Embed Size (px)
Citation preview

biblio.ugent.be
The UGent Institutional Repository is the electronic archiving and dissemination platform for all UGent research publications. Ghent University has implemented a mandate stipulating that all academic publications of UGent researchers should be deposited and archived in this repository. Except for items where current copyright restrictions apply, these papers are available in Open Access.
This item is the archived peer‐reviewed author‐version of: Pharmacokinetic analysis of modified‐release metoprolol formulations: An interspecies comparison
Authors: De Thaye E., Vervaeck A., Marostica E., Remon J.P., Van Bocxlaer J., Vervaet C., Vermeulen A.
In: European Journal of Pharmaceutical Sciences 2017, 97: 135‐142
To refer to or to cite this work, please use the citation to the published version:
De Thaye E., Vervaeck A., Marostica E., Remon J.P., Van Bocxlaer J., Vervaet C., Vermeulen A.
(2017)
Pharmacokinetic analysis of modified‐release metoprolol formulations: An interspecies
comparison. European Journal of Pharmaceutical Sciences 97: 135‐142
DOI: 10.1016/j.ejps.2016.10.039

1
Pharmacokinetic analysis of modified‐release metoprolol formulations: 1
an interspecies comparison. 2
3
Author list 4
Elien De Thayea, Anouk Vervaeckb, Eleonora Marosticaa,1, Jean Paul Remonb, Jan Van 5
Bocxlaera, Chris Vervaetb and An Vermeulena 6
7
a Laboratory of Medical Biochemistry and Clinical Analysis, Ghent University ‐ Campus 8
Heymans, Ottergemsesteenweg 460, 9000 Gent, Belgium 9
b Laboratory of Pharmaceutical Technology, Ghent University ‐ Campus Heymans, 10
Ottergemsesteenweg 460, 9000 Gent, Belgium 11
1 Currently working at LAP&P Consultants B.V., Archimedesweg 31, 2333 CM Leiden, The Netherlands 12
13
14
15
16
17
18
Corresponding author 19
Elien De Thaye ([email protected]) 20
21
22
2
Abstract 23
In the current study, we investigated the metoprolol absorption kinetics of an in‐house 24
produced oral sustained‐release formulation, matrices manufactured via prilling, and two 25
commercially available formulations, ZOK‐ZID® (reservoir) and Slow‐Lopresor® (matrix) in 26
both New Zealand White rabbits and Beagle dogs, using a population pharmacokinetic 27
analysis approach. 28
The aim of this study was to compare the in vivo pharmacokinetic (PK) profiles of different 29
formulations based on metoprolol, a selective adrenergic β1‐receptor antagonist, in dogs and 30
rabbits and to contrast the observed differences. To that end, metoprolol (50 to 200 mg) was 31
administered to 6 Beagle dogs and 6 New Zealand White rabbits as a single intravenous (IV) 32
bolus injection and to 8 dogs and 6 rabbits as an oral modified release formulation. To derive 33
pharmacokinetic parameters from the data, a non‐linear mixed‐effects model was 34
developed using NONMEM® where the contribution of observations below the limit of 35
detection (BDL, below detection limit) to the parameter estimates was taken into account in 36
the parameter estimation procedure. 37
In both species and for the three modified release formulations, different absorption models 38
were tested to describe the PK of metoprolol following oral dosing. In Beagle dogs, plasma 39
concentration‐time profiles were best described using a sequential zero‐ and first‐order 40
absorption model. In rabbits though, the absorption phase was best described using a first‐41
order process only. 42
In both species, the reservoir formulation ZOK‐ZID® was behaving quite similarly. In contrast, 43
the absorption properties of both matrix formulations were rather different between 44

3
species. This study indicates that the PK of the reservoir formulation is similar in both 45
species, even after accounting for the almost completely missed absorption phase in rabbits. 46
The insights gained further illustrate that rabbits are not very well suited to study the PK of 47
the current matrix formulations in view of their less optimal prolonged release 48
characteristics and the resulting fast decline in metoprolol plasma levels. 49
50
KEYWORDS: Metoprolol, Pharmacokinetic model, Modified‐release drug formulations, 51
Beagle dogs, New Zealand White rabbits 52
53

4
1. Introduction 54
55
The aim of the present study was to compare the absorption kinetics of metoprolol from 56
three types of modified‐release dosage forms, both in the frequently used preclinical animal 57
models Beagle dogs and New Zealand White rabbits, and to evaluate the observed differences. 58
Metoprolol is a β1‐selective adrenergic blocking agent, commonly used in the treatment of 59
hypertension, angina pectoris and heart failure. Being a Class I compound, according to the 60
Biopharmaceutics Classification System (BCS), it possesses both a high solubility and 61
permeability. However, as metoprolol is characterized by a short half‐life (3‐4h) caused by 62
extensive hepatic first‐pass metabolism, frequent dosing during the day is required (Åblad et 63
al., 1975; Regårdh et al., 2015). Hence, the drug is a suitable candidate for incorporation into 64
a controlled release dosage form that delivers the drug over an extended period of time 65
thereby significantly decreasing the frequency of dosing. 66
Metoprolol's bioavailability of an in‐house developed multiparticulate sustained‐release 67
matrix system by means of prilling was compared with two commercially available modified‐68
release formulations: Slow‐Lopresor® (Daiichi Sankyo Belgium S.A., Louvain‐la‐Neuve, Belgium) 69
and ZOK‐ZID® (Pfizer S.A., Brussels, Belgium). While Slow‐Lopresor® represents a controlled 70
release matrix tablet, ZOK‐ZID® is a tablet which immediately disintegrates into reservoir 71
coated pellets. 72
Here, we present a model‐based analysis to compare metoprolol pharmacokinetics between 73
ZOK‐ZID®, Slow‐Lopresor® and the in‐house produced prills in the selected preclinical 74
species. 75

5
2. Materials and methods 76
77
2.1. Materials 78
79
Metoprolol tartrate was purchased from Esteve Quimica (Barcelona, Spain), while behenic 80
acid (Radiacid 0560) was purchased from Oleon (Ertvelde, Belgium). Polyethylene glycol (PEG) 81
4000 was obtained from Fagron (Waregem, Belgium). All other chemicals were of analytical 82
grade. 83
2.2. Prilling 84
85
An in‐house developed multiparticulate sustained‐release matrix system was prepared by 86
means of prilling. This technique basically consists of converting a liquid melt into droplets 87
that are subsequently cooled below their solidification temperature (Rahmanian et al., 2013). 88
The process initially involves the solubilization or dispersion of a drug into a molten lipid base 89
before extrusion through calibrated nozzles. The break‐up of the liquid jet allows perfect 90
calibration of the droplets and finally results in the production of narrow‐sized spherically 91
shaped particles, called prills (Pivette et al., 2009; Pivette et al., 2012). Due to the hydrophobic 92
properties of the lipids, the process is able to produce diffusion‐controlled matrix systems. 93
Prilling was performed using the PrillDrop® device developed by Peira (Turnhout, Belgium). 94
Behenic acid and PEG 4000 were simultaneously molten and the drug was added under stirring. 95
The mixture was heated to 100 °C before droplet formation was started. By applying air 96
pressure, the mixture was fed towards the thermostated nozzle (90 °C) consisting of a valve 97
and a needle (inner diameter: 0.33 mm). Using a drop time of 0.04 s (i.e. period during which 98
the valve is open) and an air pressure of 0.5 bar, droplets were produced at the needle. Finally, 99
these droplets were quench cooled in liquid nitrogen yielding solid spherical particles. 100

6
Thermogravimetric analysis indicated that metoprolol tartrate, behenic acid and PEG 4000 101
were stable at the process temperature (data not shown). The prills showed a mean particle 102
size of 2.4 mm with narrow particle size distribution. Furthermore, the prills exhibited perfect 103
sphericity with a mean aspect ratio of 1.1. 104
2.3. In Vitro and In Vivo Study 105
106
2.3.1 In Vitro Dissolution Profile Study 107
108
In vitro drug release was determined using the USP dissolution apparatus 1 (baskets). The 109
equipment consisted of a VK 7010 system coupled with a VK 8000 automatic sampling station 110
(Vankel, New Jersey, USA). In case of the prills, an amount of prills corresponding to 30 mg 111
metoprolol tartrate was exposed to the dissolution medium, whereas 1 tablet was tested in 112
case of Slow‐Lopresor® (200 mg metoprolol tartrate) and ZOK‐ZID® (95 mg metoprolol 113
succinate). The dissolution medium consisted of 900 mL of demineralized water. Basket 114
rotational speed was set at 100 rpm and the temperature of the dissolution medium was 115
maintained at 37 ± 0.5 °C. Samples of 5 mL were withdrawn after 0.5, 1, 2, 4, 6, 8, 12, 16, 20 116
and 24 h and analyzed spectrophotometrically at 222 nm using a double beam 117
spectrophotometer (UV‐1650PC, Shimadzu, Antwerp, Belgium). Metoprolol concentrations 118
were calculated from a calibration curve between 0 and 33 µg/mL. 119
2.3.2 In Vivo Animal Study 120
121
All procedures were performed in accordance with the guidelines and after approval by 122
the local Ethics Committee. Each time, 8 dogs and 6 rabbits were orally dosed with (i) the prills 123
containing 10% metoprolol tartrate, 5% PEG 4000 and 85% behenic acid (filled in hard‐gelatin 124
capsules), (ii) the commercial reservoir formulation, ZOK‐ZID®, consisting of tablets containing 125

7
95 mg metoprolol succinate (equivalent to 100 mg metoprolol tartrate) and (iii) the 126
commercial matrix formulation, Slow‐Lopresor®, containing 200 mg metoprolol tartrate. The 127
intravenous (IV) bolus injection was administered to 6 dogs and 6 rabbits. For the oral 128
formulations, 200 mg metoprolol tartrate was administered to the dogs, while 100 mg 129
metoprolol tartrate was administered to the rabbits. Beagle dogs were treated with two 130
tablets of ZOK‐ZID® and rabbits received one tablet. Slow‐Lopresor® was dosed as one tablet 131
to Beagle dogs and rabbits received half a tablet. In case of the intravenous injection, an 132
isotonic solution was made based on metoprolol tartrate. The IV dose administered was 100 133
mg and 50 mg for the dogs and rabbits, respectively. 134
The formulations were administered in a cross‐over fashion with a wash‐out period of at 135
least 7 days. All animals were fasted from 12 h prior till 12 h after dose administration, 136
although water was available ad libitum. Before dose administration, a blank blood sample 137
was collected. The oral formulations were administered with 20 mL water. Blood samples 138
were collected in dry heparinized tubes at predetermined time points after drug 139
administration, centrifuged at 1500 × g for 5 min and resulting plasma was stored at ‐20 °C 140
until analysis. 141
2.4. HPLC Analysis 142
143
A validated HPLC method with fluorescence detection was used for the determination of 144
metoprolol in plasma. We refer to the paper written by Vervaeck et al. (2013) for more details. 145
(Vervaeck et al., 2013) 146

8
2.5 Population PK Analysis Methods 147
148
Due to the significant number of samples below the quantification limit (BQL) and the fact that 149
the extrapolated area under the curve (AUC) is higher than 20% for all formulations, except 150
for Slow‐Lopresor® in dogs (10.36%), the data were analyzed using population 151
pharmacokinetic analysis with implementation of the M3 method (Ahn et al., 2008; Jusko, 152
2012; Keizer et al., 2015), instead of non‐compartmental analysis to avoid biased PK 153
parameters. 154
A total of 258 and 205 ln‐transformed metoprolol observations sampled from 30 Beagle 155
dogs and 24 rabbits were available for population PK analysis. Population PK analysis was 156
performed by means of non‐linear mixed‐effects modeling using NONMEM® (version 7.3.0, 157
ICON, Hanover, MD,USA). All NONMEM runs were executed using Pearl‐speaks‐NONMEM 158
(PsN) 4.2.0 (Beal et al., 2011; Lindbom et al., 2005). The statistical package R (version 3.1.2, 159
(R Development Core Team, 2011)) was used during model development for a graphical 160
assessment of the goodness‐of‐fit (GOF) of the different tested models. 161
In the first stage of model development, one‐ and two‐compartment models with linear 162
elimination from the central compartment were fitted to the IV data alone using the first‐163
order conditional estimation (FOCE) method. Thereafter, oral data were combined with IV 164
data and the absorption part of the model was optimized. During model development, a first 165
order absorption process besides models assuming parallel or sequential zero‐ and first‐166
order absorption pathways were tested. 167
Observations between the limit of detection (10.1 ng/mL) and the limit of quantification 168
(30.6 ng/mL) were taken into account during the analysis, whereas BDL data were analysed 169
using the M3 method (Ahn et al., 2008; Jusko, 2012; Keizer et al., 2015). The percentages of 170

9
BQL and BDL data were 9.5% and 6.2% in Beagles and 16.5% and 6% in rabbits, respectively, 171
indicating that the BQL data need to be considered during the analysis in order to avoid bias 172
in parameter estimates. The M3‐method was suggested by Beal to handle data below the 173
limit of quantification and is based on maximization of the likelihood for all the data. The M3 174
method includes simultaneous modeling of continuous and categorical data by treating the 175
BQL observations as censored categorical data. We applied this method on our retained BDL 176
observations in the dataset, using the indicator variable F_FLAG. 177
Population PK parameters including their inter‐individual variability (IIV), and the residual 178
unexplained variability (RUV) were estimated using the LAPLACIAN estimation method. 179
Inter‐individual variability around the typical PK parameters was estimated using an 180
exponential model and was assumed to be normally distributed (in the logarithmic domain) 181
with zero mean and variance ω2. The residual variability was described with an additive error 182
in the ln domain and was defined as being normally distributed with zero mean and variance 183
σ2. 184
Models were selected based on the objective function value (OFV), goodness‐of‐fit plots and 185
a condition number below 1 000. The OFV is defined as minus twice the log‐likelihood of the 186
model. During the model building procedure, a p‐value below 0.05, representing a decrease 187
in OFV greater than 3.84 points after the addition of one single model parameter, was 188
considered to represent a statistically significant model improvement (Bonate, 2011). 189
2.5.1 Validation of the Pharmacokinetic Model 190
In order to assess the final model’s performance, the PsN‐toolkit was used to produce a 191
prediction‐corrected visual predictive check (pcVPC) (Bergstrand et al., 2011; Bergstrand and 192
Karlsson, 2009). The pcVPCs were based on 5000 new datasets, simulated using the 193
parameter estimates of the final model. The 2.5th, 50th and 97.5th percentiles were calculated 194

10
for each simulation run. A two panel type of pcVPC was chosen to evaluate the model with 195
respect to both data above and below the limit of detection. 196
Stability of the final PK parameter estimates and their 95% confidence intervals were 197
evaluated using log‐likelihood profiling (LLP), performed using the PsN‐toolkit. As an 198
advantage over confidence intervals derived from the estimated variance‐covariance matrix 199
of the model, this method makes no assumptions regarding symmetry of the confidence 200
intervals. 201
2.6 In Vitro and In Vivo Correlation 202
203
The relationship between in vitro release and in vivo absorption was evaluated using an in 204
vitro‐in vivo correlation (IVIVC) analysis (Emami, 2006), and more specifically a multiple level 205
C one. The multiple level C IVIVC establishes a single point relationship between a 206
dissolution parameter and a pharmacokinetic parameter of interest. Based on the in vivo 207
data, partial areas under the mean plasma concentration‐time curves (AUC 0‐1 h, AUC 0‐2 h, 208
AUC 0‐4 h, AUC 0‐6 h and AUC 0‐8 h), as obtained through non‐compartmental analysis, and in 209
vitro release at equivalent time points were evaluated through correlation analysis. The non‐210
compartmental analysis was done using the free statistical software package R (version 211
3.1.2, R Development Core Team, 2011) using the PK package and function nca.complete. 212
For each pair of values across the three different formulations, Pearson’s correlation 213
coefficients were calculated using R (version 3.1.2, R Development Core Team, 2011). For 214
each formulation and species, the partial mean AUCs, as indicated before, mean Cmax 215
(referring to the peak plasma concentration) and mean tmax (referring to the time at which 216
the Cmax occurs) were correlated with the cumulative metoprolol amount dissolved at the 217

11
corresponding time points. In this case, the in vitro and in vivo data were treated as the 218
independent (x) and dependent (y) variables, respectively. 219
3. Results 220
221
3.1. In Vitro Dissolution Profile Study 222
223
The in vitro drug release profiles are illustrated in Fig. 1. Slow‐Lopresor® showed a complete 224
drug release after 16 h, although 92.4% of the total drug amount was already released after 8 225
h. The prills and ZOK‐ZID® showed a comparable drug release profile over a 24 h period. 226
However, the prills initially showed a faster release since 44.1% metoprolol was released after 227
4 h, compared to only 28.0% for ZOK‐ZID®. Previously, dissolution experiments using the 228
reciprocating cylinder method (Vervaeck et al., 2014) also indicated that the prills were more 229
sensitive to the hydrodynamic flow and stress conditions in the gastrointestinal tract. In 230
contrast, release from ZOK‐ZID® was not influenced by these conditions and a similar release 231
profile was obtained for both methods (Vervaeck et al., 2014). 232
3.2 In Vivo Animal Study 233
234
For both preclinical animal species, it was possible to simultaneously describe the 235
metoprolol plasma concentration versus time data after intravenous and oral administration 236
of the different modified‐release formulations using a population approach. For both 237
species, a two‐compartment model was preferred since the observed plasma concentration‐238
time profiles of metoprolol decreased bi‐exponentially over time. Metoprolol PK in Beagle 239
dogs was best described using a sequential zero‐ and first‐order absorption model, and 240
linear elimination from the central compartment. In rabbits, metoprolol PK profiles were 241

12
best described using a conventional first‐order absorption model and linear elimination from 242
the central compartment. 243
The included model parameters consisted of plasma clearance (CL), volume of distribution of 244
the central compartment (V2), inter‐compartmental flow (Q), volume of distribution of the 245
peripheral compartment (V3), oral bioavailability (F1) and absorption rate constant (ka). In 246
addition to these parameters, the duration of the zero‐order input (D1) was estimated for 247
the dogs. Inter‐individual variability was included on CL, V2, V3 and Q in dogs and on CL and 248
F1 in rabbits. The final models for the preclinical species are illustrated in Figs. 2 and 3, 249
whereas the final population PK parameter estimates are shown in Tables 1 and 2. Because 250
of the small variability in body weight (11.9 ± 1.5 (mean ± standard deviation in kg, Beagles) 251
and 4.5 ± 0.2 (mean ± standard deviation in kg, rabbits)), the animals’ weight was not 252
expected to affect the systemic exposure to metoprolol and consequently, no covariates 253
apart from formulation type were included in the model. 254
Besides the observed differences in model parameters CL, V2, V3 and Q, variability across 255
species was also observed for oral bioavailability (F1), the absorption rate constant (ka) and 256
duration of zero‐order input (D1). Based on our available data, the model predicted a faster 257
and more extensive absorption of metoprolol in rabbits. 258
Tables 1 and 2 also illustrate differences between oral formulations within each of the 259
species. Based on the performed analysis, it can be concluded that ZOK‐ZID® showed the 260
slowest absorption in both species. In dogs, we were not able to demonstrate a difference in 261
absorption behavior between the prills and Slow‐Lopresor®. In contrast, a difference 262
between these two formulations could be observed in rabbits, in line with the in vitro 263
release findings. In this case, Slow‐Lopresor® shows a faster absorption compared to prills 264

13
and ZOK‐ZID®, respectively. Regarding the absolute oral bioavailability, it was not possible to 265
distinguish between formulations in dogs, and no inter‐individual variability in F1 could be 266
estimated. In rabbits, the oral bioavailability for prills and Slow‐Lopresor® was slightly higher 267
(8.71%) as compared to ZOK‐ZID® (5.88%). Based on the individual profiles (not shown here) 268
and parameter estimates for ka and F1, the best slow‐release profile (lowest peak‐to‐trough 269
ratio) was obtained with the reservoir formulation ZOK‐ZID® in both species. 270
The agreement between the observed and model‐predicted metoprolol concentrations in 271
the final model is illustrated in Fig. 4. This graphical evaluation confirms that our model is 272
capable of describing the data quite well. A pcVPC of the final model further confirms that 273
the developed population PK model adequately describes metoprolol PK data in Beagle dogs 274
and rabbits (Fig. 5). The lower panels indicate that the predicted fractions of BDL data match 275
the observed fractions of BDL data across time reasonably well. 276
3.3 In Vitro and In Vivo Correlation 277
278
Figs. 6 and 7 show the level C in vitro‐in vivo correlation between partial mean AUC and 279
percentage of metoprolol dissolved, for both dogs and rabbits. From the results, it is clear 280
that a level C correlation is achieved across multiple time points, indicative of a multiple level 281
C IVIVC. The Pearson’s correlation coefficients (represented as r in Figs. 6 and 7) were higher 282
for rabbits compared to dog data. The linear relationship between the dissolution kinetics 283
and the mean tmax and Cmax was also investigated (data not shown) and led to similar results, 284
but was not explored further. 285
4. Discussion 286
287

14
In this article, for the first time, a pharmacokinetic model‐based analysis is presented in 288
which metoprolol pharmacokinetics were compared between the two commercially 289
available modified‐release formulations (ZOK‐ZID® and Slow‐Lopresor®) and the in‐house 290
produced prills across two pre‐clinical species. Production of formulations via prilling 291
represents a promising technology for the development of multiparticulate solid dosage 292
forms. From a pharmacokinetic point of view, multiparticulate systems offer several 293
advantages. Compared to a classic tablet (single‐unit system), the smaller dimensions of the 294
sub‐units allow to immediately pass the pylorus, independent of the feeding state of the 295
stomach. Since gastric emptying suffers from strong intra‐ and inter‐subject variability, the 296
administration of a drug via a multiparticulate system generally results in a higher 297
reproducibility of the therapeutic effect. In addition, there is a lower risk of high local drug 298
concentrations and gastro‐intestinal side‐effects as the dose is more uniformly distributed 299
throughout the gastro‐intestinal tract (Bechgaard and Nielsen, 1978; Bodmeier and 300
Paeratakul, 1994; Gupta and Robinson, 1992; Krämer and Blume, 1994; Shukla et al., 2011). 301
The flexible design of multiparticulate formulations also offers advantages for formulation 302
scientists: the dose can be easily adjusted by increasing or decreasing the number of sub‐303
units, without the need for formulation changes and without any effect on the drug release 304
pattern. Also co‐administration of different drugs (e.g. fixed‐dose combinations) can be 305
easily achieved (Bodmeier and Paeratakul, 1994; Shukla et al., 2011). 306
Besides the fact that multiparticulate systems are obtained via prilling, the technique also 307
differentiates from other production methods via the use of lipid excipients. Characterized 308
by a water‐insoluble character, lipids represent an interesting platform for the development 309
of controlled release formulations. Furthermore, lipid excipients are beneficial since they are 310

15
low‐cost, physiologically non‐toxic and biodegradable products (Reitz and Kleinebudde, 311
2007; Rosiaux et al., 2014). 312
In this study, plasma concentration‐time data of administered metoprolol equivalently dosed 313
to metoprolol tartrate over a dose range of 50 – 200 mg to Beagle dogs and New Zealand 314
White rabbits were adequately described by a two‐compartment model with linear 315
elimination from the central compartment. In Beagles, the absorption rate constant was 316
similar for Slow‐Lopresor® and the prills. In contrast, Slow‐Lopresor® was absorbed faster 317
compared to the prills and ZOK‐ZID® in rabbits. In both species, ZOK‐ZID® resulted in the 318
lowest absorption rate constant. 319
Overall, the pharmacokinetics of metoprolol in the study animals were highly variable. The 320
pcVPC however indicates that the model performs reasonably well and predicts both the 321
central tendency and the variability between animals in observed plasma concentration‐time 322
profiles for each preclinical species and for all formulations. 323
A rank‐order relationship between in vitro dissolution and in vivo release and absorption at 324
multiple time points, as derived from mean plasma concentration‐time profiles, of the 325
modified‐release formulations could be observed in both species. In this respect, it seems 326
that the rabbit is the preferred species to compare the in vitro results with. Based on the 327
multiple level C IVIVC, the correlation coefficients for the rabbit data were higher than those 328
for the dog data. A level A correlation is likely also achievable, based on the established 329
multiple level C correlation, but wasn’t explored further due to the focus on metoprolol 330
absorption kinetics in vivo. 331
Following administration of the metoprolol modified‐release formulations in rabbits, some 332
concentration‐time profiles exhibited quite erratic profiles, which were not always captured 333

16
well in the model, also because the number of animals per group was rather small. In all 334
likelihood, this phenomenon will have contributed to a higher estimated inter‐individual 335
variability in absorption‐related parameters. 336
During the population PK analysis, it could be confirmed that all modified‐release 337
formulations except for Slow‐Lopresor® in rabbits, exhibited flip‐flop pharmacokinetics, as 338
expected. This phenomenon occurs when release of compound from the formulation is the 339
slowest step in the process, as reflected in its absorption characteristics. This can only be 340
derived if IV data are also available, which stresses the importance of the availability of an IV 341
formulation and extended sampling schemes. The ultimate aim of a slow release formulation 342
is to drive the in vivo PK profile, allowing an optimized plasma concentration‐time profile 343
including a lower peak‐trough ratio. In addition, a more practical dosing regimen (once daily 344
versus three times a day in this case) leading to increased adherence and a higher efficacy is 345
what is strived for. 346
5. Conclusion 347
In summary, a metoprolol population pharmacokinetic model has been developed and 348
validated in a group of Beagle dogs and New Zealand White rabbits, by applying the M3‐349
method, to account for observations below the limit of detection. Following intravenous 350
bolus dosing, plasma concentration‐time profiles in both species were best described by a 351
two‐compartment model with first‐order elimination. Plasma concentration‐time curves in 352
Beagle dogs following oral dosing of the different modified‐release formulations were best 353
described using a sequential zero‐ and first‐order absorption model. The absorption phase in 354
rabbits was best described using a first‐order process. In addition, a multiple level C IVIVC 355

17
was constructed based on partial AUCs and the cumulative metoprolol amount dissolved for 356
both Beagles and rabbits. 357
Plasma concentration‐time profiles for the reservoir formulation ZOK‐ZID® were comparable 358
in both species, which was not the case for the matrix formulations. This study indicates that 359
the PK of the reservoir formulation is similar in both species, even considering the almost 360
completely missed absorption phase in rabbits. The insights gained from the current study 361
further illustrate that, in view of their less optimal prolonged release characteristics and the 362
resulting fast decline in metoprolol plasma levels, rabbits are not the species of choice to 363
study PK of the matrix formulations in this study set‐up. 364
Acknowledgements 365
366
The authors would like to thank Mr. Daniël Tensy for his assistance with the in vivo 367
experiments. We thank Dr. Pieter Colin for his constructive comments during preparation of 368
this manuscript. This research did not receive any specific grant from funding agencies in the 369
public, commercial, or not‐for‐profit sectors. 370
371

18
Figures 372
373
374
Fig. 1. In vitro dissolution profiles and mean plasma concentration‐time profiles in dogs and rabbits 375
376
377

19
Fig. 2. Schematic representation of the PK model for metoprolol in Beagles 378 379
380 381 Fig. 3. Schematic representation of the PK model for metoprolol in rabbits 382 383 384
385
Fig. 4. DV vs PRED and IPRED for both dog and rabbit model 386

20
387
Fig. 5. Pred‐corrected VPC in rabbits and Beagles (the horizontal line refers to the limit of 388
detection, 10.1 ng/mL) 389
390
391

21
392
Fig. 6. IVIVC multiple level C for dogs (the squares refer to ZOK‐ZID®, the triangles 393
to Slow‐Lopresor® and the circles to the prills) 394
395

22
396
Fig. 7. IVIVC multiple level C for rabbits (the squares refer to ZOK‐ZID®, the triangles 397
to Slow‐Lopresor® and the circles to the prills) 398
399
Tables 400
401
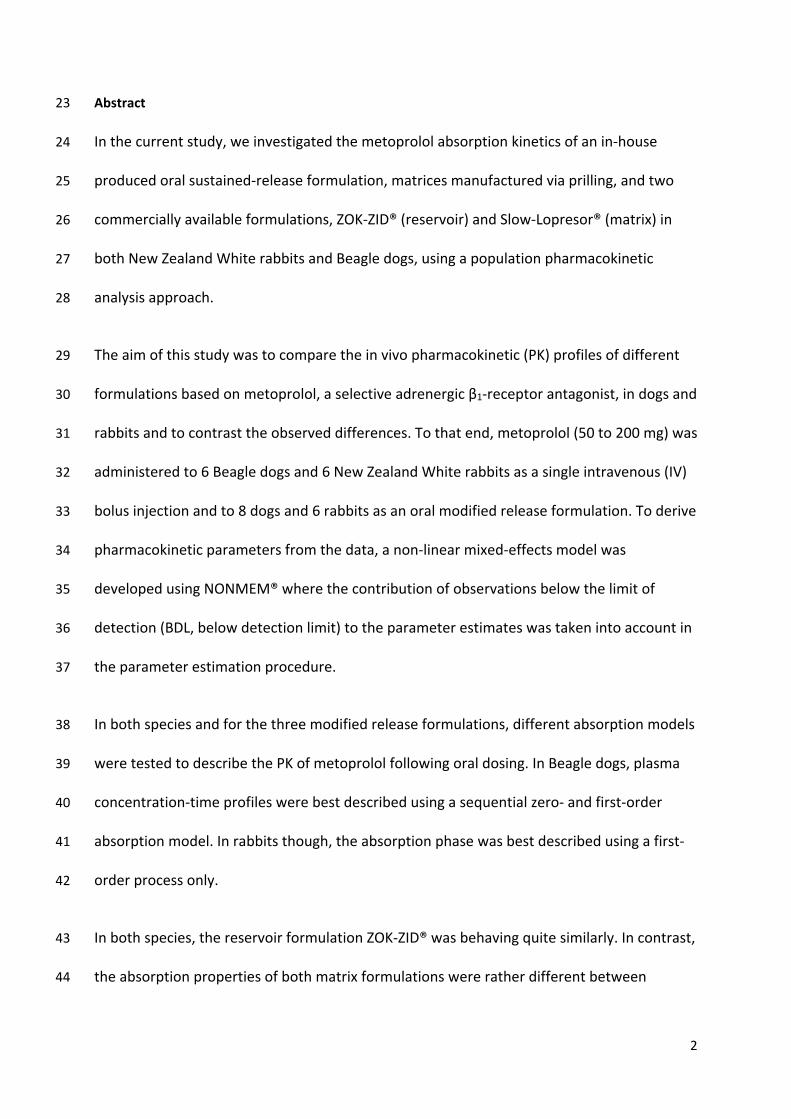
Table 1: Final population PK parameter estimates in Beagles 402
Parameter [units] Final model estimate (%RSEa) 95% Confidence interval (LLP) CL [mL/h] 776 (25.4) 471 to 1 242 V2 [mL] 631 (24.0) 339 to 934 V3 [mL] 1 490 (134.1) 729 to 8 559 Q [mL/h] 116 (23.6) 62.5 to 170 Ka prills/slow‐lopresor® [/h] 0.332 (9.9) 0.277 to 0.406 Ka ZOK‐ZID® [/h] 0.0521 (16.2) 0.037 to 0.070 F1 0.0131 (25.3) 0.008 to 0.021 D1 prills [h] 2.26 (13.9) 1.701 to 2.932
23
D1 ZOK‐ZID®/Slow‐lopresor® [h] 1.29 (17.8) 0.978 to 1.879 IIV CL (% CVb) 66.7 (15.5) 50.2 to 90.6 IIV V2 (% CVb) 84.3 (22.0) 61.4 to 134 IIV V3 (% CVb) 83.6 (38.0) 39.4 to 164 IIV Q (% CVb) 59.1 (32.2) 38.3 to 113 Residual variability, ԑ (% CVb) 67.6 (2.1) 65.3 to 70.9
403
a %RSE (percent relative standard error) was calculated based on the 95% confidence intervals (CI) 404
obtained by LLP under the assumption of a symmetrical 95% confidence interval. The used formula to 405
obtain the standard error was (upper limit CI – lower limit CI)/3.92, the %RSE was calculated by 406
dividing the standard error by the parameter estimate and multiply by 100%. 407
b %CV (percent coefficient of variation) was calculated as sqrt(ω²) x 100%; in case of LLP %CV was 408
calculated by taking the square root of the lower and upper value of the confidence intervals given by 409
PsN (Lindbom et al., 2005). 410
411
Table 2: Final population PK parameter estimates in rabbits 412
Parameter [units] Final model estimate (%RSE a) 95% Confidence interval (LLP) CL [mL/h] 3 390 (19.9) 2 341 to 4 979 V2 [mL] 7 350 (11.6) 5 844 to 9 197 V3 [mL] 29 800 (66.1) 15 866 to 93 091 Q [mL/h] 2 180 (21.2) 1 424 to 3 237 Ka prills [/h] 0.27 (16.9) 0.197 to 0.376 Ka ZOK‐ZID® [/h] 0.075 (29.0) 0.042 to 0.127 Ka Slow‐lopresor® [/h] 0.59 (29.0) 0.358 to 1.029 F1 prills/Slow‐lopresor® 0.0871 (29.3) 0.051 to 0.151 F1 ZOK‐ZID® 0.0588 (56.4) 0.026 to 0.156 IIV CL (% CV b) 51.6 (30.1) 28.8 to 89.6 IIV F1 (% CV b) 64.3 (24.5) 40.3 to 102.1 Residual variability, ԑ (% CV b) 75.4 (3.00) 71.3 to 80.1
413
a %RSE (percent relative standard error) was calculated based on the 95% confidence intervals (CI) 414
obtained by LLP under the assumption of a symmetrical 95% confidence interval. The used formula to 415
obtain the standard error was (upper limit CI – lower limit CI)/3.92, the %RSE was calculated by 416
dividing the standard error by the parameter estimate and multiply by 100%. 417
b %CV (percent coefficient of variation) was calculated as sqrt(ω²) x 100%; in case of LLP %CV was 418
calculated by taking the square root of the lower and upper value of the confidence intervals given by 419
PsN (Lindbom et al., 2005). 420
References 421
422
Åblad, B., Borg, K.O., Carlsson, E., Ek, L., Johnsson, G., Malmfors, T., Regårdh, C.‐G., 1975. A survey of 423 the pharmacological properties of metoprolol in animals and man. Acta Pharmacologica et 424 Toxicologica 36, 7‐23. 425

24
Ahn, J.E., Karlsson, M.O., Dunne, A., Ludden, T.M., 2008. Likelihood based approaches to handling 426 data below the quantification limit using NONMEM VI. Journal of Pharmacokinetics and 427 Pharmacodynamics 35, 401‐421. 428 Beal, S.L., Sheiner, L.B., Boeckmann, A.J., Bauer, R.J., 2011. NONMEM 7.2.0 users' guides. ICON 429 Development Solutions Ellicott City, Maryland. 430 Bechgaard, H., Nielsen, G.H., 1978. Controlled‐release multiple‐units and single‐unit doses a 431 literature review. Drug Development and Industrial Pharmacy 4, 53‐67. 432 Bergstrand, M., Hooker, A.C., Wallin, J.E., Karlsson, M.O., 2011. Prediction‐Corrected Visual Predictive 433 Checks for Diagnosing Nonlinear Mixed‐Effects Models. The AAPS Journal 13, 143‐151. 434 Bergstrand, M., Karlsson, M.O., 2009. Handling Data Below the Limit of Quantification in Mixed Effect 435 Models. The AAPS Journal 11, 371‐380. 436 Bodmeier, R., Paeratakul, O., 1994. Suspensions and Dispersible Dosage Forms of Multiparticulates, 437 in: Ghebre‐Sellassie, I. (Ed.), Multiparticulate Oral Drug Delivery. Marcel Dekker, Inc., New York, pp. 438 143‐157. 439 Bonate, P.L., 2011. Pharmacokinetic‐Pharmacodynamic Modeling and Simulation, Second ed. 440 Springer, New York. 441 Emami, J., 2006. In vitro ‐ in vivo correlation: from theory to applications. J Pharm Pharm Sci. 9, 169‐442 189. 443 Gupta, P.K., Robinson, J.R., 1992. Oral Controlled‐Release Delivery, in: Kydonieus, A. (Ed.), Treatise on 444 Controlled Drug Delivery. Marcel Dekker, Inc., New York, pp. 255‐313. 445 Jusko, W.J., 2012. Use of Pharmacokinetic Data Below Lower Limit of Quantitation Values. 446 Pharmaceutical research 29, 2628‐2631. 447 Keizer, R.J., Jansen, R.S., Rosing, H., Thijssen, B., Beijnen, J.H., Schellens, J.H.M., Huitema, A.D.R., 448 2015. Incorporation of concentration data below the limit of quantification in population 449 pharmacokinetic analyses. Pharmacology Research & Perspectives 3, e00131. 450 Krämer, J., Blume, H., 1994. Biopharmaceutical Aspects of Multiparticulates, in: Ghebre‐Sellassie, I. 451 (Ed.), Multiparticulate Oral Drug Delivery. Marcel Dekker, Inc., New York, pp. 307‐332. 452 Lindbom, L., Pihlgren, P., Jonsson, N., 2005. PsN‐Toolkit—A collection of computer intensive 453 statistical methods for non‐linear mixed effect modeling using NONMEM. Computer Methods and 454 Programs in Biomedicine 79, 241‐257. 455 Pivette, P., Faivre, V., Daste, G., Ollivon, M., Lesieur, S., 2009. Rapid cooling of lipid in a prilling tower. 456 Journal of Thermal Analysis and Calorimetry 98, 47‐55. 457 Pivette, P., Faivre, V., Mancini, L., Gueutin, C., Daste, G., Ollivon, M., Lesieur, S., 2012. Controlled 458 release of a highly hydrophilic API from lipid microspheres obtained by prilling: Analysis of drug and 459 water diffusion processes with X‐ray‐based methods. Journal of Controlled Release 158, 393‐402. 460 R Development Core Team, 2011. R: A Language and Environment for Statistical Computing. the R 461 Foundation for Statistical Computing, Vienna, Austria 462 Rahmanian, N., Homayoonfard, M., Alamdari, A., 2013. Simulation of urea prilling process: an 463 industrial case study. Chemical Engineering Communications 200, 764‐782. 464 Regårdh, C.G., Borg, K.O., Johansson, R., Johnsson, G., Palmer, L., 2015. Pharmacokinetic studies on 465 the selectiveβ1‐receptor antagonist metoprolol in man. Journal of Pharmacokinetics and 466 Biopharmaceutics 2, 347‐364. 467 Reitz, C., Kleinebudde, P., 2007. Solid lipid extrusion of sustained release dosage forms. European 468 Journal of Pharmaceutics and Biopharmaceutics 67, 440‐448. 469 Rosiaux, Y., Jannin, V., Hughes, S., Marchaud, D., 2014. Solid lipid excipients ‐ Matrix agents for 470 sustained drug delivery. Journal of Controlled Release 188, 18‐30. 471 Shukla, D., Chakraborty, S., Singh, S., Mishra, B., 2011. Lipid‐based oral multiparticulate formulations 472 ‐ advantages, technological advances and industrial applications. Expert Opinion on Drug Delivery 8, 473 207‐224. 474 Vervaeck, A., Monteyne, T., Saerens, L., De Beer, T., Remon, J.P., Vervaet, C., 2014. Prilling as 475 manufacturing technique for multiparticulate lipid/PEG fixed‐dose combinations. European Journal 476 of Pharmaceutics and Biopharmaceutics 88, 472‐482. 477

25
Vervaeck, A., Saerens, L., De Geest, B.G., De Beer, T., Carleer, R., Adriaensens, P., Remon, J.P., 478 Vervaet, C., 2013. Prilling of fatty acids as a continuous process for the development of controlled 479 release multiparticulate dosage forms. European Journal of Pharmaceutics and Biopharmaceutics 85, 480 587‐596. 481
482
483

![Succinate Dehydrogenase-a Comparative Review · Membrane-bound succinate dehydrogenase [SDH; E.C.1.3.99.1 succinate:(acceptor) oxido-reductase] is present in all aerobic cells. Ever](https://img.pdfslide.us/doc/110x75/5e54371d86904d694572eef0/succinate-dehydrogenase-a-comparative-review-membrane-bound-succinate-dehydrogenase.jpg)