Embed Size (px)
Citation preview
BOLTS, NUTS, AND LAR~E_ SCREWS OF IRON OR STEEL: U.S. PRODUCTION, SHIPMENTS, IMPORTS, EXPORTS, APPARENT CONSUMPTION, EMPLOYMENT, MAN-HOURS, AND PRICES, THIRD AND . FOURTH CALENDAR · QUARTERS 1978 AND FIRST CALENDAR QUARTER 1979
Report to the President on investigation No~ 332~103 · Under Section 3l2 of the Tariff Act of 1930
USITC PUBLICATION 979
MAY 1979
UnHed States International Trade Commission I Washington, D.C. 20438
UNITED ·STATES INTERNATIONAL TRADE.COMMISSION
COMMISSIONERS . ·
Joseph 0. Parker, Ch·airman Bill Alberger, Vice Chairman
George M.' Moore
Catherine Bedell
Paula Stern
Kenneth A. Mason,· Secretary to the Commission
' This report was prepared principally by
James M. Brandon~ Minerals and Metals Division
Office of Industries Norris A. Lynch, Director
Address all communications to·
Office of the Secretary United States International Trade Commission
Washington, D.C. 20436
FOR RELEASE MAY 31, 1979
CONTACT: William E. Wright (202) 523-0275
USITC REPORTS RESULTS OF QUARTERLY SURVEY OF PRODUCERS OF BOLTS, NUTS, AND LARGE SCREWS OF IRON OR STEEL
USITC 79-052
The United States International Trade Commission has completed its first
quarterly. survey of U.S. producers of .bolts, nuts, and large screws of iron or
steel, required under Presidential Proclamation No. 4632. The report, which
provides information on an annual and monthly basis, is necessary for the ' "
monitoring of the effects of teinporary increases in duties on imports.: The
information developed covers U.S. production, U.S. producers' shipments,
imports ror consumption, exports, apparent.consumption, employment, man-hours,
and prices.
Major findings of the survey indicate that during the first quarter of
1979, u.s~ produ~ers' ~hipmerits, based on quantity, were 16,percent greater
than shipments in the fourth quarter of 1978 and 26 percent gr'eater than
shipments in the third quarter of 1978. U.S. imports of bolts, nuts, and !
large screws were 4 percent greater in the.first quarter of 1979 when compared
with the last qu~rter of 1978, but wer~ 9 percent less than the quantities
imported during the third quarter of 1978. The ratio of imports to consump
tion declined from 51 percent in the third quarter of 1978 to 46 percent in
the fourth quarter of 1978 to 42 percent in the first quarter of 1979. The
quantity of U.S~ exports during the first quarter of 1979 remained about the
same as in·each of the two previous quarters.
more
USITC REPORTS RESULTS OF QUARTERLY SURVEY OF PRODUCERS OF BOLTS, NUTS, AND LARGE SCREWS OF IRON OR STEEL
2
The average number of employees engaged in the production of bolts, nuts,
and large screws gradually increased from the third quarter of 1978 through
the first quarter of 1979. The man-hours expended by these workers followed
the same increasing trend. ..
The average lowest net selling prices received in the first quarter of
1979 by U.S. producers for six representative fastener products were, on an
average, about 6 percent higher than prices received during the last two
quarters of 1978.
The report is sent to the .special Representative for Trade Negotiations
who is responsible for monitoring the effects of the temporary duty increases
implemented by the Presidential proclamation ..
Copies of the report (USITC Publication 979), can be obtained.by calling
(202) 523-5178, or from the Office of the Secretary, 701 E Street NW.,
Washington, D.C. 20436.
0 0 0
i
Summary Highlights of the First Quarterly Survey of U.S. Producers of Bolts, Nuts, and Large Screws of Iron or Steel
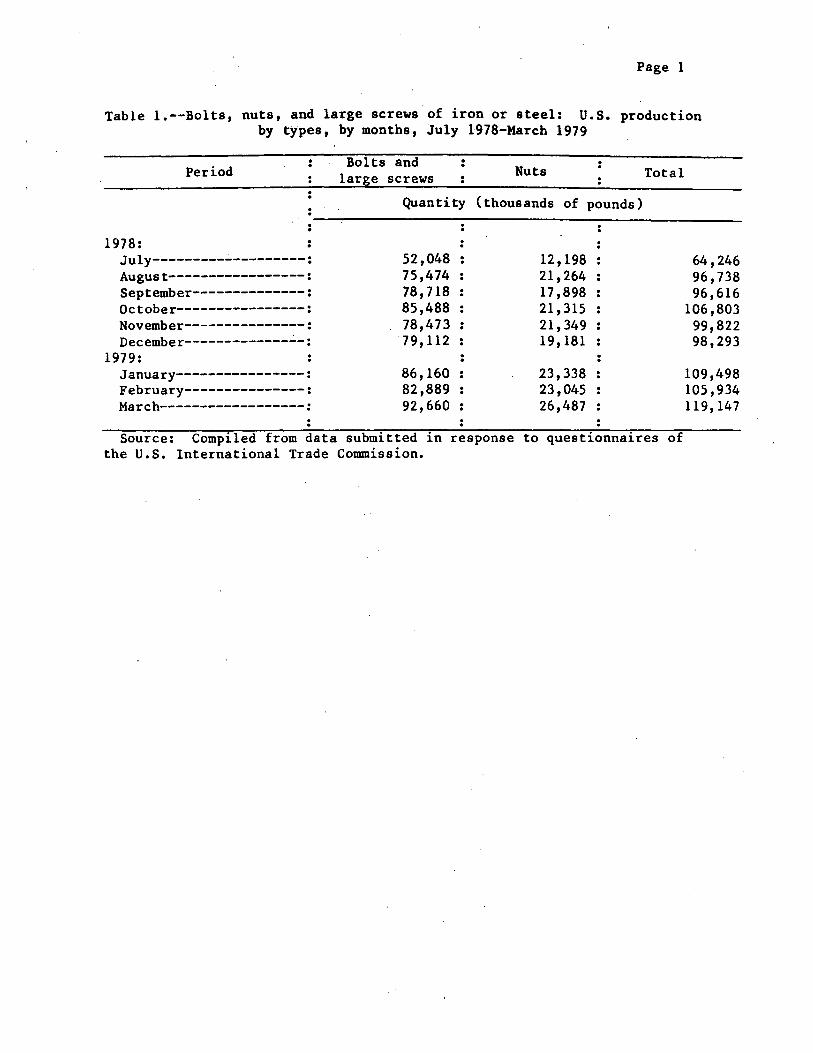
Production
From the third quarter of 1978 to the first quarter of 1979, U.S.
production of bolts, nuts, and large screws increased approximately 30 per-
cent, from 258 million pounds to 334 million pounds.
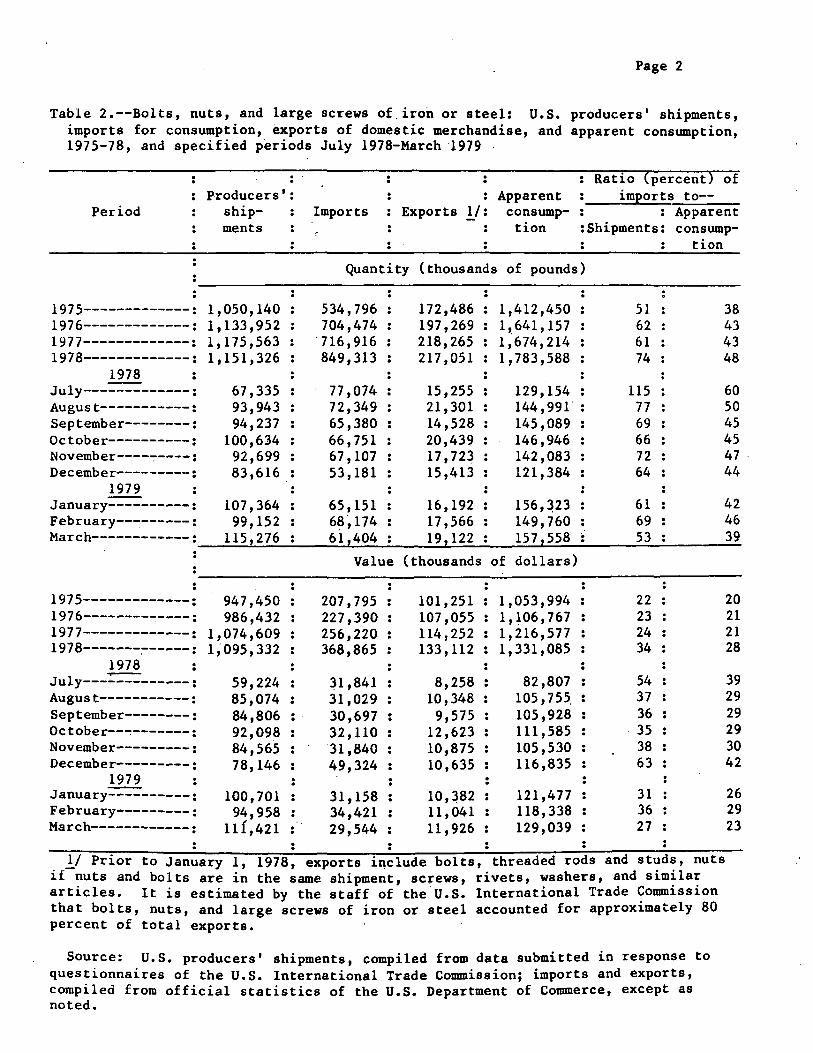
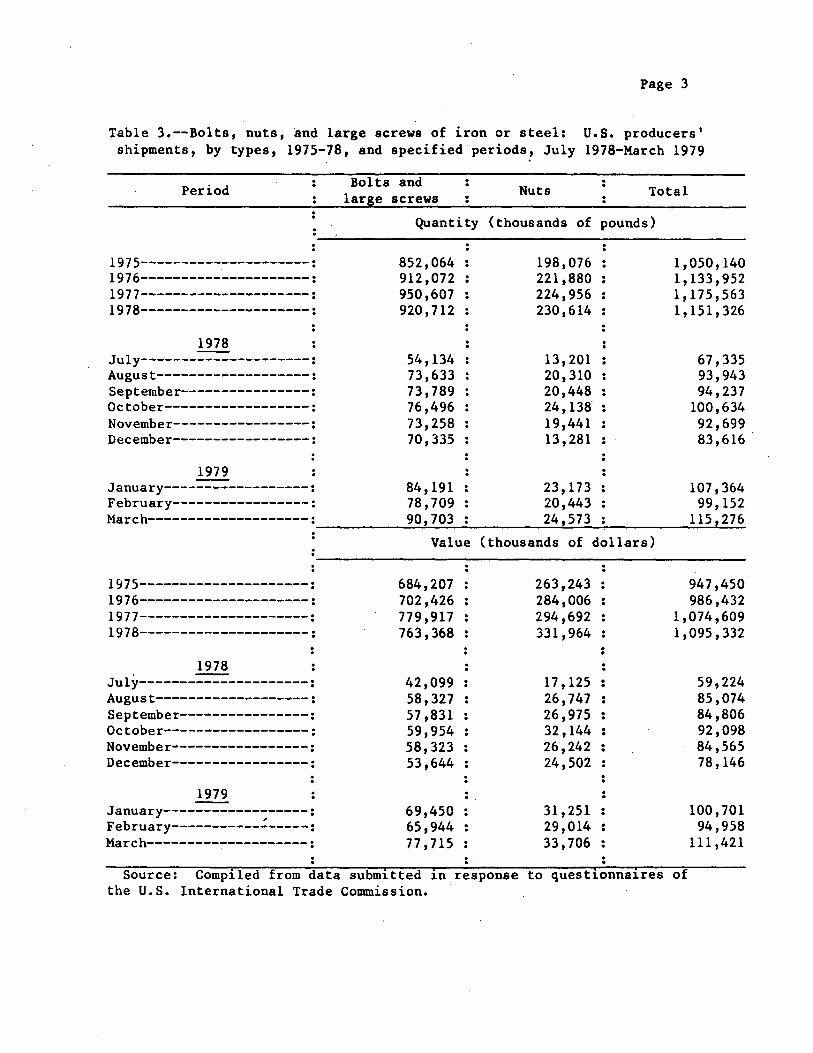
U.S. producers' shipments
During the first quarter of 1979, U.S. producers 1 shipments, based on
quantity, were 16 percent greater than shipments in the fourth quarter of
1978 and 26 percent greater than shipments in the third quarter of 1978. U.S.
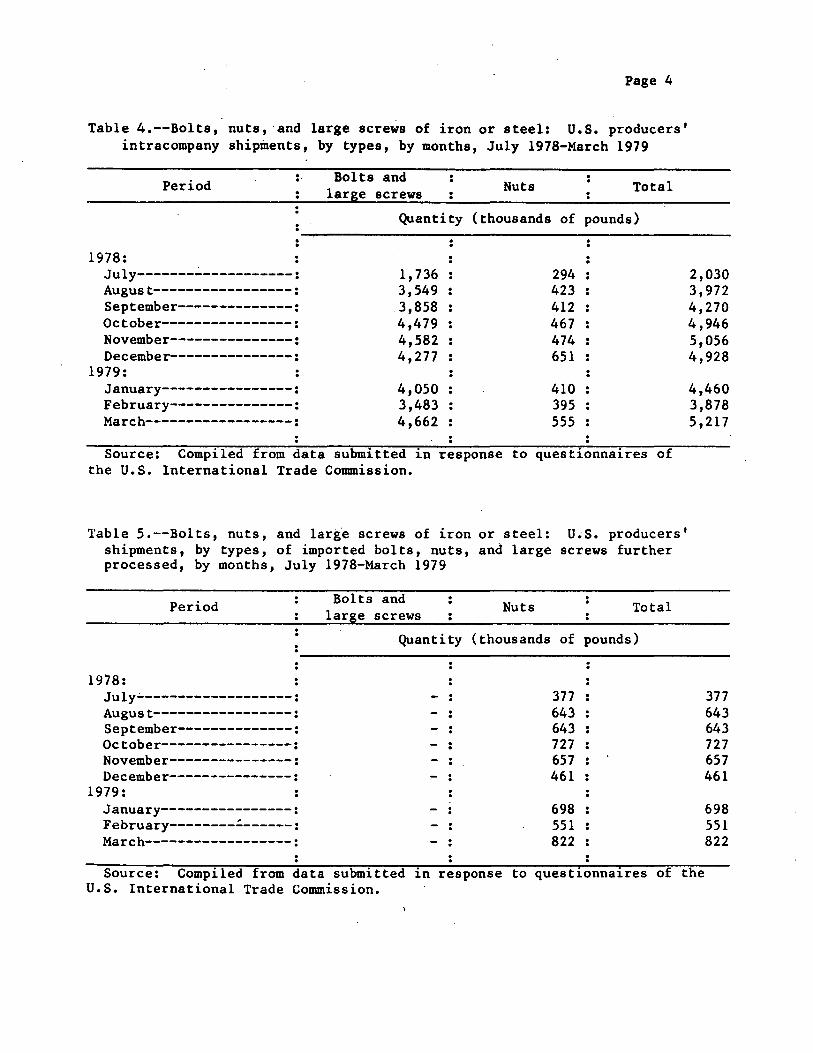
producers' intracompany shipments accounted for approximately 5 percent of
total shipments during each of the three quarters under discussion.
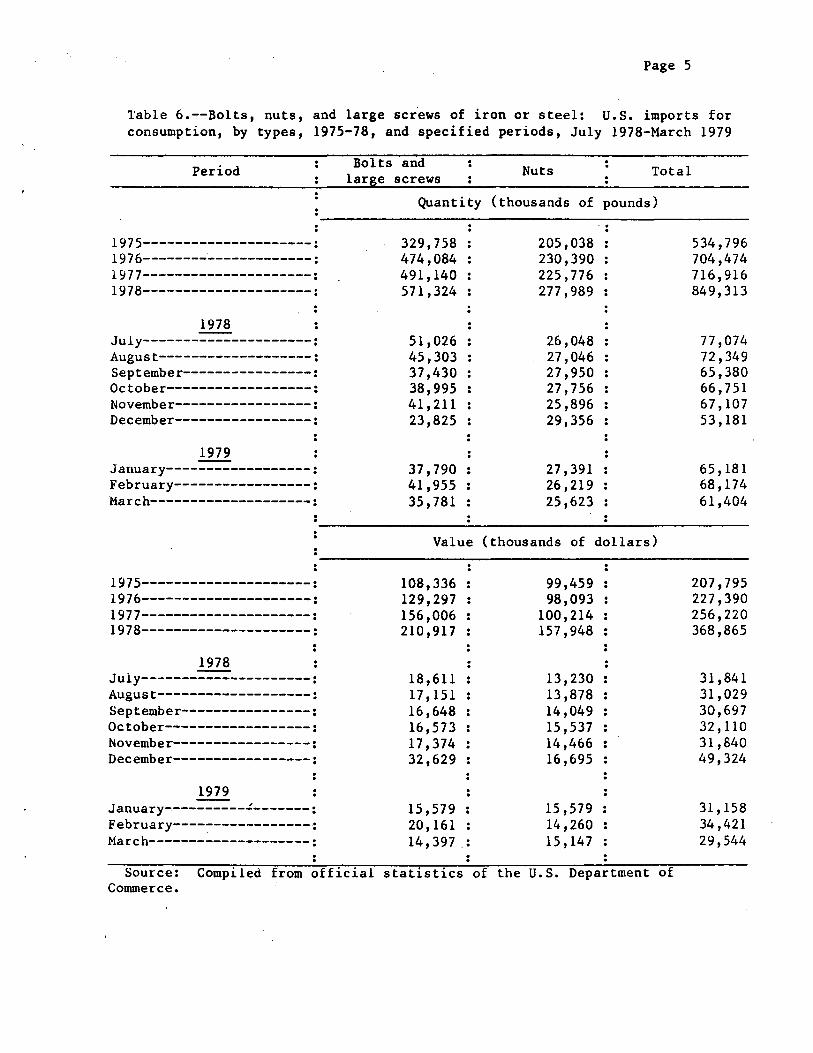
Imports for consumption
U.S. imports of bolts, nuts, and large screws were 4 percent greater in
the first quarter of 1979 when compared with the last quarter of 1978, but
were 9 percent less than the quantities imported during the third quarter of
1978.
Exports
The quantity of ,bolts, nuts, and large screws exported during the first
quarter of 1979 remained about the same, 53 million pounds, as in each of the
two previous quarters.
Apparent consumption
Apparent consumption of bolts, nuts, and large screws during the first
quarter of 1979 was 464 million pounds, which was about 13 percent greater
than in the last quarter of 1978 and 11 percent greater than in the third
ii
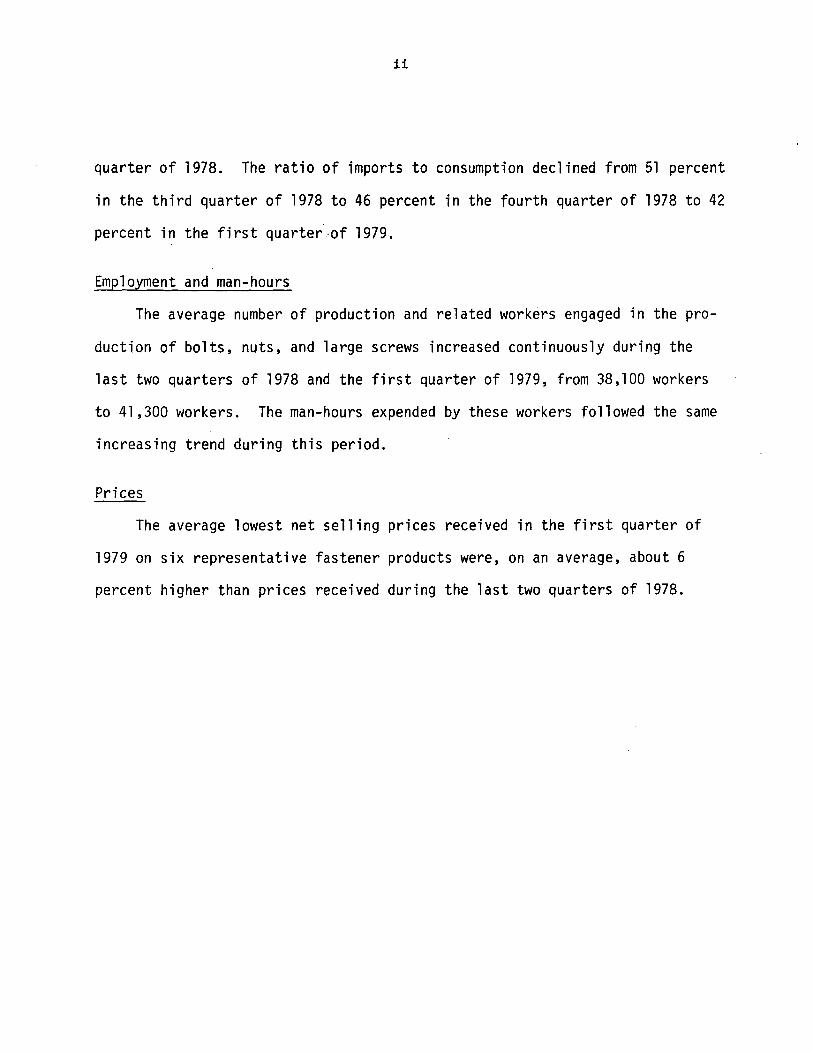
quarter of 1978. The ratio of imports to consumption declined from 51 percent
in the third quarter of 1978 to 46 percent in the fourth quarter of 1978 to 42
percent in the first quarter-of 1979.
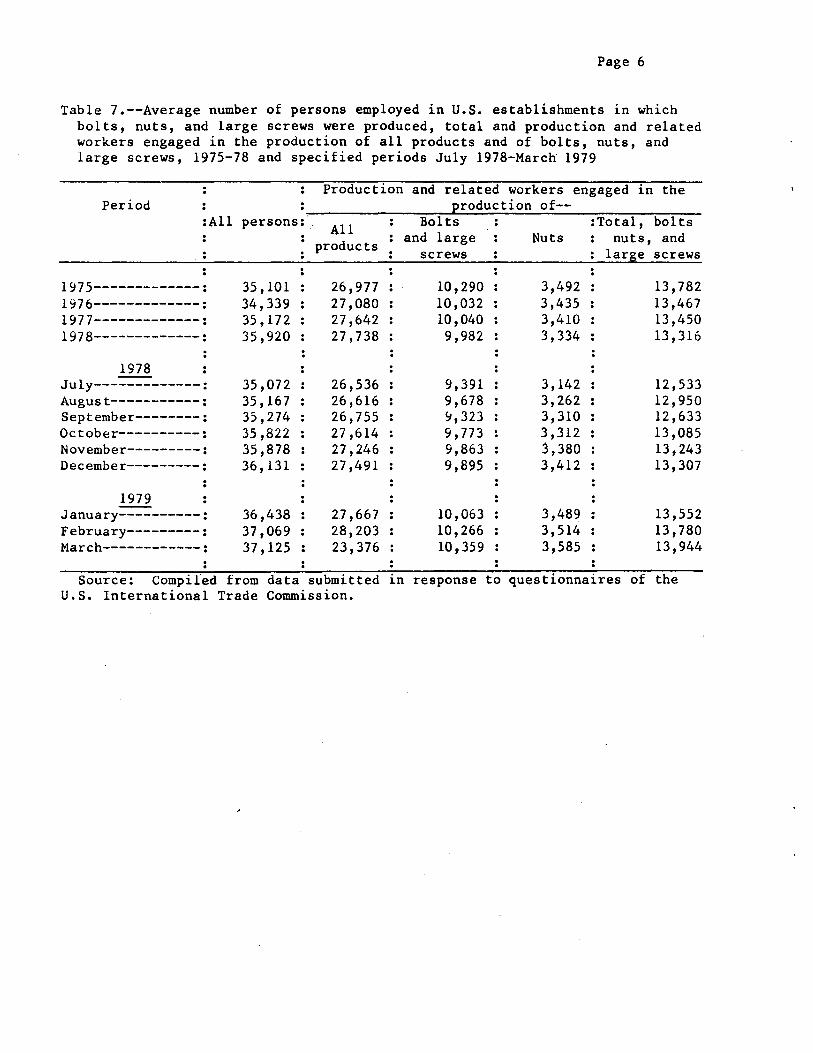
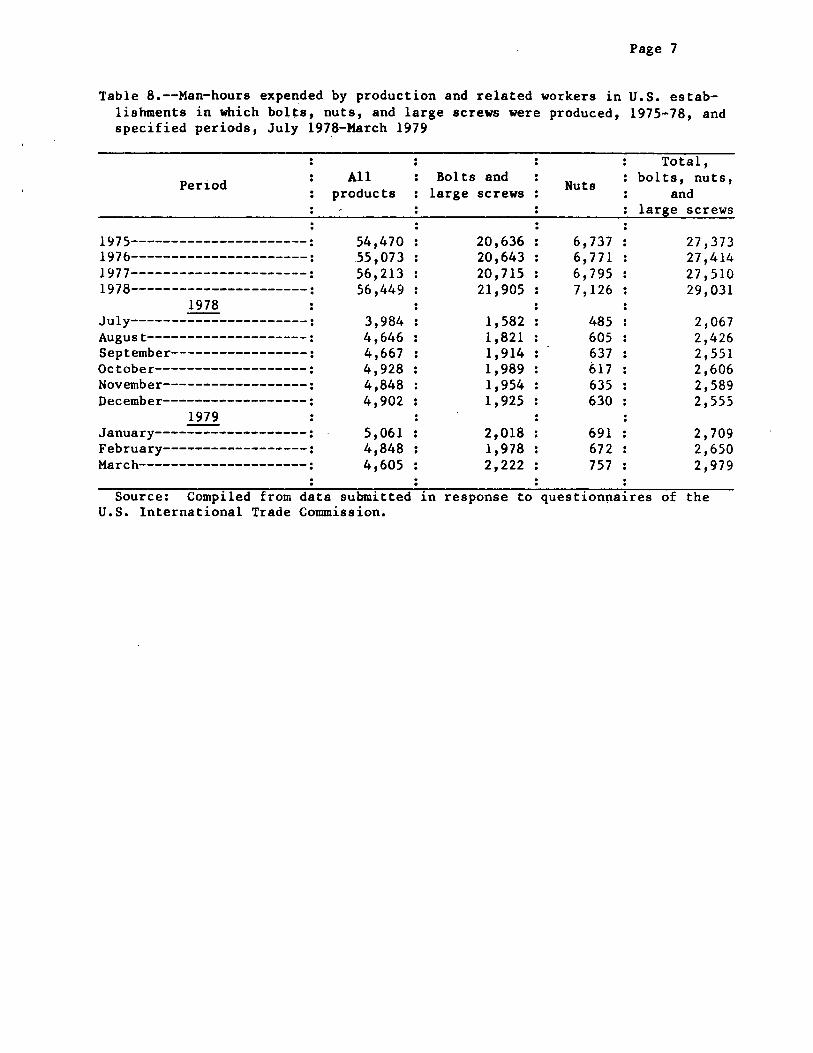
Employment and man-hours
The average number of production and related workers engaged in the pro
duction of bolts, nuts, and large screws increased continuously during the
last two quarters of 1978 and the first quarter of 1979, from 38,100 workers
to 41,300 workers. The man-hours expended by these workers followed the same
increasing trend during this period.
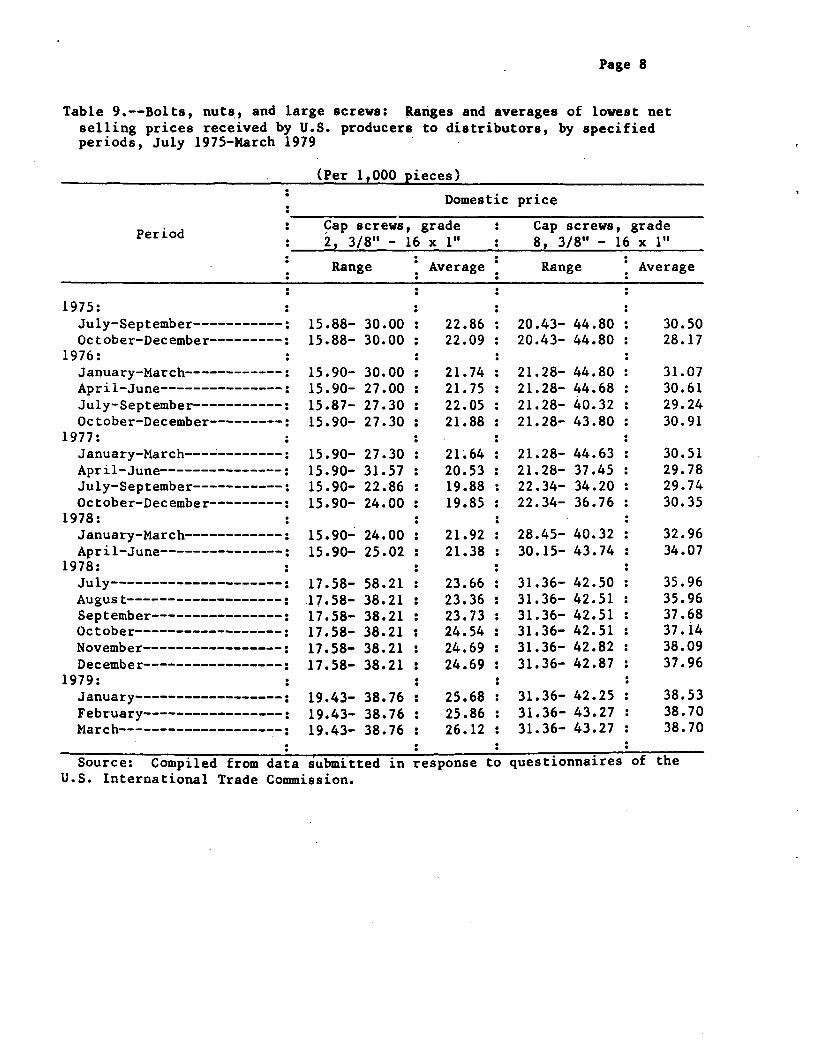
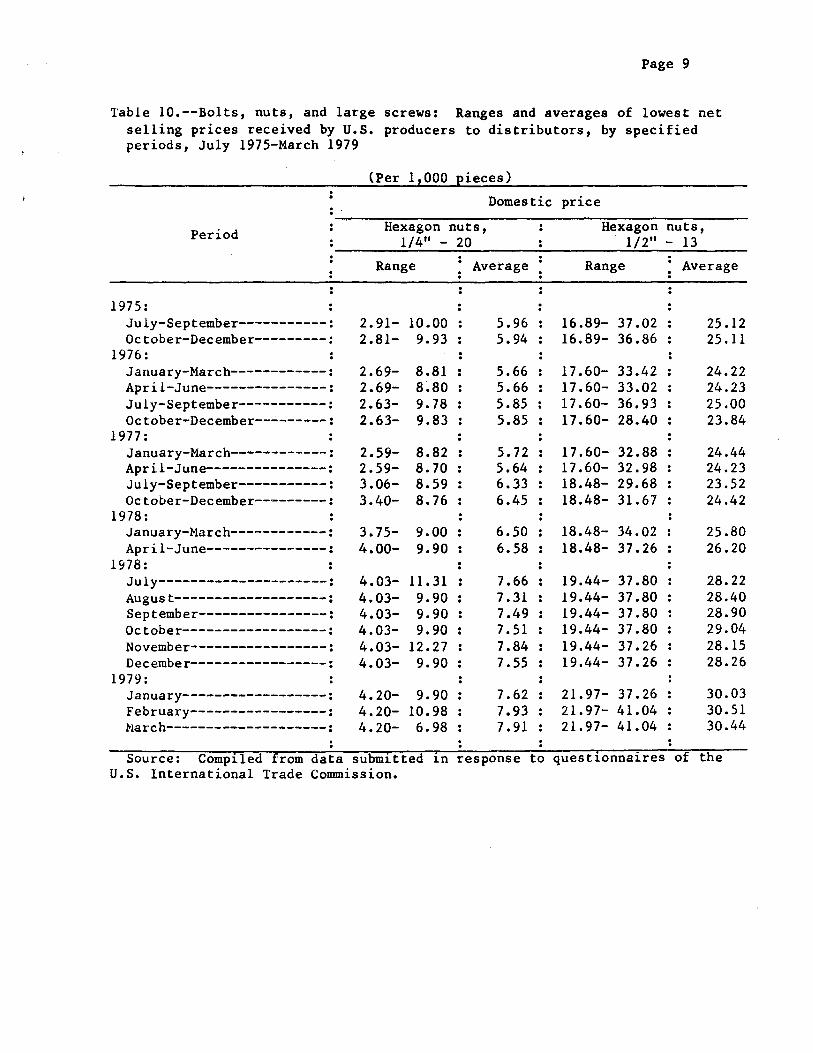
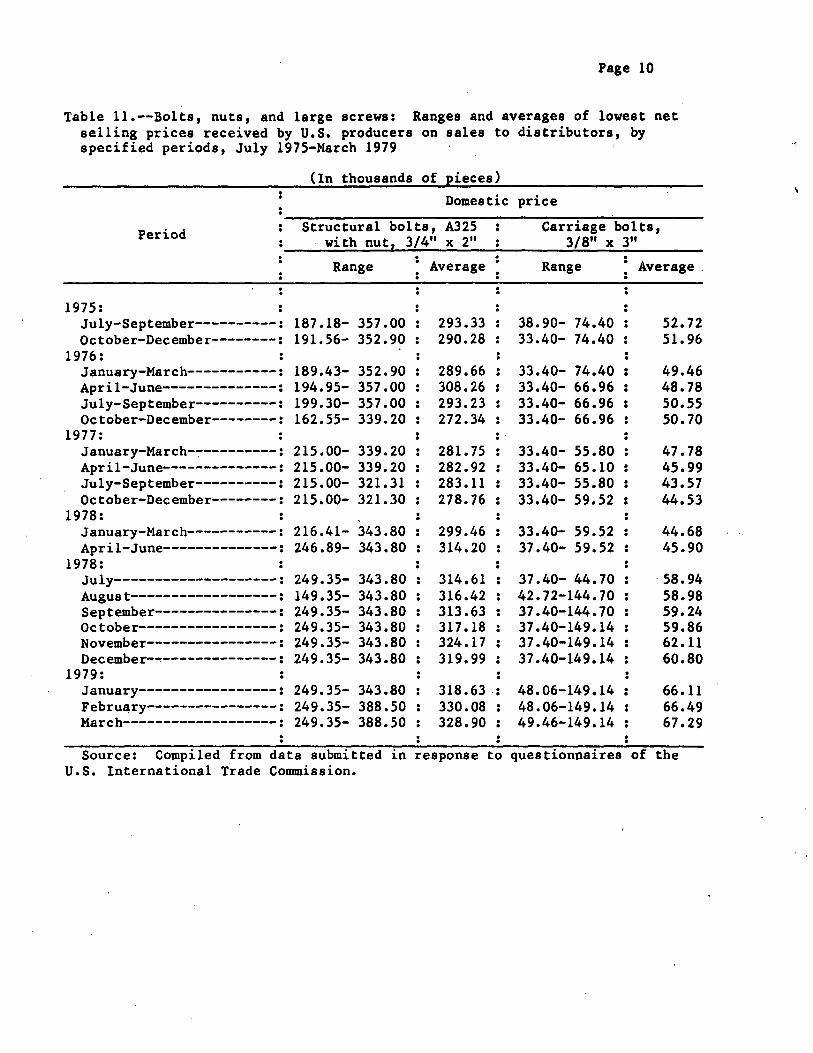
Prices
The average lowest net selling prices received in the first quarter of
1979 on six representative fastener products were, on an average, about 6
percent higher than prices received during the last two quarters of 1978.
iii
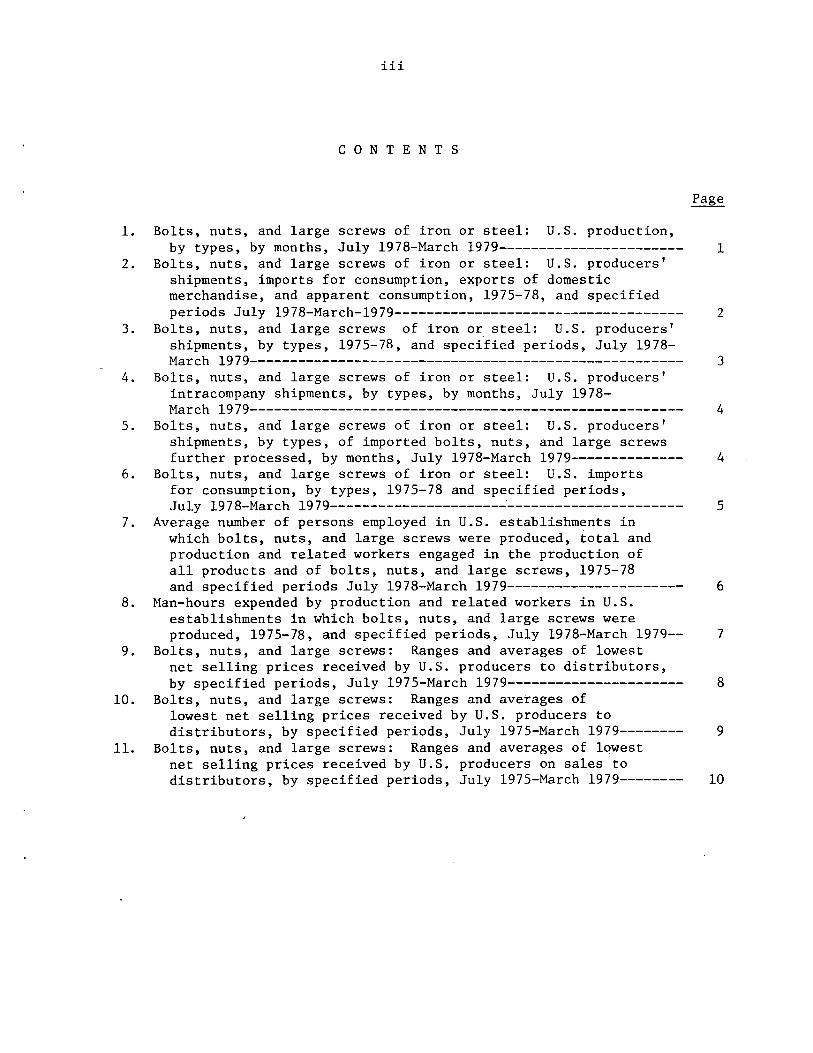
C 0 N T E N T S
1. Bolts, nuts, and large screws of iron or steel: U.S. production, by types, by months, July 1978-March 1979----------------------- 1
2. Bolts, nuts, and large screws of iron or steel: U.S. producers' shipments, imports for consumption, exports of domestic merchandise, and apparent consumption, 1975-78, and specified periods July 1978-March-1979------------------------------------ 2
3. Bolts, nuts, and large screws of iron or steel: U.S. producers' shipments, by types, 1975-78, and specified periods, July 1978-March 1979------------------------------------------------------ 3
4. Bolts, nuts, and large screws of iron or steel: U.S. producers' intracompany shipments, by types, by months, July 1978-March 1979------------------------------------------------------ 4
5. Bolts, nuts, and large screws of iron or steel: U.S. producers' shipments, by types, of imported bolts, nuts, and large screws further processed, by months, July 1978-March 1979-------------- 4
6. Bolts, nuts, and large screws of iron or steel: U.S. imports for consumption, by types, 1975-78 and specified periods, July 1978-March 1979----------------------·---------------------- 5
7. Average number of persons employed in U.S. establishments in which bolts, nuts, and large screws were produced, total and production and related workers engaged in the production of all products and of bolts, nuts, and large screws, 1975-78 and specified periods July 1978-March 1979---------------------- 6
8. Man-hours expended by production and related workers in U.S. establishments in which bolts, nuts, and large screws were produced, 1975-78, and specified periods, July 1978-March 1979-- 7
9. Bolts, nuts, and large screws: Ranges and averages of lowest net selling prices received by U.S. producers to distributors, by specified periods, July 1975-March 1979---------------------- 8
10. Bolts, nuts, and large screws: Ranges and averages of lowest net selling prices received by U.S. producers to distributors, by specified periods, July 1975-March 1979-------- 9
11. Bolts, nuts, and large screws: Ranges and averages of lqwest net selling prices received by U.S. producers on sales to distributors, by specified periods, July 1975-March 1979-------- 10

Page 1
Table 1.--Bolts, nuts, and lar.ge screws of iron or steel: U.S. production by types, by months, July 1978-March 1979
Period :
1978: July-~-----------------:
August-----------------: September--------------: October----------------: November---------------: December-------------~-:
1979: January----------------: February---------------: March------------------:
Bolts and large screws
. . Nuts
Quantity (thousands of pounds)
52,048 75,474 78,718 85,488 78,473 79, 112
86,160 82,889 92,660 . .
12,198 21,264 17,898 21,315 21,349 19,181
23,338 23,045 26,487
Total
Source: Compiled from data submitted in response to questionnaires of the U.S. International Trade Connnission.
64,246 96,738 96,616
106,803 99,822 98,293
109,498 105,934 119,147
Page 2
Table 2.--Bolts, nuts, and large screws of iron or steel: U.S. producers' shipments, imports for consumption, exports of domestic merchandise, and apparent consumption, 1975-78, and specified periods July 1978-March 1979
Period Producers':
shipments
Imports Apparent
Exports l/: consumption
Ratio (percent) of imports to--
Apparent :Shipments: consump
tion
Quantity (thousands of pounds)
1975-------------: 1976-------------: 1977-------------: 1978-------------:
1978 July---====------: August-----------: September--------: October----------: November----~----:
December---------: 1979
1,050,140 1,133,952 1,175,563 1,151,326
67,335 93,943 94,237
100,634 92,699 83,616
534,796 704,474 716' 916 849,313
77 ,074 72,349 65,380 66,751 67,107 53,181
172,486 197,269 218,265 217,051
15,255 21,301 14,528 20,439 17,723 15,413
1,412,450 l ,_ 641, 157 1,674,214 1,783,588
129,154 144,991 145,089 146,946 142,083 121,384
51 62 61 74
115 77 69 66 72 64
38 43 43 48
60 50 45 45 47 . 44
January----------: 107,364 65,151 16,192 156,~23 61 42 February---:------: 99,152 68.,174 17,566 149,760 69 46 March------------:~ __ 1_15_,~2_7_6 ______ 6_1~'~4_0_4 ______ 1~9~'~1_2_2 _____ 1_5_7~,_5_5_8 ________ 5_3~----- 39
Value (thousands of dollars) . .
1975-------------: 1976-------------: 1977-------------: 1978-------~-----:
1978 : July---====------: August-----------: September--------: October--~-------: November---------: December---------:
1979 January====-------: February---------: March------------:
947,450 986,432
1,074,609 1;095,332
59,224 85,074 84,806 : . 92,098 84,565 78,146
100,701 94,958
llf,421
207,795 227,390 256·, 220 368,865
~1,841 31,029 30,697 32' 110 31,840 49,324
31,158 34,421 29,544 . . . . . .
101,251 107,055 114' 252 133,112
8,258 10,348
9,575 12,623 10,875 10,635
10,~82 11, 041 11, 926
1,053,994 1,106,767 1,216,577 1,331,085
82,807 105,755. 105,928 11.1,585 105,530 116 ,835
121,477 118,338 129,039
22 23 24 34
54 37 36 35 38 63
31 36 27
1/ Prior to January 1, 1978, exports iqclude bolts, threaded rods and studs, nuts if nuts and bolts are in the same shipment, screws, rivets, washers, and similar articles. It is estimated by the staff of the·u.s. International Trade Commission that bolts, nuts, and large screws of iron or steel accounted for approximately 80 percent of total exports.
Source: U.S. producers' shipments, compiled from data submitted in response to questionnaires of the U.S. International Trade Commission; imports and exports, compiled from official statistics of the U.S. Department of Commerce, except as noted.
20 21 21 28
39 29 29 29 30 42
26 29 23
Page 3
Table 3.--Bolts, nuts, and large screws of iron or steel: U.S. producers' shipments, by types, 1975-78, and specified periods, July 1978-March 1979
Period :· Bolts and large screws Nuts Total
1975----------~----------: 1976---------------------: 1977---------------------: 1978---------------------:
1978 July---------------------: August-------------------: September----------------: October------------------: November-----------------: December-----------------:
1979
Quantity (thousands of pounds)
852,064 912 ,072 950,607 920 '712
54,134 73,633 73,789 76,496 73,258 70,335
198,076 221,880 224,956 230,614
13,201 20,310 20,448 24,138 19,441 13,281
1,050,140 1,133,952 1,175,563 1,151,326
67,335 93,943 94,237
100, 634 92,699 83,616.
January------------------: 84,191 23,173 107,364 February-----------------: 78,709 20,443 99,152 March--------------------=~~~~~-9_0_,7_0_3 ___________ 2_4~,_5_7_3_,_ ____ ~~-1_1_5~,_2_7_6
Value (thousands of dollars)
1975---------------------: 1976---------------------: 1977---------------------: 1978---------------------:
1978 July-------====-----------: August-------------------: September----------------: October------------------: November-----------------: December-----------------:
1979 January------------------: February-----------~-----: March--------------------:
684,207 702,426 779,917 763,368
42,099 58,327 57,831 59,954 58,323 53,644
69,450 65,944 77 '715
Source: Compiled from data submitted in the U.S. International Trade Commission.
263,243 284,006 294,692 331, 964
17,125 26,747 26,975 32,144 26' 242 24,502
. . 31,251 29,014 33,706 . . .
response to questionnaires
947,450 986,432
1,074,609 1,095,332
59,224 85,074 84,806 92,098 84,565 78' 146
100,701 94,958
111,421
of
Page 4
Table 4.--Bolts, nuts, and large screws of iron or steel: U.S. producers' intracompany shipments, by types, by months, July 1978-March 1979
Period
1978: July-------~-----------: August-----------------: September--------------: October----------------: November---------------: December---------------:
1979: January----------------: February---------------: March------------------:
Bolts and large screws Nuts Total
Quantity (thousands of pounds)
1,736 294 3,549 423 3,858 412 4,479 . 467 . 4,582 474 4,277 651
4,050 410 3,483 395 4,662 555
Source: Compiled from data submitted in response to questionnaires of the U.S. International Trade Commission.
Table 5.--Bolts, nuts, and larg·e screws of iron or steel: u.-s. producers' shipments, by types, of imported bolts, nuts, and large screws further processed, by months, July 1978-March 1979
Period
1978: July~------------------:
August-----------------: September--------------: October----------------: November---------------: December---------------:
1979: January----------------: February--------~------: March------------------:
Bolts and large screws Nuts Total
Quantity (thousands of pounds)
- . 377 . - . 643 . - . 643 . - . 727 . - . 657 . - . 461 . - . 698 . - . 551 . - . 822 .
2,030 3,972 4,270 4,946 5,056 4,928
4,460 3,878 5,217
377 643 643 727 657 461
698 551 822
Source: Compiled from data submitted in response to questionnaires of the U.S. International Trade Commission.
Page 5
Table 6.--Bolts, nuts, and large scr.ews of iron or steel: U.S. imports for consumption, by types, 1975-78, and specified periods, July 1978-March 1979
Period
1975---------------------: 19 7 6--------·-------------: 1977---------------~-----:
1978---------------------:
1978 July---------------------: August-------------------: September----------------: October------------------: November-----------------: December-----------------:
1979 January------------------: February-----------------: March--------------------:
1975---------------------: 1976---------------------: 1977---------------------: 1978---------------------:
1978 July-------====----------: August-------------------: September----------------: October------------------: November-----------------: December-----------------:
1979 January----------~-------:
February----~------------:
March--------------------:
Bolts and large screws
Quantity
329,758 474,084 491,140 571, 324
51,026 45,303 37,430 38,995 41, 211 23,825
37,790 41,955 35,781
Value
108,336 129,297 156,006 210,917
18,611 17,151 16,648 16,573 17,374 32,629
15,579 20,161 14,397 :
Nuts Total
(thousands of pounds) .. .
205,038 230,390 225, 776 277,989
26,048 27,046 27,950 27,756 25,896 29,356
27,391 26,219 25,623
(thousands of dollars)
99,459 98,093
100,214 157,948
13,230 13 ,878 14,049 15,537 14,466 16,695
15,579 14,260 15,147
Source: Compiled from official statistics of the U.S. Department of Counnerce.
534,796 704,474 716,916 849,313
77,074 72, 349 65,380 66,751 67,107 53,181
65,181 68' 174 61,404
207,795 227,390 256,220 368,865
31,841 31,029 30,697 32' 110 31,840 49, 324
31,158 34,421 29,544
Page 6
Table 7.--Average number of persons employed in U.S. establishments in which bolts, nuts, and large screws were produced, total and production and related workers engaged in the production of all products and of bolts, nuts, and large screws, 1975-78 and specified periods July 1978-March 1979
Production and related workers engaged in the Period Eroduction of--
:All persons: . All Bolts :Total, bolts
products and large Nuts nuts, and . screws large screws .. 1975-------------: 35,101 26' 977 10' 290 3,492 13 '782 1976-------------: 34,339 27,080 10' 032 3,435 13,467 1977-------------: 35,172 27,642 10,040 3,410 13,450 1978-------------: 35 '920 27,738 9,982 3,334 13,316
1978 July---====------: 35 '072 26,536 9,391 3' 142 12,533 August-----------: 35,167 26,616 9,678 3,262 12,950 September--------: 35,274 26,755 9,323 3,310 12,633 October----------: 35,822 27,614 9 '773 3,312 13,085 November---------: 35 ,878 27,246 9,863 3,380 13,243 December---------: 36' 131 27,491 9,895 3,412 13,307
1979 January----------: 36,438 27, 667 10,063 3,489 13,552 February---------: 37,069 28,203 10,266 3,514 13,780 March------------: 37,125 23,376 10,359 3,585 13,944
Source: Compiled from data submitted in response to questionnaires of the U.S. International Trade Commission.
Page 7
Table 8.--Man-hours expended by production and related workers in U.S. establishments in which bolts, nuts, and large screws were produced, 1975-78, and specified periods, July 197.8-March 1979
Total,
Period All Bolts and Nuts bolts, nuts,
products large screws and large screws
1975----------------------: 54,470 20,636 6,737 27,373 1976----------------------: .55,073 20,643 6,771 27,414 1977----------------------: 56,213 20,715 6,795 27,510 1978----------------------: 56,449 21,905 7,126 29,031
1978 July----------------------: 3,984 1,582 485 2,067 August--------------------: 4,646 1,821 605 2,426 September-----------------: 4,667 1,914 637 2,551 October-------------------: 4,928 1,989 617 2,606 November------------------: 4,848 1,954 635 2,589 December------------------: 4,902 1,925 630 2,555
1979 January-------------------: 5,061 2,018 691 2,709 February------------------: 4,848 1,978 672 2,650 March---------------------: 4,605 2,222 757 2,979
Source: Compiled from data submitted in response to questionnaires of the U.S. International Trade Commission.
Page 8
Table 9.--Bolts, nuts, and large screws: Ranges and averages of lowest net selling prices received by U.S. producers to distributors, by specified periods, July 1975-March 1979 · ·
(Per 1,000 pieces)
Domestic price
Period
1975: July-September-----------: October-December---------:
1976: January-March------------: April-June---------------: July-September-----------: Oc tober-De.cember---------:
1977: January-March---~--------:
April-June---------------: July-September-----------: October-December---------:
1978: January-March------------: April-June---------------:
1978: July---------------------: August-------------------: September----------------: October------------------: November-----------------: December-----------------:
1979: January------------------: February-----------------: March------------------~-:
~ap screws, grade 2, 3/811
- 16 x 111
Range
15.88- 30.00 15.88- 30.00
15.90- 30.00 15.90- 21.00 15.87- 27.30 15.90- 27.30
15.90- 27.30 15. 90- 31. 57 15.90- 22.86 15.90- 24.00
15.90_; 24.00 15.90- 25.02
17.58- 58.21 .17.58- 38.21 17.58- 38.21 17.58- 38~21 17.58- 38.21 11.58- 38.21
19.43- 38.76 19.43- 38.76 19.43- 38.76
Average
22.86 22.09
21. 74 21. 75 22.05 21.88
2L64 20.53 19.88 19.85
21.92 21.38
23.66 23.36 23.73 24.54 24.69 24.69
25.68 25.86 26.12
Cap screws, grade 8, 3/8" - 16 x 111
Range Average
20.43- 44.80 30.50 20.43- 44.80 28.17
21. 28- 44. 80 31.07 21. 28- 44. 68 30.61 21. 28- 40. 32 29.24 21. 28- 43. 80 30.91
21. 28- 44. 63 30.51 21. 28- 37 .45 29.78 22.34- 34.20 29.74 22.34- 36.76 30.35
28.45- 40~32 32.96 30.15- 43.74 34.07
31. 36- 42. 50 35.96 31. 36- 42. 51 35.96 31.36- 42.51 37.68 31.36- 42.51 37.i4 31.36- 42.82 38.09 31. 36- 42 .87 37.96
31.36- 42.25 38.53 31. 36- 43. 27 38.70 31.36- 43.27 38.70
Source: Compiled from data submitted in response to questionnaires of the U.S. International Trade CoDDnission.
Page 9
Table 10.--Bolts, nuts, and large screws: Ranges and averages of lowest net selling prices received by U.S. producers to distributors, by specified periods, July 1975-March 1979
. . . (Per 1 2 000 pieces)
Domestic price ~~~~~~~~~~~~~~~~~~~~~~~~
Period Hexagon nuts, 1/411
- 20
Range Average
1975: July-September-----------: 2.91- 10.00 5.96 October-December---------: 2.81- 9.93 5.94
1976: January-March------------: 2.69- 8.81 5.66 April-June---------------: 2.69- 8~80 5.66 July-September-----------: 2.63- 9.78 5.85 October-December---------: 2.63- 9.83 5.85
1977: January-March------------: 2.59- 8.82 5. 72 April-June---------------: 2.59- 8.70 5.64 July-September-----------: 3.06- 8.59 6.33 October-December---------: 3.40- 8.76 6.45
1978: January-March------------: 3.75- 9.00 6.50 April-June---------------: 4.00- 9.90 6.58
1978: July---------------------: 4.03- 11.31 7.66 August-------------------: 4.03- 9.90 7.31 September----------------: 4.03- 9.90 7.49 October------------------: 4.03- 9.90 7.51 November-----------------: 4.03- 12.27 7.84 December-----------------: 4.03- 9.90 7.55
1979: January------------------: 4.20- 9.90 7.62 February-----------------: 4.20- 10.98 7.93 March--------------------: 4.20- 6.98 7.91
Hexagon nuts, 1/211
- 13
Range Average
16.89- 37.02 25.12 16.89- 36.86 25.11
17.60- 33.42 24.22 17.60- 33.02 24.23 17.60- 36.93 25.00 17.60- 28.40 23.84
17.60- 32.88 24.44 17.60- 32.98 24.23 18.48- 29.68 23.52 18.48- 31.67 24.42
18.48- 34.02 25.80 18.48- 37.26 26.20
19.44- 37.80 28.22 19.44- 37.80 28.40 19.44- 37.80 28.90 19.44- 37.80 29.04 19.44- 37.26 28.15 19.44- 37.26 28.26
21.97- 37.26 30.03 21. 9 7- 41. 04 30.51 21. 97- 41. 04 30.44
Source: Compiled from data submitted in response to questionnaires of the U.S. International Trade Commission.
Page 10
Table 11.--Bolts, nuts, and large screws: Ranges and averages of lowest net selling prices received by U.S. producers on sales to distributors, by specified periods, July 1975-March 1979
(In thousands of pieces)
Domestic price
Period Structural bolts, A325 Carriage bolts, with nut 2 3/4" x 211 3/8" x 3"
Range Average Range : Average .
1975: July-September----------: 187.18- 357.00 293.33 38.90- 74.40 52.72 October-December--------: 191.56- 352.90 290.28 33.40- 74.40 51.96
1976: January-March-----------: 189.43- 352.90 289.66 33.40- 74.40 49.46 April-June--------------: 194.95- 357.00 308.26 33.40- 66.96 48.78 July-September----------: 199.30- 357.00 293.23 33.40- 66.96 50.55 October-December--------: 162.55- 339.20 272.34 33.40- 66.96 50.70
1977: January-March-~---------: 215.00- 339.20 281. 75 33.40- 55.80 47.78 April-June--------------: 215.00- 339.20 282.92 . 33.40- 65.10 45.99 July-September----------: 215.00- 321.31 283 .11 33.40- 55.80 43.57 October-December--------: 215.00- 321.30 278.76 33.40- 59.52 44.53
1978: -January-March-----------: 216.41- 343.80 299.46 33.40- 59.52 44.68 April-June--------------: 246.89- 343.80 314.20 37.40- 59.52 45.90
1978: July--------------------: 249.35- 343.80 314.61 37.40- 44.70 . 58.94 August------------------: 149.35- 343.80 316.42 42.72-144.70 58.98 September---------------: 249.35- 343.80 313. 63 37.40-144.70 59.24 October-----------------: 249.35- 343.80 317.18 37.40-149.14 59.86 November----------------: 249.35- 343.80 324.17 37.40-149.14 62.11 December-~--------------: 249.35- 343.80 319.99 37.40-149.14 60.80
1979: January-----------------: 249.35- 343.80 318.63 .: 48.06-149.14 66.11 February----------------: 249.35- 388.50 330.08 48.06-149.14 66.49 March-------------------: 249.35- 388.50 328.90 . 49.46-149.14 67.29 . Source: Compiled from data submitted in response to questionnaires of the
U.S. International Trade Commission.
Library Cataloging Data
U.S. International Trade Commission. Bolts, nuts, and large screws of iron
or steel: U.S. production, shipments, imports, exports, apparent consumption, employment, man-hours, and prices, third and fourth quarters of 1978 and the first quarter of 1979. Report to the President on inv~stigation no. 332-103 under section 332 of the Tariff act of 1930. Washington, 1979.
10 p. illus. 28 cm. (USITC Publication 979)
1. Bolts and nuts. 2. Screws. I. Title.
UNITED STATES
INTERNATIONAL TRADE COMMISSION WASHING'TON. D.C. 20436
OFFICIAL BUSINESS
ADDRESS CORRECTION REQUESTED
ADDRESS CHANGE O Remove from List O Change as Shown
Please detach address label and mail to address shown above.
Postage And Fees Paid U.S. International Trade Commission ~
u.&.MIUL


![ME 312 Mechanical Machine Design [Screws, Bolts, Nuts]](https://img.pdfslide.us/doc/110x75/58abead91a28ab504e8b545f/me-312-mechanical-machine-design-screws-bolts-nuts.jpg)