Embed Size (px)
Citation preview
Global Financial Crisis Discussion Series
Paper 13: Bolivia Phase 2
Luis Carlos Jemio and Osvaldo Nina
Overseas Development Institute
Global Financial Crisis Discussion Series Paper 13: Bolivia Phase 21
Luis Carlos Jemio and Osvaldo Nina2
January 2010
Overseas Development Institute 111 Westminster Bridge Road
London SE1 7JD
1 This paper was funded by the Swedish Agency for International Development Cooperation (Sida) and is part of a wider research project coordinated by the Overseas Development Institute (ODI) London, but it does not necessarily reflect their views. 2 Instituto de Estudios Avanzados en Desarrollo (INESAD).
ii
Contents
Figures and tables iii
Acronyms iv
Abstract v
1. Introduction 1
2. Effects on Bolivia: Key transmission mechanisms 2
2.1 Capital flows 2 2.2 Trade 2 2.3 Remittances 7 2.4 Aid flows 8 2.5 Summary: Balance of payments effects 8
3. Growth and development effects 10
3.1 National-level growth, investment and employment 10 3.2 Sectoral-level effects 13 3.3 Fiscal effects 14 3.4 Poverty and distributional effects 16
4. Policy responses: A critical review 17
4.1 Macroeconomic policies to manage the impact of the crisis 17 4.2 Social policies to respond to the impact of the crisis 20 4.3 Economy-wide and sectoral structural policies for getting the country out of the crisis 20
5. Conclusions 22
5.1 The impact of the crisis: An update 22 5.2 Looking ahead: How well is the country positioned to gain from a future recovery
and grow sustainably? 22
References 23
iii
Figures and tables Figure 1: Quarterly capital flows, 2005Q1-2009Q3 (US$ millions) 2 Figure 2: Monthly total exports, Jan 2005-Oct 2009 (US$ millions) 3 Figure 3: Bolivia’s export price index, Dec 2004-Oct 2009 (base year 2000 = 1) 3 Figure 4: World prices of zinc and tin, end-2004-2009 (US$ per tonne) 4 Figure 5: WTI oil price and natural gas export price for Bolivia, Dec 2004-Dec 2009 5 Figure 6: Quarterly exports, Dec 2004-Oct 2009 (US$ millions) 6 Figure 7: Monthly imports, Dec 2004-Sep 2009 (US$ millions) 6 Figure 8: Quarterly exports, imports and trade balance, 2004Q1-2009Q3 (US$ millions) 7 Figure 9: Quarterly remittances, 2004Q4-2009Q3 (US$ millions) 8 Figure 10: Quarterly aid flows, 2004Q4-2009Q3 (US$ millions) 8 Figure 11: Quarterly current account balance, 2004Q4-2009Q3 (% of GDP) 9 Figure 12: Foreign exchange reserves, Dec 2004-Dec 2009 (US$ billions) 9 Figure 13: Per capita income and per capita GDP, 2005Q1-2009Q2 (US$) 10 Figure 14: Quarterly and average GDP growth rates, 2005Q1-2009Q3 (y-o-y % change) 11 Figure 15: GDP growth rates by activity sector, 2004-2009 (% change) 11 Figure 16: GDP growth rates by activity sector, 2004-2009 (% change) 12 Figure 17: Quarterly savings–investment balance, 2004Q1-2009Q3 (% of GDP) 12 Figure 18: Public and private investment, 2004Q1-2009Q2 (% of GDP) 13 Figure 19: Total government income, expenditure and balance, 2005Q1-2009Q2
(constant 2004 Bs billions) 14 Figure 20: Tax revenue structure, 2004 and 2008 (%) 15 Figure 21: Non-financial public sector balance, 2004Q1-2009Q2 (% of GDP) 15 Figure 22: Total public debt, Jun 2005-Dec 2009 (US$ billions) 16 Figure 23: Inflation and selected monetary aggregate growth rates, Dec 2004-Oct 2009
(12-month % change) 17 Figure 24: Currency and OMOs, Dec 2004-Oct 2009 (Bs billions) 18 Figure 25: Inflation and nominal and real exchange rate appreciation/depreciation,
Dec 2004-Oct 2009 (12-month % change) 19 Figure 26: Weighted multilateral real exchange rate, Dec 2004-Oct 2009 (base year = 2000) 19 Table 1: Bolivia’s export prices, 2008-2009 (% change) 4 Table 2: Bolivia’s export quantities, Jan-Sep 2008 and Jan-Sep 2009 (constant US$, 2004 prices) 5 Table 3: Real exchange rate appreciation/depreciation by trading region, Dec 2004-Sep 2009
(% change) 20
iv
Acronyms ATPDEA Andean Trade Promotion and Drug Eradication Act BCB Central Bank of Bolivia CAN Andean Community EIA Energy Information Administration EU European Union FDI Foreign Direct Investment GDP Gross Domestic Product IDH Direct Tax on Hydrocarbons IEHD Specific Tax on Hydrocarbons INE National Institute of Statistics Mercosur Common Market of the South NAFTA North American Free Trade Agreement NFPS Non-Financial Public Sector OMO Open Market Operations Sida Swedish Agency for International Development Cooperation US United States VAT Value Added Tax WTI West Texas Intermediate y-o-y Year-on-Year
v
Abstract
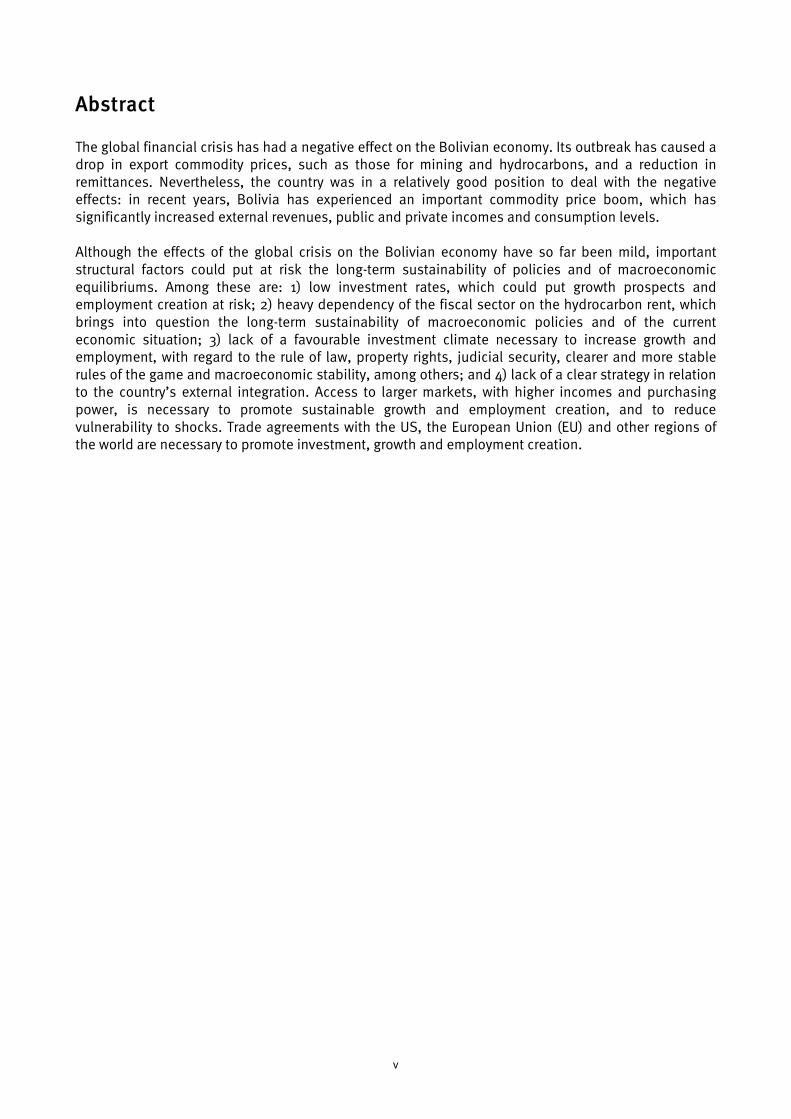
The global financial crisis has had a negative effect on the Bolivian economy. Its outbreak has caused a drop in export commodity prices, such as those for mining and hydrocarbons, and a reduction in remittances. Nevertheless, the country was in a relatively good position to deal with the negative effects: in recent years, Bolivia has experienced an important commodity price boom, which has significantly increased external revenues, public and private incomes and consumption levels. Although the effects of the global crisis on the Bolivian economy have so far been mild, important structural factors could put at risk the long-term sustainability of policies and of macroeconomic equilibriums. Among these are: 1) low investment rates, which could put growth prospects and employment creation at risk; 2) heavy dependency of the fiscal sector on the hydrocarbon rent, which brings into question the long-term sustainability of macroeconomic policies and of the current economic situation; 3) lack of a favourable investment climate necessary to increase growth and employment, with regard to the rule of law, property rights, judicial security, clearer and more stable rules of the game and macroeconomic stability, among others; and 4) lack of a clear strategy in relation to the country’s external integration. Access to larger markets, with higher incomes and purchasing power, is necessary to promote sustainable growth and employment creation, and to reduce vulnerability to shocks. Trade agreements with the US, the European Union (EU) and other regions of the world are necessary to promote investment, growth and employment creation.
1
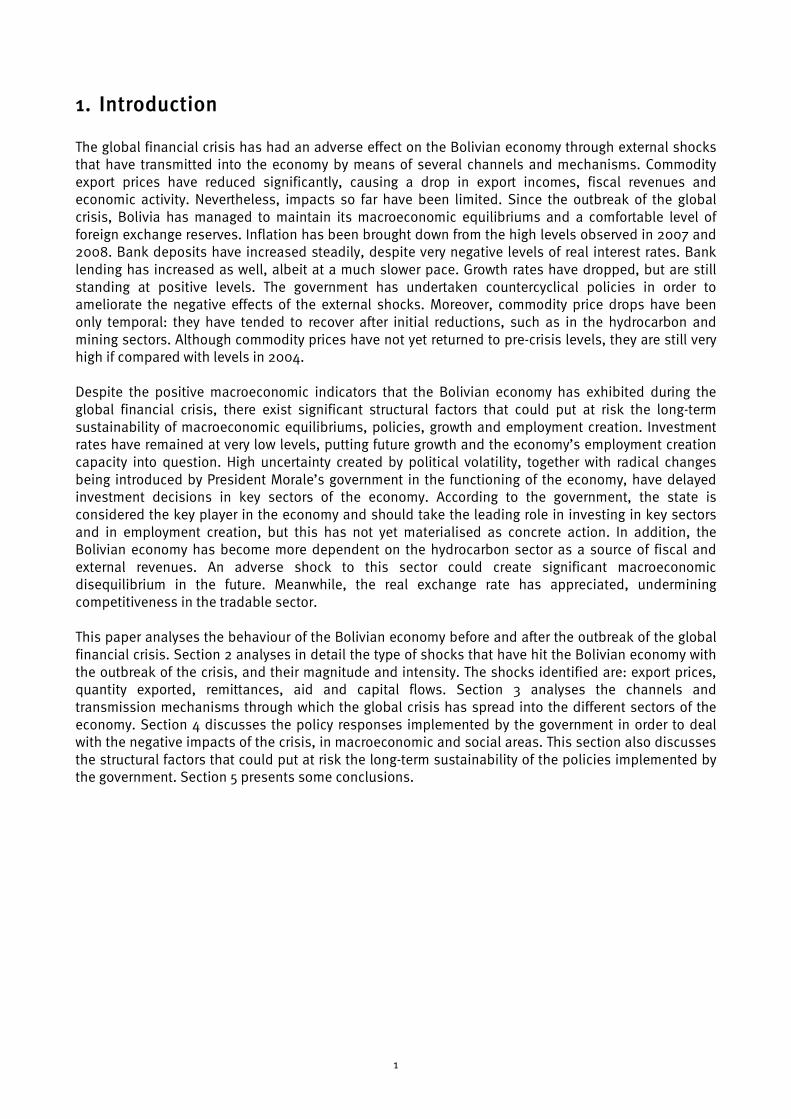
1. Introduction The global financial crisis has had an adverse effect on the Bolivian economy through external shocks that have transmitted into the economy by means of several channels and mechanisms. Commodity export prices have reduced significantly, causing a drop in export incomes, fiscal revenues and economic activity. Nevertheless, impacts so far have been limited. Since the outbreak of the global crisis, Bolivia has managed to maintain its macroeconomic equilibriums and a comfortable level of foreign exchange reserves. Inflation has been brought down from the high levels observed in 2007 and 2008. Bank deposits have increased steadily, despite very negative levels of real interest rates. Bank lending has increased as well, albeit at a much slower pace. Growth rates have dropped, but are still standing at positive levels. The government has undertaken countercyclical policies in order to ameliorate the negative effects of the external shocks. Moreover, commodity price drops have been only temporal: they have tended to recover after initial reductions, such as in the hydrocarbon and mining sectors. Although commodity prices have not yet returned to pre-crisis levels, they are still very high if compared with levels in 2004. Despite the positive macroeconomic indicators that the Bolivian economy has exhibited during the global financial crisis, there exist significant structural factors that could put at risk the long-term sustainability of macroeconomic equilibriums, policies, growth and employment creation. Investment rates have remained at very low levels, putting future growth and the economy’s employment creation capacity into question. High uncertainty created by political volatility, together with radical changes being introduced by President Morale’s government in the functioning of the economy, have delayed investment decisions in key sectors of the economy. According to the government, the state is considered the key player in the economy and should take the leading role in investing in key sectors and in employment creation, but this has not yet materialised as concrete action. In addition, the Bolivian economy has become more dependent on the hydrocarbon sector as a source of fiscal and external revenues. An adverse shock to this sector could create significant macroeconomic disequilibrium in the future. Meanwhile, the real exchange rate has appreciated, undermining competitiveness in the tradable sector. This paper analyses the behaviour of the Bolivian economy before and after the outbreak of the global financial crisis. Section 2 analyses in detail the type of shocks that have hit the Bolivian economy with the outbreak of the crisis, and their magnitude and intensity. The shocks identified are: export prices, quantity exported, remittances, aid and capital flows. Section 3 analyses the channels and transmission mechanisms through which the global crisis has spread into the different sectors of the economy. Section 4 discusses the policy responses implemented by the government in order to deal with the negative impacts of the crisis, in macroeconomic and social areas. This section also discusses the structural factors that could put at risk the long-term sustainability of the policies implemented by the government. Section 5 presents some conclusions.
2
2. Effects on Bolivia: Key transmission mechanisms
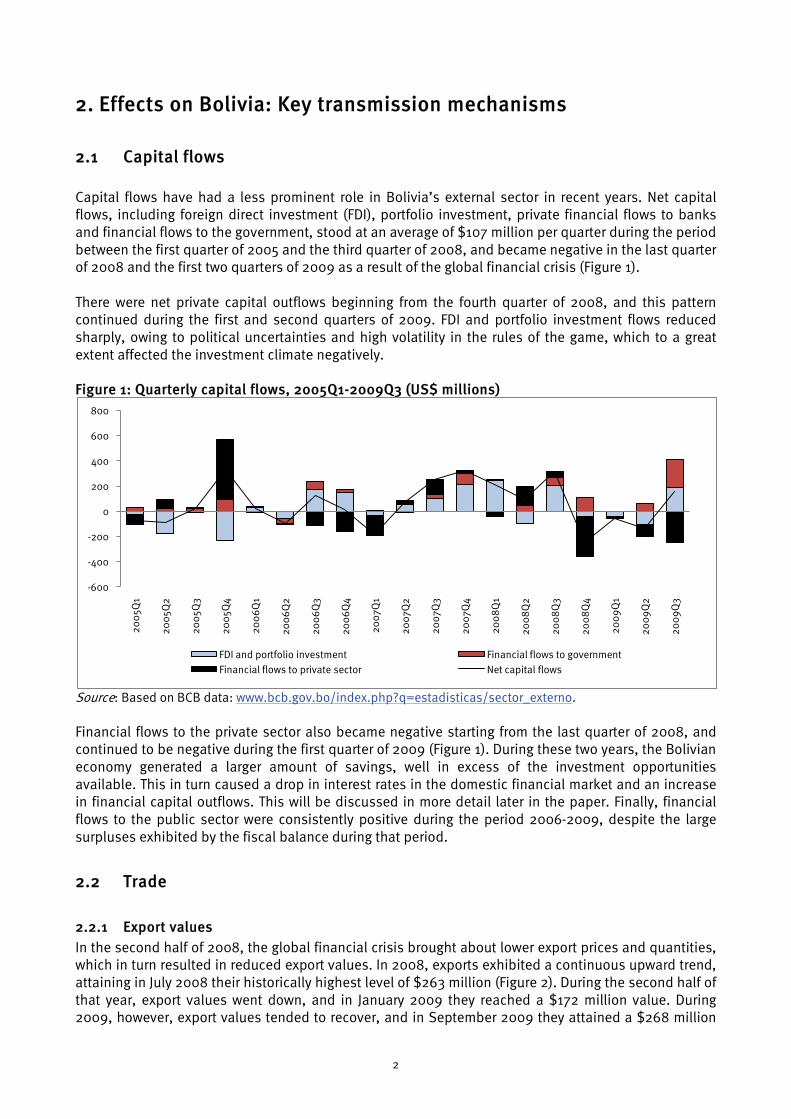
2.1 Capital flows Capital flows have had a less prominent role in Bolivia’s external sector in recent years. Net capital flows, including foreign direct investment (FDI), portfolio investment, private financial flows to banks and financial flows to the government, stood at an average of $107 million per quarter during the period between the first quarter of 2005 and the third quarter of 2008, and became negative in the last quarter of 2008 and the first two quarters of 2009 as a result of the global financial crisis (Figure 1). There were net private capital outflows beginning from the fourth quarter of 2008, and this pattern continued during the first and second quarters of 2009. FDI and portfolio investment flows reduced sharply, owing to political uncertainties and high volatility in the rules of the game, which to a great extent affected the investment climate negatively. Figure 1: Quarterly capital flows, 2005Q1-2009Q3 (US$ millions)
Source: Based on BCB data: www.bcb.gov.bo/index.php?q=estadisticas/sector_externo.
Financial flows to the private sector also became negative starting from the last quarter of 2008, and continued to be negative during the first quarter of 2009 (Figure 1). During these two years, the Bolivian economy generated a larger amount of savings, well in excess of the investment opportunities available. This in turn caused a drop in interest rates in the domestic financial market and an increase in financial capital outflows. This will be discussed in more detail later in the paper. Finally, financial flows to the public sector were consistently positive during the period 2006-2009, despite the large surpluses exhibited by the fiscal balance during that period.
2.2 Trade
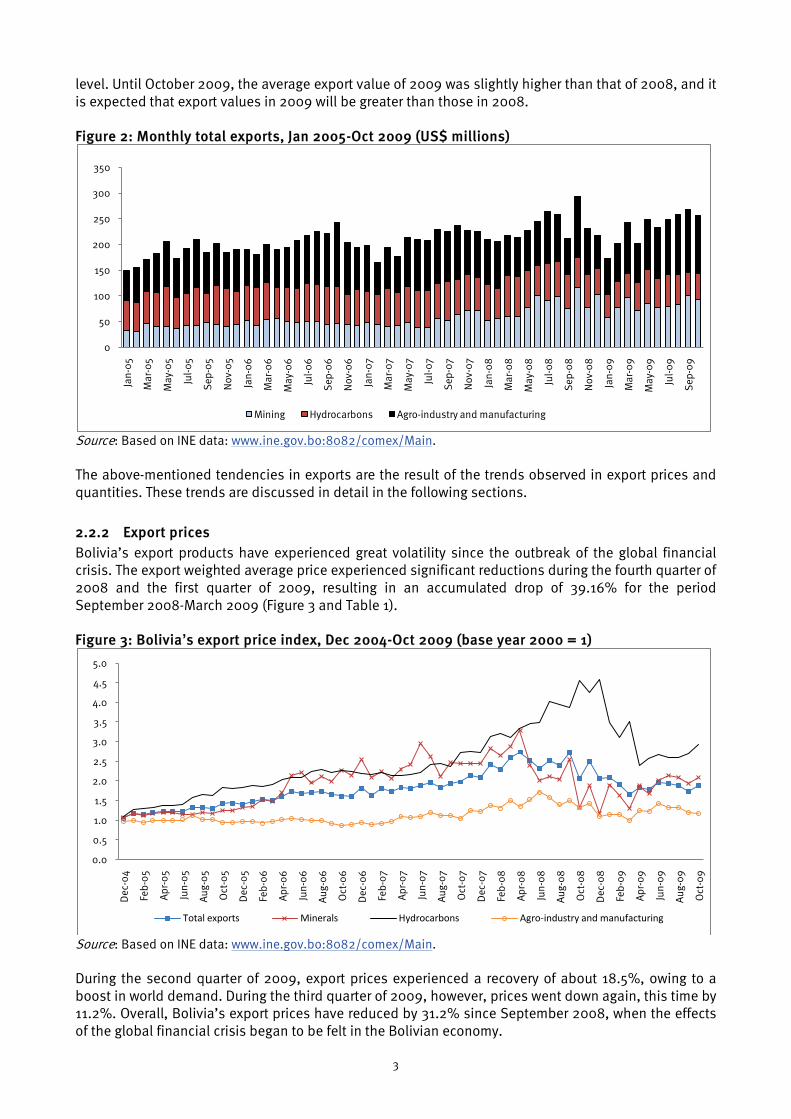
2.2.1 Export values In the second half of 2008, the global financial crisis brought about lower export prices and quantities, which in turn resulted in reduced export values. In 2008, exports exhibited a continuous upward trend, attaining in July 2008 their historically highest level of $263 million (Figure 2). During the second half of that year, export values went down, and in January 2009 they reached a $172 million value. During 2009, however, export values tended to recover, and in September 2009 they attained a $268 million
-600
-400
-200
0
200
400
600
800
200
5Q1
200
5Q2
200
5Q3
200
5Q4
200
6Q
1
200
6Q
2
200
6Q
3
200
6Q
4
200
7Q1
200
7Q2
200
7Q3
200
7Q4
200
8Q
1
200
8Q
2
200
8Q
3
200
8Q
4
200
9Q
1
200
9Q
2
200
9Q
3
FDI and portfolio investment Financial flows to governmentFinancial flows to private sector Net capital flows
3
level. Until October 2009, the average export value of 2009 was slightly higher than that of 2008, and it is expected that export values in 2009 will be greater than those in 2008.
Figure 2: Monthly total exports, Jan 2005-Oct 2009 (US$ millions)
Source: Based on INE data: www.ine.gov.bo:8082/comex/Main. The above-mentioned tendencies in exports are the result of the trends observed in export prices and quantities. These trends are discussed in detail in the following sections.
2.2.2 Export prices Bolivia’s export products have experienced great volatility since the outbreak of the global financial crisis. The export weighted average price experienced significant reductions during the fourth quarter of 2008 and the first quarter of 2009, resulting in an accumulated drop of 39.16% for the period September 2008-March 2009 (Figure 3 and Table 1). Figure 3: Bolivia’s export price index, Dec 2004-Oct 2009 (base year 2000 = 1)
Source: Based on INE data: www.ine.gov.bo:8082/comex/Main.
During the second quarter of 2009, export prices experienced a recovery of about 18.5%, owing to a boost in world demand. During the third quarter of 2009, however, prices went down again, this time by 11.2%. Overall, Bolivia’s export prices have reduced by 31.2% since September 2008, when the effects of the global financial crisis began to be felt in the Bolivian economy.
0
50
100
150
200
250
300
350
Jan-
05
Mar
-05
May
-05
Jul-0
5
Sep
-05
Nov
-05
Jan-
06
Mar
-06
May
-06
Jul-0
6
Sep
-06
Nov
-06
Jan-
07
Mar
-07
May
-07
Jul-0
7
Sep
-07
Nov
-07
Jan-
08
Mar
-08
May
-08
Jul-0
8
Sep
-08
Nov
-08
Jan-
09
Mar
-09
May
-09
Jul-0
9
Sep
-09
Mining Hydrocarbons Agro-industry and manufacturing
0.0
0.5
1.0
1.5
2.0
2.5
3.0
3.5
4.0
4.5
5.0
Dec
-04
Feb
-05
Apr
-05
Jun-
05
Aug
-05
Oct
-05
Dec
-05
Feb
-06
Apr
-06
Jun-
06
Aug
-06
Oct
-06
Dec
-06
Feb
-07
Apr
-07
Jun-
07
Aug
-07
Oct
-07
Dec
-07
Feb
-08
Apr
-08
Jun-
08
Aug
-08
Oct
-08
Dec
-08
Feb
-09
Apr
-09
Jun-
09
Aug
-09
Oct
-09
Total exports Minerals Hydrocarbons Agro-industry and manufacturing
4
Table 1: Bolivia’s export prices, 2008-2009 (% change) Total exports Minerals Hydrocarbons Agro-industry 2008Q3 17.37 26.57 10.59 -12.99 2008Q4 -23.87 -53.85 18.64 -26.97 2009Q1 -20.67 10.13 -23.30 -8.54 2009Q2 18.53 55.51 -24.23 41.67 2009Q3 -11.23 -3.88 0.95 -14.95 Sep 2008-Mar 2009 -39.60 -49.18 -9.01 -33.21 Sep 2008-Oct 2009 -31.23 -18.53 -24.47 -21.07
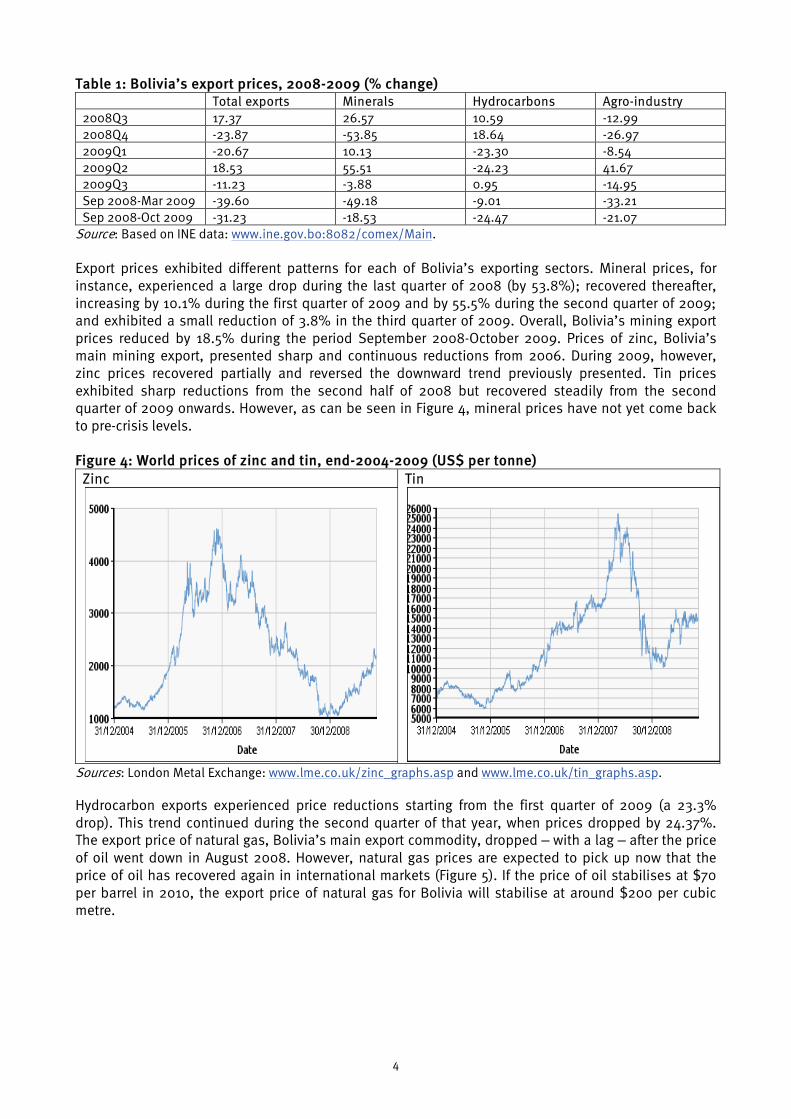
Source: Based on INE data: www.ine.gov.bo:8082/comex/Main. Export prices exhibited different patterns for each of Bolivia’s exporting sectors. Mineral prices, for instance, experienced a large drop during the last quarter of 2008 (by 53.8%); recovered thereafter, increasing by 10.1% during the first quarter of 2009 and by 55.5% during the second quarter of 2009; and exhibited a small reduction of 3.8% in the third quarter of 2009. Overall, Bolivia’s mining export prices reduced by 18.5% during the period September 2008-October 2009. Prices of zinc, Bolivia’s main mining export, presented sharp and continuous reductions from 2006. During 2009, however, zinc prices recovered partially and reversed the downward trend previously presented. Tin prices exhibited sharp reductions from the second half of 2008 but recovered steadily from the second quarter of 2009 onwards. However, as can be seen in Figure 4, mineral prices have not yet come back to pre-crisis levels. Figure 4: World prices of zinc and tin, end-2004-2009 (US$ per tonne)
Zinc
Tin
Sources: London Metal Exchange: www.lme.co.uk/zinc_graphs.asp and www.lme.co.uk/tin_graphs.asp.
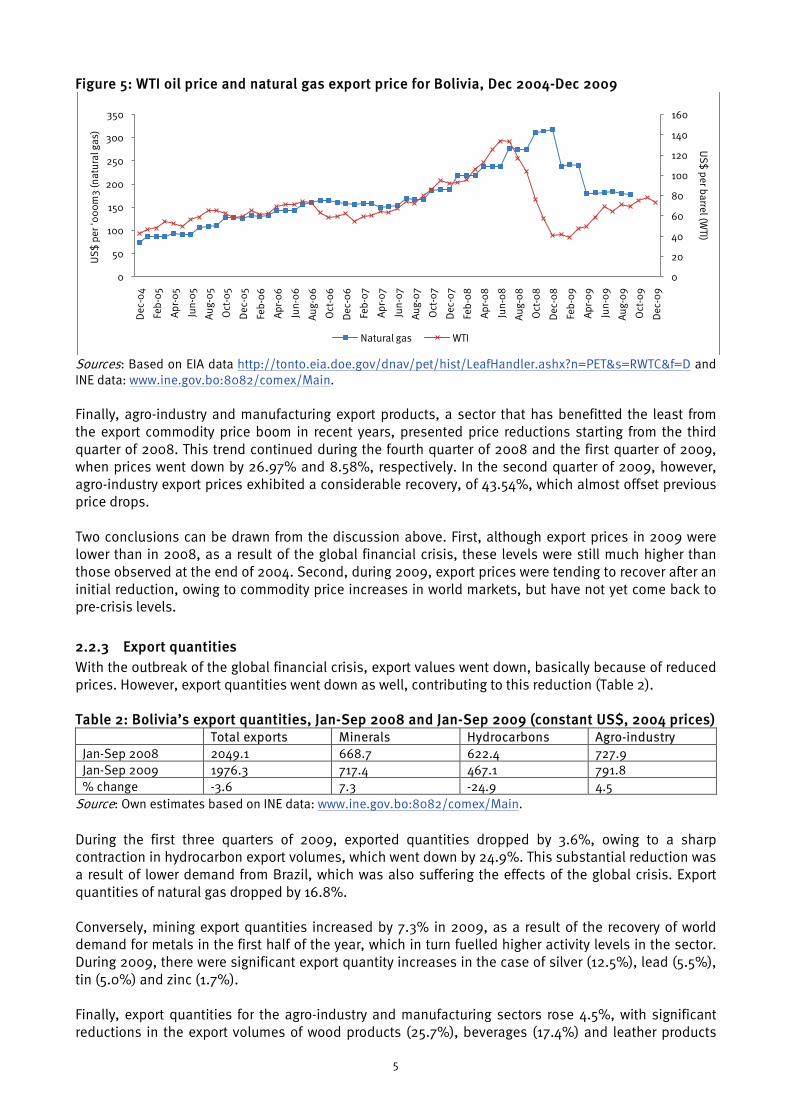
Hydrocarbon exports experienced price reductions starting from the first quarter of 2009 (a 23.3% drop). This trend continued during the second quarter of that year, when prices dropped by 24.37%. The export price of natural gas, Bolivia’s main export commodity, dropped – with a lag – after the price of oil went down in August 2008. However, natural gas prices are expected to pick up now that the price of oil has recovered again in international markets (Figure 5). If the price of oil stabilises at $70 per barrel in 2010, the export price of natural gas for Bolivia will stabilise at around $200 per cubic metre.
5
Figure 5: WTI oil price and natural gas export price for Bolivia, Dec 2004-Dec 2009
Sources: Based on EIA data http://tonto.eia.doe.gov/dnav/pet/hist/LeafHandler.ashx?n=PET&s=RWTC&f=D and INE data: www.ine.gov.bo:8082/comex/Main.
Finally, agro-industry and manufacturing export products, a sector that has benefitted the least from the export commodity price boom in recent years, presented price reductions starting from the third quarter of 2008. This trend continued during the fourth quarter of 2008 and the first quarter of 2009, when prices went down by 26.97% and 8.58%, respectively. In the second quarter of 2009, however, agro-industry export prices exhibited a considerable recovery, of 43.54%, which almost offset previous price drops. Two conclusions can be drawn from the discussion above. First, although export prices in 2009 were lower than in 2008, as a result of the global financial crisis, these levels were still much higher than those observed at the end of 2004. Second, during 2009, export prices were tending to recover after an initial reduction, owing to commodity price increases in world markets, but have not yet come back to pre-crisis levels.
2.2.3 Export quantities With the outbreak of the global financial crisis, export values went down, basically because of reduced prices. However, export quantities went down as well, contributing to this reduction (Table 2).
Table 2: Bolivia’s export quantities, Jan-Sep 2008 and Jan-Sep 2009 (constant US$, 2004 prices)
Total exports Minerals Hydrocarbons Agro-industry Jan-Sep 2008 2049.1 668.7 622.4 727.9 Jan-Sep 2009 1976.3 717.4 467.1 791.8 % change -3.6 7.3 -24.9 4.5
Source: Own estimates based on INE data: www.ine.gov.bo:8082/comex/Main.
During the first three quarters of 2009, exported quantities dropped by 3.6%, owing to a sharp contraction in hydrocarbon export volumes, which went down by 24.9%. This substantial reduction was a result of lower demand from Brazil, which was also suffering the effects of the global crisis. Export quantities of natural gas dropped by 16.8%. Conversely, mining export quantities increased by 7.3% in 2009, as a result of the recovery of world demand for metals in the first half of the year, which in turn fuelled higher activity levels in the sector. During 2009, there were significant export quantity increases in the case of silver (12.5%), lead (5.5%), tin (5.0%) and zinc (1.7%). Finally, export quantities for the agro-industry and manufacturing sectors rose 4.5%, with significant reductions in the export volumes of wood products (25.7%), beverages (17.4%) and leather products
0
20
40
60
80
100
120
140
160
0
50
100
150
200
250
300
350
Dec
-04
Feb
-05
Apr
-05
Jun-
05
Aug
-05
Oct
-05
Dec
-05
Feb
-06
Apr
-06
Jun-
06
Aug
-06
Oct
-06
Dec
-06
Feb
-07
Apr
-07
Jun-
07
Aug
-07
Oct
-07
Dec
-07
Feb
-08
Apr
-08
Jun-
08
Aug
-08
Oct
-08
Dec
-08
Feb
-09
Apr
-09
Jun-
09
Aug
-09
Oct
-09
Dec
-09
US
$ per b
arrel (WTI)
US
$ p
er '0
00
m3
(nat
ural
gas
)
Natural gas WTI
6
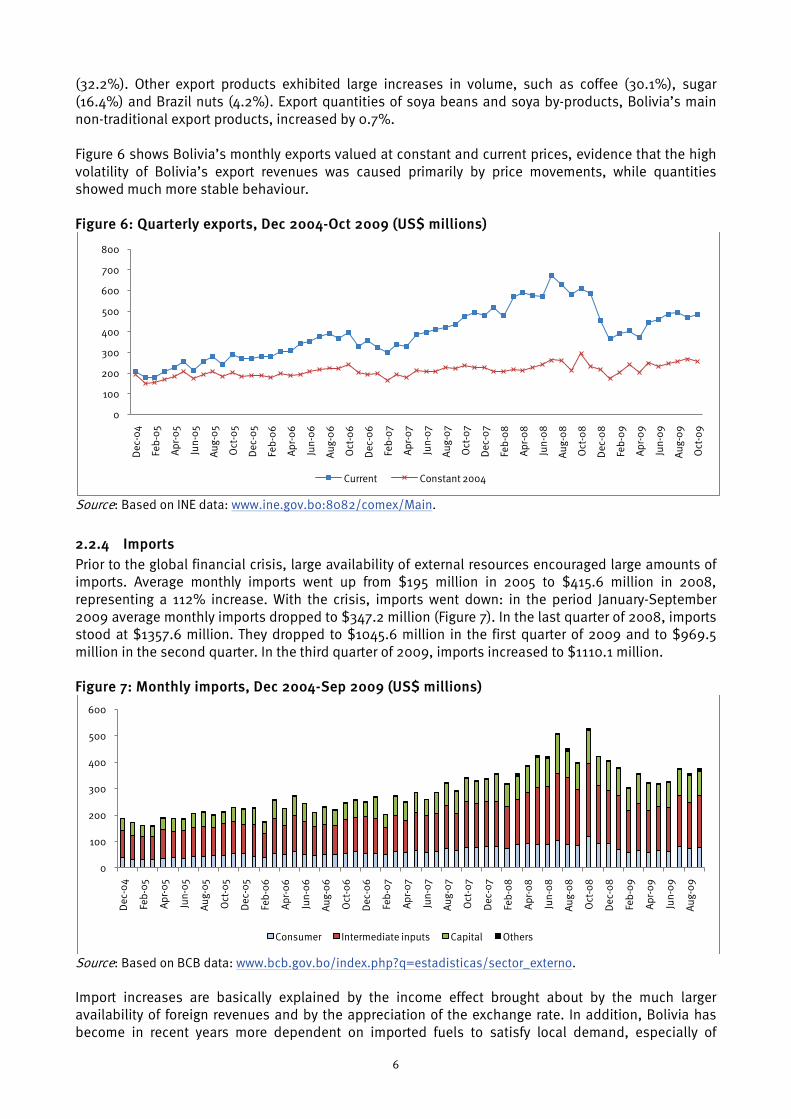
(32.2%). Other export products exhibited large increases in volume, such as coffee (30.1%), sugar (16.4%) and Brazil nuts (4.2%). Export quantities of soya beans and soya by-products, Bolivia’s main non-traditional export products, increased by 0.7%. Figure 6 shows Bolivia’s monthly exports valued at constant and current prices, evidence that the high volatility of Bolivia’s export revenues was caused primarily by price movements, while quantities showed much more stable behaviour. Figure 6: Quarterly exports, Dec 2004-Oct 2009 (US$ millions)
Source: Based on INE data: www.ine.gov.bo:8082/comex/Main.
2.2.4 Imports Prior to the global financial crisis, large availability of external resources encouraged large amounts of imports. Average monthly imports went up from $195 million in 2005 to $415.6 million in 2008, representing a 112% increase. With the crisis, imports went down: in the period January-September 2009 average monthly imports dropped to $347.2 million (Figure 7). In the last quarter of 2008, imports stood at $1357.6 million. They dropped to $1045.6 million in the first quarter of 2009 and to $969.5 million in the second quarter. In the third quarter of 2009, imports increased to $1110.1 million. Figure 7: Monthly imports, Dec 2004-Sep 2009 (US$ millions)
Source: Based on BCB data: www.bcb.gov.bo/index.php?q=estadisticas/sector_externo. Import increases are basically explained by the income effect brought about by the much larger availability of foreign revenues and by the appreciation of the exchange rate. In addition, Bolivia has become in recent years more dependent on imported fuels to satisfy local demand, especially of
0
100
200
300
400
500
600
700
800
Dec
-04
Feb
-05
Apr
-05
Jun-
05
Aug
-05
Oct
-05
Dec
-05
Feb
-06
Apr
-06
Jun-
06
Aug
-06
Oct
-06
Dec
-06
Feb
-07
Apr
-07
Jun-
07
Aug
-07
Oct
-07
Dec
-07
Feb
-08
Apr
-08
Jun-
08
Aug
-08
Oct
-08
Dec
-08
Feb
-09
Apr
-09
Jun-
09
Aug
-09
Oct
-09
Current Constant 2004
0
100
200
300
400
500
600
Dec
-04
Feb
-05
Apr
-05
Jun-
05
Aug
-05
Oct
-05
Dec
-05
Feb
-06
Apr
-06
Jun-
06
Aug
-06
Oct
-06
Dec
-06
Feb
-07
Apr
-07
Jun-
07
Aug
-07
Oct
-07
Dec
-07
Feb
-08
Apr
-08
Jun-
08
Aug
-08
Oct
-08
Dec
-08
Feb
-09
Apr
-09
Jun-
09
Aug
-09
Consumer Intermediate inputs Capital Others
7
imported diesel oil, because the country’s hydrocarbon composition is more intensive in natural gas, with relatively minor quantities of liquids, on which the economy is technologically more dependant. In addition, domestic demand has skyrocketed in recent years, not only because of higher domestic demand but also because subsidised domestic prices have promoted the smuggling of fuel products to neighbouring countries. Thus, the increase in oil prices occurring in recent years in world markets has resulted in much higher import costs to the country. Imports of fuels rose from $121.8 million in 2004 to $530.8 million in 2008, a 336% increase. During the same period, total imports went up by 170%. With the global financial crisis, total imports reduced by 16% in 2009, whereas imports of fuels went down by 24.1%, partly because of the lower price of oil in the international market.
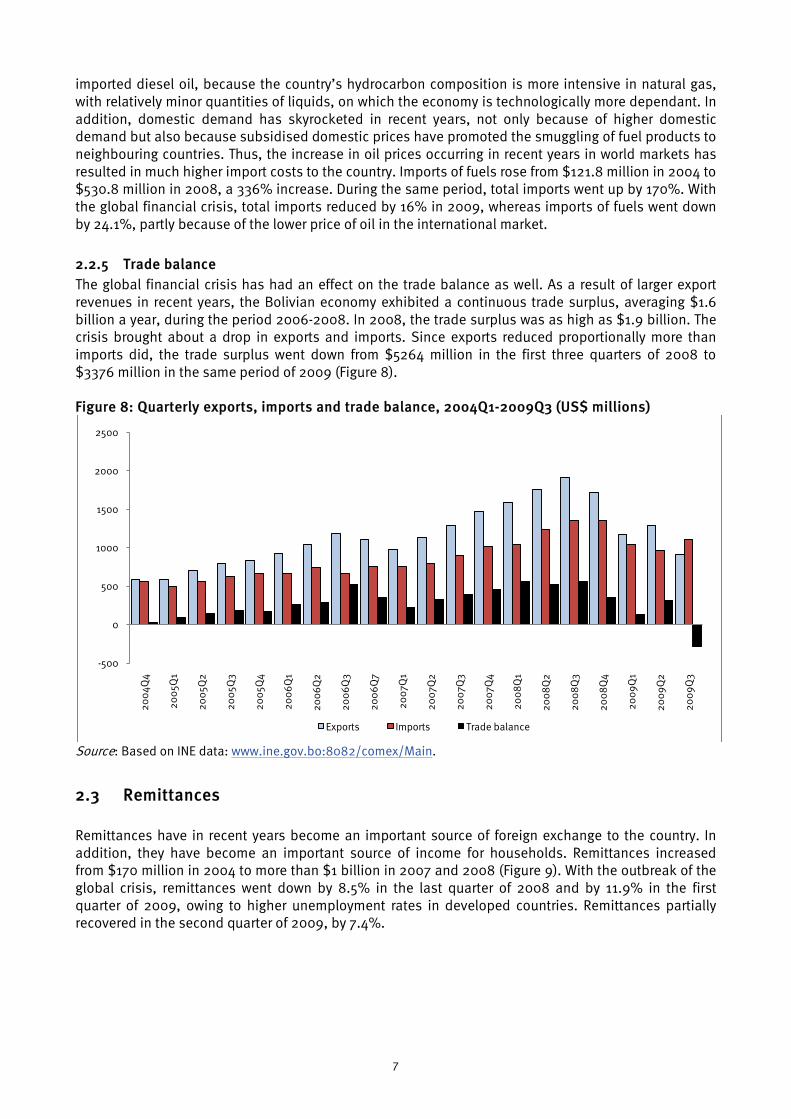
2.2.5 Trade balance The global financial crisis has had an effect on the trade balance as well. As a result of larger export revenues in recent years, the Bolivian economy exhibited a continuous trade surplus, averaging $1.6 billion a year, during the period 2006-2008. In 2008, the trade surplus was as high as $1.9 billion. The crisis brought about a drop in exports and imports. Since exports reduced proportionally more than imports did, the trade surplus went down from $5264 million in the first three quarters of 2008 to $3376 million in the same period of 2009 (Figure 8). Figure 8: Quarterly exports, imports and trade balance, 2004Q1-2009Q3 (US$ millions)
Source: Based on INE data: www.ine.gov.bo:8082/comex/Main.
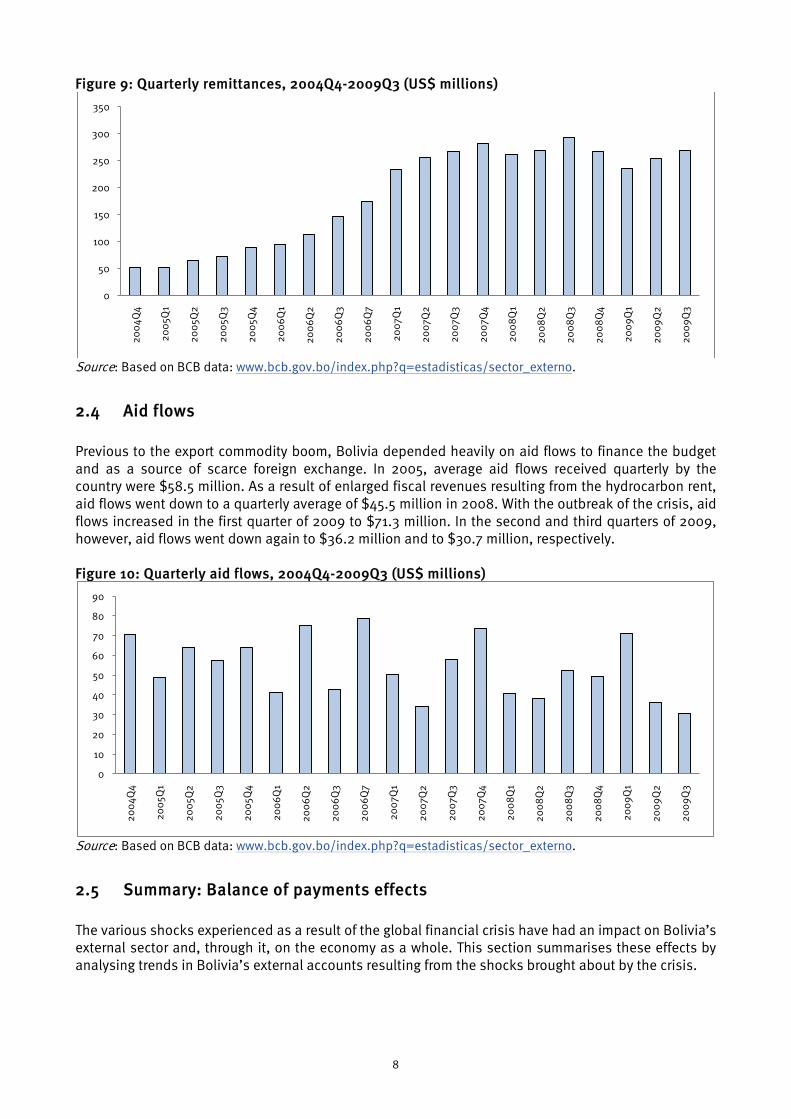
2.3 Remittances Remittances have in recent years become an important source of foreign exchange to the country. In addition, they have become an important source of income for households. Remittances increased from $170 million in 2004 to more than $1 billion in 2007 and 2008 (Figure 9). With the outbreak of the global crisis, remittances went down by 8.5% in the last quarter of 2008 and by 11.9% in the first quarter of 2009, owing to higher unemployment rates in developed countries. Remittances partially recovered in the second quarter of 2009, by 7.4%.
-500
0
500
1000
1500
2000
2500
200
4Q4
200
5Q1
200
5Q2
200
5Q3
200
5Q4
200
6Q
1
200
6Q
2
200
6Q
3
200
6Q
7
200
7Q1
200
7Q2
200
7Q3
200
7Q4
200
8Q
1
200
8Q
2
200
8Q
3
200
8Q
4
200
9Q
1
200
9Q
2
200
9Q
3
Exports Imports Trade balance
8
Figure 9: Quarterly remittances, 2004Q4-2009Q3 (US$ millions)
Source: Based on BCB data: www.bcb.gov.bo/index.php?q=estadisticas/sector_externo.
2.4 Aid flows Previous to the export commodity boom, Bolivia depended heavily on aid flows to finance the budget and as a source of scarce foreign exchange. In 2005, average aid flows received quarterly by the country were $58.5 million. As a result of enlarged fiscal revenues resulting from the hydrocarbon rent, aid flows went down to a quarterly average of $45.5 million in 2008. With the outbreak of the crisis, aid flows increased in the first quarter of 2009 to $71.3 million. In the second and third quarters of 2009, however, aid flows went down again to $36.2 million and to $30.7 million, respectively. Figure 10: Quarterly aid flows, 2004Q4-2009Q3 (US$ millions)
Source: Based on BCB data: www.bcb.gov.bo/index.php?q=estadisticas/sector_externo.
2.5 Summary: Balance of payments effects The various shocks experienced as a result of the global financial crisis have had an impact on Bolivia’s external sector and, through it, on the economy as a whole. This section summarises these effects by analysing trends in Bolivia’s external accounts resulting from the shocks brought about by the crisis.
0
50
100
150
200
250
300
350
200
4Q4
200
5Q1
200
5Q2
200
5Q3
200
5Q4
200
6Q
1
200
6Q
2
200
6Q
3
200
6Q
7
200
7Q1
200
7Q2
200
7Q3
200
7Q4
200
8Q
1
200
8Q
2
200
8Q
3
200
8Q
4
200
9Q
1
200
9Q
2
200
9Q
3
0
10
20
30
40
50
60
70
80
90
200
4Q4
200
5Q1
200
5Q2
200
5Q3
200
5Q4
200
6Q
1
200
6Q
2
200
6Q
3
200
6Q
7
200
7Q1
200
7Q2
200
7Q3
200
7Q4
200
8Q
1
200
8Q
2
200
8Q
3
200
8Q
4
200
9Q
1
200
9Q
2
200
9Q
3
9
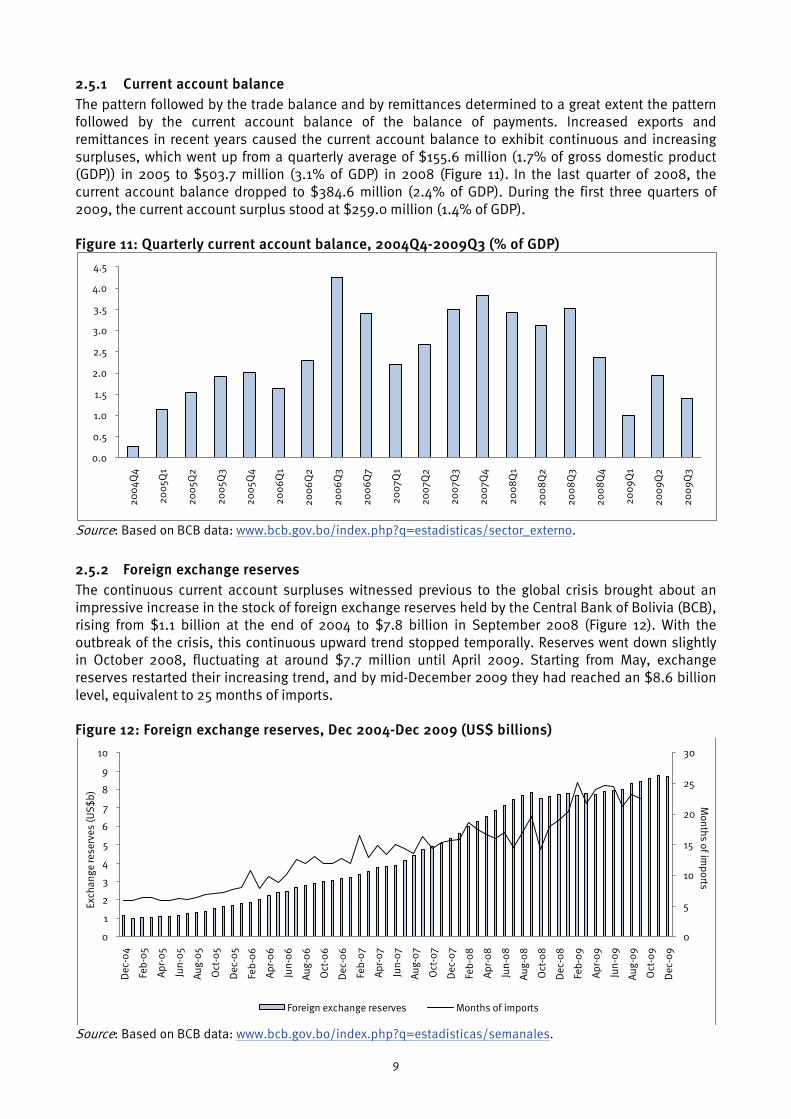
2.5.1 Current account balance The pattern followed by the trade balance and by remittances determined to a great extent the pattern followed by the current account balance of the balance of payments. Increased exports and remittances in recent years caused the current account balance to exhibit continuous and increasing surpluses, which went up from a quarterly average of $155.6 million (1.7% of gross domestic product (GDP)) in 2005 to $503.7 million (3.1% of GDP) in 2008 (Figure 11). In the last quarter of 2008, the current account balance dropped to $384.6 million (2.4% of GDP). During the first three quarters of 2009, the current account surplus stood at $259.0 million (1.4% of GDP). Figure 11: Quarterly current account balance, 2004Q4-2009Q3 (% of GDP)
Source: Based on BCB data: www.bcb.gov.bo/index.php?q=estadisticas/sector_externo.
2.5.2 Foreign exchange reserves The continuous current account surpluses witnessed previous to the global crisis brought about an impressive increase in the stock of foreign exchange reserves held by the Central Bank of Bolivia (BCB), rising from $1.1 billion at the end of 2004 to $7.8 billion in September 2008 (Figure 12). With the outbreak of the crisis, this continuous upward trend stopped temporally. Reserves went down slightly in October 2008, fluctuating at around $7.7 million until April 2009. Starting from May, exchange reserves restarted their increasing trend, and by mid-December 2009 they had reached an $8.6 billion level, equivalent to 25 months of imports. Figure 12: Foreign exchange reserves, Dec 2004-Dec 2009 (US$ billions)
Source: Based on BCB data: www.bcb.gov.bo/index.php?q=estadisticas/semanales.
0.0
0.5
1.0
1.5
2.0
2.5
3.0
3.5
4.0
4.5
200
4Q4
200
5Q1
200
5Q2
200
5Q3
200
5Q4
200
6Q
1
200
6Q
2
200
6Q
3
200
6Q
7
200
7Q1
200
7Q2
200
7Q3
200
7Q4
200
8Q
1
200
8Q
2
200
8Q
3
200
8Q
4
200
9Q
1
200
9Q
2
200
9Q
3
0
5
10
15
20
25
30
0
1
2
3
4
5
6
7
8
9
10
Dec
-04
Feb
-05
Apr
-05
Jun-
05
Aug
-05
Oct
-05
Dec
-05
Feb
-06
Apr
-06
Jun-
06
Aug
-06
Oct
-06
Dec
-06
Feb
-07
Apr
-07
Jun-
07
Aug
-07
Oct
-07
Dec
-07
Feb
-08
Apr
-08
Jun-
08
Aug
-08
Oct
-08
Dec
-08
Feb
-09
Apr
-09
Jun-
09
Aug
-09
Oct
-09
Dec
-09
Exch
ange
rese
rves
(US
$b
)M
onths of imports
Foreign exchange reserves Months of imports
10
3. Growth and development effects The much higher income levels attained in pre-crisis years as a result of favourable external conditions have permitted the Bolivian economy to deal with the negative effects of the crisis relatively successfully.
3.1 National-level growth, investment and employment
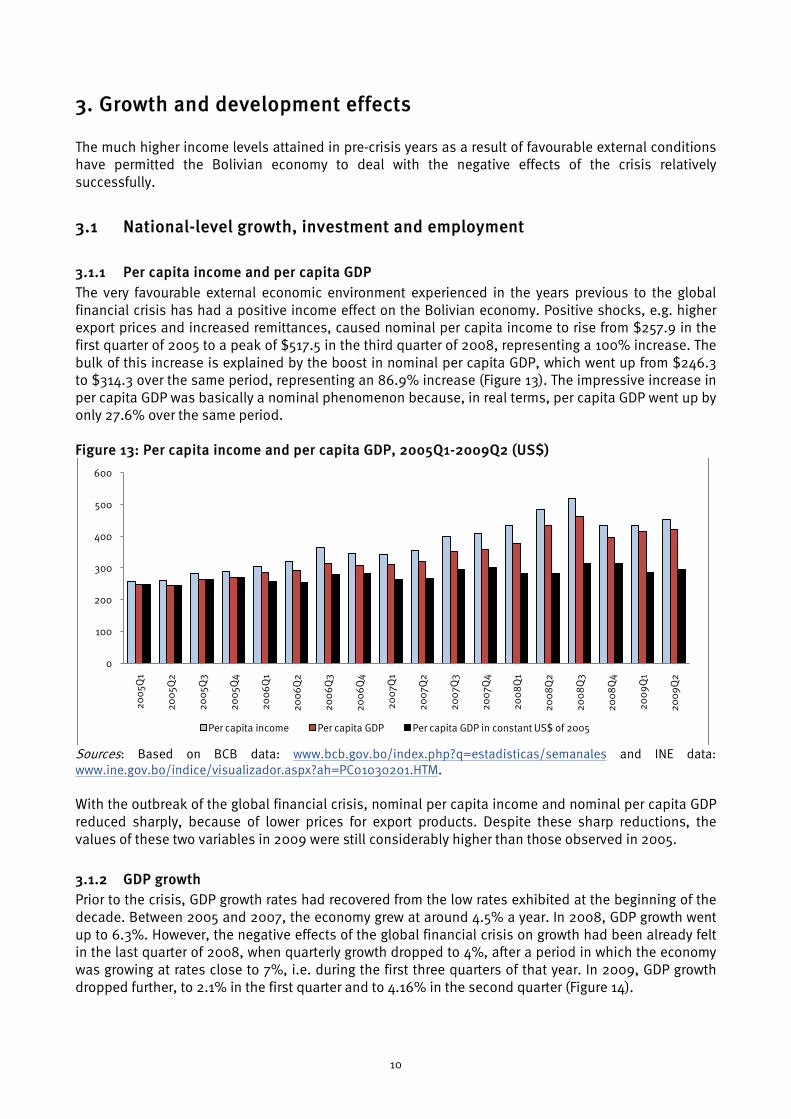
3.1.1 Per capita income and per capita GDP The very favourable external economic environment experienced in the years previous to the global financial crisis has had a positive income effect on the Bolivian economy. Positive shocks, e.g. higher export prices and increased remittances, caused nominal per capita income to rise from $257.9 in the first quarter of 2005 to a peak of $517.5 in the third quarter of 2008, representing a 100% increase. The bulk of this increase is explained by the boost in nominal per capita GDP, which went up from $246.3 to $314.3 over the same period, representing an 86.9% increase (Figure 13). The impressive increase in per capita GDP was basically a nominal phenomenon because, in real terms, per capita GDP went up by only 27.6% over the same period.
Figure 13: Per capita income and per capita GDP, 2005Q1-2009Q2 (US$)
Sources: Based on BCB data: www.bcb.gov.bo/index.php?q=estadisticas/semanales and INE data: www.ine.gov.bo/indice/visualizador.aspx?ah=PC01030201.HTM.
With the outbreak of the global financial crisis, nominal per capita income and nominal per capita GDP reduced sharply, because of lower prices for export products. Despite these sharp reductions, the values of these two variables in 2009 were still considerably higher than those observed in 2005.
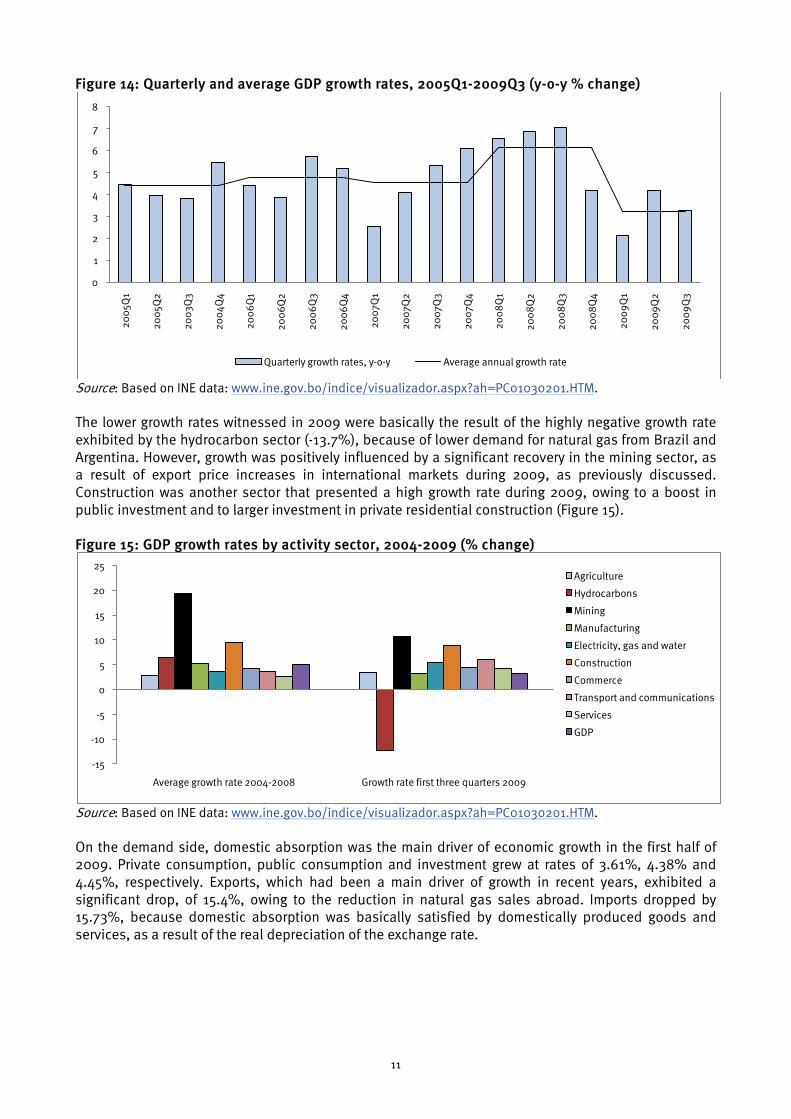
3.1.2 GDP growth Prior to the crisis, GDP growth rates had recovered from the low rates exhibited at the beginning of the decade. Between 2005 and 2007, the economy grew at around 4.5% a year. In 2008, GDP growth went up to 6.3%. However, the negative effects of the global financial crisis on growth had been already felt in the last quarter of 2008, when quarterly growth dropped to 4%, after a period in which the economy was growing at rates close to 7%, i.e. during the first three quarters of that year. In 2009, GDP growth dropped further, to 2.1% in the first quarter and to 4.16% in the second quarter (Figure 14).
0
100
200
300
400
500
600
200
5Q1
200
5Q2
200
5Q3
200
5Q4
200
6Q
1
200
6Q
2
200
6Q
3
200
6Q
4
200
7Q1
200
7Q2
200
7Q3
200
7Q4
200
8Q
1
200
8Q
2
200
8Q
3
200
8Q
4
200
9Q
1
200
9Q
2
Per capita income Per capita GDP Per capita GDP in constant US$ of 2005
11
Figure 14: Quarterly and average GDP growth rates, 2005Q1-2009Q3 (y-o-y % change)
Source: Based on INE data: www.ine.gov.bo/indice/visualizador.aspx?ah=PC01030201.HTM.
The lower growth rates witnessed in 2009 were basically the result of the highly negative growth rate exhibited by the hydrocarbon sector (-13.7%), because of lower demand for natural gas from Brazil and Argentina. However, growth was positively influenced by a significant recovery in the mining sector, as a result of export price increases in international markets during 2009, as previously discussed. Construction was another sector that presented a high growth rate during 2009, owing to a boost in public investment and to larger investment in private residential construction (Figure 15). Figure 15: GDP growth rates by activity sector, 2004-2009 (% change)
Source: Based on INE data: www.ine.gov.bo/indice/visualizador.aspx?ah=PC01030201.HTM.
On the demand side, domestic absorption was the main driver of economic growth in the first half of 2009. Private consumption, public consumption and investment grew at rates of 3.61%, 4.38% and 4.45%, respectively. Exports, which had been a main driver of growth in recent years, exhibited a significant drop, of 15.4%, owing to the reduction in natural gas sales abroad. Imports dropped by 15.73%, because domestic absorption was basically satisfied by domestically produced goods and services, as a result of the real depreciation of the exchange rate.
0
1
2
3
4
5
6
7
8
200
5Q1
200
5Q2
200
3Q3
200
4Q4
200
6Q
1
200
6Q
2
200
6Q
3
200
6Q
4
200
7Q1
200
7Q2
200
7Q3
200
7Q4
200
8Q
1
200
8Q
2
200
8Q
3
200
8Q
4
200
9Q
1
200
9Q
2
200
9Q
3
Quarterly growth rates, y-o-y Average annual growth rate
-15
-10
-5
0
5
10
15
20
25
Average growth rate 2004-2008 Growth rate first three quarters 2009
Agriculture
Hydrocarbons
Mining
Manufacturing
Electricity, gas and water
Construction
Commerce
Transport and communications
Services
GDP
12
Figure 16: GDP growth rates by activity sector, 2004-2009 (% change)
Source: Based on INE data: www.ine.gov.bo/indice/visualizador.aspx?ah=PC01030301.HTM.
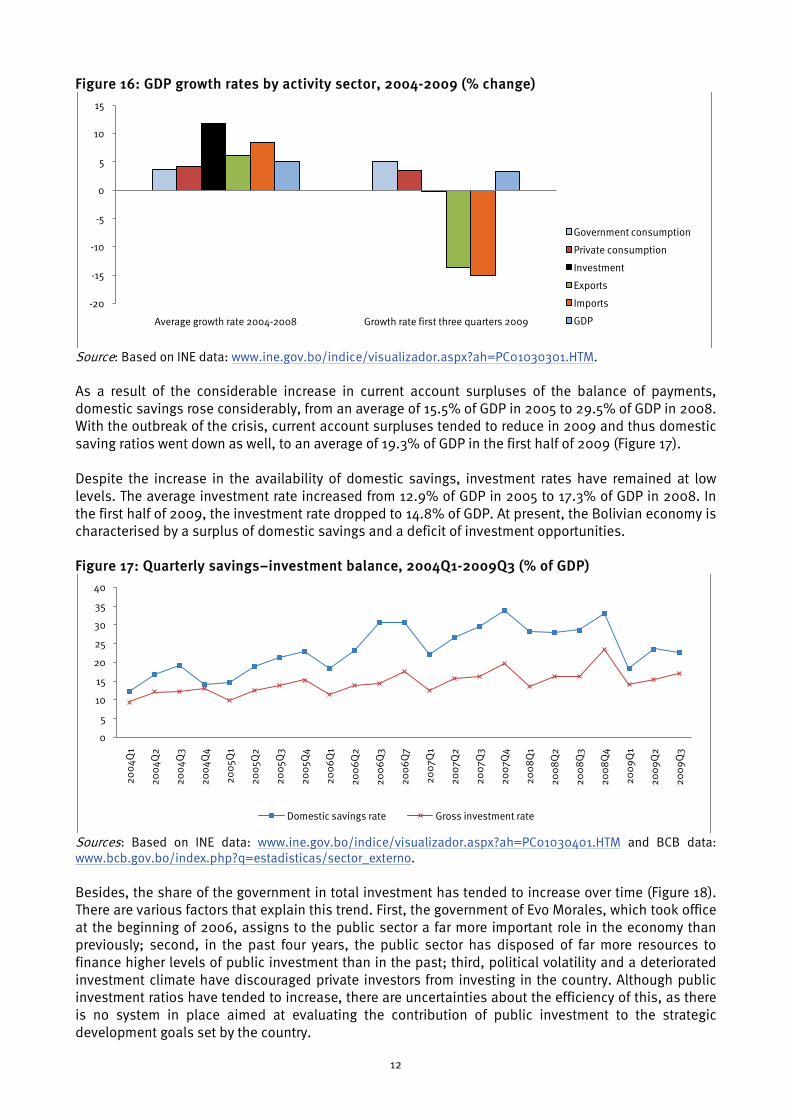
As a result of the considerable increase in current account surpluses of the balance of payments, domestic savings rose considerably, from an average of 15.5% of GDP in 2005 to 29.5% of GDP in 2008. With the outbreak of the crisis, current account surpluses tended to reduce in 2009 and thus domestic saving ratios went down as well, to an average of 19.3% of GDP in the first half of 2009 (Figure 17). Despite the increase in the availability of domestic savings, investment rates have remained at low levels. The average investment rate increased from 12.9% of GDP in 2005 to 17.3% of GDP in 2008. In the first half of 2009, the investment rate dropped to 14.8% of GDP. At present, the Bolivian economy is characterised by a surplus of domestic savings and a deficit of investment opportunities. Figure 17: Quarterly savings–investment balance, 2004Q1-2009Q3 (% of GDP)
Sources: Based on INE data: www.ine.gov.bo/indice/visualizador.aspx?ah=PC01030401.HTM and BCB data: www.bcb.gov.bo/index.php?q=estadisticas/sector_externo.
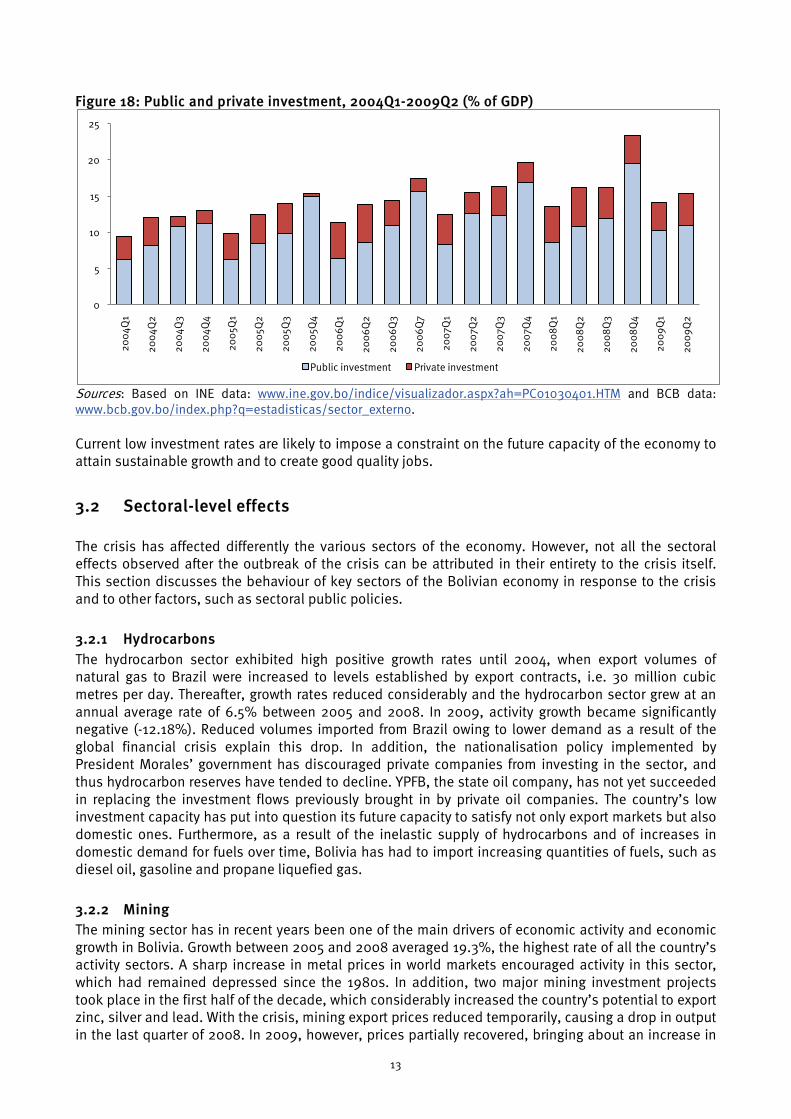
Besides, the share of the government in total investment has tended to increase over time (Figure 18). There are various factors that explain this trend. First, the government of Evo Morales, which took office at the beginning of 2006, assigns to the public sector a far more important role in the economy than previously; second, in the past four years, the public sector has disposed of far more resources to finance higher levels of public investment than in the past; third, political volatility and a deteriorated investment climate have discouraged private investors from investing in the country. Although public investment ratios have tended to increase, there are uncertainties about the efficiency of this, as there is no system in place aimed at evaluating the contribution of public investment to the strategic development goals set by the country.
-20
-15
-10
-5
0
5
10
15
Average growth rate 2004-2008 Growth rate first three quarters 2009
Government consumption
Private consumption
Investment
Exports
Imports
GDP
0
5
10
15
20
25
30
35
40
200
4Q1
200
4Q2
200
4Q3
200
4Q4
200
5Q1
200
5Q2
200
5Q3
200
5Q4
200
6Q
1
200
6Q
2
200
6Q
3
200
6Q
7
200
7Q1
200
7Q2
200
7Q3
200
7Q4
200
8Q
1
200
8Q
2
200
8Q
3
200
8Q
4
200
9Q
1
200
9Q
2
200
9Q
3
Domestic savings rate Gross investment rate
13
Figure 18: Public and private investment, 2004Q1-2009Q2 (% of GDP)
Sources: Based on INE data: www.ine.gov.bo/indice/visualizador.aspx?ah=PC01030401.HTM and BCB data: www.bcb.gov.bo/index.php?q=estadisticas/sector_externo. Current low investment rates are likely to impose a constraint on the future capacity of the economy to attain sustainable growth and to create good quality jobs.
3.2 Sectoral-level effects The crisis has affected differently the various sectors of the economy. However, not all the sectoral effects observed after the outbreak of the crisis can be attributed in their entirety to the crisis itself. This section discusses the behaviour of key sectors of the Bolivian economy in response to the crisis and to other factors, such as sectoral public policies.
3.2.1 Hydrocarbons The hydrocarbon sector exhibited high positive growth rates until 2004, when export volumes of natural gas to Brazil were increased to levels established by export contracts, i.e. 30 million cubic metres per day. Thereafter, growth rates reduced considerably and the hydrocarbon sector grew at an annual average rate of 6.5% between 2005 and 2008. In 2009, activity growth became significantly negative (-12.18%). Reduced volumes imported from Brazil owing to lower demand as a result of the global financial crisis explain this drop. In addition, the nationalisation policy implemented by President Morales’ government has discouraged private companies from investing in the sector, and thus hydrocarbon reserves have tended to decline. YPFB, the state oil company, has not yet succeeded in replacing the investment flows previously brought in by private oil companies. The country’s low investment capacity has put into question its future capacity to satisfy not only export markets but also domestic ones. Furthermore, as a result of the inelastic supply of hydrocarbons and of increases in domestic demand for fuels over time, Bolivia has had to import increasing quantities of fuels, such as diesel oil, gasoline and propane liquefied gas.
3.2.2 Mining The mining sector has in recent years been one of the main drivers of economic activity and economic growth in Bolivia. Growth between 2005 and 2008 averaged 19.3%, the highest rate of all the country’s activity sectors. A sharp increase in metal prices in world markets encouraged activity in this sector, which had remained depressed since the 1980s. In addition, two major mining investment projects took place in the first half of the decade, which considerably increased the country’s potential to export zinc, silver and lead. With the crisis, mining export prices reduced temporarily, causing a drop in output in the last quarter of 2008. In 2009, however, prices partially recovered, bringing about an increase in
0
5
10
15
20
2520
04Q
1
200
4Q2
200
4Q3
200
4Q4
200
5Q1
200
5Q2
200
5Q3
200
5Q4
200
6Q
1
200
6Q
2
200
6Q
3
200
6Q
7
200
7Q1
200
7Q2
200
7Q3
200
7Q4
200
8Q
1
200
8Q
2
200
8Q
3
200
8Q
4
200
9Q
1
200
9Q
2
Public investment Private investment
14
activity. As in hydrocarbons, mining activity is likely to be affected in future by uncertainty about public sector policies with regard to the role that private companies will play in the sector.
3.2.3 Agro-industry Agriculture and manufacturing have shown much more modest behaviour in recent years when compared with hydrocarbons and mining. Agriculture grew at an annual average rate of 2.82% between 2005 and 2008, whereas manufacturing grew at an annual average rate of 5.19% over the same period. In 2009, these two sectors exhibited growth rates of 3.35% and 3.14%, respectively. Agro-industrial and manufacturing exporting activities have been affected by the reduction in demand in export markets, as a result of the global crisis. In addition, Bolivia has lost its preferential access to US markets for manufacturing products under the Andean Trade Promotion and Drug Eradication Act (ATPDEA). This has caused export and job losses in the sector. Furthermore, the Bolivian government opposes free trade agreements with the US and the European Union (EU), whereby domestic producers could benefit from access to larger markets with greater purchasing power.
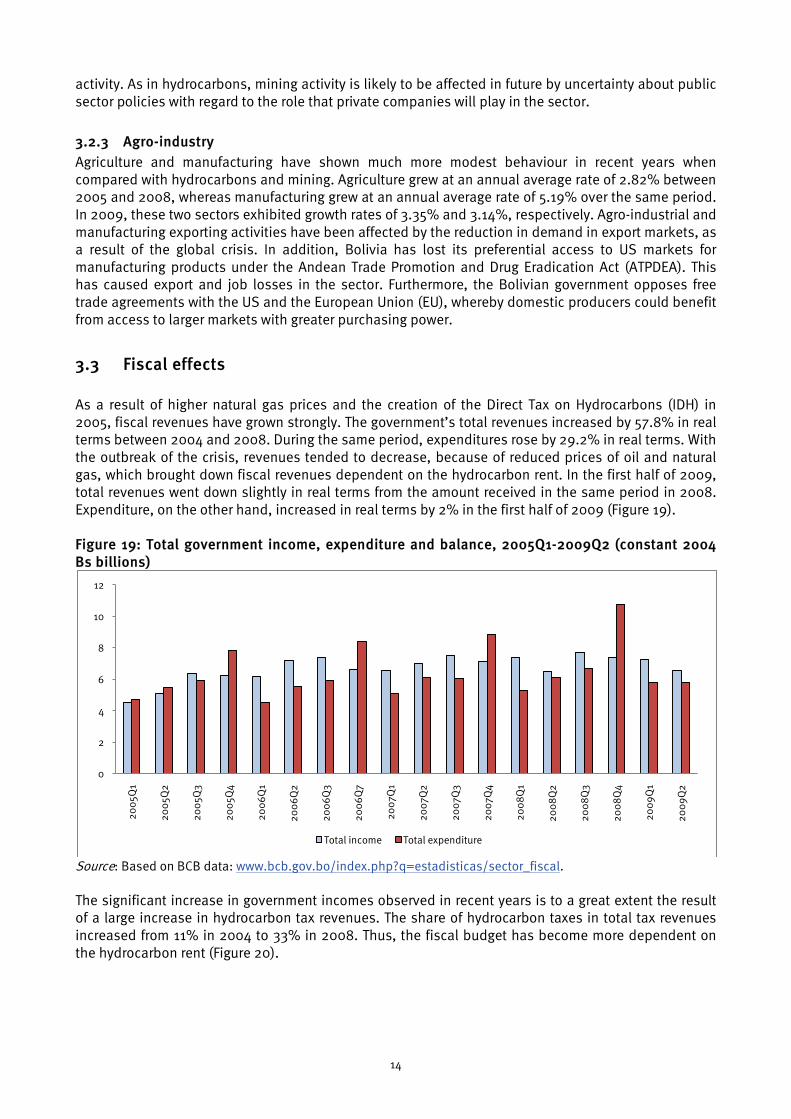
3.3 Fiscal effects As a result of higher natural gas prices and the creation of the Direct Tax on Hydrocarbons (IDH) in 2005, fiscal revenues have grown strongly. The government’s total revenues increased by 57.8% in real terms between 2004 and 2008. During the same period, expenditures rose by 29.2% in real terms. With the outbreak of the crisis, revenues tended to decrease, because of reduced prices of oil and natural gas, which brought down fiscal revenues dependent on the hydrocarbon rent. In the first half of 2009, total revenues went down slightly in real terms from the amount received in the same period in 2008. Expenditure, on the other hand, increased in real terms by 2% in the first half of 2009 (Figure 19). Figure 19: Total government income, expenditure and balance, 2005Q1-2009Q2 (constant 2004 Bs billions)
Source: Based on BCB data: www.bcb.gov.bo/index.php?q=estadisticas/sector_fiscal. The significant increase in government incomes observed in recent years is to a great extent the result of a large increase in hydrocarbon tax revenues. The share of hydrocarbon taxes in total tax revenues increased from 11% in 2004 to 33% in 2008. Thus, the fiscal budget has become more dependent on the hydrocarbon rent (Figure 20).
0
2
4
6
8
10
12
200
5Q1
200
5Q2
200
5Q3
200
5Q4
200
6Q
1
200
6Q
2
200
6Q
3
200
6Q
7
200
7Q1
200
7Q2
200
7Q3
200
7Q4
200
8Q
1
200
8Q
2
200
8Q
3
200
8Q
4
200
9Q
1
200
9Q
2
Total income Total expenditure
15
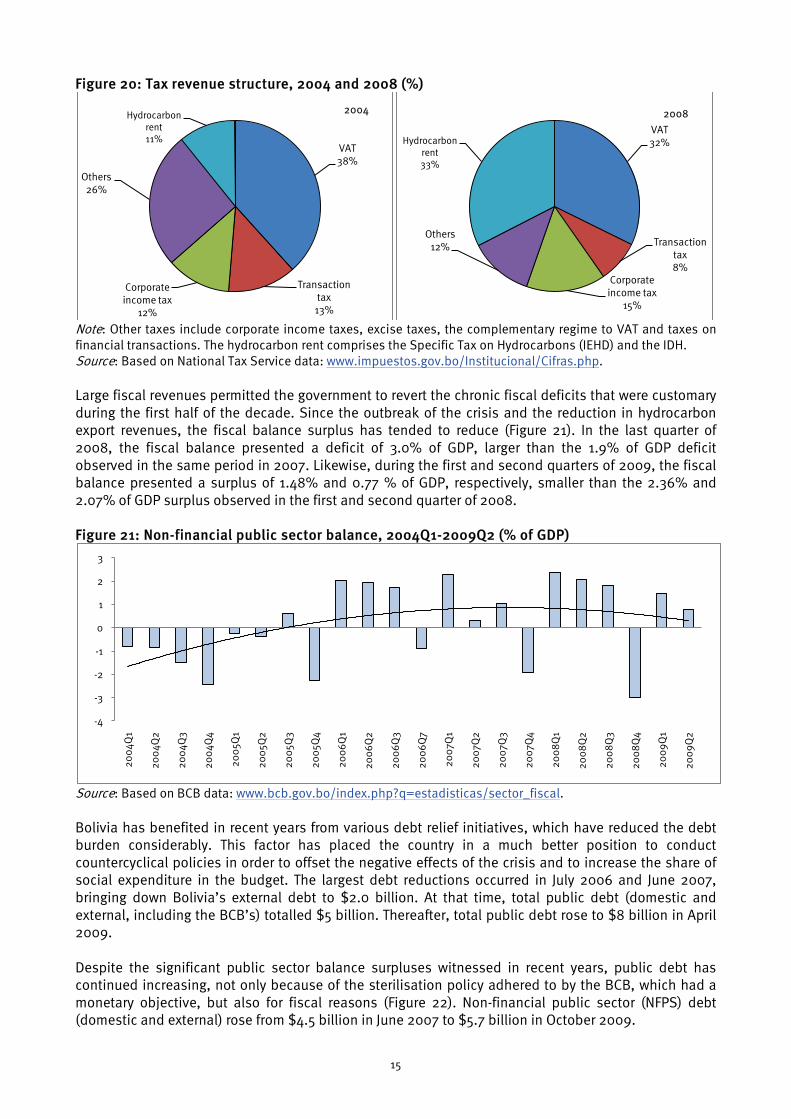
Figure 20: Tax revenue structure, 2004 and 2008 (%)
Note: Other taxes include corporate income taxes, excise taxes, the complementary regime to VAT and taxes on financial transactions. The hydrocarbon rent comprises the Specific Tax on Hydrocarbons (IEHD) and the IDH. Source: Based on National Tax Service data: www.impuestos.gov.bo/Institucional/Cifras.php.
Large fiscal revenues permitted the government to revert the chronic fiscal deficits that were customary during the first half of the decade. Since the outbreak of the crisis and the reduction in hydrocarbon export revenues, the fiscal balance surplus has tended to reduce (Figure 21). In the last quarter of 2008, the fiscal balance presented a deficit of 3.0% of GDP, larger than the 1.9% of GDP deficit observed in the same period in 2007. Likewise, during the first and second quarters of 2009, the fiscal balance presented a surplus of 1.48% and 0.77 % of GDP, respectively, smaller than the 2.36% and 2.07% of GDP surplus observed in the first and second quarter of 2008. Figure 21: Non-financial public sector balance, 2004Q1-2009Q2 (% of GDP)
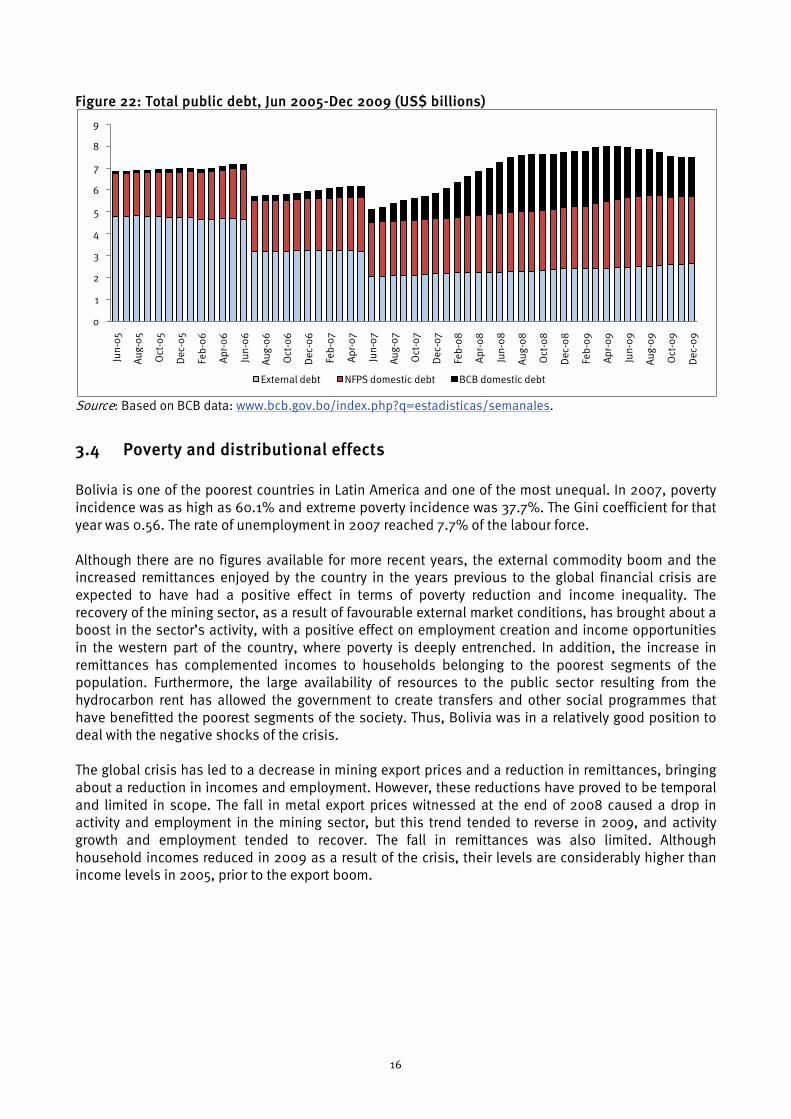
Source: Based on BCB data: www.bcb.gov.bo/index.php?q=estadisticas/sector_fiscal. Bolivia has benefited in recent years from various debt relief initiatives, which have reduced the debt burden considerably. This factor has placed the country in a much better position to conduct countercyclical policies in order to offset the negative effects of the crisis and to increase the share of social expenditure in the budget. The largest debt reductions occurred in July 2006 and June 2007, bringing down Bolivia’s external debt to $2.0 billion. At that time, total public debt (domestic and external, including the BCB’s) totalled $5 billion. Thereafter, total public debt rose to $8 billion in April 2009. Despite the significant public sector balance surpluses witnessed in recent years, public debt has continued increasing, not only because of the sterilisation policy adhered to by the BCB, which had a monetary objective, but also for fiscal reasons (Figure 22). Non-financial public sector (NFPS) debt (domestic and external) rose from $4.5 billion in June 2007 to $5.7 billion in October 2009.
VAT38%
Transaction tax
13%
Corporate income tax
12%
Others26%
Hydrocarbon rent11%
2004
VAT32%
Transaction tax8%
Corporate income tax
15%
Others12%
Hydrocarbon rent33%
2008
-4
-3
-2
-1
0
1
2
3
200
4Q1
200
4Q2
200
4Q3
200
4Q4
200
5Q1
200
5Q2
200
5Q3
200
5Q4
200
6Q
1
200
6Q
2
200
6Q
3
200
6Q
7
200
7Q1
200
7Q2
200
7Q3
200
7Q4
200
8Q
1
200
8Q
2
200
8Q
3
200
8Q
4
200
9Q
1
200
9Q
2
16
Figure 22: Total public debt, Jun 2005-Dec 2009 (US$ billions)
Source: Based on BCB data: www.bcb.gov.bo/index.php?q=estadisticas/semanales.
3.4 Poverty and distributional effects Bolivia is one of the poorest countries in Latin America and one of the most unequal. In 2007, poverty incidence was as high as 60.1% and extreme poverty incidence was 37.7%. The Gini coefficient for that year was 0.56. The rate of unemployment in 2007 reached 7.7% of the labour force. Although there are no figures available for more recent years, the external commodity boom and the increased remittances enjoyed by the country in the years previous to the global financial crisis are expected to have had a positive effect in terms of poverty reduction and income inequality. The recovery of the mining sector, as a result of favourable external market conditions, has brought about a boost in the sector’s activity, with a positive effect on employment creation and income opportunities in the western part of the country, where poverty is deeply entrenched. In addition, the increase in remittances has complemented incomes to households belonging to the poorest segments of the population. Furthermore, the large availability of resources to the public sector resulting from the hydrocarbon rent has allowed the government to create transfers and other social programmes that have benefitted the poorest segments of the society. Thus, Bolivia was in a relatively good position to deal with the negative shocks of the crisis. The global crisis has led to a decrease in mining export prices and a reduction in remittances, bringing about a reduction in incomes and employment. However, these reductions have proved to be temporal and limited in scope. The fall in metal export prices witnessed at the end of 2008 caused a drop in activity and employment in the mining sector, but this trend tended to reverse in 2009, and activity growth and employment tended to recover. The fall in remittances was also limited. Although household incomes reduced in 2009 as a result of the crisis, their levels are considerably higher than income levels in 2005, prior to the export boom.
0
1
2
3
4
5
6
7
8
9Ju
n-0
5
Aug
-05
Oct
-05
Dec
-05
Feb
-06
Apr
-06
Jun-
06
Aug
-06
Oct
-06
Dec
-06
Feb
-07
Apr
-07
Jun-
07
Aug
-07
Oct
-07
Dec
-07
Feb
-08
Apr
-08
Jun-
08
Aug
-08
Oct
-08
Dec
-08
Feb
-09
Apr
-09
Jun-
09
Aug
-09
Oct
-09
Dec
-09
External debt NFPS domestic debt BCB domestic debt
17
4. Policy responses: A critical review
4.1 Macroeconomic policies to manage the impact of the crisis
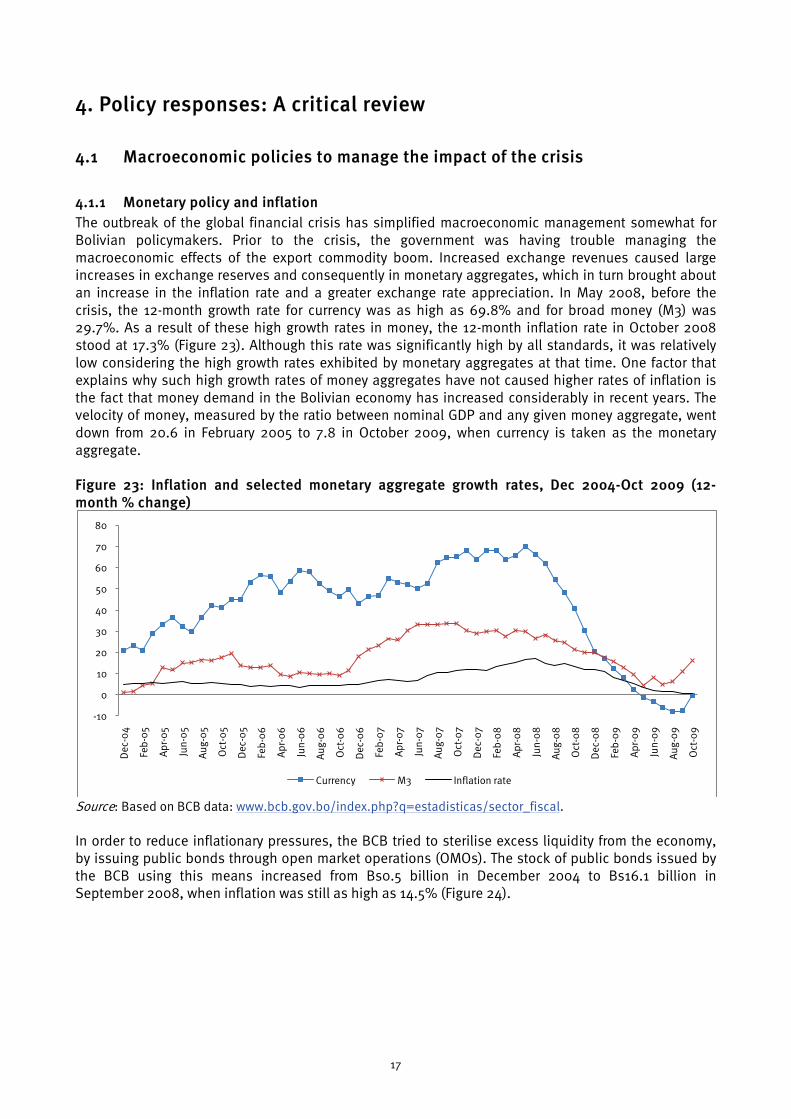
4.1.1 Monetary policy and inflation The outbreak of the global financial crisis has simplified macroeconomic management somewhat for Bolivian policymakers. Prior to the crisis, the government was having trouble managing the macroeconomic effects of the export commodity boom. Increased exchange revenues caused large increases in exchange reserves and consequently in monetary aggregates, which in turn brought about an increase in the inflation rate and a greater exchange rate appreciation. In May 2008, before the crisis, the 12-month growth rate for currency was as high as 69.8% and for broad money (M3) was 29.7%. As a result of these high growth rates in money, the 12-month inflation rate in October 2008 stood at 17.3% (Figure 23). Although this rate was significantly high by all standards, it was relatively low considering the high growth rates exhibited by monetary aggregates at that time. One factor that explains why such high growth rates of money aggregates have not caused higher rates of inflation is the fact that money demand in the Bolivian economy has increased considerably in recent years. The velocity of money, measured by the ratio between nominal GDP and any given money aggregate, went down from 20.6 in February 2005 to 7.8 in October 2009, when currency is taken as the monetary aggregate. Figure 23: Inflation and selected monetary aggregate growth rates, Dec 2004-Oct 2009 (12-month % change)
Source: Based on BCB data: www.bcb.gov.bo/index.php?q=estadisticas/sector_fiscal.
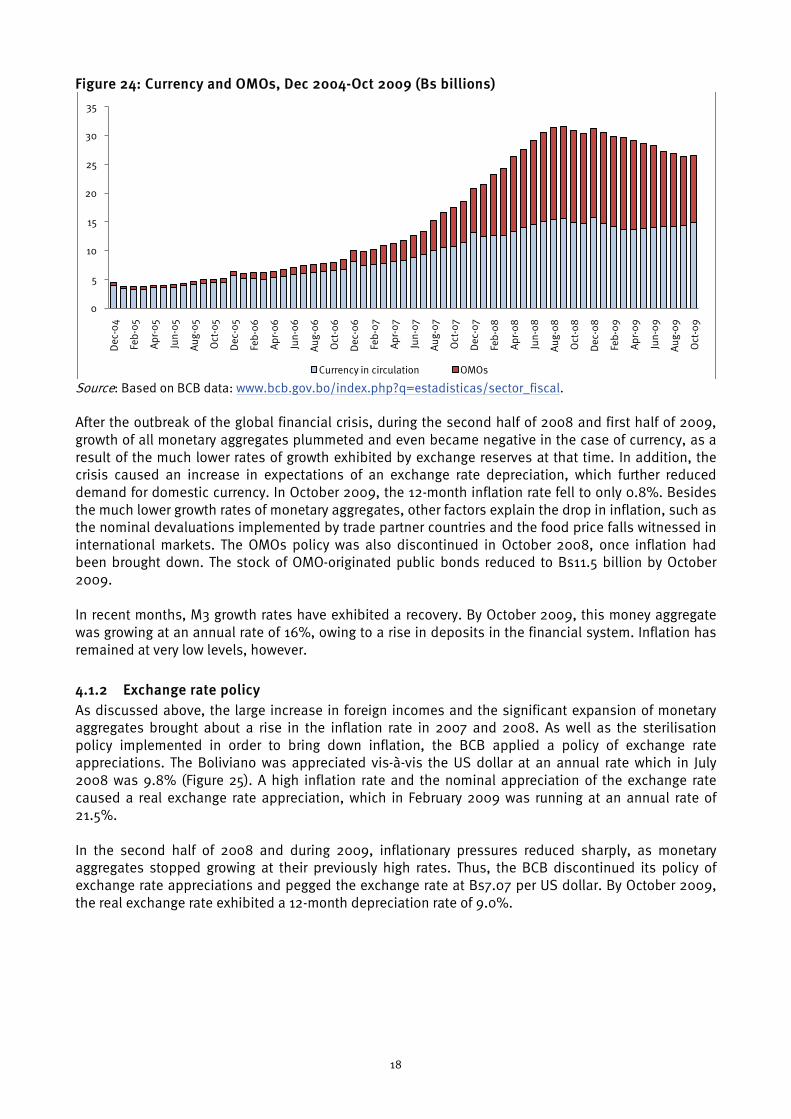
In order to reduce inflationary pressures, the BCB tried to sterilise excess liquidity from the economy, by issuing public bonds through open market operations (OMOs). The stock of public bonds issued by the BCB using this means increased from Bs0.5 billion in December 2004 to Bs16.1 billion in September 2008, when inflation was still as high as 14.5% (Figure 24).
-10
0
10
20
30
40
50
60
70
80
Dec
-04
Feb
-05
Apr
-05
Jun-
05
Aug
-05
Oct
-05
Dec
-05
Feb
-06
Apr
-06
Jun-
06
Aug
-06
Oct
-06
Dec
-06
Feb
-07
Apr
-07
Jun-
07
Aug
-07
Oct
-07
Dec
-07
Feb
-08
Apr
-08
Jun-
08
Aug
-08
Oct
-08
Dec
-08
Feb
-09
Apr
-09
Jun-
09
Aug
-09
Oct
-09
Currency M3 Inflation rate
18
Figure 24: Currency and OMOs, Dec 2004-Oct 2009 (Bs billions)
Source: Based on BCB data: www.bcb.gov.bo/index.php?q=estadisticas/sector_fiscal. After the outbreak of the global financial crisis, during the second half of 2008 and first half of 2009, growth of all monetary aggregates plummeted and even became negative in the case of currency, as a result of the much lower rates of growth exhibited by exchange reserves at that time. In addition, the crisis caused an increase in expectations of an exchange rate depreciation, which further reduced demand for domestic currency. In October 2009, the 12-month inflation rate fell to only 0.8%. Besides the much lower growth rates of monetary aggregates, other factors explain the drop in inflation, such as the nominal devaluations implemented by trade partner countries and the food price falls witnessed in international markets. The OMOs policy was also discontinued in October 2008, once inflation had been brought down. The stock of OMO-originated public bonds reduced to Bs11.5 billion by October 2009. In recent months, M3 growth rates have exhibited a recovery. By October 2009, this money aggregate was growing at an annual rate of 16%, owing to a rise in deposits in the financial system. Inflation has remained at very low levels, however.
4.1.2 Exchange rate policy As discussed above, the large increase in foreign incomes and the significant expansion of monetary aggregates brought about a rise in the inflation rate in 2007 and 2008. As well as the sterilisation policy implemented in order to bring down inflation, the BCB applied a policy of exchange rate appreciations. The Boliviano was appreciated vis-à-vis the US dollar at an annual rate which in July 2008 was 9.8% (Figure 25). A high inflation rate and the nominal appreciation of the exchange rate caused a real exchange rate appreciation, which in February 2009 was running at an annual rate of 21.5%. In the second half of 2008 and during 2009, inflationary pressures reduced sharply, as monetary aggregates stopped growing at their previously high rates. Thus, the BCB discontinued its policy of exchange rate appreciations and pegged the exchange rate at Bs7.07 per US dollar. By October 2009, the real exchange rate exhibited a 12-month depreciation rate of 9.0%.
0
5
10
15
20
25
30
35D
ec-0
4
Feb
-05
Apr
-05
Jun-
05
Aug
-05
Oct
-05
Dec
-05
Feb
-06
Apr
-06
Jun-
06
Aug
-06
Oct
-06
Dec
-06
Feb
-07
Apr
-07
Jun-
07
Aug
-07
Oct
-07
Dec
-07
Feb
-08
Apr
-08
Jun-
08
Aug
-08
Oct
-08
Dec
-08
Feb
-09
Apr
-09
Jun-
09
Aug
-09
Oct
-09
Currency in circulation OMOs
19
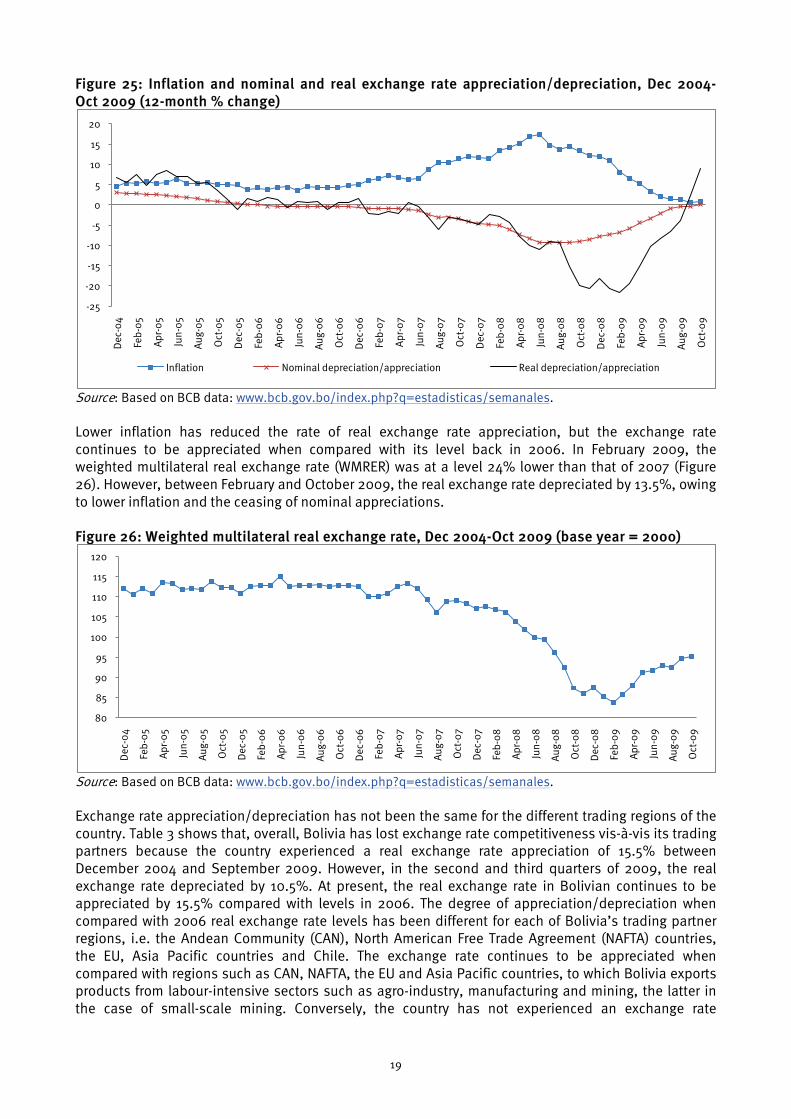
Figure 25: Inflation and nominal and real exchange rate appreciation/depreciation, Dec 2004-Oct 2009 (12-month % change)
Source: Based on BCB data: www.bcb.gov.bo/index.php?q=estadisticas/semanales.
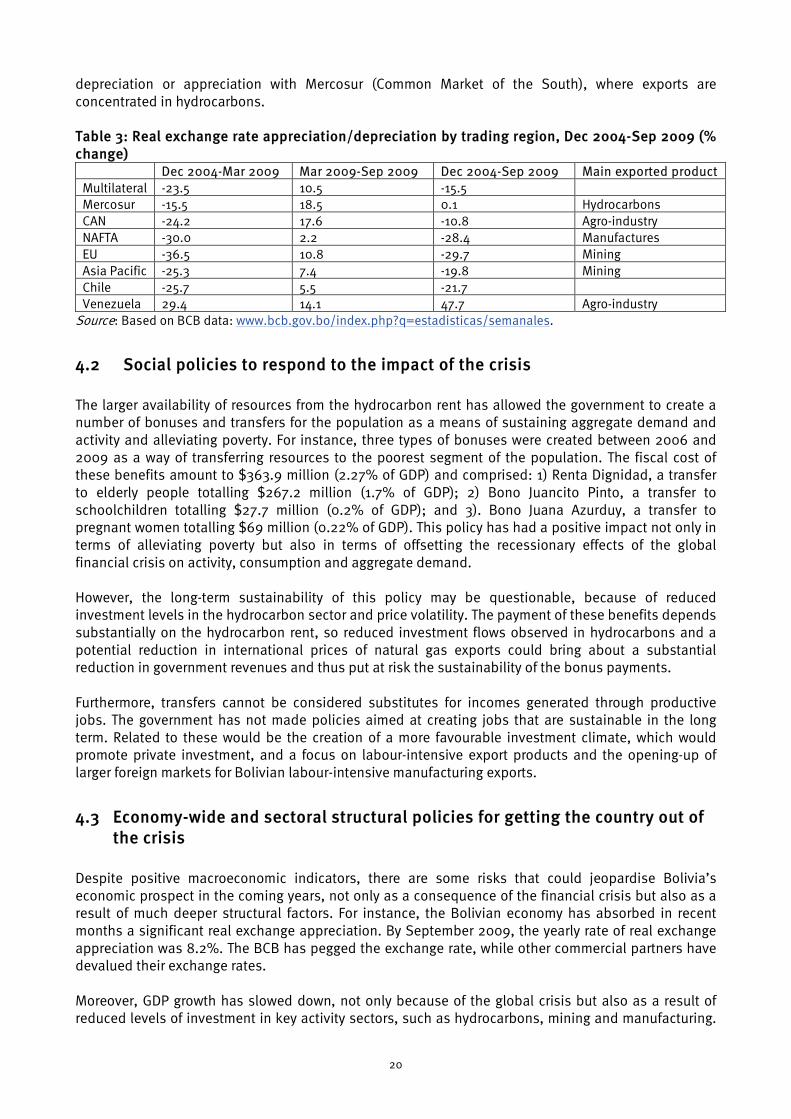
Lower inflation has reduced the rate of real exchange rate appreciation, but the exchange rate continues to be appreciated when compared with its level back in 2006. In February 2009, the weighted multilateral real exchange rate (WMRER) was at a level 24% lower than that of 2007 (Figure 26). However, between February and October 2009, the real exchange rate depreciated by 13.5%, owing to lower inflation and the ceasing of nominal appreciations.
Figure 26: Weighted multilateral real exchange rate, Dec 2004-Oct 2009 (base year = 2000)
Source: Based on BCB data: www.bcb.gov.bo/index.php?q=estadisticas/semanales.
Exchange rate appreciation/depreciation has not been the same for the different trading regions of the country. Table 3 shows that, overall, Bolivia has lost exchange rate competitiveness vis-à-vis its trading partners because the country experienced a real exchange rate appreciation of 15.5% between December 2004 and September 2009. However, in the second and third quarters of 2009, the real exchange rate depreciated by 10.5%. At present, the real exchange rate in Bolivian continues to be appreciated by 15.5% compared with levels in 2006. The degree of appreciation/depreciation when compared with 2006 real exchange rate levels has been different for each of Bolivia’s trading partner regions, i.e. the Andean Community (CAN), North American Free Trade Agreement (NAFTA) countries, the EU, Asia Pacific countries and Chile. The exchange rate continues to be appreciated when compared with regions such as CAN, NAFTA, the EU and Asia Pacific countries, to which Bolivia exports products from labour-intensive sectors such as agro-industry, manufacturing and mining, the latter in the case of small-scale mining. Conversely, the country has not experienced an exchange rate
-25
-20
-15
-10
-5
0
5
10
15
20D
ec-0
4
Feb
-05
Apr
-05
Jun-
05
Aug
-05
Oct
-05
Dec
-05
Feb
-06
Apr
-06
Jun-
06
Aug
-06
Oct
-06
Dec
-06
Feb
-07
Apr
-07
Jun-
07
Aug
-07
Oct
-07
Dec
-07
Feb
-08
Apr
-08
Jun-
08
Aug
-08
Oct
-08
Dec
-08
Feb
-09
Apr
-09
Jun-
09
Aug
-09
Oct
-09
Inflation Nominal depreciation/appreciation Real depreciation/appreciation
80
85
90
95
100
105
110
115
120
Dec
-04
Feb
-05
Apr
-05
Jun-
05
Aug
-05
Oct
-05
Dec
-05
Feb
-06
Apr
-06
Jun-
06
Aug
-06
Oct
-06
Dec
-06
Feb
-07
Apr
-07
Jun-
07
Aug
-07
Oct
-07
Dec
-07
Feb
-08
Apr
-08
Jun-
08
Aug
-08
Oct
-08
Dec
-08
Feb
-09
Apr
-09
Jun-
09
Aug
-09
Oct
-09
20
depreciation or appreciation with Mercosur (Common Market of the South), where exports are concentrated in hydrocarbons. Table 3: Real exchange rate appreciation/depreciation by trading region, Dec 2004-Sep 2009 (% change)
Dec 2004-Mar 2009 Mar 2009-Sep 2009 Dec 2004-Sep 2009 Main exported product Multilateral -23.5 10.5 -15.5 Mercosur -15.5 18.5 0.1 Hydrocarbons CAN -24.2 17.6 -10.8 Agro-industry NAFTA -30.0 2.2 -28.4 Manufactures EU -36.5 10.8 -29.7 Mining Asia Pacific -25.3 7.4 -19.8 Mining Chile -25.7 5.5 -21.7 Venezuela 29.4 14.1 47.7 Agro-industry
Source: Based on BCB data: www.bcb.gov.bo/index.php?q=estadisticas/semanales.
4.2 Social policies to respond to the impact of the crisis The larger availability of resources from the hydrocarbon rent has allowed the government to create a number of bonuses and transfers for the population as a means of sustaining aggregate demand and activity and alleviating poverty. For instance, three types of bonuses were created between 2006 and 2009 as a way of transferring resources to the poorest segment of the population. The fiscal cost of these benefits amount to $363.9 million (2.27% of GDP) and comprised: 1) Renta Dignidad, a transfer to elderly people totalling $267.2 million (1.7% of GDP); 2) Bono Juancito Pinto, a transfer to schoolchildren totalling $27.7 million (0.2% of GDP); and 3). Bono Juana Azurduy, a transfer to pregnant women totalling $69 million (0.22% of GDP). This policy has had a positive impact not only in terms of alleviating poverty but also in terms of offsetting the recessionary effects of the global financial crisis on activity, consumption and aggregate demand. However, the long-term sustainability of this policy may be questionable, because of reduced investment levels in the hydrocarbon sector and price volatility. The payment of these benefits depends substantially on the hydrocarbon rent, so reduced investment flows observed in hydrocarbons and a potential reduction in international prices of natural gas exports could bring about a substantial reduction in government revenues and thus put at risk the sustainability of the bonus payments. Furthermore, transfers cannot be considered substitutes for incomes generated through productive jobs. The government has not made policies aimed at creating jobs that are sustainable in the long term. Related to these would be the creation of a more favourable investment climate, which would promote private investment, and a focus on labour-intensive export products and the opening-up of larger foreign markets for Bolivian labour-intensive manufacturing exports.
4.3 Economy-wide and sectoral structural policies for getting the country out of the crisis
Despite positive macroeconomic indicators, there are some risks that could jeopardise Bolivia’s economic prospect in the coming years, not only as a consequence of the financial crisis but also as a result of much deeper structural factors. For instance, the Bolivian economy has absorbed in recent months a significant real exchange appreciation. By September 2009, the yearly rate of real exchange appreciation was 8.2%. The BCB has pegged the exchange rate, while other commercial partners have devalued their exchange rates. Moreover, GDP growth has slowed down, not only because of the global crisis but also as a result of reduced levels of investment in key activity sectors, such as hydrocarbons, mining and manufacturing.
21
Radical changes in the regulatory framework have discouraged private investors from undertaking badly needed investments in the hydrocarbon sector, which in turn has not permitted hydrocarbon reserves and exports to expand. Lower production capacity in the hydrocarbon sector is likely to undermine the middle- and long-term sustainability of the macroeconomic equilibriums. In addition, the loss of preferential access to the US market for manufacturing products that Bolivia benefited from under ATPDEA has caused export and job losses. Low investment rates are likely to undermine growth and employment creation in the middle to long term. As discussed above, the Bolivian economy has in recent years exhibited a greater capacity to undertake countercyclical policies to reduce the negative effects of external shocks, to sustain aggregate demand and activity and to alleviate poverty. The long-term sustainability of this policy may be in question, however, because of reduced investment levels in hydrocarbons and price volatility. Bolivia has substantially changed its hydrocarbon policy in recent years. First, it has changed the former tax system based on net incomes to a system based on gross income. In addition, it has nationalised the hydrocarbon industry, transferring to the Bolivian state the ownership of hydrocarbon reserves. Oil companies are still in charge of production but operate contractually as service providers. These policies have substantially increased government revenues in the short term but have also brought about a sharp reduction of investment flows, output and export capacity. The government is trying very hard to give new breath to the state-owned oil enterprise YPFB. In 2009, YPFB obtained long-term credit from the BCB amounting to $1 billion, which resorted to its foreign exchange reserves in order to finance this. YPFB will use these funds for drilling activities, in order to expand reserves and export capacity. There are considerable risks involved in this initiative, however. Drilling activities are very expensive and entail considerable risks of non-success. Furthermore, YPFB lacks the necessary technical capacity to undertake large-scale drilling operations, in terms not only of qualified staff but also of technological endowment. Furthermore, the BCB’s institutional autonomy has been undermined by this: by law, it cannot carry out lending operations to the government, in order to avoid policies that in the past have created considerable macroeconomic disequilibrium.
22
5. Conclusions
5.1 The impact of the crisis: An update The global crisis has had a negative effect on the Bolivian economy. Its outbreak caused a drop in export commodity prices, such as those for mining and hydrocarbons, and a reduction in remittances. However, the country was in a relatively good position to deal with such negative effects, having experienced in recent years an important commodity price boom, which has significantly increased external revenues, public and private incomes and consumption levels. In pre-crisis years, this export commodity boom permitted the country to reverse chronic fiscal and external deficits and accumulate large amounts of foreign exchange reserves. With the outbreak of the crisis, export revenues fell, but they are still at historically high levels. So far, the crisis has had a mild effect on the Bolivian economy. The boom in previous years has furnished the public sector with enhanced capacity to undertake countercyclical policies to ameliorate the negative impacts of the crisis. For instance, three types of bonuses have been created as a means of transferring resources to the poorest segment of the population. This policy has had a positive impact not only in terms of alleviating poverty but also in terms of offsetting the recessionary effects of the crisis on activity, consumption and aggregate demand.
5.2 Looking ahead: How well is the country positioned to gain from a future recovery and grow sustainably?
Although the crisis has had a mild effect on the Bolivian economy so far, important structural factors could put at risk the long-term sustainability of policies and macroeconomic equilibriums. First, investment rates, especially private investment rates, continue at very low levels. Future growth prospects and employment creation could be undermined. Second, the long-term sustainability of fiscal equilibrium and fiscal policies has become very much dependent on the hydrocarbon rent. As a result of low investment rates in the sector, hydrocarbon reserves and production and thus fiscal revenues are bound to go down in the future, putting fiscal sustainability into jeopardy. Third, low investment rates are putting at risk the future growth capacity of the economy and its capacity to create jobs. A more favourable investment climate is crucial for the country to increase investment rates, not only in the hydrocarbon sector but in all sectors of the economy. Bolivia needs FDI as a means to obtain the capital and technology necessary not only to exploit its abundant natural resources but also to promote growth in all sectors of the economy. A favourable investment climate will require, among other factors, the rule of law, property rights, judicial security, clearer and more stable rules of the game, macroeconomic stability, etc. Furthermore, a much clearer strategy in relation to the country’s external integration is also necessary. Access to larger markets, with higher incomes and purchasing power, is necessary to promote sustainable growth and employment creation, and to reduce the vulnerability of the Bolivian economy to shocks. Trade agreements with the US, the EU and other regions of the world are necessary to promote investment, growth and employment creation.
23
References Fundación Milenio (2009) ¿Qué Dejó en Bolivia la Bonanza Internacional? Coloquios Económicos 16. La
Paz: Fundación Milenio.

Overseas Development Institute111 Westminster Bridge RoadLondon SE1 7JDUK
Tel: +44 (0)20 7922 0300Fax: +44 (0)20 7922 0399Email: [email protected]: www.odi.org.uk