Embed Size (px)
Citation preview

Bogdan Vasilescu, Alexander Serebrenik Eindhoven University of Technology
@b_vasilescu, @aserebrenik
Prem Devanbu, Vladimir Filkov University of California, Davis
@devanbu
CSCW 2014, Baltimore, Maryland, USA
User support over the years
Dave����������� ������������������ (Data����������� ������������������ analyst)
Dave’s����������� ������������������ problem
How����������� ������������������ can����������� ������������������ I����������� ������������������ adjust����������� ������������������ p-values����������� ������������������ for����������� ������������������ multiple����������� ������������������ comparisons����������� ������������������ in����������� ������������������ R?
@b_vasilescu

Ask a colleague
User support over the years
Dave
Kevin
@b_vasilescu

User support over the years
Ask a colleague
Dave
Kevin
@b_vasilescu

Books
User support over the years
Forums
R
New Topic Sub-Forums People Options 1 2 3 4 ... 2640
Login Register
RR is a language and environment for statistical computing and graphics. It is a GNU project
which is similar to the S language and environment which was developed at Bell Laboratories (formerly AT&T, now Lucent Technologies) by John Chambers and colleagues. R-Project home is here.
Topics (92392) Replies Last Post Views Sub Forum
match values in dependenceof ID and Date by Mat 0 1:36pm by Mat 2 R help
How would i sum thenumber of NA's in multiplevectors by mattbju2013
1 1:34pm by Carl Witthoft 13 R help
Extract a predictors formconstparty object (CHAIDoutput) in R by christiaanpauw-2
1 12:56pm by christiaan pauw-2 3 R help
extract column's fromdifferent dataframe bycatalin roibu
1 12:55pm by Jim Lemon 3 R help
Constraint on regressionparameters by Robert U 1 12:22pm by S Ellison-2 2 R help
map with inset by markw 4 11:47am by markw 17 R help
saveXML() prefix argumentby Earl Brown 1 11:36am by Milan Bouchet-Valat 2 R help
Plot time series datairregularly hourly-spaced byCharles Novaes de Sa...
4 10:56am by Charles Novaes de Sa... 12 R help
Problem with Random Forestpredict by Michael Conklin 3 9:29am by warner121 1056 R help
R help archive by thread2674 messages: Starting Sat 31 Dec 2011 - 12:34:58 GMT, Ending Tue 31 Jan 2012 - 12:19:21 GMTThis period: Most recent messagessort by: [ thread ] [ author ] [ date ] [ subject ] [ attachment ]Other periods:[ Next, Thread view ] [ List of Folders ]Nearby: [ About this archive ] [ Other mail archives ]
[R] Cross-validation error with tune and with rpart Israel Saeta Pérez (Sat 31 Dec 2011 - 12:34:58 GMT)Re: [R] Cross-validation error with tune and with rpart Prof Brian Ripley (Sat 31 Dec 2011 - 14:13:12 GMT)Re: [R] Is it possible to "right align" text in R graphics? Duncan Mackay (Sun 01 Jan 2012 - 03:34:26 GMT)
Re: [R] Is it possible to "right align" text in R graphics? Tal Galili (Sun 01 Jan 2012 - 11:11:44 GMT)Re: [R] Is it possible to "right align" text in R graphics? Jeff Newmiller (Sun 01 Jan 2012 - 19:35:01 GMT)Re: [R] Is it possible to "right align" text in R graphics? Richard M. Heiberger (Sun 01 Jan 2012 - 20:03:20 GMT)
Re: [R] Is it possible to "right align" text in R graphics? Majid Einian (Tue 03 Jan 2012 - 06:14:06 GMT)Re: [R] Is it possible to "right align" text in R graphics? Tal Galili (Tue 03 Jan 2012 - 17:39:25 GMT)Re: [R] Is it possible to "right align" text in R graphics? Majid Einian (Sun 15 Jan 2012 - 12:55:33 GMT)
Re: [R] Is it possible to "right align" text in R graphics? Tal Galili (Tue 03 Jan 2012 - 22:30:16 GMT)Re: [R] Is it possible to "right align" text in R graphics? Tal Galili (Tue 03 Jan 2012 - 22:32:54 GMT)Re: [R] Is it possible to "right align" text in R graphics? Hadley Wickham (Tue 03 Jan 2012 - 22:51:50 GMT)Re: [R] Is it possible to "right align" text in R graphics? David Winsemius (Wed 04 Jan 2012 - 07:49:43 GMT)
Re: [R] RGtk2: How to overlay a gtkDrawingArea with a button or any other widget? Michael Lawrence (Mon 16 Jan 2012 - 15:04:02 GMT)[R] question re. package playwith not able to run command getting error message that I'm attempting to use non function FarhatMaha (Thu 19 Jan 2012 - 22:28:49 GMT)
Re: [R] question re. package playwith not able to run command getting error message that I'm attempting to use non function R.Michael Weylandt (Fri 20 Jan 2012 - 08:05:56 GMT)Re: [R] question re. package playwith not able to run command getting error message that I'm attempting to use nonfunction Farhat Maha (Fri 20 Jan 2012 - 17:56:39 GMT)Re: [R] question re. package playwith not able to run command getting error message that I'm attempting to use non function R.Michael Weylandt (Sat 21 Jan 2012 - 06:10:14 GMT)
Re: [R] Bivariate Partial Dependence Plots in Random Forests Liaw, Andy (Tue 31 Jan 2012 - 13:25:33 GMT)[R] indexing by empty string (was RE: Error in predict.randomForest ... subscript out of bounds with NULL name in X) Liaw, Andy (Tue 31Jan 2012 - 13:44:13 GMT)
Mailing lists
Blogs
Tagged Questions
R is a free, open source programming language and software environment for statistical computing, bioinformatics andgraphics. It is advised to supplement your question with a minimal reproducible example. For statistical questions pleaseuse stats.stackexchange.com.
learn more… | improve tag wiki | top users | synonyms (1)
11answers
24k viewsr r-faq community wiki
4 revs, 3 users 62%Andrie
How to make a great R reproducible example?When discussing performance with colleagues, teaching, sending a bug report or searching for guidance onmailing lists and here on SO, a reproducible example is often asked and always helpful. What ...
6answers
24k viewsr ggplot2
jebyrnes1,615 3 7 11
asked Oct 1 '12 at 14:22
How can we make xkcd style graphs in R?Apparently, folk have figured out how to make xkcd style graphs in Mathematica and in LaTeX. Can we do it inR? Ggplot2-ers? A geom_xkcd and/or theme_xkcd? I guess in base graphics, par(xkcd=TRUE)? ...
17answers
15k viewsperformance r statistics nlp community wiki
7 revsBrian Campbell
What statistics should a programmer (or computer scientist) know? [closed]I'm a programmer with a decent background in math and computer science. I've studied computability, graphtheory, linear algebra, abstract algebra, algorithms, and a little probability and statistics ...
Stack Exchange Q&A sites

December 2003 Archives by threadMessages sorted by: [ subject ] [ author ] [ date ]More info on this list...
Starting: Mon Dec 1 00:27:40 CEST 2003Ending: Wed Dec 31 21:39:13 CEST 2003Messages: 1159
[R] fitting a theoretical distribution with truncated tails Piyush Sharma[R] fitting a theoretical distribution with truncated tails Spencer Graves
[R] Discovering methods Gabor Grothendieck[R] Discovering methods Duncan Murdoch[R] Discovering methods Thomas Lumley
[R] Discovering methods Duncan Murdoch[R] Discovering methods Thomas Lumley
[R] hdf library for windows Toby.Patterson at csiro.au[R] hdf library for windows Mulholland, Tom[R] strptime Usage Ko-Kang Kevin Wang
[R] strptime Usage Prof Brian Ripley[R] Discovering methods Prof Brian Ripley[R] significance in difference of proportions: What problema Torsten Hothorn[R] Indexing ANOVA table Pascal A. Niklaus[R] wilcoxon-pratt signed rank test in R - drug-effiacy Niels Steen Krogh
[R] wilcoxon-pratt signed rank test in R - drug-effiacy Peter Dalgaard[R] wilcoxon-pratt signed rank test in R - drug-effiacy Knut M. Wittkowski
[R] Changing distance scale in plclust() Mike White[R] Rd Files? Wolski
[R] Rd Files? kjetil at entelnet.bo[R] Rd Files? Wolski
[R] Rd Files? Prof Brian Ripley[R] Rd Files? Wolski[R] Rd Files? Prof Brian D Ripley[R] Rd Files? Wolski[R] Rd Files? Prof Brian Ripley[R] Rd Files? Wolski[R] Rd Files? Prof Brian Ripley[R] Rd Files? Wolski[R] Rd Files? Prof Brian Ripley[R] Rd Files? Peter Dalgaard[R] Rd Files? Duncan Murdoch[R] Rd Files? Wolski[R] Rd Files? A.J. Rossini[R] Rd Files? Philippe Grosjean[R] Rd Files? A.J. Rossini
[R] Sampling Savano[R] Sampling paradis at univ-montp2.fr[R] Sampling Christian Mora
[R] Cluster analysis for multinominal data? Ing. Michael RostAW: [R] Sampling RINNER Heinrich[R] cclust - cindex - binary data Bruno Giordano[R] with for objects Roger D. Peng
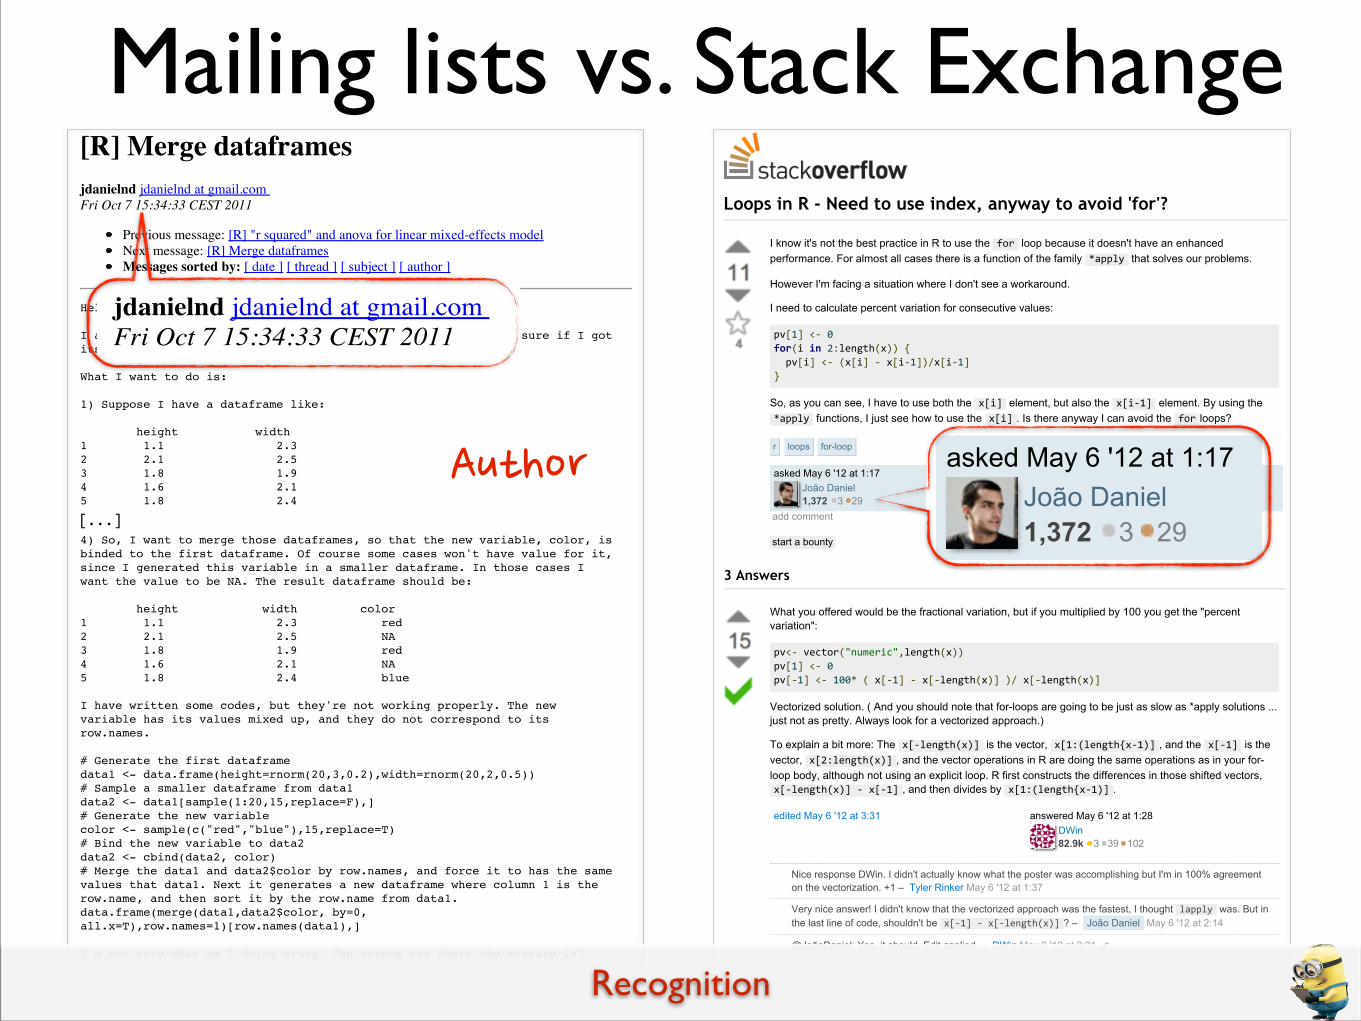
Mailing lists vs. Stack Exchange
Historically, coordinating dev’t and user support activities
[Guzzi
Changingcollaborate, learn and communicate among themselves and with their users
[Begel !Fastest Q&A site!Good technical solutions

Research goal
community����������� ������������������ change����������� ������������������ with����������� ������������������ the����������� ������������������ emergence����������� ������������������ ofHow����������� ������������������ did����������� ������������������ knowledge����������� ������������������ sharing����������� ������������������ in����������� ������������������ the
Q&A����������� ������������������ sites?
December 2003 Archives by threadMessages sorted by: [ subject ] [ author ] [ date ]More info on this list...
Starting: Mon Dec 1 00:27:40 CEST 2003Ending: Wed Dec 31 21:39:13 CEST 2003Messages: 1159
[R] fitting a theoretical distribution with truncated tails Piyush Sharma[R] fitting a theoretical distribution with truncated tails Spencer Graves
[R] Discovering methods Gabor Grothendieck[R] Discovering methods Duncan Murdoch[R] Discovering methods Thomas Lumley
[R] Discovering methods Duncan Murdoch[R] Discovering methods Thomas Lumley
[R] hdf library for windows Toby.Patterson at csiro.au[R] hdf library for windows Mulholland, Tom[R] strptime Usage Ko-Kang Kevin Wang
[R] strptime Usage Prof Brian Ripley[R] Discovering methods Prof Brian Ripley[R] significance in difference of proportions: What problema Torsten Hothorn[R] Indexing ANOVA table Pascal A. Niklaus[R] wilcoxon-pratt signed rank test in R - drug-effiacy Niels Steen Krogh
[R] wilcoxon-pratt signed rank test in R - drug-effiacy Peter Dalgaard[R] wilcoxon-pratt signed rank test in R - drug-effiacy Knut M. Wittkowski
[R] Changing distance scale in plclust() Mike White[R] Rd Files? Wolski
[R] Rd Files? kjetil at entelnet.bo[R] Rd Files? Wolski
[R] Rd Files? Prof Brian Ripley[R] Rd Files? Wolski[R] Rd Files? Prof Brian D Ripley[R] Rd Files? Wolski[R] Rd Files? Prof Brian Ripley[R] Rd Files? Wolski[R] Rd Files? Prof Brian Ripley[R] Rd Files? Wolski[R] Rd Files? Prof Brian Ripley[R] Rd Files? Peter Dalgaard[R] Rd Files? Duncan Murdoch[R] Rd Files? Wolski[R] Rd Files? A.J. Rossini[R] Rd Files? Philippe Grosjean[R] Rd Files? A.J. Rossini
[R] Sampling Savano[R] Sampling paradis at univ-montp2.fr[R] Sampling Christian Mora
[R] Cluster analysis for multinominal data? Ing. Michael RostAW: [R] Sampling RINNER Heinrich[R] cclust - cindex - binary data Bruno Giordano[R] with for objects Roger D. Peng
@b_vasilescu

[R] Merge dataframesjdanielnd jdanielnd at gmail.com Fri Oct 7 15:34:33 CEST 2011
Previous message: [R] "r squared" and anova for linear mixed-effects modelNext message: [R] Merge dataframesMessages sorted by: [ date ] [ thread ] [ subject ] [ author ]
Hello,
I am having some problems to use the 'merge' function. I'm not sure if I gotits working right.
What I want to do is:
1) Suppose I have a dataframe like:
height width1 1.1 2.32 2.1 2.53 1.8 1.94 1.6 2.15 1.8 2.4
2) And I generate a second dataframe sampled from this one, like:
height width1 1.1 2.33 1.8 1.95 1.8 2.4
3) Next, I add a new variable from this dataframe:
height width color1 1.1 2.3 red3 1.8 1.9 red5 1.8 2.4 blue
4) So, I want to merge those dataframes, so that the new variable, color, isbinded to the first dataframe. Of course some cases won't have value for it,since I generated this variable in a smaller dataframe. In those cases Iwant the value to be NA. The result dataframe should be:
height width color1 1.1 2.3 red2 2.1 2.5 NA3 1.8 1.9 red4 1.6 2.1 NA5 1.8 2.4 blue
I have written some codes, but they're not working properly. The newvariable has its values mixed up, and they do not correspond to itsrow.names.
# Generate the first dataframedata1 <- data.frame(height=rnorm(20,3,0.2),width=rnorm(20,2,0.5))# Sample a smaller dataframe from data1data2 <- data1[sample(1:20,15,replace=F),]# Generate the new variablecolor <- sample(c("red","blue"),15,replace=T)# Bind the new variable to data2data2 <- cbind(data2, color)# Merge the data1 and data2$color by row.names, and force it to has the samevalues that data1. Next it generates a new dataframe where column 1 is therow.name, and then sort it by the row.name from data1.data.frame(merge(data1,data2$color, by=0,all.x=T),row.names=1)[row.names(data1),]
I'm not sure what am I doing wrong. Can anyone see where the mistake is?
[...]
João Daniel1,372 3 29
3 Answers
DWin82.9k 3 39 102
I know it's not the best practice in R to use the for loop because it doesn't have an enhancedperformance. For almost all cases there is a function of the family *apply that solves our problems.
However I'm facing a situation where I don't see a workaround.
I need to calculate percent variation for consecutive values:
pv[1]-</-0for(i-in-2:length(x))-{--pv[i]-</-(x[i]-/-x[i/1])/x[i/1]}
So, as you can see, I have to use both the x[i] element, but also the x[i/1] element. By using the*apply functions, I just see how to use the x[i] . Is there anyway I can avoid the for loops?
r loops for-loop
asked May 6 '12 at 1:17
add comment
start a bounty
What you offered would be the fractional variation, but if you multiplied by 100 you get the "percentvariation":
pv</-vector("numeric",length(x))pv[1]-</-0pv[/1]-</-100*-(-x[/1]-/-x[/length(x)]-)/-x[/length(x)]
Vectorized solution. ( And you should note that for-loops are going to be just as slow as *apply solutions ...just not as pretty. Always look for a vectorized approach.)
To explain a bit more: The x[/length(x)] is the vector, x[1:(length{x/1)] , and the x[/1] is thevector, x[2:length(x)] , and the vector operations in R are doing the same operations as in your for-loop body, although not using an explicit loop. R first constructs the differences in those shifted vectors,x[/length(x)]-/-x[/1] , and then divides by x[1:(length{x/1)] .
edited May 6 '12 at 3:31 answered May 6 '12 at 1:28
Nice response DWin. I didn't actually know what the poster was accomplishing but I'm in 100% agreementon the vectorization. +1 – Tyler Rinker May 6 '12 at 1:37
Very nice answer! I didn't know that the vectorized approach was the fastest, I thought lapply was. But inthe last line of code, shouldn't be x[/1]-/-x[/length(x)] ? – João Daniel May 6 '12 at 2:14
@JoãoDaniel: Yes, it should. Edit applied. – DWin May 6 '12 at 3:31
add comment
You can get the same results with:
pv-</-c(0)y-</-sapply(2:length(x),-function(i)-{pv-<</-(x[i]-/-x[i/1])/x[i/1]})c(0,-y)
The for loop issues that once were a problem have been optimized. Often a for loop is not slower and mayeven be faster than the apply solution. You have to test them both and see. I'm betting your for loop isfaster than my solution.
Loops in R - Need to use index, anyway to avoid 'for'?
Mailing lists vs. Stack Exchange

João Daniel1,372 3 29
3 Answers
DWin82.9k 3 39 102
I know it's not the best practice in R to use the for loop because it doesn't have an enhancedperformance. For almost all cases there is a function of the family *apply that solves our problems.
However I'm facing a situation where I don't see a workaround.
I need to calculate percent variation for consecutive values:
pv[1]-</-0for(i-in-2:length(x))-{--pv[i]-</-(x[i]-/-x[i/1])/x[i/1]}
So, as you can see, I have to use both the x[i] element, but also the x[i/1] element. By using the*apply functions, I just see how to use the x[i] . Is there anyway I can avoid the for loops?
r loops for-loop
asked May 6 '12 at 1:17
add comment
start a bounty
What you offered would be the fractional variation, but if you multiplied by 100 you get the "percentvariation":
pv</-vector("numeric",length(x))pv[1]-</-0pv[/1]-</-100*-(-x[/1]-/-x[/length(x)]-)/-x[/length(x)]
Vectorized solution. ( And you should note that for-loops are going to be just as slow as *apply solutions ...just not as pretty. Always look for a vectorized approach.)
To explain a bit more: The x[/length(x)] is the vector, x[1:(length{x/1)] , and the x[/1] is thevector, x[2:length(x)] , and the vector operations in R are doing the same operations as in your for-loop body, although not using an explicit loop. R first constructs the differences in those shifted vectors,x[/length(x)]-/-x[/1] , and then divides by x[1:(length{x/1)] .
edited May 6 '12 at 3:31 answered May 6 '12 at 1:28
Nice response DWin. I didn't actually know what the poster was accomplishing but I'm in 100% agreementon the vectorization. +1 – Tyler Rinker May 6 '12 at 1:37
Very nice answer! I didn't know that the vectorized approach was the fastest, I thought lapply was. But inthe last line of code, shouldn't be x[/1]-/-x[/length(x)] ? – João Daniel May 6 '12 at 2:14
@JoãoDaniel: Yes, it should. Edit applied. – DWin May 6 '12 at 3:31
add comment
You can get the same results with:
pv-</-c(0)y-</-sapply(2:length(x),-function(i)-{pv-<</-(x[i]-/-x[i/1])/x[i/1]})c(0,-y)
The for loop issues that once were a problem have been optimized. Often a for loop is not slower and mayeven be faster than the apply solution. You have to test them both and see. I'm betting your for loop isfaster than my solution.
Loops in R - Need to use index, anyway to avoid 'for'?
[R] Merge dataframesjdanielnd jdanielnd at gmail.com Fri Oct 7 15:34:33 CEST 2011
Previous message: [R] "r squared" and anova for linear mixed-effects modelNext message: [R] Merge dataframesMessages sorted by: [ date ] [ thread ] [ subject ] [ author ]
Hello,
I am having some problems to use the 'merge' function. I'm not sure if I gotits working right.
What I want to do is:
1) Suppose I have a dataframe like:
height width1 1.1 2.32 2.1 2.53 1.8 1.94 1.6 2.15 1.8 2.4
2) And I generate a second dataframe sampled from this one, like:
height width1 1.1 2.33 1.8 1.95 1.8 2.4
3) Next, I add a new variable from this dataframe:
height width color1 1.1 2.3 red3 1.8 1.9 red5 1.8 2.4 blue
4) So, I want to merge those dataframes, so that the new variable, color, isbinded to the first dataframe. Of course some cases won't have value for it,since I generated this variable in a smaller dataframe. In those cases Iwant the value to be NA. The result dataframe should be:
height width color1 1.1 2.3 red2 2.1 2.5 NA3 1.8 1.9 red4 1.6 2.1 NA5 1.8 2.4 blue
I have written some codes, but they're not working properly. The newvariable has its values mixed up, and they do not correspond to itsrow.names.
# Generate the first dataframedata1 <- data.frame(height=rnorm(20,3,0.2),width=rnorm(20,2,0.5))# Sample a smaller dataframe from data1data2 <- data1[sample(1:20,15,replace=F),]# Generate the new variablecolor <- sample(c("red","blue"),15,replace=T)# Bind the new variable to data2data2 <- cbind(data2, color)# Merge the data1 and data2$color by row.names, and force it to has the samevalues that data1. Next it generates a new dataframe where column 1 is therow.name, and then sort it by the row.name from data1.data.frame(merge(data1,data2$color, by=0,all.x=T),row.names=1)[row.names(data1),]
I'm not sure what am I doing wrong. Can anyone see where the mistake is?
[...]
Code����������� ������������������ highlighting
Modern (fancy) user interface
Mailing lists vs. Stack Exchange
Tags

João Daniel1,372 3 29
3 Answers
DWin82.9k 3 39 102
I know it's not the best practice in R to use the for loop because it doesn't have an enhancedperformance. For almost all cases there is a function of the family *apply that solves our problems.
However I'm facing a situation where I don't see a workaround.
I need to calculate percent variation for consecutive values:
pv[1]-</-0for(i-in-2:length(x))-{--pv[i]-</-(x[i]-/-x[i/1])/x[i/1]}
So, as you can see, I have to use both the x[i] element, but also the x[i/1] element. By using the*apply functions, I just see how to use the x[i] . Is there anyway I can avoid the for loops?
r loops for-loop
asked May 6 '12 at 1:17
add comment
start a bounty
What you offered would be the fractional variation, but if you multiplied by 100 you get the "percentvariation":
pv</-vector("numeric",length(x))pv[1]-</-0pv[/1]-</-100*-(-x[/1]-/-x[/length(x)]-)/-x[/length(x)]
Vectorized solution. ( And you should note that for-loops are going to be just as slow as *apply solutions ...just not as pretty. Always look for a vectorized approach.)
To explain a bit more: The x[/length(x)] is the vector, x[1:(length{x/1)] , and the x[/1] is thevector, x[2:length(x)] , and the vector operations in R are doing the same operations as in your for-loop body, although not using an explicit loop. R first constructs the differences in those shifted vectors,x[/length(x)]-/-x[/1] , and then divides by x[1:(length{x/1)] .
edited May 6 '12 at 3:31 answered May 6 '12 at 1:28
Nice response DWin. I didn't actually know what the poster was accomplishing but I'm in 100% agreementon the vectorization. +1 – Tyler Rinker May 6 '12 at 1:37
Very nice answer! I didn't know that the vectorized approach was the fastest, I thought lapply was. But inthe last line of code, shouldn't be x[/1]-/-x[/length(x)] ? – João Daniel May 6 '12 at 2:14
@JoãoDaniel: Yes, it should. Edit applied. – DWin May 6 '12 at 3:31
add comment
You can get the same results with:
pv-</-c(0)y-</-sapply(2:length(x),-function(i)-{pv-<</-(x[i]-/-x[i/1])/x[i/1]})c(0,-y)
The for loop issues that once were a problem have been optimized. Often a for loop is not slower and mayeven be faster than the apply solution. You have to test them both and see. I'm betting your for loop isfaster than my solution.
Loops in R - Need to use index, anyway to avoid 'for'?
[R] Merge dataframesjdanielnd jdanielnd at gmail.com Fri Oct 7 15:34:33 CEST 2011
Previous message: [R] "r squared" and anova for linear mixed-effects modelNext message: [R] Merge dataframesMessages sorted by: [ date ] [ thread ] [ subject ] [ author ]
Hello,
I am having some problems to use the 'merge' function. I'm not sure if I gotits working right.
What I want to do is:
1) Suppose I have a dataframe like:
height width1 1.1 2.32 2.1 2.53 1.8 1.94 1.6 2.15 1.8 2.4
2) And I generate a second dataframe sampled from this one, like:
height width1 1.1 2.33 1.8 1.95 1.8 2.4
3) Next, I add a new variable from this dataframe:
height width color1 1.1 2.3 red3 1.8 1.9 red5 1.8 2.4 blue
4) So, I want to merge those dataframes, so that the new variable, color, isbinded to the first dataframe. Of course some cases won't have value for it,since I generated this variable in a smaller dataframe. In those cases Iwant the value to be NA. The result dataframe should be:
height width color1 1.1 2.3 red2 2.1 2.5 NA3 1.8 1.9 red4 1.6 2.1 NA5 1.8 2.4 blue
I have written some codes, but they're not working properly. The newvariable has its values mixed up, and they do not correspond to itsrow.names.
# Generate the first dataframedata1 <- data.frame(height=rnorm(20,3,0.2),width=rnorm(20,2,0.5))# Sample a smaller dataframe from data1data2 <- data1[sample(1:20,15,replace=F),]# Generate the new variablecolor <- sample(c("red","blue"),15,replace=T)# Bind the new variable to data2data2 <- cbind(data2, color)# Merge the data1 and data2$color by row.names, and force it to has the samevalues that data1. Next it generates a new dataframe where column 1 is therow.name, and then sort it by the row.name from data1.data.frame(merge(data1,data2$color, by=0,all.x=T),row.names=1)[row.names(data1),]
I'm not sure what am I doing wrong. Can anyone see where the mistake is?
[R] Merge dataframesjdanielnd jdanielnd at gmail.com Fri Oct 7 15:34:33 CEST 2011
Previous message: [R] "r squared" and anova for linear mixed-effects modelNext message: [R] Merge dataframesMessages sorted by: [ date ] [ thread ] [ subject ] [ author ]
Hello,
I am having some problems to use the 'merge' function. I'm not sure if I gotits working right.
What I want to do is:
1) Suppose I have a dataframe like:
height width1 1.1 2.32 2.1 2.53 1.8 1.94 1.6 2.15 1.8 2.4
2) And I generate a second dataframe sampled from this one, like:
height width1 1.1 2.33 1.8 1.95 1.8 2.4
3) Next, I add a new variable from this dataframe:
height width color1 1.1 2.3 red3 1.8 1.9 red5 1.8 2.4 blue
4) So, I want to merge those dataframes, so that the new variable, color, isbinded to the first dataframe. Of course some cases won't have value for it,since I generated this variable in a smaller dataframe. In those cases Iwant the value to be NA. The result dataframe should be:
height width color1 1.1 2.3 red2 2.1 2.5 NA3 1.8 1.9 red4 1.6 2.1 NA5 1.8 2.4 blue
I have written some codes, but they're not working properly. The newvariable has its values mixed up, and they do not correspond to itsrow.names.
# Generate the first dataframedata1 <- data.frame(height=rnorm(20,3,0.2),width=rnorm(20,2,0.5))# Sample a smaller dataframe from data1data2 <- data1[sample(1:20,15,replace=F),]# Generate the new variablecolor <- sample(c("red","blue"),15,replace=T)# Bind the new variable to data2data2 <- cbind(data2, color)# Merge the data1 and data2$color by row.names, and force it to has the samevalues that data1. Next it generates a new dataframe where column 1 is therow.name, and then sort it by the row.name from data1.data.frame(merge(data1,data2$color, by=0,all.x=T),row.names=1)[row.names(data1),]
I'm not sure what am I doing wrong. Can anyone see where the mistake is?
[...]
Vote����������� ������������������ count
Mailing lists vs. Stack Exchange
Gamification features
João Daniel1,372 3 29
3 Answers
DWin82.9k 3 39 102
I know it's not the best practice in R to use the for loop because it doesn't have an enhancedperformance. For almost all cases there is a function of the family *apply that solves our problems.
However I'm facing a situation where I don't see a workaround.
I need to calculate percent variation for consecutive values:
pv[1]-</-0for(i-in-2:length(x))-{--pv[i]-</-(x[i]-/-x[i/1])/x[i/1]}
So, as you can see, I have to use both the x[i] element, but also the x[i/1] element. By using the*apply functions, I just see how to use the x[i] . Is there anyway I can avoid the for loops?
r loops for-loop
asked May 6 '12 at 1:17
add comment
start a bounty
What you offered would be the fractional variation, but if you multiplied by 100 you get the "percentvariation":
pv</-vector("numeric",length(x))pv[1]-</-0pv[/1]-</-100*-(-x[/1]-/-x[/length(x)]-)/-x[/length(x)]
Vectorized solution. ( And you should note that for-loops are going to be just as slow as *apply solutions ...just not as pretty. Always look for a vectorized approach.)
To explain a bit more: The x[/length(x)] is the vector, x[1:(length{x/1)] , and the x[/1] is thevector, x[2:length(x)] , and the vector operations in R are doing the same operations as in your for-loop body, although not using an explicit loop. R first constructs the differences in those shifted vectors,x[/length(x)]-/-x[/1] , and then divides by x[1:(length{x/1)] .
edited May 6 '12 at 3:31 answered May 6 '12 at 1:28
Nice response DWin. I didn't actually know what the poster was accomplishing but I'm in 100% agreementon the vectorization. +1 – Tyler Rinker May 6 '12 at 1:37
Very nice answer! I didn't know that the vectorized approach was the fastest, I thought lapply was. But inthe last line of code, shouldn't be x[/1]-/-x[/length(x)] ? – João Daniel May 6 '12 at 2:14
@JoãoDaniel: Yes, it should. Edit applied. – DWin May 6 '12 at 3:31
add comment
You can get the same results with:
pv-</-c(0)y-</-sapply(2:length(x),-function(i)-{pv-<</-(x[i]-/-x[i/1])/x[i/1]})c(0,-y)
The for loop issues that once were a problem have been optimized. Often a for loop is not slower and mayeven be faster than the apply solution. You have to test them both and see. I'm betting your for loop isfaster than my solution.
Loops in R - Need to use index, anyway to avoid 'for'?
[R] Merge dataframesjdanielnd jdanielnd at gmail.com Fri Oct 7 15:34:33 CEST 2011
Previous message: [R] "r squared" and anova for linear mixed-effects modelNext message: [R] Merge dataframesMessages sorted by: [ date ] [ thread ] [ subject ] [ author ]
Hello,
I am having some problems to use the 'merge' function. I'm not sure if I gotits working right.
What I want to do is:
1) Suppose I have a dataframe like:
height width1 1.1 2.32 2.1 2.53 1.8 1.94 1.6 2.15 1.8 2.4
2) And I generate a second dataframe sampled from this one, like:
height width1 1.1 2.33 1.8 1.95 1.8 2.4
3) Next, I add a new variable from this dataframe:
height width color1 1.1 2.3 red3 1.8 1.9 red5 1.8 2.4 blue
4) So, I want to merge those dataframes, so that the new variable, color, isbinded to the first dataframe. Of course some cases won't have value for it,since I generated this variable in a smaller dataframe. In those cases Iwant the value to be NA. The result dataframe should be:
height width color1 1.1 2.3 red2 2.1 2.5 NA3 1.8 1.9 red4 1.6 2.1 NA5 1.8 2.4 blue
I have written some codes, but they're not working properly. The newvariable has its values mixed up, and they do not correspond to itsrow.names.
# Generate the first dataframedata1 <- data.frame(height=rnorm(20,3,0.2),width=rnorm(20,2,0.5))# Sample a smaller dataframe from data1data2 <- data1[sample(1:20,15,replace=F),]# Generate the new variablecolor <- sample(c("red","blue"),15,replace=T)# Bind the new variable to data2data2 <- cbind(data2, color)# Merge the data1 and data2$color by row.names, and force it to has the samevalues that data1. Next it generates a new dataframe where column 1 is therow.name, and then sort it by the row.name from data1.data.frame(merge(data1,data2$color, by=0,all.x=T),row.names=1)[row.names(data1),]
I'm not sure what am I doing wrong. Can anyone see where the mistake is?
[R] Merge dataframesjdanielnd jdanielnd at gmail.com Fri Oct 7 15:34:33 CEST 2011
Previous message: [R] "r squared" and anova for linear mixed-effects modelNext message: [R] Merge dataframesMessages sorted by: [ date ] [ thread ] [ subject ] [ author ]
Hello,
I am having some problems to use the 'merge' function. I'm not sure if I gotits working right.
What I want to do is:
1) Suppose I have a dataframe like:
height width1 1.1 2.32 2.1 2.53 1.8 1.94 1.6 2.15 1.8 2.4
2) And I generate a second dataframe sampled from this one, like:
height width1 1.1 2.33 1.8 1.95 1.8 2.4
3) Next, I add a new variable from this dataframe:
height width color1 1.1 2.3 red3 1.8 1.9 red5 1.8 2.4 blue
4) So, I want to merge those dataframes, so that the new variable, color, isbinded to the first dataframe. Of course some cases won't have value for it,since I generated this variable in a smaller dataframe. In those cases Iwant the value to be NA. The result dataframe should be:
height width color1 1.1 2.3 red2 2.1 2.5 NA3 1.8 1.9 red4 1.6 2.1 NA5 1.8 2.4 blue
I have written some codes, but they're not working properly. The newvariable has its values mixed up, and they do not correspond to itsrow.names.
# Generate the first dataframedata1 <- data.frame(height=rnorm(20,3,0.2),width=rnorm(20,2,0.5))# Sample a smaller dataframe from data1data2 <- data1[sample(1:20,15,replace=F),]# Generate the new variablecolor <- sample(c("red","blue"),15,replace=T)# Bind the new variable to data2data2 <- cbind(data2, color)# Merge the data1 and data2$color by row.names, and force it to has the samevalues that data1. Next it generates a new dataframe where column 1 is therow.name, and then sort it by the row.name from data1.data.frame(merge(data1,data2$color, by=0,all.x=T),row.names=1)[row.names(data1),]
I'm not sure what am I doing wrong. Can anyone see where the mistake is?
[...]João Daniel1,372 3 29
3 Answers
DWin82.9k 3 39 102
I know it's not the best practice in R to use the for loop because it doesn't have an enhancedperformance. For almost all cases there is a function of the family *apply that solves our problems.
However I'm facing a situation where I don't see a workaround.
I need to calculate percent variation for consecutive values:
pv[1]-</-0for(i-in-2:length(x))-{--pv[i]-</-(x[i]-/-x[i/1])/x[i/1]}
So, as you can see, I have to use both the x[i] element, but also the x[i/1] element. By using the*apply functions, I just see how to use the x[i] . Is there anyway I can avoid the for loops?
r loops for-loop
asked May 6 '12 at 1:17
add comment
start a bounty
What you offered would be the fractional variation, but if you multiplied by 100 you get the "percentvariation":
pv</-vector("numeric",length(x))pv[1]-</-0pv[/1]-</-100*-(-x[/1]-/-x[/length(x)]-)/-x[/length(x)]
Vectorized solution. ( And you should note that for-loops are going to be just as slow as *apply solutions ...just not as pretty. Always look for a vectorized approach.)
To explain a bit more: The x[/length(x)] is the vector, x[1:(length{x/1)] , and the x[/1] is thevector, x[2:length(x)] , and the vector operations in R are doing the same operations as in your for-loop body, although not using an explicit loop. R first constructs the differences in those shifted vectors,x[/length(x)]-/-x[/1] , and then divides by x[1:(length{x/1)] .
edited May 6 '12 at 3:31 answered May 6 '12 at 1:28
Nice response DWin. I didn't actually know what the poster was accomplishing but I'm in 100% agreementon the vectorization. +1 – Tyler Rinker May 6 '12 at 1:37
Very nice answer! I didn't know that the vectorized approach was the fastest, I thought lapply was. But inthe last line of code, shouldn't be x[/1]-/-x[/length(x)] ? – João Daniel May 6 '12 at 2:14
@JoãoDaniel: Yes, it should. Edit applied. – DWin May 6 '12 at 3:31
add comment
You can get the same results with:
pv-</-c(0)y-</-sapply(2:length(x),-function(i)-{pv-<</-(x[i]-/-x[i/1])/x[i/1]})c(0,-y)
The for loop issues that once were a problem have been optimized. Often a for loop is not slower and mayeven be faster than the apply solution. You have to test them both and see. I'm betting your for loop isfaster than my solution.
Loops in R - Need to use index, anyway to avoid 'for'?
[R] Merge dataframesjdanielnd jdanielnd at gmail.com Fri Oct 7 15:34:33 CEST 2011
Previous message: [R] "r squared" and anova for linear mixed-effects modelNext message: [R] Merge dataframesMessages sorted by: [ date ] [ thread ] [ subject ] [ author ]
Hello,
I am having some problems to use the 'merge' function. I'm not sure if I gotits working right.
What I want to do is:
1) Suppose I have a dataframe like:
height width1 1.1 2.32 2.1 2.53 1.8 1.94 1.6 2.15 1.8 2.4
2) And I generate a second dataframe sampled from this one, like:
height width1 1.1 2.33 1.8 1.95 1.8 2.4
3) Next, I add a new variable from this dataframe:
height width color1 1.1 2.3 red3 1.8 1.9 red5 1.8 2.4 blue
4) So, I want to merge those dataframes, so that the new variable, color, isbinded to the first dataframe. Of course some cases won't have value for it,since I generated this variable in a smaller dataframe. In those cases Iwant the value to be NA. The result dataframe should be:
height width color1 1.1 2.3 red2 2.1 2.5 NA3 1.8 1.9 red4 1.6 2.1 NA5 1.8 2.4 blue
I have written some codes, but they're not working properly. The newvariable has its values mixed up, and they do not correspond to itsrow.names.
# Generate the first dataframedata1 <- data.frame(height=rnorm(20,3,0.2),width=rnorm(20,2,0.5))# Sample a smaller dataframe from data1data2 <- data1[sample(1:20,15,replace=F),]# Generate the new variablecolor <- sample(c("red","blue"),15,replace=T)# Bind the new variable to data2data2 <- cbind(data2, color)# Merge the data1 and data2$color by row.names, and force it to has the samevalues that data1. Next it generates a new dataframe where column 1 is therow.name, and then sort it by the row.name from data1.data.frame(merge(data1,data2$color, by=0,all.x=T),row.names=1)[row.names(data1),]
I'm not sure what am I doing wrong. Can anyone see where the mistake is?
Author
Mailing lists vs. Stack Exchange
Recognition

Research goal
community����������� ������������������ change����������� ������������������ with����������� ������������������ the����������� ������������������ emergence����������� ������������������ ofHow����������� ������������������ did����������� ������������������ knowledge����������� ������������������ sharing����������� ������������������ in����������� ������������������ the
Q&A����������� ������������������ sites?
December 2003 Archives by threadMessages sorted by: [ subject ] [ author ] [ date ]More info on this list...
Starting: Mon Dec 1 00:27:40 CEST 2003Ending: Wed Dec 31 21:39:13 CEST 2003Messages: 1159
[R] fitting a theoretical distribution with truncated tails Piyush Sharma[R] fitting a theoretical distribution with truncated tails Spencer Graves
[R] Discovering methods Gabor Grothendieck[R] Discovering methods Duncan Murdoch[R] Discovering methods Thomas Lumley
[R] Discovering methods Duncan Murdoch[R] Discovering methods Thomas Lumley
[R] hdf library for windows Toby.Patterson at csiro.au[R] hdf library for windows Mulholland, Tom[R] strptime Usage Ko-Kang Kevin Wang
[R] strptime Usage Prof Brian Ripley[R] Discovering methods Prof Brian Ripley[R] significance in difference of proportions: What problema Torsten Hothorn[R] Indexing ANOVA table Pascal A. Niklaus[R] wilcoxon-pratt signed rank test in R - drug-effiacy Niels Steen Krogh
[R] wilcoxon-pratt signed rank test in R - drug-effiacy Peter Dalgaard[R] wilcoxon-pratt signed rank test in R - drug-effiacy Knut M. Wittkowski
[R] Changing distance scale in plclust() Mike White[R] Rd Files? Wolski
[R] Rd Files? kjetil at entelnet.bo[R] Rd Files? Wolski
[R] Rd Files? Prof Brian Ripley[R] Rd Files? Wolski[R] Rd Files? Prof Brian D Ripley[R] Rd Files? Wolski[R] Rd Files? Prof Brian Ripley[R] Rd Files? Wolski[R] Rd Files? Prof Brian Ripley[R] Rd Files? Wolski[R] Rd Files? Prof Brian Ripley[R] Rd Files? Peter Dalgaard[R] Rd Files? Duncan Murdoch[R] Rd Files? Wolski[R] Rd Files? A.J. Rossini[R] Rd Files? Philippe Grosjean[R] Rd Files? A.J. Rossini
[R] Sampling Savano[R] Sampling paradis at univ-montp2.fr[R] Sampling Christian Mora
[R] Cluster analysis for multinominal data? Ing. Michael RostAW: [R] Sampling RINNER Heinrich[R] cclust - cindex - binary data Bruno Giordano[R] with for objects Roger D. Peng
@b_vasilescu

Research goal
community����������� ������������������ change����������� ������������������ with����������� ������������������ the����������� ������������������ emergence����������� ������������������ ofHow����������� ������������������ did����������� ������������������ knowledge����������� ������������������ sharing����������� ������������������ in����������� ������������������ the
Q&A����������� ������������������ sites?
Transition to ?
[2010 blog entry]
“Young����������� ������������������ experts����������� ������������������ don’t����������� ������������������ want����������� ������������������ to����������� ������������������ have����������� ������������������ to����������� ������������������ monitor����������� ������������������ email����������� ������������������ all����������� ������������������ day����������� ������������������ to����������� ������������������ be����������� ������������������ part����������� ������������������ of����������� ������������������ the����������� ������������������ discussion.����������� ������������������ Their����������� ������������������ answers����������� ������������������ belong����������� ������������������ on����������� ������������������ a����������� ������������������ website����������� ������������������ with����������� ������������������ a����������� ������������������ normal����������� ������������������ content����������� ������������������ management����������� ������������������ system,����������� ������������������ with����������� ������������������ good����������� ������������������ search����������� ������������������ functions����������� ������������������ and����������� ������������������ user����������� ������������������ interactions.����������� ������������������ Go����������� ������������������ [to����������� ������������������ Stack����������� ������������������ Exchange����������� ������������������ and]����������� ������������������ sign����������� ������������������ up.”
@b_vasilescu

Research goal
community����������� ������������������ change����������� ������������������ with����������� ������������������ the����������� ������������������ emergence����������� ������������������ ofHow����������� ������������������ did����������� ������������������ knowledge����������� ������������������ sharing����������� ������������������ in����������� ������������������ the
Q&A����������� ������������������ sites?
0
500
1000
1500
1998 2000 2002 2004 2006 2008 2010 2012Date
Num
ber o
f que
stion
s
r−helpStackOverflowCrossValidated
Number of questions per month on r−help and StackExchange
#Questions asked each month
@b_vasilescu

Today
Who are they?1
@b_vasilescu

Today
Who are they?1 Do they behave any differently?
2
@b_vasilescu

Today
Who are they?1 Do they behave any differently?
2
+Mining repositories User survey (112 resp.)

Laurent Gautier - [email protected]
!!!
Laurent Gautier
Cross ValidatedMining challenges
@b_vasilescu

Laurent Gautier - [email protected]
!!!
Laurent Gautier
Cross ValidatedMining challenges
@b_vasilescu

Laurent Gautier - [email protected]
Laurent Gautier - [email protected]
!!
Laurent Gautier
Cross ValidatedMining challenges
@b_vasilescu

Laurent Gautier - [email protected]
Laurent Gautier - [email protected]
!!
Laurent Gautier
Cross ValidatedMining challenges
@b_vasilescu

Laurent Gautier - [email protected]
Laurent Gautier - [email protected]
Laurent - [email protected]
!
Laurent Gautier
Cross ValidatedMining challenges
@b_vasilescu

Laurent Gautier - [email protected]
Laurent Gautier - [email protected]
Laurent - [email protected]
!
Laurent Gautier
Cross ValidatedMining challenges
@b_vasilescu

Laurent Gautier - [email protected]
Laurent Gautier - [email protected]
Laurent - [email protected]
…
Laurent Gautier
Identity merging is far from trivial!
9 email addresses, 3 names
Cross ValidatedMining challenges
@b_vasilescu

Laurent Gautier - [email protected]
Laurent Gautier - [email protected]
Laurent - [email protected]
…
MD5([email protected]) = 8e5422a173711c086b685140dbc498fe
Cross ValidatedMining challenges
@b_vasilescu

The community
Cross Validated~16k ~10k
~2k
~3k (20%)
> September 2008
1 Who are they?
@b_vasilescu

The community
Core
Peripheral
Package maintainers
Users
Have write access to the R source (~20)
Contribute code, bug fixes and documentation (~40)
Author or maintain R packages (~2600)
Others
1 Who are they?
@b_vasilescu

0.00
0.25
0.50
0.75
1.00
All(3334;16569)
Core(8;18)
Package(312;899)
Periph.(11;21)
Users(3003;15631)
on SE not on SE
users on
Core
Peripheral
Package maintainers
Users
1 Who are they?
@b_vasilescu

0.00
0.25
0.50
0.75
1.00
All(3334;16569)
Core(8;18)
Package(312;899)
Periph.(11;21)
Users(3003;15631)
on SE not on SE
users on
Devs vs users: 1.6x-2x higher chance of being on
Core
Peripheral
Package maintainers
Users
1 Who are they?
@b_vasilescu

users on
median 1 thread answered
median 4 threads answered
Consistently more active
1 Who are they?
@b_vasilescu

Today
Who are they?1 Do they behave any differently?
2Mostly����������� ������������������ devs,����������� ������������������ consistently����������� ������������������ more����������� ������������������ active
@b_vasilescu

On r−help On StackExchange
Speed of answers for r−help participants active on StackExchange
1 min
1 hour
1 day
1 month
1 year5 years
median ~3h median 47mins
The same users answer faster on
Do they behave any differently?2@b_vasilescu

Help Center > Badges
Besides gaining reputation with your questions and answers, you receive badges for being especially helpful.Badges appear on your profile page, flair, and your posts.
Question Badges
Altruist First bounty you manually awarded on another person's question 3.6k awarded
Benefactor First bounty you manually awarded on your own question 18.7k awarded
Favorite Question Question favorited by 25 users 12.7k awarded
Stellar Question Question favorited by 100 users 1.6k awarded
Investor First bounty you offered on another person's question 7.2k awarded
Nice Question Question score of 10 or more 163k awarded
Good Question Question score of 25 or more 41.4k awarded
Great Question Question score of 100 or more 5.1k awarded
Popular Question Asked a question with 1,000 views 1.4m awarded
Notable Question Asked a question with 2,500 views 582.9k awarded
Famous Question Asked a question with 10,000 views 114.9k awarded
Promoter First bounty you offered on your own question 32.5k awarded
Scholar Asked a question and accepted an answer 627.8k awarded
Student Asked first question with score of 1 or more 788.7k awarded
Tumbleweed Asked a question with no votes, no answers, no comments, and lowviews for a week 343.8k awarded
Answer Badges
Enlightened First to answer and accepted with score of 10 or more 117k awarded
Generalist Provided non-wiki answers of 15 total score in 20 of top 40 tags 514 awarded
Guru Accepted answer and score of 40 or more 26.4k awarded
Nice Answer Answer score of 10 or more 374.8k awarded
Good Answer Answer score of 25 or more 92.3k awarded
Great Answer Answer score of 100 or more 11.5k awarded
Populist Highest scoring answer that outscored an accepted answer with score ofmore than 10 by more than 2x 4.6k awarded
Reversal Provided answer of +20 score to a question of -5 score 168 awarded
Revival Answered more than 30 days later as first answer scoring 2 or more 113.7k awarded
Necromancer Answered a question more than 60 days later with score of 5 or more 113.2k awarded
262 1 15
help
The same users answer faster on
Do they behave any differently?2@b_vasilescu

SurveyMotivation to contribute
In����������� ������������������ case����������� ������������������ of����������� ������������������ Stack����������� ������������������ Exchange,����������� ������������������ the����������� ������������������ reputation����������� ������������������ ratings����������� ������������������ are����������� ������������������ a����������� ������������������ nice����������� ������������������ little����������� ������������������ incentive.
Peer����������� ������������������ recognition/gamification����������� ������������������ within����������� ������������������ Stack����������� ������������������ Overflow
It’s����������� ������������������ a����������� ������������������ game,����������� ������������������ which����������� ������������������ also����������� ������������������ serves����������� ������������������ a����������� ������������������ good����������� ������������������ purpose.
Do they behave any differently?2@b_vasilescu

Research goal
community����������� ������������������ change����������� ������������������ with����������� ������������������ the����������� ������������������ emergence����������� ������������������ ofHow����������� ������������������ did����������� ������������������ knowledge����������� ������������������ sharing����������� ������������������ in����������� ������������������ the
Q&A����������� ������������������ sites?
0
500
1000
1500
1998 2000 2002 2004 2006 2008 2010 2012Date
Num
ber o
f que
stion
s
r−helpStackOverflowCrossValidated
Number of questions per month on r−help and StackExchange
#Questions asked each month
@b_vasilescu

Transition to
�
���
���
���
����
���� ���� ���� ���� ������
� �
����
�������
�� ������ �� �������� �
Activity of r−help answerers also active on Stack Exchange
@b_vasilescu

SurveyDisengagement from the mailing list
Google����������� ������������������ is����������� ������������������ getting����������� ������������������ better����������� ������������������ at����������� ������������������ finding����������� ������������������ answers����������� ������������������ related����������� ������������������ to����������� ������������������ R����������� ������������������ so����������� ������������������ I����������� ������������������ use����������� ������������������ it����������� ������������������ more.����������� ������������������ I����������� ������������������ rely����������� ������������������ less����������� ������������������ on����������� ������������������ going����������� ������������������ directly����������� ������������������ to����������� ������������������ mailing����������� ������������������ lists����������� ������������������ now.
r-help����������� ������������������ used����������� ������������������ to����������� ������������������ be����������� ������������������ very����������� ������������������ helpful.����������� ������������������ But����������� ������������������ as����������� ������������������ the����������� ������������������ number����������� ������������������ of����������� ������������������ posts����������� ������������������ has����������� ������������������ gone����������� ������������������ up,����������� ������������������ I����������� ������������������ find����������� ������������������ that����������� ������������������ reading����������� ������������������ it����������� ������������������ is����������� ������������������ not����������� ������������������ as����������� ������������������ useful����������� ������������������ as����������� ������������������ it����������� ������������������ had����������� ������������������ been.
@b_vasilescu

![Are Deep Neural Networks the Best Choice[2] for Modeling ...web.cs.ucdavis.edu/~devanbu/isDLgood.pdf · Modeling Implications: In NLP, it’s de regeur to limit vocabulary to the](https://img.pdfslide.us/doc/110x75/5b7979797f8b9a6a498da83c/are-deep-neural-networks-the-best-choice2-for-modeling-webcs-devanbuisdlgoodpdf.jpg)