Embed Size (px)
Citation preview
26TH DAAAM INTERNATIONAL SYMPOSIUM ON INTELLIGENT MANUFACTURING AND AUTOMATION
THE INFLUENCE OF THE FRONTAL PROFILE DESIGN OF A
VEHICLE UPON THE PEDESTRIAN SAFETY AT LOW VELOCITY
Bogdan Toleaa, Daniel Truscaa, Csaba Antonyaa, Horia Belesb
aUniversity Transilvania of Brasov, Bdul. Eroilor 29, Brasov, 500036, Romania
bUniversity of Oradea, Str. Universitatii, 1, Oradea 410087, Romania
Abstract
The objective of this paper is to determine the influence of the frontal profile design of a vehicle upon the pedestrian safety and to assess the pedestrian’s injury severity. In order to achieve this objective two crash-tests were performed, using two vehicles with different frontal profile designs and a crash test dummy, meant to simulate the pedestrian behavior. In the head of the crash test dummy a tri-axial accelerometer was mounted in order to measure the head accelerations during the collision. Obtaining the acceleration values, it is possible to assess the risk of the skull fractures, by calculating HIC (Head Injury Criteria) values.
Keywords: bumper location, collision, crash-test, frontal profile, pedestrian, HIC
This Publication has to be referred as: Tolea, B[ogdan]; Trusca, D[aniel]; Antonya, C[saba] & Beles, H[oria] (2016).
The Influence of the Frontal Profile Design of a Vehicle upon the Pedestrian Safety at Low Velocity, Proceedings of the
26th DAAAM International Symposium, pp.1052-1058, B. Katalinic (Ed.), Published by DAAAM International, ISBN
978-3-902734-07-5, ISSN 1726-9679, Vienna, Austria
DOI: 10.2507/26th.daaam.proceedings.148
- 1052 -
26TH DAAAM INTERNATIONAL SYMPOSIUM ON INTELLIGENT MANUFACTURING AND AUTOMATION
1. Introduction
Pedestrians are the most “underprivileged” road users. According to [11], in 2013, 22% of the fatalities that
occurred in the road traffic, pedestrians were involved. There was a decrease of 11% in pedestrian fatalities since 2010
[11]. The most important parameters that are influencing the injury risk of a pedestrian are the age of the pedestrian,
collision velocity, vehicle type and the frontal profile design of the vehicle [1].
The design of the vehicle frontal profile may influence the injury risk. The frontal bumper is usually the first part
of the vehicle which enters in contact with the pedestrian’s lower limbs, while its position and design may influence the
behavior of the pedestrian during the collision [2]. Depending on the collision velocity and the vehicle frontal profile
design, the pedestrian may be carried out on the windshield or thrown away on the ground.
The two body regions which are most frequently severed injured are the lower limbs and the head [18]. The
lower extremities represent the region most commonly injured, while the head injuries represent the main source of the
fatalities, accounting 30% of the overall AIS 2+ (Abbreviated Injury Scale) [17][18].
It is desired to reduce the injury severity by improving the frontal profile design of the vehicles. Below a collision
velocity of 40 km/h between a motor vehicle and a pedestrian, the injury risk is significantly reduced. The pedestrian
fatality main cause is the head injury, being the most vulnerable part of the pedestrian. The vehicle critical parts during
the collision with a pedestrian are the A pillars and the bonnet, having a high stiffness [14].
In order to reduce the head injury risk at the impact with the bonnet and the windscreen, active bonnet and the
pedestrian airbag was developed which are passive safety systems for the pedestrians. In the moment of the impact the
bonnet lifts such that the gap between the engine and the bonnet will increase and at the base of the windshield an airbag
is deployed in order to prevent the collision of the pedestrian’s head with the windscreen. These systems are meant to
reduce the accelerations that the pedestrians are subjected to [15].
The head represent the most vulnerable body region [6], [7], [8]. In order to assess the head injury severity was
introduced a scale named HIC (Head Injury Criteria). The pedestrian’s head is subjected to high loads due to the high
decelerations caused by the collision, while HIC is defined as the integration of this acceleration in a specific time interval
[3].
Frontal bumpers are structures of great importance in passenger cars that manufactures are designing carefully
in order to behave as good as possible in case of an impact [4], [5].
In order to study the behavior of the pedestrian in case of an impact against a vehicle with different frontal profile,
two different vehicles were used, having different design of the frontal bumper. To determine the pedestrian’s behavior,
a crash test dummy was used. In this dummy two tri-axial accelerometers were mounted, one in the dummy’s head,
respectively one in the dummy’s thorax. The head injury severity can be estimated using the head’s acceleration during
the crash tests.
2. Methodology
In order to determine the influence of the design of the frontal profile of the vehicle at the collision with a
pedestrian two crash tests were organized, using vehicles with different frontal profile design. To achieve accurate data,
in both crash tests the velocities were identical and the crash test dummy was positioned at the same angle of impact. The
used crash test dummy had a weight of 85 kg, respectively a height of 1.85 m. The dummy’s head is weighting 4.5kg,
representing 5.3% of the total weight of the dummy. The neck is representing a component of major importance of the
dummy due to fact that has a major influence upon the obtained head acceleration. In order to obtain accurate data, the
neck model used was the one equipped on Hybrid III dummy, which is an approved dummy as behaving similar with the
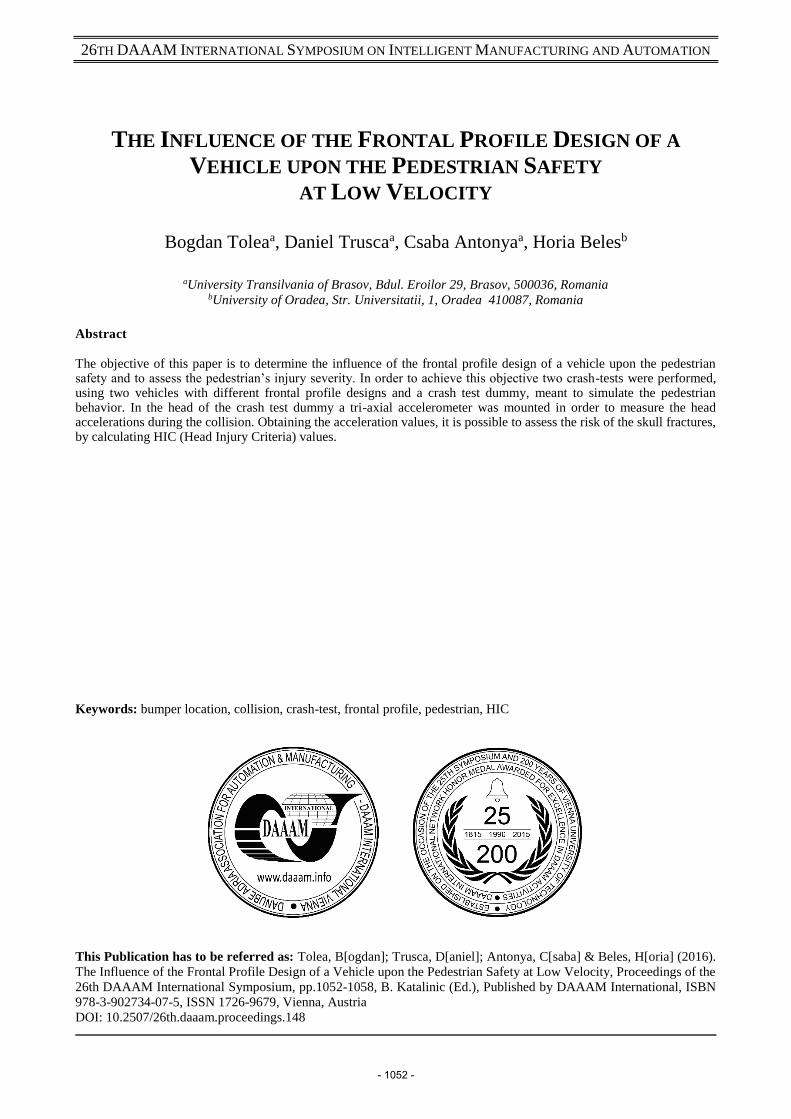
pedestrians in case of an impact with a vehicle (Fig. 1.) [16].
Fig. 1. Head-neck assembly used in the crash-test
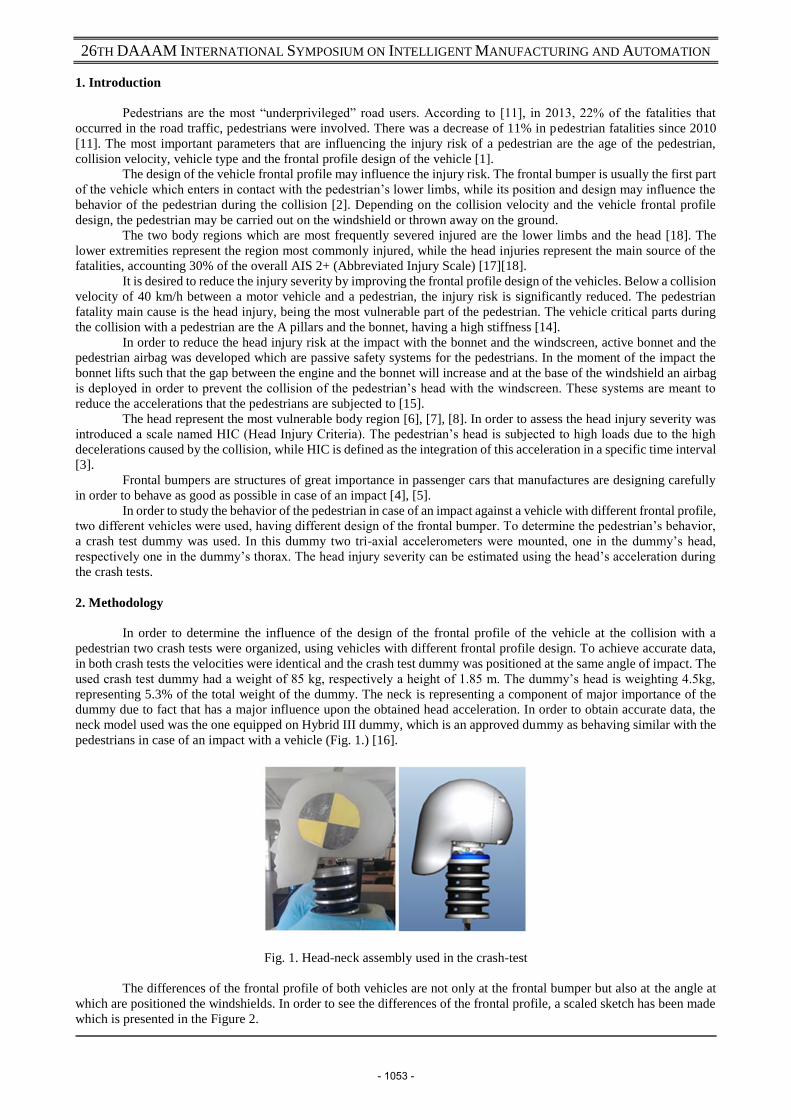
The differences of the frontal profile of both vehicles are not only at the frontal bumper but also at the angle at
which are positioned the windshields. In order to see the differences of the frontal profile, a scaled sketch has been made
which is presented in the Figure 2.
- 1053 -
26TH DAAAM INTERNATIONAL SYMPOSIUM ON INTELLIGENT MANUFACTURING AND AUTOMATION
Fig. 2. Differences of the frontal profile of the employed vehicles
The frontal profile of the vehicle 1 has straight surfaces, while the frontal profile of the second vehicle is rounded
and sharper. Another difference is the frontal bumper, which for the first vehicle is extruded in comparison with the
second vehicle, which has a smoother surface. The bonnet inclination and the design of the bonnet leading edge represent
an important difference between the two vehicles because these parts have a major influence in the behavior of the
pedestrian during collision.
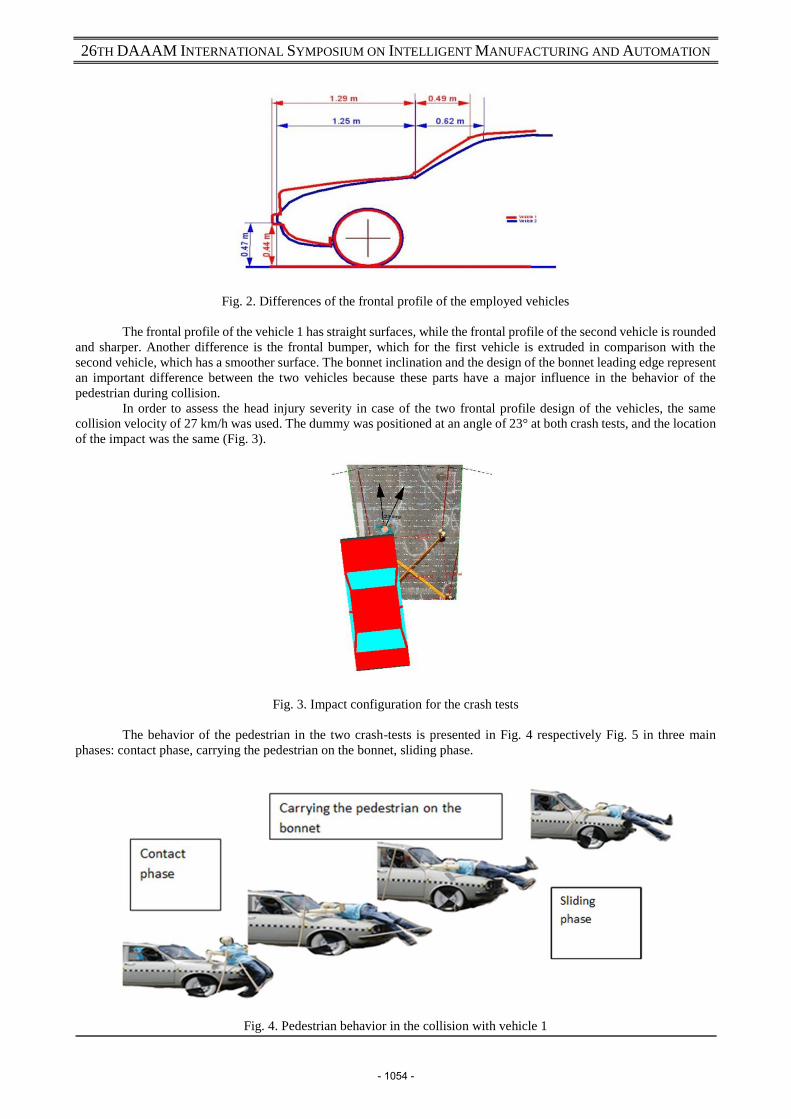
In order to assess the head injury severity in case of the two frontal profile design of the vehicles, the same
collision velocity of 27 km/h was used. The dummy was positioned at an angle of 23° at both crash tests, and the location
of the impact was the same (Fig. 3).
Fig. 3. Impact configuration for the crash tests
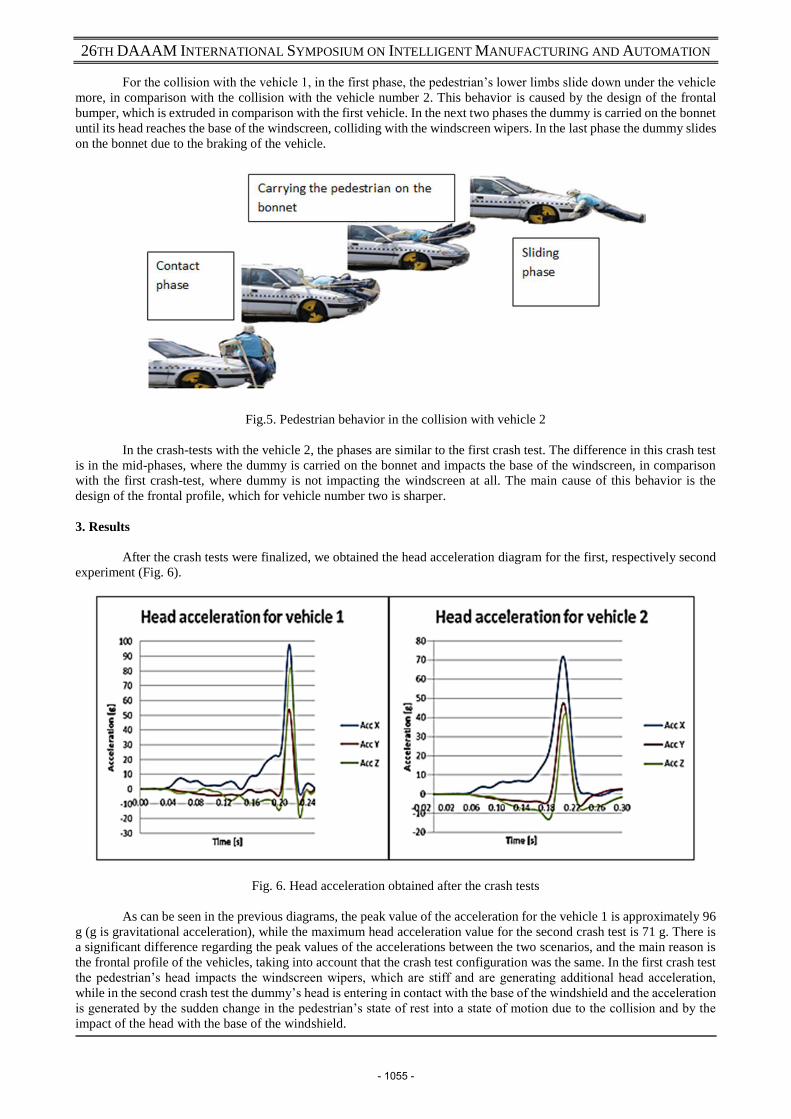
The behavior of the pedestrian in the two crash-tests is presented in Fig. 4 respectively Fig. 5 in three main
phases: contact phase, carrying the pedestrian on the bonnet, sliding phase.
Fig. 4. Pedestrian behavior in the collision with vehicle 1
- 1054 -
26TH DAAAM INTERNATIONAL SYMPOSIUM ON INTELLIGENT MANUFACTURING AND AUTOMATION
For the collision with the vehicle 1, in the first phase, the pedestrian’s lower limbs slide down under the vehicle
more, in comparison with the collision with the vehicle number 2. This behavior is caused by the design of the frontal
bumper, which is extruded in comparison with the first vehicle. In the next two phases the dummy is carried on the bonnet
until its head reaches the base of the windscreen, colliding with the windscreen wipers. In the last phase the dummy slides
on the bonnet due to the braking of the vehicle.
Fig.5. Pedestrian behavior in the collision with vehicle 2
In the crash-tests with the vehicle 2, the phases are similar to the first crash test. The difference in this crash test
is in the mid-phases, where the dummy is carried on the bonnet and impacts the base of the windscreen, in comparison
with the first crash-test, where dummy is not impacting the windscreen at all. The main cause of this behavior is the
design of the frontal profile, which for vehicle number two is sharper.
3. Results
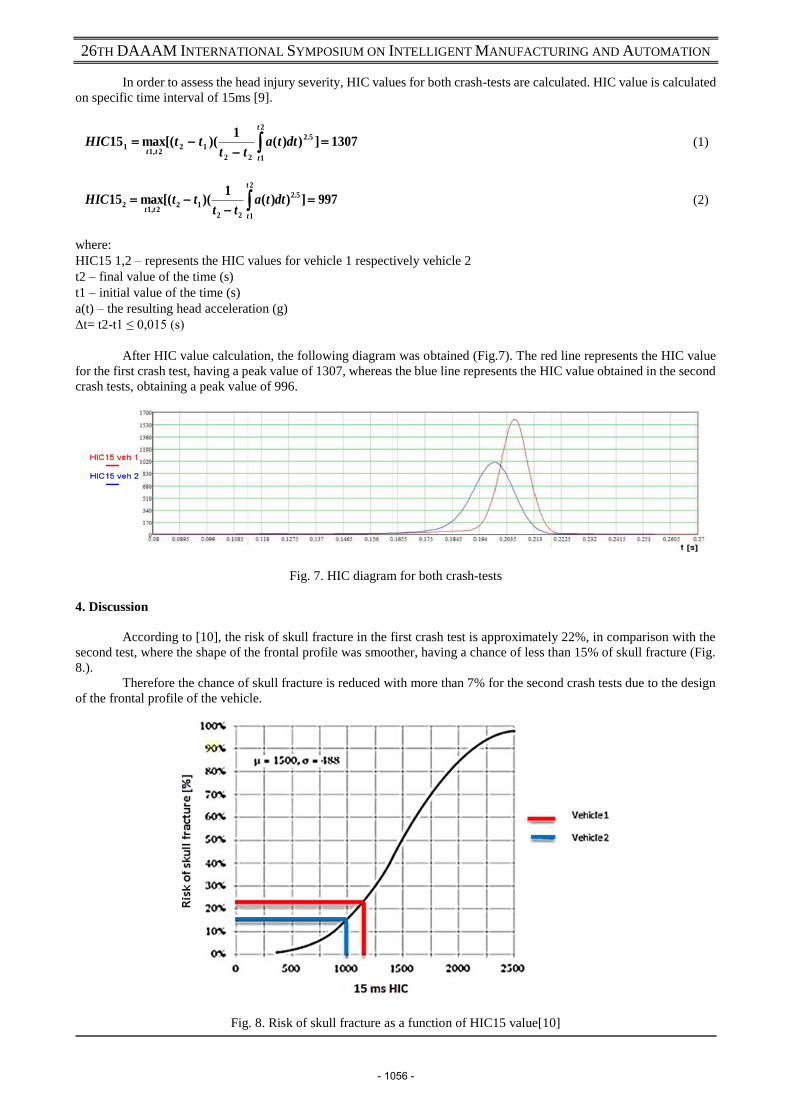
After the crash tests were finalized, we obtained the head acceleration diagram for the first, respectively second
experiment (Fig. 6).
Fig. 6. Head acceleration obtained after the crash tests
As can be seen in the previous diagrams, the peak value of the acceleration for the vehicle 1 is approximately 96
g (g is gravitational acceleration), while the maximum head acceleration value for the second crash test is 71 g. There is
a significant difference regarding the peak values of the accelerations between the two scenarios, and the main reason is
the frontal profile of the vehicles, taking into account that the crash test configuration was the same. In the first crash test
the pedestrian’s head impacts the windscreen wipers, which are stiff and are generating additional head acceleration,
while in the second crash test the dummy’s head is entering in contact with the base of the windshield and the acceleration
is generated by the sudden change in the pedestrian’s state of rest into a state of motion due to the collision and by the
impact of the head with the base of the windshield.
- 1055 -
26TH DAAAM INTERNATIONAL SYMPOSIUM ON INTELLIGENT MANUFACTURING AND AUTOMATION
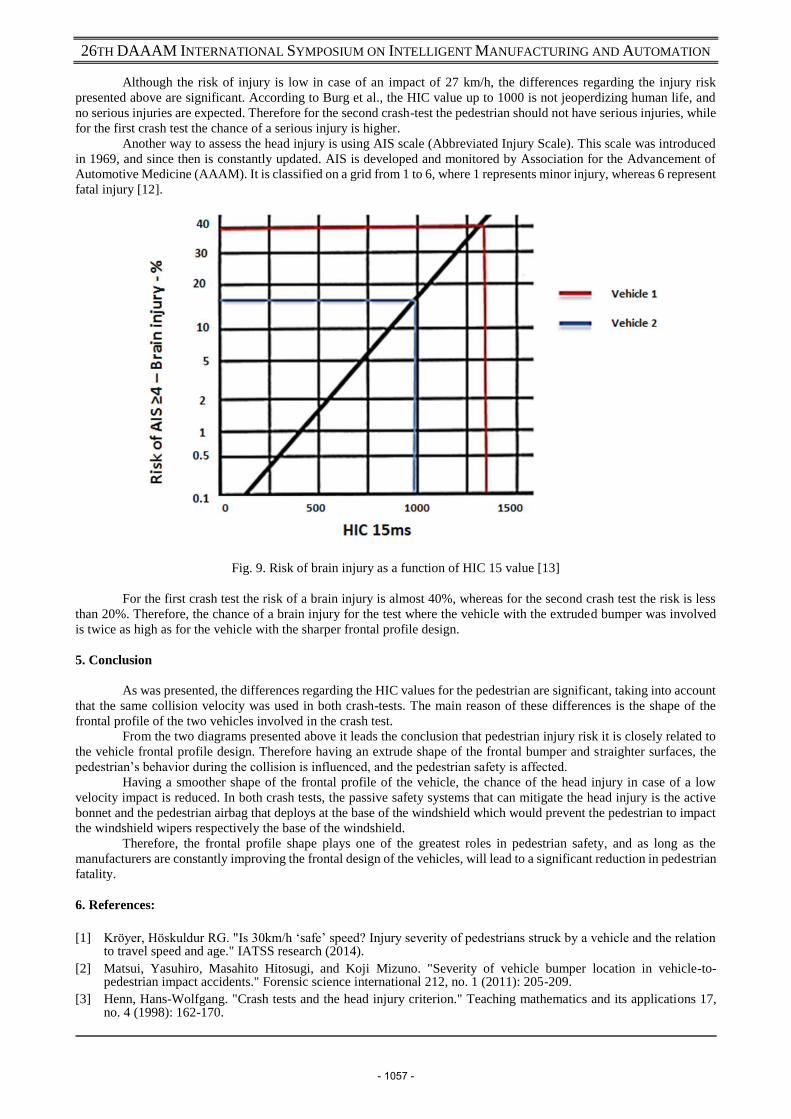
In order to assess the head injury severity, HIC values for both crash-tests are calculated. HIC value is calculated
on specific time interval of 15ms [9].
1307]))(1
)([(max15
2
1
5.2
22
122,1
1
t
ttt
dttatt
ttHIC (1)
997]))(1
)([(max15
2
1
5.2
22
122,1
2
t
ttt
dttatt
ttHIC (2)
where:
HIC15 1,2 – represents the HIC values for vehicle 1 respectively vehicle 2
t2 – final value of the time (s)
t1 – initial value of the time (s)
a(t) – the resulting head acceleration (g)
∆t= t2-t1 ≤ 0,015 (s)
After HIC value calculation, the following diagram was obtained (Fig.7). The red line represents the HIC value
for the first crash test, having a peak value of 1307, whereas the blue line represents the HIC value obtained in the second
crash tests, obtaining a peak value of 996.
Fig. 7. HIC diagram for both crash-tests
4. Discussion
According to [10], the risk of skull fracture in the first crash test is approximately 22%, in comparison with the
second test, where the shape of the frontal profile was smoother, having a chance of less than 15% of skull fracture (Fig.
8.).
Therefore the chance of skull fracture is reduced with more than 7% for the second crash tests due to the design
of the frontal profile of the vehicle.
Fig. 8. Risk of skull fracture as a function of HIC15 value[10]
- 1056 -
26TH DAAAM INTERNATIONAL SYMPOSIUM ON INTELLIGENT MANUFACTURING AND AUTOMATION
Although the risk of injury is low in case of an impact of 27 km/h, the differences regarding the injury risk
presented above are significant. According to Burg et al., the HIC value up to 1000 is not jeoperdizing human life, and
no serious injuries are expected. Therefore for the second crash-test the pedestrian should not have serious injuries, while
for the first crash test the chance of a serious injury is higher.
Another way to assess the head injury is using AIS scale (Abbreviated Injury Scale). This scale was introduced
in 1969, and since then is constantly updated. AIS is developed and monitored by Association for the Advancement of
Automotive Medicine (AAAM). It is classified on a grid from 1 to 6, where 1 represents minor injury, whereas 6 represent
fatal injury [12].
Fig. 9. Risk of brain injury as a function of HIC 15 value [13]
For the first crash test the risk of a brain injury is almost 40%, whereas for the second crash test the risk is less
than 20%. Therefore, the chance of a brain injury for the test where the vehicle with the extruded bumper was involved
is twice as high as for the vehicle with the sharper frontal profile design.
5. Conclusion
As was presented, the differences regarding the HIC values for the pedestrian are significant, taking into account
that the same collision velocity was used in both crash-tests. The main reason of these differences is the shape of the
frontal profile of the two vehicles involved in the crash test.
From the two diagrams presented above it leads the conclusion that pedestrian injury risk it is closely related to
the vehicle frontal profile design. Therefore having an extrude shape of the frontal bumper and straighter surfaces, the
pedestrian’s behavior during the collision is influenced, and the pedestrian safety is affected.
Having a smoother shape of the frontal profile of the vehicle, the chance of the head injury in case of a low
velocity impact is reduced. In both crash tests, the passive safety systems that can mitigate the head injury is the active
bonnet and the pedestrian airbag that deploys at the base of the windshield which would prevent the pedestrian to impact
the windshield wipers respectively the base of the windshield.
Therefore, the frontal profile shape plays one of the greatest roles in pedestrian safety, and as long as the
manufacturers are constantly improving the frontal design of the vehicles, will lead to a significant reduction in pedestrian
fatality.
6. References:
[1] Kröyer, Höskuldur RG. "Is 30km/h ‘safe’ speed? Injury severity of pedestrians struck by a vehicle and the relation to travel speed and age." IATSS research (2014).
[2] Matsui, Yasuhiro, Masahito Hitosugi, and Koji Mizuno. "Severity of vehicle bumper location in vehicle-to-pedestrian impact accidents." Forensic science international 212, no. 1 (2011): 205-209.
[3] Henn, Hans-Wolfgang. "Crash tests and the head injury criterion." Teaching mathematics and its applications 17, no. 4 (1998): 162-170.
- 1057 -

26TH DAAAM INTERNATIONAL SYMPOSIUM ON INTELLIGENT MANUFACTURING AND AUTOMATION
[4] Cheon SS, Choi JH, Lee DG. Development of the composite bumper beam for passenger cars. Compos Struct 1995;32:491–9.
[5] Reid SR, Zhou G. Impact behavior of fiber-reinforced composite materials and structures. England: Woodhead Publishing; 2000.
[6] Longhitano, Douglas, Basem Henary, Kavi Bhalla, Johan Ivarsson, and Jeff Crandall. Influence of vehicle body type on pedestrian injury distribution. No. 2005-01-1876. SAE Technical Paper, 2005.
[7] Maki T., Kajzer J., Mizuno K.., Sekine Y., 2003b. Comparative analysis of vehicle-bicyclist and vehicle-pedestrian accidents in Japan. Accident Analysis & Prevention 35 (6), 927–940.
[8] Zhang, G., Cao, L., Hu, J., Yang, K.H., 2008. A field data analysis of risk factors affecting the injury risks in vehicle-to- pedestrian crashes. Annals of Advances in Automotive Medicine (AAAM) 52, 199–213.
[9] H. Burg, A. Moser, Handbook of Accident Reconstruction, 2013.
[10] Winkelstein, Beth A., ed. Orthopaedic biomechanics. CRC Press, 2012.
[11] http://ec.europa.eu/transport/road_safety/pdf/vademecum_2015.pdf , accessed in 7.09.2015
[12] Champion, Howard R. "Abbreviated Injury Scale." Encyclopedia of Intensive Care Medicine. Springer Berlin Heidelberg, 2012. 1-5.
[13] Mertz, Harold J. "Injury risk assessments based on dummy responses." Accidental Injury. Springer New York, 2002. 89-102.
[14] Soica, A., Tarulescu, S., Luca, D. M. (2009). Influence of bumper design on pedestrian injuries. Annals of DAAAM & Proceedings, 2009, pp. 145-146, 2009.
[15] Xu, D., Zhu, X., Miao, Q., Ma, Z., & Wu, B. “The research of reversible pop-up Hood for pedestrian protection” Vehicular Electronics and Safety (ICVES), IEEE International Conference pp. 42-47, July 2010
[16] Guizzo, Erico. "Anatomy of a crash-test dummy." IEEE Spectrum 10, no. 44 (2007): 42-49.
[17] Jiming, Dai, Peng Yong, and Yang Jikuang. "Influence of neck dynamic response on head injuries in passenger car to pedestrian collisions." In Measuring Technology and Mechatronics Automation (ICMTMA), 2013 Fifth International Conference on, pp. 631-634. IEEE, 2013.
[18] Badea-Romero, Alexandro, and James Lenard. "Source of head injury for pedestrians and pedal cyclists: Striking vehicle or road?." Accident Analysis & Prevention 50 (2013): 1140-1150.
- 1058 -