Embed Size (px)
Citation preview

1
BofAML Global Metals, Mining & Steel Conference May 15 & 16, 2018
Timoteo Di Maulo - Chief Executive Officer

Forward-Looking Statements
This document may contain forward-looking information and statements about Aperam and its subsidiaries. These
statements include financial projections and estimates and their underlying assumptions, statements regarding
plans, objectives and expectations with respect to future operations, products and services, and statements regarding future performance. Forward-looking statements may be identified by the words “believe,” “expect,”
“anticipate,” “target” or similar expressions. Although Aperam’s management believes that the expectations
reflected in such forward-looking statements are reasonable, investors and holders of Aperam’s securities are cautioned that forward-looking information and statements are subject to numerous risks and uncertainties, many
of which are difficult to predict and generally beyond the control of Aperam, that could cause actual results and
developments to differ materially and adversely from those expressed in, or implied or projected by, the forward-looking information and statements. These risks and uncertainties include those discussed or identified in
Aperam’s filings with the Luxembourg Stock Market Authority for the Financial Markets (Commission de
Surveillance du Secteur Financier). Aperam undertakes no obligation to publicly update its forward-looking statements or information, whether as a result of new information, future events, or otherwise.
Disclaimer
2

Solid cash generation with strong shareholders’ return, thanks to consistent execution of self help strategy and financial discipline.
VDM transaction, new project of Genk and Transformation Program to further improve Aperam’s productivity and profitability.
3
Cash generation and financial discipline
Strong cash generation through the cycle
Strongest balance sheet in industry
Progressive dividend
Strong shareholder returns (payout 50-100%)
Aperam’s investment case
Solid execution of self help strategy
Leadership Journey®
Phase 1: Restructuring
Phase 2: Asset upgrade
Phase 3: Transformation
Top Line strategy
End-user focus
Optimized and sustainable European asset base
Cost Leading footprint
Sole flat stainless steel producer in South America
Lean organization
Leading industry margins and returns
Being a sustainably safe and profitable company
Value accretive opportunities (VDM, Genk CRAP)
Aperam’s investment case
Aperam's fundamentals
BofAML Global Metals, Mining & Steel Conference

Footprint and productivity breakthrough
Aperam capacity utilization and productivity has significantly improved with Leadership Journey®
* Full time equivalent excluding Bioenergia ** Quarterly average
HAP 3
CR 4 CR 3 CR 2
CAP 1 BAL CAP2
Skin 3 Skin 1
HAP 3
CR 2
Skin
CR 1
CAP 2
LC2I
RD 79
CR 2 CR 4 CR 3 CR 5 CR 6
CAP10 BA 6
BA 8
Skin 3 Skin 1
BA 11
Skin 2
HA&P lines
CR mills
CA&P/ BA lines
Skins Skin 2
GENK ISBERGUES GUEUGNON
Long term suspension Swing Leadership Journey®
Investment
Aperam downstream rationalization in EU from 29 tools to 17 tools
Core Markets
Capital goods, chemicals & energy
Auto, distribution & 1st transformation
Decoration trim, heat exchanges & white goods
Aperam productivity evolution, average
5
Aperam’s fundamentals
0
100
200
300
400
500
600
7 500
8 000
8 500
9 000
9 500
10 000
10 500
Q42010
av.2011
av.2012
av.2013
av.2014
av.2015
av.2016
av.2017
Number of employees* (LHS) Shipments ** in kt (RHS)

Unique asset base in South America well adapted to the market
The sole flat stainless steel producer in South America with a complete range of products, including Electrical and Special Carbon Steel, and flexibility between production routes to adapt to market needs
Montevideo (Uruguay)
Ribeirão Pires
Buenos Aires (Argentina)
South American Footprint
Campinas
Timoteo
Caxias do Sul
Peru
Ecuador
Caracas (Venezuela)
Colombia
Rep offices, sales agencies
Melt shop, Hot/Cold rolling
Service Centers
Tubes mills and Cutting centers
Sumaré
Range of products
Grain oriented electric steel (GO & HGO) has the magnetic properties optimized in the rolling direction, aiming its use in stationary machines such as transformers.
A complete range of stainless steel grades (austenitics, ferritics, duplex, martensitics)
Stainless steel
Grain oriented electrical steel
Non-grain oriented electrical steel
Special carbon steel
Non-grain oriented electric steel (NGO) has similar magnetic properties in all directions, aiming its use in electric motors and generators with moving parts.
Completing product portfolio with alloyed, high, medium other special carbon steel.
Bio Energia
Blast furnace fuel needs fully covered through cost competitive and environment friendly captive charcoal from our cultivated forests
Upstream integration
6
Aperam’s fundamentals

Jan
11M
ay 1
1Se
p 11
Jan
12M
ay 1
2Se
p 12
Jan
13M
ay 1
3Se
p 13
Jan
14M
ay 1
4Se
p 14
Jan
15M
ay 1
5Se
p 15
Jan
16M
ay 1
6Se
p 16
Jan
17M
ay 1
7Se
p 17
5.000
7.000
9.000
11.000
13.000
15.000
17.000
19.000
21.000
23.000
0
20
40
60
80
100
120
2011 2012 2013 2014 2015 2016 2017
S&S yearly EBITDA per ton (LHS) Nickel LME price (RHS)
Enhanced partnership with customers through focus on downstream added value services and solutions.
7
End-
use
rs
Aper
am S
tain
less
& E
lect
rical
Aper
am
Serv
ices
&
Solu
tions
Inde
pend
ent
dist
ribut
ors
and
othe
r
Transformation of Stainless Steel and additional services to better fit needs of end-users
Services & Solutions division
End- users
Aperam Stainless & Electrical
Steel
Aperam Services & Solutions
Independent distributors and other
* Source: SMR
Services & Solutions adjusted EBITDA per shipments (EUR/t)
A resilient and profitable Services & Solutions thanks to its focus on services and end-users
Products and services differentiation Aperam’s fundamentals
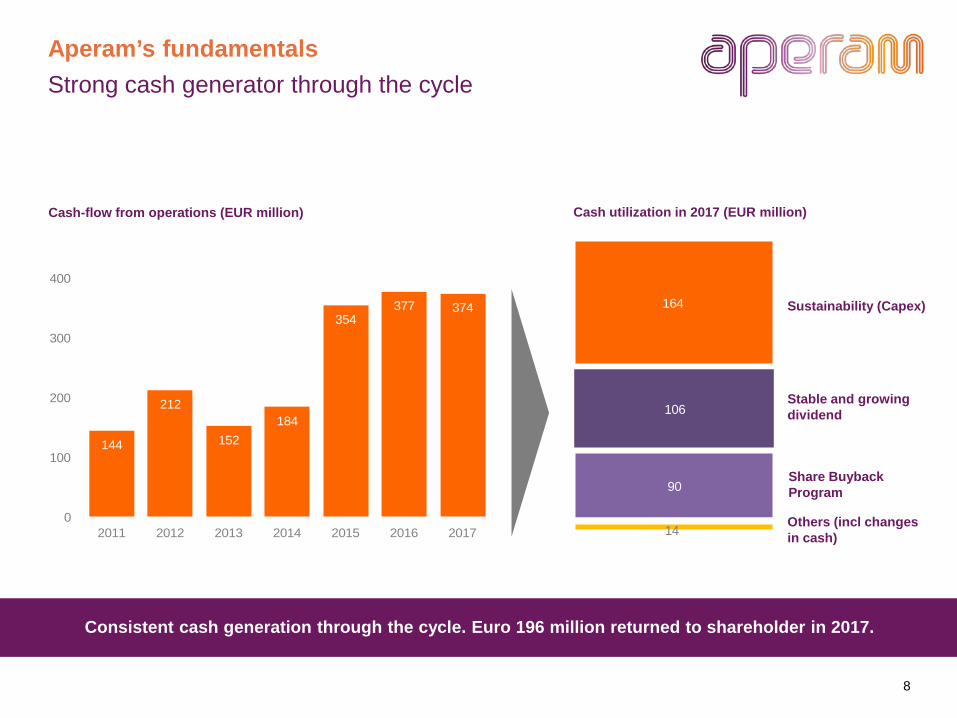
164
106
90
14
Strong cash generator through the cycle
Consistent cash generation through the cycle. Euro 196 million returned to shareholder in 2017.
Cash-flow from operations (EUR million) Cash utilization in 2017 (EUR million)
Sustainability (Capex)
Stable and growing dividend
Others (incl changes in cash)
8
Aperam’s fundamentals
Share Buyback Program
144
212
152184
354377 374
0
100
200
300
400
2011 2012 2013 2014 2015 2016 2017

BofAML Global Metals, Mining & Steel Conference
Environment and markets

10 Source: SBB/Platts * Prices exclude VAT
European Stainless steel prices continued to rise in the first quarter driven by raw materials, however increasing gap with China
Nickel - LME Cash (USD/t)
Chinese versus European CR 304 2B 2mm coil transaction price* (USD/t)
Chinese prices European prices
5.000
10.000
15.000
20.000
25.000
30.000
35.000
1500
2000
2500
3000
3500
4000
4500
5000
Stainless steel prices Environment and markets

0
100
200
300
400
500
2013 2014 2015 2016 2017
Diminishing raw material advantage of Chinese players
Chinese NPI production has reduced, affecting Chinese cost competitiveness
Source: LME, Ferroyalloys.net, China customs, Aperam estimates
Price equivalent of Nickel contained in NPI LME Nickel price Chinese NPI production Ferronickel imports (Ni content)
11
Chinese reduced NPI production leading to increased Ferro-Nickel Imports (in kt)
Price equivalent of Nickel contained in NPI vs. LME Nickel price (USD/t)
Environment and markets
5000
7000
9000
11000
13000
15000
17000
19000
21000

0
20
40
60
80
Stainless steel demand in Europe
European demand continues to be healthy
European stainless steel demand (in million tonnes - slab equivalent)
12
Environment and markets
Stocks of CR stainless steel in Germany – quarterly average (in number of days)
Source: CRU, Aperam estimates, Eurofer
0,0
1,0
2,0
3,0
4,0
5,0
6,0
Pre-crisis level (2007) Stainless steel demand

0
1
2
3
4
5
6
7
8
9
South America USA Western Europe China
Stainless steel flat stainless steel consumption per capita (kg/year)
Brazilian opportunities
Demand in Brazil starts to show signs of recovery
13
Environment and markets
Sources: CRU, Aperam estimates, World bank data
Stainless steel Brazilian apparent consumption (in million tonnes – slab equivalent)
Stainless steel demand Pre-crisis level (2014)
0,0
0,1
0,2
0,3
0,4
0,5

Aperam’s performance
BofAML Global Metals, Mining & Steel Conference

15
The Transformation Program
Profit improvement in Q2 due to market and internal initiatives but Q3 expected to be more challenging
Additional annualized gains target by 2020 increased from EUR 125 million to EUR 150 million Capex increased from EUR 125 million to EUR 150 million
Annualized EBITDA cumulated gains (EUR million)
EUR 150 million of annualized gains by the end of 2020 EUR 13 million reached by end of Q1 2018.
Good progress on all axis
Key pillars of the Phase 3 Transformation Program
Accelerate productivity gains by implementation of latest technology and breakthough in automation with development of robotics, sensors and integrated production lines
New technologies
Realize full potential of digitized, connected and collaborative organization Promote data acquisition technology along the production route
Innovation
Leaner
Value added Services
Development of new applications and solutions.
Stainless steel one stop shop for services, supply chain transformation, e.g. Haan steel service center (Germany)
Aperam’s performance
EUR 150 million of capex over 2017-2020. Capex spent until Q1’18 EUR 20 million
13
150
0
25
50
75
100
125
150
Q1 2018 Annualized
Target end of 2018
Target end of 2019
Target end of 2020

88 76 53
103 85
Q1 2017 Q2 2017 Q3 2017 Q4 2017 Q1 2018
0,99
16
Quarter on Quarter evolution of profitability
Solid operating performance and net result
Adj. EBITDA evolution[1] (EUR million)
Net Income evolution (EUR million)
[1] Adjusted EBITDA excludes EUR 8 million one-off charge mainly related to indirect taxes amnesty settlements in Brazil in Q3 2017
X Basic EPS ( USD)
0,65
1,00
1,13 1,22
Aperam’s performance
160 154 115 130 141
Q1 2017 Q2 2017 Q3 2017 Q4 2017 Q1 2018
Adj. EBITDA from operations Adj. EBITDA as % of Sales
13,4% 13,4%
11,2% 11,7% 11,6%

160 154
115 130 141
Q1 2017 Q2 2017 Q3 2017 Q4 2017 Q1 2018
119111
21 2111 14
Q4 2017 Q1 2018 Q4 2017 Q1 2018 Q4 2017 Q1 2018
486478 477
495
517
Q1 2017 Q2 2017 Q3 2017 Q4 2017 Q1 2018
17
First quarter operating performance
[1] Difference with total Aperam’s quarterly EBITDA comes from the Others & Eliminations [2] Adjusted EBITDA excludes EUR 8 million one-off charge mainly related to indirect taxes amnesty settlements in Brazil in Q3 2017
Stainless & Electrical Services & Solutions Alloys & Specialties
Adjusted EBITDA[2] (EUR million)
EBITDA of 273 EUR/t in Q1 2018, higher than 263 EUR/t in Q4 2017
Q1 2018 EBITDA per division (EUR million) [1]
Shipments (‘000t)
Aperam’s performance

76
48
16 10
12
21
23 30
88
69
39 40
2014 2015 2016 2017Cash interest and financing costs
Amortization of convertible bonds premium and arrangement fees
Strong balance sheet with significantly improved financing costs
Steep decline in financing costs thanks to a fully restructured balance sheet. Convertible bonds 2020 converted into shares by mid October 2017.
18
CB 2020
Aperam’s performance
Aperam debt reduction / restructuring actions Strong decrease of net interest and financing costs, especially cash interest costs, thanks to strong cash flows and debt reduction / restructuring actions taken since 2014, adding to further strong momentum on EPS and free cash flow generating capability of Aperam:
Convertible Bond Ornane of USD300m issued in June 2014 at
coupon of 0.625% and premium of 32.5%
High Yield Bonds of USD250m with coupon of 7.375%, maturing in 2016 reimbursed as of 1st Oct 2014,
High Yield Bonds of USD250m with coupon of 7.75%, maturing in 2018 reimbursed as of 1st Apr 2015,
Switch from Secured Borrowing Base Facility (3 year) of USD 400m to Unsecured Revolving Credit Facility (5 year) of EUR 300m
Convertible Bonds 2020 (Face value USD 198 million) have been converted by mid October 2017 resulting in issuance of 9.4m new shares. Bonds amounting to USD 2 million were redeemed at par.
Net interest & financing costs (EUR million)

19
Profit improvement in Q2 due to market and internal initiatives but Q3 expected to be more challenging
Net debt and gearing evolution (EUR million)
A net cash company with sustainable and resilient cash flow generation
799 679 619
501 442 290
147 -63 -32
29%
26% 26%23%
20%
14%
6%
-2% -1%
2010 2011 2012 2013 2014 2015 2016 2017 Q1 2018
Net debt Gearing
2,58 2,37
3,68
2,28
1,08
0,64 0,32
-0,11 -0,06
2010 2011 2012 2013 2014 2015 2016 2017 Q1 2018
Solid and continuously improving balance sheet Aperam’s performance
Aperam Net Debt / LTM Ebitda evolution, x

BofAML Global Metals, Mining & Steel Conference
Aperam’s value strategy: A customer driven company focused on its self-help story

21
Profit improvement in Q2 due to market and internal initiatives but Q3 expected to be more challenging Transform the company to achieve the next structural profitability improvement through its new strategic phase, the Transformation Program
Aperam Missions
Aperam continuously reinforced Leadership Journey®
Be a sustainably safe company
Deliver best in class profitability and returns
Be the preferred Supplier
1
2
3
2011-2013: LJ phase 1 - Restructuring
2014-2017: LJ phase 2 – Asset upgrade
1
2
Total target gains
USD 350m
USD 225m
2018-2020: Leadership Journey® phase 3 - TRANSFORMATION
3 EUR 150m
Aperam’s value strategy The Transformation Program

A global, diversified and integrated platform
Reinforcing our industry-leading asset portfolio Aperam’s value strategy
Stainless & Electrical Steel
Alloys & Specialities
Services & Solutions
Proforma Revenue by division 1, 2 (FY17)
Proforma EBITDA by Division (FY 17)
∙ Second largest stainless steel producer in Europe
∙ Largest stainless steel producer in South America
∙ Global specialty alloys producer
∙ Fully integrated asset base
∙ Production sold globally, downstream operation located in Europe and Asia
∙ Extensive market penetration being close to customers
Europe
Brazil
Aperam Alloys Imphy
Service Centers, Distribution and
Tubes
VDM Metals
22
The enlarged Alloys &
Specialities division
The enlarged Alloys &
Specialities division
1. Aperam figures based on last audited FY2017 ending December 31, 2017 and VDM figures based on last Audited FY2017 ending September 30, 2017 2. Revenues based on VDM net sales from alloys production and other activities, but excluding Nickel trading sales

A transforming and value-unlocking transaction for Aperam while maintaining a strong balance sheet consistent with investment grade ratios
VDM Metals: a transformative acquisition Aperam’s value strategy
• Total Enterprise Value of €596m incl. €123m of pension liabilities, €35m net financial debt, purchase price €438m • Equivalent to 7.8x EV/EBITDA before synergies, based on audited year-ended 30 September 2017 EBITDA €76m (LTM
28 February 2018 EBITDA is €81m) • Book value of €225m for Operating Working Capital as of 30 September 2017 • Locked Box as of 30 September 2017: VDM’s subsequent economic results and cash flows to buyer’s account
Value consideration
Financing • All cash and debt financed • Aperam will continue to maintain a strong balance sheet consistent with investment grade ratios with a pro forma
NFD/EBITDA of 0.7x as of 31 December 2017
• Standard regulatory approvals including merger control approvals • Transaction approved by the Board of Directors
Conditions precedent
• Expected closing during second half of 2018 Timetable
Structure • 100% of VDM Metals Holding GmbH and related entities
• The right price & right timing • Targeting about €20m per annum of synergies by 2020 • Acquisition to be EPS and FCF enhancing from year 1 (with synergies to come on top) • Maintain existing shareholder payout policy (between 50% to 100% of EPS) with progressive dividends • Aperam believes its enlarged Alloys & Specialities division should be valued at a premium multiple to stainless steel
Value accretive deal
23

A select suite of customers in advanced industries requesting tailored, certified and highly sophisticated solutions
Specialty alloys is a growing and premium niche segment Aperam’s value strategy
EBITDA margins by Aperam division
∙ R&D intensive industry to offer innovative solutions and anticipate new applications
∙ Deeply rooted culture of close collaboration between research and industrialisation
Innovation is core to premium specialties…
…as sector is driven by highly sophisticated and evolving needs…
…providing growth opportunities and margin stability
∙ Higher growth end applications ∙ “Kilogram” market: unique products
designed to answer precise and high-tech needs globally
∙ Strong end-market diversity with increasing and evolving requirements underpinned by positive mega-trends
Cooperation contracts 37 56 93
Total registered patents 188 407 595
Sales of new products 9% 10% ~10%
Combined
Key R&D figures (based on FY17)
∙ Less exposed to commodity cycles as cost of raw materials passed through to customers
∙ Long-standing client relationships providing good visibility on volumes, and outlook with high proportion of recurring revenue
Key end-markets / application types
LNG tankers, special welding
Gas turbines, heat exchangers
Fasteners, landing gears, turbine engines
Electrical safety, sensors
Smart phones, LED TV, seals
Gearbox, fasteners, turbo chargers
Heating resistance, watches
24

A global, high value added business within the Group’s portfolio
A global specialty alloys producer Aperam’s value strategy
Sales by region (FY17 PF1)
Sales by end-market (FY17 PF1)
Multiple optimisation opportunities and broad value
chain improvement
Well-invested complementary industrial footprint enhanced by
value-added downstream operations
Technical expertise and global sales force with regional
specialists for customer support
Potential to enhance presence in developing countries
! Altena Rod & Bar, Plate Werdohl Strip, Wire Siegen Hot Rolling, Plate
Unna Melting, Forging,
Rod & Bar Duisburg
Slab Rolling
Reno Rod, Bar
Florham Park Melting
ICS Industrial
clads
Imhua Transformation workshop
Rescal Wire drawing
Amilly Magnetic parts
Imphy Meltshop, Wire mill,
Cold rolling, Bars, R&D
Notes: 1. Aperam Alloys figures based on last Audited FY2017 ending December 31, 2017 and VDM figures based on last Audited FY2017 ending September 30, 2017 25
Aperam A&S facilities Aperam A&S sales and assistance VDM facilities VDM sales and assistance

26
Aperam’s value strategy Investment project
Profit improvement in Q2 due to market and internal initiatives but Q3 expected to be more challenging Investment project to further transform Aperam’s footprint
2018 CAPEX spend remains within earlier global guidance range between EUR 185 million to EUR 200 million
Genk cold rolling and annealing line
• On January 30, 2018, Aperam announced a new investment project in its Genk plant (Belgium) consisting in new Cold Rolling and Annealing and Pickling Line.
• The investment project targets to further facilitate transformation of our business with state of the art modern lines using latest technology, to enlarge our product range to the most demanding applications, to improve lead-time and flexibility to the market demand, to increase efficiency and cost competitiveness of our assets, and to continuously enhance our health, safety and environmental impact.
• An investment of about EUR 100 million, completion expected by early 2020

Leverage Aperam’s unique position in Europe
Closest location to major scrap generating regions as well as major stainless consumers in Europe
Outokumpu
Acerinox
Aperam
Finishing line Steel making
Terni
European stainless steel industry footprint after restructuring Key strengths of the European operations of Aperam
Sourcing
Logistics
• The only integrated upstream operations in the heart of Europe, with the best access to scrap supply
• Best location to serve the biggest consumption areas of Europe
• Performant logistics between sites for a working capital management at the benchmark of the industry
Production
• Full range of products with flexible capacity
• Enhancing recycling with scrap in line with objectives of circular economy
• A strategy to be a cost benchmark on the key products of Aperam
27
Aperam’s value strategy

The mitigation plan has enabled to largely offset the negative impacts of the economic trough since 2015 with continued solid double digit EBITDA margin (much higher than most of USA players)
Key pillars of the mitigation plan in Brazil
Portfolio management
Domestic penetration
• Preferred supplier plan with best in class deliveries,
• Performant logistics with integrated service centers
• Support stainless steel substitution in South America
Cost competitiveness
• Ensure full utilisation rate with the best margin thanks to a wide range of products and geographical sales optimisation
• Develop new grades with higher added value (stainless substitution, HGO)
• Sustain the cost benchmark in its main markets
• Leadership Journey® on-going to improve productivity
• Continuous improvement to at least compensate the inflation
Aperam’s assets optimisation in South America
Active mitigation of the Brazilian economic situation
28
Aperam’s value strategy
Timoteo meltshop 900kt capacity
• Stainless steel
• Electrical steel • Non grain oriented • Grain oriented • High grain oriented *
• Special carbon
Product mix Geographical mix
• Brazilian asset running at optimal utilisation rate with the current demand • Projects on-going to debottleneck the cold rolling operations • Upgrade of the Grain Oriented products with the development of HGO • Continuous margin optimization between products mix and deliveries in South America
Brazilian penetration
Exports

Sustainability is fully embedded in Aperam Strategy Aperam’s value strategy
[1] For the seventh consecutive year, Aperam South America was selected as one of the best companies to work for by Guia Você S/A, in recognition of our work on employee health and wellbeing. [2] Per ton of crude steel
• CO2 intensity[2] reduction >34% - almost at target to -35% by 2020 vs. 2007, thanks to maximal usage of own charcoal.
• Energy intensity[2] reduction: >8% (from 6% in 2016) - on track towards our target at -10% by 2020 vs. 2012
• 93% reuse/recycle performance - target at 100%.
• 95.3% of water in closed circuits (stable vs. 2015)
• Steep decrease in Dust emissions >22% vs. 2015 due to a strong action plan.
• LITFR : 1.42 (vs. 1.46 in 2016) - target at 1 (all employees).
• 84% of our employees recommend Aperam as a good place to work, which confirms our rating among Brazilian top employers. [1]
• Absenteeism: 2.19 (as in 2016) - target at 2.
• 2017 Performance review: 99% of Exempts, 84% of White collars, 68% of Blue collars - target at 100%.
• 2017 Training hours +4% (vs. 2016)
• Best practice in Corporate Governance reflected in our:
> Board composition > Risk management approach > Extensive Compliance plan
• Strong Customer & Innovation focus with +20 pt in % of sales in new products vs. 2015
• CSR indicators cascaded within the entire organisation.
• Leadership/Excellence level 2017 ESG ratings
Our People are our greatest asset.
Their Safety is our priority, their development is a key
to our success.
Social
We provide the “greenest steels” and constantly reduce our production costs and
impacts.
We lead by example and maintain constant
engagement with all our Stakeholders in quest of
mutually beneficial solutions.
Environment Governance
29

Remaining excess cash will be utilized in the most optimal way 4 Extra cash utilization
A base dividend, anticipated to progressively increase over time (as the company continues to benefit from its strategic actions and capture growth opportunities). The company targets a NFD/EBITDA ratio of <1x (through the cycle). In the (unlikely) event that NFD/EBITDA exceeds 1x then the company will review the dividend policy
Dividend policy
Invest in sustaining and upgrading the company’s assets base to continuously reinforce Transformation Program and Top Line Strategy
Company sustainability
Share buyback of USD 100 million / 1.8 million shares
in 2018
CAPEX 2018 reaffirmed at EUR 185 - 200 million
Compelling growth and M&A opportunities with high hurdle rate 3 Value accretive growth & M&A
VDM Purchase Price EUR 438 million
2018 Financial Policy
Dividend per share of USD 1.80 per share
Aperam preserves its financial policy and strong credit profile while maximising the long-term growth and value accretion for shareholders
Aperam’s value strategy
Aperam captures value accretive opportunities while continuing a solid financial policy with a strong balance sheet and while maintaining a total payout to shareholders between 50% to 100% of EPS
30

BofAML Global Metals, Mining & Steel Conference Q&A

Brazilian protections against unfair market behaviour
Tariff measures to support fair market environment in Brazil
Sources: SBB/Platts, Steelfirst
Environment and markets
Type of products Import duties status Anti-dumping status
Stainless Steel Flat Products
Normal import duties are 14% AD duties starting October 4th, 2013 for 5 years from 236 USD/t to 1,077 USD/t. The case involves CR 304 and 430, in thicknesses between 0.35mm and 4.75mm from China, Finland, Germany, Korea, Taiwan and Vietnam.
Stainless Steel Welded Tubes
14% of Import duties Stainless Steel welded tubes. AD duties starting July 29th, 2013 for 5 years and up to 911USD/t. Countries involved are China and Taiwan.
Electrical steel – Non Grain Oriented
14% of Import duties on NGO.
AD duties imposed for NGO on July 17th 2013 with fixed USD/t values ranging from 133 USD/t to 567 USD/t for 5 years. The countries involved are China, Korea and Taiwan.
On August 15, 2014, Camex released NGO AD partially, giving 45Kt of imports in the next 12 months without AD penalties.
On November 4, 2015, Brazilian authorities decided to end up the existing quota of imports without AD and fixed the AD duties from 90 USD/t to 132,5 USD/t
Electrical steel – Grain Oriented
Normal import duties are also 14%
32

European Union measures since 2014
Recent reinvestigation shows the European will to fight against unfair trade behaviour
Source: http://trade.ec.europa.eu/doclib/press/index.cfm?id=1823
http://www.eurofer.be/News%26Media/Press%20releases/20150827%20antidumping%20SSCR%20China%20Taiwan.fhtml
Environment and markets
• On March 25, European Commission implemented provisional duties from 24-25% for China and 10-12% for Taiwan.
Anti-dumping duties were applicable during this period with regularisation to be done once final decision would be taken.
• On August 27, 2015, the European Commission Implementing Regulation largely confirmed existing provisional measures and imposes definitive anti-dumping duty rates of up to 25.3% on SSCR imports from China, and up to 6.8% on imports from Taiwan.
• On August 11, 2016, the European commission announced that they initiated an absorption reinvestigation concerning imports of stainless steel cold-rolled flat products originating in Taiwan. On April 11, 2017, the European Commission confirmed the duties against Taiwan until at least August 2020.
“China and Taiwan have a structural overcapacity problem, and have been using the openness of the EU market to shed their excess production. This dumping has seriously undermined the profitability of the European stainless steel industry, and has ensured that European producers have not faced a level playing field for their products.”
Said EUROFER Director General Axel Eggert.
Anti-dumping development in Europe
33
SafeGuard Measures in Europe • The European Commission on 26 March 2018 initiated a safeguard
investigation on imports of steel products into the EU from all origins. It will in principle be concluded within 9 months; should provisional measures prove necessary, they can be adopted at short notice


![[ba] Validity date from [BA] COUNTRY [ba] Viet Nam 00068 ... · PDF file[ba] Name [ba] City [ba] Regions [ba] Activities [ba] Remark [ba] Date of request ... DL 115 Nha Trang FISCO](https://img.pdfslide.us/doc/110x75/5a791ef27f8b9a9d218e108a/ba-validity-date-from-ba-country-ba-viet-nam-00068-ba-name-ba-city.jpg)


![Untitled-1 [arkajainuniversity.ac.in] · 1 day ago · no_i. program b.opto b.tech-cse ba-eco ba-eng ba-eng ba-eng ba-fd ba-fd ba-jmc ba-jmc bba bba bba enrollment number aju/180873](https://img.pdfslide.us/doc/110x75/5fa3d6ad3d265943075a4ee9/untitled-1-1-day-ago-noi-program-bopto-btech-cse-ba-eco-ba-eng-ba-eng.jpg)