Embed Size (px)
Citation preview
Boeing-SMART Test Report for
DARPA Helicopter Quieting Program
August 21, 2009
Benton H. Lau, Nicole Obriecht, Tanner Gasow, Brandon Hagerty, and Kelly C. Cheng
Aeromechanics Branch NASA Ames Research Center
Moffett Field, California
Ben W. Sim UARC/AFDD
Ames Research Center Moffett Field, California

Report Documentation Page Form ApprovedOMB No. 0704-0188
Public reporting burden for the collection of information is estimated to average 1 hour per response, including the time for reviewing instructions, searching existing data sources, gathering andmaintaining the data needed, and completing and reviewing the collection of information. Send comments regarding this burden estimate or any other aspect of this collection of information,including suggestions for reducing this burden, to Washington Headquarters Services, Directorate for Information Operations and Reports, 1215 Jefferson Davis Highway, Suite 1204, ArlingtonVA 22202-4302. Respondents should be aware that notwithstanding any other provision of law, no person shall be subject to a penalty for failing to comply with a collection of information if itdoes not display a currently valid OMB control number.
1. REPORT DATE 21 AUG 2009 2. REPORT TYPE
3. DATES COVERED 00-00-2009 to 00-00-2009
4. TITLE AND SUBTITLE Boeing-SMART Test Report for DARPA Helicopter Quieting Program
5a. CONTRACT NUMBER
5b. GRANT NUMBER
5c. PROGRAM ELEMENT NUMBER
6. AUTHOR(S) 5d. PROJECT NUMBER
5e. TASK NUMBER
5f. WORK UNIT NUMBER
7. PERFORMING ORGANIZATION NAME(S) AND ADDRESS(ES) Army Research, Development & EngineeringCommand,Aeroflightdynamics Directorate,Ames ResearchCenter,Moffett Field,CA,94035
8. PERFORMING ORGANIZATIONREPORT NUMBER
9. SPONSORING/MONITORING AGENCY NAME(S) AND ADDRESS(ES) 10. SPONSOR/MONITOR’S ACRONYM(S)
11. SPONSOR/MONITOR’S REPORT NUMBER(S)
12. DISTRIBUTION/AVAILABILITY STATEMENT Approved for public release; distribution unlimited
13. SUPPLEMENTARY NOTES
14. ABSTRACT
15. SUBJECT TERMS
16. SECURITY CLASSIFICATION OF: 17. LIMITATION OF ABSTRACT Same as
Report (SAR)
18. NUMBEROF PAGES
74
19a. NAME OFRESPONSIBLE PERSON
a. REPORT unclassified
b. ABSTRACT unclassified
c. THIS PAGE unclassified
Standard Form 298 (Rev. 8-98) Prescribed by ANSI Std Z39-18

2
Nomenclature
A Rotor disk area, πR2, ft2
CT Rotor thrust coefficient, parallel to the rotor shaft, T/ρA(ΩR)2
CP Rotor power coefficient, P/ρA(ΩR)3
Madv Advancing tip Mach number, (V+ΩR)/a
Mtip Hover tip Mach number, ΩR/a
R Rotor radius, 16.925ft
SR Blade reference area, 67.49ft2
V Wind-tunnel speed, ft/s
a Speed of sound, ft/s
c Blade constant section chord, 10in
cf Active flap chord, 0.35c
r, ψ, θ Spherical coordinate system, +r radially out (ft), +ψ azimuthal angle (deg), +θ above reference plane (deg)
t Airfoil thickness
x, y, z Cartesian coordinate system, +x downstream, +y starboard, +z up, ft
Ω Rotor rotational speed, rpm
αsu, αsc Uncorrected and corrected shaft angle-of-attack, positive tilting back, deg
β Actuated flap deflection or harmonic flap amplitude, positive down, deg
µ Advance ratio, V/(ΩR)
φ Harmonic phase of flap actuation, deg
ψ Βlade azimuth angle, positive counter-clockwise with zero at downstream, deg
ρ Air density, slug/ft2
σ Rotor solidity, SR/πR2, 0.075
Subscript
a Coordinate system reference to advancing blade tip
h Coordinate system reference to hub center
k Blade number index, 1 to 5
n Harmonic index (0 to N) or harmonic frequency (per rev)
boe Boeing convention
rdms NASA/RDMS convention

3
Introduction
The Tactical Technology Office of the Defense Advanced Research Projects Agency (DARPA) initiated the Helicopter Quieting Program (HQP) in 2004 to develop high fidelity, state-of-the-art computational tools for designing advanced helicopter rotors with reduced acoustics perceptibility and enhanced performance. A critical step towards this achievement is the development of high-end rotorcraft prediction codes capable of assessing a wide range of helicopter configurations and operations for future rotorcraft designs. This includes novel next-generation rotor systems that incorporate innovative passive and/or active elements to meet future challenging military performance and survivability goals.
Phase I of the HQP program involved development of prediction methodologies (“tools”) by coupling computational structural dynamics (CSD) to computational fluid dynamics (CFD) modeling codes. Participants (vendors) included joint efforts by Stanford University/University of Maryland (SM), as well as Georgia Institute of Technology/Pennsylvania State University (GP) and Teledyne Sciences Corporation (TSC). Phase I was primarily geared towards validating these prediction tools for conventional rotors currently in use by the fleet. Results from the vendors demonstrated significant improvements in prediction accuracy and correlations [1] over classical comprehensive methods in all aspects of the aerodynamics, structural and acoustics responses of the rotor.
Phase Ib1 was initiated in 2007 to demonstrate the robustness of HQP tools in the characteristics of unconventional rotor designs that utilize innovative on-blade active controls for dynamic tuning. An active flap rotor currently under-development at Boeing (i.e. the Boeing SMART rotor) was selected as the candidate for this code validation effort. Vendors were asked to make blind predictions prior to full-scale rotor testing in the 40- by 80-Foot Wind-Tunnel of the National Full-Scale Aerodynamics Complex (NFAC) at NASA Ames Research Center. This report details experimental data acquired from the SMART test and presents the acquired data in HQP-specific formats to enable correlations/comparisons with vendors’ predictions.
HQP Phase Ib Test Conditions
Table 1 lists the five flight cases prescribed by DARPA/HQP for Phase Ib code validation effort with the Boeing SMART rotor. Test conditions include low-to-high rotor speeds and descending flight configurations with and without active-flap operations. These test conditions offer variations in shaft angle, thrust, wind speed, and trailing-edge flap settings2. Cases designated with SMART in the header pertain to conditions with active-flap excitations. The MDART case refers to a no-flap excitation case (i.e. 0° flap deflection) to simulate a base-line condition [2]. For each of the selected test cases, DARPA required data from three in-plane microphones, rotor performance, control inputs, and blade structural loads [3].
Boeing-SMART Rotor Hardware
The SMART rotor test in the NFAC wind tunnel was a joint effort by DARPA, NASA, Army, and Boeing, with participations from the University of California at Los Angeles, Massachusetts Institute of Technology, and the University of Maryland. A modified full-scale MD 902 Explorer rotor with on-blade piezoelectric-actuated trailing-edge flap was used to demonstrate the capabilities of active-flap technology in forward flight.
The 5-bladed bearingless rotor has an HH-10 (12% thick) airfoil at the in-board section and an HH-06 (9.5% thick) airfoil at the outboard section. The blade region from 0.93R to the tip has a parabolic leading-edge sweep (22° at the tip) with straight trailing edge and a 2:1 taper ratio. Table 2a lists a summary of the SMART rotor characteristics [4].
1 HQP Phase Ib has only two participants: one team from Stanford University/University of Maryland (SM) and another from Georgia Institute of Technology/Pennsylvania State University (GP). 2 Following Boeing’s definition, the active flap deflection angle (βk) resulting from a commanded flap schedule of harmonic magnitude (βn)/frequency (n)/phase (φn boe) combination is mathematically expressed as βk(ψk) = Σn βn⋅sin(n⋅ψk+φn boe).

4
Case CT/σ αsc µ Matip Flap schedule
MDART 0.080 -9.1° 0.30 0.805 βk=0° SMART 1 0.080 -9.1° 0.30 0.805 βk=2°⋅sin(5⋅ψk+90°) SMART 2 0.080 -9.1° 0.30 0.805 βk=2°⋅sin(3⋅ψk+60°) SMART 3 0.070 -9.1° 0.38 0.805 βk=1°⋅sin(5⋅ψk+180°) SMART 4 0.075 +1.5° 0.20 0.746 βk=2°⋅sin(2⋅ψk+240°)+1°⋅sin(5⋅ψk+330°) k=blade index 1 to 5
Table 1. Prescribed flight conditions for DARPA HQP Phase Ib.
The active flap, which spanned radially between 0.74R to 0.92R, has a 25% chord with the piezoelectric actuators embedded in the blade spar at 0.74R (figure 1). The actuators are designed to drive the trailing-edge flap at frequencies from two-per-rev (2P) up to six-per-rev (6P) with as much as a 6° amplitude. A continuous-time higher harmonics controller (CTHHC) developed by Hall et al. [5] was used to individually command the desired active flap angle of each blade [6]. Table 2b summarizes the active-flap characteristics.
(a) Rotor Rotor Modified MD 900 Hub type Bearingless Number of blade 5 Radius, ft 16.925 Blade chord, in 10 Airfoil HH-10, t/c=12%; r/R<0.74
HH-06, t/c=9.5%; r/R>0.84 Tip sweep Parabolic leading-edge, r/R>0.93; 22° at tip Tip taper 2:1 straight trailing-edge Twist rate -10°
Rotor solidity 0.075 Nominal rotor speed, rpm 392 Nominal tip speed, ft/s 695 Nominal thrust, lbf 5811 Nominal CT/σ 0.075 (b) Active flap Radial span 0.739≤r/R≤0.916 Chord, cf 0.35c Hinge location 0.75c Flap twist axis 1.0 in aft of flap leading-edge Control horn length, in 0.75 Max. flap angle ±6° Flap weight, lbm 1.26
Table 2. Boeing SMART characteristics (a) rotor, (b) active flap.
Test Setup
The 11-week long test in the NFAC wind tunnel began in February of 2008. The SMART rotor was installed on the Large Rotor Test Stand (LRTS) with the rotor hub 23.8 ft above the acoustic lining of the tunnel floor. The LRTS was supported by two main front-struts and a telescoping tail-strut. Tail-strut retraction provided positive, uncorrected shaft angle-of-attack (αsu) for the LRTS. Connected by a vertical test-stand strut, the LRTS consisted of an upper and a lower housings. The upper housing enclosed the rotor balance and hydraulic servo-actuators for the rotor control system while the lower housing enclosed a 1,500-HP General Electric motor and its transmission. A five-component rotor balance was mounted on top of a static mast that connected to the rotor

5
hub in the upper housing. The balance measured three forces (lift, drag, and side) and two moments (pitch and roll). Torque was passed directly to the rotor hub through the rotating drive shaft that was confined in the static mast. Rotor torque was measured on the flex coupling between the drive shaft and the rotor. Figure 2 shows the model installation in the NFAC wind-tunnel.
Figure 1. Boeing SMART rotor with active trailing-edge flaps in the NFAC 40-Ft-by-80-Ft Wind-Tunnel.
Figure 2. Boeing-SMART rotor mounted on the LRTS in the wind tunnel.
Instrumentation
During the Boeing-SMART rotor test, a set of microphones was strategically placed around the model to capture rotor noise sources of interest (figure 2). These microphones were grouped into: a) out-of-plane fixed microphones (M1 and M4) to correlate to microphones used previously in the MDART test [2], b) traverse microphones (M5 through M12) that can be moved along guided rails for out-of-plane blade-vortex interaction noise mapping, and c) in-plane microphones (M13, M15 and M14) for low-frequency, in-plane rotor-noise measurement. Microphones M13, M15 and M14 were mounted on tower struts to be near in-plane of the rotor (approximately 10° below wind-tunnel horizon). These microphones were also intentionally positioned along a straight line originating from the advancing blade tip to the tunnel centerline (figure 3) to help determine near-field/far-field characteristics of in-plane rotor noise. With the exception of M14, all microphones are located within the acoustically-treated portion of the 40-by-80-Ft test section. Summaries of the microphone positions, relative to both the rotor hub center and to the advancing blade tip (both at zero shaft tilt), are illustrated in tables 3a and 3b respectively. To account for non-zero shaft tilt angle (αsu), the microphone coordinates must be transformed accordingly using the pivot point located 163 inches below the rotor hub.

6
Figure 3. Top view of the test setup of the microphone layout with rotor hub at αsu = 0º.
Mic. No. xh, ft yh, ft zh, ft rh, ft rh/R ψh, deg θh, deg Notes
M1 -29.67 10.27 -17.94 36.16 2.14 160.9 -29.7 Fixed M4 -27.92 15.59 -17.87 36.63 2.16 150.8 -29.2 Fixed M5 16.73 6.97 -15.13 23.61 1.39 157.4 -39.9 Traverse M6 -16.73 9.79 -15.13 24.59 1.45 149.7 -38.0 Traverse M7 16.73 12.02 -15.13 25.56 1.51 144.3 -36.3 Traverse M8 -16.73 14.17 -15.13 26.64 1.57 139.7 -34.6 Traverse M9 -16.73 16.42 -15.13 27.90 1.65 135.5 -32.8 Traverse
M10 -16.73 18.67 -15.13 29.28 1.73 131.9 -31.1 Traverse M11 -16.73 20.90 -15.13 30.75 1.82 128.7 -29.5 Traverse M12 -16.73 23.92 -15.13 32.88 1.94 125.0 -27.4 Traverse M13 -29.67 10.27 -5.34 31.85 1.88 160.9 -9.7 In-plane M15 -38.77 8.73 -7.13 40.38 2.39 167.3 -10.2 In-plane M14 -80.38 -0.33 -14.84 81.72 4.83 180.2 -10.5 In-plane
Table 3a. Hub-centered microphone position at αsu= 0°.
Mic. No. xa, ft ya, ft za, ft ra, ft ra/R ψa, deg θα, deg Notes
M1 -29.67 -6.43 -17.94 35.26 2.11 192.2 -30.6 Fixed M4 -27.92 -1.11 -17.87 33.17 1.99 182.3 -32.6 Fixed M5 -16.73 -9.73 -15.13 24.57 1.47 210.2 -38.0 Traverse M6 -16.73 -6.91 -15.13 23.59 1.41 202.4 -39.9 Traverse M7 -16.73 -4.68 -15.13 23.04 1.38 195.6 -41.1 Traverse M8 -16.73 -2.53 -15.13 22.70 1.36 188.6 -41.8 Traverse M9 -16.73 -0.28 -15.13 22.56 1.35 181.0 -42.1 Traverse
M10 -16.73 1.97 -15.13 22.64 1.36 173.3 -41.9 Traverse M11 -16.73 4.20 -15.13 22.94 1.37 165.9 -41.3 Traverse M12 -16.73 7.22 -15.13 23.68 1.42 156.7 -39.7 Traverse M13 -29.67 -6.43 -5.34 30.82 1.85 192.2 -10.0 In-plane M15 -38.77 -7.97 -7.13 40.22 2.41 191.6 -10.2 In-plane M14 -80.36 -17.03 -14.84 83.47 5.00 192.0 -10.2 In-plane
Table 3b. Advancing blade tip-centered microphone positions at αsu= 0°.
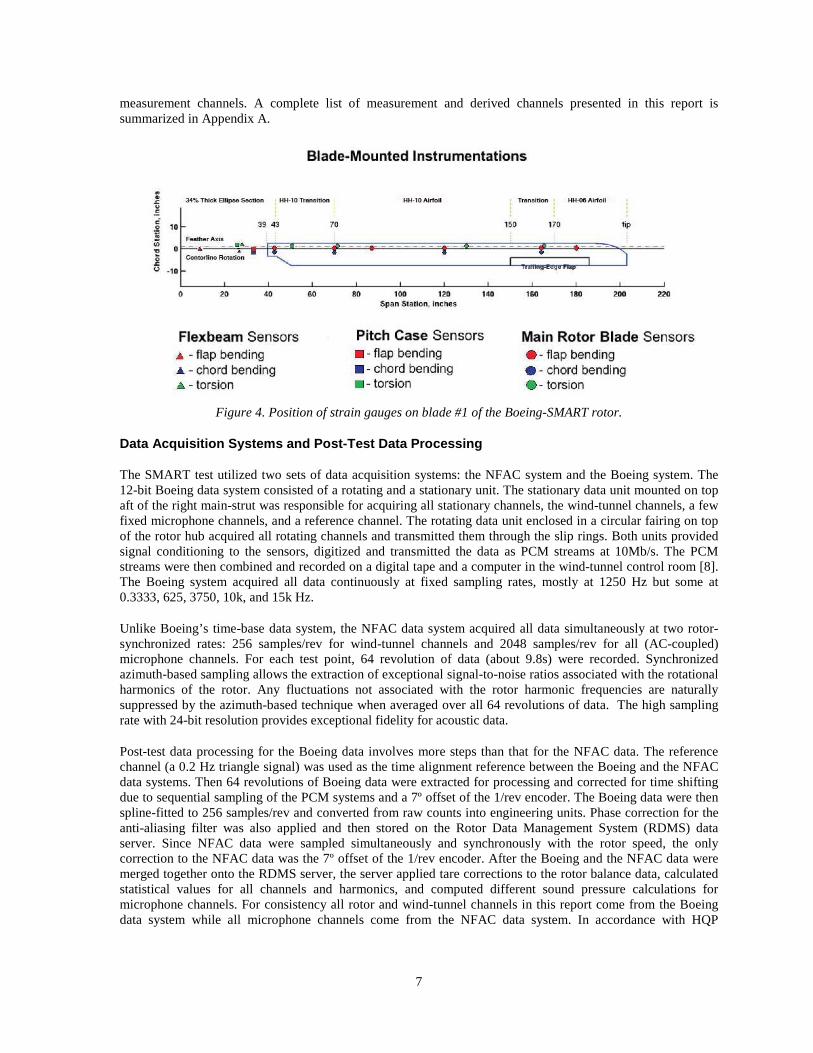
In addition to the microphone and the rotor-balance channel measurements, other measurements included the rotating-blade channels, the stationary channels, and the wind-tunnel channels. Since blade #1 was the primary blade, it was fully instrumented with rotating-blade channels including the flap, the lag, and the torsional strain gauges on the flex beam, the pitchcase, and the blade at various stations as shown in figure 4. During the test, the critical flap-bending gauge on the flex beam at station 9 at r/R=0.044 was used by the rotor operator to manually minimize blade flapping and hence hub moments at the desired test point [7]. An active backup channel of the same strain gauge on blade #2 was also acquired. Other rotating channels included the active-flap position of each blade measured through LVDT sensor, the input voltage and current to the piezoelectric actuators. The stationary channels included the non-rotating swashplate positions, the rotor speed, the test-stand vibration, and the IRIG-B time code. The wind-tunnel channels included model shaft angle-of-attack, temperature, pressure, humidity, etc. related to the wind-tunnel condition. Beside measurement channels, there are derived channels, like air density, advance ratio, rotor collective, etc., which are calculated from multiple
7
measurement channels. A complete list of measurement and derived channels presented in this report is summarized in Appendix A.
Figure 4. Position of strain gauges on blade #1 of the Boeing-SMART rotor.
Data Acquisition Systems and Post-Test Data Processing
The SMART test utilized two sets of data acquisition systems: the NFAC system and the Boeing system. The 12-bit Boeing data system consisted of a rotating and a stationary unit. The stationary data unit mounted on top aft of the right main-strut was responsible for acquiring all stationary channels, the wind-tunnel channels, a few fixed microphone channels, and a reference channel. The rotating data unit enclosed in a circular fairing on top of the rotor hub acquired all rotating channels and transmitted them through the slip rings. Both units provided signal conditioning to the sensors, digitized and transmitted the data as PCM streams at 10Mb/s. The PCM streams were then combined and recorded on a digital tape and a computer in the wind-tunnel control room [8]. The Boeing system acquired all data continuously at fixed sampling rates, mostly at 1250 Hz but some at 0.3333, 625, 3750, 10k, and 15k Hz.
Unlike Boeing’s time-base data system, the NFAC data system acquired all data simultaneously at two rotor-synchronized rates: 256 samples/rev for wind-tunnel channels and 2048 samples/rev for all (AC-coupled) microphone channels. For each test point, 64 revolution of data (about 9.8s) were recorded. Synchronized azimuth-based sampling allows the extraction of exceptional signal-to-noise ratios associated with the rotational harmonics of the rotor. Any fluctuations not associated with the rotor harmonic frequencies are naturally suppressed by the azimuth-based technique when averaged over all 64 revolutions of data. The high sampling rate with 24-bit resolution provides exceptional fidelity for acoustic data.
Post-test data processing for the Boeing data involves more steps than that for the NFAC data. The reference channel (a 0.2 Hz triangle signal) was used as the time alignment reference between the Boeing and the NFAC data systems. Then 64 revolutions of Boeing data were extracted for processing and corrected for time shifting due to sequential sampling of the PCM systems and a 7º offset of the 1/rev encoder. The Boeing data were then spline-fitted to 256 samples/rev and converted from raw counts into engineering units. Phase correction for the anti-aliasing filter was also applied and then stored on the Rotor Data Management System (RDMS) data server. Since NFAC data were sampled simultaneously and synchronously with the rotor speed, the only correction to the NFAC data was the 7º offset of the 1/rev encoder. After the Boeing and the NFAC data were merged together onto the RDMS server, the server applied tare corrections to the rotor balance data, calculated statistical values for all channels and harmonics, and computed different sound pressure calculations for microphone channels. For consistency all rotor and wind-tunnel channels in this report come from the Boeing data system while all microphone channels come from the NFAC data system. In accordance with HQP

8
reporting guidelines, smooth time-history data are synthesized from the first 1024 harmonics for microphone channels and the first 10 harmonics for all other channels.
Data Repeatability and Selection
During the wind-tunnel test, the high-speed SMART3 case experienced unexpected high vibratory hub and blade loads. No data was collected for that particular test case. In-situ testing, as well as information from the flex-beam manufacturer, identified some discrepancies in the flex-beams used in the Boeing-SMART test as compared to the 1992 MDART test [2]. The high vibratory load issues encountered by the Boeing-SMART rotor were due to load limits pre-configured based on previous MDART rotor properties from 1992. Preliminary investigations determined that the Boeing-SMART rotor’s flex-beams were approximately four times stiffer than that on the 1992 MDART rotor [9] and the 2003 SMART rotor in the whirl-tower test [11]. All other test cases were tested successfully.
Multiple test points were acquired for each of the four cases, MDART, SMART1, SMART2, and SMART4. It was necessary to select one representative data point per HQP test case to validate vendor predictions. This process began by gathering all data points acquired for the test and categorizing them with the appropriate test case in a spreadsheet. The mean statistical data were downloaded from the RDMS data server and compared with the rotor/wind-tunnel operating parameters that are known to govern acoustics radiation to the first order [10]. Test-point selections were based on how close the mean operating conditions were to the desired HQP test conditions. Table 4 summarizes which data points remained after all the points were evaluated.
Once the data points were narrowed down, the next step was to review the flap schedule of blade #13 to ensure accordance with HQP requirements (table 1). Measured amplitudes and phases4 of the first 6 harmonics were analyzed and compared with HQP specified requirements as shown in table 5. Selected points are shown to meet the flap conditions, with the exception of run 42 points 113 and 114, of the SMART1 case. These two points did not reach the 2° amplitude specified by HQP. Due to this inconsistency, these two points were not considered for validation with vendor predictions.
Once it was determined that all selected points met HQP requirements, the final step was the selection of a representative point for each case. The process began by first reviewing the mean statistical value for the collective, lateral, and longitudinal control inputs. Initial efforts focused on whether these control parameters were held constant during multiple repeated test points. Then the rotor performance data were examined. Since the vendors modeled the pitchlink and pitchcase in their predictions, the rotor balance data corrected for weight tares were used in analysis. To select a single representative data point, the mean values for each of the rotor performance channels were tabulated for each of the four test cases. The value that was the closest to this calculated mean value was selected for each case. Due to inconsistencies in the pitch and roll moments, these channels were not used in the selection process, even though it was determined that the inconsistencies were small, given the measurement units, and the variations were insignificant. The data point that had the most selected values was chosen as the representative data point. For every case other than SMART1, there was clearly one point that would be selected for vendor validations as marked in table 6. Because of the inconsistencies discovered when reviewing the flap requirements, the SMART1 case was narrowed down to two points, making the means of selection used thus far inadequate. Run 46 point 92 was selected as the representative point for the SMART1 case because the point met HQP requirements better than run 46 point 93. Table 7 displays the test points selected for each of the four flight cases.
In addition to using mean statistical data associated with the rotor and flap settings, 64 revolution-averaged time histories were also examined to check for temporal consistencies over a rotor revolution. For the final selected points, it was necessary to confirm that they were repeatable for each revolution of data. For each flight case, the flap schedules, in-plane acoustics, rotor performance, and structural loads were plotted in groups (see Appendix B to F). The data presented in this report includes both static and oscillatory components. For blade
3 Although not shown, active-flap excitations associated with blade #2 through #5 are similar and consistent with blade #1 throughout the test. 4 Mathematical representation of flap deflection in RDMS is expressed by: βk(ψk) = Σn βn⋅cos(n⋅ψk - φn RDMS). To be consistent with HQP specifications (table 1), phase angles in table 5 were converted to Boeing’s convention (see footnote 2).

9
structural loads, the static components are not reliable because of bias from centrifugal loading. A listing of all HQP and RDMS channel names, units, and descriptions used for data acquisition, along with the coordinate conventions during data analysis, can be found in Appendix A. In reviewing these repeatability plots, the mean time histories generally demonstrated highly repeatable temporal characteristics, except for the following cases/channels:
• SMART1 case for run 42 points 113 and 114 did not achieve the specified flap amplitude during testing, but came within 87% of the target amplitude. These test points were discarded from subsequent considerations.
• M14 shows highly inconsistent variations in the acoustic data. This is most likely associated with strong wall reflections due to its location situated outside of the acoustic liner-section of the tunnel. Microphone M14 is not recommended for use in the analysis.
• SMART4 flight case showed more variability than other flight cases in all areas due to strong blade-vortex interaction occurrences. As will be shown in the following section, this variability stayed within the standard deviations.
Overall, these plots confirmed that the HQP cases were indeed repeatable and the individual selected test points are representative of the state of the rotor apt for HQP Phase Ib code validation.
DARPA HQP points
Run Pt. µ αsc Ω Mtip Madv CT/σ CP/σ MDART 0.300 -9.10 0.805 0.080 42 106 0.300 -9.12 392.2 0.620 0.805 0.079 0.0073 42 111 0.301 -9.11 392.3 0.620 0.805 0.081 0.0073 46 86 0.300 -9.11 392.3 0.620 0.805 0.082 0.0072 46 90 0.299 -9.11 392.4 0.620 0.805 0.080 0.0073 46 94 0.300 -9.11 392.4 0.620 0.805 0.080 0.0073 SMART1 0.300 -9.10 0.805 0.080 42 113 0.300 -9.12 392.5 0.620 0.806 0.079 0.0074 42 114 0.301 -9.12 392.5 0.620 0.806 0.079 0.0074 46 92 0.300 -9.12 392.4 0.620 0.805 0.080 0.0074 46 93 0.300 -9.12 392.3 0.620 0.805 0.079 0.0074 SMART2 0.300 -9.10 0.805 0.080 42 108 0.301 -9.11 392.1 0.619 0.805 0.082 0.0074 42 109 0.301 -9.11 392.1 0.619 0.805 0.081 0.0074 46 89 0.300 -9.11 392.3 0.620 0.805 0.082 0.0073 SMART3 0.375 -9.10 0.852 0.070
NA NA NA NA NA NA NA SMART4 0.200 1.50 0.746 0.075 42 31 0.202 1.50 392.7 0.621 0.746 0.075 0.0024 42 32 0.202 1.52 393.7 0.621 0.746 0.076 0.0024 61 44 0.198 1.52 401.2 0.624 0.747 0.073 0.0020 61 45 0.198 1.53 401.3 0.624 0.747 0.075 0.0020 61 47 0.198 1.54 401.3 0.624 0.747 0.076 0.0020 61 48 0.198 1.54 401.3 0.624 0.747 0.076 0.0020
Table 4. Mean values of data points based on HQP requirements (in gray shading).

10
Harmonic amplitude ( βn) and phase ( φn) of blade #1’s active flap
Harm. n 0th 1st 2nd 3rd 4th 5th 6th Run Pt β0 φ0 β1 φ1 β2 φ2 β3 φ3 β4 φ4 β5 φ5 β6 φ6
MDART 0.00 0.00 0.00 0.00 0.00 0.00 0.00 42 106 0.03 - 0.00 56.63 0.00 206.74 0.00 115.05 0.00 331.06 0.00 119.05 0.00 116.86 42 111 0.02 - 0.01 75.33 0.00 114.84 0.00 102.15 0.00 150.54 0.00 99.16 0.00 44.27 46 86 0.03 - 0.00 344.19 0.00 209.08 0.00 109.38 0.00 355.60 0.00 252.42 0.00 185.16 46 90 0.03 - 0.00 192.98 0.01 75.06 0.00 171.35 0.00 202.58 0.00 37.32 0.00 190.59 46 94 0.03 - 0.00 148.68 0.01 103.47 0.01 296.43 0.00 110.97 0.01 239.64 0.01 231.46
SMART1 0.00 0.00 0.00 0.00 0.00 2.00 90.00 0.00 42 113 0.03 - 0.00 262.91 0.00 296.68 0.00 155.17 0.00 96.58 1.72 89.27 0.00 268.77 42 114 0.02 - 0.00 159.29 0.01 4.13 0.01 268.83 0.01 173.45 1.71 89.26 0.01 241.63 46 92 0.02 - 0.00 156.12 0.00 183.00 0.00 71.55 0.00 124.46 1.99 93.88 0.00 341.17 46 93 0.03 - 0.00 213.17 0.00 278.83 0.00 166.40 0.01 83.33 1.99 94.09 0.00 265.08
SMART2 0.00 0.00 0.00 2.00 60.00 0.00 0.00 0.00 42 108 0.03 - 0.00 180.27 0.00 92.12 1.98 62.35 0.00 195.41 0.00 357.90 0.00 231.54 42 109 0.03 - 0.00 192.75 0.01 349.83 1.97 62.41 0.01 204.73 0.00 319.32 0.00 238.88 46 89 0.03 - 0.00 128.80 0.00 338.59 1.97 62.40 0.01 200.29 0.00 128.85 0.00 197.41
SMART3 0.00 0.00 0.00 0.00 0.00 1.00 180.00 0.00 NA NA NA NA NA NA NA NA NA NA NA NA NA NA
SMART4 0.00 0.00 2.00 240.00 0.00 0.00 1.00 330.00 0.00 42 31 0.01 - 0.00 314.80 1.97 241.57 0.01 21.93 0.01 309.79 1.00 334.01 0.00 111.16 42 32 0.01 - 0.00 193.15 1.97 241.30 0.01 357.97 0.00 222.77 0.99 333.27 0.00 88.52 61 44 0.01 - 0.00 227.79 2.00 241.71 0.01 9.84 0.00 142.29 0.99 334.20 0.07 129.81 61 45 0.01 - 0.00 251.55 2.00 241.80 0.01 14.59 0.00 168.45 1.00 334.35 0.07 134.42 61 47 0.01 - 0.00 237.03 1.99 241.49 0.01 3.46 0.01 80.34 1.00 333.98 0.01 91.07 61 48 0.01 - 0.01 290.85 1.99 241.76 0.00 66.49 0.00 253.82 1.00 334.59 0.00 36.03
Table 5: Comparison of measured and HQP requirements of the first 6 harmonics for blade #1’s active-flap.
Representative data point selection process using rotor performance data Run Pt COLLA LATA LONGA ROTOR
DRAGRH ROTOR
SIDERH ROTOR
LIFTRH ROTOR
TORQUE ROTOR
ROLLRH ROTOR
PITCHRH MDART
42 106 10.6 -1.8 6.3 -32.4 -133.4 5950 110968 3757 9379 42 111 10.7 -1.6 6.2 -39.1 -120.0 6060 111755 6254 9803 46 86 10.6 -1.6 5.9 -17.5 -138.4 6117 109606 6837 15506 46 90 10.6 -1.6 6.1 -66.3 -139.0 5985 109988 6264 11351 46 94 10.6 -1.6 6.1 -63.3 -138.5 6003 110094 6356 11551
MEAN NA NA NA -43.7 -133.9 6023 110482 NA NA SMART1 46 92 10.6 -1.6 6.1 -75.8 -141.0 5944 112332 5879 9446 46 93 10.6 -1.6 6.1 -74.0 -137.9 5929 112413 6181 9877
MEAN NA NA NA -74.9 -139.5 5937 112373 NA NA SMART2 42 108 10.7 -1.8 6.4 -17.0 -145.2 6129 113126 803 10697 42 109 10.7 -1.6 6.5 -47.8 -129.1 6080 113214 2504 8064 46 89 10.6 -1.6 6.1 -20.5 -148.5 6144 110896 3072 14657
MEAN NA NA NA -28.4 -140.9 6118 112412 NA NA SMART3
NA NA NA NA NA NA NA NA NA SMART4 42 31 4.7 -2.0 2.6 -178.3 -165.1 5730 37415 988 7992 42 32 4.8 -2.0 2.6 -171.7 -167.3 5839 37431 1408 6955 61 44 4.7 -1.9 2.6 -183.1 -165.4 5637 37987 1126 7913 61 45 4.7 -1.9 2.6 -183.5 -167.1 5766 37230 1370 7436 61 47 4.7 -2.1 2.5 -161.3 -177.1 5843 37265 165 9236 61 48 4.7 -2.1 2.5 -163.3 -177.6 5853 37248 70 8941
MEAN NA NA NA -173.5 -169.9 5778 37429 NA NA
Gray shading=point that is closest to mean; Bold=representative data point Table 6. Rotor performance data for test and run point evaluation.
Run Point MDART 46 94 SMART1 46 92 SMART2 42 108 SMART3 NA NA SMART4 42 32
Table 7. Summary of final selected point for each test case.

11
Data Quality and Reporting Format
Once the representative test point had been selected for each of the HQP specified test cases, the “unsteadiness” of each channel measurement due to dynamic variations associated with operating the rotor. The objective is to obtain an appropriate scatter-band that will be useful for correlating experimental data to HQP vendors’ predictions. For this purpose, the standard derivations derived from variations between revolution-to-revolution, over the entire 64-revolution duration of measurement, were computed for each channel (see Appendix G to J). This exercise yielded the following results:
• With the exception of microphone and some rotor balance/blade channels, all measurements yielded highly consistent and stable measurements during the 64-revolution duration with acceptable small scatter-band.
• Microphone channels in general were found to have larger scatter-bands than other channels. This is especially apparent for microphone M15 where the measured rotor noise signal is obscured by large amplitude fluctuations manifesting at very low frequencies (figure 5a). Further examination revealed that these low frequency contents are associated with the background noise of the facility and instrumentation self-noise, and are not directly due to the operation of the rotor. To remove these non-rotor related noise content, a band-pass filter, that preserves only the noise content at integer-harmonic numbers, was applied to the entire 64-revolutions of data, prior to revolution-based averaging. As shown in figure 5b, this band-pass approach significantly reduces the scatter-band, but does not affect the 64 revolution-averaged time history. (Note: All acoustic channel plots shown in Appendices G to J reflect the effects of the band-pass filter.)
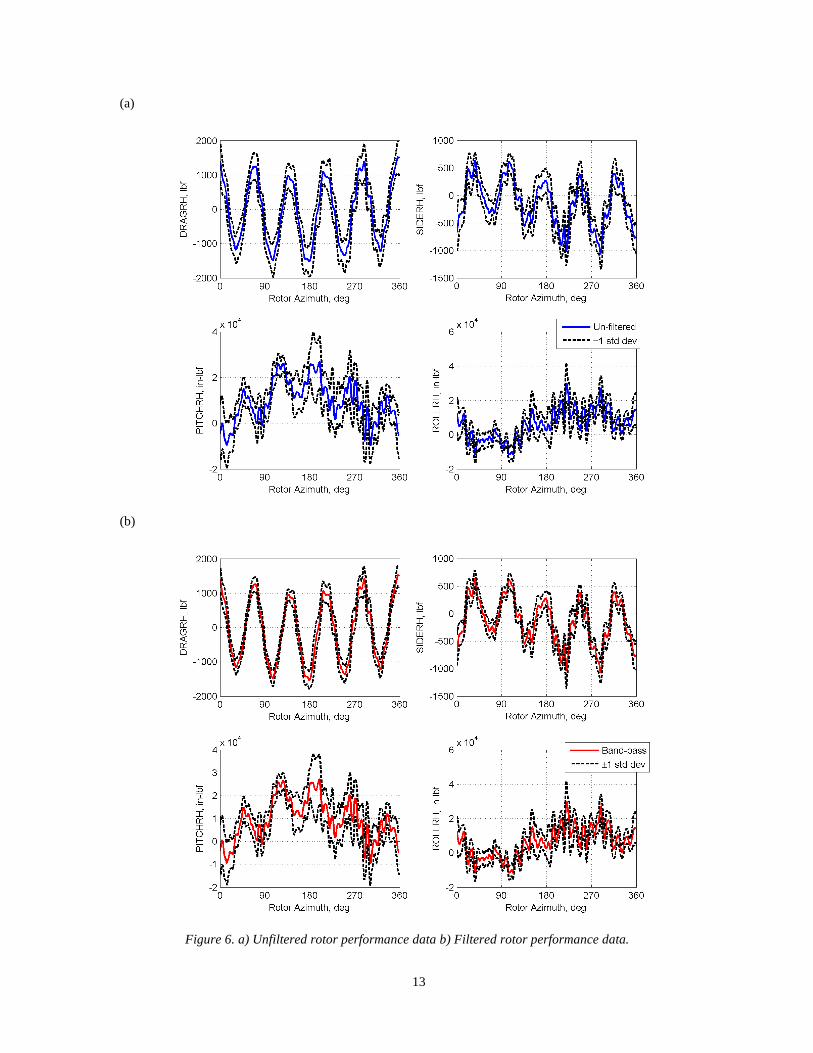
• Large fluctuations in some of the rotor performance channels were observed. Analyses revealed a strong contribution at 6.135 per rev sub-harmonic that was not rotor-related, but was attributed to a rotating gear frequency [5]. The net result introduced large in-plane vibratory load fluctuations that amplified error bands in the rotor balance measurements for drag force, side force, pitching moment, and rolling moment channels as shown in figure 6a. This sub-harmonic, however, has no effect on the averaged revolution and the integer harmonics. Nevertheless to correct for the problem, a band-pass filter was developed to remove the 6.135 per rev sub-harmonic in the rotor performance channels as shown in figure 6b. Subsequent results yielded much smaller standard deviations that implied a highly steady-state condition throughout the 64 revolutions of data acquisition. (Note: All drag force, side force, pitching moment, and rolling moment channel plots shown in Appendices G to J reflect the effects of this band-pass filter.)
• Measurements on blade #1’s flex-beam torsion sensor were dominated by a strong one-per-rev variation with very small standard deviations. Subsequent analyses determined that this is caused by the stiff flex-beam, which accentuated effects of the swash-plate motion associated with cyclic motion. Very little effects due to aero-elastic blade motion were registered at this flex-beam sensor. Because the variations in the control inputs between individual revolutions were small (see Appendix G to J), this resulted in very small standard deviation for this flex-beam torsion sensor.

12
(a)
(b)
Figure 5. Acoustic data from Microphone 15 for SMART 1 case: a) Signal-to-background noise comparisons, b) Effect of applying band-pass filter to remove non-rotor related noise sources.
13
(a)
(b)
Figure 6. a) Unfiltered rotor performance data b) Filtered rotor performance data.

14
Conclusion
• Data collected from the Boeing-SMART rotor test were examined and formatted to meet requirements as stated by DARPA for the HQP Phase Ib code validation effort. All the pertinent experimental data channels were reviewed to ensure HQP requirements were met and that the quality and repeatability of the data was adequate.
• One representative test point, for each of the five flight conditions, was selected from multiple repeats for submission to DARPA. Overall, it is determined that each individual selected test point is representative of the desired state of the rotor and are apt for HQP Phase Ib code validation.
• In analyzing these data, contributions from non rotor-related sources (e.g. instrumentation noise and facility effects) were found to skew data quality. These discrepancies were rectified via implementation of band-pass filters during data post-processing to remove unnecessary information not related to rotor.
• Information, both mean statistics and mean time histories, for each data point chosen has been formatted to meet HQP requirements and is enclosed in a CD attached to this report. Information on the error band of each measurement channel was examined and presented as well.
Acknowledgement
The SMART wind-tunnel test was funded by the Helicopter Quieting Program of DARPA and the NASA Subsonic Rotary-Wing Program. The authors would like to acknowledge valuable contributions from many dedicated staffs at Boeing, DARPA, NASA, NFAC, Army, MIT, UCLA, and the University of Maryland. In particular, the authors would like to thank Dr. Friedrich Straub (Boeing) as the Principal Investigator of the Boeing SMART program for the helpful discussion, Mr. Randall Peterson at NASA Ames for data post-processing and RDMS support, and Dr. Daniel Newman (DARPA), Mr. Thomas Maier (AFDD), Ms. Susan Gorton (NASA), Dr. Wayne Johnson (NASA Ames) and Dr. William Warmbrodt (NASA Ames) for their support on the test.
References
1. Newman, D., Doligalski, T., Minniti, R., “Advances in Modeling and Simulation of Rotorcraft Noise and Associated Impacts on Survivability,” Presented at the 26th Army Science Conference, Orlando, Florida, December 2008.
2. Jacklin, S.A., Lau, B. H., Nguyen, K. Q., Smith, R. L., and McNulty, M. J., “Full-Scale Wind Tunnel Test of the McDonnell Douglas Five-Bladed Advanced Bearingless Rotor: Performance, Stability, Loads, Control Power, Vibration, and HHC Data,” American Helicopter Society Aeromechanics Specialist Conference, San Francisco, California, January 1994.
3. Helicopter Quieting Report Phase Ib Reporting Guideline (see attached CD)
4. Sim, B. W., JanakiRam, R. D., Barbely, N. L., Solis, E., “Reduced In-Plane, Low Frequency Noise of an Active Flap Rotor,” Presented at the American Helicopter Society 65th Annual Forum, Grapevine, Texas, May 2009.
5. Hall, S. R., Anand, V. R., Straub, F. K., Lau, B. H., “Active Flap Control of the SMART Rotor for Vibration Reduction,” American Helicopter Society 65th Annual Forum, Grapevine, Texas, May 2009.
6. Straub, F. and Anand, V. R., “SMART Rotor Extended Wind Tunnel Test Plan Draft and Closed Loop Control Methodologies Report,” Report L9S7-05-DTP-08001, CDRL 5-2, Flight Technology Technical Note, FTN-2008-010, The Boeing Company, February 2008.
7. Straub, F. K., Anand, V. R., Birchette, T. S., Lau, B. H., “Wind Tunnel Test of the SMART Active Flap Rotor,” American Helicopter Society 65th Annual Forum, Grapevine, Texas, May 2009.
8. Anand, V R. and Straub, F., “SMART Rotor Wind Tunnel Test-Software Plan,” Report L9S7-03-FTP-08002, CDRL 3-2, Flight Technology Technical Note, FTTN-2008-003, The Boeing Company, January 2008.

15
9. Cheng, K., “SMART Rotor Data Correlation Documentation,” Internal Memo. NASA Ames Research Center, Aeromechanics Branch, Moffett field, CA, March 2009.
10. Schmitz, F. H., “Rotor Noise,” Chapter 2 in book authored by Hubbard, H. H., Aeroacoustics of Flight Vehicles, Theory and Practice, Vol. 1: Noise Sources, Published for the Acoustical Society of America through the American Institute of Physics, 1995.
11. Straub, F., et al, “Development and Whirl Tower Test of the SMART Active Flap Rotor,” SPIE Conference on Smart Material and Structures, San Diego, CA, 2004.

16

17
Appendix Channel Description .................................................................................................................... Appendix A
Flap-Schedule Polar Plot ............................................................................................................. Appendix B
MDART Repeatability Plots* ...................................................................................................... Appendix C
SMART1 Repeatability Plots* ..................................................................................................... Appendix D
SMART2 Repeatability Plots* ..................................................................................................... Appendix E
SMART4 Repeatability Plots* ..................................................................................................... Appendix F
MDART Standard-Deviation Plots ............................................................................................. Appendix G
SMART1 Standard-Deviation Plots ............................................................................................ Appendix H
SMART2 Standard-Deviation Plots ............................................................................................ Appendix I
SMART4 Standard-Deviation Plots ............................................................................................ Appendix J
CD Contents ................................................................................................................................ Appendix K
*Bolded test points in plots correspond to representative data point selected.


19
Appendix A
Channel Description

20
Appendix A subdivides test data and relates HQP and RDMS channel names. This table includes channel units, the positive directions defined in RDMS, and channel descriptions. The rotor performance channels with weight-tare correction are referenced to the hub center. LIFTRH and THRUST are identical and used interchangeably throughout this report. In RMDS channel name with “_B” indicates Boeing measurement, instead of NFAC measurement.
Folder/File Label RMDS HQP/Vendor RDMS units (positive direction) Description
Acoustics MIC_13 M0159 Pascal (compression) MIC_14 M0156 Pascal (compression) MIC_15 M0180 Pascal (compression)
Control Inputs COLLA COLLECTIVE deg (nose up) Rotor collective control input LONGA LONGITUDINAL deg (nose down at ψ=90°) Rotor longitudinal control input
LATA LATERAL deg (nose down at ψ=0°) Rotor lateral control input
ALFSC ALPHA deg (rotor shaft tilt aft) Corrected model shaft angle of attack
Rotor Performance [1] DRAGRH X_Force lbf (aft) Rotor drag force SIDERH Y_Force lbf (right) Rotor side force LIFTRH, THRUST Z_Force lbf (up) Rotor lift force ROLLRH X_Moment In-lbf (right down) Rotor roll moment PITCHRH Y_Moment In-lbf (nose up) Rotor pitch moment TORQ Z_Moment In-lbf (drag) Rotor torque
Structural Loads/Pitch MRPLK1LOAD STA010 lbf (tension) Main Rotor Pitchcase 1 Pitchlink Load
Structural Loads/Chord MRFBM1CB26P5 STA026 In-lbf (lag) Main Rotor Flexbeam 1 Chord Bending Station 26.5 MRPC1CB33P25 STA033 In-lbf (lag) Main Rotor Pitchcase 1 Chord Bending Station 33.25 MRBLD1CB42P75 STA042 In-lbf (lag) Main Rotor Blade 1 Chord Bending Station 42.75 MRBLD1CB70 STA070 In-lbf (lag) Main Rotor Blade 1 Chord Bending Station 70 MRBLD1CB120 STA120 In-lbf (lag) Main Rotor Blade 1 Chord Bending Station 120 MRBLD1CB164 STA164 In-lbf (lag) Main Rotor Blade 1 Chord Bending Station 164
Structural Loads/Flap MRFBM1FB9 STA009 In-lbf (tip up) Main Rotor Flexbeam 1 Flap Bending Station 9 MRPC1FB33P25 STA033 In-lbf (tip up) Main Rotor Pitchcase 1 Flap Bending Station 33.25 MRBLD1FB42P75 STA042 In-lbf (tip up) Main Rotor Blade 1 Flap Bending Station 42.75 MRBLD1FB70 STA070 In-lbf (tip up) Main Rotor Blade 1 Flap Bending Station 70 MRBLD1FB87 STA087 In-lbf (tip up) Main Rotor Blade 1 Flap Bending Station 87 MRBLD1FB120 STA120 In-lbf (tip up) Main Rotor Blade 1 Flap Bending Station 120 MRBLD1FB164 STA164 In-lbf (tip up) Main Rotor Blade 1 Flap Bending Station 164 MRBLD1FB180 STA180 In-lbf (tip up) Main Rotor Blade 1 Flap Bending Station 180
Structural Loads/Torsion MRPC1TOR25P5 STA025 In-lbf (leading edge up) Main Rotor Pitchcase 1 Torsion Station 25.5 MRFBM1TOR26P5 STA026 In-lbf (leading edge up) Main Rotor Flexbeam 1 Torsion Station 26.5 MRBLD1TOR51 STA051 In-lbf (leading edge up) Main Rotor Blade 1 Torsion Station 51 MRBLD1TOR71 STA071 In-lbf (leading edge up) Main Rotor Blade 1 Torsion Station 71 MRBLD1TOR130 STA130 In-lbf (leading edge up) Main Rotor Blade 1 Torsion Station 130 MRBLD1TOR164 STA164 In-lbf (leading edge up) Main Rotor Blade 1 Torsion Station 164
Flight Conditions MU_B MU - Advance ratio PS_B P_INF psf Tunnel static pressure TSR_B T_INF deg Rankine Tunnel static temperature RHO_B RHO slug/ft^3 Tunnel air density CSND_B SOUND_SPEED ft/s Speed of sound VFPS_B V_INF ft/s Tunnel speed MTUN_B MACH_INF - Tunnel Mach number MTIP_B MTIP - Hover tip Mach number CTOS CT_SIGMA - Rotor thrust coefficient over solidity CPOS CP_SIGMA - Rotor power coefficient over solidity

21
Appendix B
Flap-Schedule Polar Plot

22
Appendix B compares the measured harmonic amplitudes and phases of all five active flaps with the HQP requirement for each prescribed flap schedule (table 1) in the selected representative test points (table 7). The harmonic phases are presented in Boeing convention.
Figure B1. Polar plot of active-flap schedule.

23
Appendix C
MDART Repeatability Plots

24
In Appendix C, repeatability for all five MDART test points (table 4) was plotted along with the HQP requirements to show data regularity. These plots include flap schedules of all five flaps, acoustics for the three in-plane microphones, rotor performance at the rotor hub and structural loading on blade #1. Unless indicated, the azimuth for all plots is referenced to blade #1’s azimuthal angle.
Figure C1.Comparison of measured active-flap schedule of blades #1 to 5 with HQP requirements, plotted
against the local blade azimuth.
Figure C2. Microphones M13, M15 and M14.

25
Figure C3. Lift, drag and side forces at rotor hub.
Figure C4. Pitching moment, rolling moment and rotor torque at rotor hub.

26
Figure C5. Blade chord- and flap-bending at station 70 and torsion at station 71.
Figure C6. Blade chord-bending, flap-bending and torsion at station 164.

27
Figure C7. Flap bending of flexbeam 1 and 2 at station 9.


29
Appendix D
SMART1 Repeatability Plots
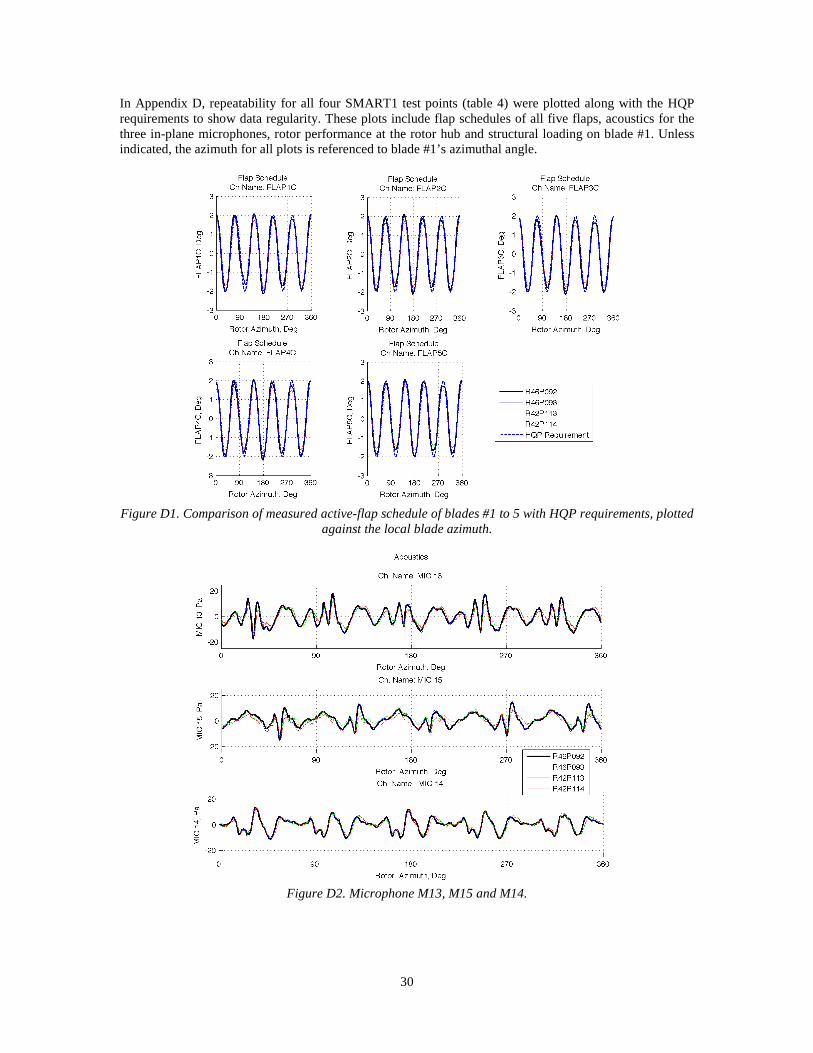
30
In Appendix D, repeatability for all four SMART1 test points (table 4) were plotted along with the HQP requirements to show data regularity. These plots include flap schedules of all five flaps, acoustics for the three in-plane microphones, rotor performance at the rotor hub and structural loading on blade #1. Unless indicated, the azimuth for all plots is referenced to blade #1’s azimuthal angle.
Figure D1. Comparison of measured active-flap schedule of blades #1 to 5 with HQP requirements, plotted
against the local blade azimuth.
Figure D2. Microphone M13, M15 and M14.

31
Figure D3. Lift, drag and side forces at rotor hub.
Figure D4. Pitching moment, rolling moment and rotor torque at rotor hub.

32
Figure D5. Blade chord- and flap-bending at station 70 and torsion at station 71.
Figure D6. Blade chord-bending, flap-bending and torsion at station 164.

33
Figure D7. Flap-bending of flexbeam 1 and 2 at station 9.


35
Appendix E
SMART2 Repeatability Plots

36
In Appendix E, repeatability for all three SMART2 test points (table 4) were plotted along with the HQP requirements to show data regularity. These plots include; flap schedules of all five flaps, acoustics for the three in-plane microphones, rotor performance at the rotor hub and structural loading on blade #1. Unless indicated, the azimuth for all plots is referenced to blade #1’s azimuthal angle.
Figure E1. Comparison of measured active-flap schedule of blades #1 to 5 with HQP requirements, plotted
against the local blade azimuth.
Figure E2. Microphones M13, M15 and M14.

37
Figure E3. Lift, drag and side forces at rotor hub.
Figure E4. Pitching moment, rolling moment and rotor torque at rotor hub.
38
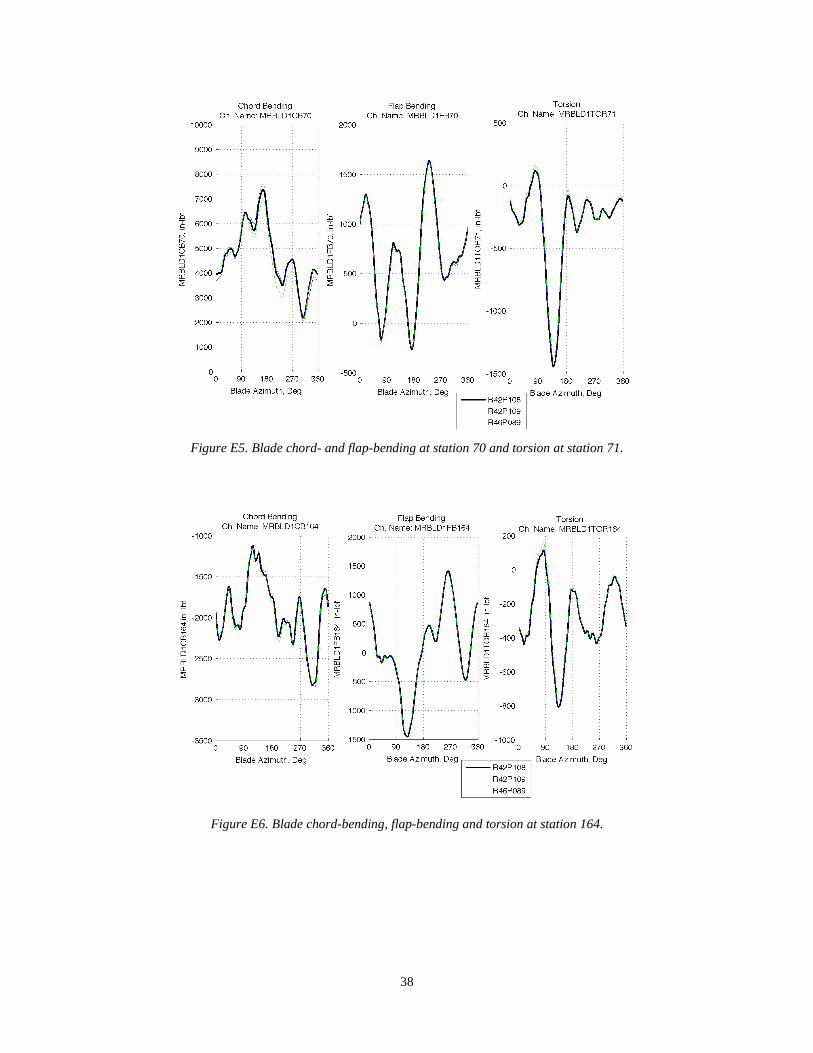
Figure E5. Blade chord- and flap-bending at station 70 and torsion at station 71.
Figure E6. Blade chord-bending, flap-bending and torsion at station 164.

39
Figure E7. Flap bending of flexbeam 1 and 2 at station 9.


41
Appendix F
SMART4 Repeatability Plots


43
In Appendix F, repeatability for all six SMART4 test points (table 4) were plotted along with the HQP requirements to show data regularity. These plots include flap schedules of all five flaps, acoustics for the three in-plane microphones, rotor performance at the rotor hub and structural loading on blade #1. Unless indicated, the azimuth for all plots is referenced to blade #1’s azimuthal angle.
Figure F1. Comparison of measured active-flap schedule of blades #1 to 5 with HQP requirements, plotted
against the local blade azimuth.
Figure F2. Microphones M13, M15, and M14.

44
Figure F3. Lift, drag and side forces at rotor hub.
Figure F4. Pitching moment, rolling moment, and rotor torque at rotor hub.

45
Figure F5. Blade chord-and flap-bending at station 70 and torsion at station 71.
Figure F6. Blade chord-bending, flap-bending and torsion at station 164.

46
Figure F7. Flap bending of flexbeam 1 and 2 at station 9.

47
Appendix G
MDART Standard Deviation Plots
48
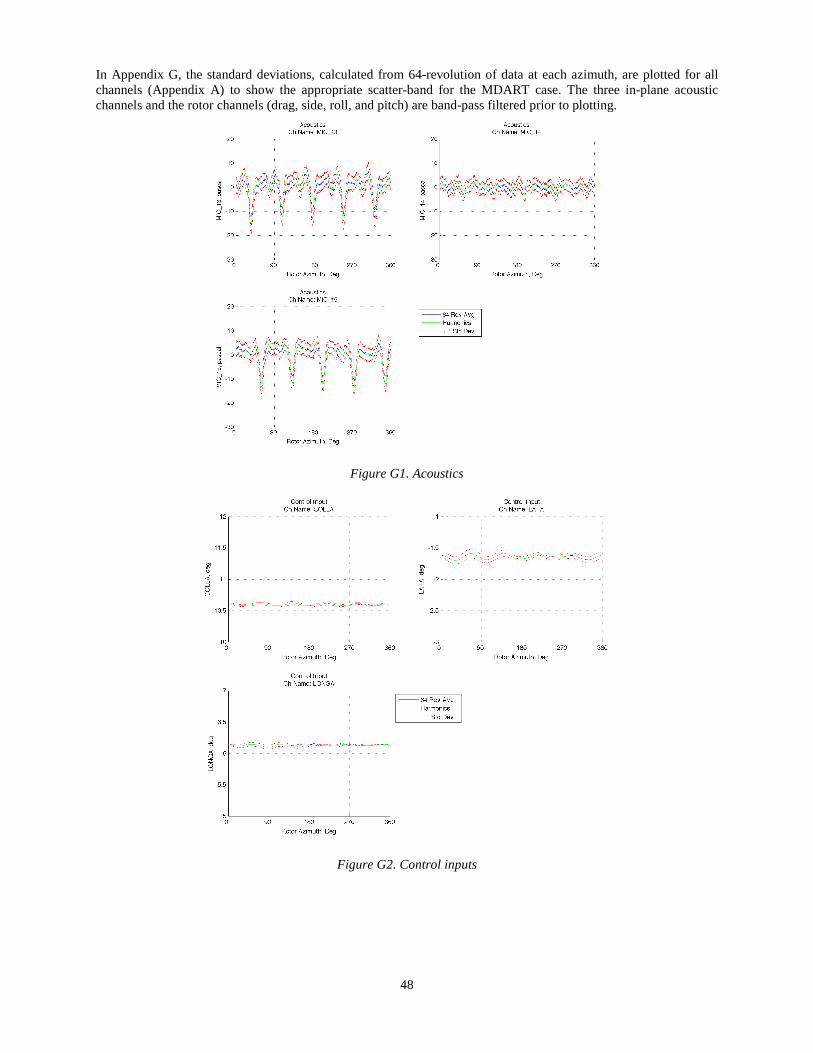
In Appendix G, the standard deviations, calculated from 64-revolution of data at each azimuth, are plotted for all channels (Appendix A) to show the appropriate scatter-band for the MDART case. The three in-plane acoustic channels and the rotor channels (drag, side, roll, and pitch) are band-pass filtered prior to plotting.
Figure G1. Acoustics
Figure G2. Control inputs

49
Figure G3. Chord-bending loads at various stations.
Figure G4. Flap-bending loads at various stations.
50
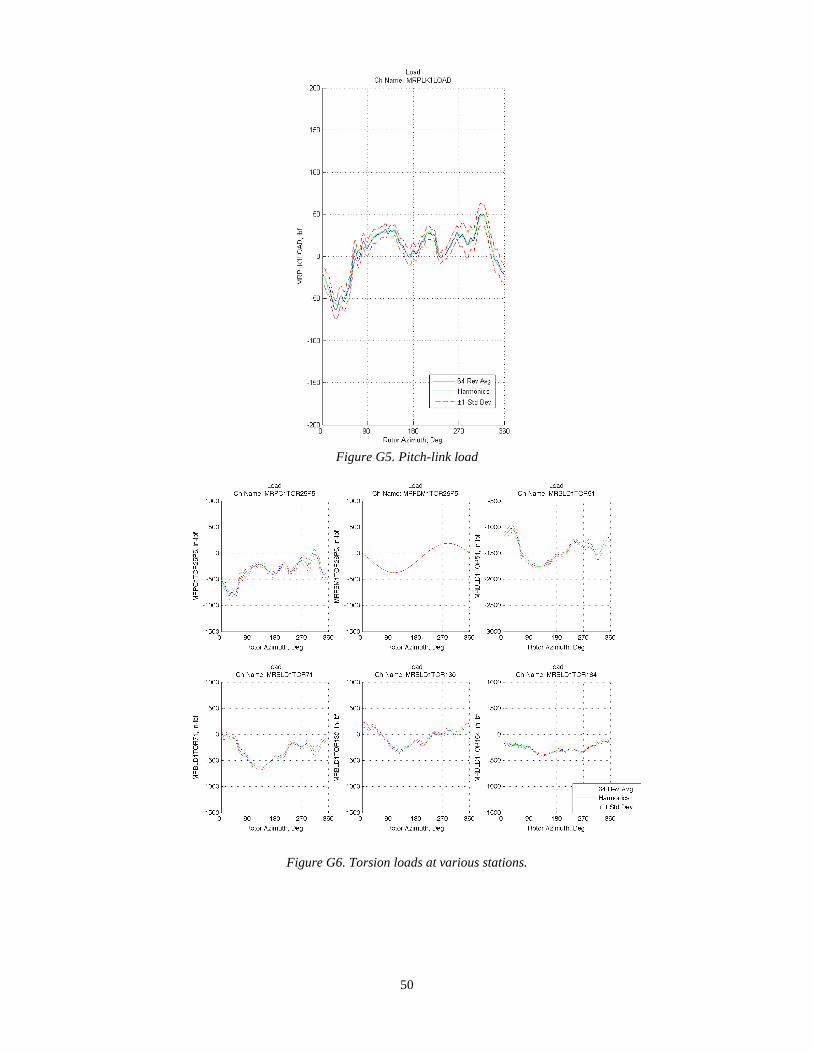
Figure G5. Pitch-link load
Figure G6. Torsion loads at various stations.
51
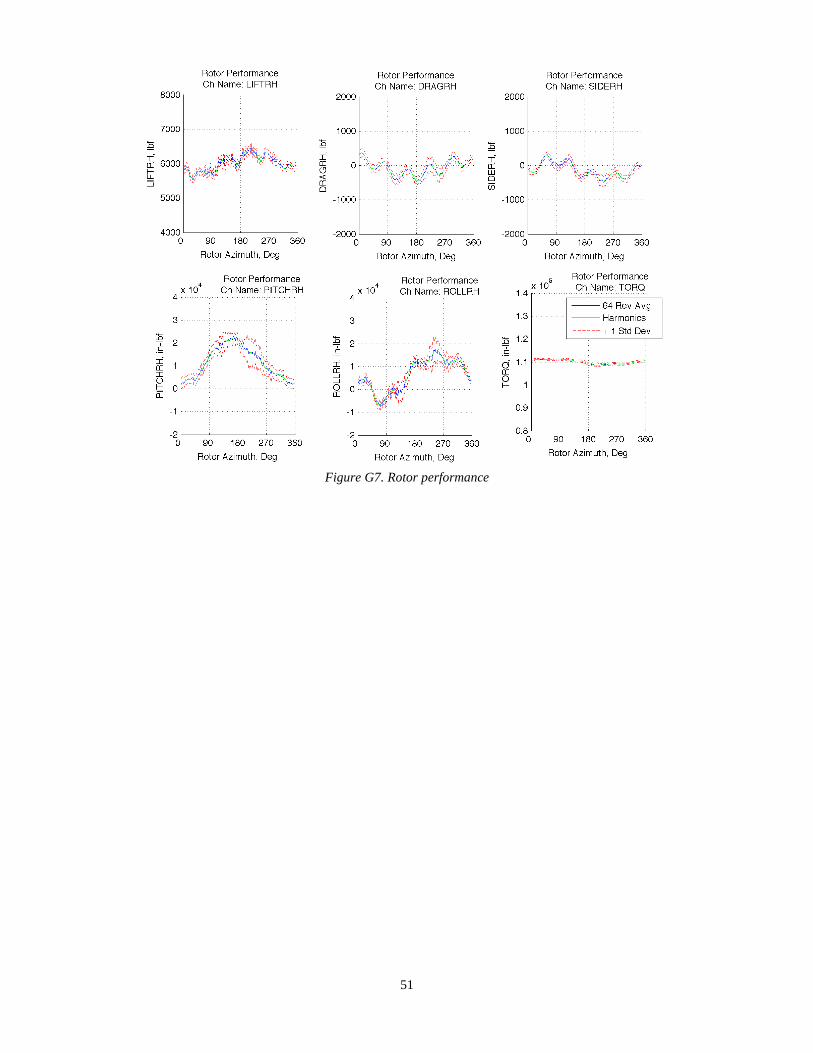
Figure G7. Rotor performance


53
Appendix H
SMART1 Standard Deviation Plots
54
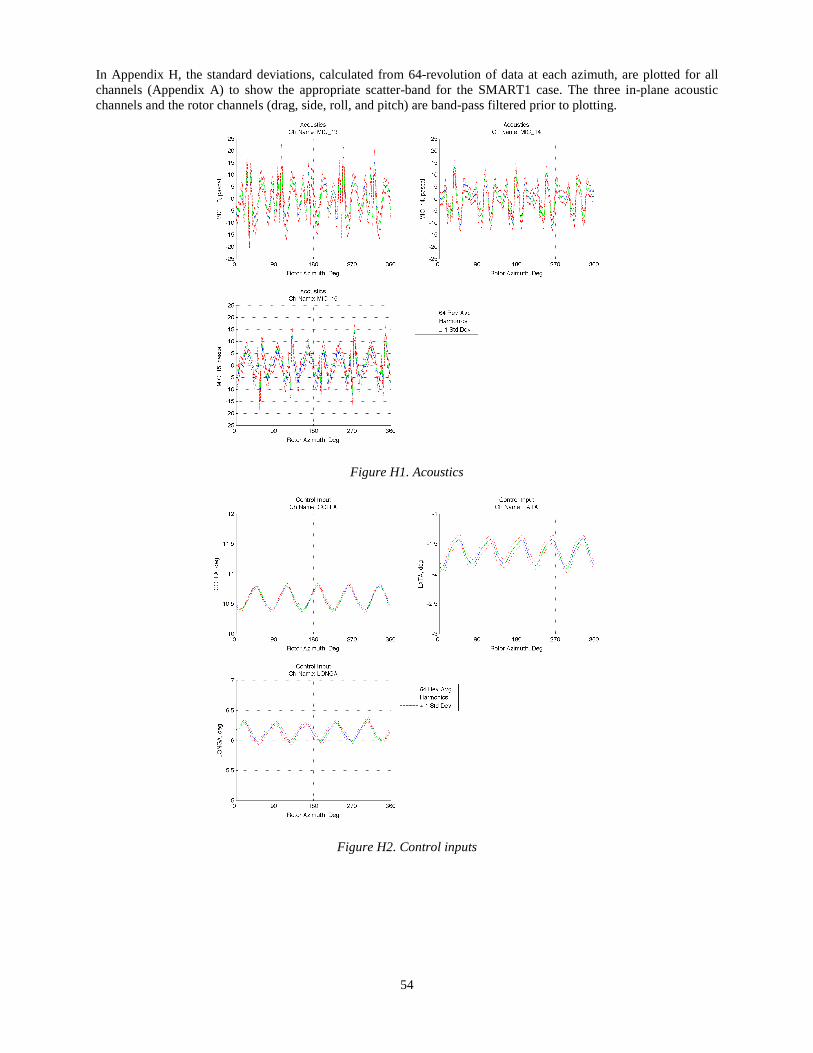
In Appendix H, the standard deviations, calculated from 64-revolution of data at each azimuth, are plotted for all channels (Appendix A) to show the appropriate scatter-band for the SMART1 case. The three in-plane acoustic channels and the rotor channels (drag, side, roll, and pitch) are band-pass filtered prior to plotting.
Figure H1. Acoustics
Figure H2. Control inputs

55
Figure H3. Chord-bending loads at various stations.
Figure H4. Flap-bending loads at various stations.
56
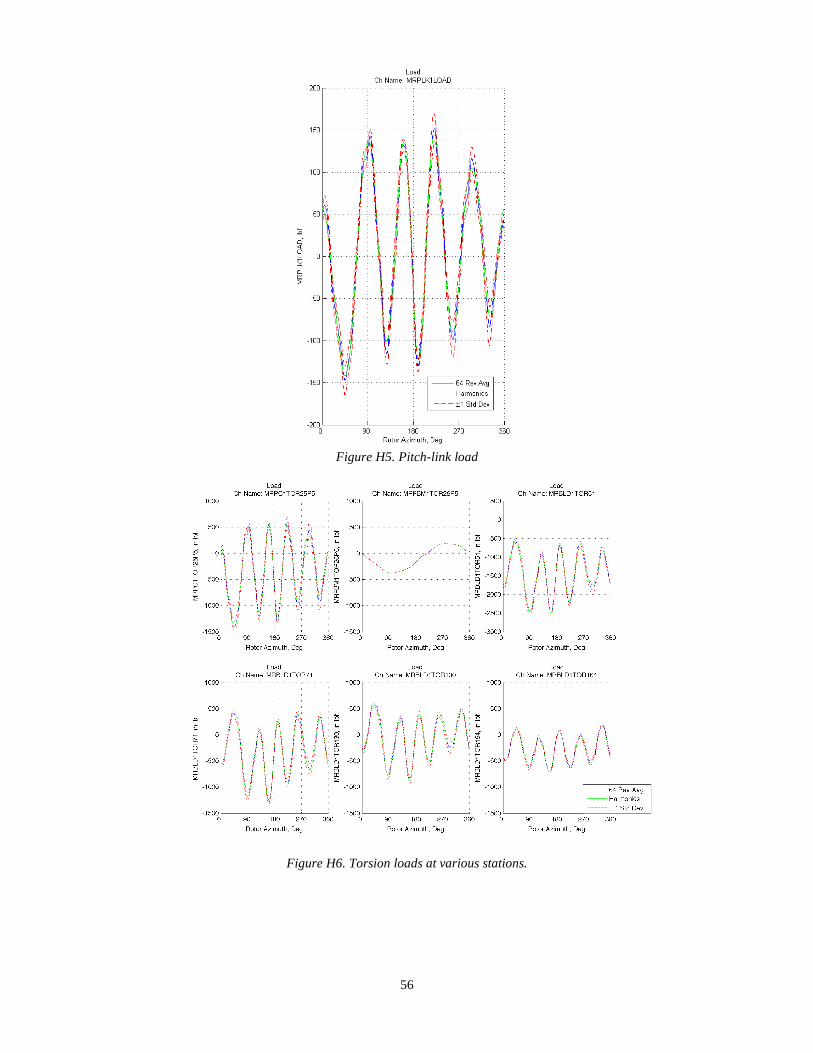
Figure H5. Pitch-link load
Figure H6. Torsion loads at various stations.

57
Figure H7. Rotor performance


59
Appendix I
SMART2 Standard Deviation Plots
60
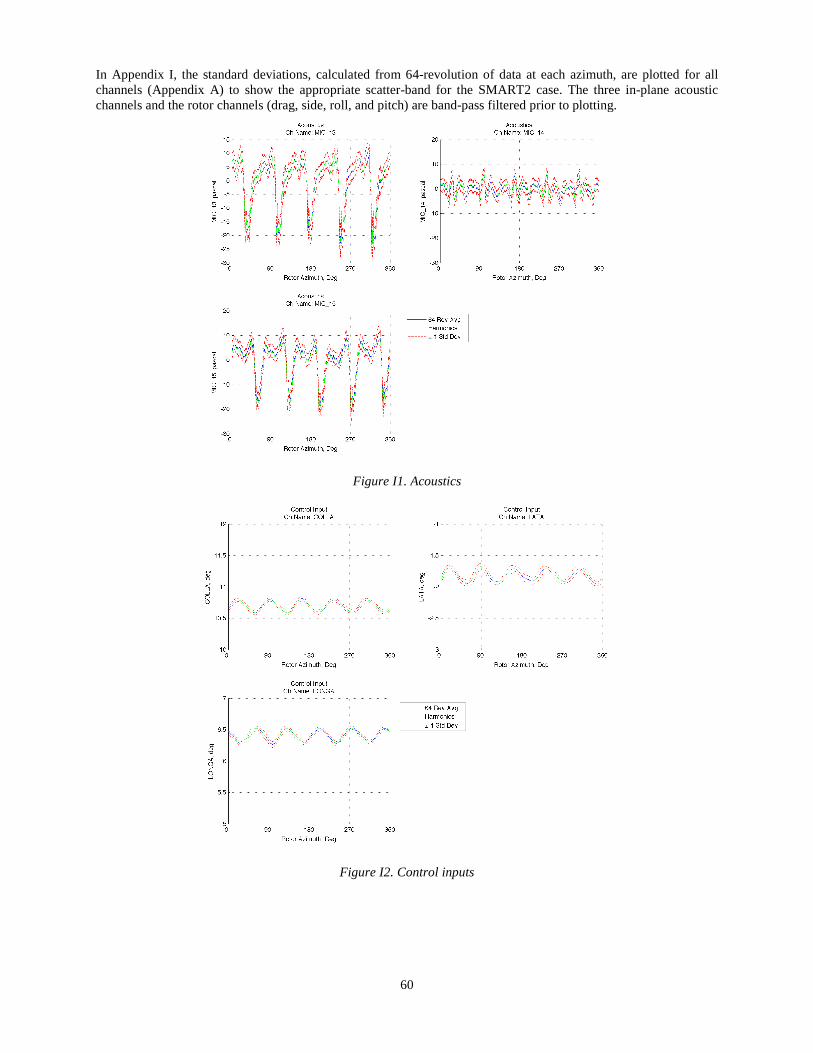
In Appendix I, the standard deviations, calculated from 64-revolution of data at each azimuth, are plotted for all channels (Appendix A) to show the appropriate scatter-band for the SMART2 case. The three in-plane acoustic channels and the rotor channels (drag, side, roll, and pitch) are band-pass filtered prior to plotting.
Figure I1. Acoustics
Figure I2. Control inputs

61
Figure I3. Chord-bending loads at various stations.
Figure I4. Flap-bending loads at various stations.

62
Figure I5. Pitch-link load.
Figure I6. Torsion loads at various stations.

63
Figure I7. Rotor performance


65
Appendix J
SMART4 Standard Deviation Plots


67
In Appendix J, the standard deviations, calculated from 64-revolution of data at each azimuth, are plotted for all channels (Appendix A) to show the appropriate scatter-band for the SMART4 case. The three in-plane acoustic channels and the rotor channels (drag, side, roll, and pitch) are band-pass filtered prior to plotting.
Figure J1. Acoustics
Figure J2. Control inputs

68
Figure J3. Chord-bending loads at various stations.
Figure J4. Flap-bending loads at various stations.

69
Figure J5. Pitch-link load.
Figure J6. Torsion loads at various stations.

70
Figure J7. Rotor performance

71
Appendix K
CD Contents

72
Appendix K describes the contents of the data CD enclosed with this report. It includes a description of the folder structure and the file hierarchy of all data presented. A copy of the HQP Phase Ib reporting guideline document [2] is also included, as well as an electronic copy of this report.
Data CD File Structure
The top-most level of the CD contains the follow files/folders:
• EXP_DATA ( Folder) o This folder contains numerical data of all the channels as requested by DARPA for all five HQP Phase Ib
test conditions.
• Phase1B_MileStone_Reporting_Guidlines.pdf ( PDF document) o A document, originally given to the HQP vendors, that describes the format of the submitted data.
• HQP_PhaseIb_DataReport.pdf ( PDF document) o An electronic copy of the current report.
EXP_DATA Folder
This folder contains the sensor/channel data acquired during the Boeing-SMART test for the specified HQP Phase Ib (table 1). All data files with .dat extensions are stored in TAB-delimited, ASCII text format with <LF> as line break. The hierarchy of these stored data-files follows the format as specified by DARPA [3]. All channel units can be found in Appendix A.
The contents of this folder are categorized by the five HQP Phase Ib test conditions. For each test condition, all the associated experimental data are placed in a separate folder, with the file hierarchy shown below:
• EXP_DATA/ o AUX_INFO/ README.TXT Flight_summary.dat EXP_DATA_STDEV/ MDART_AUX/ RxxPyyyHA.txt RxxPyyyHCI.txt RxxPyyyHL.txt RxxPyyyHRP.txt
SMART1_AUX/ [Same file structure as MDART_AUX/]
SMART2_AUX/ [ Same file structure as MDART_AUX/]
SMART3_AUX/ [ Empty]
SMART4_AUX/ [ Same file structure as MDART_AUX/]
o SMART_1/ Flight_condition.dat EXP_2008/ Rotor_Performance/ Control_Inputs/ Cn_Cc_Cm/ LOAD_DATA/ ACOUSTIC/
o SMART_2/ [Same file structure as in SMART1/]
o SMART_3/
73
[Empty/] o SMART_4/ [Same file structure as in SMART1/]
o MDART/ [Same file structure as in SMART1/]
For each test condition, the bulk of the data is stored within a folder named “EXP_2008/ ” and is sub-categorized into major measurement groups (e.g. Rotor_Performance/ , Control_Inputs/ , etc.). Detailed descriptions and data formats of these groups are reported in reference 3 and will not be repeated here. Following the requirements outlined in reference 3, a Flight_condition.dat file is also included that summarizes the (measured) operating conditions of the rotor for each HQP Phase Ib test condition with additional flight parameters pending at the end.
Some important notes regarding the content of this folder are noted below:
• Due to the lack of surface pressure measurement in the Boeing-SMART rotor test, there are no airload and airfoil pitching moment data available. The contents within the “Cn_Cc_Cm/” folder are left blank.
• Tare data are not reported in the “LOAD_DATA/” folder as all reported pitch link and blade structural load channels already had zero-tare correction.
• There are no data reported for the high-speed SMART3 condition (table 1) as the test point could not be acquired due to high flex-beam and load limits. No data files were inserted under the “SMART_3/” folder.
AUX_INFO Folder
The AUX_INFO folder contains auxiliary data pertaining to the test. A README.TXT describes the file and the folder contents. The Flight_summary.dat file combines the Flight_condition.dat files from all four test cases into one file for ease of comparison. Inside the AUX_INFO folder, there are EXP_DATA_STDEV folder and a case_AUX folder for each of the four test cases.
case_AUX Folder
The case_AUX folder contains the cosine-sine harmonic pairs for all channels. For acoustic channels, the integer harmonics from 0 to 511are saved in the file RxxPyyyHA.txt . All other channels have integer harmonics from 0 to 10 and are saved in RxxPyyyHCI.txt for control-inputs, RxxPyyyHL.txt for structural loads, and RxxPyyyHRP.txt for rotor performance. Again no data is available in the “SMART3_AUX/” folder.
EXP_DATA_STDEV Folder
The standard deviations of each measurement channel, shown in Appendices G to J, are stored in this directory. Each HQP Phase Ib test condition comes with two data files: one for acoustics channels (case_STDEV_ACOUSTIC.dat ) alone and another (case_STDEV_ROTOR.dat) for all other channels listed in Appendix A.
• EXP_DATA_STDEV/ o MDART_STDEV_ACOUSTIC.dat (Figures G1) o MDART_STDEV_ROTOR.dat (Figure G2 to G7) o SMART1_STDEV_ACOUSTIC.dat (Figures H1) o SMART1_STDEV_ROTOR.dat (Figure H2 to H7) o SMART2_STDEV_ACOUSTIC.dat (Figures I1) o SMART2_STDEV_ROTOR.dat (Figure I2 to I7) o SMART3_STDEV_ACOUSTIC.dat (Figures J1) o SMART3_STDEV_ROTOR.dat (Figure J2 to J7)
The standard deviations are derived from evaluating data scatter associated with 64-revolutions of time-history data. Standard-deviations data for all three in-plane microphone channels (M13, M14 and M15) are stored in the

74
case_STDEV_ACOUSTIC.dat . The first column contains data pertaining to the scan index* (ranging from 1 to 2048) that depicts the 2048 azimuthal positions recorded during one rotor revolution. The remaining three columns represent the standard deviations for channels M13, M14 and M15 respectively.
The standard deviations for the rest of the performance, controls and blade structural load channels are stored in sheet case_STDEV_ROTOR.dat in a similar manner. Each channel (column) contains information corresponding to 256 recorded azimuth positions for each rotor revolution. Note that there are no data for the SMART3 test condition due to reasons as discussed before.
* The following equation must be used to convert scan index to rotor azimuth (deg.): ψ=(360˚/N)*(scan_index –1), where N is 2048 for acoustics, or 256 for all other sensors/channels.