Embed Size (px)
Citation preview

TABLE I Variability of Heart Rate and Finger Arterial Systolic Pressure During Quiet Breathing in Patients with Atrial Septal Defect, and in Age- and Sex-Matched Healthy Subjects
Healthy Pts. with Atrial Subjects Septal Defect
Measurement (n = 16) (n = 16)”
RR interval (ms) 988 f 112 875 f 119t Log root-mean-square successive 3.9 + 0.6 3.3 k 0.5$
RR interval difference Log RR interval power
0.0-0.5 Hz. (103/mean RR 7.8 2 1.0 7.0 k 0.7t interval)
0.07-0.15 Hz 5.9 k 1.4 5.1 * 0.7 0.15-0.5 Hz. (103/mean RR 7.2 + 1.0 6.3 + O.i’$ interval)
Log systolic arterial pressure power
0.0-0.5 Hz. (lOs/mean RR 2.6 2 0.6 2.6 + 0.5 interval)
0.07-0.15 Hz 0.5 k 0.8 0.4 k 0.;7
0.15-0.5 Hz. (103/mean RR 1.4 2 0.4 1.3 f 0.3 interval)
*n = 14 in power spectral analysis. tp ~0.05; tp <O.Ol compared with healthy subjects (Student’s t test). Data are mean + SD; log-transformed data are presented in dimensionless units.
tients with ASD may explain part of these group differ- ences,6 but not entirely, because the deep breathing change in HR is independent of the prevailing HR.7
The development of sinus arrhythmia is unknown in detail, but in addition to central control mechanisms and the function of baroreflex arc, stretch receptors in the lungs and the atria of the heart may be involved.8 The normal respiratory variation of right atria1 size is absent in patients with ASD,g and reduced expiratory-inspira- tory fluctuation of vagal afferent flow from the atria1 mechanoreceptors could contribute to the reduction of beat-to-beat HR variation. Sinus node dysfunction is a relatively frequent finding in ASD, even before surgery,‘O
and blunting of the sinus node responses to autonomic stimuli could also result in less respiratory HR variation. Patients with ASD had increased HR in addition to de creased HR variation, which suggests altered sympatho- vagal balance as 1 possible explanation for our findings. Because of the noninvasive design of this study, we could not include electrophysiologic measurements or invasive quantification of atria1 pressures and volumes during res- piration.
In summary, adult patients with ASD have less res- piratory HR variation than do age-matched healthy sub- jects. By contrast, there is no blunting of respiratory variation of systolic blood pressure in ASD.
Acknowledgment: We thank Kalevi PytirBlZi, MD, for contribution to the idea of this study.
1. Finley JP, Nugent ST, Hellenbrand W, Craig M, Gillis DA. Sinus arrhythmia in children with atria1 septal defect: an analysis of heart rate variability before. and after surgical repair. Br Heart J 1989;61:280-284. 2. Boehmer RD. Continuous, real-time, noninvasive monitor of blood pressure: Penaz methodology applied to the finger. J Chin Monif 1987;3:282-287. 3. Elghozi J-L, Laude D, Girard A. Effects of respiration on blood pressure and heart rate variability in humans. Clin Exp Pharmacol Physiol 1991;18:735-742. 4. Viiolainen J. Use of noninvasive finger blood pressure monitoring in the estimation of aortic pressure at rest and during the Mueller manoeuvre. Clin Physiol (in press). 5. Malliani A, Pagani M, Lombardi F, Cerutti S. Cardiovascular neural regula- tion explored in the frequency domain. Circulation 1991;84:482-492. 6. Van Hoogenhuyze D, Weinstein N, Martin GJ, Weiss JS, Schaad JW, Sah- youni XN, Fmtel D, Remme WJ, Singer DH. Reproducibility and relation to mean heart rate of heart rate variabilitv in normal subiects and in oatients with congestive heart failure secondary to -coronary arter; disease. Ah J Cardiol 1991:68:1668-1676. 7. O’Brien IA, O’Hare P, Corral1 RJM. Heart rate variability in healthy subjects: effect of age and the derivation of normal ranges for tests of autonomic function. Br Heart .I 1986;55:348-354. 8. van den Aardweg JG, Karemaker JM. Respiratory variability and associated cardiovascular changes in adults at rest. Clin Physiol 1991;11:95-118. 9. Ferguson JJ, Miller MJ, Aroesty JM, Sahagian P, Grossman W, McKay RG. Assessment of right atria1 pressurevolume relations in patients with and without atria1 septal defect. J Am Co11 Cardiol 1989;13:630-636. 10. Clark EB, Kugler JD. Preoperative secundum atria1 septal defect with coax- isting sinus node and atrioventricular node dysfunction. Circulation 1982;65: 976-980.
Body Surface Laplacian Mapping of Cardiac Electrical Activity Bin He, PhD, and Richard J. Cohen, MD, PhD
C ardiac electrical activity is distributed over the 3- dimensional volume of the myocardium. Ideally one
would like to be able to map the 3-dimensional distribu- tion of cardiac electrical activity in the heart at each point in time during the cardiac cycle. The conventional elec- trocardiogram and vectorcardiogram provide a highly degenerate representation of cardiac electrical activity. The body surface potential map (BSPM) involves the measurement of the potential at many points on the body
From Harvard University-Massachusetts Institute of Technology, Di- vision of Health Sciences and Technology, Massachusetts Institute of Technology, Room E25-33Od, Cambridge, Massachusetts 02139. This work was supported in part by Grants MOlRR00088 and 5ROlHL39291 from the National Institutes of Health, Bethesda, Maryland; and a grant from the American Heart Association, Massa- chusetts Affiliate. Manuscript received April 9, 1992; revised manu- script received June 19,1992, and accepted June 22.
surface in an attempt to characterize the distributed na- ture of cardiac electrical activity.1-7 Although the BSPM has been shown by a number of investigators to reliably identify major single cardiac events,8 its ability to resolve spatially separated bioelectrical events is limited4-6 be- cause of the smoothing effect of the torso volume conduc- tor.gJO
The fundamental limitation to interpreting the BSPM in terms of cardiac electrical events is the nonuniqueness of the electrocardiograph inverse problem.” One can generally represent the heart as a bioelectrical source in terms of a 3-dimensional distribution of electrical dipoles. One can prove that any given body surface potential distribution does not uniquely specify a specific 3-dimen- sional electrical dipole source distribution. Whereas the epicardial potential distribution has been estimated from the BSPM,12J3 such inverse calculations require detailed
BRIEF REPORTS 1617
geometric information14 and are mathematically ill- posed. Furthermore, the epicardial potential distribution itself does not specify the distribution of bioelectrical sources within the heart. The ability to image cardiac electrical activity noninvasively from the body surface could greatly enhance our ability to diagnose a wide
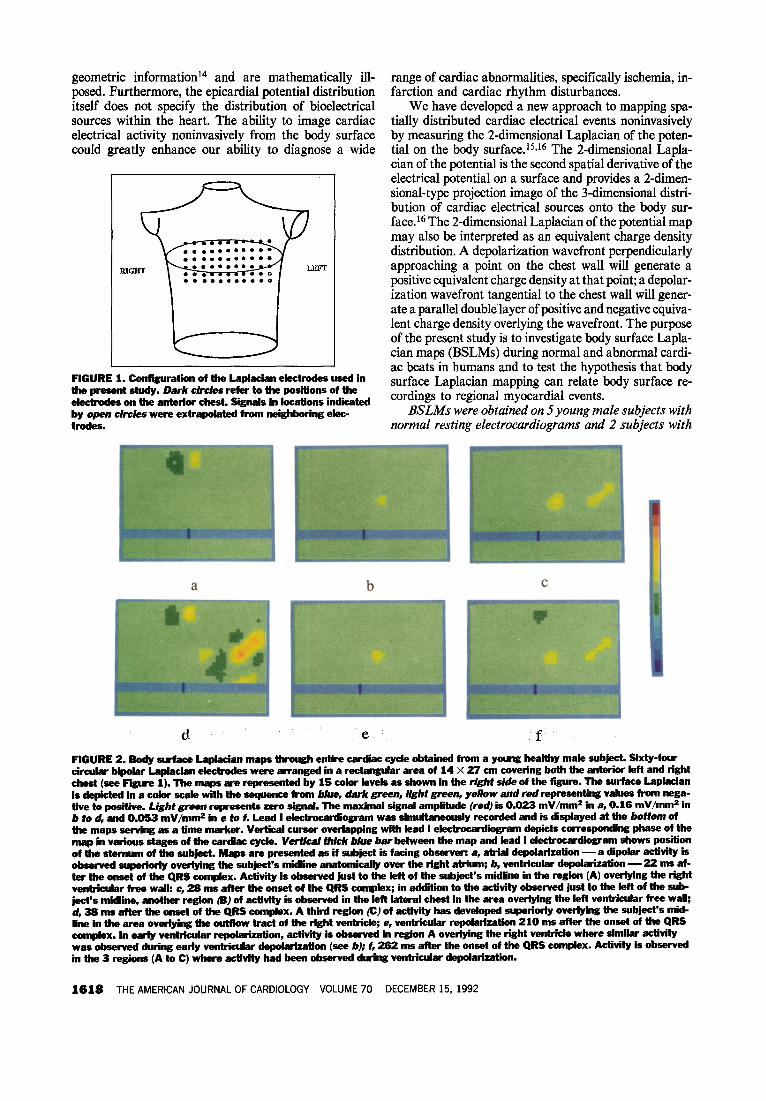
FIGURE 1. Configuration of the hplacian electrodes used in the present study. Dark cirdes refer to the positions of the electrodes on the anterter chest. Signals in locations indicated by open circfes were extrapolated from neighboring ekc- trodes.
range of cardiac abnormalities, specifically ischemia, in- farction and cardiac rhythm disturbances.
We have developed a new approach to mapping spa- tially distributed cardiac electrical events noninvasively by measuring the 2-dimensional Laplacian of the poten- tial on the body surface. 15,16 The 2-dimensional Lapla- cian of the potential is the second spatial derivative of the electrical potential on a surface and provides a 2-dimen- sional-type projection image of the 3-dimensional distri- bution of cardiac electrical sources onto the body sur- face.16 The 2-dimensional Laplacian of the potential map may also be interpreted as an equivalent charge density distribution. A depolarization wavefront perpendicularly approaching a point on the chest wall will generate a positive equivalent charge density at that point; a depolar- ization wavefront tangential to the chest wall will gener- ate a parallel double layer of positive and negative equiva- lent charge density overlying the wavefront. The purpose of the present study is to investigate body surface Lapla- cian maps (BSLMs) during normal and abnormal cardi- ac beats in humans and to test the hypothesis that body surface Laplacian mapping can relate body surface re- cordings to regional myocardial events.
BSLMs were obtained on 5 young male subjects with normal resting electrocardiograms and 2 subjects with
FIGURE 2. Gody surface Laplacian maps through entire cardiac cycle obtained from a young healthy male subject. Sixty-four circular bipolar Laplacian ek&odes were arranged in a rectangular area of 14 X 27 cm covering both the anterior left and right chest (see Figure 1). The maps are represented by 15 color levels as shown in the right side of the figure. The surface Laplacian isdepictedinacolorscalewiththesequence hwn blue, dark green, light green, yellow and red representing values from nega- tive to positive. Light green mpmwnts zero signal. The maximal signal amplitude (red) is 0.023 mV/mm2 in a, 0.16 mV/mms in b to d, and 0.053 mV/mmc in e to f. Lead I ektrocardiogram was simultaneously recorded and is displayed at the bottom of the maps servtng as a time marker. Vertical cursor overlapping with lead I ektrocardiogram depiits corresponding phase of the map in various stages of the cardiac cycle. Wertica/ thick blue bar between the map and lead I electrocardiigram shows position ofthestefman of the subject. Maps are presented as if subjsct is facing observer: a, atrial depolarization -a dtpolar activity is observed superkcly overlying the subjsct’s midline anatomically over the right atrium; b, ventricular depolarization - 22 mr af- ter the onset of the QRS complex. Activity is observed just to the left of the subject’s midline in the region (A) overlying the right ventricular free wall: c, 26 ms after ths onset of the QRS complex; in addition to the activity observed just to the left of the sub- ject’s midline, another region @J of activity is observed in the left lateral chest in the area overlying ths left ventricular free waH; d, 38 ms after the onset of the QRS complex. A third region (cl of activfty has developed superiorly overlying the subject’s mid- line in the area overtying the outttow tract of the right ventride; e, ventricular repolartxatton 210 ms after the onset of the QRS complex. In earfy ventricular repolarixation, activity 50 observed in region A overlying the right ventricle where similar activity was observed during early ventricular depolarization (see b); f, 262 ms after the onset of the QRS complex. Activity is observed in the 3 regions (A to C) where activity had been observed during ventricular depolarization.
1616 THE AMERICAN JOURNAL OF CARDIOLOGY VOLUME 70 DECEMBER 15, 1992

left bundle branch block. Studies were performed in the Massachusetts Institute of Technology Clinical Re- search Center, according to a protocol approved by the Massachusetts Institute of Technology Human Studies Committee. All subjects gave written informed consent.
Bipolar concentric circle electrodes,‘7J8 ‘Laplacian electrodes,” each consisting of a central conductive AgCl disk (diameter 8 mm) and a concentric conductive AgCl ring (inner diameter 12 mm, outer diameter 15 mm), were used to measure the surface Laplacian of thepoten- tial on the body surface. 15,t6 A pad with 64 dry circular Laplacian electrodes was placed covering both the right and left anterior chest of the subject after skin prepara- tion using rubbing alcohol. The electrode positions on the anterior chest are depicted in Figure 1 where dark circles refer to the positions of the electrodes. Thepoten- tial difference between the central disk and the outer ring of each electrode, which is negatively proportional to the 2-dimensional Laplacian of the potential at the center of the electrodet5J6 was amplified and filtered using Nihon Kohden Bioelectric Amplifiers AB-601 G. The frequency band of the Jilter was 0.5 to 200 Hz. The conditioned signals were multiplexed and underwent analog-to-digi- tal conversion at a samplingfrequency of 500 Hz using a 32-bit workstation (Concurrent 5450). Lead I electro- cardiogram was also measured using conventional uni- polar electrodes as a time reference. Baseline for each individual channel was adjusted by subtractingfor each channel its average signal value over the duration of the PR segment in the lead I (or lead II in patients with left bundle branch block) electrocardiogram. BSLMs were constructed at each time point in the cardiac cycle.from the 64 electrode signals using a 2-dimensional interpola- tion algorithm for spatial smoothing, and presented us- ing a 15level color scale of signal amplitude.
In Figure 2 typical BSLMs are shown at selected points in time during the cardiac cycle including atria1 depolarization, ventricular depolarization and repolar- ization for subject 1, Each map represents the spatial distribution of the surface Laplacian on an area of I4 by 27 cm on the anterior chest overlying the heart (Figure 1). The lead I electrocardiogram is plotted under the spatial map to serve as a time marker. The vertical thick blue bar between the spatial map and lead I electrocar- diogram indicates the position of the sternum. Thephys- ical unit of the surface Laplacian is mV/mm2. Note that atria1 activity in the BSLM (Figure 2a) is limited to the region of the chest overlying the atria and is not found elsewhere, indicating the ability of the BSLM to spatial- ly resolve cardiac electrical events. In contrast, atria1 activity in the BSPM appears to be measured diffusely over the body surface (Figure 3a).
Figures 2b, 2c and 2d correspond to 3 stages of ven- tricular depolarization. These figures illustrate the se- quential activation of 3 discrete regions located: (A) just to the left of the subject’s midline, (B) in the left lateral chest, and (C) superiorly overlying the subject’s midline. On an anatomic basis one can tentatively associate these regional activations with the right and left ventricle free walls, and right ventricle outflow tract. This activation sequence during ventricular depolarization as observed in the BSLM coincides with the activation sequence on the epicardial surface observed in isolated human heartsI and in open chest recordings of human subjects without conduction abnormalities.20 Depolarization is initiated on the endocardial surface of the ventricles. Epicardial breakthrough is generally first achieved on the right ventricular free wall and later on the left ven- tricular free wall.
Figures 2e and 2f illustrate the BSLM during ven-
a b
BRIEF REPORTS 1619

tricular repolarization. Notice that the pattern of ven- tricular repolarization appears to recapitulate the pat- tern of ventricular depolarization.
BSLMs during ventricular depolarization and repo- larization obtained in normal subjects were highly re- producible and quite similar from one subject to the next. The 3 regions of activity could be identified in all subjects. In 4 of the 5 subjects, region A was activated first during ventricular depolarization. In the fifth sub- ject, regions A and B were simultaneously activated. In 4 of the 5 subjects region B was activated before region C.
Figure 3a depicts a typical BSPM during atria1 depo- larization of subject 1 using the same electrode configu- ration as Figure 2. This image was constructed from the unipolar potentials recordedfrom the central conducting disks of the Laplacian electrode in reference to Wilson’s central terminal. Notice the smeared nature and lack of spatial resolution of the BSPM compared with the BSLM as shown in Figure 2a. Figure 3b shows a typical BSLM during ventricular depolarization in a patient with left bundle branch block. Notice that the regions (A and C) overlying the right ventricle free wall and right ventricle outflow tract are activated, but no activity is seen over the left lateral region (B) corresponding to the left ventricle free wall. At the corresponding time, after the onset of depolarization (see Figure 2d) in normal subjects, this left lateral area (B) would be activated. In the 2 patients with left bundle branch block, left ventric- ular activation was delayed and/or diminished in intensi- ty as observed in the BSLM. This finding helps confirm the ability of the BSLM to resolve right and left ventric- ular activity.
The BSLM provides (1) sufficient spatial resolution to enable one, for the first time, to map regional myocar- dial events from the body surface; (2) much enhanced lateral resolution compared with the BSPM; and (3) much greater depth resolution than the BSPM. The BSLM tends to greatly emphasize sources located closest to the recording Laplacian electrode.16 In contrast, the BSPM tends to sum electrical activity from the entire heart. The enhanced spatial resolution of the BSLM compared with the BSPM is most dramatically demon- strated during atria1 depolarization (Figures 2a and 3a). The BSLM is able to resolve right and left ventricular depolarization and detect the activation sequence. The BSLM of ventricular repolarization demonstrates the distributed nature of T-wave activity. On the other hand, the BSPM is limited in its ability to resolve the distribut- ed nature of ventricular depolarization and repolariza- tion.
The present study demonstrates the ability of body surface Laplacian mapping to spatially resolve cardiac electrical activity. The BSLM may be interpreted as a 2- dimensional equivalent charge density distribution, in which the equivalent charge density is a projection of the 3-dimensional cardiac bioelectrical source distribution onto the body surface. l6 The spatial resolution of the BSLM is currently limited by the spacing of electrodes, and could be improved by increased electrode number. Mapping of lateral and posterior cardiac activity could be accomplished by placing electrodes on the lateral and posterior chest walls. Further investigations using more
electrodes covering the anterior, lateral and posterior chest wall are needed in order to study bioelectrical activi- ty from the entire heart.
By bringing to electrocardiography imaging tech- nology capable of anatomically resolving bioelectrical sources, body surface Laplacian mapping promises to greatly enhance the use of electrocardiography in all its current applications. Such applications may include the imaging of acute ischemia and acute current of injury by examination of the BSLM during the ST segment. In- farcted regions may be localized by identifying regions with absent ventricular depolarization. Furthermore, it might be possible to map abnormalities of impulse initia- tion and conduction to localize sites of origin of prema- ture atria1 or ventricular depolarizations, to localize sites of focal tachycardia, and to visualize macroreentrant cir- cuits of activity. Thus, body surface Laplacian mapping may provide a powerful new imaging tool for cardiovas- cular research and for the diagnosis and management of cardiovascular disease.
Acknowledgment: We are grateful to Gianfranco Pa- rati, MD, who performed physical examinations on some of the subjects.
1. Taccardi B. Distribution of heart potential on the thoracic surface of normal human subiects. circ Res 1963~12341-352. 2. Id&x I&, Bandura JP, Larsen RA, Cox JW, Keller FW, Brody DA. Local- ization of heart vectors produced by epicardii burns and ectopic stimuli. Circ Res 1975;30:105-112. 3. Yamada K, Toyama J, Wada M, Sugiyama S, Sugenoya J, Toyoshima H, Miino Y, Sotohata I, Kobayashi T, Okajima M. Body surface isopotential mapping in Wolff-Parkinson-White syndrome. Noninvasive method to determine the localization of the accessory atrioventricular pathway. Am Heart J 1975;90: 721-734. 4. Abiklskov JA, Burgess MJ, Lux RL, Wyatt RF. Experimental evidence for regional cardiac influence in body surface isopotential maps of dogs. Circ Res 1976;38:386-391. 8. Mirvis DM, Keller FW, Ideker RE, Cox JW, Zettergren DG, Dowdie RF. Values and limitations of surface isopotential mapping techniques in the detection and localization of multiple discrete epicardial events. J Eiectrocardiol 1977; l&347-358. 6. Spach MS, Barr RC, Ianning CF. Experimental basis for QRS and T wave potentials in the WPW syndrome. Circ Res 1978;42:103-118. 7. Green IS, Lux RL, Haws CW. Detection and localiition of coronary artery disease with boay surface mapping in patients with normal electrocardiograms. Circulation 1987;76:1290. 8. Mirvis DM, ed. Bcdy Surface Electrocardiographic Mapping. Boston: Kluwer Academic Publishers, 1988. 9. Rudy Y, Plonsey R. A comparison of volume conductor and source geometry effectson body surface andepicardiil potentials. CRCCircRes 1980;46:283-291. 10. Suach MS. Barr RC. tima CF. Tucek PCL. Griain of bcdv surface ORS and Twave potentials from epic&ll’potential distribu%ons in the intact C&I: pame. Circulation 1977;55:268-278. Il. Plonsey R. Bioelectric Phenomena. New York McGraw-Hill, 1969. 12. Barr RC, Spach MS. Inverse calculation of QRS-T epicardial potentials from body surface potential distributions for normal and ectopic beats i&the intact dog. Circ Res 1978;42:661-675. 13. Rudy Y, Measinger-Rapport BJ. The inverse problem in electrocardiography: solutions in terms of epicardial potentials. Crit Rev Biomed Eng 1988;16: 215-268. 14. Choi J, Pilkington TC. Effects of geometrical uncertainties on electrocardiog- raphv. IEEE Tranr Biomed Em 1981:28:325-334. 1s. He B, Cohen RJ. Body surf& Iaplacian mapping in man. Proc 13th Annu Int Conf IEEE Eng Med Biol Sot 1991;784-786. 16. He B, Cohen RJ. Body surface Laplacian ECG mapping. IEEE Tranr Biomed Eng, in press. 17. Fattoruaso V, Thaon M, Tihnant J. Contribution of l’etude de l’eleotmcardio- gramme precordial. Acto Cardiol 1949;4:464-487. 16. Thaon M, Minot G, Damoiselet R, Thevenet J. Contribution a l’etude de la double electrode a element concentriquea dite “electrode circulaire.” Acta Cardiol 1951;7:327-346. 19. Durrer D, van Dam RT, Freud GE, Janse MJ, Meijler FL, Arzbaecher RC. Total excitation of the isolated human heart. Circulation 1970;41:899-912. 20. Wyndham CR, Meeran MK, Smith T, Saxena A, Engehnan RM, Levitsky S, Rosen KM. Epicardial activation of the intact human heart without conduction defect. Circulation 1979;59:161-168.
1620 THE AMERICAN JOURNAL OF CARDIOLOGY VOLUME 70 DECEMBER 15. 1992


![Fast Local Laplacian Filters: Theory and Applications · Fast Local Laplacian Filters: Theory and Applications • 3 Local Laplacian filtering. Paris et al. [2011] introduced local](https://img.pdfslide.us/doc/110x75/5c8ca33b09d3f236358c3284/fast-local-laplacian-filters-theory-and-applications-fast-local-laplacian-filters.jpg)


![Laplacian - ISBEM · electrocardiogram and recent developments of body surface Laplacian mapping, ... negative surface Laplacian of the body surface potential [3,9]](https://img.pdfslide.us/doc/110x75/5b6781f77f8b9af77c8b6336/laplacian-electrocardiogram-and-recent-developments-of-body-surface-laplacian.jpg)