Embed Size (px)
Citation preview

Loughborough UniversityInstitutional Repository
Body mapping of sweatingpatterns in athletes: a sex
comparison
This item was submitted to Loughborough University's Institutional Repositoryby the/an author.
Citation: SMITH, C.J. and HAVENITH, G., 2012. Body mapping of sweatingpatterns in athletes: a sex comparison. Medicine and Science in Sports andExercise, 44 (12), pp. 2350�2361.
Additional Information:
• This is a non-final version of an article published in finalform in the journal Medicine and Science in Sports and Exer-cise [ c© American College of Sports Medicine] and the defini-tive version is available at: http://pdfs.journals.lww.com/acsm-msse/2012/12000/Body_Mapping_of_Sweating_Patterns_in_Athletes___A.12.pdf
Metadata Record: https://dspace.lboro.ac.uk/2134/10115
Version: Accepted for publication
Publisher: c© The American College of Sports Medicine
Please cite the published version.

This item was submitted to Loughborough’s Institutional Repository (https://dspace.lboro.ac.uk/) by the author and is made available under the
following Creative Commons Licence conditions.
For the full text of this licence, please go to: http://creativecommons.org/licenses/by-nc-nd/2.5/

1
Body Mapping of Sweating Patterns in Athletes: A Sex Comparison
Caroline J. Smith and George Havenith
Environmental Ergonomics Research Centre, Loughborough University, UK
Address for correspondence: George Havenith, Loughborough Design School, Environmental
Ergonomics Research Centre, Loughborough University, Loughborough, Leicestershire, LE11
3TU. UK.
Phone: +44 (0)1509 223031
Fax: +44 (0)1509 223014
Email: [email protected]
Running Title: Body Sweat Mapping: A Sex Comparison
Conflicts of Interest and Sources of Funding: The current research was co-funded by Adidas
Innovation Team, Germany, and the Environmental Ergonomics Research Centre,
Loughborough University, UK.
*Manuscript (include title page, abstract, text, references)
2
Abstract
Purpose: Limited regional sweat data are available for females, with only a small number of
sites measured across the body. Similarly, sex differences in sweating typically concentrate on
whole body sweat loss, with limited data on regional sweat rates (RSR). Methods: A modified
absorbent technique was used to collect sweat at two exercise intensities (60% (I1) and 75% (I2)
V O2 max) in 13 aerobically trained females (21±1 yrs, 59±7 kg, 1.64±0.1 m2, 18±4% body fat,
59.5±10 ml-1
.min-1
.kg-1
VO2max) in moderately warm conditions (25°C, 45% rh, 2 m.s-1
air
velocity). Female data were compared to 9 aerobically trained males (23±3 yrs, 74±5 kg,
1.92±0.1 m2, 11±5% body fat, 70.2±13 ml
-1.min
-1.kg
-1 VO2max) tested under the same
experimental conditions. Results: Female RSR at I1 were highest at the central upper back,
heels, dorsal foot, and between the breasts, with values of 223, 161, 139 and 139 g.m-2
.h-1
,
respectively. Lowest values were over the breasts and at the mid and lower outer (lateral) back
with values below 16 g.m-2
.h-1
. Similarly at I2 the central upper back and bra triangle showed
some of the highest RSR in addition to the lower back, showing values of 723, 470, and 333 g.m-
2.h
-1, respectively. Regions of the breasts and the palms had the lowest RSR at I2 with values
below 82 g.m
-2.h
-1, respectively. Significantly greater absolute GSL and thus RSR were observed
in males compared to females at both exercise intensities. For the same metabolic heat
production (comparing male I1 vs. female I2) both absolute and normalised RSR data showed a
significant region and sex interaction (p < 0.001), with a greater distribution towards the arms
and hands in females compared to males. Conclusions: Despite some differences in distribution,
both sexes showed some of the highest RSR on the central upper back and the lowest towards the
extremities. No correlation was observed between local skin temperature and RSR, failing to

3
explain the RSR variation observed. These data have important applications for sex specific
clothing design, thermophysiological modelling, and thermal manikin design.
Keywords: sweating, metabolic rate, sex, sweat mapping, regional

4
Introduction
Paragraph 1 The majority of thermoregulatory research available focuses on males rather than
females and emphasises core temperature and whole body sweat loss. Limited research is
available on females, with a sparsity of information on regional sweat rates. Historically,
regional sweat rates have been measured over a very limited number of sites or studies have used
qualitative methods to assess sweating over large surface areas (Kuno, 1956). More recently,
several studies have measured regional sweat rates on multiple body regions (12, 30-32, 39, 40,
42), however, these studies used only males or reported combined data from both sexes. The
only data currently available on females were limited to torso sweat rates (22), which identified
significant regional variation between zones. The first study measuring regional sweat rates over
almost the whole body surface area in males was recently published by Smith and Havenith (38),
identifying both significant inter and intra-regional variation in sweating. To the knowledge of
the authors no study has attempted to measure regional sweat rates simultaneously over large
skin surface areas for females.
Considerable debate surrounds sex differences in thermoregulation. Traditionally, women
(testing a population average) are considered less effective in regulating body temperature than
males in dry heat (36), with maintenance of a significantly lower sweat rate compared to men,
and a substantially higher rectal temperature (7, 13, 14, 36, 37). A more pronounced delay in
sweat onset has also been noted in women, attributed in part to a lower body water content (20),
and potential effects of menstruation (25). Observations of sex-related differences in sweat rate,
sweat thresholds (25), sweat gland size and distribution (4, 5, 25) have contributed to the opinion
that females generally sweat less than males. Conversely, several studies have observed that sex

5
differences in thermoregulation cease to be significant upon matching subjects or correcting for
anthropometric, acclimatisation, and fitness parameters (2, 3, 14, 15, 23, 24). Such disagreement
in the literature must be viewed with careful consideration of the experimental design,
measurement technique and subject characteristics. Individual characteristics play a major role in
thermoregulatory responses to heat stress (23, 24) and are thought to explain a substantial part of
response variation observed (17). More recently, however, studies supporting the existence of
sex-differences per se in thermoregulation have emerged; Madeira and colleagues (33) have
demonstrated a greater pilocarpine-induced sweating responses in males compared to females
when groups were matched for V O2 peak. Aerobic capacity is known to enhance sudomotor
response to pilocarpine in males (8), which may partially explain sex differences in local
sweating in studies using unmatched groups. In addition, Gagnon et al. (19) observed lower
evaporative heat loss and thermosensitivity in females despite a fixed absolute metabolic heat
production and matching of physical characteristics between sexes.
This is of particular importance when considering fixed absolute versus relative work rates,
whereby sex differences may be artificially created. During absolute work rate protocols, results
may be confounded between groups if unmatched for V O2 max and/or body composition.
Alternatively, when relative work rates are used differences in absolute work rates and thus
metabolic heat production may arise between sexes (18, 21). Group ‘matching’ is therefore
important to consider and in doing so either comparing ‘average’ individuals from each
population or, to match V O2 max, accepting that this is an unrepresentative sample from one
population. With this in mind, the present study has taken an applied approach in comparing

6
thermoregulatory responses between sexes in which the groups were selected for similar training
and athletic performance levels (elite to sub-elite athletes) and were therefore not matched for
physical characteristics. For exercise load it was decided to use relative work rates which
represent training and competition practice.
Paragraph 2 The aims of the present study were 1) to produce a whole body sweat map of
aerobically trained females during mild exercise-induced hyperthermia, and 2) compare these
data to previously published body maps of sweating in aerobically trained males produced in our
laboratory under the same experimental conditions (38). It was hypothesised that, similar to
males, significant regional variation in sweat rate would be observed within the female group,
with consistent patterns of variation between participants. It was further hypothesised that
females would sweat significantly less than males due to a lower absolute metabolic heat
production when exercising at a fixed relative workload, arising from a lower absolute aerobic
capacity. Similar patterns of distribution of sweating were expected between sexes.

7
Methods
Participants
Paragraph 3 Thirteen female unacclimated, aerobically trained, elite to sub-elite runners
participated in whole body sweat mapping. All experimental procedures were approved by the
Loughborough University Ethical Committee and were fully explained to the participants before
obtaining informed written consent and completion of a healthscreen questionnaire.
Pre-Test Session
Paragraph 4 Participants attended the Environmental Ergonomics Research Centre for
anthropometric measurements of height, mass, and body dimensions used for the calculation of
body surface area (9) and absorbent pad sizes. Skinfolds were taken using a 4 point calliper
method (26) specific to female athletes for calculation of body fat percentage. Aerobic fitness
level, expressed as maximal oxygen uptake (V O2 max), was calculated from a sub-maximal fitness
test based on the Åstrand-Ryhming method (1). The test was conducted at an ambient
temperature of 18°C to prevent thermal stress and comprised of four exercise intensities running
on a treadmill (h/p/cosmos mercury 4.0 h/p/cosmos sports & medical gmbh, Nussdorf-
Traunstein, Germany) each lasting five minutes. Estimation of V O2 max was based upon the linear
relationship between heart rate and work rate (work rate based upon treadmill speed and angle
(10).
Sweat Pad Preparation and Application
Paragraph 5 Regional sweat rates (RSRs) were determined using the method developed in our
laboratory (12, 22, 38, 39) by applying absorbent material directly to the skin for a short,

8
predefined period of time (5 minutes). Two sets of absorbent pads were produced for each
participant based on the anthropometric data ( see online text, Supplemental Digital Content 1
(SDC-1) for details of pad sizing). Pads were weighed (Sartorius YACOILA, Sartorius AG,
Goettingen, Germany. Precision 0.01g) inside individually labelled airtight bags, in which they
were stored until testing. A total of 78 pads were used to produce a whole body sweat map for
each exercise intensity (see Figure 1. of online Supplemental Digital Content 2 (SDC-2) for
sweat map pad locations). Pads were attached to custom sized plastic sheeting for fast
application to the body and to prevent the evaporation of sweat during the test periods. The pads
were kept in place against the skin using a stretch long sleeve t-shirt and trousers. For the breast
area pads were attached inside a sports bra. On the feet, pads were secured in place on the ankles
and dorsal surface of the foot inside 100% cotton socks which were also used to collect sweat
from the top of the foot. Plastic stretch socks were worn on top to prevent evaporation of sweat
from the cotton socks during the measurement period. Similarly, 100% cotton gloves were worn
to collect sweat on the hands, with small incisions made at the base of each finger to prevent the
migration of sweat between regions, while maintaining their structural integrity during the test.
Latex gloves were worn over the cotton gloves during the measurement period to secure the
gloves in place against the skin and prevent sweat evaporation.

9
Experimental protocol
Paragraph 6 Experimental sessions were conducted in a climate controlled room at 25.7 ±
0.4°C, 45 ± 7% relative humidity, and a 2 m.s-1
frontal air velocity. Data were obtained in three
identical experimental sessions per participant, with approximately one third of the skin surface
area covered in each test, thus allowing enough exposed skin for thermoregulation. The three
sessions focused on 1) torso/upper body (UB), 2) legs, and 3) arms, hands, buttocks, and feet
(AHBF). Testing sequence was balanced to prevent any order effect and performed at the same
time of day to minimise circadian variation. Menstrual cycle phase was not controlled for during
experimental sessions; participants were tested over a wide range of the menstrual cycle,
providing a representative sample of menses state in the results.
Paragraph 7 On arrival to the laboratory participants were provided with shorts and t-shirt and
then weighed. Infra-red images (IRI; Thermacam B2, FLIR Systems Ltd., West Malling, Kent,
UK) of the nude, dried, skin were taken prior to testing, before and after each pad application,
and immediately after testing to monitor Tsk. Resting heart rate (HR) was recorded before
participants warmed up, with HR monitored throughout the experiment at 15 second intervals.
Tcore was measured using a VitalSense Integrated Physiological Monitoring System (Mini Mitter
Company, Inc. Bend, Oregon, USA). Participants swallowed a CorTemp™ ingestible
temperature pill 5 hours before testing. Throughout the experiment the VitalSense monitor
wirelessly tracked and recorded Tcore four times per minute. Participants ran for a total of 60
minutes involving two exercise intensities of 30 minutes each on the treadmill with an incline of
1%. The target HR was 125-135 and 150-160 beats per minute (bpm) for intensity 1 (I1) and
intensity 2 (I2), respectively, in order to control workload at the targets of 60% and 75% of V O2

10
max. Exercise intensities were not separated by a break; however, subjects were required to step
off the treadmill for all measurements and pad application/removal (approximately 3 minutes).
Participants removed their clothing and towelled their skin dry immediately prior to pad
application to ensure only sweat produced during the sample period was collected. All of the
pads had an impermeable backing to prevent evaporation. Sweat samples were taken during the
last 5 minutes of each exercise intensity at 30 minutes and 60 minutes, during which time the
participants returned to the treadmill donning the absorbent pads. Immediately following the
sample periods the pads were quickly returned to their airtight bags and sealed. The participants
could drink water freely during the experiment, which was recorded, in order to prevent
dehydration. Following the 60 minute run, final measurements of core temperature, skin
temperature and body weight were recorded. All pads were re-weighed inside their sealed bags.
The cotton glove and sock segments could not be individually weighed before testing as they
were not yet separated from each other. Immediately following sweat collection, specific
sections of the gloves and socks were dissected and placed in individually labelled airtight bags.
The post-test wet weight of each sample was recorded before being dried out in a thermal
chamber at 30°C, 50% rh for 24 hours then re-weighed to obtain the ‘dry’ (pre-test) weight. The
surface area of each pad was calculated from the dry weight of each pad and the weight per unit
of surface area of the material. Local sweat rate was calculated in grams per meter square of
body surface area per hour (g.m-2
.h-1
) using the weight change of the pad, the pad surface area,
and duration of application to the skin.

11
Analysis
Paragraph 8 As data from the different experimental sessions were to be combined in a whole
body sweat map, and as sweat rates may differ, even between identical sessions for an individual,
it was decided to correct individual session data in line with the session’s gross sweat loss (GSL)
value. Data for each individual were standardised towards the mean GSL over all three sessions
for that individual. All corrections work on the assumption that within each work load there is a
relation between regional and GSL for an individual.
GSL was calculated based on the weight change of each participant across each test period,
adjusted for fluid intake. Corrections were made for respiratory and metabolic mass losses.
Evaporative loss from respiration ( , Watts) was calculated using equation [1], based upon
work described by Livingstone et al. (29):
[1]
And converted into mass loss (g):
Mass Loss = [2]
Where;
evaporative loss from respiration (W)
metabolic rate (W)
air temperature (ºC)
time: duration of intensity or experiment (s)
2430, latent heat of evaporation of 1 gram of water (J.g-1
)
Metabolic mass loss (g) was calculated based upon Kerslake (27):
resE
31.27 10 (59.34 0.53 11.69 )res a aE M T P
1
2430resE t
resE
M
aT
t
12
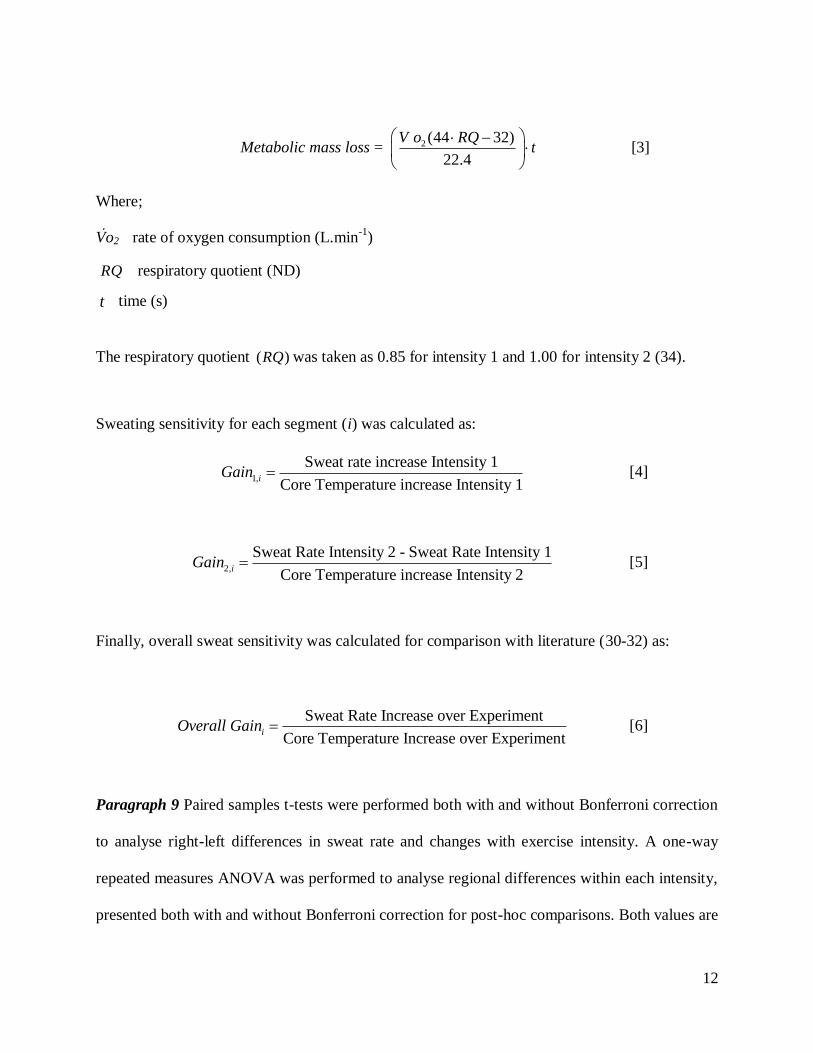
Metabolic mass loss = [3]
Where;
V o2 rate of oxygen consumption (L.min-1
)
respiratory quotient (ND)
time (s)
The respiratory quotient was taken as 0.85 for intensity 1 and 1.00 for intensity 2 (34).
Sweating sensitivity for each segment (i) was calculated as:
[4]
[5]
Finally, overall sweat sensitivity was calculated for comparison with literature (30-32) as:
[6]
Paragraph 9 Paired samples t-tests were performed both with and without Bonferroni correction
to analyse right-left differences in sweat rate and changes with exercise intensity. A one-way
repeated measures ANOVA was performed to analyse regional differences within each intensity,
presented both with and without Bonferroni correction for post-hoc comparisons. Both values are
2 (44 32)
22.4
V o RQt
RQ
t
( )RQ
1,
Sweat rate increase Intensity 1
Core Temperature increase Intensity 1iGain
2,
Sweat Rate Intensity 2 - Sweat Rate Intensity 1
Core Temperature increase Intensity 2iGain
Sweat Rate Increase over Experiment
Core Temperature Increase over ExperimentiOverall Gain

13
presented firstly due to the exploratory nature of the study and secondly due to the large number
of zones studied compared to any earlier study (6, 35). This makes the Bonferroni correction
very stringent and zones that would show significance in a smaller study will struggle to reach
significance here. For RSR comparison between sexes, a two way repeated measures ANOVA
was performed with sex (between subject factor), region, and sex-region interaction as factors.
To allow direct comparison of the upper chest between sexes despite the use of differing pads,
the upper chest (3 pads) in the males and the upper chest and bra pads (11 pads) in the females
were area weighted to produce a single ‘upper chest’ sweat rate value for each sex.
Paragraph 10 To allow standardisation of sweat data over participants and for the easy
identification of ‘higher’ and ‘lower than average’ sweat regions regardless of absolute sweat
rates, RSRs were normalised for the area weighted sweat rate of all zones. The same analysis
was performed on the normalised regional sweat data as described above for the absolute data.
Pearson’s correlation coefficient was calculated to assess correlations between RSRs and
regional Tsk, and RSRs and GSL. Finally, it was decided that it would be more relevant to
graphically show results for the ‘average sweater’ (the median) rather than the ‘average amount
of sweat produced’ (the mean), as the latter can be affected more easily by outliers, i.e. extreme
sweaters. In tables, both values are presented to provide insight into the data distribution.
Male data presented in the present paper have been reported previously (38) and are in part
included here to allow comparison with the female data.

14
Results
Participant Characteristics
Paragraph 11 Female subjects were significantly shorter (female 165 ± 8 cm vs. male 179 ± 4,
p < 0.001), lighter (59 ± 7 vs. 74 ± 5 kg, p < 0.001) , had a smaller surface area (1.64 ± 0.10 vs.
1.92 ± 0.10 m2, p < 0.001) , and showed a higher body fat percentage than males (18 ± 4 vs. 11 ±
5 %, p<0.01). Although age was significantly different between groups ( female 21 ± 1 vs. male
23 ± 3 yrs, p=0.047) this was not biologically relevant. Females had a significantly lower V O2
max (59.5 ± 10 vs. 70.2 ± 13 ml.kg-1
.min-1
, p<0.05) with a value 85% that of the trained males.
When based on fat free mass females had a V O2max 92% that of males (female 78.9 vs. male 72.6
ml.kg-1
.min-1
).
Core Temperature, Work Rate, and Heart Rate
Paragraph 12 Female Data: Baseline data were taken as the temperature and HR recorded
immediately before commencing I1. Reported I1 and I2 data were the mean values over the final
5 minutes of each intensity. Tcore increased significantly from 37.29 ± 0.29°C at baseline to 37.83
± 0.19°C at I1 (BL to I1 ΔTcore = 0.54 ± 0.21°C, p<0.001), and to 38.06 ± 0.24°C at I2 (ΔTcore;
BL to I2 = 0.77 ± 0.35°C, p<0.001, I1 to I2 = 0.23 ± 0.25°C, p<0.01). HR increased significantly
from 66 ± 13 bpm at baseline to 134 ± 3 at I1 (p<0.001), and to 157 ± 3 (p<0.001) at I2,
reflecting relative work rates of 61 ± 7 and 72 ± 11%V O2 max for I1 and I2, respectively.
Paragraph 13 Sex Comparison: No differences in HR were present between groups for either
exercise intensity, however, running speed (km.h-1
) was significantly higher in males compared
to females (I1 10.4 ± 2.0 vs. 8.5 ± 1.7, p<0.05; I2 13.6 ± 2.2 vs. 10.5 ± 1.7, p<0.01). Males

15
showed a lower resting Tcore than females (male 36.93 ± 0.39°C, p<0.05) but no sex difference
was present at the end of either exercise intensity (Male I1 = 37.68 ± 0.45°C, I2 = 38.06 ±
0.44°C). ΔTcore were significant over both exercise intensities (Male ΔTcore; BL to I1 = 0.76 ±
0.18°C, I1 to I2 = 0.45 ± 0.30°C, p<0.001) in both sexes, with the rise being significantly greater
in males from BL to I1, reflecting the lower resting Tcore (p<0.05).
Gross Sweat Loss
Paragraph 14 Female data: Substantial variation in GSL was observed both within (between
sessions) and between participants. The mean GSL of all sweat mapping experiments was 272 ±
103 g.m-2
.h-1
, with mean values for upper body/torso (UB), legs, and arms, hands, buttocks and
feet (AHBF) sessions of 300 ± 113, 268 ± 95, and 246 ± 101 g.m-2
.h-1
, respectively. The mean
surface areas covered in each experiment were 0.49, 0.45, and 0.33 m2 for the AHGF, legs, and
UB experiments, respectively, totalling 1.28 m2. The percentage of body coverage was 30.1%,
27.7%, and 20.2% over the three experiments, totalling 78% of the whole body. GSL increased
significantly with exercise intensity (p<0.001) from 168 ± 81 to 410 ± 144 g.m-2
.h-1
and
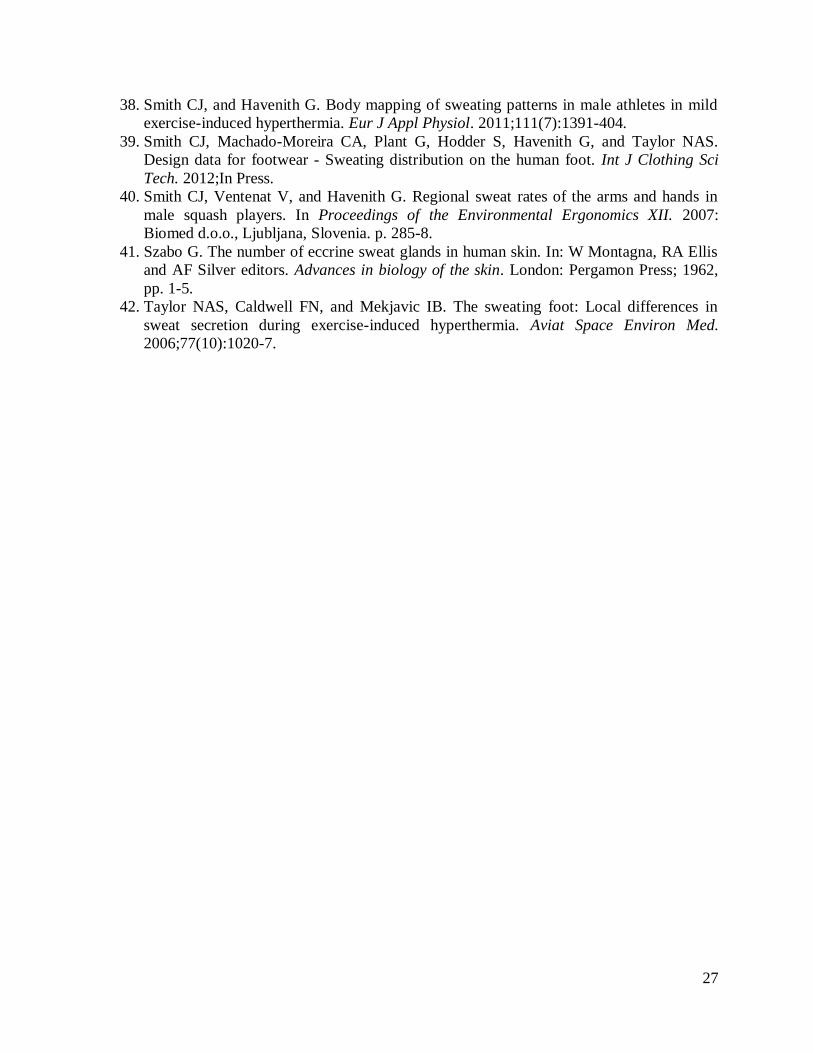
correlated positively with V O2 max (r = 0.71, p<0.01) and for individual work intensities (Figure
1) GSL (g.h-1
) correlated positively with metabolic rate (W; I1 r = 0.89, p<0.001; I2 r = 0.87,
p<0.05) with no significant difference present between the gradient of regression lines for each
exercise intensity.
Paragraph 15 Sex comparison: Males showed significantly higher GSL compared to females
both during each exercise intensity and overall (male GSL: I1 364 ± 84, I2 657 ± 119 g.m-2
.h-1
,
overall 458 ± 115 g.m-2
.h-1
; male vs. female GSL all p<0.001). When GSL was plotted against V

16
O2 max, no significant differences between the gradient of the regression lines or the intercepts
were present between sexes. Metabolic heat production was significantly greater in males than
females expressed in absolute terms (Figure 1: male I1 993 ± 185 W, I2 1335 ± 259 W, both p <
0.001), but only at I2 when expressed as a function of surface area (male I1 519 ± 103 W.m-2
, p
= 0.081; I2 697 ± 137 W.m-2
, p < 0.01).
Regional Sweat Rates
Paragraph 16 Female Data: RSR data were grouped for corresponding right and left zones since
only one zone showed a bilateral difference. Median grouped data for all participants are
illustrated for both exercise intensities in Figure 2. The pads illustrated in grey, located below the
anterior and posterior neck and at the axilla, acted to absorb excess sweat which might otherwise
have dripped from these areas and thus preventing it from being absorbed by adjacent pads.
These extra pads were discarded following sweat collection and were not used in sweat mapping
calculations. The highest sweat rates observed at I1 were at the central upper back, heels, dorsal
foot, and between the breasts, with values of 223, 161, 139, and 139 g.m-2
.h-1
, respectively.
Sweat rate increased at all regions with increasing exercise intensity, with exception of the feet,
ankles, and the lateral lower breast (Table 1). At I2 the central upper back and the area between
the breasts showed the highest sweat rates with values of 723 and 470 g.m-2
.h-1
, compared to
significantly lower values on the breasts and towards the extremities. Detailed comparisons of all
absolute regional sweat rates within each exercise intensity may be viewed in the Supplemental
Digital Content 3 (SDC-3, Tables 1-4).‘Higher’ and ‘lower than average’ sweat rates may easily
be identified using normalised regional sweat rate data, illustrated in Figure 3. Regions with
sweat rate ratios significantly different from average (=1) are denoted in Table 1 by grey shading

17
in the ratio column. A comparison of normalised ratio data between exercise intensities indicated
little change in distribution between I1 and I2, with exception to a significant decrease in
distribution towards the feet and shoulders and an increase towards the breasts at the higher
exercise intensity.
Paragraph 18 Sex comparison: Regional absolute and normalised sweat data for male athletes
(adapted from Smith and Havenith (38)) is presented in Figure 4. Absolute and normalised data
comparisons between sexes are presented both with and without Bonferroni correction in Table
2. As expected, males showed significantly greater absolute local sweat rates compared to
females at both exercise intensities, with exception of areas of the hands and feet at I1 and only
the thumbs and dorsal hand at I2. Both sexes did exhibit similarities in regional sweat rates,
showing 1) greater sweat rates on the anterior compared to the posterior torso, 2) a medial to
lateral decrease in sweat rates across the torso, 3) the greatest sweat rates on the central and
lower back (with exception to the bra triangle in females at I2), and 4) the lowest sweat rates
towards the extremities. Normalised ratio data (Figure 3. vs. Figure 4b) indicated a significantly
higher distribution of sweat towards the torso in males, and females showing a significantly
higher distribution towards the hands and feet compared to males at both exercise intensities.
Since no significant difference in absolute metabolic rate was present between sexes for male I1
compared to female I2 a comparison of absolute and normalised data between sexes was
performed for these data (Table 2). GSL do not differ significantly between males at I1
compared to females I2 when compared in absolute terms (male 699 ± 157 vs. female 685 ± 260
g.h-1
, p = 0.887), nor when normalised for body surface area (365 ± 84 vs. 410 ± 131 g.m-2
.h-1
, p

18
= 0.379). Absolute RSR remained significantly higher in males compared to females on the
torso, legs, and areas of the feet, representing 17 of the 34 regions compared. Despite
significantly greater sweat rates in males, regions of high and low sweating were similar between
sexes. A significant region-sex interaction for both I1 and I2 normalised data (p<0.001) did
however indicate some differences in distribution. Fewer differences were present in relative
sweat distribution compared to absolute data, with the main exception being significantly greater
ratio values for the arms and hands in females compared to males, with significance present at 9
out of the 34 regions compared.
Skin Temperature
Paragraph 19 Female Data: Regional Tsk data were right and left grouped due to only five
regions out of the 48 measured showing significant bilateral differences, and no significant
differences following Bonferroni correction. Tsk increased from baseline to I1 at only the feet and
ankles (uncorrected: heels, soles and dorsal foot p < 0.001, ankles p < 0.05. Corrected: heels and
soles p < 0.001, dorsal foot p < 0.01), reflecting their low baseline temperatures. The lowest
baseline Tsk of 26.5°C was observed at the heels compared to the highest value of 34.0°C at the
anterior upper chest and medial upper back. Interestingly, the mean increase in Tsk of all regions
from pre to post pad application was 1.1°C for both I1 and I2, reflecting the impact of the
measurement technique itself on Tsk.
Paragraph 20 A within-participant analysis of the correlation between RSR and corresponding
regional Tsk was performed to avoid the potentially confounding effects of between-participant
factors on Tsk and RSR (particularly absolute work rate affecting SR). RSR and regional Tsk were

19
not correlated in any participant at either exercise intensity or across measurement periods (mean
± SD Pearson’s r correlation: I1 0.14 ± 0.34, I2 0.06 ± 0.17).
Paragraph 21 Sex Comparison: No significant differences in regional Tsk were present between
sexes at any measurement period with exception to baseline. Similarly to the females, the lowest
regional Tsk for males at baseline of 25.8°C was at the heels, compared to the highest of 32.5°C
observed on the anterior upper arm. Tsk at baseline was significantly higher in females at all
regions of the upper body (torso: posterior medial upper, posterior lateral upper, p<0.05; anterior
upper, anterior medial lower, anterior lateral lower, posterior medial lower, posterior lateral
lower, p<0.01; sides, p<0.001). The posterior medial upper, posterior lateral upper, anterior
medial lower and posterior lateral lower regions did not show significance following Bonferroni
correction. Absolute regional Tsk increased significantly at only the feet and ankles during I1,
with most sites on the torso and the anterior arms increasing from I1 to I2. The mean increase in
Tsk over all regions during pad application was 0.9°C during I1 and 0.8°C during I2, reflecting
the impact of the procedure on Tsk (For complete regional Tsk data see Supplemental Digital
Content 4 (SDC-4)). No correlation between RSR and regional Tsk was observed in males
(Pearson’s r correlation: I1 0.17 ± 0.23, I2 -0.11 ± 0.19).
Discussion
Paragraph 22 The present study aimed to produce a whole body sweat map of aerobically
trained Caucasian females at two exercise intensities in a temperate environment. A secondary
aim of the study was to compare this data with whole body sweat maps of aerobically trained
Caucasian males tested under the same experimental conditions (38). The data have clearly
illustrated significant intra and inter-regional variation in sweat rate in aerobically trained
20
females, similar to that observed in males, and has shown large variation in absolute sweat rates
between individuals. Regardless of the variation in absolute quantities of sweat produced,
differences in distribution were observed between sexes, despite similarities in high and low
sweat regions. Such differences should be considered in sex specific application of clothing
design, clothing evaluation with thermal manikins and thermal modelling.
Paragraph 26 It is clear from the present data that absolute gross sweat rates were significantly
higher in males compared to females exercising at the same relative work rate and unmatched for
physical characteristics. This approach elicited a greater metabolic heat production in males (18)
due to a higher absolute work rate compared to females and a greater body mass. This is largely
reflected in the absolute regional sweat data in which 28 of the 34 regions measured were
significantly higher in males than females at I1 and 32 of the 34 regions at I2. When considering
distribution, at both exercise intensities the males had a significantly higher distribution of sweat
towards the torso whilst the females had a significantly higher distribution towards the hands and
feet in comparison to males. Comparing absolute sweat rates between sexes when exercising at
similar rates of metabolic heat production (male I1 vs. female I2) still 17 of the 34 regions
measured were significantly higher in males, mostly on the torso and legs, despite the similarity
in GSL. Although the distribution of sweat was approximately similar between sexes, females
did show a significantly higher distribution towards the arms (anterior and posterior) and hands
(fingers, thumbs and dorsal hand) than the males, compared to a small number of regions
showing a higher distribution of sweat on the torso in males compared to females. These data are
consistent with previous upper body sweat mapping data produced by our laboratory using males

21
and females of equal aerobic fitness (22). These data observed no overall effect of sex but a
significant zone and sex interaction which showed that certain regions sweated more in males
whilst other regions sweated more in females. Similarly to the present data, the highest
normalised sweat rates were observed on the mid-central back in both sexes (with exception only
to the area between the breasts in females), sweating to be greater on the posterior compared to
anterior torso, and lowest on the extremities.
Paragraph 27 Explaining the observed differences in sweat distribution both within and between
sexes requires further investigation. They cannot be explained by Tsk in the present data, and
high versus low heat activated sweat gland distributions are reported to be similar in both males
and females (28). Despite a higher heat activated sweat gland density in females there are no
differences in total numbers of glands between sexes due to a greater surface area in males.
Notably, a lower output per gland in females for a given thermal or pharmacological stimulus (5,
25, 33) may help explain the lower absolute RSRs in females compared to males, although not
the regional differences, nor the impact on the heat balance this may have. In both sexes,
regional sweat gland densities vary considerably over the body, with the greatest densities
(glands.cm-2
) reported on the soles (620 ± 120), forehead (360 ± 60), and cheeks (320 ± 60),
compared to the lowest values on the back, buttocks, arms and legs (ranging from 160 ± 30 to
120 ± 10, respectively) (41). Notably, this data used a small cadaver sample in which the type of
sweat gland and its status as active or inactive was not discernible. A comprehensive review of
torso sweat gland densities (inactive and active) is available from Machado-Moreira et al. (31),
providing more reliable values. Regional glandular densities on the torso were relatively uniform
(range:115-81 glands.cm-2
on the abdomen and the chest and abdomen (umbilicus),

22
respectively), failing to explain the regional sweating variation observed in the present study.
Alternative explanations include the number of active sweat glands, output per gland, and
sudomotor sensitivity. Segmental sudomotor sensitivity calculated by Machado-Moreira et al.
(31) closely matched regional sweat rate variation observed in the current data, supporting this
factor as a likely explanation.
Applications: Applications for the current data can be found in a number of areas. Firstly, in
models of human thermophysiology; these have moved over the last 5 decades from relatively
simple 2-node models (a core and a skin compartment) (16) to highly detailed multi-node models
that represent the whole body shape and calculate heat exchanges separately for many individual
compartments (e.g. 63 body surface segments for Fiala (11)). This means that heat transfer is
calculated differently for a chest section than for an arm section, for example. Until the current
data were available, this difference was only in the heat transfer coefficients (difference in
movements), but now also different sweat production levels for different areas can be included
(11) providing an additional level of realism. The second application area is in clothing design.
The body mapping data provided from the present and earlier work(12, 38), have been used by
sportswear designers to target areas of high sweat generation with additional ventilation openings
and with fabrics with different absorption and wicking properties, thereby improving heat loss
(39). Thirdly, the obtained data feed directly into the design of sweating thermal manikins, used
for the evaluation of clothing and environments; Being able to provide a more realistic sweat
distribution adds an extra level or realism.

23
Paragraph 28 Conclusion: During exercise in a temperate environment aerobically trained
Caucasian females demonstrated large regional variation in absolute regional sweat rates over the
body but a consistent pattern of distribution. When compared to aerobically trained Caucasian
males working at the same relative work rates, males showed a greater gross sweat loss
compared to females owing to a greater metabolic heat production. Despite this, males and
females showed similar ‘high’ and ‘low’ sweat distributions, however, slightly different overall
patterns of distribution were present between sexes. Males had a relatively higher distribution of
sweat towards the torso compared to females, where the arms, hands and feet contributed
relatively more to total sweat loss in the females. Regional variation in sweat rate cannot be
explained by regional skin temperature in the present study and does not correspond with
regional sweat gland densities reported in the literature.
Limitations and Future Research: The present research has provided novel regional sweating
data in Caucasian females and a comparison with Caucasian males under the same experimental
conditions. It is difficult to dissociate the contributions of physical characteristics to the core
temperature responses, requiring further studies using groups matched for physical
characteristics to elucidate sex differences. Due to the applied and largely descriptive approach
of this work it is beyond the scope of the paper to explain both the regional sweating variation
and sex differences from a mechanistic viewpoint. Future work is needed to investigate regional
differences in active eccrine sweat gland densities, gland sensitivity, and sudomotor innervation.

24
Acknowledgements
Paragraph 29 The authors would like to acknowledge the continued support from the Adidas
Innovation Team during this study, with special thanks to Berthold Krabbe, Brady Anderson,
Jean Piere Roy and James Lamont.
Conflicts of Interest
Paragraph 30 The research presented was co-funded by the Adidas Innovation Team, Germany,
and the Environmental Ergonomics Research Centre, Loughborough University. The authors
were fully responsible for the conduct of the trial and the data.
The authors declare that there are no conflicts of interest.
The results from the present study do not constitute endorsement by the American College of
Sports Medicine.
25
References
1. American College of Sports Medicine. ACSM’s guidelines for exercise testing and
prescription. 6th ed. Baltimore (MD):Lippincott Williams & Wilkins; 2000. pp. 72-7.
2. Avellini BA, Kamon E, and Krajewski JT. Physiological responses of physically fit men
and women to acclimation to humid heat. J Appl Physiol. 1980;49(2):254-61.
3. Avellini BA, Shapiro Y, Pandolf KB, Pimental NA, and Goldman RF. Physiological
responses of men and women to prolonged dry heat exposure. Aviat Space Environ Med.
1980;51(10):1081-5.
4. Bar-Or O. Effects of age and gender on sweating pattern during exercise. Int J Sports
Med. 1998;19 Suppl 2:S106-7.
5. Bar-Or O, Magnusson LI, and Buskirk ER. Distribution of heat-activated sweat glands in
obese and lean men and women. Hum Biol. 1968;40(2):235-48.
6. Bender R, and Lange S. Multiple test procedures other than Bonferroni's deserve wider
use. BMJ. 1999;318(7183):600-1.
7. Bittel J, and Henane R. Comparison of thermal exchanges in men and women under
neutral and hot conditions. J Physiol. 1975;250(3):475-89.
8. Buono MJ, White CS, and Connolly KP. Cholinergic sensitivity of the eccrine sweat
gland in trained and untrained men. J Dermatol Sci. 1992;4(1):33-7.
9. Dubois D, and Dubois E. A formula to estimate the approximate surface area if height
and weight be known. Arch Intern Med. 1916;17:831-6.
10. Epstein Y, Stroschein LA, and Pandolf KB. Predicting metabolic costs of running with
and without backpack loads. Eur J Appl Physiol. 1987;56(5):495-500.
11. Fiala D, Havenith G, Brode P, Kampmann B, and Jendritzky G. UTCI-Fiala multi-node
model of human heat transfer and temperature regulation. Int J Biometeorol.
2012;56(3):429-41.
12. Fogarty AL, Barlett R, Ventenat V, and Havenith G. Regional foot sweat rates during a
65-minute uphill walk with a backpack. In: Proceedings of the Environmental
Ergonomics XII. 2007: Biomed d.o.o., Ljubljana, Slovenia. p. 266-9.
13. Fox RH, Lofstedt BE, Woodward PM, Eriksson E, and Werkstrom B. Comparison of
thermoregulatory function in men and women. J Appl Physiol. 1969;26(4):444-53.
14. Frye AJ, and Kamon E. Responses to dry heat of men and women with similar aerobic
capacities. J Appl Physiol. 1981;50(1):65-70.
15. Frye AJ, and Kamon E. Sweating efficiency in acclimated men and women exercising in
humid and dry heat. J Appl Physiol. 1983;54(4):972-7.
16. Gagge AP, Stolwijk JAJ, and Nishi Y. An effective temperature scale based on a simple
model of human physiological regulatory responses. ASHRAE Transactions.
1971;77:247-62.
17. Gagnon D, Dorman LE, Jay O, Hardcastle S, and Kenny GP. Core temperature
differences between males and females during intermittent exercise: physical
considerations. Eur J Appl Physiol. 2009;105(3):453-61.
18. Gagnon D, Jay O, Lemire B, and Kenny G. Sex-related differences in evaporative heat
loss: the importance of metabolic heat production. Eur J Appl Physiol. 2008;104(5):821-
9.
19. Gagnon D, and Kenny GP. Sex modulates whole-body sudomotor thermosensitivity
during exercise. J Physiol. 2011;589(24):6205-17.

26
20. Grucza R, Lecroart J, Hauser J, and Houdas Y. Dynamics of sweating in men and women
during passive heating. Eur J Appl Physiol Occup Physiol. 1985;54(3):309-14.
21. Havenith G. Human surface to mass ratio and body core temperature in exercise heat
stress--a concept revisited. J Therm Biol. 2001;26(4-5):387-93.
22. Havenith G, Fogarty A, Bartlett R, Smith CJ, and Ventenat V. Male and female upper
body sweat distribution during running measured with technical absorbents. Eur J Appl
Physiol. 2008;104(2):245-55.
23. Havenith G, Luttikholt VG, and Vrijkotte TG. The relative influence of body
characteristics on humid heat stress response. Eur J Appl Physiol Occup Physiol.
1995;70(3):270-9.
24. Havenith G, and Van Middendorp H. The relative importance of physical fitness,
acclimatization state, anthropometric measures and gender on individual reactions to heat
stress. Eur J Appl Physiol. 1990;61:419-27.
25. Inoue Y, Tanaka Y, Omori K, Kuwahara T, Ogura Y, and Ueda H. Sex- and menstrual
cycle-related differences in sweating and cutaneous blood flow in response to passive
heat exposure. Eur J Appl Physiol. 2005;94(3):323-32.
26. Jackson AS, Pollock ML, and Ward A. Generalized equations for predicting body density
of women. Med Sci Sports Exerc. 1980;12(3):175-81.
27. Kerslake D. The stress of hot environments. Cambridge: Cambridge University Press;
1972. pp. 121.
28. Knip AS. Measurement and Regional Distribution of Functioning Eccrime Sweat Glands
in Male and Female Caucasians. Hum Biol. 1969;41(3):380-7.
29. Livingstone SD, Nolan RW, Cain JB, and Keefe AA. Effects of working in hot
environments on respiratory air temperature. Eur J Physiol Occup Physiol.
1994;69(2):98-101.
30. Machado-Moreira CA, Caldwell JN, Mekjavic IB, and Taylor NA. Sweat secretion from
palmar and dorsal surfaces of the hands during passive and active heating. Aviat Space
Environ Med. 2008;79(11):1034-40.
31. Machado-Moreira CA, Smith FM, van den Heuvel AM, Mekjavic IB, and Taylor NA.
Sweat secretion from the torso during passively-induced and exercise-related
hyperthermia. Eur J Appl Physiol. 2008;104(2):265-70.
32. Machado-Moreira CA, Wilmink F, Meijer A, Mekjavic IB, and Taylor NA. Local
differences in sweat secretion from the head during rest and exercise in the heat. Eur J
Appl Physiol. 2008;104(2):257-64.
33. Madeira LG, da Fonseca MA, Fonseca IA, de Oliveira KP, Passos RL, Machado-Moreira
CA, and Rodrigues LO. Sex-related differences in sweat gland cholinergic sensitivity
exist irrespective of differences in aerobic capacity. Eur J Appl Physiol. 2010;109(1):93-
100.
34. Parsons K. Human Thermal Environments: the effects of hot, moderate, and cold
environments on human health, comfort and performance. 2nd ed. London: Taylor &
Francis; 2003. pp. 135.
35. Perneger TV. What's wrong with Bonferroni adjustments. BMJ. 1998;316:1236-8.
36. Shapiro Y, Pandolf KB, Avellini BA, Pimental NA, and Goldman RF. Physiological
responses of men and women to humid and dry heat. J Appl Physiol. 1980;49(1):1-8.
37. Shapiro Y, Pandolf KB, and Goldman RF. Sex differences in acclimation to a hot-dry
environment. Ergonomics. 1980;23(7):635-42.
27
38. Smith CJ, and Havenith G. Body mapping of sweating patterns in male athletes in mild
exercise-induced hyperthermia. Eur J Appl Physiol. 2011;111(7):1391-404.
39. Smith CJ, Machado-Moreira CA, Plant G, Hodder S, Havenith G, and Taylor NAS.
Design data for footwear - Sweating distribution on the human foot. Int J Clothing Sci
Tech. 2012;In Press.
40. Smith CJ, Ventenat V, and Havenith G. Regional sweat rates of the arms and hands in
male squash players. In Proceedings of the Environmental Ergonomics XII. 2007:
Biomed d.o.o., Ljubljana, Slovenia. p. 285-8.
41. Szabo G. The number of eccrine sweat glands in human skin. In: W Montagna, RA Ellis
and AF Silver editors. Advances in biology of the skin. London: Pergamon Press; 1962,
pp. 1-5.
42. Taylor NAS, Caldwell FN, and Mekjavic IB. The sweating foot: Local differences in
sweat secretion during exercise-induced hyperthermia. Aviat Space Environ Med.
2006;77(10):1020-7.

28
Table Captions
Table 1. Descriptive statistics for all regions sampled at I1 and I2 for female subjects. Statistical
comparison of sweat rates within each region between exercise intensities for both absolute and
normalised data, corrected and uncorrected for multiple comparisons.
n=number of participants. Grey shading in columns for normalised ratio data indicates
significant deviation from 1, i.e. average sweat rate. A decrease in median sweat rate ratio
between intensities is indicated by black shading in the intensity comparison column. Sudomotor
sensitivity for all regions tested, calculated as changes in regional sweat rate divided by change
in Tcore (ΔTcore), for both intensities and overall (Taylor et al. 2006). For conversion of
absolute sweat rates (in g.m-2
.h-1
) to other units: divide by 600 to get mg.cm-2
.min-1
, or by 10,000
to get mg.cm-2
.h-1
. Level of significance with no correction for multiple comparisons: *p<0.05,
**p<0.01, ***p<0.001. Level of significance following Bonferroni correction: # p<0.05, ##
p<0.05, ### p<0.0001, $ 0.05<p<0.1.
Table 2. Comparison of male and female absolute (g.m-2
.h-1
) and ratio regional sweat data for
exercise intensity 1 (I1) and 2 (I2). A comparison of male exercise intensity 1 and female
intensity 2 absolute and ratio regional sweat data are presented in the far right hand columns.
Level of significance for male vs. female comparisons with no correction for multiple
comparisons: *p<0.05, **p<0.01, ***p<0.001. Level of significance following Bonferroni
correction: # p<0.05, ## p<0.05, ### p<0.0001, $ 0.05<p<0.1.
29
Figure Captions
Figure 1.Absolute mean GSL (g.h-1
) and absolute mean metabolic rate (W) for trained females
and males at exercise intensity 1 (I1) and intensity 2 (I2). Male data has been modified from
Smith and Havenith 2011 .
Figure 2. Absolute regional median sweat rates of female athletes at exercise intensity 1 (Panel
A), and exercise intensity 2 (Panel B). Note: The sweat rate scale is the same as that used for
male absolute sweat maps from Smith and Havenith 2011 to allow direct comparison between
data sets.
Figure 3. Normalised regional median sweat rates of female athletes at exercise intensity 1
(Panel A), and exercise intensity 2 (Panel B).
Figure 4. Absolute (Panel A) and normalised (Panel B) regional median sweat rates of male
athletes at exercise intensity 1 and 2. These data have been adapted from Smith and Havenith for
direct comparison with the female data.

30
List of Supplemental Digital Content
Supplemental Digital Content 1.doc: Text describing anthropometric measurements and
absorbent pad calculations.
Supplemental Digital Content 2.pptx: Figure illustrating sweat mapping absorbent pad
placement.
Supplemental Digital Content 3.pptx: Tables 1-4 showing the significance level of comparison of
absolute sweat rates for all regions at exercise intensity 1 and 2, with and without Bonferroni
correction.
Supplemental Digital Content 4.pptx: Tables 1-2 showing regional skin temperature in female
(Table 1) and male (Table 2) participants during baseline and pre/post pad application at exercise
intensity 1 and 2. Data show the significance level of comparison of regional skin temperature
between measurement periods, with and without Bonferroni correction.

Table 1.
Absolute sweat data (g.m-2
.h-1
) Normalised ratio data
Surface
area I1 I2 I1 I2
(mg.cm-2
.
min-1
.°C-1
)
n m2 min max median mean SD min max median mean SD Median IQR Median IQR I1 I2 Absolute data Normalised
ratio data
I1 I2 Overall
shoulders 13 0.052 3 240 40 80 83 65 570 138 189 130 0.72 0.78 0.94 0.39 0.92 0.72 ***## ***# 78 426 0.42
upper chest 13 0.023 0 300 58 64 80 44 478 199 185 131 0.38 0.64 0.88 0.51 0.52 0.66 ***# ***# 112 613 0.41
med upper bra 13 0.009 0 93 22 34 39 0 402 145 153 142 0.27 0.46 0.70 1.23 0.60 0.60 ** * 43 535 0.34
lat upper bra 13 0.010 0 86 0 18 29 0 180 46 72 72 0.00 0.18 0.34 0.44 0.79 0.81 **$ **$ 0 202 0.16
med lower bra 13 0.009 0 184 0 27 52 0 361 57 92 112 0.00 0.35 0.27 0.52 0.53 0.61 * - 0 248 0.21
lat lower bra 13 0.010 0 48 0 5 13 0 76 0 16 26 0.00 0.00 0.00 0.09 0.65 0.67 - - 0 0 0.03
bra triangle 13 0.002 0 2251 139 418 664 0 3940 723 912 1038 1.19 6.85 4.85 7.01 0.39 0.51 **$ - 270 2539 2.04
lat mid chest 13 0.032 0 210 31 55 63 16 221 83 109 68 0.36 0.50 0.51 0.39 0.79 0.64 ***# - 60 225 0.24
med mid chest 13 0.016 0 159 57 67 57 31 253 97 130 75 0.62 0.53 0.70 0.37 0.72 0.50 ***## - 110 174 0.29
sides 13 0.034 23 322 67 96 88 81 350 211 192 86 0.71 0.57 0.93 0.62 0.71 0.45 ***# - 130 626 0.43
ant lower 13 0.016 0 292 49 73 83 12 384 106 144 105 0.52 0.48 0.70 0.78 0.59 0.31 ***# - 95 248 0.32
lat upper back 13 0.035 7 399 138 162 130 119 601 324 338 151 1.44 0.64 1.86 0.40 0.89 0.76 ***### - 268 807 0.76
med upper back 13 0.019 21 814 223 282 227 141 963 470 496 228 2.29 1.37 2.86 1.16 0.80 0.69 ***## - 433 1076 1.11
lat mid upper back 13 0.017 0 284 13 80 105 0 413 137 186 137 0.18 1.09 0.92 0.42 0.68 0.77 ** - 25 538 0.42
lat mid lower back 13 0.017 0 273 16 66 88 30 337 83 129 114 0.33 0.67 0.66 0.60 0.83 0.67 **$ - 31 292 0.29
med mid back 13 0.017 0 473 133 166 146 45 613 304 340 162 1.53 1.06 1.94 0.48 0.88 0.85 ***### * 258 743 0.76
pos lower back 13 0.015 0 466 132 164 168 14 598 333 300 190 1.36 2.26 1.83 1.13 0.79 0.55 **$ - 257 875 0.67
ant upper leg 12 0.065 32 275 111 123 71 44 451 160 190 117 1.20 0.47 0.97 0.40 0.89 0.84 **$ - 215 214 0.42
med upper leg 12 0.065 28 276 71 101 73 47 351 138 152 89 1.00 0.18 0.82 0.15 0.82 0.87 **$ - 137 293 0.34
pos upper leg 12 0.065 41 221 88 100 54 67 293 114 144 84 0.97 0.34 0.75 0.32 0.77 0.72 ** - 171 112 0.32
lat upper leg 12 0.065 57 205 111 118 49 53 366 123 166 106 1.28 0.35 0.91 0.40 0.72 0.70 * * 216 51 0.37
ant lat lower leg 13 0.049 19 364 75 122 98 24 372 140 164 109 1.12 0.74 0.90 0.65 0.78 0.73 ** - 145 285 0.37
ant med lower leg 13 0.049 31 308 99 132 85 30 448 159 197 127 1.39 0.31 1.23 0.40 0.78 0.73 **$ - 193 260 0.44
pos lower leg 13 0.095 42 218 81 102 57 57 295 112 141 77 0.99 0.45 0.74 0.30 0.77 0.72 **$ * 158 134 0.32
ant upper arm 13 0.060 0 172 67 80 61 58 282 133 145 72 0.76 0.24 0.83 0.17 0.93 0.91 ***## - 131 287 0.33
pos upper arm 13 0.060 0 177 52 68 67 19 272 138 139 74 0.55 0.57 0.78 0.29 0.89 0.78 ***## * 101 374 0.31
ant lower arm 13 0.053 0 293 68 101 96 51 427 185 188 106 0.86 0.86 1.09 0.20 0.87 0.87 ***## * 131 511 0.42
pos lower arm 13 0.052 0 275 89 104 98 12 393 257 209 123 0.97 0.98 1.22 0.43 0.91 0.71 **$ - 173 729 0.47
thumbs 13 0.010 16 233 104 118 80 56 503 142 195 119 1.16 1.01 1.08 0.40 0.59 0.39 * - 203 161 0.44
fingers 13 0.039 13 135 70 70 40 23 148 113 103 37 0.68 0.61 0.69 0.34 0.47 0.27 **$ - 136 185 0.23
palms 13 0.030 1 152 43 58 44 15 153 82 80 32 0.62 0.32 0.55 0.18 0.56 0.31 * - 83 168 0.18
back hand 13 0.033 9 315 106 118 96 34 308 151 163 90 1.02 1.03 1.07 0.45 0.53 0.64 * - 205 199 0.37
buttocks 13 0.037 15 267 120 110 68 62 325 192 190 74 1.07 0.71 1.17 0.33 0.56 0.23 **$ - 233 314 0.43
sole 13 0.017 59 160 116 119 33 56 154 125 119 33 1.40 1.66 0.89 0.58 0.09 -0.20 - **$ 225 40 0.27
dorsal foot 13 0.056 32 157 139 115 46 34 195 131 124 49 1.32 0.77 0.81 0.57 0.28 0.13 - **$ 269 -31 0.28
toes 13 0.010 81 219 114 130 41 29 213 108 121 52 1.66 1.84 0.91 0.88 -0.33 -0.52 - **$ 222 -28 0.27
heel 13 0.007 69 233 161 148 52 46 209 131 129 45 1.43 1.95 0.92 0.67 -0.34 -0.33 - **$ 313 -132 0.29
med ankle 13 0.015 16 368 101 144 130 21 332 192 196 95 1.10 1.18 1.17 0.92 0.71 0.02 - - 197 392 0.44
lat ankle 13 0.014 0 284 47 91 92 0 260 128 127 68 0.73 0.64 0.85 0.63 0.65 -0.04 - - 91 353 0.28
Pearson's r Significance level of Sudomotor sensitivity
GSL and RSR
intensity comparison
(g.m-2
.h-2
.°C-1
)
Table 1

Male I1 and Female I2 Sweat data
comparison
Absolute sweat data (g.m-2.h-1) Normalised ratio data Absolute data Ratio data
I1 I2 I1 I2 (g.m-2.h-1)
shoulders *** ### *** ## ** ** * -
upper chest *** ### *** ### ** $ * * -
lat mid chest *** ### *** ## ** $ * *** ## -
med mid chest *** ### *** ## ** $ ** *** ## *
sides ** ** - - - -
ant lower ** *** ## - - - -
lat upper back *** ### *** ### * - ** -
med upper back *** # *** ## - - * -
lat mid upper back *** ### *** ### ** * ** -
lat mid lower back *** ### *** ## *** ## *** ## ** $ ** $
med mid back *** ### *** ## ** $ * *** ## *
pos lower back *** ## *** # * - ** -
ant upper leg ** $ ** $ - - - -
med upper leg * * - - - -
pos upper leg *** # ** - - - -
lat upper leg ** ** $ - - * *
ant lat lower leg * ** - - * -
ant med lower leg ** *** # - - * -
pos lower leg *** ## *** ## - - ** -
ant upper arm * ** - ** - *** ##
pos upper arm - ** - - - *
ant lower arm * ** $ - - - *
pos lower arm * ** - - - -
thumbs - - * **$ - **
fingers - * * ** - *
palms - * * * - -
back hand - - - * - **
buttocks ** ** $ - - - -
sole * ** ** - ** -
top foot * ** - - ** -
toes - * ** * - -
heel - * ** $ * - -
med ankle * ** - - * -
lat ankle * ** - - - -
Table 2
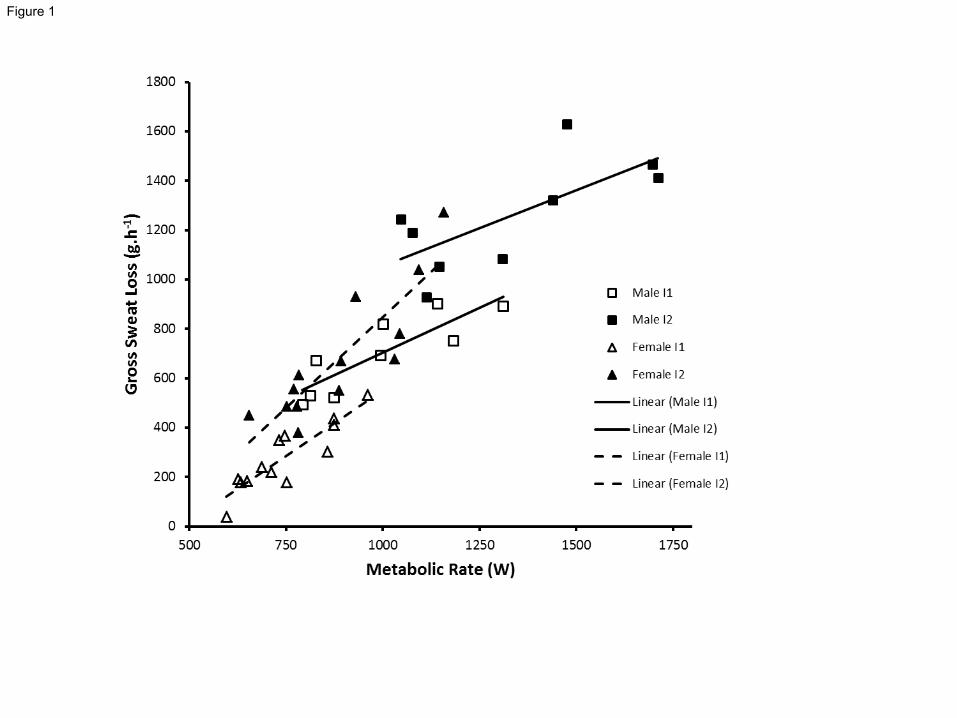
Figure 1

Figure 2.
A
B
Figure 2
Figure 3.
A
B
Figure 3

A
B
Figure 4.
Figure 4

Supplemental Digital Content 1
Sweat Mapping: Anthropometric Measurements and Pad Calculations
UPPER BODY/TORSO
Anatomical Measurement Descriptions
Anterior and Posterior Torso Width Calculations for Absorbent Pads
Anterior upper width = upper circumference*0.32 Anterior mid width = mid-upper circumference*0.37 Anterior lower width = lower circumference*0.4 Posterior upper width = upper circumference*0.4 Posterior mid-upper width = mid-upper circumference*0.43 Posterior mid-lower width = mid-lower circumference*0.37 Posterior lower width = lower circumference*0.38 Absorbent Pad Calculations Note: Bra pads were pre-sized to fit based on bra cup size. These pad calculations are not included. Right and left shoulder Width: biacromial diameter*0.32 Medial side: upper arm circumference*0.54 Lateral side: arm circumference*0.81 Anterior/posterior side: biacromial diameter*0.12 Right and left anterior upper Lateral height: upper body length * 0.18 Medial height: upper body length * 0.22 Width: upper circumference * 0.14 Right, left, and centre anterior mid Height: upper body length * 0.34 Upper width: anterior mid with/3 Lower width: anterior lower width/3 Right and left side Height: upper body length * 0.55 Upper width: upper circumference * 0.07 Lower width: lower circumference * 0.09
location measurement descriptionbiacromial diameter distance between the right and left acromion processes
upper body lengthdistance between the right acromion process and the height of the right anterior iliac spine
upper arm circum.the circumference at the mid point of the upper arm (mid point of the distance from the superolateral surface of the acromion process to the posterior surface of the olecranon process of the ulna)
upper circum. circum. at the level of the upper body length * 0.62mid-upper circum. circum. at the level of the upper circumference height / 2mid-lower circum. circum. at the level of the mid-upper circum. height / 2lower circum. circum at the level of the right and left anterior superior iliac spine

Anterior lower Height: upper body length * 0.10 Width: equal to anterior lower width Right and left posterior upper Medial height: upper body length*0.38 Lateral height: upper body length*0.31 Upper width: no ‘upper side’ but width is same as centre pos upper Lower width: posterior mid-upper width/3 Centre posterior upper Height: upper body length*0.38 Upper width: posterior upper width/3 Lower width: posterior mid-upper width/3 Right and left posterior mid-upper Height: center posterior mid pad height/2 Upper width: posterior mid-upper width/3 Lower width: posterior mid-lower width/3 Right and left posterior mid lower Height: centre posterior mid pad height/2 Upper width: posterior mid-lower width/3 Lower width: posterior lower width/3 Centre posterior mid Height: upper body length*0.34 Upper width: posterior mid-upper width/3 Lower width: posterior lower width/3 Posterior lower Height: upper body length*0.10 Width: equal to posterior lower width

LEGS Anatomical Measurement Descriptions
Absorbent Pad Calculations Right and left upper leg pads: anterior/posterior/medial/lateral Height: right/left leg length*0.6 Upper width: right/left upper circumference/4 Mid width: right/left mid circumference/4 Lower width: right/left lower width/4 Right and left anterior lower leg pads: medial/lateral Height: equal to right/left lower leg length Upper width: right/left lower leg anterior upper width/2 Mid width: right/left lower leg anterior mid width/2 Lower width: right/left lower leg anterior width/2 Right and left posterior lower leg Height: equal to right/left lower leg length Upper width: right/left lower leg posterior upper width Mid width: right/left lower leg posterior mid width Lower width: right/left lower leg posterior lower width
Location Pad Measurement Description
anterior upper leg lengthdistance from the anterior superior iliac spine to the proximal edge of the patella
anterior lower leg lengthdistance from the distal edge of the patella to the level of the proximal surface of the medial and lateral malleoli
upper leg: upper circum.circumference of the upper leg at the height of the top of the absorbent pad (upper leg length*0.6)
upper leg: mid circum.circumference of the upper leg at the midpoint of the absorbent pad (upper leg length*0.6/2)
upper leg: lower circum.circumference of the upper leg directly at the height of the proximal edge of the patella (level of the bottom of the absorbent pad)
lower leg: upper circum. circumference of the lower leg at the height of the distal edge of the lower leg: mid circum. circumference at the midpoint of the lower leg (lower leg length/2)
lower leg: lower circum.circumference of the lower leg at the level of the proximal surface of the medial and lateral malleoli
lower leg: anterior/posterior divisionmedial malleolus to medial condyle of femur. lateral malleolus to lateral condyles of femur
anterior lower leg: upper widthwidth across anterior division of the leg at the height of the distal edge of the patella
posterior lower leg: upper widthwidth across posterior division of the leg at the height of the distal edge of the patella.
anterior lower leg: mid widthwidth across anterior division of the leg at the midpoint of the lower leg (lower leg length/2)
posterior lower leg: mid widthwidth across posterior division of the leg at the midpoint of the lower leg (lower leg length/2)
anterior lower leg: lower widthwidth across the anterior division of the leg at the level of the proximal sufrace of the medial and lateral malleoli
posterior lower leg: lower widthwidth across the posterior division of the leg at the level of the proximal surface of the medial and lateral malleoli
hip circum: ant. sup. Iliac spine circumference of the waist at the level of the anterior superior iliac hip circum: head of femur circumference of the waist at the level of the head of femur

ARMS, HANDS, BUTTOCKS AND FEET Anatomical Measurement Descriptions
Absorbent Pad Calculations Right and left upper arm pads: anterior and posterior Height: right/left upper arm height*0.7 Upper width: right/left upper arm upper circumference/2 Mid width: right/left upper arm mid circumference/2 Lower width: right/left upper arm lower circumference/2 Right and left lower arm pads: anterior and posterior Height: equal to right/left lower arm length Upper width: right/left lower arm upper circumference/2 Mid width: right/left lower arm mid circumference/2 Lower width: right left lower arm lower circumference/2 Right and left medial ankle Height: right/left medial ankle height*0.6 Width: right/left ankle circumference/2 Right and left lateral ankle Height: right/left lateral ankle height*0.6 Width: right/left ankle circumference/2 Right and Left buttocks Height: upper body length*0.26 Width: circumference at anterior superior iliac spine*0.18
Location Pad Measurement Description
upper arm lengthdistance from the superolateral surface of the acromion process to the posterior surface of the olecranon process of the ulna * 0.7
lower arm lengthdistance from the posterior surface of the olecranon process of the ulna to the styloid process of the ulna
upper arm upper circumcircumference of the upper arm at the height of the top of the absorbent pad (upper arm length * 0.7)
upper arm mid circumcircumference at the midpoint of the upper arm pad length (upper arm length * 0.7/2)
upper arm lower circumcircumference of the upper arm at the height of the superior surface of the olecranon process of the ulna
lower arm upper circum circumference of the lower arm at the height of the olecranon process of the ulna
upper arm mid circum circumference at the midpoint of the lower arm (lower arm length/2)
lower arm lower circumcircumference of the lower arm at the height of the superior surface the styloid process of the ulna
(Anterior and Posterior pad widths are produced by dividing the circumferences at the 3 points by 2)

Figure 1. Absorbent pad locations and labels for female sweat mapping. Note: Pads 2 and 3 are specific to male sweat maps due to differences in upper chest pads between sexes (See Smith and Havenith, 2011). Numbering has been kept constant between male and female sweat maps to allow easy comparison.
Supplemental Digital Content 2
shou
lder
s
uppe
r ch
est
med
. upp
er
bra
lat.
uppe
r br
am
ed. l
ower
br
ala
t. lo
wer
br
abr
a tr
iang
le
lat.
mid
ch
est
med
. mid
ch
est
side
s
ant.
low
er
lat.
uppe
r ba
ckm
ed. u
pper
ba
ckla
t. m
id
u ppe
r ba
ckla
t. m
id
low
er b
ack
med
. mid
ba
ckpo
s. lo
wer
ba
ckan
t. up
per
leg
med
. upp
er
leg
pos.
upp
er
leg
lat.
uppe
r le
gan
t. la
t lo
wer
leg
ant.
med
lo
wer
leg
pos.
low
er
leg
ant.
uppe
r ar
mpo
s. u
pper
ar
man
t. lo
wer
ar
mpo
s. lo
wer
ar
mth
umbs
finge
rs
palm
s
back
han
d
butt
ocks
sole
top
foot
toes
heel
med
. ank
le
upper chest -med. upper bra -lat. upper bra -med. lower bra - - -lat. lower bra - -bra triangle - - -lat. mid chest - - - - -med. mid chest - - - -sides - - - -ant. lower - - - - - - -lat. upper back -med. upper back -lat. mid upper back - - - - - - - - -lat. mid lower back - - - - - - - - - -med. mid back - -pos. lower back - - - -ant. upper leg - - - - - - -med. upper leg - - - - - - -pos. upper leg - - - - - - - - - -lat. upper leg - - - - - - - - - - -ant. lat lower leg - - - - - - - - - - - -ant. med lower leg - - - - - - - - - -pos. lower leg - - - - - - - - - - - - - -ant. upper arm - - - - - - - - - - - - -pos. upper arm - - - - - - - - - - - - - -ant. lower arm - - - - - - - - - - - - - - - - - - -pos. lower arm - - - - - - - - - - - - - - - - - - -thumbs - - - - - - - - - - - - - - - - - - - - -fingers - - - - - - - - - - - - - - - - - -palms - - - - - - - - - - - - - - -back hand - - - - - - - - - - - - - - - - - - - - - - - - -buttocks - - - - - - - - - - - - - - - - - - - - - - - - -sole - - - - - - - - - - - - - - - - - - - - - - -top foot - - - - - - - - - - - - - - - - - - - - - - - - -toes - - - - - - - - - - - - - - - - - - - - - - - - - -heel - - - - - - - - - - - - - - - - - - - - - -med. ankle - - - - - - - - - - - - - - - - - - - - - - -lat. ankle - - - - - - - - - - - - - - - - - - - - - - - - - - - - - - -
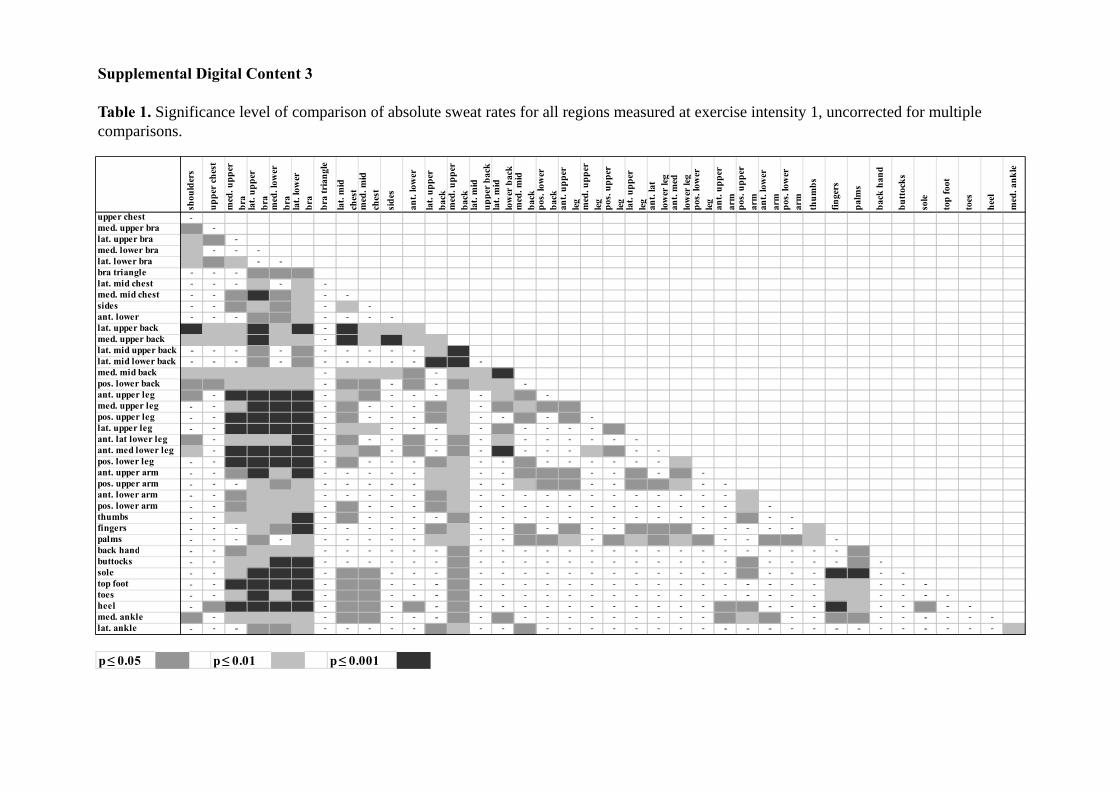
Supplemental Digital Content 3
Table 1. Significance level of comparison of absolute sweat rates for all regions measured at exercise intensity 1, uncorrected for multiple comparisons.
p ≤ 0.05 p ≤ 0.01 p ≤ 0.001

shou
lder
s
uppe
r ch
est
med
. upp
er
bra
lat.
uppe
r br
am
ed. l
ower
br
ala
t. lo
wer
br
abr
a tr
iang
le
lat.
mid
ch
est
med
. mid
ch
est
side
s
ant.
low
er
lat.
uppe
r ba
ckm
ed. u
pper
ba
ckla
t. m
id
u ppe
r ba
ckla
t. m
id
low
er b
ack
med
. mid
ba
ckpo
s. lo
wer
ba
ckan
t. up
per
leg
med
. upp
er
leg
pos.
upp
er
leg
lat.
uppe
r le
gan
t. la
t lo
wer
leg
ant.
med
lo
wer
leg
pos.
low
er
leg
ant.
uppe
r ar
mpo
s. u
pper
ar
man
t. lo
wer
ar
mpo
s. lo
wer
ar
mth
umbs
finge
rs
palm
s
back
han
d
butt
ocks
sole
top
foot
toes
heel
med
. ank
le
upper chest -med. upper bra - -lat. upper bra - - -med. lower bra - - - -lat. lower bra - - - - -bra triangle - - - - - -lat. mid chest - - - - - - -med. mid chest - - - - - - - -sides - - - - - - - - -ant. lower - - - - - - - - - -lat. upper back - - - - - - - - - - -med. upper back - - - - - - - - - - - -lat. mid upper back - - - - - - - - - - - - -lat. mid lower back - - - - - - - - - - - $ - -med. mid back - - - - - - - - - - - - - - $pos. lower back - - - - - - - - - - - - - - - -ant. upper leg - - - $ $ - - - - - - - - - - -med. upper leg - - - - - - - - - - - - - - - - - -pos. upper leg - - - - - - - - - - - - - - - -lat. upper leg - - - - - - - - - - - - - - - -ant. lat lower leg - - - - - - - - - - - - - - - - - - - - -ant. med lower leg - - - - $ - - - - - - - - - - - - - - - -pos. lower leg - - - $ - - - - - - - - - - - - - - - - -ant. upper arm - - - - - - - - - - - - - - - - - - - - - - - -pos. upper arm - - - - - - - - - - - - - - - - - - - - - - - - -ant. lower arm - - - - - - - - - - - - - - - - - - - - - - - - - -pos. lower arm - - - - - - - - - - - - - - - - - - - - - - - - - - -thumbs - - - - - - - - - - - - - - - - - - - - - - - - - - - -fingers - - - - - $ - - - - - - - - - - - - - - - - - - - - - - -palms - - - - - - - - - - - - - - - - - - - - - - - - - - - - - -back hand - - - - - - - - - - - - - - - - - - - - - - - - - - - - - - -buttocks - - - - - - - - - - - - - - - - - - - - - - - - - - - - - - - -sole - - - - - - - - - - - - - - - - - - - - - - - - - - - - - - -top foot - - - $ - - - - - - - - - - - - - - - - - - - - - - - - - - - - -toes - - - - - - - - - - - - - - - - - - - - - - - - - - - - - - - - -heel - - - $ - - - - - - - - - - - - - - - - - - - - - - - - - - - - - - -med. ankle - - - - - - - - - - - - - - - - - - - - - - - - - - - - - - - - - - - - -lat. ankle - - - - - - - - - - - - - - - - - - - - - - - - - - - - - - - - - - - - - -
Supplemental Digital Content 3
Table 2. Significance level of comparison of absolute sweat rates for all regions measured at exercise intensity 1 after Bonferroni correction.
p ≤ 0.05 p ≤ 0.01 p ≤ 0.001 0.1< p ≥0.05 $

shou
lder
s
uppe
r ch
est
med
. upp
er
bra
lat.
uppe
r br
am
ed. l
ower
br
ala
t. lo
wer
br
abr
a tr
iang
le
lat.
mid
ch
est
med
. mid
ch
est
side
s
ant.
low
er
lat.
uppe
r ba
ckm
ed. u
pper
ba
ckla
t. m
id
u ppe
r ba
ckla
t. m
id
low
er b
ack
med
. mid
ba
ckpo
s. lo
wer
ba
ckan
t. up
per
leg
med
. upp
er
leg
pos.
upp
er
leg
lat.
uppe
r le
gan
t. la
t lo
wer
leg
ant.
med
lo
wer
leg
pos.
low
er
leg
ant.
uppe
r ar
mpo
s. u
pper
ar
man
t. lo
wer
ar
mpo
s. lo
wer
ar
mth
umbs
finge
rs
palm
s
back
han
d
butt
ocks
sole
top
foot
toes
heel
med
. ank
le
upper chest -med. upper bra - -lat. upper bramed. lower bra -lat. lower brabra trianglelat. mid chest - - -med. mid chest - - - - -sides - - -ant. lower - - - - - - - -lat. upper backmed. upper back -lat. mid upper back - - - - - -lat. mid lower back - - - - - - - - -med. mid back -pos. lower back - - -ant. upper leg - - - - - - -med. upper leg - - - - - - - - - -pos. upper leg - - - - - - - - - - -lat. upper leg - - - - - - - - - - -ant. lat lower leg - - - - - - - - - - - - -ant. med lower leg - - - - - - - - -pos. lower leg - - - - - - - - - - - - - -ant. upper arm - - - - - - - - - - - - - - - -pos. upper arm - - - - - - - - - - - - - - - - - -ant. lower arm - - - - - - - - - - - - -pos. lower arm - - - - - - - - - - - - -thumbs - - - - - - - - - - - - - - - -fingers - - - - - - - - - -palms - - - - -back hand - - - - - - - - - - - - - - - - - - - - -buttocks - - - - - - - - - - - - - - - - - - - - - -sole - - - - - - - - - - - - - - - - - - - - -top foot - - - - - - - - - - - - - - - - - - - - - -toes - - - - - - - - - - - - - - - - - - - - - - - - - - -heel - - - - - - - - - - - - - - - - - - - - - - - - - - - -med. ankle - - - - - - - - - - - - - - - - - - - - - - - -lat. ankle - - - - - - - - - - - - - - - - - - - - - - - - - - -
Supplemental Digital Content 3
Table 3. Significance level of comparison of absolute sweat rates for all regions measured at exercise intensity 2, uncorrected for multiple comparisons.
p ≤ 0.05 p ≤ 0.01 p ≤ 0.001

shou
lder
s
uppe
r ch
est
med
. upp
er
bra
lat.
uppe
r br
am
ed. l
ower
br
ala
t. lo
wer
br
abr
a tr
iang
le
lat.
mid
ch
est
med
. mid
ch
est
side
s
ant.
low
er
lat.
uppe
r ba
ckm
ed. u
pper
ba
ckla
t. m
id
u ppe
r ba
ckla
t. m
id
low
er b
ack
med
. mid
ba
ckpo
s. lo
wer
ba
ckan
t. up
per
leg
med
. upp
er
leg
pos.
upp
er
leg
lat.
uppe
r le
gan
t. la
t lo
wer
leg
ant.
med
lo
wer
leg
pos.
low
er
leg
ant.
uppe
r ar
mpo
s. u
pper
ar
man
t. lo
wer
ar
mpo
s. lo
wer
ar
mth
umbs
finge
rs
palm
s
back
han
d
butt
ocks
sole
top
foot
toes
heel
med
. ank
le
upper chest -med. upper bra - -lat. upper bra - - -med. lower bra - - - -lat. lower bra - - - - -bra triangle - - - - - -lat. mid chest - - - - - - -med. mid chest - - - - - $ - -sides - - - $ - - - -ant. lower - - - - - - - - - -lat. upper back - - - $ - - -med. upper back - - - -lat. mid upper back - - - - - - - - - - -lat. mid lower back - - - - - - - - - - - $ -med. mid back - - - $ - - - - - -pos. lower back - - - - - $ - - - - - - - - - -ant. upper leg - - - - - $ - - - - - - $ - - -med. upper leg - - - - - - - - - - - - - - -pos. upper leg - - - - - $ - - - - - $ - - - - -lat. upper leg - - - - - - - - - - - - - - - - - - -ant. lat lower leg - - - - - - - - - - - - $ - - $ - - - - -ant. med lower leg - - - - - - - - - - - - - - - - - - - - - -pos. lower leg - - - - - - - - - - $ - - - - - - - - -ant. upper arm - - - - - - - - - - - $ - - - - - - - -pos. upper arm - - - - - - - - - - $ - - $ - - - - - - - - -ant. lower arm - - - - - - - - - - - $ - - - - - - - - - - - - -pos. lower arm - - - $ - $ - - - - - - - - - - - - - - - - - - - - -thumbs - - - - - - - - - - - - - - - - - - - - - - - - - - - -fingers - - - - - - - - - - - $ - - $ - - - - - - - - - - - - -palms - - - - - - - - - - $ - - - - - - - - - - - - - - - -back hand - - - - - - - - - - - - - - - - - - - - - - - - - - - - - -buttocks - - - - - - - - - - - - - - - - - - - - - - - - - - - - - - -sole - - - - - - - - - - - - - - - - - - - - - - - - - - - - - - - -top foot - - - - - - - - - - - - - - - - - - - - - - - - - - - - - - - - -toes - - - - - - - - - - - - - - - - - - - - - - - - - - - - - - - - - - -heel - - - - - - - - - - - - - - - - - - - - - - - - - - - - - - - - - - -med. ankle - - - - - - - - - - - - - - - - - - - - - - - - - - - - - - - - - - - -lat. ankle - - - - - - - - - - - - - - - - - - - - - - - - - - - - - - - - - - - - - -
Supplemental Digital Content 3
Table 4. Significance level of comparison of absolute sweat rates for all regions measured at exercise intensity 2 after Bonferroni correction.
p ≤ 0.05 p ≤ 0.01 p ≤ 0.001 0.1< p ≥0.05 $

Supplemental Digital Content 4
Table 1. Regional Skin Temperature at Baseline (BL), Pre, and Post Absorbent Pad Application at Exercise Intensity 1 and 2 in Female participants. Regional skin temperature significant from previous measurement period: * p<0.05, ** p<0.01, *** p<0.001 with no Bonferroni correction; # p<0.05, ## p<0.01, ### p<0.001 following Bonferroni correction.
Skin Temperature (°C)
Region BL Pre I1 Post I1 Pre I2 Post I2
UB anterior upper 34.0 31.8***### 32.7***## 32.1**$ 33.1*
anterior bra (chest) 33.2 31.5***### 32.8***### 31.7***### 33.1***#
anterior medial lower 32.7 30.3***### 31.8***## 29.8***### 31.2**#
anterior lateral lower 33.2 31.3***## 32.4***## 31.1***### 32.1**$
posterior medial upper 34.0 32.3***### 32.9***### 32.7 33.6**#
posterior lateral upper 33.7 31.7***### 32.9***### 32.1***## 33.5***##
posterior medial lower 33.4 31.8***### 32.8***## 32.1**# 33.4***##
posterior lateral lower 32.8 31.1***### 32.2***## 31.1***## 32.5**#
sides 32.8 31.5***### 32.2***# 31.5**# 32.4**#
Legs anterior upper 30.7 30.3 31.9***### 30.8* 32.4**#
medial upper 30.3 30.6 32.5**## 31.4**# 32.7*$
posterior upper 30.8 30.9 32.5**## 31.2* 32.5**#
lateral upper 30.7 30.8 32.7**## 31.6**$ 33**#
anterior lower 31.2 30.6 32.0**## 31.3* 32.5**#
posterior lower 31.0 30.7 32.3**# 31.1* 32.5**##
AHF anterior upper 32.7 30.7**# 32.4**# 30.9**# 32.4***##
posterior upper 31.5 31.7 32.3 32.3 33.0*
anterior lower 32.5 31.0* 32.5**# 31.2**# 32.6**#
posterior lower 32.2 31.3 32.3* 32.1 33.0*
palms 31.7 33.0 33.3 33.3 33.7
hands 30.7 31.3 31.4 31.5 32.0
heels 26.5 32.3***### 32.7 32.3 33.0
soles 28.0 34.1***### 34.1 34.3 34.6
dorsal foot 29.6 33.9***## 34.2 34.4 34.2
ankles (anterior) 29.9 32.2* 33.0 32.1 32.7
Mean 31.7 31.5 32.6 31.8 32.9
SD 1.9 1.0 0.6 1.1 0.7

Table 2. Regional Skin Temperature at Baseline (BL), Pre, and Post Absorbent Pad Application at Exercise Intensity 1 and 2 in Male participants. Regional skin temperature significant from previous measurement period: * p<0.05, ** p<0.01, *** p<0.001 with no Bonferroni correction; # p<0.05, ## p<0.01, ### p<0.001 following Bonferroni correction.
Skin Temperature (°C)
Region BL Pre I1 Post I1 Pre I2 Post I2
UB anterior medial upper 30.8 31.7 32.64* 32.5 33.9
anterior lateral upper 30.8 31.1 32.01* 31.4* 33.2
anterior medial lower 30.0 30.5 31.74* 30.1***## 32.5*
anterior lateral lower 30.0 31.6 32.27* 31.3**# 33.0
posterior medial upper 31.0 32.3 33.44**# 33.3 34.8
posterior lateral upper 31.1 31.4 33.02**# 32.3* 34.3*
posterior medial lower 29.4 32.4 33.27**$ 33.2 34.5
posterior lateral lower 29.4 31.4 32.63**# 32.0* 33.8
sides 30.0 31.3 32.34**# 31.4* 33.1***###
Legs anterior upper 31.1 31.4 32.2 32.4 32.8
posterior upper 31.7 31.6 32.3**# 33.1 32.9
lateral upper 31.0 31.3 32.1* 32.5 33.3
anterior lower 31.5 31.2 31.5 32.2 31.9
posterior lower 31.7 31.3 31.7 32.9 32.4
AHF anterior upper 32.5 31.4 32.7**# 31.3**# 32.3**#
posterior upper 31.8 31.6 32.7* 32.0 32.8**$
anterior lower 31.5 31.6 32.9**# 32.1* 32.9*
posterior lower 31.7 31.7 32.8* 32.4 33.0*
palms 31.5 32.3 33.5 33.2 33.8
hands 30.4 30.3 31.9 31.4 32.2
heels 25.8 32.7**# 32.7 33.0 32.7
soles 27.5 33.5***## 33.4 33.9 33.7
dorsal foot 28.9 33.6**# 33.5 33.8 33.5
ankles (anterior) 29.4 32.2* 32.5 32.2 32.2