Embed Size (px)
Citation preview

COMMUNAUTÉ FRANÇAISE DE BELGIQUE ACADÉMIE UNIVERSITAIRE WALLONIE-EUROPE
UNIVERSITÉ DE LIÈGE - GEMBLOUX AGRO-BIO TECH
BODY CONDITION SCORE AND MILK FATTY ACIDS AS INDICATORS OF
DAIRY CATTLE REPRODUCTIVE PERFORMANCES
CATHERINE BASTIN
Essai présenté en vue de l’obtention du grade
de docteur en sciences agronomiques et ingénierie biologique
Promoteur : Nicolas Gengler
2013

Copyright
Aux termes de la loi belge du 30 juin 1994, sur le droit d’auteur et les droits voisins, seul l’auteur a le droit
de reproduire partiellement ou complètement cet ouvrage de quelque façon et forme que ce soit ou d’en
autoriser la reproduction partielle ou complète de quelque manière et sous quelque forme que ce soit. Toute
photocopie ou reproduction sous autre forme est donc faite en violation de la dite loi et des modifications
ultérieures.

Catherine BASTIN. (2013). Body condition score and milk fatty acids as indicators of dairy
cattle reproductive performances. (PhD Dissertation in English). Gembloux, Belgium,
Gembloux Agro-Bio Tech, University of Liège, 120p., 23 tabl., 21 fig.
Abstract
Improving cow fertility by means of genetic selection has become increasingly important
over the last years in order to overcome the decline in dairy cow fertility that has taken
place over the past decades. However, fertility traits are difficult to measure and have low
heritabilities. Consequently, indicator traits are of interest for breeding value estimation
for fertility especially if these traits are easier to measure, have higher heritabilities and
are well correlated with fertility. Therefore, the objective of this thesis was to investigate
the opportunity of using either fatty acid contents (FA) in milk predicted by mid-infrared
spectrometry or body condition score (BCS; i.e., a subjective measure of the amount of
metabolizable energy stored in a live animal) as indicator traits of female fertility.
Research conducted on BCS and fertility records from Canadian Ayrshire and Holstein
cows indicated that BCS was heritable and showed a low to moderate favorable genetic
correlation with fertility suggesting that higher BCS would be related to better fertility.
Also, based on results obtained on Walloon data, selection for higher nadir BCS was
suggested as useful to change BCS curve over the lactation and improve fertility.
Furthermore, using records from Walloon Holstein cows, FA were demonstrated to be
moderately heritable. Genetic correlations among FA and fertility were low to moderate
and changed over the lactation. Overall, the pattern of genetic correlations of fertility with
BCS and FA substantiated the known relationship between energy balance status and
fertility. Body fat mobilization in early lactation induces BCS loss. Also, the release of
long-chain FA in milk from the body fat mobilization inhibits de novo FA synthesis in the
mammary gland, leading to a decrease of short- and medium- chain FA. To conclude, this
research has shown that traits based on BCS and milk FA profile fulfill criteria to be
considered as indicator traits to improve indirectly fertility of dairy cows.


Catherine BASTIN. (2013). Utilisation de la note d’embonpoint et de la composition en acides
gras du lait en tant qu’indicateurs des performances de reproduction chez la vache laitière.
(Thèse de doctorat en anglais). Gembloux, Belgique, Gembloux Agro-Bio Tech, Université
de Liège, 120p., 23 tabl., 21 fig.
Résumé
Au cours des dernières années, la sélection génétique est devenue un outil incontournable
pour améliorer la fertilité des vaches laitières dans le but ultime de contrôler la
détérioration des performances de reproduction qui a été observée chez la vache laitière
durant les dernières décennies. Cependant, la fertilité est un caractère difficile à mesurer
et faiblement héritable. C’est pourquoi, des caractères indicateurs peuvent être utilisés
pour l’estimation des valeurs d’élevage pour la fertilité. De tels caractères indicateurs sont
d’autant plus intéressants s’ils sont facilement mesurables, plus héritables que la fertilité
et bien corrélés à celle-ci. L’objectif de cette thèse était donc d’étudier la possibilité
d’utiliser soit les taux d’acides gras (AG) dans le lait prédits par la spectrométrie en
moyen infrarouge soit la note d’embonpoint (BCS; à savoir, une mesure subjective de la
quantité d’énergie métabolisable chez un animal vivant) comme caractères indicateurs de
la fertilité. Les recherches menées sur les données BCS et fertilité provenant de vaches
Holstein et Ayrshire au Canada ont indiqué que le BCS est héritable et que la corrélation
génétique entre le BCS et la fertilité est faible à modérée et suggère qu’un BCS plus élevé
est associé à une meilleure fertilité. De plus, sur base de résultats obtenus sur les données
wallonnes, il a été démontré que la sélection pour une hausse du minimum de la courbe de
BCS au cours de la lactation permettrait d’améliorer la fertilité. Par ailleurs, grâce à une
étude menée sur des données provenant de vaches Holstein wallonnes, il a été établi que
les AG sont modérément héritables. Les corrélations génétiques entre les AG et la fertilité
étaient faibles à modérées et variaient au cours de la lactation. L’ensemble des
corrélations génétiques de la fertilité avec le BCS et les AG confirment l’association entre
la balance énergétique et la fertilité. En effet, la mobilisation des réserves corporelles en
début de lactation induit une perte de BCS. De plus, la libération dans le lait d’AG à
longues chaines provenant des réserves corporelles inhibe la synthèse de novo dans la
glande mammaire provoquant une diminution du taux en AG à courtes et moyennes
chaines. Pour conclure, ces recherches ont démontré que des caractères basés sur le BCS
et le profil en AG du lait répondent à tous les critères pour être considérés comme des
caractères indicateurs permettant une amélioration indirecte de la fertilité des vaches
laitières.


Acknowledgments
Over these last 6 years, I have learned a lot and I owe this to many people. This work would not
have been achieved without the help, the support, the knowledge and the advices of a great
number of people to whom I would like to express here my sincerest gratitude.
First, I would like to acknowledge the supervisor of this thesis, Pr. Nicolas Gengler, for his
support and guidance through this work. Thank you for offering me the opportunity to train, to
collaborate with many people, to travel around the world and, after all, to learn a lot.
I would like to extend my sincerest gratitude to all my jury members: Pr. Frédéric Francis
(President of the jury, Gembloux Agro-Bio Tech, University of Liège), Filippo Miglior (Canadian
Dairy Network and University of Guelph, Canada), Carlo Bertozzi (Walloon Breeding
Association, Belgium), Joseph Flaba (Gembloux Agro-Bio Tech, University of Liège and Service
Public of Wallonia, SPW-DGARNE), and Hélène Soyeurt, Pr. André Théwis, and Pr. Yves
Beckers from Gembloux Agro-Bio Tech, University of Liège. I am very grateful to Filippo
Miglior, reviewer of this manuscript. Thank you for your kindliness. Thank you for encouraging
me all over these years; I am not sure I would have made it to this point without your support.
Thank you for organizing my scientific stay in Guelph; it has been an extremely enriching
experience. I also would like to acknowledge Hélène Soyeurt for her contribution to this work,
especially in the fatty acids research. I wish to thank Pr. Yves Beckers, reviewer of this
manuscript, for his helpful comments. I am also grateful to Pr. Rodolphe Palm as a member of my
thesis committee.
I wish to thank colleagues throughout the quantitative genetics community for helping me through
the various challenges experienced during this thesis. Special thanks to:
Donagh Berry (Teagasc, Moorepark, Ireland) for his contribution either as a reviewer or
as a co-author of most of the papers in this thesis. Thank you so much for your valuable
and very helpful comments;
all the co-authors of the paper presented in this thesis. In addition to the people that have
been acknowledged above, I am very grateful to Alain Gillon (Walloon Breeding
Association) for his appreciated help in the research and analyses conducted throughout
this work and to Sarah Loker (Livestock Improvement Corporation, New Zealand) for her
contribution to many papers of this thesis. I also would like to acknowledge Xavier
Massart (Walloon Breeding Association), Sylvie Vanderick (Gembloux Agro-Bio Tech,
University of Liège) and Asheber Sewalem (Canadian Dairy Network);
Jérémie Vandenplas (Gembloux Agro-Bio Tech, University of Liège) for his contribution
to the last chapter of this thesis involving the selection index theory. Many thanks for
your time and your invaluable help.
Jarmila Johnston (Canadian Dairy Network) and Pr. Larry Schaeffer (University of
Guelph, Canada) for their helpful comments during my stay at University of Guelph.
Also, I would like to acknowledge the different partners of the research we are conducting for
Walloon dairy farmers: the Walloon Breeding Association, the Comité du Lait de Battice and the

Acknowledgments
Walloon Agricultural Research Center. I am also grateful to Valacta (Québec, Canada) for
providing BCS data for the research conducted in Chapters 3 and 4.
Furthermore, I acknowledge the financial support:
of the Public Service of Wallonia (Service Public de Wallonie - Direction Générale
Opérationnelle de l’Agriculture, des Ressources naturelles et de l’Environnement;
previously Ministère de la Région Wallonne - Direction Générale de l’Agriculture)
through the OptiVal and OptiVal+ projects,
of the National Fund for Scientific Research (FNRS, Brussels, Belgium), and Wallonie-
Bruxelles International (CGRI-DRI, WBI) through grants provided for scientific stay at
University of Guelph,
from the European Commission, Directorate-General for Agriculture and Rural
Development (Grand Agreement 211708) and from the Commission of the European
Communities (FP7, KBBE-2007-1) through the RobustMilk project.
Finally, I am infinitely grateful to the people who took the time to read and correct the various
drafts of the chapters from this thesis: Frédéric Colinet, Marie-Laure Vanrobays, Pierre Faux,
Héloïse Bastiaanse, Christopher Marcq, Alain Gillon, Marie Dufrasne and Bernd Buske. Also,
many thanks to Geneviève Jean for her advised help in the editing of the final document.

A ma famille, à mes chers amis et collègues …
Parce que les remerciements, c’est, comme beaucoup d’entre nous, ce que je préfère lire dans une
thèse. Parce que si cette partie ne fait pas au moins 2 pages et ne fait pas référence à quelques
privates jokes, c’est beaucoup moins drôle. Parce que, pour la plupart d’entre vous, c’est sans
doute la première chose que vous lirez dans ce travail. Parce que, pour la majorité d’entre vous,
c’est sans doute la seule chose que vous lirez dans ce travail. Parce que, si vous n’avez pas encore
trouvé votre nom dans la première partie des remerciements, vous le trouverez sans doute ici.
Parce que finalement, cette thèse c’est un peu l’aboutissement du travail de ces dernières années
et que d’une manière ou d’une autre, par votre amitié, votre bienveillance, votre présence ou vos
encouragements, vous avez contribué à la réalisation de ce travail. Merci.
A tous les collègues, stagiaires et étudiants qui sont passés ou restés pour quelques semaines,
quelques mois ou plusieurs années. A tous ceux qui, au final, ont joyeusement contribué à la
surpopulation des bureaux! Aux gens d’en bas et en particulier Geneviève. Merci pour ta
disponibilité et ton amitié. A ‘mes’ étudiants et stagiaires: Afef, Lucie et Bruno, j’ai beaucoup
appris avec vous. A l’équipe des généticiens. Fred, merci pour tes conseils avisés, ta bienveillance
et ton amitié, tout cela m’a été très précieux au cours de ces années et plus particulièrement au
cours de ces derniers mois. Alain, tu resteras un des meilleurs office mates ever, merci pour ta
zénitude à toutes épreuves. Pas d’offense, Marie et Jérémie, vous êtes aussi de supers office
mates! Pierre, nous ferons le bilan de notre pari le jour de la défense publique, mais j’espère bien
avoir gagné sur la plate couture de la pointe de l’épée! Catherine, Eloah et Maïté, votre passage en
zootechnie a finalement été bref mais si on me proposait à nouveau une expérience
professionnelle (ou un voyage à Athens) avec vous, ce serait avec grand plaisir. Il y a aussi
l’OptiMIR team : Hana, Aurélie, Laura et Amaury et puis ceux qui ont été brièvement mes office
mates à l’Athéna: Thibault, Gil et Valérie W. ainsi que les expatriés du Luxembourg (Valérie
A.), des stats (Hélène) ou du bureau d’en bas (Hedi). Sans oublier: Marie-Laure, Sylvie, Purna,
Elisabeth, Coraline et Bernd. Merci à vous tous pour les bons moments passés à Gembloux mais
aussi à Southport, San Antonio, Dublin, Scarborough, Athens, Niagara Falls, Montréal, Riga,
Liepzig, Belfast (If we ever meet again), New Orleans, Wageningen, Stavanger, Phoenix,
Bratislava et Indianapolis! Waw! Que de voyages, que de souvenirs, que de soirées mémorables
avec vous ! Merci les amis ! Ces années, ça a été du travail et du stress aussi, des réunions à
rallonges, des GT weekends au mess, des after au Poco Loco et un nombre incalculable de
rapports, de PV et de power-points ! Mais tout cela aurait été beaucoup moins drôle sans vous.
Genetics is magic !
Il me tient finalement à cœur d’encourager tous les doctorants en plus ou moins début ou en plus
ou moins fin de thèse. S’il est certain qu’une fin de thèse n’est jamais tout à fait sereine, vous
apprendrez que lorsqu’on sort l’expression magique ‘Je suis en fin de thèse’, ça vous attire toute
la compassion du monde, ou du moins toute la compassion des gens qui sont passés par là. Bonne
chance les amis!

A ma famille, à mes chers amis et collègues …
A mes chers co-kotteurs, les p’tis, Jérôme et Amaury. A mes colocs Lorraine et Gino. Merci pour
tous ces bons moments passés ensemble, merci d’avoir été des oreilles attentives et bienveillantes.
A tous les amis de l’aventure gembloutoise (je n’oserais vous citer tous ici). A mes précieux amis,
Virginie, Pierre, Noëlle, Sylvie, Christopher et Ellen. A ma best friend ever ever, Héloïse. Parce
que vous êtes là quand j’ai besoin d’une oreille attentive ou quand j’ai besoin d’encouragements.
Parce que vous me rappelez ce qui est réellement important quand il le faut. Parce que même si
vous êtes loin (la Nouvelle-Zélande, le Gabon ou Malmédy quand même), vous êtes là. Parce que
notre amitié a maintenant plus de 10 ans et que je me souviens comment chacune d’entre elles a
commencé. Parce que si on connait Du côté de chez Swann, on connait tout de la chanson
française. Parce que je n’en finirais pas de citer toutes les anecdotes et les souvenirs qui nous
lient. Parce que j’ai partagé des moments rares avec vous. Merci.
A ma famille bien sûr. Merci pour votre soutien et vos encouragements. A mes parents qui m’ont
appris bien des choses sur l’agronomie bien avant que je ne fréquente la Faculté de Gembloux.
Merci de m’avoir appris la persévérance et le goût du travail bien fait. A Coralie, mon expert ès
gastronomie et Luc, mon expert IT. Merci d’être toujours là pour moi. A Stéphanie, Vincent,
Anne-Françoise, David, Sylvain et Alexandre.
A ceux qui nous ont quittés, aussi. A la veille de décrocher ce nouveau diplôme, j’ai une pensée
pour mon grand-père qui, il y a bien longtemps, me disait que je deviendrai docteur, tout comme
sa grand-tante dont je suis l’homonyme. Eh bien … nous y voilà!
Catherine Bastin
Juillet 2013
Contents - Table des matières
List of abbreviations .............................................................................................................................. 1
Chapter 1. General introduction ........................................................................................................... 3
Context ............................................................................................................................................ 5
Aim of the thesis .............................................................................................................................. 6
Outline ............................................................................................................................................. 6
Framework ....................................................................................................................................... 7
References ...................................................................................................................................... 7
Chapter 2. Genetics of BCS as an indicator of dairy cattle fertility: a review ................................. 9
Introduction .................................................................................................................................... 11
Body condition score: definition, target values, and factors of variation ........................................ 11
Genetic variability of body condition score .................................................................................... 13
Genetic correlations of body condition score with other traits ....................................................... 16 Genetic correlations with non-fertility traits .................................................................................... 16 Genetic correlations with fertility ................................................................................................... 19
Body condition score as an indirect predictor of fertility ................................................................. 20
Alternatives to body condition score .............................................................................................. 21
Conclusions ................................................................................................................................... 22
Acknowledgements ........................................................................................................................ 22
References .................................................................................................................................... 22
Chapter 3. Genetic relationships between BCS and reproduction traits in Canadian Holstein and Ayrshire first-parity cows ............................................................................................................. 27
Introduction .................................................................................................................................... 29
Materials and methods .................................................................................................................. 29 Data editing ................................................................................................................................... 29 Models and genetic parameter estimation .................................................................................... 33
Results and discussion .................................................................................................................. 35 Data .............................................................................................................................................. 35 Variance components, heritabilities, and genetic correlations among BCS .................................. 36 Genetic correlations between BCS and fertility traits .................................................................... 39 Genetic correlations between BCS and calving traits.................................................................... 42 Use of BCS in selection programs ................................................................................................ 44
Conclusions ................................................................................................................................... 45
Acknowledgments .......................................................................................................................... 45
References .................................................................................................................................... 45
Chapter 4. Short communication: Genetic relationship between calving traits and body condition score before and after calving in Canadian Ayrshire second-parity cows .................. 49
Acknowledgments .......................................................................................................................... 57
References .................................................................................................................................... 58
Chapter 5. Genetic evaluation for body condition score in the Walloon Region of Belgium ....... 59
Introduction .................................................................................................................................... 61
Materials and methods .................................................................................................................. 61 Data .............................................................................................................................................. 61 (Co)variance estimation and model............................................................................................... 62 Breeding values definition ............................................................................................................. 62

Contents – Table des matières
Results and Discussion ................................................................................................................. 64
Heritabilities and genetic correlations ............................................................................................ 64 Comparison among EBV1 to EBV7 ................................................................................................ 65
Conclusion ..................................................................................................................................... 66
Acknowledgments ......................................................................................................................... 67
References .................................................................................................................................... 67
Chapter 6. Phenotypic and genetic variability of production traits and milk fatty acid contents across days in milk for Walloon Holstein first-parity cows. .......................................... 69
Introduction .................................................................................................................................... 71
Materials and methods .................................................................................................................. 72 Data editing ................................................................................................................................... 72 Model and genetic parameter estimation ...................................................................................... 73
Results and discussion .................................................................................................................. 75 Data............................................................................................................................................... 75 Variation of FA contents in milk over DIM ..................................................................................... 75 Variances and heritabilities ........................................................................................................... 77 Approximate genetic correlations among production traits and FA ............................................... 79
Conclusions ................................................................................................................................... 84
Acknowledgments ......................................................................................................................... 85
References .................................................................................................................................... 85
Chapter 7. Genetic correlations of days open with production traits and contents in milk of major FA predicted by mid-infrared spectrometry ........................................................................... 89
Introduction .................................................................................................................................... 91
Materials and methods .................................................................................................................. 92 Data editing ................................................................................................................................... 92 Model ............................................................................................................................................ 93 Genetic parameters ....................................................................................................................... 94
Results and discussion .................................................................................................................. 95
Conclusions ................................................................................................................................... 99
Acknowledgments ......................................................................................................................... 99
References .................................................................................................................................. 100
Chapter 8. General discussion, conclusion and future prospects ............................................... 103
About the selection for fertility ..................................................................................................... 104
BCS and milk FA fulfill conditions to be considered as indicator traits for fertility ....................... 104
Accuracy in selection for fertility using BCS and milk FA as indicator traits ................................ 106
Including BCS and milk FA in breeding programs ....................................................................... 108 Consequences on milk production traits...................................................................................... 108 Selection for BCS ........................................................................................................................ 109 Selection for FA ........................................................................................................................... 110
General conclusion ...................................................................................................................... 111
Implications .................................................................................................................................. 112
Future research ........................................................................................................................... 112
Summary ..................................................................................................................................... 113
References .................................................................................................................................. 114
List of tables ....................................................................................................................................... 117
List of figures ..................................................................................................................................... 119

1
List of abbreviations
BCS Body condition score
CE Calving ease
CEd Direct calving ease
CEm Maternal calving ease
CS Calf survival
CSd Direct calf survival
CSm Maternal calf survival
CTFS Days between calving and first service
DIM Days in milk
DO Days open
EB Energy balance
EBV Estimated breeding value
EBVd Daily estimated breeding value
FA Fatty acid
FSTC Days between first service and conception
LCFA Long chain fatty acid
MCFA Medium chain fatty acid
MUFA Monounsaturated fatty acid
NRR Non return rate at first insemination
PR Pregnancy rate
PUFA Polyunsaturated fatty acid
RPD Ratio of (standard error of) prediction to (standard) deviation
R²cv Coefficient of determination of the cross-validation
SCFA Short chain fatty acid
SCS Somatic cell count
SFA Saturated fatty acid
UFA Unsaturated fatty acid
VCE Variance components estimation


Chapter 1. General introduction


General introduction
5
Context
Dairy production systems that use cows selected, managed, and fed for high milk production
levels have suffered decline in cow fertility over the past decades (e.g., Lucy, 2001; Walsh et al.,
2011). A multitude of studies conducted on Holstein cows under various production systems
documented decrease in conception success following insemination and deterioration in
reproductive performance expressed as intervals. Decline in first-service conception rate has been
addressed by Lucy (2001). Extension of interval from calving to conception, of interval from first
to successful insemination, and of calving interval has been reported (e.g., González-Recio et al.,
2004; VanRaden et al., 2004; Dillon et al., 2006; Liu et al., 2008). In the Walloon Region of
Belgium, calving interval has increased from 396 days in 1994 to 417 days in 2008 (Laloux et al.,
2009).
Optimal fertility is vital for profitable dairy production systems (De Vries, 2006; Inchaisri et al.,
2010). In support of the objective of one calf per year per cow that is observed for instance in
seasonal grass-based milk production systems, farmers aim for a 3-month interval from calving to
conception. Besides, extended lactation practices may be considered as a way to manage high
yielding dairy cows: milk production is prioritized, first service is postponed and calving interval
is extended. In all circumstances, good fertility in dairy cows can be defined as the
accomplishment of pregnancy at the desired time (Pryce et al., 2004); success of conception after
first insemination should be addressed in all dairy production systems. In 2004, González-Recio
et al. stated that an increase of one unit in the number of inseminations per service period would
reduce profitability by 67.32 USD per year per cow.
Fertility is a multi-factorial trait and its deterioration has been caused by a network of genetic,
physiological, environmental, and managerial factors (Walsh et al., 2011). Hence, improving
dairy cow fertility through genetic selection has become increasingly important in recent years
since it was established that declining fertility cannot be arrested solely by improved management
(Veerkamp and Beerda, 2007). Most dairy cattle populations have, by now, routine genetic
evaluation systems for female fertility (INTERBULL, 2012a) and such fertility traits have been
nearly unanimously included in national breeding goals (Miglior et al., 2005). Furthermore,
international genetic evaluations for female fertility are available since 2007 (INTERBULL, 2012b).
Genetic evaluations for fertility traits may provide useful selection tools 1) to help farmers to
monitor the fertility of their cows and 2) to assess and enhance the genetic trend of the population
as a whole (Banos et al., 2004).
However, direct selection for female fertility, might be complicated by the following factors: 1)
the difficulty in collecting large amounts of relevant direct fertility records, especially for unfertile
animals (e.g., no calving interval records for animals that are unfertile), 2) the long time period
required to validate some phenotypes (e.g., calving interval) and its subsequent effect on
generation interval and thus genetic gain, and 3) the generally low heritability of most traditional
fertility phenotypes (from 0.01 to 0.05; Veerkamp and Beerda, 2007). These factors contribute to
low accuracy of estimated breeding values (i.e., genetic merit of animals), especially for cows and
young bulls. Therefore, indicator traits could be very useful to supplement the prediction of
genetic merit for female fertility as long as these traits are easier to measure, are recorded earlier
in the cow’s lactation, are heritable, and are genetically correlated with fertility (Shook, 1989).

Chapter 1
6
Because energy balance has been presented as one of the most important factors influencing
fertility (Butler and Smith, 1989; Walsh et al., 2011), traits related to the extent and the duration
of the postpartum negative energy balance are of great interest as indicator traits to enhance
indirect genetic improvement of reproductive performances. Negative energy balance occurs for
about 2 to 4 months following calving, when nutrient requirements for growth, activity,
maintenance, and lactation exceed the ability of the cow to consume energy in the feed. In
response to the energy deficit, cows mobilize tissue reserves. Several traits have been associated
with energy balance state of dairy cows: body condition score (BCS), body weight (Coffey et al.,
2001) and various metabolic and endocrine blood and milk traits such as levels of ketone bodies,
non-esterified fatty acids (FA), milk fat:protein ratio and milk FA (de Vries and Veerkamp, 2000;
Reist et al., 2002; Stoop et al., 2009).
Body condition score is a subjective measure of the amount of metabolizable energy stored in a
live animal (Edmonson et al., 1989) and it has been widely accepted by scientists and producers
as the most practical method for assessing changes in energy reserves in dairy cattle (Bewley and
Schutz, 2008). Besides, milk FA profile is thought to be related to energy balance status of cows
in early lactation (Stoop et al., 2009). At initiation of lactation, when cows are in negative energy
balance, adipose FA are mobilized and incorporated in milk, causing an increase of C18 FA
proportion in milk fat and a consequent inhibition of de novo synthesis of FA by the mammary
gland (Palmquist et al., 1993). Therefore, BCS and milk FA appear as traits of great interest to
improve indirectly reproductive performances of dairy cows.
Aim of the thesis
This thesis aimed to investigate the opportunity of using BCS and milk FA as indicator traits of
female fertility. Towards this objective, the genetic variability of BCS and milk FA and their
genetic correlations with reproductive performances were studied and a genetic evaluation for
BCS in the Walloon Region of Belgium was developed.
Outline
This manuscript is a compilation of published scientific papers and is structured as follows. First,
a literature review on the genetic variability of BCS and its genetic correlations with traits of
economic importance is provided in Chapter 2. Genetic correlations among BCS and reproduction
traits (both fertility and calving traits) were then estimated using records from Canadian Holstein
and Ayrshire cows (Chapters 3 and 4). In Chapter 5, the development of a genetic evaluation for
BCS in the Walloon Region of Belgium was investigated. Chapter 6 describes phenotypic and
genetic variability of milk FA. Genetic correlations between fertility and FA were estimated in
Chapter 7. Finally, Chapter 8 compiled results obtained through this work and explored the
opportunity of using BCS and milk FA as indicator traits of female fertility in dairy cows. Also, a
general conclusion and future prospects were drawn.
General introduction
7
Framework
This thesis was initiated in the framework of the OptiVal and OptiVal+ projects financed by the
Public Service of Wallonia (Service Public de Wallonie - Direction Générale Opérationnelle de
l’Agriculture, des Ressources naturelles et de l’Environnement; previously Ministère de la Région
Wallonne - Direction Générale de l’Agriculture) and jointly conducted by the Animal Science
Unit of Gembloux Agro-Bio Tech, University of Liège (GxABT - ULg, Gembloux, Belgium;
previously Faculté universitaire des Sciences Agronomiques de Gembloux) and the Research and
Development department of the Walloon Breeding Association (AWE asbl, Ciney, Belgium). The
objective of these projects was to develop management tools, based on performance recording
data, to support dairy farmers in their daily decisions. Three directions were explored during the
projects: fine-tuning feeding, monitoring changes in functional morphology, and fertility
management. Moreover, the collaboration with the Canadian Dairy Network (CDN, Guelph,
Canada) and the Center for the Genetic Improvement of Livestock at University of Guelph
(CGIL, Guelph, Canada) allowed the work on Canadian data (from Valacta, Québec). This work
was financed by the Public Service of Wallonia, the National Fund for Scientific Research
(FNRS, Brussels, Belgium), and Wallonie-Bruxelles International (CGRI-DRI, WBI). Finally,
this thesis also took advantages from beneficial interactions with the FP7 European project
RobustMilk: “Innovative and practical breeding tools for improved dairy products from more
robust dairy cattle”.
References
Banos, G., S. Brotherstone, R. Thompson, J.A. Woolliams, E. Wall, and M.P. Coffey. 2004.
Calculation of multiple-trait sire reliability for traits included in a dairy cattle fertility index.
Anim. Sci. 79:1-9.
Bewley, J.M. and M.M. Schutz. 2008. Review: An interdisciplinary review of body condition
scoring for dairy cattle. The Prof. Anim. Sci. 24:507-529.
Butler, W.R., and R.D. Smith. 1989. Interrelationships between energy balance and postpartum
reproductive function in dairy cattle. J. Dairy Sci. 72:767-783.
Coffey, M.P, G.C. Emmans, and S. Brotherstone. 2001. Genetic evaluation of dairy bulls for
energy balance traits using random regression. Anim. Sci. 73:29-40.
de Vries, M.J., and R. F. Veerkamp. 2000. Energy balance of dairy cattle in relation to milk
production variables and fertility. J. Dairy Sci. 83:62-69.
De Vries, A. 2006. Economic value of pregnancy in dairy cattle. J. Dairy Sci. 89:3876-3885.
Dillon, P., D.P. Berry, R.D. Evans, F. Buckley, and B. Horan. 2006. Consequences of genetic
selection for increased milk production in European seasonal pasture based systems of milk
production. Livest. Sci. 99:141-158.
Edmonson A.J., I.J. Lean, L.D. Weaver, T. Farver, and G. Webster. 1989. A body condition
scoring chart for Holstein dairy cows. J. Dairy Sci., 72:68-78.
Inchaisri C., R. Jorristma, P.L.A.M. Vos, G.C. van der Weijden, and H. Hogeveen. 2010.
Economic consequences of reproductive performance in dairy cattle. Theriogenology
74:835-846.
INTERBULL. 2012a. Description of National Genetic Evaluation Systems for dairy cattle traits as
applied in different INTERBULL member countries. Accessed on November 23, 2012.
http://www-interbull.slu.se/national_ges_info2/framesida-ges.htm.
INTERBULL. 2012b. INTERBULL Routine Genetic Evaluation for Female Fertility Traits. Accessed
on November 23, 2012. http://www-interbull.slu.se/Female_fert/framesida-fert.htm.

Chapter 1
8
González-Recio, O., M.A. Pérez-Cabal, and R. Alenda. 2004. Economic value of female fertility
and its relationship with profit in Spanish dairy cattle. J. Dairy Sci. 87:3053-3061.
Laloux, L., C. Bastin, and L. Devroede. 2009. Un intervalle vêlage court: un objectif intéressant
pour les hautes productrices? Wallonie Elevage 2:14-16.
Liu, Z., J. Jaitner, F. Reinhardt, E. Pasman, S. Rensing, and R. Reents. 2008. Genetic evaluation
of fertility traits of dairy cattle using a multiple-trait animal model. J. Dairy Sci. 91:4333-
4343.
Lucy, M.C. 2001. ADSA Foundation Scholar Award: Reproductive loss in high-producing dairy
cattle: where will it end? J. Dairy Sci. 84:1277-1293.
Miglior, F., B.L. Muir, and B. J. Van Doormaal. 2005. Selection indices in Holstein cattle of
various countries. J. Dairy Sci. 88:1255-1263.
Palmquist, D.L., A.D. Baulieu, and D.M. Barbano. 1993. Feed and animal factors influencing
milk fat composition. J. Dairy Sci. 76:1753-1771.
Pryce, J.E., M.D. Royal, P.C. Garnsworthy, and I.L. Mao. 2004. Fertility in the high-producing
dairy cow. Livest. Prod. Sci. 86:125-135.
Reist, M., D. Erdin, D. von Euw, K. Tschuemperlin, H. Leuenberger, Y. Chilliard, H.M.
Hammon, C. Morel, C. Philipona, Y. Zbinden, N. Kuenzi, and J.W. Blum. 2002. Estimation
of energy balance at the individual and herd level using blood and milk traits in high-yielding
dairy cows. J. Dairy Sci. 85:3314-3327.
Shook. G.E. 1989. Selection for disease resistance. J. Dairy Sci. 72:1349-1362.
Stoop, W.M., H. Bovenhuis, J.M.L. Heck, and J.A.M. van Arendonk. 2009. Effect of lactation
stage and energy status on milk fat composition of Holstein-Friesian cows. J. Dairy Sci.
92:1469-1478.
VanRaden, P.M., A.H. Sanders, M.E. Tooker, R.H. Miller, H.D. Norman, M.T. Kuhn, and G.R.
Wiggans. 2004. Development of a national genetic evaluation for cow fertility. J. Dairy Sci.
87:2285-2292.
Veerkamp, R. F., and B. Beerda. 2007. Genetics and genomics to improve fertility in high
producing dairy cows. Theriogenology 68S:S266-S273.
Walsh, S.H., E.J. Williams, and A.C.O. Evans. 2011. A review of the causes of poor fertility in
high milk producing dairy cows. Anim. Reprod. Sci. 123:127-138.

Chapter 2. Genetics of BCS
as an indicator of dairy cattle fertility: a review
Outline
Body condition score is a subjective measure of the amount of metabolizable energy stored in a live animal. Over a range of studies, BCS has been proposed as a useful indicator trait for dairy cattle fertility. Therefore, the objective of this Chapter was to review the genetic parameters of BCS as well as its genetic association with other traits of economic importance, especially fertility. As a first step in the research strategy of this thesis, this Chapter also focuses on the genetic selection of BCS in order to indirectly improve reproductive performances of dairy cows.
From: Bastin, C., and N. Gengler. 2013. Genetics of BCS as an indicator of dairy cattle
fertility: a review. Biotechnol. Agron. Soc. Environ. 17:65-76.

Chapter 2
10
Abstract
Genetics of BCS as an indicator of dairy cattle fertility: a review
Body condition score (BCS) is a subjective measure of the amount of metabolizable energy stored
in a live animal. Change in BCS of dairy cows is considered to be an indicator of the extent and
the duration of postpartum negative energy balance. Although change in BCS over lactation is
lowly heritable, heritability estimates of level of BCS range from 0.20 to 0.50. Also, BCS tends to
be more heritable in mid-lactation indicating that genetic differences are more related to how well
cows recover from the negative energy balance state. BCS measurements are generally highly
correlated within and between lactations. Genetic correlations with BCS are unfavorable for milk,
fat, and protein yield, suggesting that genetically superior producers tend to have lower BCS,
especially during the lactation. Genetic correlations are generally moderate and favorable with
fertility indicating that cows with higher levels of BCS would have a greater chance to conceive
after insemination and fewer number of days when not pregnant. Because direct selection to
improve fertility might be complicated by several factors, selection for higher levels of BCS,
especially in mid-lactation, appears to be a good option to indirectly improve fertility in dairy
cows.
Keywords: Dairy cows, body condition, energy balance, heritability, fertility, genetic correlation
Résumé
La note d’embonpoint chez la vache laitière: variabilité génétique et lien avec la fertilité
(synthèse bibliographique)
La note d’embonpoint (BCS) est une mesure subjective de la quantité d’énergie métabolisable
chez un animal vivant. Les changements de BCS donnent des indications quant à l’importance et
la durée de la balance énergétique négative postpartum chez la vache laitière. Bien que la perte de
BCS au cours de la lactation présente une faible héritabilité, l’héritabilité du BCS varie en
moyenne entre 0,20 et 0,50. De plus, le BCS est plus héritable en milieu de lactation, ce qui
indique que les différences génétiques sont davantage liées à la manière dont les vaches
reviennent en balance énergétique positive. Les mesures de BCS sont hautement corrélées au sein
et à travers les lactations. Les corrélations génétiques entre le BCS et les rendements en lait,
matière grasse et protéines sont défavorables et suggèrent que les vaches qui sont génétiquement
de hautes productrices ont tendance à avoir un BCS plus faible, et plus particulièrement au cours
de la lactation. Les corrélations génétiques sont modérées et favorables entre le BCS et la fertilité
et suggèrent que des vaches qui présentent un BCS plus élevé, d’une part, ont plus de chances de
concevoir après l’insémination et d’autre part, présentent un nombre plus faible de jours où elles
ne sont pas gestantes. Étant donné que la sélection directe pour la fertilité peut être compliquée
par une série de facteurs, la sélection pour des niveaux plus élevés de BCS, et plus
particulièrement en milieu de lactation, apparait comme une bonne option pour améliorer
indirectement la fertilité des vaches laitières.
Mots-clés : Vache laitière, état corporel, bilan énergétique, héritabilité, fertilité, corrélation
génétique

Genetics of body condition score and fertility
11
Introduction
In general, dairy cows experience a negative energy balance (EB) for about 2 to 4 months
following calving when nutrient requirements for growth (especially in first-parity cows), activity,
maintenance and lactation exceed the ability of the cow to consume energy in the feed. In
response to the energy deficit, cows mobilize tissue reserves. During lactation, dry matter intake
increases at a slower rate than milk production, exacerbating negative EB. About 2 to 4 months
after calving, dry matter intake increases to a point where energy input is greater than energy
output, resulting in a positive EB for the remainder of the lactation (Bewley et al., 2008).
Although negative EB in early lactation is a normal physiological state (i.e., all mammals are
designed to convert body stores of energy to milk during lactation; Bewley et al., 2008), it is
commonly assumed that duration and magnitude of negative EB both have an impact on
reproductive performance of dairy cows. Butler et al. (1989) indicated that negative EB and rate
of mobilization of body reserves in early lactation appear to be directly related to the interval from
calving to first ovulation and to a lower conception rate. Also, de Vries et al. (2000) reported that
a lower nadir of EB is correlated with a delay in the postpartum start of luteal activity.
Furthermore, Friggens et al. (2007) provided evidence that body energy change is
environmentally and genetically driven and suggested that genetic selection could affect EB
profiles. Therefore, recording EB on a routine basis could enhance improvement of fertility and
hence address one of the greatest challenges of the modern dairy industry, which is to overcome
the decline in cow fertility that has taken place over the past five decades (Veerkamp et al., 2007).
Direct measures of EB are primarily based on individual cow feed intake and milk output.
However, measurement of individual feed intake is expensive and unfeasible in a commercial
population. Therefore, indirect indicators of EB, such as body condition score (BCS) change, are
commonly used. Body condition score is a subjective measure of the amount of metabolizable
energy stored in a live animal (Edmonson et al., 1989) and it is recognized by animal scientists
and producers as being a useful trait to customize feeding strategies and manage dairy cattle
health and fertility.
After an overview of the definition and the interest in BCS, this paper will focus on the genetic
variability of BCS in dairy cows. Furthermore, the genetic association of BCS with other traits of
economic importance and especially reproductive performance will be examined. Finally, the
selection of BCS in order to indirectly improve the fertility of dairy cows will be considered.
Body condition score: definition, target values, and factors of
variation
Body condition scoring has been widely accepted as the most practical method for assessing
changes in energy reserves in dairy cattle (Bewley et al., 2008). This technique is accomplished
by the visual or tactile observation (or both) of a cow by a trained professional (Edmonson et al.,
1989; Roche et al., 2004). Body condition can be scored by dairy farmers, veterinarians, field
staff, or classifiers. It can be recorded once or several times over the lactation. Although it is a
subjectively measured trait that only assesses subcutaneous fat stores, previous studies have
indicated that BCS could be accurate enough to assess the relative amount of body fat
mobilization (Waltner et al., 1994; Bewley et al., 2008).

Chapter 2
12
During the last 25 years, various BCS systems have been described and researched throughout the
world (Bewley et al., 2008). The scale used to measure BCS differs between countries, but low
values generally reflect emaciation and high values reflect obesity (Roche et al., 2009a).
Edmonson et al. (1989) developed a 5-point chart system used in the United States describing
changes in conformation with body condition change for eight body locations identified as
important for predicting BCS. In the Walloon Region of Belgium, dairy cows are assigned a BCS
based on a nine-point scale with unit increments as used for the linear scoring system. The
decision chart (Table 1), adapted from the five-point scale described by Ferguson et al. (1994), is
mainly based on the observation and the tactile appraisal of the thurl region, the pin and hip bones
and the sacral and coccygeal ligaments with scoring of 1 (= emaciated cows) to 9 (= obese cows).
Table 1. Decision chart for body condition scoring dairy cows in the Walloon Region of Belgium
Principal descriptors of body region BCS
The thurl (rump region) has a V appearance. <= 5
Hook bone is rounded. 5
Hook and pin bones are angular. Pin bone has a palpable fat pad. 4
Pin bone does not have a palpable fat pad. The transverse processes of the lumbar vertebrae are sharp.
3
Thurl is prominent and the cow has a saw-toothed spine. 2
Severely emaciated. All skeletal structures are visible. 1
The thurl (rump region) has a U appearance > 5
The sacral ligament is visible and the coccygeal ligament is faintly visible. 6
Both sacral and coccygeal ligaments are not visible. 7
The thurl region flattens and becomes round. Pin bone is round. 8
All osseous protuberances are round. 9
Mao et al. (2004) suggested that the change in a cow’s BCS over time is determined by changes
in intake, in utilization of energy intake for yield, growth and maintenance, and in body tissue
deposition and mobilization. Typically, the intercalving profile of BCS is a mirror image of the
milk lactation profile, declining to a nadir at 40 to 100 days after calving as milk production peaks
and tissue reserves are mobilized to compensate for negative EB, before replenishing lost body
reserves as the milk lactation profile declines (Roche et al., 2007b). However, the shape of this
profile could be influenced by the system of production; New Zealand cows grazing fresh pasture
exhibit a W-shaped BCS profile (Roche et al., 2007b), declining for a second time in mid-
lactation when pasture quality and quantity decline, before increasing again in late lactation
(Roche et al., 2009b; Roche et al., 2009c).
An extensive review of the literature by Roche et al. (2009a) summarized the phenotypic
association between BCS (at calving, nadir and changes during the lactation) and milk production
or fertility traits. They indicated that the association between BCS and milk production and
fertility traits is generally nonlinear. Health and reproductive disorders arise from having cows
that are either too thin (especially in early lactation) or too fat (especially before calving).
Although low BCS during lactation or excessive loss of body condition in early lactation often
result in impaired health and reproductive performances (Pryce et al., 2001; Reksen et al., 2002;
Roche et al., 2007a), it has been reported that greater BCS at calving exacerbates BCS lost
postcalving and negative EB problems instead of overcoming them (Garnsworthy, 2006; Roche et
al., 2007b). Body condition score could therefore be considered an intermediate optimum trait
(Loker, 2011). The ideal BCS is the level of body fat that allows the cow to optimize milk

Genetics of body condition score and fertility
13
production while simultaneously minimizing metabolic and reproductive disorders (Bewley et al.,
2008). The ideal BCS is highly dependent on lactation stage and on the production system in
which cows are managed. Phenotypic target values for BCS as recommended by the Walloon
Breeding Association (on a 9-point scale) are 4 to 6 between 0 and 45 days in milk (DIM), 4 to 5
between 46 and 300 DIM, and 5 to 6 after 300 DIM and during dry-off (Massart, 2011).
Furthermore, an efficient BCS management strategy should also consider changes in BCS.
Monitoring changes in body condition through a scoring system is probably of greater value than
identifying absolute, snapshot measures of body condition (Bewley et al., 2008).
Body condition score profiles vary among cows and many herd- or cow-level factors contribute to
this variation. Factors associated with feeding level or diet type are of primary importance. Berry
et al. (2006) showed that cows on higher feeding levels mobilized less BCS in early lactation than
cows on lower feeding levels. Roche et al. (2009a) indicated that stocking rate, level of
concentrates, or diet type (grazed grass or total mixed ration) affect BCS. Among others, parity,
age within parity, season of calving, year of calving, breed, and genetics are all cow-level factors
that impact BCS profiles (Koenen et al., 2001; Pryce et al., 2001; Berry et al., 2006). Within
lactation, loss in BCS tends to increase with increasing parity and first-parity cows are generally
managed to calve in greater BCS than later-parity cows (Berry et al., 2006; Bewley et al., 2008).
Also, Koenen et al. (2001) showed that BCS increased as calving age increased. Differences in
BCS profile among breeds and a heterosis effect have also been reported (Koenen et al., 2001;
Mao et al., 2004; Pryce et al., 2006). Finally, as BCS is a subjectively scored trait, the effect of
BCS assessor is of importance (Veerkamp et al., 2002) and it is often considered a “nuisance
factor” (Roche et al., 2009a) that has to be considered and corrected for.
Genetic variability of body condition score
Several studies investigated the genetic variability in BCS traits and provided evidence that
differences in BCS profiles among cows are partly genetically driven. Although it is not
exhaustive, Table 2 provides an overview of the variety of studies that estimated genetic
parameters for BCS. Estimates of heritability ranged from 0.05 to 0.79 but most of the studies
reported heritabilities ranging from 0.20 to 0.50. Studies differ in the origin of data (field data or
data from research herds), breed, number and stage of lactation being examined, definition of
traits (e.g., scales used for scoring body condition), as well as the data edits, model used to
estimate genetic parameters and heritability definition (i.e., daily vs. lactation).
Field data involve a large data set of BCS generally assessed by classifiers with one record per
lactation while a data set from research herds generally includes several measurements of BCS by
one assessor on a limited number of cows in a limited number of herds. Heritability estimates tend
to be lower for field data (e.g., Lassen et al., 2003; Dal Zotto et al., 2007) than for research herd
data (e.g., Oikonomou et al., 2008; Spurlock et al., 2012). This tendency could be attributed to the
high variability among herds and BCS evaluators in field data while environmental conditions are
more controlled in research herds. Furthermore, heritability estimates tend to be higher in studies
in which BCS was assessed by a limited number of trained operators (Gallo et al., 2001; Berry et
al., 2003a) than in studies in which BCS was assessed by producers or by a large number of
evaluators (Dechow et al., 2001).

Chapter 2
14
Table 2. Overview of heritability estimates for body condition score (BCS) from various studies
Reference BCS assessor Repeated measures?
Type of record
1
Number of cows
Model2 Heritability
Koenen and Veerkamp, 1998
- Yes P 469 A - RR 0.21 - 0.45
Jones et al., 1999 Classifiers No P 100,078 S - RR 0.20 - 0.28
Pryce et al., 2000 Classifiers No P 44,672 A 0.28
Dechow et al., 2001 Producers, consultants
Yes P+M 62,957 A - MT 0.07 - 0.20
Gallo et al., 2001 1 operator Yes P+M 1,344 A 0.29
A - MT 0.27 - 0.36
Koenen et al., 2001 Classifiers No P 135,017 A - MT 0.23 - 0.37
Berry et al., 2002 Trained staff Yes P+M 6,646 A - MT 0.27 - 0.37
Berry et al., 2003b Trained staff Yes P+M 8,725 A - RR 0.39 - 0.51
Kadarmideen and Wegmann, 2003
Classifiers No P 31,500 S 0.24
Lassen et al., 2003 Classifiers No P 28,948 S - MT 0.14 - 0.29
S - RR 0.18 - 0.27
Dechow et al., 2004a
Classifiers Yes P+M 119,215 S 0.20
S - RR 0.15 - 0.24
S - MT 0.20 - 0.22
Mao et al., 2004 ~ 1 operator Yes P+M 294 A - RR 0.05 - 0.78
Pryce and Harris, 2006
Classifiers No P 169,661 S - RR 0.23 - 0.32
Dal Zotto et al., 2007
Classifiers No P 32,359 A 0.15
Oikonomou et al., 2008
1 veterinarian Yes P 497 A - RR 0.34 - 0.79
Banos and Coffey, 2010
- Yes P+M 957 A - RR 0.24 - 0.56
Vallimont et al., 2010
1 technician Yes P+M 970 A 0.26
Buttchereit et al., 2011
1 evaluator Yes P 682 A - RR 0.34 - 0.59
Loker et al., 2011 Milk recording agency
Yes P+M 21,878 A - RR 0.14 - 0.33
Zink et al., 2011 Classifiers No P 59,457 A 0.30
Spurlock et al., 2012
1 evaluator Yes P+M 402 A - MT 0.48 - 0.55
A - RR 0.43 - 0.67 1 P = primiparous; M = multiparous 2 A = animal; MT = multitrait (BCS taken at different periods of the lactation are considered different traits);
RR = random regression; S = sire
Hence, Dechow et al. (2003) indicated that heritability for BCS increased from 0.14 to 0.19 after
edits on BCS data to eliminate data with no BCS assessors or data scored inconsistently when
compared with other BCS assessors’ data. These authors expected that the heritability estimate for
BCS would increase as BCS assessors became more accustomed to evaluating cows for this trait.
Dechow et al. (2004b) estimated a genetic correlation of 0.85 (with a standard error not greater
than 0.06) between classifier recorded BCS and producer and herd-consultant recorded BCS,
indicating that these traits are very similar but not exactly the same. Moreover, to alleviate
Genetics of body condition score and fertility
15
differences in the range of scoring by different BCS assessors, some studies suggested
preadjusting BCS records using the phenotypic standard deviation within classifier (Jones et al.,
1999; Pryce et al., 2000; Koenen et al., 2001).
Although BCS can be considered the same trait over the lactation with a constant genetic variance
(Pryce et al., 2000; Kadarmideen et al., 2003; Dal Zotto et al., 2007; Zink et al., 2011), most
studies hypothesized that the variation in BCS might be controlled by different genes across DIM.
In such studies, genetic parameters were estimated using either multitrait models (BCS measured
at different periods treated as separate traits) or random regression models (Table 2). Using these
two last approaches on the same data, Lassen et al. (2003), Dechow et al. (2004a), and Spurlock et
al. (2012) reported heritability estimates in the same range. Koenen et al. (1998), Veerkamp et al.
(2001), and Berry et al. (2003b) investigated different orders of Legendre polynomials to model
the additive genetic component and calculated the eigenvalues of the additive genetic covariance
matrix to determine the contribution of each extra term to the overall variation in the curve. Using
a quadratic random regression model, the first eigenfunction accounted for 71% (Berry et al.,
2003b), 98% (Veerkamp et al., 2001), and 99% (Koenen et al., 1998) of genetic variance. Little
advantage of using Legendre polynomials of order 3 instead of order 2 has been reported (Berry et
al., 2003b).
Using either a random regression or multitrait model, genetic variance and heritability of BCS
tend to vary across days in milk (Table 2). Various trends of genetic variances for BCS have been
presented. The paucity of data at the beginning and the end of the lactation and the mathematical
behavior of polynomials at data extremities might contribute to the large genetic variation at the
peripheries of lactation in some studies (Berry et al., 2003b; Oikonomou et al., 2008). However,
the majority of studies found lower genetic variance in early lactation than in the rest of the
lactation (e.g., Koenen et al., 1998; Koenen et al., 2001; Veerkamp et al., 2001; Dechow et al.,
2004a; Loker et al., 2011), suggesting that cows are more different in their rate of immediate
recovery from negative EB than when they lose condition. Furthermore, Mao et al. (2004)
reported that the genetic variance of BCS was the highest around 120 DIM, when energy
expenditure and intake supposedly reach a balance during lactation and they concluded that BCS
curves differ genetically between cows in shape and in height. Likewise, several authors found
that heritability estimates peaked in midlactation (Gallo et al., 2001; Koenen et al., 2001; Berry et
al., 2002, 2003b; Dechow et al., 2004a; Loker et al., 2011). Finally, heritability of BCS was
generally lower in first-lactation than in later lactations (Dechow et al., 2001; Loker et al., 2011).
Heritabilities reported in Table 2 are for Holstein cows with the exception of estimates from
Koenen et al. (2001; Holstein and Red-and-White), Mao et al. (2004; Holstein, Jersey, and Danish
Red), Pryce et al. (2006; Holstein, Jersey, and crossbred), and Dal Zotto et al. (2007; Brown
Swiss). Koenen et al. (2001) found lower heritability estimates for Red-and-White heifers (0.23 to
0.32) than for Holstein cows (0.28 to 0.37) while Dal Zotto et al. (2007) obtained a relatively low
heritability (0.15) for BCS of Brown Swiss cattle. These results suggest that BCS might be under
stronger genetic control in Holstein than in other breeds. However, Mao et al. (2004) reported
higher heritability estimates for Jersey (0.55 to 0.78) and Danish-Red (0.58 to 0.70) than for
Holstein (0.30 to 0.60). Nevertheless, the latter results were obtained from data collected in a
single experimental herd that contained 294 cows and these estimates are probably subject to
large standard errors.
Body condition score measures are generally highly correlated within and between parity. Genetic
correlations among parities ranged between 0.77 and 1.00 (Dechow et al., 2001; Loker et al.,

Chapter 2
16
2011) suggesting that selection based on first lactation BCS would be effective for later parities as
well. Genetic correlation estimates between BCS measured at different points during the lactation
are generally strong, especially between adjacent periods (Koenen et al., 2001; Loker et al., 2011).
However, in some studies (Jones et al., 1999; Dechow et al., 2001; Gallo et al., 2001), BCS in
early lactation appears to be genetically less similar to BCS in other periods. Jones et al. (1999)
indicated that the correlation between BCS before 30 DIM and BCS from 151 to 210 DIM was
0.63. In the study from Dechow et al. (2001), the genetic correlation between BCS at calving and
BCS before dry-off was 0.69. Roche et al. (2009a) concluded that much of the variation observed
in BCS at different stages of the cow’s life would be under the influence of similar genes.
However, Berry et al. (2003c) found genotype by environment interactions for BCS implying that
genes that influence BCS may differ according to the nutritional (i.e., concentrate feeding level,
grazing severity, and silage quality) or milk yield (i.e., herd-year mean milk yield) environment.
As a consequence of the strong correlations among different BCS measurements over the
lactation, little genetic variation in BCS change is expected in comparison to the variation in level
of BCS. Heritability estimates for BCS change are actually lower than for BCS level and vary
from 0.01 to 0.10 (Pryce et al., 2001; Berry et al., 2002; Dechow et al., 2002).
Genetic correlations of body condition score with other traits
An overview of various studies presenting genetic correlation estimates between BCS and
production, type and body weight, diseases, and fertility traits is given in Table 3. In general, the
direction of correlations did not change between studies although the magnitude of correlations
varied. Also, it should be noted that high standard errors have been reported for some correlation
estimates.
Genetic correlations with non-fertility traits
Over a range of studies, milk, fat, and protein yields had unfavorable genetic correlations with
BCS. Clearly, cows that are genetically superior producers tend to have lower BCS, especially
during the lactation. Genetic correlations with BCS were on average -0.37 for milk yield, -0.27
for fat yield, and -0.31 for protein yield (Table 3). Negative correlations of a similar magnitude
have been also reported for test-day milk, fat, and protein yields, and fat and protein contents
(Veerkamp et al., 1997; Toshniwal et al., 2008; Loker et al., 2012). Greater BCS change in early
lactation is also expected for genetically superior producers (Pryce et al., 2001; Berry et al., 2002;
Dechow et al., 2002; Berry et al., 2003a). There was a tendency for BCS measured in early
lactation to give the weakest correlations with milk yield (Veerkamp et al., 2001; Berry et al.,
2003a; Loker et al., 2012). From these results, Dechow et al. (2001) concluded that cows that are
efficient producers of milk, direct more nutrients towards milk production and less toward body
reserves during the lactation and thus, tend to have lower BCS during the lactation. Nevertheless,
the genetic relationships between BCS and production traits are not 1, indicating that, using
appropriate indexes, both traits could be improved by genetic selection.

Genetics of body condition score and fertility
17
Table 3. Overview of genetic correlation estimates between body condition score (BCS) and
production, type, body weight, diseases, and fertility traits from various studies
Trait Average genetic correlation with BCS
1
Range Reference2
Production
Milk yield -0.37 -0.63 to -0.12 3, 5, 6, 7, 8, 10, 12, 14, 17, 18, 19
Fat yield -0.27 -0.43 to -0.03 3, 5, 6, 10, 12, 14, 18, 19
Protein yield -0.31 -0.54 to -0.06 3, 5, 6, 10, 12, 14, 18, 19
Somatic cell score -0.12 -0.17 to -0.08 18, 19, 24
Type and body weight
Dairy form, dairy character, angularity
-0.65 -0.77 to -0.35 1, 11, 12, 13, 15, 16, 17
Strength 0.45 0.17 to 0.72 11, 12
Stature 0.20 0.13 to 0.28 1, 11, 12
Heart girth 0.28 0.21 to 0.34 4, 12
Body depth 0.20 -0.05 to 0.40 1, 11, 12
Body weight 0.55 0.42 to 0.67 1, 7, 19, 21, 25
Diseases
Mastitis -0.52 -0.61 to -0.25 13, 16, 23
Diseases other than mastitis -0.19 -0.22 to -0.15 13, 16, 23
Fertility
Days to first heat -0.41 - 5
Days to commencement of luteal activity
-0.84 - 9
Days to first service -0.48 -0.63 to -0.35 3, 5, 6, 10, 14, 18, 20, 22
Days to last service -0.44 - 6
Days to conception, days open
-0.38 -0.46 to -0.30 17, 22
Days from first service to conception
0.01 - 10
Days from first to last service -0.46 -0.62 to -0.30 20, 22
Calving interval -0.39 -0.53 to -0.14 2, 5, 6, 8, 14, 20
Number of services -0.22 -0.37 to -0.06 3, 6, 10, 20
Conception at first service 0.22 0.16 to 0.28 6, 10
Conception rate at first service 0.60 - 20
Pregnant 63d after the start of the breeding season
0.37 - 10
Presented for mating within 21d from the planned start of mating
0.49 - 19
Calving rate within 42d from the planned start of calving
0.43 - 19
1 Correlations have been averaged first within studies and second among studies. 2 1=Veerkamp and Brotherstone,
1997; 2=Pryce et al., 2000; 3=Dechow et al., 2001; 4=Gallo et al., 2001; 5=Pryce et al., 2001; 6=Veerkamp et al., 2001;
7=Berry et al., 2002; 8=Pryce et al., 2002; 9=Royal et al., 2002; 10=Berry et al., 2003a; 11=Dechow et al., 2003;
12=Kadarmideen and Wegmann, 2003; 13=Lassen et al., 2003; 14=Wall et al., 2003; 15=Dechow et al., 2004a;
16=Dechow et al., 2004b; 17=Dechow et al., 2004c; 18=Kadarmideen, 2004; 19=Pryce and Harris, 2006; 20=De Haas
et al., 2007; 21=Toshniwal et al., 2008; 22=Zink et al., 2011; 23=Koeck et al., 2012; 24=Loker et al., 2012;
25=Spurlock et al., 2012.

Chapter 2
18
In contrast to these studies, Pryce et al. (2006) found a genetic correlation between BCS and 270-
d fat changing from moderately positive in early lactation to negative in late lactation. They
observed the same trend in protein yield, and, to a lesser extent, in milk yield. Pryce et al. (2006)
concluded that under the pastoral production systems typical in New Zealand, cows that have high
BCS in early lactation (in spring) are more likely to have higher total yields of fat and protein
because they have more reserves available for production in the autumn when feed resources are
limited.
Several studies investigated the genetic relationships between BCS and conformation traits.
Overall, traits related to dairyness of cows such as dairy form, angularity or udder traits are
generally negatively correlated with BCS. Since dairy form (or angularity) is a subjective type
evaluation trait described by the openness and the angle of the ribs and the flatness of bones, it
could be considered a similar trait, yet opposite, to BCS. On average the genetic correlation
between BCS and dairy form was -0.65 (Table 3); with the exception of Kadarmideen et al.
(2003) who reported a genetic correlation of -0.35, most of the studies reported relatively strong
estimates ranging from -0.77 to -0.61. Furthermore, genetic relationships between BCS and udder
type traits have been reported to be unfavorable but low to moderate (Veerkamp et al., 1997;
Dechow et al., 2003; Kadarmideen et al., 2003).
In opposition to dairyness traits, traits related to body size, body development, and body weight
were generally positively correlated with BCS. Genetic correlations with BCS were on average
0.45 for strength, 0.20 for stature, 0.28 for heart girth, and 0.20 for body depth (Table 3).
Moreover, Veerkamp et al. (1997) showed that the accuracy of selection for BCS using an index
combining stature, chest width, body depth, angularity, and rump width would be 0.88, suggesting
that BCS could be predicted from the type traits with little loss in accuracy. Dechow et al. (2003)
concluded that cows with a higher BCS have more body fat and muscle and thus appear to be
stronger, have somewhat larger body dimensions and weigh more. Moderate to strong genetic
correlations between BCS and body weight have been documented with average estimates
ranging from 0.42 to 0.67 (Table 3). From their results, Berry et al. (2002) proposed that some
breeding indices pursuing a reduction in body weight to increase animal efficiency may also lead
to reducing animals’ BCS, assuming no cognizance of other traits associated with BCS.
Overall, cows with high merit for BCS are genetically less susceptible to diseases. On average,
the genetic correlation between BCS and the occurrence of diseases other than mastitis was -0.19
(Table 3). Nevertheless, estimates vary across studies according to the trait considered (from -0.64
to 0.27; Lassen et al., 2003; Dechow et al., 2004b; Koeck et al., 2012). The strongest genetic
associations were found for ketosis, displaced abomasum, mastitis and metritis in Koeck et al.
(2012) and for metabolic and digestive disease, displaced abomasum, and mastitis in Dechow et
al. (2004b). Correlations between BCS and mastitis ranged from -0.61 to -0.25 indicating that
animals with higher BCS are genetically more resistant to mastitis. This is corroborated by the
weak negative genetic correlation between BCS and somatic cell score, which is considered an
indicator of udder health (lower values of somatic cell score are desirable). This correlation was
-0.12 on average (Table 3).

Genetics of body condition score and fertility
19
Genetic correlations with fertility
Over a range of studies, favorable, moderate to strong genetic relationships have been
documented between BCS and fertility (Table 3); cows that have genetically lower levels of BCS,
on average, experience more reproductive difficulties.
Negative genetic correlations between BCS and interval reproductive traits (i.e., number of days
between two events such as calving, heat, insemination, conception or subsequent calving) have
been reported. Genetically low BCS tend to be associated with delayed first estrus, and negative
correlations have been found between BCS and the number of days to first heat (-0.41; Pryce et
al., 2001) and the number of days to commencement of luteal activity (-0.84; Royal et al., 2002).
Cows with low BCS may not maintain energy levels that are sufficient to activate ovarian
function or display estrus and they are therefore likely inseminated for the first time at a later date
(Dechow et al., 2001). Likewise, cows genetically inclined to maintain BCS in early lactation are
inseminated earlier in the lactation (Dechow et al., 2002). The number of days to first service
actually showed moderate to strong negative correlations with BCS, ranging from -0.63 to -0.35
with an average of -0.48 (Table 3). Over a range of interval traits within the same study, the
number of days to first service often showed the strongest genetic correlation with BCS
(Veerkamp et al., 2001; Berry et al., 2003a; Wall et al., 2003). Negative genetic correlations of
BCS with calving interval, number of days to last service, number of days from calving to
conception and days between first and last services have also been reported and range on average
from -0.39 to -0.46 (Table 3). Overall, it suggests that lower BCS levels during the lactation
would increase the number of days when the cow is not pregnant.
Moderate favorable genetic relationships have been reported between BCS and traits reflecting
pregnancy status of the cow after the first insemination or within a specific time interval.
Conception (rate) at first service, pregnant 63d after the start of breeding season, presented for
mating within 21 days from the planned start of mating, and calving rate within 42 days from the
planned start of calving were all positively genetically correlated with BCS, with the correlations
ranging from 0.22 to 0.60 (Table 3). Negative genetic correlations between BCS and number of
services per cow have been reported (Table 3), ranging from -0.37 to -0.06. These estimates
suggest that cows with genetically higher BCS would have a greater chance to conceive after
insemination.
Although the direction of correlations between BCS and fertility traits generally did not change
over the lactation, studies reported that the magnitude of correlations varied according to the
lactation stage. Dechow et al. (2001), Berry et al. (2003a) and de Haas et al. (2007) reported that
BCS in mid-lactation had the strongest relationship with fertility. Because genetic correlations
between fertility and BCS could depend on lactation stage, it might be expected that the BCS
change is correlated with reproductive performance. Despite the fact that estimates are quite
variable and are subject to high standard errors, unfavorable low to moderate genetic correlations
between fertility and BCS loss in early lactation have been reported (Pryce et al., 2001; Dechow
et al., 2002; Berry et al., 2003a), indicating that greater BCS loss in early lactation is correlated
with poorer fertility.
In early lactation, cows are in negative EB. Consequently, they mobilize body tissue to sustain
milk production and their BCS decreases. Therefore, they may be yielding milk at the expense of
reproduction. Hence, Dechow et al. (2001; 2002) included mature equivalent milk yield as a
covariable in the model to adjust the genetic correlation between BCS and fertility for milk

Chapter 2
20
production as they stated that producers might inseminate higher producing cows later in
lactation. However, this adjustment did not have a significant effect on the correlations. Berry et
al. (2003a) and Pryce et al. (2000) also reported that adjustment for milk had no effect on the
direction of correlations between BCS and fertility traits.
Body condition score as an indirect predictor of fertility
A number of studies stated that focusing selection on high production over the last 50 years has
resulted in selection for cows that prioritize milk production at the expense of both health and
fertility (Veerkamp et al., 2007). To overcome declining cow fertility by means of genetic
selection, most leading dairy countries have, by now, routine genetic evaluation systems for
female fertility, and such fertility traits are now nearly unanimously included in national breeding
goals (Miglior et al., 2005). However, direct selection for female fertility might be complicated by
the following factors:
difficulty in collecting large quantities of relevant direct fertility records, especially for
unfertile animals (e.g., no calving interval records for animals that are infertile);
the long time period required to validate some phenotypes (e.g., calving interval) and its
subsequent effect on generation interval and thus genetic gain;
the generally low heritability of most traditional fertility phenotypes (from 0.01 to 0.05;
e.g., Veerkamp et al., 2007).
These factors contribute to low accuracy of estimated breeding values, especially for cows and
young bulls. Therefore, indicator traits are of interest to supplement the prediction of genetic
merit for fertility as long as these traits are easy to measure, are ideally recorded earlier in the
cow’s lactation, are heritable, and are genetically correlated with fertility. Body condition score
meets all these criteria, so is considered a useful indicator trait for health and fertility status in
dairy cattle (Loker, 2011). Body condition score is easy, quick and measurable at low cost,
exhibits genetic variation, is heritable (Table 2), and is moderately to strongly favorably
genetically correlated with fertility (Table 3). Furthermore, many countries have, by now,
implemented national genetic evaluations for BCS (Battagin et al., 2012).
Numerous studies have discussed the possibility of using BCS in a selection index or the
usefulness of BCS in predicting estimated breeding values for fertility traits. Banos et al. (2010)
investigated the associations of nine direct and indirect body energy traits with fertility and
reported that BCS in early lactation was one of the most useful traits for selection in terms of the
correlated improvement in a cow’s capacity to resume her reproductive activity postpartum. Berry
et al. (2003b) stated that BCS can serve as a predictor for the estimated breeding value of fertility,
albeit with an accuracy no greater than the genetic correlation between BCS and the fertility trait.
de Jong (2005) presented the effect of using different sources of information on the reliability of
the Dutch fertility index. Their results were based on a bull achieving 100 daughters in the first
lactation of which 64 had BCS and showed little advantage of including BCS in a genetic
evaluation. These authors concluded that BCS adds extra information only when it is recorded
early in lactation. Such results might be due to the use of classifier recorded BCS data, which
seems to be less informative than repeated measurements of BCS during the lactation. Veerkamp
et al. (2007) also stated that the additional value of including BCS in a genetic evaluation is
highest when breeding values for fertility have low accuracy, as in the case for individual cows or
when limited progeny records are available for a sire. Berry et al. (2003a) investigated different

Genetics of body condition score and fertility
21
selection indexes and illustrated the possibility of continued selection for increased milk
production without any deleterious effects on fertility or average BCS, albeit genetic merit for
milk production would increase at a slower rate. Finally, Pryce et al. (2000) also indicated that a
fertility index based on calving interval, BCS and type traits would be attractive to improve, or
prevent further decline in fertility.
Over a range of studies, BCS in mid-lactation appeared to be a more informative fertility predictor
than average BCS or BCS at other stages of lactation. Mid-lactation is the time when genetic
variability for BCS and its correlation with fertility are the greatest (Mao et al., 2004; de Haas et
al., 2007; Loker et al., 2011). Mid-lactation is also the most critical part of the lactation of the
cow, as this is when insemination often occurs, daily milk yield approaches its peak, and EB and
BCS are on the decline (Banos et al., 2004). Dechow et al. (2002) and Pryce et al. (2001) also
concluded that selection for BCS level itself, rather than BCS change across lactation, would be
more efficient for improving fertility. Banos et al. (2004) further suggested that each cow has a
genetically predetermined lowest level of body energy (and BCS) that she is allowed to reach, and
it is this nadir that determines her aptitude for fertility. These authors also stated that the speed of
reaching this level seems to be less important than the level itself. This assumption was supported
by results from phenotypic studies by Pryce et al. (2001) and Buckley et al. (2003).
Alternatives to body condition score
Several traits that are indicators of EB or changes in body reserves are potential alternatives to
BCS as fertility predictors. It includes body weight, measurements of metabolic and hormone
factors that are indicative of energy in early lactation (e.g., non esterified fatty acids, growth
hormone, and insulin), and BCS measured via automatic scoring technology. This section focuses
on traits that are potentially available within performance recording schemes: body weight,
angularity, and traits predicted from milk samples by mid-infrared spectrometry.
Body weight appears to be an obvious option to monitor changes in body reserves. Although it
has been suggested that changes in body weight are influenced by a multitude of factors other
than changes in amount of body fat (Bewley et al., 2008) and that body weight should be
supplemented by BCS to provide accurate assessments of energy balance changes across lactation
(Toshniwal et al., 2008), genetic correlations between fertility traits and body weight were in the
same range as the corresponding estimates between fertility traits and BCS (Veerkamp et al.,
2000; Berry et al., 2003a).
Angularity (or dairy form) has also been investigated as an indicator of EB and fertility and has
shown genetic correlations with fertility similar in magnitude to those of BCS (Pryce et al., 2000;
Dechow et al., 2004c). Although it remained unclear that genetic evaluations for BCS would
provide valuable genetic information beyond current dairy form evaluations, Dechow et al.
(2004b) concluded that there might be advantages to selecting BCS to improve fertility. In fact,
producers may be less reluctant to select for higher BCS than for lower dairy form because dairy
form is generally weighted positively in final score calculations.
The measurement of factors in milk that are related to EB could be promising as long as these
factors can be obtained within the routine analysis of milk recording samples. Reist et al. (2002)
investigated the use of milk traits for estimating EB and demonstrated that fat:lactose ratio was
one of the most informative traits for estimation of EB. Also milk fatty acid (FA) profile has been
Chapter 2
22
suggested to be related to energy balance status of cows in early lactation (Stoop et al., 2009), a
topic that deserves further research. Recently, McParland et al. (2011) reported the opportunity to
predict body energy status of Holstein cows using mid-infrared analysis of milk.
Conclusions
Body condition score meets all criteria required for indirect improvement of health and fertility.
First, heritability and genetic variation estimates from literature are sufficient to support BCS as a
trait suitable for breeding programs of dairy cattle. Second, although BCS is a subjectively
measured trait, BCS is both easy and quick to record. Third, genetic correlations between BCS
and fertility are favorable and moderate to strong. Cows that mobilize more body reserves and
exhibit lower BCS during lactation are genetically more disposed to fertility problems.
Consequently, selection for higher levels of BCS, especially in mid-lactation, would indirectly
improve fertility of dairy cows using an appropriate selection index.
Acknowledgements
Sarah Loker (Livestock Improvement Corporation, Hamilton 3240, New Zealand), Marie
Dufrasne and Pierre Faux (University of Liège, Gembloux Agro-Bio Tech, Animal Science Unit,
Gembloux, Belgium) are acknowledged for the manuscript review.
References
Banos, G., S. Brotherstone, and M.P. Coffey. 2004. Evaluation of body condition score measured
throughout lactation as an indicator of fertility in dairy cattle. J. Dairy Sci. 87:2669-2676.
Banos, G., and M.P. Coffey. 2010. Genetic association between body energy measured
throughout lactation and fertility in dairy cattle. Animal 4:189-199.
Battagin, M., F. Forabosco, J.H. Jakobsen, M. Penasa, T.J. Lawlor, and M. Cassandro. 2012.
International genetic evaluation of Holstein bulls for overall type traits and body condition
score. J. Dairy Sci. 95:4721-4731.
Berry, D.P., F. Buckley, P. Dillon, R.D. Evans, M. Rath, and R.F. Veerkamp. 2002. Genetic
parameters for level and change of body condition score and body weight in dairy cows. J.
Dairy Sci. 85:2030-2039.
Berry, D.P., F. Buckley, P. Dillon, R.D. Evans, M. Rath, and R.F. Veerkamp. 2003a. Genetic
relationships among body condition score, body weight, milk yield, and fertility in dairy
cows. J. Dairy Sci. 86:2193-2204.
Berry, D.P., F. Buckley, P. Dillon, R.D. Evans, M. Rath, and R.F. Veerkamp. 2003b. Genetic
parameters for body condition score, body weight, milk yield, and fertility estimated using
random regression models. J. Dairy Sci. 86:3704-3717.
Berry, D.P., F. Buckley, P. Dillon, R.D. Evans, M. Rath, and R.F. Veerkamp. 2003c. Estimation
of genotype × environment interactions, in a grass-based system, for milk yield, body
condition score, and body weight using random regression models. Livest. Prod. Sci. 83:191-
203.
Berry, D.P., R.F. Veerkamp, and P. Dillon. 2006. Phenotypic profile for body weight, body
condition score, energy intake, and energy balance across different parities and concentrate
feeding levels. Livest. Sci. 104:1-12.

Genetics of body condition score and fertility
23
Bewley, J.M. and M.M. Schutz. 2008. Review: An interdisciplinary review of body condition
scoring for dairy cattle. The Prof. Anim. Sci. 24:507-529.
Buckley, F., K. O’Sullivan, J.F. Mee, R.D. Evans, and P. Dillon. 2003. Relationships among milk
yield, body condition, cow weight, and reproduction in spring-calved Holstein-Friesians. J.
Dairy Sci. 86:2308-2319.
Butler, W.R. and R.D. Smith, 1989. Interrelationships between energy balance and postpartum
reproductive function in dairy cattle. J. Dairy Sci. 72:767-783.
Buttchereit, N., E. Stamer, W. Junge, and G. Thaller. 2011. Short communication: genetic
relationships among daily energy balance, feed intake, body condition score, and fat to
protein ratio of milk in dairy cows. J. Dairy Sci. 94:1586-1591.
Dal Zotto, R., M. De Marchi, C. Dalvit, M. Cassandro, L. Gallo, P. Carnier, and G. Bittante.
2007. Heritabilities and genetic correlations of body condition score and calving interval
with yield, somatic cell score, and linear type traits in Brown Swiss cattle. J. Dairy Sci.
90:5737-5743.
Dechow, C.D, G.W. Rogers, and J.S. Clay. 2001. Heritabilities and correlations among body
condition scores, production traits, and reproductive performance. J. Dairy Sci. 84:266-275.
Dechow, C.D., G.W. Rogers, and J.S. Clay. 2002. Heritability and correlations among body
condition score loss, body condition score, production and reproductive performance. J.
Dairy Sci. 85:3062-3070.
Dechow, C.D., G.W. Rogers, L. Klei, and T.J. Lawlor. 2003. Heritabilities and correlations
among body condition score, dairy form, and selected linear type traits. J. Dairy Sci.
86:2236-2242.
Dechow, C.D., G.W. Rogers, L. Klei, and T.J. Lawlor. 2004a. Heritability and correlations for
body condition score and dairy form within and across lactation and age. J. Dairy Sci.
87:717-728.
Dechow, C.D., G.W. Rogers, U. Sander-Nielsen, L. Klei, T.J. Tawlor, J.S. Clay, A.E. Freeman,
G. Abdel-Azim, A. Kuck, and S. Schnell. 2004b. Correlations among body condition scores
from various sources, dairy form, and cow health from the United States and Denmark. J.
Dairy Sci. 87:3526-3533.
Dechow, C.D., G.W. Rogers, L. Klei, T.J. Lawlor, and P.M. VanRaden. 2004c. Body condition
scores and dairy form evaluations as indicators of days open in US Holsteins. J. Dairy Sci.
87:3534-3541.
de Haas, Y., L.L.G. Janss, and H.N. Kadarmideen. 2007. Genetic correlations between body
condition scores and fertility in dairy cattle using bivariate random regression models. J.
Anim. Breed. Genet. 124:277-285.
de Jong, G. 2005. Usage of predictors for fertility in the genetic evaluation, application in the
Netherlands. INTERBULL Bull. 33:69-73.
de Vries, M.J. and R.F. Veerkamp. 2000. Energy balance of dairy cattle in relation to milk
production variables and fertility. J. Dairy Sci. 83:62-69.
Edmonson, A. J., I. J. Lean, L. D. Weaver, T. Farver, and G. Webster, 1989. A body condition
scoring chart for Holstein dairy cows. J. Dairy Sci. 72:68-78.
Ferguson, J.D., D.T. Galligan, and N. Thomsen, 1994. Principal descriptors of body condition
score in Holstein cows. J. Dairy Sci. 77:2698-2703.
Friggens, N.C., P. Berg, P. Theilgaard, K.L. Ingvartsen, P. LØvendahl, and J. Jensen. 2007. Breed
and parity effects on energy balance profiles through lactation: evidence of genetically driven
body energy change. J. Dairy Sci. 90:5291-5305.
Gallo, L., P. Carnier, M. Cassandro, R. Dal Zotto, and G. Bittante. 2001. Test-day genetic
analysis of condition score and heart girth in Holstein Friesian cows. J. Dairy Sci. 84:2321-
2326.
Garnsworthy, P.C. 2006. Body condition score in dairy cows: targets for production and fertility.
In: Garnsworthy, P.C. and J. Wiseman, eds. Recent Advances in Animal Nutrition.
Nottingham: Nottingham University Press 61-86.

Chapter 2
24
Jones, H.E., I.M.S. White, and S. Brotherstone. 1999. Genetic evaluation of Holstein Friesian
sires for daughter condition-score changes using a random regression model. Anim. Sci.
68:467-475.
Kadarmideen, H.N. and S. Wegmann. 2003. Genetic parameters for body condition score and its
relationship with type and production traits in Swiss Holsteins. J. Dairy Sci. 86:3685-3693.
Kadarmideen, H.N. 2004. Genetic correlations among body condition score, somatic cell score,
milk production, fertility, and conformation traits in dairy cows. Anim. Sci. 79:191-201.
Koeck, A., F. Miglior, D.F. Kelton, and F.S. Schenkel. 2012. Short communication: genetic
association of body condition score with disease resistance in first lactation Canadian
Holsteins. Can. J. Anim. Sci. 92:285-289.
Koenen, E.P.C, and R.F. Veerkamp. 1998. Genetic covariance functions for live weight, condition
score and dry-matter intake measured at different lactation stages of Holstein Friesian
heifers. Livest. Prod. Sci. 57:67-77.
Koenen, E.P.C, R.F. Veerkamp, P. Dobbelaar, and G. de Jong. 2001. Genetic analysis of body
condition score of lactating Dutch Holstein and Red-and-White heifers. J. Dairy Sci.
84:1265-1270.
Lassen, J., M. Hansen, M.K. SØrensen, G.P. Aamand, L.G. Christensen, and P. Madsen. 2003.
Genetic relationship between body condition score, dairy character, mastitis, and diseases
other than mastitis in first-parity Danish Holstein cows. J. Dairy Sci. 86:3730-3735.
Loker, S., 2011. Genetic analysis of body condition score in Canadian Holsteins. PhD Thesis:
University of Guelph - Guelph (ON, Canada).
Loker, S., C. Bastin, F. Miglior, A. Sewalem, L.R. Schaeffer, J. Jamrozik, and V. Osborne. 2011.
Short communication: estimates of genetic parameters of body condition score in the first 3
lactations using a random regression animal model. J. Dairy Sci. 94:3693-3699.
Loker, S., C. Bastin, F. Miglior, A. Sewalem, L.R. Schaeffer, J. Jamrozik, A. Ali, and V. Osborne.
2012. Genetic and environmental relationships between body condition score and milk
production traits in Canadian Holsteins. J. Dairy Sci. 95:410-419.
Massart, X., 2011. Un suivi du BCS via le contrôle laitier bientôt valorisé sur my@wenet.
Wallonie Elevages 6:17-19.
Mao, I.L., K. Sloveniewski, P. Madsen, and J. Jensen. 2004. Changes in body condition score and
in its genetic variation during lactation. Livest. Prod. Sci. 89:55-65.
McParland, S., G. Banos, E. Wall, M.P. Coffey, H. Soyeurt, R.F. Veerkamp, and D.P. Berry.
2011. The use of mid-infrared spectrometry to predict body energy status of Hosltein cows.
J. Dairy Sci. 94:3651-3661.
Miglior, F., B.L. Muir, and B.J. Van Doormaal. 2005. Selection indices in Holstein cattle of
various countries. J. Dairy Sci. 88:1255-1263.
Oikonomou, G., G.E. Valergakis, G. Arsenos, N. Roubies, and G. Banos. 2008. Genetic profile of
body energy and blood metabolic traits across lactation in primiparous Holstein cows. J.
Dairy Sci. 91:2814-2822.
Pryce, J.E., M.P. Coffey, and S. Brotherstone. 2000. The genetic relationship between calving
interval, body condition score, and linear type and management traits in registered Holsteins.
J. Dairy Sci. 83:2664-2671.
Pryce, J. E., M.P. Coffey, and G. Simm. 2001. The relationship between body condition score and
reproductive performance. J. Dairy Sci. 84:1508-1515.
Pryce, J.E., M.P. Coffey, S.H. Brotherstone, and J.A. Woolliams. 2002. Genetic relationships
between calving interval and body condition score conditional on milk yield. J. Dairy Sci.
85:1590-1595.
Pryce, J. E., and B.L. Harris. 2006. Genetics of body condition score in New Zealand dairy cows.
J. Dairy Sci. 89:4424-4432.
Reksen, O., Ø. Havrevoll, Y.T. Gröhn, T. Bolstad, A. Waldmann, and E. Ropstad. 2002.
Relationships among body condition score, milk constituents and postpartum luteal function
in Norwegian dairy cows. J. Dairy Sci. 85:1406-1415.

Genetics of body condition score and fertility
25
Reist, M., D. Erdin, D. von Euw, K. Tschuemperlin, H. Leuenberger, Y. Chilliard, H.M.
Hammon, C. Morel, C. Philipona, Y. Zbinden, N. Kuenzi, and J.W. Blum. 2002. Estimation
of energy balance at the individual and herd level using blood and milk traits in high-yielding
dairy cows. J. Dairy Sci. 85:3314-3327.
Roche, J.R., P.G. Dillon, C.R. Stockdale, L.H. Baumgard, and M.J. VanBaale. 2004.
Relationships among international body condition scoring systems. J. Dairy Sci. 87:3076-
3079.
Roche, J.R., K.A. Macdonald, C.R. Burke, J.M. Lee, and D.P. Berry. 2007a. Associations among
body condition score, body weight, and reproductive performance in seasonal-calving dairy
cattle. J. Dairy Sci. 90:376-391.
Roche, J.R., D.P. Berry, J.M. Lee, K.A. Macdonald, and R.C. Boston. 2007b. Describing the body
condition score change between successive calvings: a novel strategy generalizable to diverse
cohorts. J. Dairy Sci. 90:4378-4396.
Roche, J.R., N.C. Friggens, J.K. Kay, M.W. Fisher, K.J. Stafford, and D.P. Berry, 2009a. Invited
review: Body condition score, and its association with dairy cow productivity, health, and
welfare. J. Dairy Sci. 92:5769-5801.
Roche, J.R., L.R. Turner, J.M. Lee, D.C. Edmeades, D.J. Donaghy, K.A. Macdonald, J.W. Penno,
and D.P. Berry. 2009b. Weather, herbage quality and milk production in pastoral systems. 2.
Temporal patterns and intra-relationships in herbage quality and mineral concentration
parameters. Anim. Prod. Sci. 49:200-210.
Roche, J.R., L.R. Turner, J.M. Lee, D.C. Edmeades, D.J. Donaghy, K.A. Macdonald, J.W. Penno,
and D.P. Berry. 2009c. Weather, herbage quality and milk production in pastoral systems. 2.
Effects on dairy cattle production. Anim. Prod. Sci. 49:222-232.
Royal, M.D., J.E. Pryce, J.A. Woolliams, and A.P.F. Flint. 2002. The genetic relationship
between commencement of luteal activity and calving interval, body condition score,
production, and linear type traits in Holstein-Friesian dairy cattle. J. Dairy Sci. 85:3071-
3080.
Spurlock, D.M., J.C.M. Dekkers, R. Fernando, D.A. Koltes, and A. Wolc. 2012. Genetic
parameters for energy balance, feed efficiency and related traits in Holstein cattle. J. Dairy
Sci. 95:5393-5402.
Stoop, W.M., H. Bovenhuis, J.M.L. Heck, and J.A.M. van Arendonk. 2009. Effect of lactation
stage and energy status on milk fat composition of Holstein-Friesian cows. J. Dairy Sci.
92:1469-1478.
Toshniwal, J.K., C.D. Dechow, B.G. Cassel, J.A.D.R.N. Appuhamy, and G.A. Varga. 2008.
Heritability of electronically recorded daily body weight and correlations with yield, dry
matter intake, and body condition score. J. Dairy Sci. 91:3201-3210.
Vallimont, J.E., C.D. Dechow, J.M. Daubert, M.W. Dekleva, J.W. Blum, C.M. Barlieb, W. Liu,
G.A. Varga, A.J. Heinrichs, and C.R. Baumrucker. 2010. Genetic parameters of feed intake,
production, body weight, body condition score, and selected type traits of Holstein cows in
commercial tie-stall barns. J. Dairy Sci. 93:4892-4901.
Veerkamp, R. F., and S. Brotherstone. 1997. Genetic correlations between linear type traits, food
intake, live weight and condition score in Holstein Friesian dairy cattle. Anim. Sci. 64:385-
392.
Veerkamp, R.F., J.K. Oldenbroek, H.J. Van Der Gaast, and J.H.J. Van Der Werf. 2000. Genetic
correlation between days until start of luteal activity and milk yield, ernergy balance, and live
weights. J. Dairy Sci. 83:577-583.
Veerkamp, R.F., E.P.C. Koenen, and G. de Jong. 2001. Genetic correlations among body
condition score, yield, and fertility in first-parity Holstein cows estimated by random
regression models. J. Dairy Sci. 84:2327-2335.
Veerkamp, R.F., C.L.M. Gerritsen, E.P.C Koenen, A. Hamoen, and G. de Jong. 2002. Evaluation
of classifiers that score linear type traits and body condition score using common sires. J.
Dairy Sci. 85:976-983.

Chapter 2
26
Veerkamp, R.F., and B. Beerda. 2007. Genetics and genomics to improve fertility in high
producing dairy cows. Theriogenology 68S:S266-S273.
Wall, E., S. Brotherstone, J.A. Woolliams, G. Banos, and M.P. Coffey. 2003. Genetic evaluation
for fertility using direct and correlated traits. J. Dairy Sci. 86:4093-4102.
Waltner, S.S., J.P. McNamara, J.K. Hillers, and D.L. Brown, 1994. Validation of indirect
measures of body fat in lactating cows. J. Dairy Sci. 77:2570-2579.
Zink, V., M. Štípková, and J. Lassen. 2011. Genetic parameters for female fertility, locomotion,
body condition score, and linear type traits in Czech Holstein cattle. J. Dairy Sci. 94:5176-
5182.

Chapter 3. Genetic relationships between BCS
and reproduction traits in Canadian Holstein and
Ayrshire first-parity cows
Outline
The previous Chapter stated that, according to the present scientific literature, BCS meets all criteria required for indirect improvement of fertility. One of these criteria is that BCS should be genetically correlated to fertility. Therefore, the objective of this Chapter was to further explore the genetic correlations between BCS and reproductive performances (including fertility and calving traits) using data from Canadian Holstein and Ayrshire first parity cows. The originality of this study lies in the use of random regression models to estimate the genetic correlations between BCS (as a trait measured several times over the lactation) and reproduction traits that are measured as a single lactation record. Such approach allows the estimation of the change of the correlations between BCS and reproduction traits across the lactation.
From: Bastin, C., S. Loker, N. Gengler, A. Sewalem, and F. Miglior. 2010. Genetic
relationships between BCS and reproduction traits in Canadian Holstein and Ayrshire
first-parity cows. J. Dairy Sci. 93:2215-2228.
Chapter 3
28
Abstract
The objective of this study was to investigate the genetic relationship between body condition
score (BCS) and reproduction traits for first-parity Canadian Ayrshire and Holstein cows. Body
condition scores were collected by field staff several times over the lactation in herds from
Québec, and reproduction records (including both fertility and calving traits) were extracted from
the official database used for the Canadian genetic evaluation of those herds. For each breed, six
2-trait animal models were run; they included random regressions that allowed the estimation of
genetic correlations between BCS over the lactation and reproduction traits that are measured as a
single lactation record. Analyses were undertaken on data from 108 Ayrshire herds and 342
Holstein herds. Average daily heritabilities of BCS were close to 0.13 for both breeds; these
relatively low estimates might be explained by the high variability among herds and BCS
evaluators. Genetic correlations between BCS and interval fertility traits (days from calving to
first service, days from first service to conception, and days open) were negative and ranged
between -0.77 and -0.58 for Ayrshire and between -0.31 and -*0.03 for Holstein. Genetic
correlations between BCS and 56-d nonreturn rate at first insemination were positive and
moderate. The trends of these genetic correlations over the lactation suggest that a genetically low
BCS in early lactation would increase the number of days that the primiparous cow was not
pregnant and would decrease the chances of the primiparous cow to conceive at first service.
Genetic correlations between BCS and calving traits were generally the strongest at calving and
decreased with increasing days in milk. The correlation between BCS at calving and maternal
calving ease was 0.21 for Holstein and 0.31 for Ayrshire and emphasized the relationship between
fat cows around calving and dystocia. Genetic correlations between calving traits and BCS during
the subsequent lactation were moderate and favorable, indicating that primiparous cows with a
genetically high BCS over the lactation would have a greater chance of producing a calf that
survived (maternal calf survival) and would transmit the genes that allowed the calf to be born
more easily (maternal calving ease) and to survive (direct calving ease).
Key words: body condition score, fertility, calving ease, genetic correlation

Body condition score and reproduction traits
29
Introduction
Management of reproductive performance (including fertility and calving traits) is an important
issue to the dairy industry. Decreased fertility is a very topical problem and has been documented
over the last few years by several authors (Lucy, 2001). For instance, VanRaden et al. (2004)
indicated that the number of days between calving and conception (or days open) increased from
110 to 140 between 1965 and 2000 in the United States. The decline in fertility is probably due to
a combination of physiological and management factors that have an additive effect on
reproductive efficiency (Lucy, 2001). Among other factors, the extent and the duration of the
postpartum negative energy balance strongly influences the fertility of the dairy cow (Butler and
Smith, 1989). However, because of the difficulty of routinely measuring the energy balance
status, indirect indicators such as BCS are commonly used. Body condition score assesses the
stored energy reserves of the dairy cow and is therefore linked to energy balance status and
fertility. Previous studies estimated the genetic correlations between fertility traits and BCS using
multivariate analyses and suggested that cows with a genetically low BCS tend to have poorer
fertility (Dechow et al., 2001; Pryce et al., 2001; Berry et al., 2003a).
Calving traits are among the most important functional traits because of their association with
economi cally important traits such as fertility, longevity, and milk production (Dematawewa and
Berger, 1997). Some risk factors of dystocia have been identified such as parity, sex, and weight
of the calf, age at first calving, or season (Meijering, 1984; Berry et al., 2007). Moreover, some
studies investigated the phenotypic relationship between BCS and calving traits and indicated that
a high BCS before calving could increase the risk of dystocia and consequently stillbirth
(Chassagne et al., 1999). To our knowledge, the genetic relationship between BCS and calving
traits has not been investigated.
Previous studies concerning the genetic relationship between fertility and BCS considered BCS at
different stages of lactation as different traits (e.g., BCS at calving or BCS postpartum). However,
as shown by Veerkamp et al. (2001) and Berry et al. (2003b), using random regression models
allows the estimation of genetic correlations between BCS over the lactation and traits that are
measured as a single lactation record. This approach allows the estimation of the change of the
correlations between BCS and reproduction traits across the lactation.
The objective of this research was to estimate genetic correlations between BCS and reproduction
traits for first-parity Canadian Holstein and Ayrshire cows, using random regression models. This
research is part of a larger project to develop a genetic evaluation for BCS in Canada.
Materials and methods
Data editing
In Canada, BCS is recorded via 2 separate systems. First, BCS has been recorded on a scale from
1 to 5 in increments of 0.25 (Edmonson et al., 1989) on a large number of Québec herds by the
field staff of Valacta (the Canadian DHI organization responsible for Québec and Atlantic
provinces) since 2001, mainly for management purposes. More recently, BCS has been recorded
nationwide, also on a scale from 1 to 5 in increments of 0.25, since June 2006 as a research trait
by breed classifiers during the routine type classification. Whereas the latter system generally

Chapter 3
30
records one observation per cow per lactation, several records are available per cow per lactation
from the first system. The number of data from the classification system is still limited; therefore,
only data from Valacta were used in this study.
Ayrshire and Holstein BCS were collected between January 2001 and September 2008 from herds
in Québec, Canada. Scores were available for cows in the first 3 parities. Body condition score
could be recorded several times during lactation and during the dry period. The same scale was
used in both breeds, and the same group of BCS assessors scored Holstein and Ayrshire cows. On
average, 2.4 and 2.7 BCS records were available per cow per parity for Ayrshire and Holstein
cows, respectively. Herds with <5 cows recorded across the data set were deleted. Across the data
set, herds had to have a BCS standard deviation >0.25. Then, BCS records were deleted for a
given herd × test-day if <5 records were taken at that herd × test-day. These criteria were chosen
so that the data set included records from herds that recorded BCS regularly and in a reliable way.
Finally, BCS records taken after 335 DIM were deleted and cows with a dry period >80 d were
eliminated.
Reproduction records used for the Canadian genetic evaluation were then extracted from the
official database of the Canadian Dairy Network. Records were kept for herds with at least 1 cow
with both BCS records and one of the following traits: 1) days between calving and first service
(CTFS), 2) days between first service and conception (FSTC), 3) days open (DO), 4) 56-d
nonreturn rate at first insemination (NRR), 5) calving ease (CE), and 6) calf survival (CS).
Nonreturn rate was coded 1 when there was no subsequent insemination between 15 and 56 d
following the first service, and 0 otherwise. Because NRR is used as an early indication of
conception rate, NRR data have not been validated with a subsequent calving date. Therefore, true
pregnancy rate might have been overestimated because cows that were sold or culled or cows that
returned but were served by a natural-service farm sire were not taken into account. Conception
date was determined using the subsequent calving date that agreed with the latest insemination
data. Calving difficulty was scored in 4 classes from 1 (unassisted calving) to 4 (surgery). In this
study, the trait will be called calving ease to stay in agreement with official Canadian practice.
Calf survival was defined as 0 (dead within 24 h from birth) and 1 (alive).
After editing the data set, only records from the first parity were kept, as this was a preliminary
study. Because a random regression model was used, cows were limited to at least 2 BCS records,
1 before 60 DIM and 1 after 60 DIM. Moreover, at least 2 observations per class of each effect
(except animal effect) were required. After those edits, 3.7 and 4.0 BCS records were available on
average per cow for Ayrshire and Holstein, respectively. Whereas the complete data set was used
for the variance component estimation for Ayrshire cows, 5 random samples of complete herds
were extracted from the edited Holstein data set. Numbers of data and numbers of cows after
editing are given in Tables 4 and 5. For Ayrshire, data included 9,739 BCS observations and
9,525 to 10,768 reproduction records depending on the trait. These data included 11,975 to 14,683
cows with records for at least 1 trait and 1,288 to 1,920 cows with records for both traits. For
Holstein, data from the 5 samples included 5,606 to 9,432 BCS records (7,351 on average), 5,205
to 11,299 reproduction records (7,682 on average), and 6,011 to 13,602 cows with at least 1
record (8,812 on average) depending on the sample and on the trait. The number of cows with
both records ranged between 5,212 and 7,321. This number of records was about 20% of the total
number of cows. The number of herds was 108 for the Ayrshire data set, 1,816 for the complete
Holstein data set, and 342 for the Holstein data set that was used for variance component
estimation. Finally, pedigree data were extracted from the database used for the official Canadian
genetic evaluations and were limited to animals born after 1985.

Body condition score and reproduction traits
31
Tab
le 4
. D
escriptive s
tatistics o
f th
e e
dite
d f
irst-
parity
Ayrs
hire d
ata
set
for
each m
ode
l: B
CS
with
one o
f th
e f
ollo
win
g t
raits:
ca
lvin
g t
o f
irst
serv
ice
(CT
FS
), first serv
ice
to
con
ceptio
n (
FS
TC
), d
ays o
pen (
DO
), 5
6-d
no
nre
turn
rate
at firs
t in
sem
inatio
n (
NR
R),
calv
ing e
ase (
CE
), a
nd
calf s
urv
ival (C
S)

Chapter 3
32
Tab
le 5
. D
escriptive s
tatistics o
f th
e e
dite
d H
ols
tein
com
ple
te d
ata
set
and t
he d
ata
set
used f
or
para
mete
r estim
atio
n (
VC
E d
ata
set)
for
each
mode
l: B
CS
with o
ne o
f th
e f
ollo
win
g t
raits:
calv
ing t
o f
irst
serv
ice (
CT
FS
), f
irst
serv
ice t
o c
onception (
FS
TC
), d
ays o
pen (
DO
), 5
6-d
nonre
turn
rate
at
firs
t in
se
min
ation (
NR
R),
ca
lvin
g e
ase (
CE
), a
nd c
alf s
urv
ival (C
S)

Body condition score and reproduction traits
33
Models and genetic parameter estimation
The models were developed based on the official genetic evaluation models for reproduction
traits, initially developed by Jamrozik et al. (2005) and then updated by the Canadian Dairy
Network (INTERBULL, 2009). For Ayrshire, six 2-trait (BCS and each of the 6 reproduction traits)
models were run. For Holstein, the six 2-trait models were run for each of the 5 samples. The
effects used to model CTFS, FSTC, and DO were the same.
The following model was used:
edZaZpZpZhZXβy 54d3m21
where y was the vector of observations for BCS and one of the reproduction traits; β was the
vector of the following fixed effects: for CTFS, FSTC and DO, 1) class of 2 yr of birth × season
of birth, 2) age at calving × season of calving; for NRR, 1) class of 2 yr of birth × season of birth,
2) age at calving × season of first service; for CE and CS, 1) class of 2 yr of birth × season of
birth, 2) age at calving × season of calving × sex of calf; for BCS, 1) class of 2 yr of calving ×
season of calving, 2) age at calving × class of 14 DIM; for CTFS, DO, FSTC, CE, and CS, h was
the vector for the following random effect: 1) herd × class of 2 yr of birth; for NRR, h was the
vector of the following random effects: 1) herd × class of 2 yr of birth, 2) AI technician × class of
2 yr of first service, 3) service sire × class of 2 yr of first service; and for BCS, h was the vector of
random regression coefficients for the effect of herd × class of 2 yr of calving; pm was the vector
of random regression coefficients for permanent environmental effect for BCS, the vector of the
random environmental effect for fertility traits, and the vector of the random environmental
maternal effect for calving traits; pd was the vector of the random direct environmental effect for
calving traits; a was the vector of random regression coefficients for additive genetic effect for
BCS, the vector of the random additive genetic effects for fertility traits, and the vector of
maternal (cow) genetic effects for calving traits; d was the vector of direct (calf) genetic effects
for calving traits; e was a vector of residuals; and X and Zi (i = 1,5) were incidence matrices
assigning observations to effects.
Inasmuch as BCS is a longitudinal trait over the lactation, calving date rather than birth date was
chosen to determine environmental effects for BCS. Because the information was not available,
an effect accounting for BCS assessors was not included in the model. Four groups for age at
calving were defined as <24 mo, from 24 to 26 mo, from 27 to 28 mo and >28 mo. Four seasons
of birth or calving were defined as December to February, March to May, June to August, and
September to November. Regression curves were modeled using Legendre polynomials of order 2
(quadratic); this order was chosen first considering the number of available BCS records per first-
parity cow, and second based on preliminary results that showed that the model tended to be
overparameterized using higher order Legendre polynomials. Moreover, other studies such as
Berry et al. (2003b) presented little advantage of using Legendre polynomials of order 3 instead
of order 2. For the analyses of fertility traits, the covariance matrices for environmental and
additive genetic effects combined the variance for the fertility trait (2σf ), the (co)variances for
random regression components for BCS (e.g.,2
0σbcsL , 2,0σ bcsLbcsL ) and the covariance between the
fertility trait and random regression components for BCS (e.g., 0,σ bcsLf ).

Chapter 3
34
The (co)variance matrix had the following structure:
[
2
22,02,
2,0
2
00,
2,0,
2
σ...σσ
............
σ...σσ
σ...σσ
bcsLbcsLbcsLbcsLf
bcsLbcsLbcsLbcsLf
bcsLfbcsLff
]
For calving traits, the covariance matrices for genetic and environmental effects combined the
variance for the maternal effect of calving trait (2σcm ), the variance for the direct effect of calving
trait (2σcd ), the (co)variances for random regression components for BCS (e.g.
2
0σbcsL , 2,0σ bcsLbcsL )
and the covariance between maternal or direct effect of calving trait and random regression
components for BCS (e.g. 0,σ bcsLcm , 1,σ bcsLcd ). Covariance between maternal and direct genetic
effects was assumed to be zero, as in the official evaluation run by Canadian Dairy Network. The
covariance environmental and genetic matrices had the following structure:
[
2
1,0,
1,
2
11,01,
0,1,0
2
00,
1,0,
2
σ...σσ0
...............
σ...σσσ
σ...σσσ
0...σσσ
cdbcsLcdbcsLcd
bcsLcdbcsLbcsLbcsLbcsLcm
bcsLcdbcsLbcsLbcsLbcsLcm
bcsLcmbcsLcmcm
]
.
Including environmental covariance between reproduction traits and BCS in the model allowed
for the nongenetic link between BCS and those traits to be taken into account across the lactation.
It also avoided an overestimation of the genetic correlations between BCS and reproduction traits.
Random effects were assumed to be normally distributed and residual variances were assumed to
be independent and constant over the lactation. (Co)variance estimation was performed using
expectation maximization (EM)-REML (Misztal, 2007) on the whole population of Ayrshire cows
and on the 5 random samples of complete herds for Holstein. The 5 sets of variance components
for Holstein were averaged afterward. For both breeds, variance components for BCS over the
lactation were averaged across the six 2-trait analyses; standard errors of genetic variances were
assumed to be the standard deviation of genetic variances across analyses. For Ayrshire
reproductive traits, standard errors of genetic variances were estimated by running average
information (AI)-REML for 1 round, using the final estimates given by EM-REML as priors. For
Holstein reproductive traits, standard errors of genetic variance were assumed to be the standard
deviation of genetic variances across the 5 samples. Daily heritability of BCS was defined as the
ratio of genetic variance to the sum of all random effects variances for each DIM from 5 to 335 d;
daily BCS heritabilities were then averaged across the 6 separate 2-trait analyses within each
breed. Finally, the average daily BCS heritability was defined as the average across the entire
lactation. The genetic correlations among BCS at different stages of lactation were also computed
within each breed for the six 2-trait models and were then averaged. Heritabilities for
reproduction traits were defined as the ratio of genetic variance to the sum of all random effect
variances. Genetic correlations across the lactation between BCS and reproduction traits were
obtained as the diagonal of QGQ′, where G represents the covariance matrix of the genetic effect
and Q is a 23 × 3 matrix containing Legendre polynomials coefficients computed for DIM 5, 20,
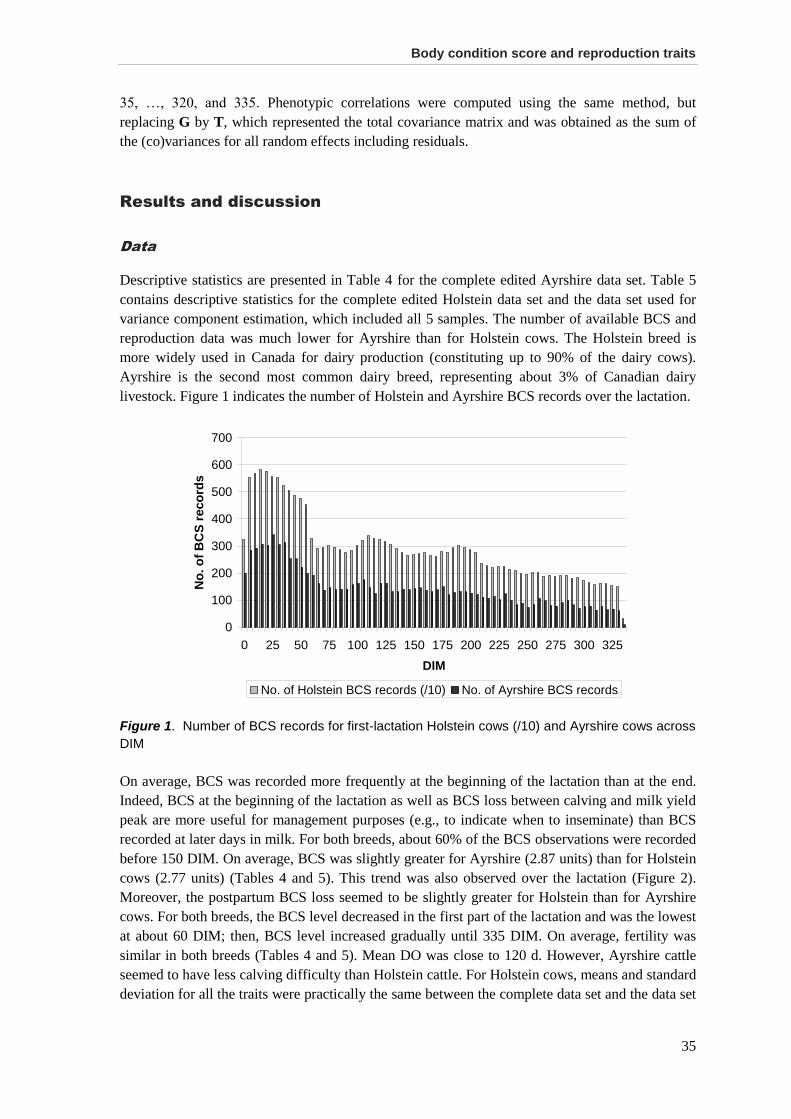
Body condition score and reproduction traits
35
35, …, 320, and 335. Phenotypic correlations were computed using the same method, but
replacing G by T, which represented the total covariance matrix and was obtained as the sum of
the (co)variances for all random effects including residuals.
Results and discussion
Data
Descriptive statistics are presented in Table 4 for the complete edited Ayrshire data set. Table 5
contains descriptive statistics for the complete edited Holstein data set and the data set used for
variance component estimation, which included all 5 samples. The number of available BCS and
reproduction data was much lower for Ayrshire than for Holstein cows. The Holstein breed is
more widely used in Canada for dairy production (constituting up to 90% of the dairy cows).
Ayrshire is the second most common dairy breed, representing about 3% of Canadian dairy
livestock. Figure 1 indicates the number of Holstein and Ayrshire BCS records over the lactation.
Figure 1. Number of BCS records for first-lactation Holstein cows (/10) and Ayrshire cows across
DIM
On average, BCS was recorded more frequently at the beginning of the lactation than at the end.
Indeed, BCS at the beginning of the lactation as well as BCS loss between calving and milk yield
peak are more useful for management purposes (e.g., to indicate when to inseminate) than BCS
recorded at later days in milk. For both breeds, about 60% of the BCS observations were recorded
before 150 DIM. On average, BCS was slightly greater for Ayrshire (2.87 units) than for Holstein
cows (2.77 units) (Tables 4 and 5). This trend was also observed over the lactation (Figure 2).
Moreover, the postpartum BCS loss seemed to be slightly greater for Holstein than for Ayrshire
cows. For both breeds, the BCS level decreased in the first part of the lactation and was the lowest
at about 60 DIM; then, BCS level increased gradually until 335 DIM. On average, fertility was
similar in both breeds (Tables 4 and 5). Mean DO was close to 120 d. However, Ayrshire cattle
seemed to have less calving difficulty than Holstein cattle. For Holstein cows, means and standard
deviation for all the traits were practically the same between the complete data set and the data set
0
100
200
300
400
500
600
700
0 25 50 75 100 125 150 175 200 225 250 275 300 325
DIM
No
. o
f B
CS
reco
rds
No. of Holstein BCS records (/10) No. of Ayrshire BCS records

Chapter 3
36
used for variance component estimation. The sample data set can therefore be considered
representative of the complete data set.
Figure 2. Trend (daily means) of BCS records for first-lactation Holstein and Ayrshire cows
across DIM
Variance components, heritabilities, and genetic correlations among BCS
Variance components of BCS across lactation are presented in Figure 3. For both breeds, genetic
variance was the lowest variance across lactation and increased with increasing DIM. Variance
for the herd × class of 2 yr of calving effect was largest at the extremities of the curve.
Figure 3. Variance component (averaged for each breed across the six 2-trait analyses) of BCS
for first-parity Ayrshire (AY) and Holstein (HO) cows across DIM
Genetic variances and their standard errors are presented in Table 6 for BCS and in Table 7 for
reproduction traits. Because variance component estimation was undertaken on the whole
2
2.2
2.4
2.6
2.8
3
3.2
3.4
0 25 50 75 100 125 150 175 200 225 250 275 300 325
DIM
BC
S
Holstein Ayrshire
0
2
4
6
8
10
5 35 65 95 125 155 185 215 245 275 305 335
DIM
Va
ria
nc
es
(*1
00
)
Herd x 2 years of calving (AY) Permanent environment (AY)
Additive genetic (AY) Herd x 2 years of calving (HO)
Permanent environment (HO) Additive genetic (HO)

Body condition score and reproduction traits
37
population of Ayrshire but only on 5 independent samples for Holstein, standard errors were
generally smaller for Ayrshire.
Table 6. Genetic variances (×100) and their standard errors (×100) of the constant (i0), the linear
(i1), and the quadratic (i2) Legendre coefficient of BCS1
Trait
Ayrshire Holstein
i0 i1 i2 i0 i1 i2
BCS 1.98 ± 0.04 0.20 ± 0.01 0.02 ± 0.04 2.27 ± 0.61 0.23 ± 0.08 0.09 ± 0.03 1 Genetic variances were averaged across the six 2-trait analyses; standard errors of genetic variances were assumed to
be the standard deviation of genetic variances across analyses.
Table 7. Maternal and direct genetic variances and their standard errors in Ayrshire and Holstein
breeds for the following traits: calving to first service (CTFS), first service to conception (FSTC),
days open (DO), 56-d nonreturn rate at first insemination (NRR), calving ease (CE), and calf
survival (CS)1
Trait
Ayrshire Holstein
Maternal Direct Maternal Direct
CTFS 15.81 ± 0.14 37.31 ± 7.43
FSTC 23.97 ± 0.22 54.32 ± 17.49
DO 108.80 ± 1.00 106.76 ± 56.48
NRR 0.49 ± 0.00 0.29 ± 0.07
CE 0.53 ± 0.00 0.08 ± 0.00 2.28 ± 0.41 1.72 ± 1.14
CS 0.04 ± 0.00 0.06 ± 0.00 0.26 ± 0.22 0.11 ± 0.10 1For NRR, CE, and CS, variances and standard errors are multiplied by 100. Genetic variances were averaged across
analyses. For Ayrshire, standard errors of genetic variances have been estimated running average information-REML.
For Holstein, standards errors of genetic variance have been assumed to be the standard deviation of genetic variances
across the 5 samples.
Daily heritabilities for BCS in first lactation for each breed are presented in Figure 4. For
Ayrshire, heritability estimates over the lactation ranged between 0.08 and 0.24 and increased
with DIM. For Holstein, BCS heritability was the smallest at early lactation (0.07 at 5 DIM) and
the largest in mid lactation (0.17 at 215 DIM). This result is in agreement with the literature,
which indicated that BCS heritabilities tended to be larger in mid to late lactation (Koenen et al.,
2001; Berry et al., 2003b). The average daily heritability, obtained as the average of the daily
heritabilities across the entire lactation, was about 0.13 for both breeds (Table 8). These
heritabilities were generally lower than estimates from the literature obtained from various data
sets (Holstein or other breeds; one or several BCS records throughout the cow’s lifetime; 5- or 9-
point scale; different systems of production) using various models (random regression vs.
multivariate; animal vs. sire) with estimates ranging between 0.27 and 0.36 (Gallo et al., 2001),
between 0.28 and 0.37 (Koenen et al., 2001), between 0.29 and 0.43 (Berry et al., 2003a), and
between 0.23 and 0.32 (Pryce and Harris, 2006). Some suggestions could be put forward to
explain the relatively low heritability estimates of this study. First, BCS is a subjective measure
and, in the current study, was assessed by field staff or producers. For most of the studies cited
above, BCS was taken by trained individuals who used similar scoring procedures (classifiers or
personnel of research center). The recording was therefore expected to be more homogeneous
among herds and BCS evaluators than in the current study. This fact could explain the large
proportion of the total variance explained by the herd × class of 2 yr of calving effect (35%),
whereas the importance of the other effects was (in decreasing order): residual (27%), permanent
environment (24%), and genetic (14%) (Figure 3). Similarly, Koenen et al. (2001) found that
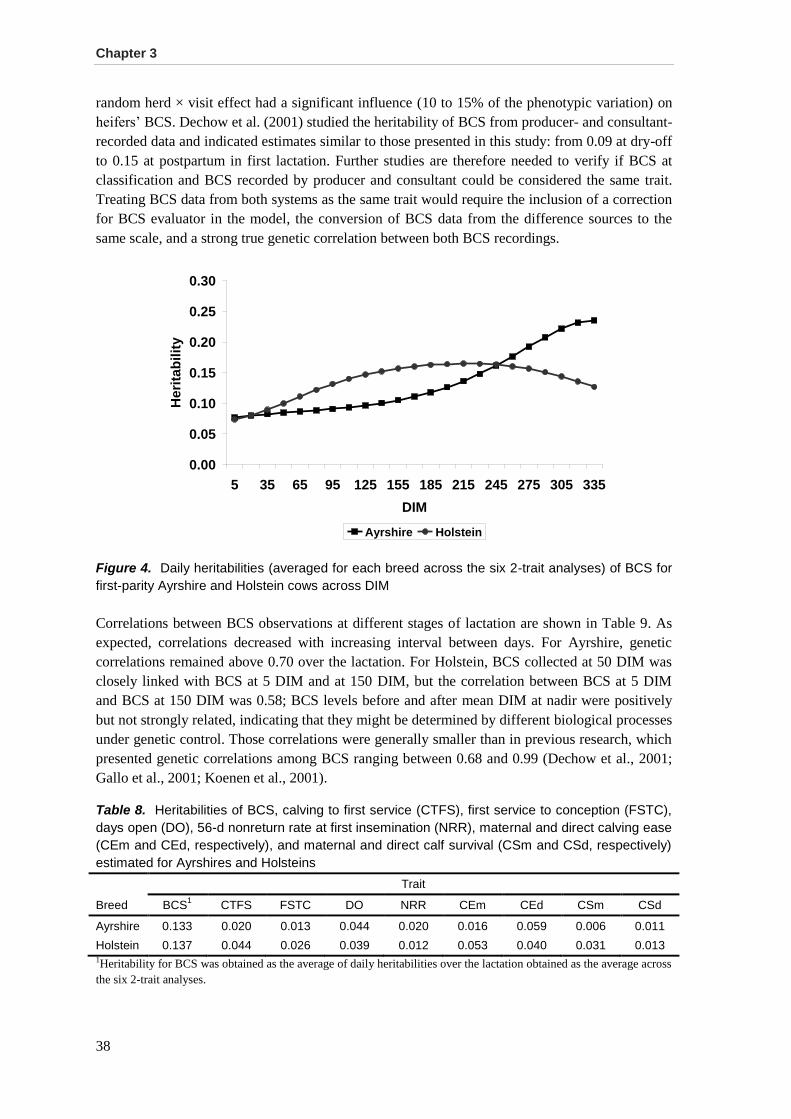
Chapter 3
38
random herd × visit effect had a significant influence (10 to 15% of the phenotypic variation) on
heifers’ BCS. Dechow et al. (2001) studied the heritability of BCS from producer- and consultant-
recorded data and indicated estimates similar to those presented in this study: from 0.09 at dry-off
to 0.15 at postpartum in first lactation. Further studies are therefore needed to verify if BCS at
classification and BCS recorded by producer and consultant could be considered the same trait.
Treating BCS data from both systems as the same trait would require the inclusion of a correction
for BCS evaluator in the model, the conversion of BCS data from the difference sources to the
same scale, and a strong true genetic correlation between both BCS recordings.
Figure 4. Daily heritabilities (averaged for each breed across the six 2-trait analyses) of BCS for
first-parity Ayrshire and Holstein cows across DIM
Correlations between BCS observations at different stages of lactation are shown in Table 9. As
expected, correlations decreased with increasing interval between days. For Ayrshire, genetic
correlations remained above 0.70 over the lactation. For Holstein, BCS collected at 50 DIM was
closely linked with BCS at 5 DIM and at 150 DIM, but the correlation between BCS at 5 DIM
and BCS at 150 DIM was 0.58; BCS levels before and after mean DIM at nadir were positively
but not strongly related, indicating that they might be determined by different biological processes
under genetic control. Those correlations were generally smaller than in previous research, which
presented genetic correlations among BCS ranging between 0.68 and 0.99 (Dechow et al., 2001;
Gallo et al., 2001; Koenen et al., 2001).
Table 8. Heritabilities of BCS, calving to first service (CTFS), first service to conception (FSTC),
days open (DO), 56-d nonreturn rate at first insemination (NRR), maternal and direct calving ease
(CEm and CEd, respectively), and maternal and direct calf survival (CSm and CSd, respectively)
estimated for Ayrshires and Holsteins
Breed
Trait
BCS1 CTFS FSTC DO NRR CEm CEd CSm CSd
Ayrshire 0.133 0.020 0.013 0.044 0.020 0.016 0.059 0.006 0.011
Holstein 0.137 0.044 0.026 0.039 0.012 0.053 0.040 0.031 0.013 1Heritability for BCS was obtained as the average of daily heritabilities over the lactation obtained as the average across
the six 2-trait analyses.
0.00
0.05
0.10
0.15
0.20
0.25
0.30
5 35 65 95 125 155 185 215 245 275 305 335
DIM
He
rita
bil
ity
Ayrshire Holstein
Body condition score and reproduction traits
39
Table 9. Genetic correlations over DIM among first-parity BCS for Ayrshire (above diagonal) and
Holstein (below diagonal)
DIM
DIM
5 50 150 250 335
5 0.93 0.71 0.70 0.74
50 0.90 0.91 0.88 0.83
150 0.58 0.88 0.97 0.87
250 0.46 0.78 0.97 0.95
335 0.43 0.65 0.81 0.92
Heritabilities for reproduction traits for both breeds in first lactation are presented in Table 8.
They ranged between 0.006 and 0.059 depending on the breed and trait. Binary traits (NRR and
CS) tended to have lower estimates. Heritability estimates of this study were smaller than in the
study of Jamrozik et al. (2005), who provided the most recent estimates for Canadian Holstein
cows. Several assumptions could be put forward to explain these differences. First, high standard
errors are generally observed on estimates for reproduction traits. As presented in Table 7,
standard errors of genetic variances were relatively high for those traits. Second, environmental
variance was linked to BCS in the models of this study. Finally, the estimates used in Jamrozik et
al. (2005) derived benefit from the use of a multivariate model, which included 16 reproductive
traits.
Genetic correlations between BCS and fertility traits
Genetic correlations between BCS and fertility traits are presented in Figure 5 for Ayrshire and
Figure 6 for Holstein first-parity cows. Phenotypic correlations are presented in Table 10 for
Ayrshire and Table 11 for Holstein. For both breeds, genetic correlations were negative for
interval traits (CTFS, FSTC, and DO) and positive for NRR, suggesting a favorable genetic
relationship between BCS and fertility. For Ayrshire, genetic correlations between BCS and
interval traits were moderate to strong and did not change considerably over the lactation; they
ranged between -0.77 for DO at 335 DIM and -0.58 for FSTC at 5 DIM. The genetic correlation
between BCS and NRR ranged from 0.16 and 0.24. For Holstein, genetic correlations between
BCS and interval traits were smaller compared with Ayrshire estimates. Between BCS and FSTC
and between BCS and DO, the weakest correlation occurred in early lactation and was larger in
mid and late lactation. Specifically, genetic correlations ranged from -0.19 around 200 DIM to
-0.03 at 5 DIM between BCS and FSTC and from -0.31 at 200 DIM to -0.14 at 5 DIM between
BCS and DO. Between BCS and CTFS, the largest correlation occurred at 50 DIM and was -0.27.
The genetic correlation between BCS and NRR ranged between 0.45 and 0.54. The phenotypic
relationships between BCS and fertility traits were not as strong as the genetic relationships. The
range of phenotypic correlations was -0.17 to -0.01. Furthermore, the sign of correlation (positive
or negative) was the same for phenotypic and genetic correlations.
In first-parity Holstein cows, average CTFS and DO were 88 and 122 d, respectively (87 and 120
d in Ayrshire, respectively). Therefore, the correlations presented above suggest that a genetically
low BCS in early lactation was associated with increased number of days when the cow was not
pregnant and a decreased chance for the cow to be pregnant at first service. From a phenotypic
point of view, dairy cows enter a negative energy state in early lactation in which they mobilize
fat stores to meet the increased energy requirements of milk production. This mobilization of
body reserves, represented by a loss of BCS, has been associated with delays in the onset of

Chapter 3
40
normal ovarian activity (limiting the number of estrus cycles before breeding) and a reduced
conception rate (Butler and Smith, 1989). Furthermore, van Straten et al. (2009) indicated that the
amount of body fat available for mobilization between 40 to 60 DIM was more informative as an
indicator for the extent of adaptation to negative energy balance than the amount of body fat lost
from calving to this period and was associated with extended FSTC.
Figure 5. Genetic correlations between BCS and fertility traits: calving to first service (CTFS),
first service to conception (FSTC), days open (DO), and 56-d nonreturn rate at first insemination
(NRR) for first-parity Ayrshire cows across DIM
Figure 6. Genetic correlations between BCS and fertility traits: calving to first service (CTFS),
first service to conception (FSTC), days open (DO), and 56-d nonreturn rate at first insemination
(NRR) for first-parity Holstein cows across DIM
From a genetic point of view, these results indicate that cows that were genetically low for BCS
may not have been able to maintain energy levels sufficient to activate ovarian function or display
estrus. These types of cows are likely inseminated for the first time at a later date because of a
delay in the onset of ovulation or estrus (Dechow et al., 2001) and would likely conceive later as
well. The estimated correlations in this study are in the range of those reported in previous
-1.0
-0.8
-0.6
-0.4
-0.2
0.0
0.2
0.4
5 35 65 95 125 155 185 215 245 275 305 335
DIM
Ge
ne
tic
co
rre
lati
on
BCS-CTFS BCS-FSTC BCS-DO BCS-NRR
-0.4
-0.2
0.0
0.2
0.4
0.6
5 35 65 95 125 155 185 215 245 275 305 335
DIM
Ge
ne
tic
co
rre
lati
on
BCS-CTFS BCS-FSTC BCS-DO BCS-NRR

Body condition score and reproduction traits
41
studies. Dechow et al. (2001) reported a genetic correlation of -0.12 between BCS at calving and
CTFS for first-parity Holstein cows. Berry et al. (2003b) estimated genetic correlations between
BCS and CTFS that varied slightly around -0.35 during the first 100 DIM for multiparous
Holstein cows using a random regression model. Additionally, Veerkamp et al. (2001) estimated
genetic correlations for first-parity cows by using a random regression model and found stronger
estimates, ranging between -0.60 and -0.50, during the first 100 d of the lactation.
Table 10. Phenotypic correlations between BCS and the reproduction traits calving to first
service (CTFS), first service to conception (FSTC), days open (DO), 56-d nonreturn rate at first
insemination (NRR), maternal and direct calving ease (CEm and CEd, respectively), and maternal
and direct calf survival (CSm and CSd, respectively) for first-parity Ayrshire cows across DIM
DIM
DIM
5 50 100 200 335
BCS - CTFS -0.08 -0.10 -0.10 -0.09 -0.06
BCS - FSTC -0.04 -0.05 -0.06 -0.07 -0.07
BCS - DO -0.09 -0.09 -0.07 -0.09 -0.17
BCS - NRR 0.02 0.03 0.03 0.03 0.01
BCS - CEm 0.01 0.01 0.01 0.01 0.04
BCS - CEd -0.04 -0.01 0.02 0.04 0.00
BCS - CSm -0.05 -0.03 -0.01 -0.01 -0.05
BCS - CSd -0.03 0.01 0.04 0.08 0.07
Table 11. Phenotypic correlations between BCS and the reproduction traits calving to first
service (CTFS), first service to conception (FSTC), days open (DO), 56-d nonreturn rate at first
insemination (NRR), maternal and direct calving ease (CEm and CEd, respectively), and maternal
and direct calf survival (CSm and CSd, respectively) for first-parity Holstein cows across DIM
DIM
DIM
5 50 100 200 335
BCS - CTFS -0.05 -0.07 -0.08 -0.08 -0.05
BCS - FSTC -0.02 -0.04 -0.06 -0.07 -0.05
BCS - DO -0.05 -0.08 -0.10 -0.11 -0.09
BCS - NRR 0.01 0.01 0.01 0.02 0.05
BCS - CEm 0.00 0.00 0.00 -0.01 0.00
BCS - CEd -0.04 -0.02 0.00 0.03 0.03
BCS - CSm 0.02 0.00 -0.01 -0.02 0.01
BCS - CSd -0.07 -0.03 0.01 0.08 0.11
As shown in Figures 5 and 6, the genetic correlations between BCS and fertility traits were
generally larger in mid and late lactation than in the immediate postpartum period. Correlations
between BCS in mid and late lactation with fertility traits could be more difficult to interpret as
the BCS recording occurs after the fertility event (either first service or conception), and the
causal relationship is not as clear as it is for BCS in early lactation. According to Reksen et al.
(2002), greater BCS from wk 13 to 15 after calving for first-parity Norwegian dairy cows was
associated with early onset of luteal function (defined as the appearance of a progesterone
concentration >5 ng/mL in the 24 d after calving), which would suggest better reproductive
performance. Berry et al. (2003b) reported stronger genetic correlations between BCS and CTFS
in mid and late lactation (-0.47 at around 250 DIM). Meanwhile, Veerkamp et al. (2001) showed
that BCS in early lactation was more strongly correlated with CTFS. Therefore, although BCS

Chapter 3
42
during the postpartum period reflects the extent of the negative energy balance of the cow, BCS in
mid and late lactation might indicate the ability of the cow to recover body reserves after this
critical period and could therefore be genetically related to reproductive performance. Berry et al.
(2003b) suggested that the maximum genetic gain in fertility from indirect selection on BCS
should be based on measurements taken in mid lactation when the genetic variance for BCS is
largest and the correlations between BCS and fertility traits are the strongest.
Overall, genetic correlations between fertility and BCS were generally stronger for Ayrshire than
for Holstein. Historically, the Canadian Ayrshire in North America has been highly selected for
dairy form and has a lower body weight than Holstein. This selection might have reinforced the
relationship between BCS and fertility.
Genetic correlations between BCS and calving traits
Although phenotypic and genetic correlations between BCS and fertility traits have often been
studied, few authors have investigated the association between BCS and calving traits. Moreover,
to our knowledge, genetic relationships between BCS and calving traits have not been reported.
Genetic correlations between BCS and calving traits are presented in Figure 7 for Ayrshire and in
Figure 8 for Holstein first-parity cows. Phenotypic correlations are presented in Table 10 for
Ayrshire and Table 11 for Holstein. For both breeds, the genetic correlations between BCS and
maternal CE (CEm) were mostly positive and ranged from 0.13 to 0.31 for Ayrshire and from
-0.02 to 0.21 for Holstein. The strongest correlations occurred at calving and decreased
throughout the lactation. Genetic correlations between BCS and direct CE (CEd) were mostly
negative for both Ayrshire and Holstein and were weaker with increasing DIM. The range was
-0.31 to -0.12 for Ayrshire and -0.31 to 0.05 for Holstein. For Ayrshire, genetic correlations
between BCS and maternal CS (CSm) as well as direct CS (CSd) were positive and were stronger
in early stages of lactation. For Holstein, the genetic relationship between BCS and CSm was
positive and varied slightly around 0.16. The genetic correlation between BCS and CSd was
generally positive and was strongest in mid lactation. Phenotypic correlations for calving traits
were close to zero for most of the traits in both breeds.
Because calving is the starting point of the lactation, correlations presented in Figures 7 and 8
indicate the causal relationship of dystocia and calf survival on BCS over the lactation. However,
considering that BCS at 5 DIM represented the BCS level at calving, these results indicated that a
genetically high BCS at calving 1) increased the chance of the cow to have dystocia (CEm); 2)
increased the chance of the calf to be born easily (CEd); 3) increased the chance of the cow to
have a calf that survived (CSm); and 4) increased the chance of the calf to survive (CSd) for
Ayrshire but not for Holstein (for which the genetic correlation between CSd and BCS was close
to zero and negative at 5 DIM). The positive correlation between BCS around calving and the
maternal effect for calving ease was in agreement with previous studies that investigated the
phenotypic effect of BCS on calving performance traits. Indeed, animals carrying excessive body
condition resulting in intrapelvic fat deposition and a reduction in pelvic area (especially for first-
lactation heifers) are more likely to develop dystocia (Gearhart et al., 1990). Chassagne et al.
(1999) indicated that having a BCS >4 (on a 5-point scale) before calving posed a significant risk
for dystocia.
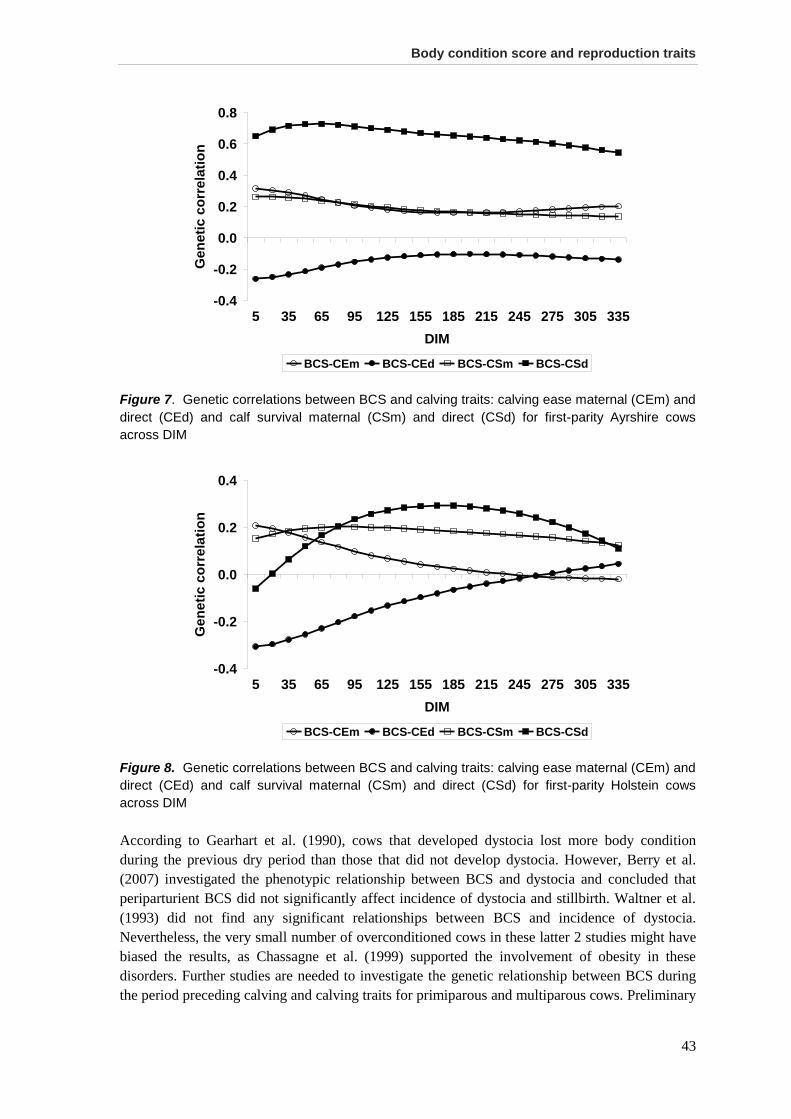
Body condition score and reproduction traits
43
Figure 7. Genetic correlations between BCS and calving traits: calving ease maternal (CEm) and
direct (CEd) and calf survival maternal (CSm) and direct (CSd) for first-parity Ayrshire cows
across DIM
Figure 8. Genetic correlations between BCS and calving traits: calving ease maternal (CEm) and
direct (CEd) and calf survival maternal (CSm) and direct (CSd) for first-parity Holstein cows
across DIM
According to Gearhart et al. (1990), cows that developed dystocia lost more body condition
during the previous dry period than those that did not develop dystocia. However, Berry et al.
(2007) investigated the phenotypic relationship between BCS and dystocia and concluded that
periparturient BCS did not significantly affect incidence of dystocia and stillbirth. Waltner et al.
(1993) did not find any significant relationships between BCS and incidence of dystocia.
Nevertheless, the very small number of overconditioned cows in these latter 2 studies might have
biased the results, as Chassagne et al. (1999) supported the involvement of obesity in these
disorders. Further studies are needed to investigate the genetic relationship between BCS during
the period preceding calving and calving traits for primiparous and multiparous cows. Preliminary
-0.4
-0.2
0.0
0.2
0.4
0.6
0.8
5 35 65 95 125 155 185 215 245 275 305 335
DIM
Ge
ne
tic
co
rre
lati
on
BCS-CEm BCS-CEd BCS-CSm BCS-CSd
-0.4
-0.2
0.0
0.2
0.4
5 35 65 95 125 155 185 215 245 275 305 335
DIM
Ge
ne
tic
co
rre
lati
on
BCS-CEm BCS-CEd BCS-CSm BCS-CSd

Chapter 3
44
results realized on Canadian Ayrshire cows indicated that the genetic correlation between BCS
during the 100 d before the second calving and CEm at second calving ranged between 0.51 at
100 d before calving and 0.28 at 5 DIM (Bastin et al., 2009). This result suggests that
overconditioning of dry cows is detrimental to calving ease.
Concerning the genetic relationship between BCS and calving traits during the following
lactation, the estimates presented in Figures 7 and 8 had the same sign (positive or negative) as for
BCS at calving (except for CSd for Holstein), but generally decreased with increasing DIM. The
positive genetic correlation between CEm and BCS during the following lactation was in contrast
with the phenotypic study of Berry et al. (2007), who reported that cows that experienced dystocia
lost more BCS to nadir, resulting in reduced BCS at nadir.
With the exception of the positive genetic correlation between BCS at calving and CEm, which
emphasized the phenotypic relationship between fat cows around calving and dystocia supported
by other researchers (Gearhart et al., 1990; Chassagne et al., 1999), genetic correlations between
calving traits and BCS during the subsequent lactation were favorable. This seems to indicate that
cows with a genetically high BCS 1) would have a greater chance to have a calf that survives
(CSm) and 2) would transmit genes to the calf that permit an easy birth (CEd) and increased
chance of survival (CSd). These last statements are supported by previous research that reported
that genetically low BCS was related to less robust cows presenting impaired fertility (Dechow et
al., 2001; Pryce et al., 2001) or health disorders such as mastitis (Lassen et al., 2003;
Neuenschwander et al., 2009).
Use of BCS in selection programs
Current breeding programs tend to combine both productive and functional aspects to select high-
producing and robust cows. In support of this global objective, the interest in functional traits
such as BCS is increasing, especially because of its relationship with economically important
traits that take an increasing weight in modern breeding objectives, such as fertility. Because
fertility traits are difficult to measure, are often not readily available, and have low heritabilities,
BCS can serve as predictor for estimating breeding values for fertility traits (Berry et al., 2003b).
Results of this research indicate that BCS may be a useful indicator trait in selection programs to
select for or maintain better reproductive performance; BCS could therefore be included in
indices for fertility or robustness but not in the breeding objective. This strategy has been
suggested in previous studies. Dechow et al. (2004) showed that genetic evaluations for BCS
could be used to increase the predicted transmitted ability for DO for bulls that have few
daughters with direct DO observations. Furthermore, Berry et al. (2003b) indicated that BCS
could be used as a predictor for EBV for fertility traits with accuracy no greater than the genetic
correlation between BCS and the trait of interest. This approach could be applicable in 2 cases:
when fertility data and BCS data can be simultaneously included in the selection index (Wall et
al., 2003) or when fertility data may only be available after the cow has had a subsequent calving.
As this study showed that heritabilities of reproduction traits were low, heritability for BCS was
moderate, and the correlations between BCS and reproduction traits were generally moderate,
developing selection tools based on BCS would allow indirect selection on reproduction traits.

Body condition score and reproduction traits
45
Conclusions
Except for CEm, favorable genetic correlations were found between BCS and fertility and calving
traits studied; correlations were stronger in mid lactation for fertility traits and in early lactation
for calving traits. Genetic correlation trends were the same for both breeds but were generally
greater for Ayrshire than for Holstein. This might reflect a different focus of selection between the
breeds. A genetically high BCS in early and mid lactation for primiparous cows was associated
with 1) shortened time during which the cow was not pregnant (CTFS, FSTC, DO), 2) greater
chance of the cow to be pregnant at first service (NRR), 3) greater chance of the cow to have had
dystocia (CEm), 4) greater chance for the calf to have survived (CSm), 5) greater chance for the
cow to have transmitted genes to the calf that would have permitted an easy birth (CEd) and a
greater chance of survival (CSd). Moreover, further studies are needed to investigate the
relationships between BCS at drying and the subsequent reproductive performances. Similar
studies on data from multiparous cows need to be conducted because conclusions from first parity
cannot be extended to later parities.
Acknowledgments
Authors are grateful to Valacta (Québec, Canada) for providing BCS data for this research.
Catherine Bastin acknowledges the supports of National Fund for Scientific Research (Brussels,
Belgium) and Wallonie-Bruxelles International (CGRI-DRI, WBI) through grants provided for
scientific stay at University of Guelph (Ontario, Canada). Additional financial support of the
Ministry of Agriculture of Walloon Region of Belgium (Service Public de Wallonie, Direction
générale opérationnelle “Agriculture, Ressources naturelles et Environnement” (DGA-RNE),
Direction du Développement et de la Vulgarisation) (Namur, Belgium) was also provided.
Nicolas Gengler who is a research associate of the National Fund for Scientific Research
(Brussels, Belgium) acknowledges his support. Additional support was provided through grants
2.4507.02F (2) and F.4552.05 of the National Fund for Scientific Research. The support of
DairyGen Council of Canadian Dairy Network and Natural Sciences and Engineering Research
Council of Canada is also acknowledged. Authors are grateful to Alain Gillon (Animal Science
Unit, Gembloux Agro-Bio Tech, University of Liège, Belgium) as well as to Jarmila Bohmanova
(Center for Genetic Improvement of Livestock, University of Guelph, Ontario, Canada) for their
assistance and to L. R. Schaeffer and J. Jamrozik (Center for Genetic Improvement of Livestock,
University of Guelph, Ontario, Canada) for their helpful comments and suggestions.
References
Bastin, C., S. Loker, N. Gengler, and F. Miglior. 2009. Estimates of genetic parameters among
body condition score and calving traits in first parity Canadian Ayrshire cows. Proc. 60th
Annual Meeting of the European Association for Animal Production, Barcelona, Spain.
Berry, D.P., F. Buckley, P. Dillon, R.D. Evans, M. Rath, and R.F. Veerkamp. 2003a. Genetic
relationships among body condition score, body weight, milk yield, and fertility in dairy
cows. J. Dairy Sci. 86:2193-2204.

Chapter 3
46
Berry, D.P., F. Buckley, P. Dillon, R.D. Evans, M. Rath, and R.F. Veerkamp. 2003b. Genetic
parameters for body condition score, body weight, milk yield, and fertility estimated using
random regression models. J. Dairy Sci. 86:3704-3717.
Berry, D.P., J.M. Lee, K.A. Macdonald, and J.R. Roche. 2007. Body condition score and body
weight effects on dystocia and stillbirths and consequent effects on postcalving performance.
J. Dairy Sci. 90:4201-4211.
Butler, W.R., and R. D. Smith. 1989. Interrelationships between energy balance and postpartum
reproductive function in dairy cattle. J. Dairy Sci. 72:767-783.
Chassagne, M.J., J. Barnouin, and J.P. Chaconac. 1999. Risk factors for stillbirth in Holstein
heifers under field conditions in France: A prospective survey. Theriogenology 51:1477-
1488.
Dechow, C.D., G.W. Rogers, and J.S. Clay. 2001. Heritabilities and correlations among body
condition scores, production traits, and reproductive performances. J. Dairy Sci. 84:266-275.
Dechow, C.D., G.W. Rogers, L. Klei, T.J. Lawlor, and P.M. VanRaden. 2004. Body condition
scores and dairy form evaluations as indicators of days open in US Holsteins. J. Dairy Sci.
87:3534-3541.
Dematawewa, C.M.B., and P.J. Berger. 1997. Effect of dystocia on yield, fertility, and cow losses
and an economic evaluation of dystocia scores for Holsteins. J. Dairy Sci. 80:754-761.
Edmonson, A.J., I.J. Lean, L.D. Weaver, T. Farver, and G. Webster. 1989. A body condition
scoring chart for Holstein dairy cows. J. Dairy Sci. 72:68-78.
Gallo, L., P. Carnier, M. Cassandro, R. dal Zotto, and G. Bittante. 2001. Test-day genetic analysis
of condition score and heart girth in Holstein Friesian cows. J. Dairy Sci. 84:2321-2326.
Gearhart, M.A., C.R. Curtis, H.N. Herb, R.D. Smith, C.J. Sniffen, L.E. Chase, and M.D. Cooper.
1990. Relationship of changes in condition score to cow health in Holsteins. J. Dairy Sci.
73:3132-3140.
INTERBULL. 2009. Description of national genetic evaluation systems. http://www-
interbull.slu.se/national_ges_info2/framesida-ges.htm Accessed on Sep. 4, 2009.
Jamrozik, J., J. Fatehi, G.J. Kistemaker, and L.R. Schaeffer. 2005. Estimates of genetic
parameters for Canadian Holstein female reproduction traits. J. Dairy Sci. 88:2199-2208.
Koenen, E.P.C., R.F. Veerkamp, P. Dobbelaar, and G. de Jong. 2001. Genetic analysis of body
condition score of lactating Dutch Holstein and Red-and-White heifers. J. Dairy Sci.
84:1265-1270.
Lassen, J., M. Hansen, M.K.S. Ørensen, G.P. Aamand, L.G. Christensen, and P. Madsen. 2003.
Genetic relationship between body condition score, dairy character, mastitis, and diseases
other than mastitis in first parity Danish Holstein cows. J. Dairy Sci. 86:3730-3735.
Lucy, M. C. 2001. ADSA Foundation Scholar Award: Reproductive loss in high-producing dairy
cattle: Where will it end? J. Dairy Sci. 84:1277-1293.
Meijering, A. 1984. Dystocia and stillbirth in cattle—A review of causes, relations and
implications. Livest. Prod. Sci. 11:143-177.
Misztal, I. 2007. BLUPF90 family of programs. University of Georgia.
http://nce.ads.uga.edu/~ignacy/numpub/blupf90/ Accessed on Dec. 2, 2007.
Neuenschwander, T.F.-O., F. Miglior, J. Jamrozik, and L.R. Schaeffer. 2009. Bivariate analyses
of body condition score and health traits in Canadian Holstein cattle using a random
regression model. Proc. 60th Annual Meeting of the European Association for Animal
Production, Barcelona, Spain.
Pryce, J E., M P. Coffey, and G. Simm. 2001. The relationship between body condition score and
reproductive performance. J. Dairy Sci. 88:2199-2208.
Pryce, J E., and B L. Harris. 2006. Genetics of body condition score in New Zealand dairy cows.
J. Dairy Sci. 89:4424-4432.
Reksen, O., Ø. Havrevoll, Y.T. Gröhn, T. Bolstad, A. Waldmann, and E. Ropstad. 2002.
Relationships among body condition score, milk constituents and postpartum luteal function
in Norwegian dairy cows. J. Dairy Sci. 85:1406-1415.

Body condition score and reproduction traits
47
van Straten, M., N.Y. Shpigel, and M. Friger. 2009. Associations among patterns in daily body
weight, body condition scoring, and reproductive performance in high producing dairy cows.
J. Dairy Sci. 92:4375-4385.
VanRaden, P.M., A.H. Sanders, M.E. Tooker, R.H. Miller, H.D. Norman, M.T. Kuhn, and G.R.
Wiggans. 2004. Development of a national genetic evaluation for cow fertility. J. Dairy Sci.
87:2285-2292.
Veerkamp, R.F., E.P.C. Koenen, and G. de Jong. 2001. Genetic correlations among body
condition score, yield, and fertility in first parity cows estimated by random regression
models. J. Dairy Sci. 84:2327-2335.
Wall, E., S. Brotherstone, J.A. Woolliams, G. Banos, and M.P. Coffey. 2003. Genetic evaluation
of fertility using direct and correlated traits. J. Dairy Sci. 86:4093-4102.
Waltner, S.S., J.P. McNamara, and J.K. Hillers. 1993. Relationships of body condition score to
production variables in high producing Holstein dairy cows. J. Dairy Sci. 76:3410-3419.

Chapter 4. Short communication
Genetic relationship between calving traits and
body condition score before and after calving
in Canadian Ayrshire second-parity cows
Outline
The previous Chapter assessed the genetic correlations over the lactation between BCS after calving and calving performance. However, it is commonly assumed that BCS before calving has an effect on subsequent calving performance. Therefore, the objective of this study was to investigate the genetic relationship between calving traits (including calving ease and calf survival) and BCS recorded from 100 days before calving to 335 days after calving. This study was conducted using data from Canadian Ayrshire second-parity cows.
From: Bastin, C., S. Loker, N. Gengler, A. Sewalem, and F. Miglior. 2010. Short
communication: Genetic relationship between calving traits and body condition score
before and after calving in Canadian Ayrshire second-parity cows. J. Dairy Sci. 93:
4398-4403.

Chapter 4
50
Abstract
The objective of this study was to investigate the genetic relationship between body condition
score (BCS) and calving traits (including calving ease and calf survival) for Ayrshire second-
parity cows in Canada. The use of random regression models allowed assessment of the change of
genetic correlation from 100 d before calving to 335 d after calving. Therefore, the influence of
BCS in the dry period on subsequent calving could be studied. Body condition scores were
collected by field staff several times over the lactation in 101 herds from Quebec and calving
records were extracted from the official database used for Canadian genetic evaluation of calving
ease. Daily heritability of BCS increased from 0.07 on d 100 before calving to 0.25 at 335 d in
milk. Genetic correlations between BCS at different stages ranged between 0.59 and 0.99 and
indicated that genetic components for BCS did not change much over lactation. With the
exception of the genetic correlation between BCS and direct calving ease, which was low and
negative, genetic correlations between BCS and calving traits were positive and moderate to high.
Correlations were the highest before calving and decreased toward the end of the ensuing
lactation. The correlation between BCS 10 d before calving and maternal calving ease was 0.32
and emphasized the relationship between fat cows before calving with dystocia. Standards errors
of the genetic correlations estimates were low. Genetic correlations between BCS and calf
survival were moderate to high and favorable. This indicates that cows with a genetically high
BCS across lactation would have a greater chance of producing a calf that survived (maternal calf
survival) and that they would transmit genes that allow the calf to survive (direct calf survival).
Key words: body condition score, calving ease, stillbirth, genetic correlation

Calving traits and body condition score
51
It is commonly assumed that overconditioned cows before calving are at a greater risk for calving
difficulty. Animals carrying excessive body condition resulting in intrapelvic fat deposition and a
reduction in pelvic area (especially for first-lactation heifers) are more likely to develop dystocia.
It has also been indicated that a BCS higher than 4 (on a 5-point scale) before calving posed a
significant risk for dystocia (Chassagne et al., 1999). However, previous research studying the
relationship between calving traits and BCS has investigated only the phenotypic link and has
been generally based on a limited number of herds. Furthermore, the use of more data and random
regression models could allow the estimation of phenotypic and genetic correlations across both
the dry period and lactation between BCS as a longitudinal trait and calving traits that are
measured as single lactation records. The objective of this study was to estimate the genetic
correlation between calving traits and BCS recorded during the period preceding the second
calving and during the following lactation.
Calving traits included calving ease (CE) and calf survival (CS). Calving ease was coded in 4
classes from 1 (unassisted calving) to 4 (surgery required). Calf survival was 0 if the calf died
within 24 h from birth and 1 otherwise. The study was focused on second-parity Canadian
Ayrshire cows. This work is the continuation of research by Bastin et al. (2010) investigating the
genetic correlation between BCS and reproduction traits (including both female fertility and
calving performance) in Canadian Ayrshire and Holstein first-parity cows. Aside from extending
the research to a later parity, the originality of the current paper is the inclusion of BCS data
recorded during the 100 d preceding calving.
Body condition score data, on a scale from 1 (thin) to 5 (fat) at increments of 0.25 (Edmonson et
al., 1989), were collected by Valacta (Sainte-Anne-de-Bellevue, Québec, Canada) field staff
between January 2001 and September 2008 in herds from Québec. Several edits described by
Bastin et al. (2010) were performed to obtain a data set including records from herds that recorded
BCS regularly and in a reliable way. Body condition score data were limited to records taken
from 100 d before calving to 335 d after calving for second-parity cows. Calving ease and CS
records used for the Canadian genetic evaluation were then extracted from the official database of
Canadian Dairy Network (Guelph, Ontario, Canada). Records were kept for herds with at least 1
cow with both BCS records and 1 calving trait records. Only cows with at least 2 BCS records, 1
before 60 DIM and 1 after 60 DIM, were used. Moreover, at least 2 observations per class of each
effect (except animal effect) were required. Descriptive statistics of the edited data set are
presented in Table 12.
Table 12. Descriptive statistics of data for the analysis of BCS, calving ease (CE) coded from 1
(unassisted calving) to 4 (surgery), and calf survival (CS) coded as 0 if the calf died within 24 h
from birth and 1 otherwise
Item Model
BCS - CE BCS - CS
No. of BCS records 8,032 8,032
No. of calving records 10,637 10,432
Mean BCS ± SD 2.90 ± 0.49 2.90 ± 0.49
Mean calving trait ± SD 1.23 ± 0.49 0.94 ± 0.23
No. of cows with records 12,632 12,427
No. of cows with records for both traits 1,706 1,640
No. of animals in the pedigree 32,400 31,993

Chapter 4
52
After edits the data set contained 10,637 CE records, 10,432 CS records, and 8,032 BCS records
of which 1,315 were taken before calving. Cows were from 101 herds. On average, about 4 BCS
records were available per cow. Finally, pedigree data were extracted from the database used for
official Canadian genetic evaluations and were limited to animals born after 1985.
Two 2-trait (BCS with either CE or CS) analyses were performed. Data used for the BCS-CE
analysis included 12,632 cows of which 1,706 had records on both traits. Data used in the BCS-
CS analysis included 12,427 cows of which 1,640 had both BCS and CS records. The model used
in both analyses was the same as the one described by Bastin et al. (2010). The model was
designed to show the change of the correlation between BCS and calving traits from the dry
period (100 d before calving) to the end of the following lactation (335 DIM). The model
included 2 fixed effects for calving traits: class of 2 yr of dam birth by season of dam birth
interaction, and age at calving by season of calving by sex of calf interaction. Similarly, the fixed
effects of 2 yr of calving by season of calving interaction and age at calving by class of 14 DIM
interaction were defined for BCS. Four groups for age at calving were defined as <38 mo, from
38 to 40 mo, from 41 to 43 mo, and >44 mo. Four seasons of birth or calving were defined as
December to February, March to May, June to August, and September to November. An effect
accounting for BCS assessors was not included in the model because this information was not
available. However, the same scoring method was used by all assessors and standardization took
place within assessor to limit bias and errors. Random effects for CE and CS were herd by class
of 2 yr of birth interaction, maternal (cow) and direct (calf) environmental effect linked with BCS,
and maternal and direct genetic additive effect. Random regression effects for BCS were herd by
class of 2 yr of calving interaction, permanent environmental effect, and genetic additive effect.
Including an environmental covariance between calving traits and BCS in the model allowed for
the nongenetic link between BCS and those traits to be taken into account across the lactation and
avoided an overestimation of the genetic correlation between traits. The covariance structure for
genetic and environmental effects was described by Bastin et al. (2010); it combined the variance
for the maternal effect of calving trait, the variance for the direct effect of calving trait, the
(co)variances for random regression components for BCS, and the covariance between maternal
or direct effect of calving trait and random regression components for BCS. Covariance between
maternal and direct genetic effects was set to zero as in the official genetic evaluation for calving
traits run by the Canadian Dairy Network. Random effects were assumed to be normally
distributed and residual variances were assumed to be independent and constant over the lactation.
Regression curves for BCS were modeled using Legendre polynomials of order 2 (quadratic)
defined between 100 d before calving and 335 DIM; the covariates associated with DIM (ztm)
were zt0=1.0, zt1=3.00.5
x, and zt2=5.00.5
(1.5x2-0.5), where ⁄
with DIM standardized from -1 to 1.
(Co)variance estimation was performed using expectation maximization REML (Misztal, 2007)
on the complete edited data set. Standard errors of variance components were estimated by
running average information REML for 1 round using final estimates given by expectation
maximization REML as priors. Heritabilities and correlations were computed as described by
Bastin et al. (2010). Standard errors of heritability and correlation estimates were calculated using
the method of Fischer et al. (2004) based on variance estimates from the average information
inverse matrix of the average information REML output file. Because variances and standard
errors for BCS were similar in both analyses, estimates presented here are those obtained with the
2-trait analysis of BCS and CE.

Calving traits and body condition score
53
The expected response ( xR ) to selection on a calving trait was computed using the following
formula (Falconer and Mackay, 1996):
xxx ihR σ2= ,
where xR is the expected response to selection for a calving trait [maternal CE (CEm), direct CE
(CEd), maternal CS (CSm), and direct CS (CSd)]; i is the selection intensity; 2
xh is the
heritability of the calving trait of interest; and xσ is the phenotypic standard deviation of the
calving trait of interest. Because the desirable value for CE is low, the expected response to
selection for CEm and CEd was negative. The correlated response ( xCR ) in calving traits as a
result of direct selection on BCS 30 d before calving was estimated using the following formula
(Falconer and Mackay, 1996):
xgxbcsbcsxx rhihCR σ= ,
where xCR is the correlated response to selection for BCS in a calving trait (CEm, CEd, CSm,
and CSd); i is the selection intensity; xh is the square root of the heritability of the calving trait
of interest; bcsh is the square root of the heritability of BCS; gxbcsr is the genetic correlation
between the BCS and the calving trait of interest; and xσ is the phenotypic standard deviation of
the calving trait.
Figure 9 presents daily means of BCS from 100 d before calving to 335 d after calving. It is
interesting to note that BCS increased from 100 d before calving to calving, especially during the
dry period (considered to start 60 d before calving), whereas it is generally recommended to
stabilize body condition during that period. Roche et al. (2009) indicated that first-parity animals
generally failed to regain BCS postnadir as effectively as their multiparous counterparts.
Therefore, the BCS increase during the period preceding the second calving might be explained
by the fact that the first-parity cows are managed to reach an optimal BCS at their second calving
(3.5 according to Roche et al., 2009). Body condition score loss postcalving to nadir was 0.52
BCS units; BCS nadir occurred at 69 DIM. Afterward, BCS increased again until 335 DIM and
reached the same level as it was at the previous calving. Sixteen percent of BCS records were
collected during the 100 d before calving. Body condition score was recorded more frequently
during the first 100 DIM (37% of records) because it may be more useful for management
purposes.
Heritability estimates for BCS across time are presented in Figure 10. The 99.7% confidence
interval (±3 SE) of these estimates is also presented in Figure 10 and indicated that the SE were
low across DIM. Furthermore, SE were higher at the end of the lactation, which is probably
attributable to the nature of Legendre polynomials. Daily heritability increased constantly across
time from 0.07 at 100 d before calving to 0.25 at 335 DIM; the average daily heritability
throughout the period considered was 0.16. These estimates are in the same range as values
reported by Dechow et al. (2001) for BCS recorded by producers and consultants on second-
parity Holstein cows, using a multivariate animal model (0.07-0.20). Berry et al. (2003) presented
higher estimates ranging from 0.39 to 0.51 using a random regression model on multilactation
BCS data. Higher heritabilities in Berry et al. (2003) may be attributable to the fact that only a
few trained people undertook the BCS assessments. Heritabilities for calving traits and their SE
were low: 0.0202 ± 0.0003 for CEm, 0.0262 ±0.0004 for CEd, 0.0044 ± 0.00005 for CSm, and
0.0111 ± 0.0001 for CSd. Those values were lower than the results of Jamrozik et al. (2005) for
Canadian Holstein cows, especially for CEm and CEd. Differences in the models used could

Chapter 4
54
explain the differences observed as well as differences in the breed studied (Ayrshire vs.
Holstein).
Figure 9. Average daily BCS for Ayrshire cows from 100 d before second calving to 335 d after
calving
Figure 10. Daily heritabilities and their 99.7% confidence interval (±3 SE) for BCS in Ayrshire
cows from 100 d before second calving to 335 d after calving
Genetic correlations between BCS at different times before and after calving are shown in Table
13. Estimates ranged between 0.62 and 0.99 and decreased with increasing number of days. The
genetic correlation between BCS at calving and BCS at -50 and 50 DIM was 0.96 and 0.98,
respectively.
0
0.5
1
1.5
2
2.5
3
3.5
4
4.5
5
-100 -50 0 50 100 150 200 250 300
No. of days before and after calving
BC
SCALVING
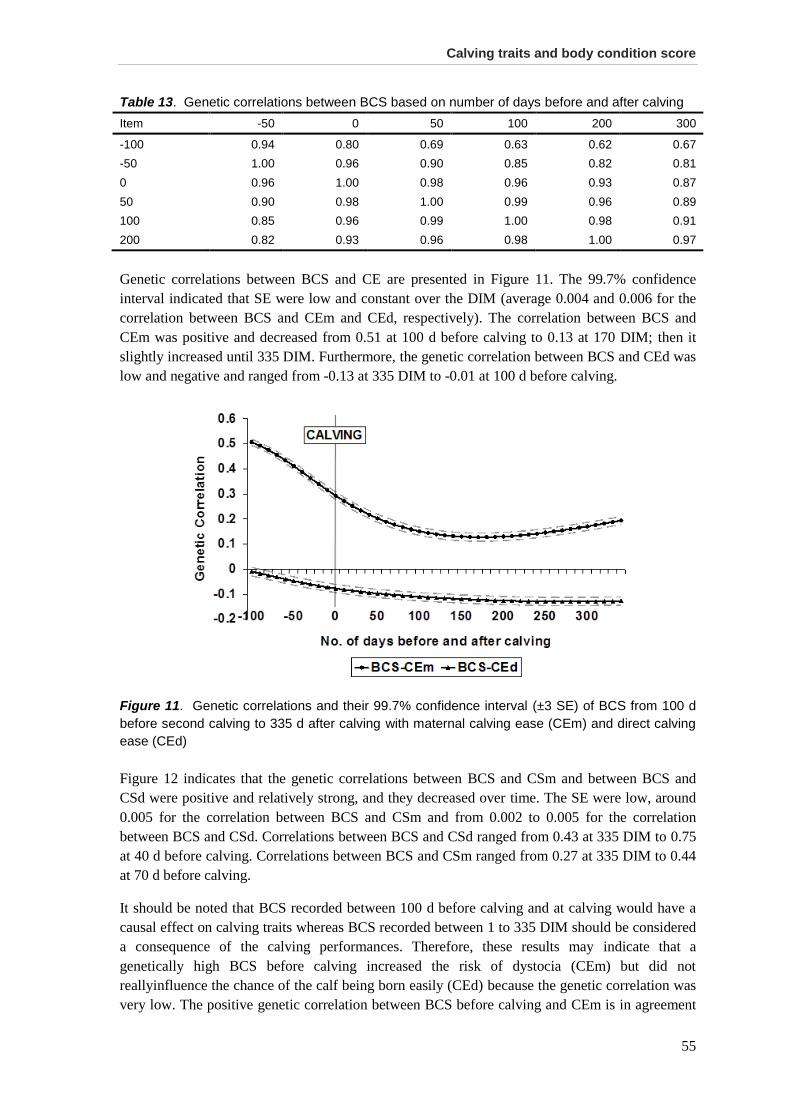
Calving traits and body condition score
55
Table 13. Genetic correlations between BCS based on number of days before and after calving
Item -50 0 50 100 200 300
-100 0.94 0.80 0.69 0.63 0.62 0.67
-50 1.00 0.96 0.90 0.85 0.82 0.81
0 0.96 1.00 0.98 0.96 0.93 0.87
50 0.90 0.98 1.00 0.99 0.96 0.89
100 0.85 0.96 0.99 1.00 0.98 0.91
200 0.82 0.93 0.96 0.98 1.00 0.97
Genetic correlations between BCS and CE are presented in Figure 11. The 99.7% confidence
interval indicated that SE were low and constant over the DIM (average 0.004 and 0.006 for the
correlation between BCS and CEm and CEd, respectively). The correlation between BCS and
CEm was positive and decreased from 0.51 at 100 d before calving to 0.13 at 170 DIM; then it
slightly increased until 335 DIM. Furthermore, the genetic correlation between BCS and CEd was
low and negative and ranged from -0.13 at 335 DIM to -0.01 at 100 d before calving.
Figure 11. Genetic correlations and their 99.7% confidence interval (±3 SE) of BCS from 100 d
before second calving to 335 d after calving with maternal calving ease (CEm) and direct calving
ease (CEd)
Figure 12 indicates that the genetic correlations between BCS and CSm and between BCS and
CSd were positive and relatively strong, and they decreased over time. The SE were low, around
0.005 for the correlation between BCS and CSm and from 0.002 to 0.005 for the correlation
between BCS and CSd. Correlations between BCS and CSd ranged from 0.43 at 335 DIM to 0.75
at 40 d before calving. Correlations between BCS and CSm ranged from 0.27 at 335 DIM to 0.44
at 70 d before calving.
It should be noted that BCS recorded between 100 d before calving and at calving would have a
causal effect on calving traits whereas BCS recorded between 1 to 335 DIM should be considered
a consequence of the calving performances. Therefore, these results may indicate that a
genetically high BCS before calving increased the risk of dystocia (CEm) but did not
reallyinfluence the chance of the calf being born easily (CEd) because the genetic correlation was
very low. The positive genetic correlation between BCS before calving and CEm is in agreement

Chapter 4
56
with the common thinking that overconditioned cows before calving are at a greater risk for
calving difficulty. According to Gearhart et al. (1990), cows that developed dystocia lost more
body condition during the dry period than those that did not develop dystocia. Indeed, the feeding
management aimed at correcting BCS of cows during the dry period and, therefore, cows losing
the greatest amount of body condition before calving may have been the most overconditioned at
drying off (Gearhart et al., 1990).
Figure 12. Genetic correlations and their 99.7% confidence interval (±3 SE) of BCS from 100 d
before second calving to 335 d after calving with maternal calf survival (CSm) and direct calf
survival (CSd)
Furthermore, a genetically high precalving BCS increased both the chance of the cow having a
calf that survived (CSm) and the chance of the calf itself surviving (CSd). These results were in
opposition to the results reported by Chassagne et al. (1999), who indicated that overconditioned
cows would present greater risk for stillbirth than cows with an optimal BCS at calving.
Concerning the genetic relationship between calving traits and BCS during the ensuing lactation,
estimates had the same sign (positive or negative) as for BCS before calving but decreased with
increasing DIM, with the exception of the correlation between BCS and CEd. These results
indicate that a cow that has calved with difficulty (CEm) will tend to have a higher BCS during
the ensuing lactation; however, the genetic correlation was low to moderate (from 0.13 to 0.27).
This was in contrast with the phenotypic study of Berry et al. (2007), who reported that cows that
experienced dystocia lost more BCS to nadir, resulting in reduced BCS at nadir. Furthermore,
results of the present study indicated that the relationship between postcalving BCS and CEd was
poor and that a cow that had a calf that survived will have a genetically high BCS during the
following lactation. However, Berry et al. (2007) indicated that incidence of stillbirths did not
affect BCS in early lactation.
Some of the above results were in contrast with the literature investigating the phenotypic
relationship between pre- and postcalving BCS and the calving traits. This might be explained by
the fact that the genetic effect reflects only partly the process that regulates body condition. Roche
et al. (2009) reported that lipolysis is primarily regulated genetically whereas lipogenesis is

Calving traits and body condition score
57
environmentally controlled. Therefore, a genetically high BCS would reflect the ability of the cow
to limit the body fat mobilization rather than its ability to store fat.
Table 14 presents the expected response to selection, under the hypothesis that selection intensity
is equal to 1, for CEm, CEd, CSm, and CSd as well as the correlated response in the same traits as
a result of selection for higher BCS 30 d before calving. First, it should be noted that to achieve
favorable response of CEm, CEd, CSm, and CSd when selecting for BCS before calving, BCS has
to be selected for lower values to improve CEm but for higher values to improve all other calving
traits. Therefore, the results indicated that using only BCS (and selecting for higher BCS) for
improving CE is rather problematic because it would generate a nondesirable response to
selection for CEm and a low response to selection for CEd. However, selecting for higher BCS to
improve CS would lead to a clearly higher (183 and 203%) response to selection than selecting
directly on CS. Given these results, efficient use of BCS to select for improved CE and CS would
require the use of adapted selection indices involving all traits to counterbalance negative effects
on CEm of selection for higher BCS before calving.
Table 14 Expected direct response to selection (R) on calving traits and correlated response
(CR) in calving traits as a result of selection for higher BCS at 30 d before calving1
Trait2 R CR CR/R (in %)
CEm -0.0098 0.0073 75
CEd -0.0127 -0.0014 11
CSm 0.0010 0.0018 183
CSd 0.0025 0.0052 203 1Selection intensity equals 1. 2CEm = maternal calving ease; CEd = direct calving ease; CSm = maternal calf survival; CSd = direct calf survival.
With the exception of the positive genetic correlation between CEm and BCS before calving,
which emphasized the phenotypic relationship between fat cows around calving and dystocia,
genetic correlations between BCS and calving traits were favorable. This seems to indicate that
cows with a genetically high BCS would have a greater chance to have a calf that survives while
transmitting to the calf genes that would increase chance of survival (CSd). These last statements
are in line with previous research that reported that genetically low BCS were related to less
robust cows presenting impaired fertility (Dechow et al., 2001; Berry et al., 2003; Bastin et al.,
2010) or health disorders such as mastitis (Neuenschwander et al., 2009). Finally, results of this
research indicated that BCS could be used as an indicator trait to select for maternal calving ease
and calf survival and could therefore be included in selection indices.
Acknowledgments
Authors are grateful to Valacta (Sainte-Anne-de-Bellevue, Québec, Canada) for providing BCS
data for this research. Catherine Bastin acknowledges the support of National Fund for Scientific
Research (Brussels, Belgium) and Wallonie-Bruxelles International (CGRI-DRI, WBI, Brussels,
Belgium) through grants provided for scientific stay at University of Guelph (Ontario, Canada).
Additional financial support of the Ministry of Agriculture of Walloon Region of Belgium
[Service Public de Wallonie, Direction générale opérationnelle “Agriculture, Ressources
naturelles et Environnement” (DGA-RNE), Direction du Développement et de la Vulgarisation,
Namur, Belgium] was also provided. Nicolas Gengler, who is Research Associate of the National

Chapter 4
58
Fund for Scientific Research (Brussels, Belgium), acknowledges this support. Additional support
was provided through grants 2.4507.02F (2) and F.4552.05 of the National Fund for Scientific
Research. The support of DairyGen council of Canadian Dairy Network (Guelph, Ontario,
Canada) and Natural Sciences and Engineering Research Council of Canada (Ottawa, Ontario,
Canada) is also acknowledged. Authors are grateful to Alain Gillon (Animal Science Unit,
Gembloux Agro-Bio Tech, University of Liège, Gembloux, Belgium) as well as Jarmila
Bohmanova (Center for Genetic Improvement of Livestock, University of Guelph) for their
assistance and to Larry R. Schaeffer and Janusz Jamrozik (Center for Genetic Improvement of
Livestock, University of Guelph) for their helpful comments and suggestions.
References
Bastin, C., S. Loker, N. Gengler, A. Sewalem, and F. Miglior. 2010. Genetic relationships
between body condition scores and reproduction traits in Canadian Holstein and Ayrshire
first parity cows. J. Dairy Sci. 93:2215-2228.
Berry, D.P., F. Buckley, P. Dillon, R.D. Evans, M. Rath, and R.F. Veerkamp. 2003. Genetic
parameters for body condition score, body weight, milk yield, and fertility estimated using
random regression models. J. Dairy Sci. 86:3704-3717.
Berry, D.P., J.M. Lee, K.A. Macdonald, and J.R. Roche. 2007. Body condition score and body
weight effects on dystocia and stillbirths and consequent effect on postcalving performance.
J. Dairy Sci. 90:4201-4211.
Chassagne, M., J. Barnouin, and J.P. Chaconac. 1999. Risk factors for stillbirth in Holstein heifers
under field conditions in France: A prospective survey. Theriogenology 51:1477-1488.
Dechow, C. D., G.W. Rogers, and J.S. Clay. 2001. Heritabilities and correlations among body
condition scores, production traits, and reproductive performances. J. Dairy Sci. 84:266-275.
Edmonson, A.J., I.J. Lean, L.D. Weaver, T. Farver, and G. Webster. 1989. A body condition
scoring chart for Holstein dairy cows. J. Dairy Sci. 72:68-78.
Falconer, D.S., and T.F.C. Mackay. 1996. Introduction to Quantitative Genetics. 4th ed.
Longman, London, UK.
Fischer, T.M., A.R. Gilmour, and H.J.J. van der Werf. 2004. Computing approximate standard
errors for genetic parameters derived from random regression models fitted by average
information REML. Genet. Sel. Evol. 36:363-369.
Gearhart, M.A., C.R. Curtis, H.N. Herb, R.D. Smith, C.J. Sniffen, L.E. Chase, and M.D. Cooper.
1990. Relationship of changes in condition score to cow health in Holsteins. J. Dairy Sci.
73:3132-3140.
Jamrozik, J., J. Fatehi, G.J. Kistemaker, and L.R. Schaeffer. 2005. Estimates of genetic
parameters for Canadian Holstein female reproduction traits. J. Dairy Sci. 88:2199-2208.
Misztal, I. 2007. BLUPF90 family of programs. http://nce.ads.uga.edu/~ignacy/numpub/blupf90/
Accessed on Jun. 2, 2009.
Neuenschwander, T.F.-O., F. Miglior, J. Jamrozik, and L.R. Schaeffer. 2009. Bivariate analyses
of body condition score and health traits in Canadian Holstein cattle using a random
regression model. Page 104 in Proc. 60th Annual Meeting European Association for Animal
Production, Barcelona, Spain. Wageningen Academic Publishers, Wageningen, the
Netherlands.
Roche, J.R., N.C. Friggens, J.C. Kay, M.W. Fisher, K.J. Stafford, and D.P. Berry. 2009. Invited
review: Body condition score and its association with dairy cow productivity, health, and
welfare. J. Dairy Sci. 92:5769-5801.

Chapter 5. Genetic evaluation for body condition
score in the Walloon Region of Belgium
Outline
Results presented in Chapters 3 and 4 provided evidences of the genetic association between BCS and reproduction of dairy cattle and implied the opportunity of using BCS in a breeding program as an indicator trait to select for better reproductive performances. Therefore, the objective of the present Chapter was to investigate the development of a genetic evaluation for BCS. This study was undertaken on data from Walloon Holstein cows in parity 1 to 3. First, genetic parameters for BCS were estimated. Then, a method for expressing BCS breeding values as an indicator optimizing the genetic gain on fertility was explored.
From: Bastin, C., A. Gillon, X. Massart, H. Soyeurt, S. Vanderick, C. Bertozzi, and N.
Gengler. 2010. Genetic evaluation for BCS in the Walloon Region of Belgium.
INTERBULL Bull. 42:85-90.

Chapter 5
60
Abstract
The objectives of this study were 1) the development of the genetic evaluation for body condition
score (BCS) in the Walloon Region of Belgium using BCS data from the first three lactations, and
2) the development a method for expressing BCS breeding values as an indicator optimizing the
genetic gain on fertility. Daily heritabilities for BCS ranged between 0.08 and 0.31 according to
the number and the stage of lactation. Seven different options for expressing BCS breeding values
were compared. Results indicated that BCS could be used as an indicator trait for improving
fertility. Selecting for higher minimum genetic BCS averaged among the first 3 lactations would
lead to a similar response to selection than selecting directly on PR. However negative impacts of
selecting BCS on economically important traits other than fertility have also to be considered.

Genetic evaluation for body condition score
61
Introduction
Body Condition Score (BCS) assesses the stored energy reserves of the dairy cow and is therefore
commonly used as an indicator of the extent and the duration of the postpartum negative energy
balance (Roche et al., 2009). A regular body condition scoring in a dairy herd is a valuable
decision making tool to fine-tune feeding and manage fertility. Moreover the inclusion of BCS in
selection programs has to be considered because of its relationships with economically important
traits, especially fertility. However, target values for BCS vary across the lactation contrary to the
most of the other traits such as milk yield for which a high value is desired. Currently, expression
of breeding values for BCS is generally done as an average of the genetic effect for an animal
across the entire lactation and does not take into account this specificity.
Bastin et al. (2007) reported the work done for the development of a genetic evaluation for BCS
in the Walloon Region of Belgium using a two-trait (BCS and angularity) random regression
model for first lactation. They indicated the interest of including angularity records to estimate
BCS sire breeding values and improve their reliabilities. Based on this study, the Walloon Region
of Belgium has been taking part to the international genetic evaluation for BCS performed by
INTERBULL since September 2008.
This study had two main objectives: 1) extend the model currently used for the genetic evaluation
to BCS data from the first three lactations, and 2) develop a method for expressing BCS breeding
values as an indicator optimizing the genetic gain on fertility.
Materials and methods
Data
Since April 2006, BCS has been monthly collected by milk recording agents (Walloon Breeding
Association, Ciney, Belgium) in selected herds of the Walloon Region of Belgium. Holstein cows
are given a BCS based on a nine-point scale (with unit increments) following the decision chart
presented by Bastin et al. (2007). BCS were required to have been recorded between 5 and 365
days in milk (DIM) on lactating cows in parity 1 to 3. On average, 6 BCS records were available
per cow per lactation. Angularity records were collected between 5 and 365 DIM for cows in
parity 1. The final dataset included 30,081 BCS records in parity 1, 22,545 BCS records in parity
2, 15,102 BCS records in parity 3, 86,351 angularity records, 1364 herds, and 89,123 cows with
records for at least one trait. A number of 7,213 cows had BCS records and 3,303 cows had both
BCS and angularity records; and 521 cows had more than 1 angularity record for the first
lactation.
For variance components estimation, cows were required to be born after 1996 and to come from
one of the 86 herds including at least one cow with both BCS and angularity records. The
variance components estimation dataset included 27,454 BCS records in parity 1, 20,576 BCS
records in parity 2, 13,767 BCS records in parity 3, 7,088 angularity records, 9,842 cows with
records for at least one trait, 6,553 cows with BCS records, and 3,235 cows with both BCS and
angularity records. Pedigree data were extracted from the database used of the official Walloon
genetic evaluations and were limited to animals born after 1985 for the variance components
estimation.
Chapter 5
62
(Co)variance estimation and model
Based on the model presented by Bastin et al. (2007), the following four-trait model was used:
eZaZpWwQXβy
where:
y was the vector of observations (BCS in lactation 1 (BCS1), BCS in lactation 2 (BCS2),
BCS in lactation 3 (BCS3), and angularity in lactation 1),
β was the vector of the following fixed effects: 1) class of 14 DIM x age at calving group,
2) herd x scoring date for BCS, and herd x date scored x classifier x classification system
for angularity,
w was the vector of BCS recorder random regression coefficients for BCS or the vector of
classifier x classification system random regression coefficients for angularity,
p was the vector of permanent environmental random regression coefficients,
a was the vector of additive genetic random regression coefficients,
e was the vector of random residuals,
X, W, Z were incidence matrices,
Q was the covariate matrix of second-order Legendre polynomials.
Groups of age at calving were defined within lactation. Random effects were assumed to be
normally distributed and residual variances were assumed to be independent and constant over the
lactation. Variance components estimation was performed using EM-REML (Misztal, 2009). The
initial variance matrices were those presented by Bastin et al. (2007). Daily heritabilities and daily
genetic correlations among the 4 traits were calculated.
Breeding values definition
The model was solved using the final dataset and 9 BCS genetic solutions (3 Legendre
coefficients for BCS1, BCS2, and BCS3) were obtained for each animal in the pedigree. These
solutions were named BCSiLj and represented the genetic solution of the jth Legendre polynomial
coefficient for BCS in lactation i. They were then combined to generate daily genetic values
(BCSik, with k=1 to 305) for each animal in lactation 1 to 3 for every DIM between 1 and 305.
Based on these genetic solutions, 7 different options for expressing BCS breeding values were
investigated and then compared. Reliabilities were estimated based on INTERBULL EDC
computation. All options were defined as a high value is desirable to improve fertility.
The first option tested (EBV1) previously used by Bastin et al. (2007) was basically the genetic
solution for the constant Legendre coefficient in lactation 1: BCS1L0.
The second option (EBV2) was defined as the average BCS over DIM 1 to 305 and across first 3
lactations; EBV2 was calculated using the following formula:
3
∑∑3,1 3,1
2 == =i j
LjLjBCSiq
EBV
where qLi was averaged jth Legendre polynomial coefficient over DIM 1 to 305.

Genetic evaluation for body condition score
63
Option 3 (EBV3) was defined as the minimum genetic BCS averaged among the first 3 lactations:
3
∑3,1
min
3 ==i
BCSi
EBV
where BCSimin was the lowest daily genetic solution between DIM 1 and 200 for BCS in lactation
i; BCSimin was defined for each animal.
Option 4 (EBV4) was defined as the genetic BCS postpartum loss averaged among the first 3
lactations:
3
-∑3,1
min
4 ==i
cal BCSiBCSi
EBV
where BCSical was the genetic solutions for DIM 1 for BCS in lactation i.
Option 5 (EBV5) took into account both the genetic BCS postpartum loss and the time when it
occurred:
( )
3
- ∑3,1
minmin
5 ==i
cal BCSiBCSidi
EBV
where dimin was the dim when occurred the lowest daily genetic solutions for BCS in lactation i;
dimin was defined for each animal.
Option 6 (EBV6) was defined as the genetic BCS recovering from its lowest value to its value at
300 DIM:
3
- ∑3,1
min300
6 ==i
BCSiBCSi
EBV .
Option 7 (EBV7) combined both the genetic BCS recovering and the time needed for starting this
recovering:
( )
3
- ∑3,1
min300min
7 ==i
BCSiBCSidi
EBV .
Afterwards EBV1 to EBV7 were standardized using as the genetic reference base the 1,272 cows
with BCS records and born in 2005. Heritabilities were estimated for each option; variances for
BCS1min, BCS2min, and BCS3min were assumed to be variances estimated for the averaged d1min,
d2min, and d3min, respectively. Averaged d1min, d2min, and d3min were estimated on cows with BCS
records.
The correlated response to selection on pregnancy rate (PR) using the different options were
calculated and compared to the response to selection expected while selecting directly on PR. The
expected response RPR to selection on pregnancy rate was computed using the following formula
(Falconer and Mackay, 1996):
PRPRPR ihR σ2=
where i was the selection intensity (set to 1); 2
PRh was the heritability of PR and was 0.039; and
PR was the phenotypic standard deviation of PR and was 25.26.

Chapter 5
64
The correlated response (CRPR) in PR as a result of selection on BCS was estimated using the
following formula (Falconer and Mackay, 1996):
PRPRxEBVEBVPRPR kkrhihCR σ=
where PRh was the square root of the heritability of PR; kEBVh was the square root of the
heritability of EBVk; kPRxEBVr was the correlation between the PR breeding values and EBVk.
Responses to selection were estimated for the 13,376 Walloon cows born after 2004 and
presenting reliability for V€G ≥ 0.30 and reliability for BCS ≥ 0.30.
Correlations between the different options and the breeding values of the economically important
traits were estimated. The economically important traits were: milk, fat and protein yields;
somatic cell count (SCS); longevity; and the Walloon economic indexes: V€L (partial economic
index milk), V€T (partial economic index type), V€F (partial economic index functionality), and
V€G (global economic index which is the sum of V€L, V€T, and V€F).
Finally Spearman and Pearson correlations among EBV1 to EBV7 were estimated for the 769
bulls with BCS reliability ≥ 0.30.
Results and Discussion
Heritabilities and genetic correlations
Daily heritabilities for BCS ranged between 0.08 and 0.31 according to the number and the stage
of lactation (Figure 13). BCS heritability increased with the number of lactation. They increased
from 5 to 200 DIM and then decreased until 305 DIM. These heritabilities were lower than
estimates obtained by Berry et al. (2003) on a similar data set (repeated BCS records collected by
trained staff) with a random regression animal model; their estimates ranged from 0.39 to 0.51.
Daily heritabilities for angularity were between 0.13 and 0.18.
Figure 13. Daily heritabilities of angularity and BCS across days in milk

Genetic evaluation for body condition score
65
Genetic correlations among BCS1, BCS2 and BCS3 ranged between 0.64 and 0.88 (Figure 14). It
indicated that BCS over the parities is not exactly the same trait. Genetic correlations between
BCS and angularity were negative and ranged between -0.81 and -0.46. Estimates for parity 1
were similar to previous results (Bastin et al., 2007).
Figure 14. Daily genetic correlations among BCS1, BCS2, BCS3, and angularity across days in
milk
Comparison among EBV1 to EBV7
Table 15 shows heritabilities of EBV1 to EBV7. Estimates were low to moderate: EBV4 to EBV7
showed the lowest heritability estimates while EBV2 and EBV3 presented the highest
heritabilities.
Table 15. Heritabilities of EBV1 to EBV7 and correlated response to selection on PR while
selecting on EBV1 to EBV7
Heritabilities CRPR (%)
EBV1 0.185 0.638
EBV2 0.375 0.929
EBV3 0.416 0.981
EBV4 0.074 0.391
EBV5 0.076 0.376
EBV6 0.030 0.180
EBV7 0.030 0.226
Previous studies indicated that BCS is not only genetically related to fertility but also to health
and production (Dechow et al., 2001; Pryce et al., 2001; Berry et al., 2003; Lassen et al., 2003).
Therefore EBV1 to EBV7 were also compared based on their correlations with the breeding values
of economically important traits (Table 16). Results indicated that, except for EBV6 and EBV7,
correlations with breeding values of economically important traits other than fertility were
generally negative and ranged between -0.39 and 0.00. Therefore, selection for improved BCS

Chapter 5
66
would have a relatively low negative impact on production, SCS and longevity. Negative
correlations with V€T is mainly explained by the negative relationship between BCS and dairy
character. Finally correlations with V€G ranged between -0.26 and 0.00.
Table 16. Correlations between EBV1 to EBV7 and breeding values of the economically important
traits
EBV1 EBV2 EBV3 EBV4 EBV5 EBV6 EBV7
Milk yield -0.11 -0.14 -0.13 -0.16 -0.17 0.03 -0.05
Fat yield -0.16 -0.18 -0.18 -0.20 -0.22 0.08 0.00
Protein yield -0.02 -0.05 -0.04 -0.08 -0.10 0.14 0.06
SCS -0.01 -0.01 -0.01 -0.01 0.00 -0.09 -0.08
Longevity -0.18 -0.18 -0.18 -0.16 -0.17 -0.03 -0.08
Pregnancy rate 0.30 0.30 0.31 0.29 0.27 0.21 0.26
V€L -0.05 -0.06 -0.06 -0.10 -0.12 0.16 0.08
V€T -0.38 -0.39 -0.39 -0.34 -0.32 -0.31 -0.36
V€F -0.14 -0.14 -0.14 -0.13 -0.13 -0.01 -0.04
V€G -0.23 -0.25 -0.25 -0.25 -0.26 0.00 -0.09
Pearson and Spearman correlations were estimated among EBV1 to EBV7 for 769 bulls (Table
17). Results indicated that EBV1, EBV2 and EBV3 are closely related. As they were both
indicators of BCS postpartum loss, EBV4 and EBV5 were highly correlated. Moreover EBV6 was
not clearly related to others, except to EBV7.
Table 17. Pearson (above the diagonal) and Spearman (below the diagonal) correlations among
EBV1 to EBV7
EBV1 EBV2 EBV3 EBV4 EBV5 EBV6 EBV7
EBV1 0.97 0.97 0.87 0.86 0.66 0.82
EBV2 0.97 0.99 0.91 0.90 0.65 0.82
EBV3 0.97 0.99 0.93 0.91 0.68 0.84
EBV4 0.88 0.95 0.95 0.99 0.63 0.82
EBV5 0.87 0.93 0.94 0.99 0.58 0.78
EBV6 0.65 0.65 0.67 0.62 0.57 0.93
EBV7 0.82 0.84 0.85 0.81 0.77 0.92
Conclusion
Based on genetic solutions obtained from the model using BCS data of the first three parities,
different options for expressing BCS EBV were investigated and compared. Results indicated that
BCS could be used as an indicator trait for improving fertility. Selecting for higher EBV3 for
improving PR would lead to a similar response to selection than selecting directly on PR.
However negative impacts of selecting for BCS on economically important traits other than
fertility have also to be considered.

Genetic evaluation for body condition score
67
Acknowledgments
The authors gratefully acknowledge the support of the Ministry of Agriculture of Walloon Region
of Belgium (Service Public Wallon, SPW - DGARNE). Nicolas Gengler who is Research
associate and Hélène Soyeurt who is Postdoctoral researcher acknowledge the National Fund for
Scientific Research (Brussels, Belgium) for its support.
References
Bastin, C., L. Laloux, A. Gillon, C. Bertozzi, S. Vanderick, and N. Gengler. 2007. First results of
body condition score modeling for Walloon Holstein cows. INTERBULL Bull. 37:170-174.
Berry, D.P., F. Buckley, P. Dillon, R.D. Evans, M. Rath, and R.F. Veerkamp. 2003. Genetic
parameters for body condition score, body weight, milk yield, and fertility estimated using
random regression models. J. Dairy Sci. 86:3704-3717.
Dechow, C.D., G.W. Rogers, and J.S. Clay. 2001. Heritabilities and correlations among body
condition scores, production traits, and reproductive performances. J. Dairy Sci. 84:266-275.
Falconer, D.S., and T.F.C. Mackay. 1996. Introduction to quantitative genetics. 4th Edition
Longman, London. cited by MRode R. A., 2005.
Lassen, J., M. Hansen, M.K. Sørensen, G.P. Aamand, L.G. Christensen, and P. Madsen. 2003.
Genetic relationship between body condition score, dairy character, mastitis, and diseases
other than mastitis in first-parity Danish Holstein cows. J. Dairy Sci. 86:3730-3735.
Misztal, I. 2009. BLUPF90 family of programs. University of Georgia.
http://nce.ads.uga.edu/~ignacy/newprograms.html. Accessed on January 9, 2009.
MRode R.A. Linear models for the prediction of animal breeding values. 2nd Edition, CABI
Publishing, Wallingford.
Pryce, J.E., M.P. Coffey, and G. Simm. 2001. The relationship between body condition score and
reproductive performance. J. Dairy Sci. 84:1508-1515.
Roche, J.R., N.C. Friggens, J.K. Kay, M.W. Fisher, K.J. Stafford, and D.P. Berry. 2009. Invited
review: Body condition score and its association with dairy cow productivity, health, and
welfare. J. Dairy Sci. 92:5769-5801.
Van Vleck, L.D. 1993. Selection index and introduction to mixed model methods. Raton, Florida:
CRC Press.

Chapter 6. Phenotypic and genetic variability
of production traits and milk fatty acid contents
across days in milk
for Walloon Holstein first-parity cows
Outline
Chapters 2 to 5 were dedicated to the study of BCS and its association with reproduction performances. The two following Chapters will focus on the second group of traits that has been proposed in this thesis as an indicator of fertility: the milk FA profile. Milk FA are thought to be related to energy balance status of cows in early lactation and are available through routine milk recording schemes. In the present Chapter, the phenotypic and the genetic variability of milk FA contents throughout the lactation was explored using data from Walloon Holstein first-parity cows.
From: Bastin, C., N. Gengler, and H. Soyeurt. 2011. Phenotypic and genetic variability
of production traits and milk fatty acid contents across days in milk for Walloon
Holstein first-parity cows. J. Dairy Sci. 94:4152-4163.
Chapter 6
70
Abstract
The objective of this study was to assess the phenotypic and genetic variability of production
traits and milk fatty acid (FA) contents throughout lactation. Genetic parameters for milk, fat, and
protein yields, fat and protein contents, and 19 groups and individual FA contents in milk were
estimated for first-parity Holstein cows in the Walloon Region of Belgium using single trait, test-
day animal models and random regressions. Data included 130,285 records from 26,166 cows in
531 herds. Heritabilities indicated that de novo synthesized FA were under stronger genetic
control than FA originating from the diet and from body fat mobilization. Estimates for saturated
short- and medium-chain individual FA ranged from 0.35 for C4:0 to 0.44 for C8:0, whereas
those for monounsaturated long-chain individual FA were lower (around 0.18). Moreover, de
novo synthesized FA were more heritable in mid to late lactation. Approximate daily genetic
correlations among traits were calculated as correlations between daily breeding values for days
in milk between 5 and 305. Averaged daily genetic correlations between milk yield and FA
contents did not vary strongly among FA (around -0.35) but they varied strongly across days in
milk, especially in early lactation. Results indicate that cows selected for high milk yield in early
lactation would have lower de novo synthesized FA contents in milk but a slightly higher content
of C18:1 cis-9, indicating that such cows might mobilize body fat reserves. Genetic correlations
among FA emphasized the combination of FA according to their origin: contents in milk of de
novo FA were highly correlated with each other (from 0.64 to 0.99). Results also showed that
genetic correlations between C18:1 cis-9 and other FA varied strongly during the first 100 d in
milk and reinforced the statement that the release of long-chain FA inhibits FA synthesis in the
mammary gland while the cow is in negative energy balance. Finally, results showed that the FA
profile in milk changed during the lactation phenotypically and genetically, emphasizing the
relationship between the physiological status of cow and milk composition.
Key words: fatty acid, genetic correlation, milk fat, random regression

Variability in milk production traits and milk fatty acid contents
71
Introduction
Fat is one of the most variable components of bovine milk. In recent years, the detailed study of
milk fat composition has been increasing because of 2 major concerns. First, milk composition
reflects the metabolism and the environment of the cow. Milk fat composition is thought to be
related to the energy status of the cow: negative energy balance is associated with an increase in
C16:0 and C18:0, which suggests mobilization of body fat reserves (Stoop et al., 2009). In
addition, Chilliard et al. (2009) investigated the effect of 3 different physical forms of linseed
fatty acids (FA) on cow dairy performance, and milk FA secretion and composition, and their
relationship with methane eructed by cows. They observed strong correlations between the
concentration of some FA in milk fat and methane eructed by dairy cows, indicating that milk FA
profile can be considered a potential indicator of in vivo methane output in ruminants. Second,
milk is a consumer product and its composition influences its economic value as well as its
nutritional, technological, and sensory qualities. Some FA are known to have potential beneficial
effects (e.g., the anticarcinogenic properties of C18:2 cis-9,trans-11; Moate et al., 2007) or
potential deleterious effects (e.g., the hypercholesterolemic effects of C16:0; Grummer, 1991) on
human health. Moreover, Palmquist et al. (1993) indicated that an increasing C18:2 content made
butter softer, but milk with more than 20% of C18:2 was not acceptable regarding sensory quality.
In such milks, off-flavors were predominantly of an oxidized type, whereas significant oxidized
flavor was absent in freshly drawn milk.
Because of these multiple interests, better knowledge of the sources of variation of milk fat
composition is the first step to enhance the wide use of this information by the dairy industry and
dairy farmers. Several studies reported feeding effects on milk fat composition (Grummer, 1991;
Chilliard et al., 2001) but only a few studies have investigated genetic effects on milk FA profiles
(Karijord et al., 1982; Bobe et al., 2008; Stoop et al., 2008). These studies were generally based
on a limited number of records because the reference analysis for milk FA, gas chromatography,
requires skilled staff and is expensive and time-consuming. However, recent studies (Soyeurt et
al., 2006, 2011; Rutten et al., 2009) confirmed the potential of using mid-infrared spectrometry to
quantify FA contents in cow milk. Because of its use by regular milk recording and its proven
robustness (Soyeurt et al., 2011), this technology offers the possibility of investigating genetic
variability of milk FA on large data sets containing repeated records per cow. Such data sets allow
the use of random regression models to assess the evolution of genetic parameters within the
lactation. Although changes in genetic parameters over lactation have been previously suggested
(Mele et al., 2009), few authors have investigated the evolution of heritabilities and genetic
correlations among production traits and FA contents across a lactation (Soyeurt et al., 2008).
However, such studies present an opportunity to better understand the genetic effects on milk FA
contents toward the global objective of selecting dairy cows on the milk FA profile.
Therefore, the objective of this research was to estimate the genetic parameters of milk, fat, and
protein yields, fat and protein contents, and 19 groups and individual FA contents in milk
predicted by mid-infrared spectrometry for first-parity cows in the Walloon Region of Belgium
using random regression test-day animal models. The potential relationship between the energy
status of the cow and the phenotypic and genetic variabilities of FA throughout lactation was also
considered in the discussion of the results. This study is part of a larger project titled RobustMilk
(www.robustmilk.eu) aimed at developing genetic evaluation for FA contents in milk and
allowing dairy farmers to select cows that produce milk with a desirable FA profile.
Chapter 6
72
Materials and methods
Data editing
Daily milk yield (kg), fat yield (kg), protein yield (kg), fat content (g/dL of milk), and protein
content (g/dL of milk) of Holstein cattle were extracted from the edited database used for the
Walloon genetic evaluation of production traits and that included records since 1974. This
database included cows with known birth dates. Cows presenting unlikely ages for a given
lactation were excluded. Production records ranged between 5 and 365 DIM. Only first-lactation
records where observations were from 3 to 85 kg for milk yield, from 1 to 7% for protein content,
and from 1.5 to 9% for fat content were used for the calculations.
In the Walloon Region of Belgium, milk samples are collected through milk recording, which is
organized by the Walloon Breeding Association (Ciney, Belgium). The samples are analyzed by
using a mid-infrared MilkoScan FT6000 spectrometer (Foss, Hillerød, Denmark) by the milk
laboratory Comité du Lait (Battice, Belgium) to quantify fat and protein contents. The storage of
spectral data generated during the mid-infrared analysis was undertaken in 2005 at an
experimental level. Since January 2007, most of the spectral data of milk recording samples have
been included in the spectral database. Data for FA contents in milk (g/dL) used in this study
(Table 18) were predicted by applying the calibration equations developed by Soyeurt et al.
(2011) on the spectral database. It should be noted that not all FA contents are predicted with the
same accuracy by mid-infrared spectrometry. Therefore, to give indications of the accuracy of the
predicted FA contents, the coefficient of determination of the cross-validation (R2
cv) and the ratio
of the standard deviation of the data used to build the calibration equation (i.e., GC data) to the
standard error of the cross-validation (RPD) are provided in Table 18 (further details are provided
in Soyeurt et al., 2011). The prediction can be considered reliable if the RPD is >3 (Williams,
2007). Based on this criterion, predictions for 19 of the 29 predicted groups and individual FA
obtained by Soyeurt et al. (2011) were used. An exception was the group of polyunsaturated fatty
acids (PUFA) with a RPD close to 3 (2.6). This group was included in the analysis because of its
usefulness to perform a first screening of the studied dairy cow population and to provide
preliminary genetic parameters.
All of the 19 predicted individual FA or groups of FA are listed in Table 18. The 7 major FA
groups are saturated (SFA), unsaturated (UFA), monounsaturated (MUFA), PUFA, short-chain
fatty acids (SC) including FA with 4 to 10 carbons, medium-chain fatty acids (MC) including FA
with 12 to 16 carbons, and long-chain fatty acids (LC) including FA with 17 to 22 carbons. To
eliminate potentially abnormal records, FA values below the first percentile and above the 99th
percentile were deleted. Percentiles were calculated using the PROC UNIVARIATE in SAS (SAS
Institute Inc., Cary, NC). Descriptive statistics of data after the preliminary edits are presented in
Table 18. The pattern of average FA contents in milk at the classes of DIM 1-20, 21-40, 41-60,
and 61-80 as a proportion of those occurring at class 81-100 DIM is shown in Figure 15. Class
81-100 DIM was chosen as standard because trends of FA concentrations in milk across the
lactation were more variable during the first 100 DIM and more stable after that threshold.
For the estimation of variance components, cows were required to have all production and FA
records for at least 3 test-days. Herds with fewer than 12 test dates across the data set were
deleted. Moreover, records were deleted for a given herd × test-day if fewer than 5 records were
available. Descriptive statistics of the data set after this second editing are shown in Table 18.

Variability in milk production traits and milk fatty acid contents
73
Finally, the data set for the variance components estimation included 130,285 records from
26,166 cows in 531 herds collected between January 2007 and October 2010. Pedigree data were
extracted from the database used for the official Walloon genetic evaluation and were limited to
animals born after 1985. The final pedigree file included 73,749 animals.
Table 18. Descriptive statistics of the data set after preliminary edits and of the data set used for
variance components estimation
Data set after preliminary
edits
Data set for variance components
estimation (n = 130,285)
Trait R²cv RPD n Mean SD Mean SD h² SE (h²) RES1
Milk (kg) - - 4,101,652 18.961 6.605 23.525 5.902 0.197 0.018 0.253
Fat (kg) - - 4,100,367 0.766 0.272 0.920 0.224 0.166 0.017 0.336
Protein (kg) - - 4,097,233 0.620 0.210 0.778 0.185 0.160 0.016 0.322
Fat (%) - - 4,100,409 4.095 0.700 3.959 0.541 0.395 0.020 0.344
Protein (%) - - 4,097,275 3.310 0.381 3.336 0.319 0.447 0.022 0.263
Fatty acids2
Saturated 1 15.7 227,313 2.774 0.494 2.787 0.457 0.426 0.020 0.316
Monounsaturated 0.99 8.9 227,313 1.142 0.231 1.126 0.204 0.212 0.016 0.509
Polyunsaturated 0.85 2.6 231,951 0.169 0.036 0.168 0.032 0.298 0.017 0.485
Unsaturated 0.99 9.6 223,965 1.321 0.246 1.308 0.224 0.223 0.016 0.498
Short chain 0.98 6.7 227,314 0.345 0.068 0.348 0.063 0.438 0.021 0.315
Medium chain 0.98 6.5 227,313 2.111 0.433 2.128 0.406 0.434 0.020 0.304
Long chain 0.98 6.5 227,313 1.644 0.343 1.623 0.305 0.199 0.016 0.522
C4:0 0.94 4.1 227,317 0.105 0.020 0.105 0.018 0.354 0.019 0.405
C6:0 0.97 5.7 227,317 0.073 0.014 0.074 0.013 0.438 0.021 0.312
C8:0 0.97 6.1 227,321 0.045 0.010 0.046 0.009 0.441 0.021 0.308
C10:0 0.96 5.1 227,314 0.107 0.028 0.109 0.027 0.429 0.021 0.303
C12:0 0.96 5.2 227,315 0.130 0.037 0.133 0.035 0.427 0.020 0.304
C14:0 0.97 5.4 227,315 0.461 0.093 0.467 0.087 0.435 0.021 0.297
C16:0 0.95 4.6 227,313 1.224 0.282 1.228 0.265 0.408 0.020 0.333
C17:0 0.89 3.1 227,325 0.030 0.005 0.030 0.004 0.380 0.019 0.374
C18:0 0.90 3.2 227,313 0.411 0.101 0.407 0.093 0.231 0.016 0.522
C18:1 0.98 7.7 227,313 0.997 0.219 0.982 0.194 0.179 0.015 0.537
C18:1 cis 0.97 6.0 227,313 0.862 0.200 0.848 0.177 0.175 0.015 0.544
C18:1 cis-9 0.97 5.9 227,314 0.812 0.188 0.800 0.167 0.177 0.015 0.543 1 RES was defined as the daily ratio of residual variance to the total variance averaged across the entire lactation. 2 For fatty acids, the coefficient of determination of the cross-validation (R2cv) and the ratio of the standard deviation of
the data used to build the calibration equation to the standard error of cross-validation (RPD; Soyeurt et al., 2011) are
also presented as an indication of prediction accuracy.
Model and genetic parameter estimation
The applied model was based on the official Walloon genetic evaluation model for production
traits as described by Croquet et al. (2006). Variances and heritabilities were estimated for the 24
studied traits using single-trait random regression animal test-day models. The following model
was used:
eZaZpWhQXβy )(

Chapter 6
74
where y was the vector of observations for 1 of the 24 studied traits; β was the vector of the
following fixed effects: herd × test-day, gestation stage, minor lactation stage (classes of 5 DIM),
and major lactation stage (classes of 73 DIM) × age at calving × season of calving; h was the
vector of herd × period of calving random regression coefficients; p was the vector of permanent
environmental random regression coefficients; a was the vector of additive genetic random
regression coefficients; e was the vector of residuals; X, W, and Z were incidence matrices
assigning observations to effects; and Q was the covariate matrix for second-order Legendre
polynomials.
Random effects were assumed to be normally distributed and residual variances were assumed to
be independent and constant over the lactation. Variance components estimation was performed
using average information REML (AI-REML; Misztal, 2010). Priors of variance components
were estimated by expectation maximization REML (EM-REML; Misztal, 2010) using single-
trait random regression models on a reduced data set (about 68,000 records from 16,000 cows).
Daily variances were estimated and daily heritabilities were defined as the ratio of the genetic
variance to the total variance for each day between 5 and 305 DIM. The daily ratio of residual
variance to the total variance (RES) was also calculated for every trait. Standard errors of daily
variance and heritability estimates were calculated using the method presented by Fischer et al.
(2004) based on variance estimates from the average information inverse matrix of the AI-REML
output file. Average daily variances, heritabilities, RES, and their standard errors were defined as
the average across the entire lactation.
Approximate daily genetic correlations were computed between traits using the following method.
First, daily breeding values (EBVd) for each DIM between 5 and 305 and for cows with records
were calculated as following:
EBVdhtk ∑ ahkmztm
2
m 0
was the daily breeding value of cow k, for trait h, for each DIM t between 5 and 305,
was the random regression coefficient for the additive genetic effects, was the covariate
for Legendre polynomials associated with DIM t; and zt0 1.0, zt1 , zt2
, where ⁄ .1
Second, daily genetic correlations between 2 traits were estimated as correlations between EBVd
values of the 2 traits of interest for each DIM from 5 to 305. Finally, average daily correlations
were defined as the average correlations across the entire lactation. For simplification, these
correlations are called genetic correlations throughout this paper although they are correlations
among EBVd values.
1 In comparison to the published paper, the formula has been corrected.

Variability in milk production traits and milk fatty acid contents
75
Results and discussion
Data
Means and standard deviations of FA traits were similar between the data set after preliminary
edits and the data set used for variance components estimation (Table 18). However, for milk, fat,
and protein yields, means were higher in the final data set. This could be explained by the fact that
the first data set included more years of data for milk, fat, and protein yields (years 1974-2010).
Therefore, the mean was influenced by lower production in the past compared with the final data
set (years 2007-2010).
On average, contents of individual FA in milk were in agreement with previous studies based on
Walloon data (Soyeurt et al., 2007). Concerning the saturation of milk fat, values in Table 18
indicate that SFA was the most represented group of FA in milk, followed by MUFA and PUFA.
This is in accordance with literature data indicating that typical milk fat from dairy cows contains
approximately 70% SFA, 25% MUFA, and5% PUFA (Grummer, 1991). Concerning chain length,
our results showed that the MC group was the most represented in milk, followed by LC and SC.
This was expected because C14:0 and C16:0 are 2 of the major FA in milk (Jensen et al., 1991).
Variation of FA contents in milk over DIM
Figure 15 shows the pattern of FA contents in milk at different lactation stages until 100 DIM. It
indicates that UFA, especially MUFA, were more variable than SFA throughout the lactation.
Furthermore, LC were more variable than MC and SC. The evolution of phenotypic milk FA
contents across the lactation can be related to the cows’ physiology and notably to the energy
balance status. Three points are striking in Figure 15. First, at initiation of lactation, cows are in
negative energy balance, causing mobilization of adipose FA and incorporation of these FA in
milk (Palmquist et al., 1993). The FA stored as triglycerides in ruminant adipose tissue are mainly
C16:0, C18:0, and C18:1 cis-9 (Chilliard et al., 2000). Figure 15 clearly shows the release of
C18:0 and C18:1 cis-9 in early lactation (until around 80 DIM). Barber et al. (1997) also indicated
that the FA composition of milk has a much higher proportion of C18 FA when lipolysis is high.
Second, concomitant with the release of adipose FA in milk, the high uptake of LC inhibits de
novo synthesis of FA by mammary gland tissue (Palmquist et al., 1993) through the inhibition of
acetyl-coenzyme A carboxylase, which catalyzes the synthesis of malonyl-CoA, a catabolic
intermediate in FA synthesis. Figure 15 confirms this statement, as almost all C4:0 to C14:0 FA
and approximately one-half of the C16:0 FA in milk are derived from de novo synthesis
(Grummer, 1991). It shows further that the proportions of C8:0, C10:0, C12:0, and C14:0 were
lower in early than later stages of lactation. As discussed by Palmquist et al. (1993), de novo
synthesis is inhibited to different degrees in a pattern that shows increasing inhibition from C8:0
to C12:0. Furthermore, the synthesis of C4:0 is not inhibited, which is consistent with its origin
from pathways independent of the inhibitable acetyl-coenzyme A carboxylase pathway
(Palmquist et al., 1993). The increasing inhibition with higher chain length is consistent with the
condensation of acetyl units with a preformed 4-carbon primer. The formation of C6:0 requiring
one acetyl unit addition via malonyl coenzyme A would be influenced less than longer chain FA,
which would require increasing numbers of acetyl unit additions (Palmquist et al., 1993).

Chapter 6
76
Figure 15. Concentration of group and individual fatty acids in milk [saturated (SFA),
monounsaturated (MUFA), unsaturated (UFA), short-chain (SC), medium-chain (MC), long-chain
(LC) fatty acids, C4:0, C6:0, C8:0, C10:0, C12:0, C14:0, C16:0, C17:0, C18:0, C18:1, C18:1 cis,
and C18:1 cis-9] at the following classes of DIM: 1-20, 21-40, 41-60, and 61-80 as a proportion of
their concentration at class 81-100 DIM
Variability in milk production traits and milk fatty acid contents
77
Third, C16:0 did not show the same pattern in early lactation as LC or MC. This is probably due
to its double origin from de novo synthesis and circulating blood lipids (Grummer, 1991).
These results were in accordance with Kay et al. (2005), who showed that the week of lactation
markedly affected the content of most individual milk FA. They indicated that as long as lactation
progressed, the proportion of de novo (sum of C4:0 to C14:1) and mixed origin (sum of C16:0 to
C16:1) FA increased, whereas preformed FA (sum of >C17:0) decreased.
Variances and heritabilities
Average daily heritabilities for milk, fat, and protein yields were 0.197, 0.166, and 0.160,
respectively (Table 18). Average daily heritabilities for fat and protein contents were higher than
for yields: 0.395 and 0.447, respectively. These estimates were similar to averaged daily
heritabilities (0.24 for milk yield, 0.37 for fat content, and 0.46 for protein content) provided by
H. Soyeurt (unpublished data). Standard errors ranged from 0.015 to 0.022 (Table 18). Figure 16
depicts the evolution of heritabilities for milk, fat, and protein yields, and fat and protein contents
over DIM, and shows that the latter 2 traits were more heritable in mid (around 180 DIM) to late
lactation.
Concerning FA groups, estimates indicate that SFA were more heritable than UFA (Table 18).
Heritabilities were 0.426 for SFA, 0.223 for UFA, 0.212 for MUFA, and 0.298 for PUFA.
Furthermore, at the group level, heritability estimates decreased with FA chain length; averaged
daily heritabilities were 0.438 for SC, 0.434 for MC, and 0.199 for LC. Heritabilities of the
individual FA were in line with estimates of the FA groups: heritabilities of saturated short- and
medium-chain individual FA ranged from 0.354 for C4:0 to 0.441 for C8:0, whereas heritabilities
for monounsaturated long-chain individual FA were around 0.175 (Table 18).
The general pattern of the heritability estimates from this study was in line with results presented
by Soyeurt et al. (2007), Bobe et al. (2008), and Stoop et al. (2008). These authors indicated that
SFA and de novo synthesized FA had higher heritabilities than MUFA and PUFA. However,
heritabilities estimated in this study were generally higher than those from Soyeurt et al. (2007)
on the same type of data. They were also higher than estimates from Karijord et al. (1982), Bobe
et al. (2008), and Mele et al. (2009). However, a comparison of heritability estimates among
studies is difficult for several reasons. First, definition of FA traits differed across studies: in the
current research as well as in that of Soyeurt et al. (2007, 2008), FA contents were expressed in
grams per deciliter of milk. Bobe et al. (2008) used FA traits expressed in grams per liter of milk
or in weight percentage (i.e., FA weight as a proportion of total fat weight), whereas Stoop et al.
(2008) and Mele et al. (2009) expressed FA traits in weight percentage, and Karijord et al. (1982),
who conducted one of the first studies in genetic variability of milk FA profile, estimated genetic
parameters of FA concentrations in fat (g/100 g of fat). These studies suggested that the
concentrations of FA in milk are generally more heritable than those in milk fat. This is expected
because the fat content of bovine milk is strongly heritable (Arnould and Soyeurt, 2009).
Furthermore, the calibration equations from studies of Soyeurt et al. (2007, 2008) for the FA
predictions were different and became more reliable with time due to the use of larger calibration
data sets including greater variability of FA profile.
A second reason was the difference in the model used for estimating genetic parameters (e.g., sire
or animal model, herd as random or fixed effect, inclusion of random regressions). Finally, Mele
et al. (2009) indicated that differences in heritabilities among studies could be due to differences

Chapter 6
78
in the analytical methodology used for measuring FA contents. Most of the previously cited
studies (Bobe et al., 2008; Stoop et al., 2008; Mele et al., 2009) used gas chromatography,
whereas the current study used mid-infrared spectrometry. Therefore, Mele et al. (2009)
suggested that the error variance of a trait might vary due to the analytical methodology used.
However, the study presented by Stoop et al. (2008) and conducted on FA contents in fat
measured by gas chromatography indicated RES values similar to our results (Table 18). Their
average RES estimate for individual FA was 0.38, whereas our RES estimate was 0.39.
Figure 16. Daily heritabilities of milk, fat, and protein yields, fat and protein contents, and groups
and individual fatty acid contents: saturated (SFA), monounsaturated (MUFA), unsaturated (UFA),
short-chain (SC), medium-chain (MC), long-chain (LC) fatty acids, C4:0, C6:0, C8:0, C10:0,
C12:0, C14:0, C16:0, C17:0, C18:0, C18:1, C18:1 cis, and C18:1 cis-9
Our results indicated further that SC and MC are expected to be under stronger genetic control
than LC (Table 18), which could be explained by the different origin of milk FA. On the one
hand, short- and medium-chain FA (C4:0 to C14:0, and almost half of C16:0) are synthesized de
novo in the mammary gland. Therefore, the 2 key enzymes (acetyl-coenzyme A carboxylase and
FA synthetase) involved in this metabolic pathway seem to be partially under genetic control.
Figure 16 also indicates that SFA, SC, and MC are more heritable in mid to late lactation stage.
Heritability among DIM for C4:0 to C16:0 showed a similar pattern of the curve.

Variability in milk production traits and milk fatty acid contents
79
On the other hand, the remaining C16:0 and almost all of the longer chain FA are excreted from
the blood in the udder. Blood lipids may be derived from the digestion and absorption of dietary
fat or from mobilization from adipose tissue (Grummer, 1991). Because LC concentration in milk
is more dependent on diet intake than SC and MC, LC had lower heritabilities than FA
synthesized de novo. However, these heritabilities were not zero, indicating that processes
involved in the inclusion of LC in milk fat (i.e., biohydrogenation in the rumen, absorption of LC
in the intestine, or mobilization of FA from adipose tissue) could be partially under genetic
control. This confirmed the statement of Roche et al. (2009), who indicated that early lactation
lipolysis is genetically controlled. Furthermore, PUFA are not synthesized by ruminants so their
concentration in milk is closely related to the absorbed quantities in the intestine, which are
themselves related to the PUFA diet intake and to their biohydrogenation in the rumen (Chilliard
et al., 2001). Higher heritabilities for PUFA than for MUFA could indicate that processes
involved in the inclusion of PUFA in milk are more genetically controlled than those involved in
the production of MUFA in milk. Furthermore, Figure 16 indicates that the heritability of MUFA,
which mostly included C18:1 cis-9, is more stable among DIM than other FA, for which the shape
of the heritability curve seems to follow the curve of fat content heritability.
Approximate genetic correlations among production traits and FA
Approximation of genetic correlations
In this study, approximate daily genetic correlations among traits were estimated as correlations
among daily breeding values. As presented by Calo et al. (1973), correlations between breeding
values do not fully reflect the genetic relationships between 2 traits and they might underestimate
it. The range of estimates and the pattern of the curves obtained in this study were compared with
the genetic correlations obtained by Soyeurt et al. (2008), who used multivariate random
regression models on the same population. Estimates were, on average, in the same range for both
studies but the correlations were less variable along the lactation. For instance, correlations
between milk yield and SFA content in milk ranged between -0.20 and -0.55 in Soyeurt et al.
(2008) and between -0.42 and -0.33 in this study (data not shown). Correlations between MUFA
and SFA content in milk ranged between -0.10 and 0.80 in the study of Soyeurt et al. (2008) and
between 0.44 and 0.64 in this study (data not shown). These approximate genetic correlations will
be called genetic correlations in the discussion below.
Genetic correlations between production and FA
Averaged daily genetic correlations between milk yield and FA were negative (Table 19), which
was expected because of the dilution effect. Average daily correlations between milk yield and
FA contents did not vary strongly and approached -0.35. These correlations indicate that selection
for improved milk yield would affect almost equally all FA contents in milk on average
throughout the lactation and could therefore explain the results of Kay et al. (2005) and Bobe et
al. (2007), who indicated that selection for milk yield had little effect on milk FA composition.
However, given our results, the genetic relationships between milk yield and FA contents in milk
varied across DIM; Figure 17 depicts the genetic correlations between milk yield and fat content,
all individual FA, and PUFA. These FA were chosen because they were representative of the
complete data set. Trends for SC, MC, LC, SFA, MUFA, and UFA depended strongly on the
individual FA tendencies. Results in Figure 17 show that the genetic relationship between fat
content and milk yield was negative and decreased from -0.25 at 5 DIM to -0.44 at 215 DIM.

Chapter 6
80
Figure 17 also indicates that selection for higher milk yield in early lactation (before 100 DIM)
would affect the FA contents in milk differently: C4:0, C18:0, and PUFA would decrease but less
strongly than C6:0 to C17:0. Genetic correlations with milk yield at 5 DIM were -0.15 for C4:0, -
0.14 for C18:0, and -0.17 for PUFA, whereas they ranged from -0.26 for C6:0 to -0.34 for C14:0.
In contrast, the genetic correlation between milk yield and C18:1 cis-9 was slightly positive in
early lactation (0.06 at 5 DIM) and became negative around 35 DIM. Similarly, genetic
correlations between milk yield and C17:0, C18:0, C18:1 cis-9, and PUFA seemed to be stable
after 160 DIM and were around -0.45. The genetic correlation between milk yield and C16:0,
however, did not change much across DIM. The genetic correlation between milk yield and
PUFA was -0.17 in early lactation and decreased to -0.45 at 305 DIM. These results indicate that
selection for higher milk yield in early lactation would (1) decrease the FA contents in milk
synthesized de novo in the mammary gland, with a weaker influence on C4:0; (2) hardly affect
the content of C18:1 cis-9; and (3) negatively affect C18:0 and PUFA but with a weaker influence
than on short- and medium-chain FA. Furthermore, selection for higher milk yield in late lactation
would decrease the fat content and consequently all FA contents in milk, with a greater influence
on long-chain saturated and unsaturated FA. Finally, even if selection for higher milk yield at
specific DIM would affect the milk FA profile differently, the results indicated that, on average,
throughout the lactation, selection for improved milk yield would affect all FA contents in milk
almost equally.
Table 19. Averaged daily genetic correlations between production traits and fatty acid contents in
milk (g/dL); average daily genetic correlations were calculated as the correlations between daily
breeding values of cows having records and averaged for DIM between 5 and 305
Fatty acid Milk (kg) Fat (kg) Protein (kg) Fat (%) Protein (%)
Saturated -0.40 0.29 -0.21 0.97 0.49
Monounsaturated -0.39 0.15 -0.20 0.76 0.48
Polyunsaturated -0.39 0.13 -0.15 0.72 0.60
Unsaturated -0.40 0.15 -0.19 0.77 0.52
Short chain -0.32 0.32 -0.13 0.87 0.48
Medium chain -0.38 0.29 -0.18 0.95 0.54
Long chain -0.42 0.15 -0.27 0.79 0.38
C4:0 -0.27 0.34 -0.15 0.81 0.30
C6:0 -0.30 0.34 -0.13 0.87 0.43
C8:0 -0.31 0.31 -0.11 0.85 0.50
C10:0 -0.32 0.27 -0.11 0.81 0.55
C12:0 -0.34 0.24 -0.11 0.81 0.60
C14:0 -0.37 0.28 -0.13 0.89 0.59
C16:0 -0.37 0.28 -0.21 0.92 0.43
C17:0 -0.43 0.24 -0.21 0.96 0.57
C18:0 -0.37 0.17 -0.32 0.75 0.18
C18:1 -0.38 0.12 -0.22 0.70 0.39
C18:1 cis -0.36 0.12 -0.20 0.67 0.38
C18:1 cis-9 -0.35 0.13 -0.20 0.68 0.38
Genetic correlations between fat content and FA contents in milk (Table 19) were positive and
moderate to high; from 0.67 for C18:1 cis to 0.97 for SFA. Therefore, increasing fat content
would logically increase all underlying FA contents in milk. The high correlations between fat
content and SFA, MC, or C16:0 were expected because these FA are some of the major FA in fat.

Variability in milk production traits and milk fatty acid contents
81
These results indicated that selecting for higher fat content would increase SFA, SC, and MC
contents in milk more than it would increase MUFA, PUFA, or LC.
Genetic correlations of FA contents in milk with fat and protein yields were weaker than with
milk, positive with fat yield, and negative with protein yield (Table 19). Furthermore, genetic
correlations between protein content and FA contents were positive and ranged from 0.18 to 0.60.
Because FA contents are highly correlated with fat content, positive correlations between protein
content and FA contents could be explained by the genetic correlation between fat and protein
contents (0.54; data not shown) and negative correlations between protein yield and FA contents
by the genetic correlation between fat content and protein yield (-0.22; data not shown).
Figure 17 Daily genetic correlations between milk yield (kg) and fat content (%), and contents
(g/dL) of the following individual fatty acids or groups of fatty acids: C4:0, C6:0, C8:0, C10:0,
C12:0, C14:0, C16:0, C17:0, C18:0, C18:1 cis-9, and polyunsaturated fatty acids (PUFA). Daily
genetic correlations were calculated as correlations between daily breeding values of cows with
records
Results in Table 19 were in line with the estimates given by Soyeurt et al. (2007), although their
genetic correlations between milk yield and FA contents in milk were lower compared with those
in the current study. These differences could be due to different data sets (i.e., the inclusion of
cows with production data but without FA information in their study), the use of more reliable

Chapter 6
82
calibration equations for predicting FA contents in the present study, and the model used (this
study included different effects and random regressions in the model). Furthermore, correlations
presented here are approximate genetic correlations because they are correlations between
breeding values.
Genetic correlations among FA
All averaged daily genetic correlations were positive and ranged between 0.27 and 1.00 (Table
20). Individual FA were highly correlated with the group(s) to which they belonged. Such
correlations were higher if the individual FA was highly represented in the group (e.g., genetic
correlation between C18:1 and C18:1 cis-9 was 0.98). Contents in milk of all de novo FA (C4:0 to
C16:0) were strongly positively correlated with each other; the correlations ranged between 0.64
and 0.99. The correlations tended to be stronger between FA with a similar chain length (e.g.,
0.99 between C10:0 and C12:0 vs. 0.64 between C4:0 and C12:0). In contrast, C4:0 to C16:0
were less strongly correlated with C18:1, C18:1 cis, and C18:1 cis-9; the correlations ranged from
0.27 to 0.50. Genetic correlations among FA permit the identification of the different groups of
FA according to their origin: de novo synthesized FA and FA extracted from circulating blood
lipids. Although differences existed in the definition of FA traits and in the model used, our
results support the direction of associations among FA reported by previous studies. Soyeurt et al.
(2007) presented similar tendencies in genetic relationships among FA and grouped the FA
according to their origin. Stoop et al. (2008) estimated genetic correlations among FA expressed
in weight percentage and indicated that genetic correlations among C4:0 to C14:0 were high and
positive, as were those among unsaturated C18, but correlations of C4:0 to C14:0 with
unsaturated C18 were generally low.
Correlations between FA did not differ strongly over DIM (data not shown) except between
C18:1 cis-9 and most of the other individual FA (Figure 18). Results indicate that at the beginning
of lactation, the genetic correlations between C18:1 cis-9 and C8:0 to C14:0 were close to zero
and then increased until 125 DIM. Genetic correlations between C18:1 cis-9 and C6:0 and C16:0
were 0.20 and 0.27, respectively, in early lactation and then increased to 0.42 and 0.51 at 125
DIM. Contrarily, the genetic relationship between C18:1 cis-9 and C4:0, C17:0, C18:0, and PUFA
did not vary strongly over the lactation.

Variability in milk production traits and milk fatty acid contents
83
Tab
le 2
0.
Avera
ged d
aily
genetic c
orr
ela
tions a
mon
g f
atty a
cid
s i
n m
ilk (
g/d
L);
avera
ge d
aily
ge
netic c
orr
ela
tio
ns w
ere
calc
ula
ted a
s t
he c
orr
ela
tion
s
betw
een d
aily
bre
edin
g v
alu
es o
f cow
s h
avin
g r
ecord
s a
nd a
vera
ged f
or
DIM
betw
een 5
and 3
05
1
1 G
rou
ps
of
stu
die
d f
atty
aci
ds
are
satu
rate
d (
SF
A),
mo
no
un
satu
rate
d (
MU
FA
), p
oly
un
satu
rate
d (
PU
FA
), u
nsa
tura
ted
(U
FA
), s
ho
rt-c
hai
n (
SC
), m
ediu
m-c
hai
n (
MC
), a
nd
lon
g-c
hai
n (
LC
)
fatt
y a
cid
s.

Chapter 6
84
Figure 18. Daily genetic correlations between the content in milk (g/dL) of C18:1 cis-9 and the
content in milk (g/dL) of the following individual fatty acids or groups of fatty acids: C4:0, C6:0,
C8:0, C10:0, C12:0, C14:0, C16:0, C17:0, C18:0, and polyunsaturated fatty acids (PUFA). Daily
genetic correlations were calculated as correlations between daily breeding values of cows with
records
Conclusions
The FA profile in milk changed throughout lactation phenotypically and genetically. Although
genetic correlations between traits were approximated in this study, the relationship was strong
between the physiological status of the cow and its milk composition. As suggested in previous
studies, C18:1 cis-9 could be an indicator of mobilization of body reserves. Our results also
reinforce the value of studying the relationships between body energy status traits and changes in
FA throughout the lactation using multivariate models. Moreover, heritabilities of FA contents in
milk ranged between 0.175 for C18:1 cis and 0.441 for C8:0 and indicated that de novo
synthesized FA are under stronger genetic control than FA originating from the diet and from
body fat mobilization. Nevertheless, genetic correlations among FA were moderate to high
(especially between FA of similar origins) and suggest that selecting for certain FA would affect

Variability in milk production traits and milk fatty acid contents
85
the complete FA profile in milk. Finally, these results indicated that selection for FA content in
milk is feasible; however, the inclusion of these traits in breeding programs requires additional
work as well as the consultation of the stakeholders from the dairy industry. Two steps are then
needed: (1) the definition of clear breeding objectives related to these new traits and (2) the
definition of selection indexes giving appropriate weights to FA to select all traits toward their
desirable value.
Acknowledgments
This research received financial support from the European Commission, Directorate-General for
Agriculture and Rural Development, under Grand Agreement 211708 and from the Commission
of the European Communities, FP7, KBBE-2007-1. This paper does not necessarily reflect the
view of these institutions and in no way anticipates the Commission’s future policy in this area.
Hélène Soyeurt, as a postdoctoral researcher, and Nicolas Gengler, as a research associate,
acknowledge the support of the National Fund for Scientific Research (Brussels, Belgium) for
these positions and for the additional grants 2.4507.02F(2) and F4552.05 (2.4.623.08.F).
Additional financial support was provided by the Ministry of Agriculture of Walloon Region of
Belgium (Service Public de Walonie, Direction générale opérationnelle “Agriculture, Ressources
naturelles et Environnement” - DGA-RNE) through research projects D31-1207 and D31-1224.
Authors are grateful to University of Liège (SEGI facility) for the use of NIC3 supercomputer, to
Bernd Buske (Animal Science Unit, Gembloux Agro-Bio Tech, University of Liège, Belgium) for
manuscript review, and to the RobustMilk team (Teagasc Moorepark Dairy Production Research
Centre, Fermoy, Co. Cork, Ireland; Sustainable Livestock Systems Group, Scottish Agricultural
College, Bush Estate, Penicuik, Midlothian, United Kingdom; Walloon Agricultural Research
Centre, Valorisation of Agricultural Products, Gembloux, Belgium; Animal Science Unit,
Gembloux Agro-Bio Tech, University of Liège, Gembloux, Belgium) involved in the creation of
the fatty acid calibration equations used in this study.
References
Arnould, V.M.R., and H. Soyeurt. 2009. Genetic variability of milk fatty acids. J. Appl. Genet.
50:29-39.
Barber, M.C., R.A. Clegg, M.T. Travers, and R.G. Vernon. 1997. Lipid metabolism in the
lactating mammary gland. Biochim. Biophys. Acta 1347:101-126.
Bobe, G., G.L. Lindberg, A.E. Freeman, and D.C. Beitz. 2007. Short communication:
Composition of milk protein and milk fatty acids is stable for cows differing in genetic merit
for milk production. J. Dairy Sci. 90:3955-3960.
Bobe, G., J.A. Minick Bormann, G.L. Lindberg, A.E. Freeman, and D.C. Beitz. 2008. Short
communication: Estimates of genetic variation of milk fatty acids in US Holstein cows. J.
Dairy Sci. 91:1209-1213.
Calo, L.L., R.E. McDowell, L.D. VanVleck, and P.D. Miller. 1973. Genetic aspects of beef
production among Holstein-Friesians pedigree selected for milk production. J. Anim. Sci.
37:676-682.
Chilliard, Y., A. Ferlay, and M. Doreau. 2001. Contrôle de la qualité nutritionnelle des matières
grasses du lait par l’alimentation des vaches laitières: Acides gras trans, polyinsaturés, acide
linoléique conjugué. INRA Prod. Anim. 14:323-335.

Chapter 6
86
Chilliard, Y., A. Ferlay, R.M. Mansbridge, and M. Doreau. 2000. Ruminant milk fat plasticity:
Nutritional control of saturated, polyunsaturated, trans and conjugated fatty acids. Ann.
Zootech. 49:181-205.
Chilliard, Y., C. Martin, J. Rouel, and M. Doreau. 2009. Milk fatty acids in dairy cows fed whole
crude linseed, extruded linseed, or linseed oil, and their relationship with methane output. J.
Dairy Sci. 92:5199-5211.
Croquet, C., P. Mayeres, A. Gillon, S. Vanderick, and N. Gengler. 2006. Inbreeding depression
for global and partial economic indexes, production, type, and functional traits. J. Dairy Sci.
89:2257-2267.
Fischer, T.M., A.R. Gilmour, and H.J.J. van der Werf. 2004. Computing approximate standard
errors for genetic parameters derived from random regression models fitted by average
information REML. Genet. Sel. Evol. 36:363-369.
Grummer, R.R. 1991. Effect of feed on the composition of milk fat. J. Dairy Sci. 74:3244-3257.
Jensen, R.G., A.M. Ferris, and C.J. Lammi-Keefe. 1991. The composition of milk fat. J. Dairy
Sci. 74:3228-3243.
Karijord, Ø., N. Standal, and O. Syrstad. 1982. Sources of variation in composition of milk fat. Z.
Tierzücht. Züchtungsbiol. 99:81-93.
Kay, J.K., W.J. Weber, C.E. Moore, D.E. Bauman, L.B. Hansen, H. Chester-Jones, B.A. Crooker,
and L.H. Baumgard. 2005. Effects of week of lactation and genetic selection for milk yield
on milk fatty acids composition in Holstein cows. J. Dairy Sci. 88:3886-3893.
Mele, M., R. Dal Zotto, M. Cassandro, G. Conte, A. Serra, A. Buccioni, G. Bittante, and P.
Secchiari. 2009. Genetic parameters of conjugated linoleic acid, selected milk fatty acids,
and milk fatty acid unsaturation of Italian Holstein-Frisian cows. J. Dairy Sci. 92:392-400.
Misztal, I. 2010. BLUPF90 family of programs. University of Georgia, Athens. Accessed on
March 25, 2010. http://nce.ads.uga.edu/~ignacy/newprograms.html.
Moate, P.J., W. Chalupa, R.C. Boston, and I.J. Lean. 2007. Milk fatty acids. I. Variation in the
concentration of individual fatty acids in bovine milk. J. Dairy Sci. 90:4730-4739.
Palmquist, D.L., A.D. Beaulieu, and D.M. Barbano. 1993. Feed and animal factors influencing
milk fat composition. J. Dairy Sci. 76:1753-1771.
Roche, J.R., N.C. Friggens, J.K. Kay, M.W. Fisher, K.J. Stafford, and D.P. Berry. 2009. Invited
review: Body condition score and its association with dairy cow productivity, health, and
welfare. J. Dairy Sci. 92:5769-5801.
Rutten, M.J.M., H. Bovenhuis, K.A. Hettinga, H.J.F. van Valenberg, and J.A.M. Van Arendonck.
2009. Predicting bovine milk fat composition using infrared spectroscopy based on milk
samples collected in winter and summer. J. Dairy Sci. 92:6202-6209.
Soyeurt, H., P. Dardenne, F. Dehareng, G. Lognay, D. Veselko, M. Marlier, C. Bertozzi, P.
Mayeres, and N. Gengler. 2006. Estimating fatty acids content in cow milk using mid-
infrared spectrometry. J. Dairy Sci. 89:3690-3695.
Soyeurt, H., F. Dehareng, N. Gengler, S. McParland, E. Wall, D.P. Berry, M. Coffey, and P.
Dardenne. 2011. Mid-infrared prediction of bovine milk fatty acids across multiple breeds,
production systems, and countries. J. Dairy Sci. 94:1657-1667.
Soyeurt, H., F. Dehareng, P. Mayeres, C. Bertozzi, and N. Gengler. 2008. Genetic parameters of
saturated and monounsaturated fatty acid content and the ratio of saturated to unsaturated
fatty acids in bovine milk. J. Dairy Sci. 91:3611-3626.
Soyeurt, H., A. Gillon, S. Vanderick, P. Mayeres, C. Bertozzi, and N. Gengler. 2007. Estimation
of heritability and genetic correlations for the major fatty acids in bovine milk. J. Dairy Sci.
90:4435-4442.
Stoop, W.M., H. Bovenhuis, J.M.L. Heck, and J.A.M. van Arendonk. 2009. Effect of lactation
stage and energy status on milk fat composition of Holstein-Friesian cows. J. Dairy Sci.
92:1469-1478.

Variability in milk production traits and milk fatty acid contents
87
Stoop, W.M., J.A.M. van Arendonk, J.M.L. Heck, H.J.F. van Valenberg, and H. Bovenhuis. 2008.
Genetic parameters for major fatty acids and milk production traits of Dutch Holstein-
Friesians. J. Dairy Sci. 91:385-394.
Williams, P. 2007. Near-infrared technology, Getting the best out of light. PDK Grain, Namaimo,
Canada.


Chapter 7. Genetic correlations of days open
with production traits and contents in milk of
major FA predicted by mid-infrared spectrometry
Outline
Results from the previous Chapter emphasized the assumed relationship between the physiological status of cows and milk fat composition. At initiation of lactation, cows are in negative EB, causing the release of long-chain FA from the mobilization of body fat reserves and the consequent inhibition of synthesis of de novo FA in the mammary gland. To further verify the opportunity of using milk FA as indicator traits of fertility, genetic correlations between fertility and milk FA were explored using data from Walloon Holstein first-parity cows in the present Chapter. The use of random regression models allowed the estimation of the change of the correlations between milk FA contents and fertility across the lactation.
From: Bastin, C., D.P. Berry, H. Soyeurt, and N. Gengler. 2012. Genetic correlations of
days open with production traits and contents in milk of major FA predicted by mid-
infrared spectrometry. J. Dairy Sci. 95:6113-6121.

Chapter 7
90
Abstract
The objective of this study was to estimate the genetic relationships between days open (DO) and
both milk production traits and fatty acid (FA) content in milk predicted by mid-infrared
spectrometry. The edited data set included 143,332 FA and production test-day records and
29,792 DO records from 29,792 cows in 1,170 herds. (Co)variances were estimated using a series
of 2-trait models that included a random regression for milk production and FA traits. In contrast
to the genetic correlations with fat content, those between DO and FA content in milk changed
considerably over the lactation. The genetic correlations with DO for unsaturated FA,
monounsaturated FA, long-chain FA, C18:0, and C18:1 cis-9 were positive in early lactation but
negative after 100 d in milk. For the other FA, genetic correlations with DO were negative across
the whole lactation. At 5 d in milk, the genetic correlation between DO and C18:1 cis-9 was 0.39,
whereas the genetic correlations between DO and C6:0 to C16:0 FA ranged from -0.37 to -0.23.
These results substantiated the known relationship between fertility and energy balance status,
explained by the release of long-chain FA in early lactation, from the mobilization of body fat
reserves, and the consequent inhibition of de novo FA synthesis in the mammary gland. At 200 d
in milk, the genetic correlations between DO and FA content ranged from -0.38 for C18:1 cis-9 to
-0.03 for C6:0. This research indicates an opportunity to use FA content in milk as an indicator
trait to supplement the prediction of genetic merit for fertility.
Key words: fatty acid, genetic correlation, days open, random regression

Correlations of days open, production traits, and milk fatty acid contents
91
Introduction
Most dairy production systems have suffered a decline in cow fertility over the past 5 decades.
Fertility is a multifactorial trait and its deterioration has been caused by a combination of genetic,
environmental, and management factors (Walsh et al., 2011). However, improving dairy cow
fertility through genetic selection has become increasingly important in recent years since it was
established that declining fertility cannot be arrested solely by improved management (Veerkamp
and Beerda, 2007). Most dairy cattle populations have, by now, routine genetic evaluation
systems for female fertility (INTERBULL, 2011a) and such fertility traits are now almost always
included in national breeding goals (Miglior et al., 2005). Furthermore, international genetic
evaluations for female fertility are now available (INTERBULL, 2011b).
Direct selection for female fertility, however, might be complicated by the following factors: (1)
the difficulty in collecting large quantities of relevant direct fertility records, especially for
unfertile animals (e.g., no calving interval records for animals that are infertile), (2) the long
period required to validate some phenotypes (e.g., calving interval) and its subsequent effect on
generation interval and thus genetic gain, and (3) the generally low heritability of most traditional
fertility phenotypes (from 0.01 to 0.05; Veerkamp and Beerda, 2007). These factors contribute to
low accuracy of EBV, especially for cows and young bulls. Therefore, indicator traits could be
very useful to supplement the prediction of genetic merit for fertility as long as these traits are
easier to measure, recorded earlier in the cow’s lactation, heritable, and genetically correlated
with fertility. Several previous studies have documented a benefit of using correlated traits in
genetic evaluations of fertility such as milk, fat, protein yields, type traits, or traits related to the
extent and the duration of postpartum negative energy balance such as BW or BCS (Wall et al.,
2003; de Jong, 2005). Moreover, energy balance status is expected to be associated with milk
yield and milk composition. de Vries and Veerkamp (2000) suggested that a decrease in fat
percentage in early lactation might serve as an indicator of energy balance. Also, milk FA profile
is thought to be related to energy balance status of cows in early lactation (Stoop et al., 2009; Mc
Parland et al., 2011). At initiation of lactation when cows are in negative energy balance, adipose
FA are mobilized and incorporated in milk, causing an increase of C18 FA proportion in milk fat
and a consequent inhibition of de novo synthesis of FA by the mammary gland (Palmquist et al.,
1993; Barber et al., 1997). Moreover, previous studies have clearly shown that milk FA content is
heritable (Soyeurt et al., 2007; Stoop et al., 2008). Therefore, FA contents in milk could be
considered as potential indicator traits for fertility. Although the genetic relationship between
fertility and traditional production traits (milk, fat, and protein) has been reported in several
studies (Veerkamp et al., 2001; Windig et al., 2006), to our knowledge, the genetic relationship
between fertility and milk FA profile has not been investigated.
The objective of this study was to investigate the genetic relationships between fertility, measured
as the interval from calving to conception or days open (DO), and FA content in milk. The genetic
correlations between fertility and both milk production traits and content in milk of 17 groups and
individual FA predicted by mid-infrared spectrometry were estimated for first-parity Walloon
Holstein cows using random regression test-day animal models for milk production and FA traits.

Chapter 7
92
Materials and methods
Data editing
Daily milk yield (kg), fat yield (kg), protein yield (kg), fat content (%), protein content (%), and
DO records of first-parity Holstein cattle were extracted from the edited database used for the
Walloon genetic evaluation in Belgium. This data set included cows with a known birth date and
calving for the first time between 21 and 49 mo of age. Production records ranged between 5 and
365 DIM and only records where values were between 3 and 85 kg for milk yield, between 1 and
7% for protein content, and between 1.5 and 9% for fat content were used. These thresholds are
used in the official genetic evaluation for production traits in the Walloon region of Belgium and
are based on International Committee for Animal Recording (ICAR) guidelines (ICAR, 2012).
Days open and pregnancy rate (which is derived from DO) are the only traits currently available
in the Walloon fertility database used for genetic evaluation. Because AI data are scarce, DO is
often estimated using the next calving date by subtracting 280 d from the calving interval. Days
open <21 were deleted and DO >355 were set to 355.
Contents (g/dL of milk) of individual and groups of FA used in this study were predicted by
applying, to the Walloon spectral database, the calibration equations developed by Soyeurt et al.
(2011) using 517 samples selected in 3 countries (Belgium, Ireland, and United Kingdom) from
various breeds, cows, and production systems (Table 21). Contents of FA in milk fat (g/100 g of
fat) were not used for 2 reasons. First, Soyeurt et al. (2011) demonstrated that mid-infrared
prediction of FA contents in milk fat was inferior to predictions of contents in milk. Second, by
expressing FA content in milk, results could be directly compared with those obtained for fat and
protein content. To provide an indication of the accuracy of mid-infrared spectroscopy at
predicting milk FA content, the coefficient of determination of the cross-validation (R²cv) and the
ratio of (standard error of) prediction to (standard) deviation (RPD) are provided in Table 21. For
each equation, the RPD was calculated and defined as the ratio of the standard deviation of the
data used to build the calibration equation (i.e., gas chromatographic data) to the standard error of
the cross-validation (further details are provided in Soyeurt et al., 2011). Soyeurt et al. (2011)
further indicated that equations with R²cv greater than 75% could be used for animal breeding
purposes. Williams (2007) suggested that the prediction can be considered as reliable if the RPD
is higher than 3. Based on this criterion, predictions for 16 out of the 29 predicted groups and
individual FA presented by Soyeurt et al. (2011) were included in the present study. An exception
was the group of PUFA with an RPD close to 3 (2.6) because of the usefulness of including the
major groups of FA in the analysis. Since January 2007, the Walloon spectral database has
included most of the spectra generated during the analysis of milk samples collected through milk
recording in the Walloon region. Milk recording is organized by the Walloon Breeding
Association (Ciney, Belgium), and milk samples are analyzed using mid-infrared MilkoScan
FT6000 spectrometer (Foss, Hillerød, Denmark) by the milk laboratory Comité du Lait (Battice,
Belgium). The 7 FA groups used in this study were SFA, unsaturated (UFA), MUFA, PUFA,
short-chain fatty acids (SCFA), including FA with 4 to 10 carbons, medium-chain fatty acids
(MCFA), including FA with 12 to 16 carbons, and long-chain fatty acids (LCFA), including FA
with 17 to 22 carbons. To eliminate potentially abnormal records, FA contents in milk below the
1st and above the 99th percentile were discarded.

Correlations of days open, production traits, and milk fatty acid contents
93
Table 21. Mean and standard deviation of days open (n = 29,792) and production and FA traits
(n = 143,332) in the data set used for genetic correlations estimation; lactation heritability
estimates 2
305dh , average daily heritability estimates 2
dh , and lactation genetic correlations with
days open (r305d) are also presented1.
Traits R²cv RPD Mean SD 2
305dh 2
dh r305d
Days open - - 147 83 0.05 - -
Milk (kg) - - 23.08 5.99 0.31 0.21 0.51
Fat (kg) - - 0.904 0.226 0.29 0.18 0.42
Protein (kg) - - 0.765 0.187 0.29 0.17 0.38
Fat (%) - - 3.964 0.544 0.68 0.40 -0.15
Protein (%) - - 3.343 0.324 0.67 0.44 -0.34
Fatty acids2 (g/dl of milk)
SFA 1.00 15.7 2.793 0.461 0.68 0.43 -0.12
MUFA 0.99 8.9 1.129 0.206 0.58 0.21 -0.15
PUFA 0.85 2.6 0.167 0.032 0.69 0.31 -0.16
Unsaturated FA 0.99 9.6 1.310 0.226 0.60 0.23 -0.16
Short chain FA 0.98 6.7 0.348 0.063 0.68 0.42 -0.10
Medium chain FA 0.98 6.5 2.134 0.412 0.68 0.43 -0.13
Long chain FA 0.98 6.5 1.625 0.307 0.56 0.20 -0.13
C4:0 0.94 4.1 0.106 0.018 0.63 0.34 -0.03
C6:0 0.97 5.7 0.074 0.013 0.67 0.42 -0.07
C8:0 0.97 6.1 0.046 0.009 0.68 0.43 -0.11
C10:0 0.96 5.1 0.109 0.027 0.68 0.42 -0.15
C12:0 0.96 5.2 0.132 0.035 0.69 0.43 -0.18
C14:0 0.97 5.4 0.467 0.087 0.68 0.43 -0.13
C16:0 0.95 4.6 1.236 0.269 0.67 0.41 -0.11
C17:0 0.89 3.1 0.030 0.004 0.70 0.39 -0.20
C18:0 0.90 3.2 0.407 0.093 0.59 0.23 -0.06
C18:1 cis-9 0.97 5.9 0.803 0.167 0.52 0.17 -0.13 1Standard errors ranged from 0.01 to 0.04 for h²305d, were 0.02 for h²d, and ranged from 0.07 to 0.10 for r305d. 2For fatty acids, the coefficient of determination of the cross-validation R²cv and the ratio of (standard error of)
prediction to (standard) deviation (RPD; Soyeurt et al., 2011) are presented.
To estimate genetic correlations among DO and both milk production and milk FA content, cows
from the edited data set were required to have a DO record and full information on production and
FA content for at least 3 test-days. Descriptive statistics of the data set used for the estimation of
genetic correlations are in Table 21. The final data set included 143,332 FA and production
records and 29,792 DO records from 29,792 cows in 1,170 herds. The data set included cows that
had calved between March 2006 and July 2010. Pedigree data were extracted from the database
used for the official Walloon genetic evaluation and were limited to animals born after 1985. The
pedigree file contained 91,032 animals.
Model
The model used in this study was based on models used for Walloon genetic evaluations for
production and fertility (Croquet et al., 2006; Mayeres et al., 2006). A total of 22 two-trait (DO

Chapter 7
94
and each of the 22 production and FA traits) analyses were run using the following bivariate
model:
2
1
2
1
2
1
2
1
2
1
1
1
2
2
2
1
2
1
2
1
e
e
a
a
Z0
0Z
p
p
Z0
0Zw
W
0h
0
H
β
β
X0
0X
y
y
where y1 was a vector of records of production or FA traits; y2 was a vector of DO records; β1 was
the vector of the following fixed effects for production and FA traits: (1) herd × test-day, (2)
gestation stage, (3) stage of lactation (classes of 5 DIM), and (4) stage of lactation (classes of 73
DIM) × age at calving × season of calving; β2 was the vector of the following fixed effects for
DO: (1) herd, (2) year × month of calving, and (3) age at calving × season of calving; h2 was the
vector of the herd × year of calving random effect for DO; w1 was the vector of herd × period of
calving random regression coefficients for FA and production traits; p1 was the vector of within-
lactation permanent environmental random regression coefficients for production traits and FA; p2
was the vector of nongenetic cow-specific (within-animal) environmental random effect for DO;
a1 was the vector of additive genetic random regression coefficients for FA and production traits;
a2 was the vector of additive genetic random effect for DO; e1 and e2 were the vector of residuals
for y1 and y2, respectively; and X1, X2, H2, W1, Z1, and Z2 were incidence matrices assigning
observations to effects.
Regression curves were modeled using modified Legendre polynomials of the second order.
Random effects were assumed to be normally distributed, and residual variances were assumed to
be independent and constant over the lactation. Genetic covariances were modeled among genetic
effect for DO and genetic random regression effects for production traits or FA. No residual
covariance was modeled between DO and other traits because they were obtained from different
sources and not recorded simultaneously. Therefore, to avoid environmental covariances being
considered as genetic covariances, within-animal environmental covariance among traits was
modeled by the permanent environmental effect, as proposed by Negussie et al. (2008) and Bastin
et al. (2010). This effect allowed for a cow-specific, nongenetic link between the traits of the 2
data sets.
(Co)variance components estimation was performed using Gibbs sampling (Misztal, 2010).
Posterior means and posterior standard errors of (co)variance components were estimated using
90,000 samples after a burn-in of 10,000 samples.
Genetic parameters
Daily heritability estimates 2
dh were defined for the production and FA traits as the ratio of the
genetic variance to the sum of genetic, environmental, herd × period of calving, and residual
variances for each day between 1 and 305 DIM. Genetic, environmental, and herd × period of
calving daily variances for production and FA traits at DIM t were estimated as qqK , where K
was the elementary covariance matrix among the Legendre polynomial coefficient of the
corresponding effect for the trait of interest, and q was a line vector of Legendre polynomials
coefficients computed for DIM t. Average daily heritabilities were defined as the average across
the entire lactation. Lactation heritability or 305-d heritability 2
305dh was estimated in the same
way as daily estimates using 305-d variances; genetic, environmental, and herd × period of
calving 305-d variances of production and FA traits were estimated by replacing q by q305d, which

Correlations of days open, production traits, and milk fatty acid contents
95
was the vector of Legendre polynomial coefficients cumulated from 1 to 305 d. Residual 305-d
variance was computed as 2
es , where s was 305 and 2
e was the estimated residual variance.
Heritability for DO was defined as the ratio of genetic variance to the sum of all random effect
variances and was averaged across the 22 two-trait analyses.
To calculate daily genetic correlations between DO and production and FA traits, the daily
genetic covariance at DIM t between DO and the production or FA trait of interest was obtained
as qc’, where c was the additive genetic covariance line vector among both traits. Similarly,
lactation genetic covariance (or 305-d genetic covariance) was obtained by replacing q by q305d in
the above formula.
Calculation of standard errors of parameters (heritability and genetic correlations) was based on
formulas presented by Fischer et al. (2004) using posterior standard errors of the (co)variance
components.
Results and discussion
Heritability estimates for the different traits are presented in Table 21. Heritability for DO was
0.05, with a standard error of 0.01, and was similar to estimates from the literature for fertility.
Mayeres et al. (2006) reported heritability of 0.05 for pregnancy rate in Walloon data. In that
study, pregnancy rate was expressed as a percentage and computed as 21/(DO - 45 + 11), where
45 represents the voluntary waiting period in the Walloon production system and 11 represents
half of a normal estrus cycle. Veerkamp and Beerda (2007) reported a mean heritability for DO
estimated across 17 studies of 0.024; VanRaden et al. (2004) estimated a heritability of 0.037 for
DO in first-lactation Holstein cows in the United States, and Hou et al. (2009) reported a
heritability of 0.066 for DO in first-parity Danish Holstein cows. Lactation heritability estimates
for milk, fat, and protein yields were almost 0.10 lower than those used in Walloon genetic
evaluations at, respectively, 0.41, 0.43, and 0.40 (Auvray and Gengler, 2002). Lactation
heritabilities for FA ranged between 0.52 for C18:1 cis-9 and 0.70 for C17:0. The average daily
heritability of FA ranged from 0.17 to 0.43 and was similar to previous estimates by Bastin et al.
(2011). Standard errors of the heritability estimates were all <0.04. The de novo synthesized FA
(C4:0 to C14:0 and half of C16:0) had generally higher heritabilities than FA originating from the
diet and from body fat mobilization (LCFA and PUFA), which is in line with previous studies
(Bobe et al., 2008; Stoop et al., 2008).
Lactation genetic correlations between DO and production traits and FA contents in milk are
presented in Table 21. Lactation genetic correlations between DO and FA content in milk were
low and ranged between -0.20 and -0.03; standard errors of the estimates ranged from 0.07 to
0.10. Daily genetic correlations between DO and production traits and FA content in milk are
presented in Figures 19, 20, and 21; standard errors of the estimates ranged from 0.07 to 0.13.
Daily genetic correlations between DO and the yield traits were positive and did not change
greatly over DIM (Figure 19). Genetic correlations ranged between 0.45 at 245 DIM and 0.54 at
35 DIM for milk yield, between 0.38 at 185 DIM and 0.42 at 50 DIM for fat yield, and between
0.32 at 5 DIM and 0.39 at 305 DIM for protein yield. Lactation correlations with DO were 0.51
for milk yield, 0.42 for fat yield, and 0.38 for protein yield. This is in agreement with previous
studies reporting antagonistic genetic correlations between interval fertility traits and milk yield.
Veerkamp et al. (2001) reported genetic correlations with interval between first and second

Chapter 7
96
calving of 0.67 for 305-d milk yield, 0.58 for 305-d fat yield, and 0.67 for 305-d protein yield.
Windig et al. (2006) also reported positive genetic correlations between milk yield and days to
first service varying over environments from 0.30 in small herds to 0.48 in herds with low average
fertility. These correlations suggest that selection for higher yield alone, without any knowledge
of other (functional) traits, would negatively affect fertility performances. However, a complex
relationship exists between milk yield, health, and reproductive performances; therefore, no clear
evidence exists of a direct cause-effect association between yield and fertility (Weigel, 2006).
Figure 19. Daily genetic correlations between days open (DO) and milk, fat, and protein yields,
and fat and protein contents in milk. Standard errors of estimates ranged from 0.07 to 0.12.
Although genetic correlations between fat content in milk and DO were negative and relatively
stable across the lactation (correlations ranged from -0.17 at 305 DIM to -0.07 at 5 DIM; Figure
19), the genetic correlations between DO and some FA content in milk varied over the lactation.
This suggests that changes in overall FA profile in milk over lactation were not simply explained
by changes in overall fat percentage. For UFA, MUFA, LCFA, C18:0, and C18:1 cis-9, the
genetic correlations with DO were positive in early lactation but negative after 100 DIM. For the
other groups and individual FA, genetic correlations with DO were negative across the entire
lactation (Figures 20 and 21).
The pattern of genetic correlations between fertility and FA content in milk is likely related to the
cow’s physiological state, especially in early lactation. At the initiation of lactation, cows are in
negative energy balance (Berry et al., 2006), causing catabolism of adipose FA and leading to an
increase in C18 FA in milk (Palmquist et al., 1993; Barber et al., 1997; Van Haelst et al., 2008).
The FA composition of milk has therefore a much higher proportion of C18:0 and C18:1 cis-9
when lipolysis is high (i.e., when the cow is in negative energy balance). This is supported by Mc
Parland et al. (2011), who presented correlations between LCFA content in milk and body energy
status of -0.20 in cows fed a high concentrate diet and -0.24 in cows fed a low concentrate diet.
Because negative energy balance is known to be associated with reduced fertility (de Vries and
Veerkamp, 2000), the expectation is that higher contents of C18:0 and C18:1 cis-9 in milk could
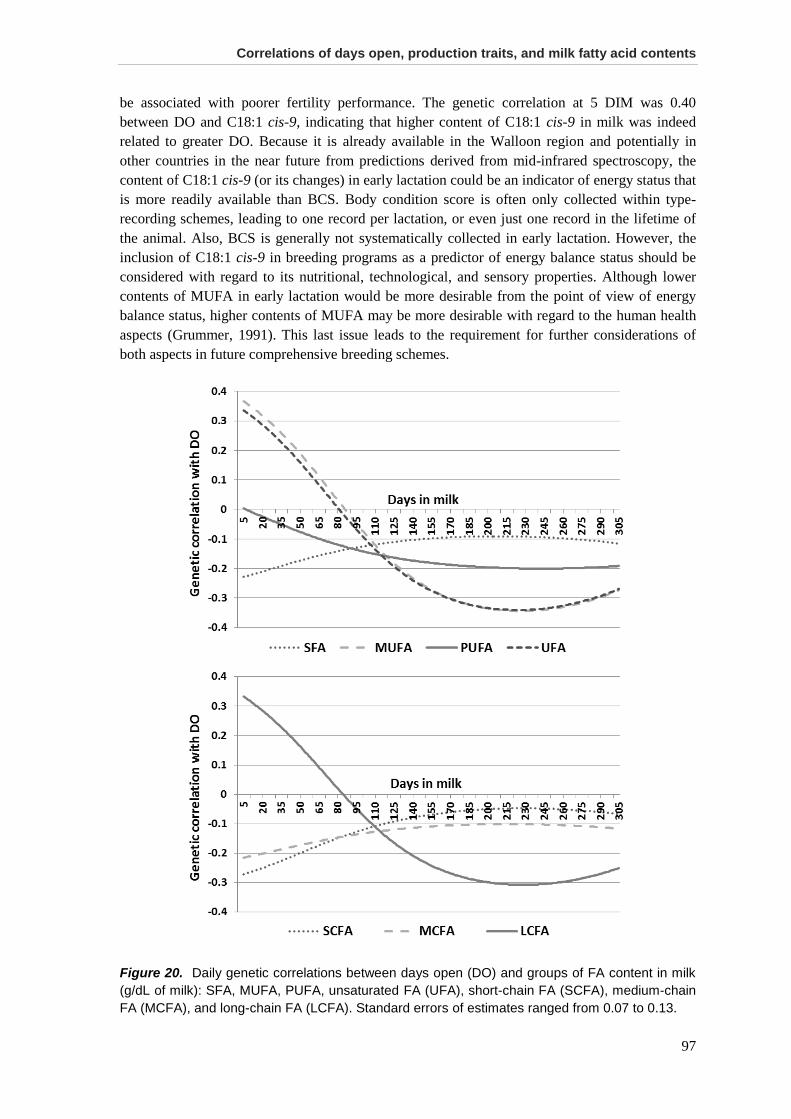
Correlations of days open, production traits, and milk fatty acid contents
97
be associated with poorer fertility performance. The genetic correlation at 5 DIM was 0.40
between DO and C18:1 cis-9, indicating that higher content of C18:1 cis-9 in milk was indeed
related to greater DO. Because it is already available in the Walloon region and potentially in
other countries in the near future from predictions derived from mid-infrared spectroscopy, the
content of C18:1 cis-9 (or its changes) in early lactation could be an indicator of energy status that
is more readily available than BCS. Body condition score is often only collected within type-
recording schemes, leading to one record per lactation, or even just one record in the lifetime of
the animal. Also, BCS is generally not systematically collected in early lactation. However, the
inclusion of C18:1 cis-9 in breeding programs as a predictor of energy balance status should be
considered with regard to its nutritional, technological, and sensory properties. Although lower
contents of MUFA in early lactation would be more desirable from the point of view of energy
balance status, higher contents of MUFA may be more desirable with regard to the human health
aspects (Grummer, 1991). This last issue leads to the requirement for further considerations of
both aspects in future comprehensive breeding schemes.
Figure 20. Daily genetic correlations between days open (DO) and groups of FA content in milk
(g/dL of milk): SFA, MUFA, PUFA, unsaturated FA (UFA), short-chain FA (SCFA), medium-chain
FA (MCFA), and long-chain FA (LCFA). Standard errors of estimates ranged from 0.07 to 0.13.

Chapter 7
98
Figure 21. Daily genetic correlations between days open (DO) and individual FA content in milk
(g/dL of milk): C4:0, C6:0, C8:0, C10:0, C12:0, C14:0, C16:0, C17:0, C18:0, and C18:1 cis-9.
Standard errors of estimates ranged from 0.07 to 0.13.
Concomitant with the release of adipose FA into milk in early lactation, the high uptake of LCFA
inhibits de novo synthesis of FA by mammary gland tissue through the inhibition of acetyl-
coenzyme A carboxylase. This inhibition intensifies with increasing chain lengths (Palmquist et
al., 1993). Lower contents of C6:0 to C14:0 FA in milk could therefore also be associated with
greater body fat mobilization and poorer fertility performance. This was substantiated by the
negative genetic correlations observed in this study. Genetic correlations at 5 DIM between DO
and C6:0 to C14:0 ranged between -0.37 (C10:0) and -0.23 (C6:0; Figure 21). Furthermore, the
synthesis of C4:0 is not inhibited in early lactation because it originates in pathways independent

Correlations of days open, production traits, and milk fatty acid contents
99
of the inhibited acetyl coenzyme A carboxylase pathway (Palmquist et al., 1993). Therefore the
genetic correlation between DO and content of C4:0 in milk was close to zero. Finally, the genetic
correlation between C16:0 content in milk and DO was negative throughout lactation and ranged
from -0.17 at 5 DIM to -0.10 at 305 DIM. Because C16:0 originates from both de novo synthesis
and circulating blood lipids (Grummer, 1991), genetic correlations between DO and C16:0 are
difficult to interpret biologically.
After 150 DIM, genetic correlations between DO and contents of FA in milk were all negative
and ranged between -0.39 for C18:1 cis-9 at 230 DIM to -0.02 for C4:0 at 150 DIM. These
correlations indicated that selection for higher contents in milk of C18:1 cis-9 in mid to late
lactation is related to improved fertility.
Polyunsaturated FA content in milk was not strongly genetically associated with fertility,
especially in early lactation (Figure 20); genetic correlations between DO and PUFA ranged from
-0.20 at 230 DIM to 0.00 at 5 DIM. Polyunsaturated FA are not synthesized by ruminants, and
their concentration in milk is closely related to dietary intake of PUFA (Chilliard et al., 2000).
Therefore, our results indicated that processes involved in the inclusion of PUFA in milk in early
lactation are not likely to be genetically related to fertility in dairy cows.
Further research might consider the genetic relationship between fertility and FA volumes or FA
contents in fat. Although the mid-infrared prediction of FA contents in fat presents much lower
accuracy than the mid-infrared prediction of FA in milk (Soyeurt et al., 2011), this trait might
reflect more clearly the equilibrium among FA originating from different metabolic origins.
Moreover, even if correlations between fertility and volumes of FA were more dependent on milk
yield, this trait could be useful to account for the “dilution” effect and to distinguish 2 cows that
present the same content of FA in milk but that produce different quantities of milk and FA.
Conclusions
Results from this study confirmed the unfavorable genetic association between fertility and milk,
fat, and protein yields. Genetic correlations between DO and FA content in milk substantiated the
known unfavorable relationship between fertility and energy balance status and could be
explained by the release of LCFA content in early lactation resulting from the mobilization of
body fat reserves and the consequent inhibition of de novo FA synthesis in the mammary gland.
In particular, the content of C18:1 cis-9 in early lactation seems to be a useful indicator of body
fat mobilization and consequently of reproductive performance.
Acknowledgments
This research received financial support from the European Commission, Directorate-General for
Agriculture and Rural Development (Grand Agreement 211708) and from the Commission of the
European Communities (FP7, KBBE-2007-1). This paper does not necessarily reflect the view of
these institutions and in no way anticipates the Commission’s future policy in this area. Hélène
Soyeurt, as a postdoctoral researcher, and Nicolas Gengler as a senior research associate until
December 31, 2011, acknowledge the support of the National Fund for Scientific Research
(Brussels, Belgium) for these positions and for the additional grants 2.4507.02F(2) and F4552.05

Chapter 7
100
(2.4.623.08.F). Additional financial support was provided by the Ministry of Agriculture of
Walloon Region of Belgium (Service Public de Wallonie, Direction générale opérationnelle
“Agriculture, Ressources naturelles et Environnement”) through research projects D31-1207 and
D31-1224. Authors are grateful to University of Liège (SEGI facility) for the use of NIC3
supercomputer.
References
Auvray, B., and N. Gengler. 2002. Feasibility of a Walloon test-day model and study of its
potential as tool for selection and management. INTERBULL Bull. 29:123-127.
Barber, M.C., R.A. Clegg, M.T. Travers, and R.G. Vernon. 1997. Lipid metabolism in the
lactating mammary gland. Biochim. Biophys. Acta 1347:101-126.
Bastin, C., N. Gengler, and H. Soyeurt. 2011. Phenotypic and genetic variability of production
traits and milk fatty acid contents across days in milk for Walloon Holstein first-parity cows.
J. Dairy Sci. 94:4152-4163.
Bastin, C., S. Loker, N. Gengler, A. Sewalem, and F. Miglior. 2010. Genetic relationships
between body condition score and reproduction traits in Canadian Holstein and Ayrshire
first-parity cows. J. Dairy Sci. 93:2215-2228.
Berry, D.P., R.F. Veerkamp, and P. Dillon. 2006. Phenotypic profiles for body weight, body
condition score, energy intake, and energy balance across different parities and concentrate
feeding levels. Livest. Sci. 104:1-12.
Bobe, G., J.A. Minick Bormann, G.L. Lindberg, A.E. Freeman, and D.C. Beitz. 2008. Short
communication: Estimates of genetic variation of milk fatty acids in US Holstein cows. J.
Dairy Sci. 91:1209-1213.
Chilliard, Y., A. Ferlay, R.M. Mansbridge, and M. Doreau. 2000. Ruminant milk fat plasticity:
Nutritional control of saturated, polyunsaturated, trans and conjugated fatty acids. Ann.
Zootech. 49:181-205.
Croquet, C., P. Mayeres, A. Gillon, S. Vanderick, and N. Gengler. 2006. Inbreeding depression
for global and partial economic indexes, production, type, and functional traits. J. Dairy Sci.
89:2257-2267.
de Jong, G. 2005. Usage of predictors for fertility in the genetic evaluation, application in the
Netherlands. INTERBULL Bull. 33:69-73.
de Vries, M.J., and R.F. Veerkamp. 2000. Energy balance of dairy cattle in relation to milk
production variables and fertility. J. Dairy Sci. 83:62-69.
Fischer, T.M., A.R. Gilmour, and H.J.J. van der Werf. 2004. Computing approximate standard
errors for genetic parameters derived from random regression models fitted by average
information REML. Genet. Sel. Evol. 36:363-369.
Grummer, R.R. 1991. Effect of feed on the composition of milk fat. J. Dairy Sci. 74:3244-3257.
Hou, Y., P. Madsen, R. Labouriau, Y. Zhang, M.S. Lund, and G. Su. 2009. Genetic analysis of
days from calving to first insemination and days open in Danish Holsteins using different
models and censoring scenarios. J. Dairy Sci. 92:1229-1239.
INTERBULL. 2011a. Description of national genetic evaluation systems for dairy cattle traits as
applied in different INTERBULL member countries. Accessed on Nov. 3, 2011. http://www-
interbull.slu.se/national_ges_info2/framesida-ges.htm.
INTERBULL. 2011b. INTERBULL routine genetic evaluation for female fertility traits-August 2011.
Accessed on Nov. 3, 2011. http://www-interbull.slu.se/Female_fert/framesida-fert.htm.
ICAR. 2012. International Committee for Animal Recording: ICAR recording guidelines.
Accessed on Mar. 15, 2012. http://www.icar.org/pages/recording_guidelines.htm.

Correlations of days open, production traits, and milk fatty acid contents
101
Mayeres, P., S. Vanderick, C. Croquet, H. Soyeurt, H. Hammami, and N. Gengler. 2006. Genetic
evaluation of female fertility for Walloon dairy and dual purpose cows using a parity random
regression model: First results. INTERBULL Bull. 34:42-46.
Mc Parland, S., P. Schmidely, N.C. Friggens, G. Banos, H. Soyeurt, M.P. Coffey, E. Wall, R.F.
Veerkamp, and D.P. Berry. 2011. Relationship between milk fatty acids and body energy
status in Holstein dairy cows. Agricultural Research Forum, Tullamore, Ireland.
Miglior, F., B.L. Muir, and B.J. Van Doormaal. 2005. Selection indices in Holstein cattle of
various countries. J. Dairy Sci. 88:1255-1263.
Misztal, I. 2010. BLUPF90 family of programs. University of Georgia. Accessed on Mar. 25,
2010. http://nce.ads.uga.edu/~ignacy/newprograms.html.
Negussie, E., I. Strandén, and E.A. Mäntysaari. 2008. Genetic association of clinical mastitis with
test-day somatic cell score and milk yield during first lactation of Finnish Ayrshire cows. J.
Dairy Sci. 91:1189-1197.
Palmquist, D.L., A.D. Baulieu, and D.M. Barbano. 1993. Feed and animal factors influencing
milk fat composition. J. Dairy Sci. 76:1753-1771.
Soyeurt, H., F. Dehareng, N. Gengler, S. McParland, E. Wall, D. P. Berry, M. Coffey, and P.
Dardenne. 2011. Mid-infrared prediction of bovine milk fatty acids across multiple breeds,
production systems, and countries. J. Dairy Sci. 94:1657-1667.
Soyeurt, H., A. Gillon, S. Vanderick, P. Mayeres, C. Bertozzi, and N. Gengler. 2007. Estimation
of heritability and genetic correlations for the major fatty acids in bovine milk. J. Dairy Sci.
90:4435-4442.
Stoop, W.M., H. Bovenhuis, J.M.L. Heck, and J.A.M. van Arendonk. 2009. Effect of lactation
stage and energy status on milk fat composition of Holstein-Friesian cows. J. Dairy Sci.
92:1469-1478.
Stoop, W.M., J.A.M. van Arendonk, J.M.L. Heck, H.J.F. van Valenberg, and H. Bovenhuis. 2008.
Genetic parameters for major fatty acids and milk production traits of Dutch Holstein-
Friesians. J. Dairy Sci. 91:385-394.
Van Haelst, Y.N.T., A. Beeckman, A.T.M. Van Knegsel, and V. Fievez. 2008. Short
communication: Elevated concentrations of oleic acid and long-chain fatty acids in milk fat
of multiparous subclinical ketotic cows. J. Dairy Sci. 91:4683-4686.
VanRaden, P.M., A.H. Sanders, M.E. Tooker, R.H. Miller, H.D. Norman, M.T. Kuhn, and G.
R. Wiggans. 2004. Development of a national genetic evaluation for cow fertility. J. Dairy Sci.
87:2285-2292.
Veerkamp, R.F., and B. Beerda. 2007. Genetics and genomics to improve fertility in high
producing dairy cows. Theriogenology 68(Suppl. 1):S266-S273.
Veerkamp, R.F., E.P.C. Koenen, and G. de Jong. 2001. Genetic correlations among body
condition score, yield, and fertility in first-parity cows estimated by random regression
models. J. Dairy Sci. 84:2327-2335.
Wall, E., S. Brotherstone, J.A. Woolliams, G. Banos, and M.P. Coffey. 2003. Genetic evaluation
of fertility using direct and correlated traits. J. Dairy Sci. 86:4093-4102.
Walsh, S.W., E.J. Williams, and A.C.O. Evans. 2011. A review of the causes of poor fertility in
high milk producing dairy cows. Anim. Reprod. Sci. 123:127-138.
Weigel, K.A. 2006. Prospects for improving reproductive performance through genetic selection.
Anim. Reprod. Sci. 96:323-330.
Williams, P. 2007. Near-infrared technology, Getting the best out of light. PDK Grain, Nanaimo,
BC, Canada.
Windig, J.J., M.P.L. Calus, B. Beerda, and R. F. Veerkamp. 2006. Genetic correlations between
milk production and health and fertility depending on herd environment. J. Dairy Sci.
89:1765-1775.


Chapter 8. General discussion, conclusion
and future prospects
Outline
Chapters 2 to 7 supported the interest of both BCS and milk FA profile as indicator traits to enhance indirect selection of reproductive performance in dairy cows. The objectives of the present Chapter are to compile results obtained throughout this work and to explore the opportunity of using BCS and milk FA as indicator traits of female fertility in dairy cows.
Towards these objectives, the following points will be addressed. First, selection for fertility will be discussed. Second, the criteria for a trait to be used as an indicator trait will be examined in the light of the results obtained in this thesis. Third, the benefit of using BCS and milk FA as indicator traits of fertility will be assessed. Fourth, the consequences of including BCS and milk FA in current breeding programs will be discussed. Finally, general conclusion and future prospects will be drawn.

Chapter 8
104
About the selection for fertility
A multitude of studies in dairy cattle (Pryce and Veerkamp, 2001) showed that antagonistic
phenotypic and genetic correlations of fertility traits with milk yield would lead to a decline in
cow fertility, if selection is for milk only. Therefore, in addition to the adjustment of fertility
management practices, incorporation of fertility in selection breeding goal is a long-term,
sustainable solution to declining fertility in dairy cattle. Genetic selection for functional traits such
as fertility has been practiced for more than 2 decades in some Scandinavian countries. The
selection was based on total merit indexes including production, fertility and health traits and has
proven to be effective in maintaining functional efficiency of the cows simultaneously with a
sharp increase in production (Philipsson and Lindhé, 2003). To date, most leading dairy cattle
breeding programs have included fertility in their selection indexes (Veerkamp and Beerda,
2007).
Pryce et al. (2004) stated that good fertility in dairy cows is the accomplishment of pregnancy at
the desired time. Moreover, Kadarmideen et al. (2003) indicated that characters of good cow
fertility can be defined as cows that show visible signs of heat at the right time after calving and
that conceive when inseminated the first time. Fertility measures calculated from calving and
insemination dates can be divided into two categories: the fertility scores (e.g., non-return rate to
first service, conception at first service) and the interval traits (e.g., calving interval, days to first
service or first heat, days open; Pryce et al., 2004). Endocrine measures have been also described
such as the milk progesterone to determine the commencement of luteal activity (Royal et al.,
2002). Although selection on fertility traits free of management bias (e.g., traits not related to the
voluntary waiting period) should be desirable, calving intervals are the only readily available
fertility records for routine evaluations in several countries (Veerkamp and Beerda, 2007).
Jamrozik et al. (2005) indicated that reproductive performance of a cow is an array of several
traits measuring different aspects of reproduction. However, favorable moderate to high genetic
correlations have been reported among fertility traits indicating that overall improvement of
fertility can be achieved using interval and/or fertility score traits.
Fertility is of economic importance and present sufficient genetic variation for effective selection
(Pryce and Veerkamp, 2001). However, fertility traits are of low heritability (Veerkamp and
Beerda, 2007), might be difficult to record, and are susceptible to poor data quality. Hence,
indirect selection using indicator traits can enhance the accuracy of selection and thus the genetic
gain on fertility.
BCS and milk FA fulfill conditions to be considered as indicator
traits for fertility
In 1989, Shook reported that a marker (or indicator) trait may be used if it has a high genetic
correlation with an economically important trait and if it has either a lower recording cost, a
higher heritability, or can be measured earlier in life than the economically important trait it
represents. Results obtained throughout this work provided evidences that BCS and milk FA
fulfill these criteria.

General discussion, conclusion and future prospects
105
In Chapters 3 and 7, it has been verified that BCS and FA content in milk were genetically
correlated with fertility:
Genetic correlations between BCS and fertility were assessed for first-parity Canadian
cows. Estimates between BCS and interval fertility traits (days from calving to first
service, days from first service to conception, and DO) were negative and ranged between
-0.77 and -0.58 for Ayrshire, and between -0.31 and -0.03 for Holstein. Genetic
correlations between BCS and 56 days non return rate at first insemination were positive
and ranged between 0.16 and 0.24 for Ayrshire and between 0.45 and 0.54 for Holstein.
Estimates were generally larger in mid and late lactation than in the immediate
postpartum period. Overall, genetic correlations were favorable suggesting that a higher
BCS would decrease the number of days that the cow was not pregnant and would
increase the chances of the cow to conceive at first service.
Genetic correlations between FA contents in milk and days open were estimated for first-
parity Walloon Holstein cows and verified that FA contents in milk and fertility were
genetically correlated. Correlations between days open and contents in milk of 17 group
and individual FA ranged from -0.37 to 0.39. Estimates varied greatly according to the
trait and the lactation stage. Genetic correlations with DO for the content in milk of
unsaturated FA, monounsaturated FA, long-chain FA, C18:0, and C18:1 cis-9 were
positive in early lactation but negative after 100 DIM. For the other FA, genetic
correlations with DO were negative across the whole lactation. The strongest correlation
was observed for C18:1 cis-9 content in milk at 5 DIM, indicating that higher content of
this FA in milk during the postpartum period would be related to higher interval from
calving to conception. Therefore, the content in milk of C18:1 cis-9 in early lactation
might serve as indicator trait of fertility.
Moreover, both BCS and milk FA could be potentially recorded at low cost:
Body condition can be visually scored on freely moving cattle (Edmonson et al., 1989) by
dairy farmers, veterinarians, field staff, or classifiers. Decision charts are generally based
on the observation and the tactile appraisal of a restricted number of body locations
(Edmonson et al., 1989; Ferguson et al., 1994) to keep the BCS measurement easy and
quick. Therefore, BCS can be collected under different circumstances: by trained staff in
a limited number of herds (e.g., Berry et al., 2003a), by milk recording agencies (e.g.,
Loker et al., 2011), by producers and consultants (e.g., Dechow et al., 2001), and most
frequently by classifiers (e.g., Jones et al., 1999; Pryce and Harris, 2006; Zink et al.,
2011). However, time constraints remain and BCS as a frequent, repeated measure on-
farm procedure is generally not nation-wide adopted (Bewley and Schutz, 2008). Also,
because BCS is a subjective recorded trait, training and validation of assessors before
comparing BCS obtained from different scorers in different herds are often required
(Bewley and Schutz, 2008) and might generate extra costs.
The reference analysis for milk FA, gas chromatography, requires skilled staff and is
expensive and time-consuming. However, recent studies (Soyeurt et al., 2006; Rutten et
al., 2009) provided evidences of the potential of using mid-infrared spectrometry to
quantify FA content in cow milk. Because of its use by regular milk recording to quantify
major milk components (i.e., fat, protein, urea, and lactose) and its proven robustness
(Soyeurt et al., 2011), this technology offers the opportunity to routinely obtain a cheap
and accurate measurement of the major FA content in milk.

Chapter 8
106
In Chapters 3 to 7, BCS and milk FA have been proved to be heritable traits with sufficient
phenotypic and genetic variation to warrant genetic selection:
Genetic variability of BCS in various dairy cow populations has been examined. In
Canada, heritability of BCS collected by field staff ranged from 0.08 to 0.24 for Ayrshire
first-parity cows, from 0.10 to 0.25 for Ayrshire second-parity cows, and from 0.07 to
0.17 for first-parity Holstein cows. In Walloon Holstein population, heritability of BCS
collected by milk recorder ranged from 0.10 to 0.21 in first-parity, from 0.08 to 0.23 in
second-parity, and from 0.10 to 0.31 in third-parity. Also, BCS was the most heritable in
mid to late lactation.
The genetic variability of FA contents in milk was investigated on Walloon Holstein first-
parity cows. Average daily heritabilities of milk FA content traits ranged from 0.18 to
0.44. Estimates were higher for saturated short- and medium-chain FA than for
monounsaturated long-chain FA. This indicates that de novo synthetized FA were under
stronger genetic control than FA originating from the diet and from body fat mobilization.
Overall, heritabilities were higher in mid and late lactation.
Finally, both BCS and milk FA are generally recorded earlier in life than fertility traits. Intervals
between successive calving are the only available fertility records for routine evaluations in
several places (Veerkamp and Beerda, 2007), including the Walloon Region of Belgium.
Therefore, BCS and milk FA records are more readily available, especially when they are
collected within milk-recording schemes. In such cases, records for these traits are available
within the first months of lactation while the fertility record is only available when the subsequent
lactation starts.
Accuracy in selection for fertility using BCS and milk FA as
indicator traits
In order to investigate the benefit of using BCS and milk FA as indicator traits of fertility, the
accuracy of a fertility index including either DO, BCS, or one FA trait was determined for a bull
having a varying number of daughters.
Schemes of selection and parameters used in the calculations were those for the Walloon Region
of Belgium. The following traits were considered: 1) DO for fertility, as it is the only trait
currently available in the Walloon fertility database used for genetic evaluations; 2) nadir BCS or
“minimum genetic BCS”, since results from Chapter 5 indicated that this trait was moderately
heritable and provided the best correlated response in fertility; 3) content in milk at 5 DIM of 3
major individual FA (C10:0, C12:0, and C18:1 cis-9), since results from Chapter 7 indicated that
these FA showed the strongest genetic correlation with DO in early lactation with reasonable
heritability and genetic standard deviation.
The accuracy in selection based on different schemes was calculated using the selection index
theory (Van Vleck, 1993). The breeding objective was DO. The accuracy of an index for fertility
was estimated for a bull having a varying number of daughters with records (p=20, 100, 200)
under five scenarios: 1) selection on DO; 2) selection on nadir BCS with a varying number of
records per animal; 3) selection on one of the 3 FA traits; 4) selection on nadir BCS and DO; 5)
selection on one of the 3 FA traits and DO. Because FA traits are currently available within milk
recording schemes, the number of records available per cow was set to 8. Two recording schemes

General discussion, conclusion and future prospects
107
were considered for BCS: three times per lactation at specified periods (e.g., calving, first service;
n=3) and at each milk recording (n=8). The scenario in which BCS would be collected once per
lactation (e.g., by classifiers) was not considered because breeding values for nadir BCS are
obtained using a random regression model which requires repeated observations per animal.
Following the selection index theory (Van Vleck, 1993), the accuracy of the index was estimated
as ⁄ where the variance of the breeding objective was and the variance of
the index was . The economic weight on DO was and c was the genetic
variance of DO. The b-values were obtained as . The diagonal elements in matrix
were calculated as (
)
where was the number of records per animal; ,
and were respectively the repeatability, the heritability, and the phenotypic variance of trait i;
was the number of daughters in progeny group; and was the relationship among animals in
progeny groups (0.25). The off-diagonal elements in matrix were calculated as
where and
were respectively the phenotypic and genetic covariance between traits i and j.
Finally, the elements in were calculated as where was the relationship among animals in
progeny group and the bull (a=0.5). Parameters used in calculations were obtained throughout this
work for Walloon first-parity cows and are provided in Table 22.
Table 22. Assumed genetic standard deviation ( ), heritability ( ), repeatability ( ), and
phenotypic ( ) and genetic ( ) correlations with DO
Trait
Days open 18.432 a 0.05
a - - -
Nadir body condition score 0.326 b 0.21
b 0.54
b -0.35
c -0.08
c
C10:0 at 5 days in milk (g/dl) 0.01185 d 0.26
d 0.64
d -0.37
a -0.08
a
C12:0 at 5 days in milk (g/dl) 0.01494 d 0.25
d 0.63
d -0.35
a -0.08
a
C18:1 cis-9 at 5 days in milk (g/dl) 0.07667 d 0.13
d 0.63
d 0.39
a 0.04
a
a Inferred from Chapter 7; b Inferred from Chapter 5; c Inferred from Bastin et al., 2012; d Inferred from Chapter 6
As expected, direct selection on DO seemed to provide the best accuracy of the fertility index in
all the scenarios with only one trait (Table 23). In Wallonia, DO is often estimated using the next
calving date by subtracting 280 days from the calving interval. Therefore, DO records can only be
validated for a cow that had the opportunity to calve again. As a consequence, a certain period is
required to obtain and validate this phenotype. Also, records for animals with the worst fertility
(infinite DO) cannot be easily integrated. Hence, using BCS and FA traits in a fertility index
would allow to operate more rapidly an indirect selection on fertility performances.
Three additional points are striking from Table 23. First, increasing the number of BCS records
did not provide substantial gain in accuracy of the index. Therefore, body condition scoring at
specified periods of the lactation could be sufficient to enhance indirect selection for fertility.
Second, an index including either the content in milk of C18:1 cis-9 at 5 DIM, the content in milk
of C10:0 at 5 DIM, or the content in milk of C12:0 at 5 DIM showed similar, even higher,
accuracy than an index including only nadir BCS. Because selection response is proportional to
the accuracy of the index, indirect selection on milk FA could provide similar response on fertility
than indirect selection on BCS. Milk FA could therefore substantiate for BCS as an indirect
indicator of fertility. This last point is of special interest for dairy farmers since milk FA could be
routinely collected within milk recording schemes and would be therefore more readily available
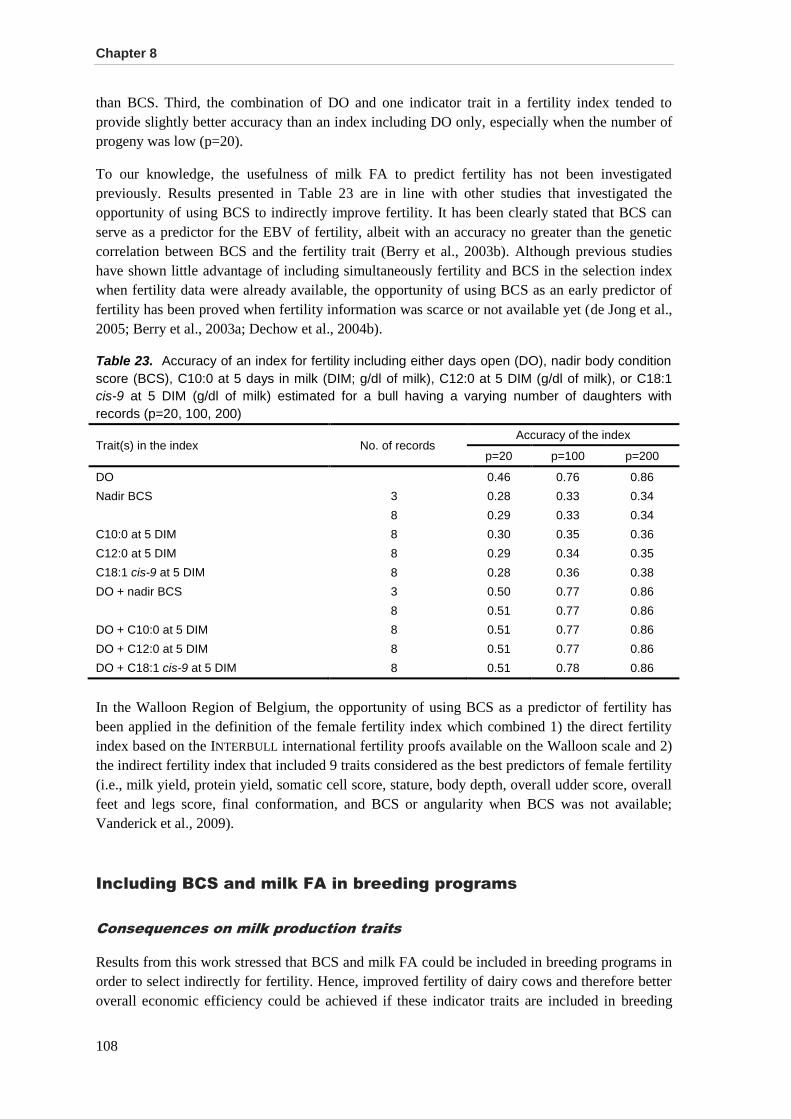
Chapter 8
108
than BCS. Third, the combination of DO and one indicator trait in a fertility index tended to
provide slightly better accuracy than an index including DO only, especially when the number of
progeny was low (p=20).
To our knowledge, the usefulness of milk FA to predict fertility has not been investigated
previously. Results presented in Table 23 are in line with other studies that investigated the
opportunity of using BCS to indirectly improve fertility. It has been clearly stated that BCS can
serve as a predictor for the EBV of fertility, albeit with an accuracy no greater than the genetic
correlation between BCS and the fertility trait (Berry et al., 2003b). Although previous studies
have shown little advantage of including simultaneously fertility and BCS in the selection index
when fertility data were already available, the opportunity of using BCS as an early predictor of
fertility has been proved when fertility information was scarce or not available yet (de Jong et al.,
2005; Berry et al., 2003a; Dechow et al., 2004b).
Table 23. Accuracy of an index for fertility including either days open (DO), nadir body condition
score (BCS), C10:0 at 5 days in milk (DIM; g/dl of milk), C12:0 at 5 DIM (g/dl of milk), or C18:1
cis-9 at 5 DIM (g/dl of milk) estimated for a bull having a varying number of daughters with
records (p=20, 100, 200)
Trait(s) in the index No. of records Accuracy of the index
p=20 p=100 p=200
DO 0.46 0.76 0.86
Nadir BCS 3 0.28 0.33 0.34
8 0.29 0.33 0.34
C10:0 at 5 DIM 8 0.30 0.35 0.36
C12:0 at 5 DIM 8 0.29 0.34 0.35
C18:1 cis-9 at 5 DIM 8 0.28 0.36 0.38
DO + nadir BCS 3 0.50 0.77 0.86
8 0.51 0.77 0.86
DO + C10:0 at 5 DIM 8 0.51 0.77 0.86
DO + C12:0 at 5 DIM 8 0.51 0.77 0.86
DO + C18:1 cis-9 at 5 DIM 8 0.51 0.78 0.86
In the Walloon Region of Belgium, the opportunity of using BCS as a predictor of fertility has
been applied in the definition of the female fertility index which combined 1) the direct fertility
index based on the INTERBULL international fertility proofs available on the Walloon scale and 2)
the indirect fertility index that included 9 traits considered as the best predictors of female fertility
(i.e., milk yield, protein yield, somatic cell score, stature, body depth, overall udder score, overall
feet and legs score, final conformation, and BCS or angularity when BCS was not available;
Vanderick et al., 2009).
Including BCS and milk FA in breeding programs
Consequences on milk production traits
Results from this work stressed that BCS and milk FA could be included in breeding programs in
order to select indirectly for fertility. Hence, improved fertility of dairy cows and therefore better
overall economic efficiency could be achieved if these indicator traits are included in breeding
General discussion, conclusion and future prospects
109
programs. However, giving emphasis to such traits in the breeding objective would have
consequences on other economically important traits, especially production (milk, fat and protein
yields).
It is widely recognized that BCS and milk production are unfavorably correlated; implying that
selection for higher BCS to improve fertility would lead to lower production. A compilation of
studies in Chapter 2 showed that, although the range of estimates among studies was large, the
genetic correlations between production traits and BCS were moderate (-0.37 with lactation milk
yield, -0.27 with lactation fat yield, and -0.31 with lactation protein yield). Also, some studies
have shown that, after adjusting for milk yield, BCS was still favorably correlated with fertility
(Pryce et al., 2002; Berry et al., 2003). Besides, it has been suggested in Chapter 5 that selection
for higher nadir BCS would have little impact on production, since the genetic correlations with
milk, fat, and protein 305d yields were respectively -0.13, -0.18, and -0.04. Therefore, it could be
possible to select for high producing cows with improved BCS and fertility.
In Chapter 6, genetic correlations between test-day milk yield and milk FA across DIM were
estimated. Correlations at 5 DIM between milk yield and content in milk of C10:0, C12:0, and
C18:1 cis-9 were respectively -0.34, -0.35, and 0.06. Given the genetic correlations in Table 22,
selection on lower content in milk of C18:1 cis-9, and higher content in milk of C10:0 and C12:0
would be required to improve DO. Therefore, such selection would impact negatively milk yield
in early lactation. However, further studies are required to assess the genetic correlations of milk
FA with 305d yields.
To summarize, despite the fact that relationships among fertility indicator traits and milk
production traits might be unfavorable, these genetic correlations are different from 1, suggesting
that, using appropriate weights in total merit indexes, both groups of traits could be included in
breeding programs to be improved by genetic selection. Indeed, Berry et al. (2003a) demonstrated
that, using optimum economic values for traits in the total merit index, continued selection for
increased milk production could be achieved without any deleterious effects on fertility or
averaged BCS, albeit genetic merit for milk production would increase at a slower rate. Bastin et
al. (2011) further suggested that giving emphasis to nadir BCS in a total merit index did not affect
greatly traits other than fertility as genetic correlations with these traits were low.
Selection for BCS
The inclusion of BCS and milk FA in breeding programs has been widely discussed regarding
their usefulness as indicator traits for fertility. Besides, the relationships of both groups of traits
with other economically important traits as well as their direct/implicit economic importance have
to be examined.
As for fertility, it has been reported that selection for higher BCS during the lactation would be
required to improve health (Lassen et al., 2003; Dechow et al., 2004a; Koeck et al., 2012).
Although genetic correlation estimates among BCS and health traits are scarce in the literature, it
has been reported that cows with high merit for BCS are genetically less susceptible to diseases.
Koeck et al. (2012) reported moderate favorable genetic correlations between average level of
BCS over the lactation and disease events indicating that cows with higher BCS may have fewer
cases of disease, especially of mastitis, ketosis, displaced abomasum, and metritis. Roche et al.
(2009) reported that the relationship of health with cow EB status and BCS may manifest itself in
2 ways. First, thin cows or cows in severe negative EB may be more susceptible to infection

Chapter 8
110
(causal relationship). Second, “unhealthy” animals may have a reduced dry matter intake and a
resultant greater BCS mobilization to satisfy the drive to milk (associative relationship).
Moreover, genetically higher BCS would be also required to improve direct calving ease as well
as maternal and direct calf survival (Chapter 3). Since Roche et al. (2009) reported that lipolysis is
primarily regulated genetically whereas lipogenesis is environmentally controlled, it is worth
noting that a genetically high BCS would rather reflect the ability of the cow to limit the body fat
mobilization than its ability to store fat.
Moreover, as mentioned in Chapter 2, we should bear in mind that BCS is an intermediate
optimum trait. Bewley and Schutz (2008) stated that the ideal BCS is the level of body fat that
allows the cow to optimize milk production while simultaneously minimizing metabolic and
reproductive disorders. In particular, the BCS in which a cow calves is of great importance. Roche
et al. (2009) proposed an optimum calving BCS of 3.0 to 3.25 (5-point scale); similar target
values (5 to 6 on the 9-point scale) are recommended by the Walloon Breeding Association
(Chapter 2). Roche et al. (2009) further indicated that calving BCS < 3 (5-point scale) is
associated with reduced production and reproduction; whereas calving BCS ≥ 3.5 (5-point scale)
is associated with a reduction in early lactation dry matter intake, excessive loss of energy
reserves during early lactation and increased risk of periparturient metabolic disorders such as
ketosis. Also, it is commonly assumed that overconditioned cows before calving are at a greater
risk of calving difficulty (Chassagne et al., 1999). Results from Chapter 3 and 4 further suggested
that genetically higher BCS at calving would be related to dystocia.
Furthermore, BCS could be identified by consumers as an important indicator of animal well-
being. It is often suggested that the welfare of some dairy cows is, at times, compromised by
being in poor BCS (Roche et al., 2009). Bewley and Schutz (2008) concluded that nutritional,
management, and genetic programs should be designed with a long-term view of the general
consumers concerns with regards to BCS.
To sum up, although genetic selection for higher BCS during the lactation would be required to
improve fertility, health and public perception of dairy cows welfare, we should keep in mind that
BCS is an intermediate optimum trait. This is of particular importance for calving BCS which has
been demonstrated to affect greatly the accomplishment of the ensuing lactation. Such issues have
to be accounted for in comprehensive breeding schemes.
Selection for FA
In addition to its link with energy balance status and fertility, milk fat composition is of
importance to issues related to nutritional, physical and organoleptic properties of milk (Chilliard
et al., 2000). Milk FA profile could also provide valuable information on the methane production
of dairy cows (Dijkstra et al., 2011). Yet the direct economic value of milk FA remains unclear
because most of the milk producers do not receive bonuses or penalties with respect to the FA
profile in milk. Furthermore, the desirable direction of change of FA contents in milk should be
defined. For instance, consumption of C18:1 cis-9 is considered to be favorable to human health
because it lowers plasma cholesterol, low-density lipoprotein cholesterol and triacylglycerols.
Moreover replacement of SFA with cis-UFA would reduce the risk of coronary artery disease
(Haug et al., 2007; Ebringer et al., 2008). Hence, higher content in milk of C18:1 cis-9 would be
desirable in regard to the nutritional properties of milk fat while lower content of C18:1 cis-9 at 5
DIM would be desirable for improved fertility. However, results inferred from Chapter 6

General discussion, conclusion and future prospects
111
indicated that the genetic correlation between content in milk of C18:1 cis-9 at 5 DIM and its
content at 50, 100, 200, and 300 DIM were respectively 0.96, 0.75, 0.27, and 0.31. It may
therefore be suggested that the content in milk of C18:1 cis-9 at 5 DIM could be lowered for
improved fertility while restricting the decrease in average MUFA content in milk.
To conclude, the inclusion of BCS and milk FA within breeding schemes has to be considered in
the light of the overall breeding goal, their economic value, their relationships with all
economically important traits as well as their desirable direction of change.
General conclusion
The main conclusions from this thesis are:
Body condition score presented a moderate heritability and it was the most heritable in
mid to late lactation.
Contents in milk of the major individual FA and groups of FA were moderately heritable.
Heritability estimates were the highest in mid to late lactation. De novo synthetized FA
presented higher heritability estimates than FA originating from the diet and from body
fat mobilization. Also, the general pattern of genetic correlations among FA traits
emphasized the combination of FA according to their origin.
The genetic correlation between BCS and fertility was low to moderate and favorable: a
lower BCS, especially in mid to late lactation, would increase the number of days that the
cow was not pregnant and would decrease the chances of the cow to conceive at first
service.
The genetic correlation between DO and content in milk of FA originating from body fat
mobilization (e.g., C18:1 cis-9) was positive and low to moderate in early lactation but
negative after 100 DIM. For the other FA, genetic correlations with DO were negative
across the whole lactation.
The general pattern of correlation estimates between BCS and DO on the one hand and
between BCS and milk FA contents on the other hand substantiated the known
relationship between negative energy balance and poor fertility. In early lactation, when
the difference between energy intake and expenditure is negative, cows mobilized tissue
reserves in response to the energy deficit. Mobilization of body reserves results in BCS
loss and in a release of long-chain FA in milk. Concomitantly, the high uptake of long-
chain FA in milk inhibits de novo synthesis by mammary gland tissue.
Genetic correlation between calving traits and BCS during the subsequent lactation was
moderate and favorable. It indicates that cows with a genetically high BCS over the
lactation would have a greater chance of producing a calf that survived and would
transmit the genes that allow the calf to be born more easily and to survive. However,
higher BCS before calving would increase the chance of the cow to experience calving
difficulty.
Because BCS is an intermediate optimum trait, selection for higher nadir BCS (i.e.,
selection against the extent of BCS loss) was suggested as a good option to change BCS
curve.
Indicator traits based on BCS and milk FA profile (i.e., nadir BCS and content in milk at
5 DIM of C10:0, C12:0 and C18:1 cis-9) have been proved to be very useful to
supplement the prediction of genetic merit for female fertility.

Chapter 8
112
Implications
Research from this thesis showed that BCS and FA contents in milk presented moderate
heritability estimates with sufficient genetic variation to warrant genetic selection. This thesis also
contributed to the understanding of the genetic association between reproduction traits on the one
hand and BCS and milk FA contents on the other hand. Random regression models were used and
allowed the estimation of changes of genetic correlations over the lactation between longitudinal
traits (i.e., BCS and milk FA because there are several records over the lactation) and traits that
are measured as a single lactation record (i.e., reproduction traits). Finally, to our knowledge, the
genetic association between calving traits and BCS evolution before and after calving has not
been investigated previously.
Research undertaken during this thesis permits the development of a genetic evaluation for BCS
in the Walloon Region of Belgium. Since August 2011, Walloon dairy producers can include BCS
as a part of their breeding decision. Also, the development of a genetic evaluation for BCS
allowed the Walloon Region to take part of the international genetic evaluation for BCS
performed by INTERBULL. Finally, the opportunity of using BCS as a predictor of fertility has
been made concrete in the definition of the Walloon female fertility index.
Future research
This thesis contributed to a better understanding of body condition score and milk fatty acids as
indicators of dairy cattle reproductive performances. It also showed different further directions of
research:
to investigate the additional aspects of the genetic association among BCS and milk FA
(Bastin et al., 2012);
to explore other fertility indicator traits such as the mid-infrared prediction of energy
balance (McParland et al., 2011);
given the complexity of relationships among milk FA traits (i.e., across the lactation), to
add knowledge on the genetic correlations among milk FA traits using adapted
multivariate random regression models;
to adapt the Walloon genetic evaluation for BCS for data collected through various
channels (i.e., classifiers, dairy producers, milk recording agents);
and finally, to assess proper economic values for traits of interest, especially for BCS and
milk FA traits in order to explore opportunities to include these traits in future breeding
programs.

General discussion, conclusion and future prospects
113
Summary
The aim of this work was to investigate the use of BCS and milk FA as indicator traits to
indirectly improve female fertility.
First, a literature review on the genetic variability of BCS and its genetic correlation with traits of
economic importance was provided in Chapter 2.
According to the present scientific literature, BCS meets all criteria required for indirect
improvement of health and fertility. First, heritability and genetic variation estimates from
literature are sufficient to support BCS as a trait suitable for breeding programs of dairy
cattle. Second, although BCS is a subjectively measured trait, it is both easy and quick to
record. Third, genetic correlations between BCS and fertility are favorable and moderate
to strong. Cows that mobilize more body reserves and exhibit lower BCS during lactation
are genetically more disposed to fertility problems. Consequently, selection for higher
levels of BCS would indirectly improve fertility of dairy cows using an appropriate
selection index.
Genetic correlations among BCS and reproduction traits (both fertility and calving traits) were
then estimated using records from Canadian Holstein and Ayrshire cows in Chapters 3 and 4.
The originality of this study lied in the use of random regression models to estimate the
genetic correlations between BCS (as a trait measured several times over the lactation)
and reproduction traits that are measured as single lactation records. Briefly, results
suggested low to moderate favorable genetic relation between BCS and fertility in first-
parity cows: a lower BCS, especially in mid to late lactation, would increase the number
of days that the cow was not pregnant and would decrease the chances of the cow to
conceive at first service (Chapter 3). Furthermore, genetic correlations between calving
traits and BCS during the subsequent lactation of first-parity cows were moderate and
favorable. These estimates indicate that cows with a genetically high BCS over the
lactation would have a greater chance of producing a calf that survived and would
transmit the genes that allowed the calf to be born more easily and to survive (Chapter 3).
Finally, genetic correlations between calving traits and BCS before and after calving for
second-parity Ayrshire cows indicated that higher BCS before calving would increase the
chance of the cow to experience calving difficulty (Chapter 4).
Since previous results provided evidences of the genetic association between BCS and
reproduction and implied the opportunity of using BCS in a breeding program as an indicator trait
to improve reproduction, the development of a genetic evaluation for BCS in the Walloon Region
of Belgium was investigated in Chapter 5.
First, this study undertook the estimation of genetic parameters for BCS of Walloon
Holstein cows in parity 1 to 3. Results supported that BCS is a moderately heritable trait.
Also, the model used for the genetic evaluation of BCS was defined. The second
objective of this study was to develop a method for expressing BCS breeding values as an
indicator optimizing the genetic gain on fertility. Results indicated that selection for
higher “minimum genetic BCS” (i.e., selection against the extent of BCS loss) would lead
to a similar response to selection than selecting directly on the fertility trait (i.e.,
pregnancy rate). Finally, the development of a genetic evaluation for BCS allowed the
Walloon Region to take part of the international genetic evaluation for BCS performed by
INTERBULL.

Chapter 8
114
Results from Chapters 3 to 5 supported the interest of BCS as a useful trait to improve robustness
and reproductive performances of dairy cows. However, routine scoring and recording of BCS is
not a common practice in most dairy farms. On the other hand, milk composition data are more
readily available since they are obtained from milk recording which occurs several times over the
lactation. Furthermore, milk FA are thought to be related to energy balance status of cows in early
lactation and they are available through routine milk recording schemes. Therefore, the
phenotypic and genetic variability of milk FA (Chapter 6) and the genetic correlations between
fertility and FA (Chapter 7) were investigated.
Results in Chapter 6 showed that the FA profile in milk changed both phenotypically and
genetically during the lactation. Also, de novo synthetized FA were under stronger
genetic control than FA originating from the diet and from body fat mobilization. Results
in Chapter 7 substantiated the known unfavorable relationship between fertility and
negative energy balance status, explained by the release of long-chain FA in early
lactation, from the mobilization of body fat reserves and the consequent inhibition of de
novo FA synthesis in the mammary gland.
Chapters 2 to 7 supported the interest of both BCS and FA as indicator traits to enhance indirect
selection of reproductive performance in dairy cows. Chapter 8 explored and discussed the
opportunity of using BCS and milk FA as indicator traits of female fertility in dairy cows.
Indicator traits based on BCS and milk FA profile (i.e., nadir BCS and content in milk at
5 DIM of C10:0, C12:0 and C18:1 cis-9) has been proved to be very useful to supplement
the prediction of genetic merit for female fertility although their inclusion within breeding
schemes has to be considered in the light of the overall breeding goal, their economic
value, their relationships with all economically important traits as well as their desirable
direction of change.
References
Bastin, C., D.P. Berry, M.P. Coffey, E. Strandberg, J.I. Urioste, R.F. Veerkamp, and N. Gengler.
2011. Consequences of selection for milk quality and robustness traits. INTERBULL Bull.
44:195-199.
Bastin, C., D. Berry, H. Soyeurt, and N. Gengler. 2012. Use of milk fatty acids to substitute for
body condition score in breeding purposes. J. Dairy Sci. 95 (Suppl. 2):683. (Abstr.)
Berry D.P., F. Buckley, P. Dillon, R.D. Evans, M. Rath, and R.F. Veerkamp. 2003a. Genetic
relationships among body condition score, body weight, milk yield, and fertility in dairy
cows. J. Dairy Sci. 86:2193-2204.
Berry D.P., F. Buckley, P. Dillon, R.D. Evans, M. Rath, and R.F. Veerkamp. 2003b. Genetic
parameters for body condition score, body weight, milk yield, and fertility estimated using
random regression models. J. Dairy Sci. 86:3704-3717.
Bewley J.M. and M.M. Schutz. 2008. Review: An interdisciplinary review of body condition
scoring for dairy cattle. The Prof. Anim. Sci. 24:507-529.
Chassagne, M., J. Barnouin, and J.P. Chaconac. 1999. Risk factors for stillbirth in Holstein heifers
under field conditions in France: A prospective survey. Theriogenology 51:1477-1488.
Chilliard Y., A. Ferlay, R.M. Mansbridge, and M. Doreau. 2000. Ruminant milk fat plasticity:
nutritional control of saturated, polyunsaturated, trans and conjugated fatty acids. Ann.
Zootech. 49:181-205.

General discussion, conclusion and future prospects
115
Dechow C.D, G.W. Rogers, and J.S. Clay. 2001. Heritabilities and correlations among body
condition 441 scores, production traits, and reproductive performance. J. Dairy Sci. 84:266-
275.
Dechow C.D., G.W. Rogers, U. Sander-Nielsen, L. Klei, T.J. Tawlor, J.S. Clay, A.E. Freeman, G.
Abdel-Azim, A. Kuck, and S. Schnell. 2004a. Correlations among body condition scores
from various sources, dairy form, and cow health from the United States and Denmark. J.
Dairy Sci. 87:3526-3533.
Dechow C.D., G.W. Rogers, L. Klei, T.J. Lawlor, and P.M. VanRaden. 2004b. Body condition
scores and dairy form evaluations as indicators of days open in US Holsteins. J. Dairy Sci.
87:3534-3541.
de Jong G. 2005. Usage of predictors for fertility in the genetic evaluation, application in the
Netherlands. INTERBULL Bull. 33:69-73.
Dijkstra J., S.M. van Zijderveld, J.A. Apajalahti, A. Bannink, W.J.J. Gerrits, J.R. Newbold, H.B.
Perdok, and H. Bernends. 2011. Relationships between methane production and milk fatty
acid profile in dairy cattle. Anim. Feed Sci. Technol. 166-167:590-595.
Ebringer, L., M. Ferenčík, and J. Krajčovič. 2008. Beneficial health effects of milk and fermented
dairy products - review. Folia Microbiol. 53:378-394.
Edmonson A. J., I. J. Lean, L. D. Weaver, T. Farver, and G. Webster. 1989. A body condition
scoring chart for Holstein dairy cows. J. Dairy Sci. 72:68-78.
Ferguson J. D., D. T. Galligan, and N. Thomsen. 1994. Principal descriptors of body condition
score in Holstein cows. J. Dairy Sci. 77:2698-2703.
Haug, A., A.T. HØstmark, and O.M. Harstad. 2007. Bovine milk in human nutrition - a review.
Lipids Health Dis, 6:25.
Jamrozik, J., J. Fatehi, G.J. Kistemaker, and L.R. Schaeffer. 2005. Estimates of genetic
parameters for Canadian Holstein female reproduction traits. J. Dairy Sci. 88:2199-2208.
Jones H.E., I.M.S. White, and S. Brotherstone. 1999. Genetic evaluation of Holstein Friesian sires
for daughter condition-score changes using a random regression model. Anim. Sci. 68:467-
475.
Kadarmideen H.N., R. Thompson, M.P. Coffey, and M. A. Kossaibati. 2003. Genetic parameters
and evaluations from single- and multiple-trait analysis of dairy cow fertility and milk
production. Livest. Prod. Sci. 81:183-195.
Koeck A., F. Miglior, D.F. Kelton, and F.S. Schenkel. 2012. Short communication: genetic
association of body condition score with disease resistance in first lactation Canadian
Holsteins. Can. J. Anim. Sci. 92:285-289.
Lassen J., M. Hansen, M.K. SØrensen, G.P. Aamand, L.G. Christensen, and P. Madsen. 2003.
Genetic relationship between body condition score, dairy character, mastitis, and diseases
other than mastitis in first-parity Danish Holstein cows. J. Dairy Sci. 86:3730-3735.
Loker S., C. Bastin, F. Miglior, A. Sewalem, L.R. Schaeffer, J. Jamrozik, and V. Osborne. 2011.
Short communication: estimates of genetic parameters of body condition score in the first 3
lactations using a random regression animal model. J. Dairy Sci. 94:3693-3699.
McParland, S., G. Banos, E. Wall, M.P. Coffey, H. Soyeurt, R.F. Veerkamp, and D.P. Berry.
2011. The use of mid-infrared spectrometry to predict body energy status of Holstein cows.
J. Dairy Sci. 94:3651-3661.
Philipsson, J. and B. Lindhé. 2003. Experiences of including reproduction and health traits in
Scandinavian dairy cattle breeding programmes. Livest. Prod. Sci. 83:99-112.
Pryce, J.E. and R.F. Veerkamp. 2001. The incorporation of fertility indices in genetic
improvement programs. BSAS Occasional Publication 26:237-250.
Pryce, J.E., M.P. Coffey, S.H. Brotherstone, and J.A. Woolliams. 2002. Genetic relationships
between calving interval and body condition score conditional on milk yield. J. Dairy Sci.
85:1590-1595.
Pryce, J.E., M.D. Royal, P.C. Garnsworthy, and I.L. Mao. 2004. Fertility in the high-producing
dairy cow. Livest. Prod. Sci. 86:125-135.

Chapter 8
116
Pryce, J. E., and B.L. Harris. 2006. Genetics of body condition score in New Zealand dairy cows.
J. Dairy Sci. 89:4424-4432.
Roche, J.R., N.C. Friggens, J.C. Kay, M.W. Fisher, K.J. Stafford, and D.P. Berry. 2009. Invited
review: Body condition score and its association with dairy cow productivity, health, and
welfare. J. Dairy Sci. 92:5769-5801
Royal M.D., J.E. Pryce, J.A. Woolliams, and A.P.F. Flint. 2002. The genetic relationship between
commencement of luteal activity and calving interval, body condition score, production, and
linear type traits in Holstein-Friesian dairy cattle. J. Dairy Sci. 85:3071-3080.
Rutten, M.J.M., H. Bovenhuis, K.A. Hettinga, H.J.F. van Valenberg, and J.A.M. Van Arendonck.
2009. Predicting bovine milk fat composition using infrared spectroscopy based on milk
samples collected in winter and summer. J. Dairy Sci. 92:6202-6209.
Shook. G.E. 1989. Selection for disease resistance. J. Dairy Sci. 72:1349-1362.
Soyeurt, H., P. Dardenne, F. Dehareng, G. Lognay, D. Veselko, M. Marlier, C. Bertozzi, P.
Mayeres, and N. Gengler. 2006. Estimating fatty acids content in cow milk using mid-
infrared spectrometry. J. Dairy Sci. 89:3690-3695.
Soyeurt, H., F. Dehareng, N. Gengler, S. McParland, E. Wall, D. P. Berry, M. Coffey, and P.
Dardenne. 2011. Mid-infrared prediction of bovine milk fatty acids across multiple breeds,
production systems, and countries. J. Dairy Sci. 94:1657-1667.
Vanderick, S., C. Bastin, N. Gengler. 2009. Expressing female fertility in the Walloon Region of
Belgium: how to do? INTERBULL Bull. 40:10-16.
Van Vleck, L.D. 1993. Selection index and introduction to mixed model methods for genetic
improvement of animals. CRC Press, Boca Raton, FL, USA.
Veerkamp, R.F., and B. Breeda. 2007. Genetics and genomics to improve fertility in high
producing dairy cows. Theriogenology 68S:S266-S273
Zink V., M. Štípková, and J. Lassen. 2011. Genetic parameters for female fertility, locomotion,
body 578 condition score, and linear type traits in Czech Holstein cattle. J. Dairy Sci.
94:5176-5182.

117
List of tables
Table 1. Decision chart for body condition scoring dairy cows in the Walloon Region of Belgium. ...... 12
Table 2. Overview of heritability estimates for body condition score (BCS) from various studies ........ 14
Table 3. Overview of genetic correlation estimates between body condition score (BCS) and
production, type, body weight, diseases, and fertility traits from various studies ......................... 17
Table 4. Descriptive statistics of the edited first-parity Ayrshire data set for each model: BCS with
one of the following traits: calving to first service (CTFS), first service to conception (FSTC),
days open (DO), 56-d nonreturn rate at first insemination (NRR), calving ease (CE), and calf
survival (CS) ...................................................................................................................................... 31
Table 5. Descriptive statistics of the edited Holstein complete data set and the data set used for
parameter estimation (VCE data set) for each model: BCS with one of the following traits:
calving to first service (CTFS), first service to conception (FSTC), days open (DO), 56-d
nonreturn rate at first insemination (NRR), calving ease (CE), and calf survival (CS) ................. 32
Table 6. Genetic variances (×100) and their standard errors (×100) of the constant (i0), the linear
(i1), and the quadratic (i2) Legendre coefficient of BCS1 ............................................................... 37
Table 7. Maternal and direct genetic variances and their standard errors in Ayrshire and Holstein
breeds for the following traits: calving to first service (CTFS), first service to conception
(FSTC), days open (DO), 56-d nonreturn rate at first insemination (NRR), calving ease (CE),
and calf survival (CS)1 ...................................................................................................................... 37
Table 8. Heritabilities of BCS, calving to first service (CTFS), first service to conception (FSTC),
days open (DO), 56-d nonreturn rate at first insemination (NRR), maternal and direct calving
ease (CEm and CEd, respectively), and maternal and direct calf survival (CSm and CSd,
respectively) estimated for Ayrshires and Holsteins ....................................................................... 38
Table 9. Genetic correlations over DIM among first-parity BCS for Ayrshire (above diagonal) and
Holstein (below diagonal) ................................................................................................................. 39
Table 10. Phenotypic correlations between BCS and the reproduction traits calving to first service
(CTFS), first service to conception (FSTC), days open (DO), 56-d nonreturn rate at first
insemination (NRR), maternal and direct calving ease (CEm and CEd, respectively), and
maternal and direct calf survival (CSm and CSd, respectively) for first-parity Ayrshire cows
across DIM......................................................................................................................................... 41
Table 11. Phenotypic correlations between BCS and the reproduction traits calving to first service
(CTFS), first service to conception (FSTC), days open (DO), 56-d nonreturn rate at first
insemination (NRR), maternal and direct calving ease (CEm and CEd, respectively), and
maternal and direct calf survival (CSm and CSd, respectively) for first-parity Holstein cows
across DIM......................................................................................................................................... 41
Table 12. Descriptive statistics of data for the analysis of BCS, calving ease (CE) coded from 1
(unassisted calving) to 4 (surgery), and calf survival (CS) coded as 0 if the calf died within
24 h from birth and 1 otherwise ........................................................................................................ 51
Table 13. Genetic correlations between BCS based on number of days before and after calving ....... 55
Table 14 Expected direct response to selection (R) on calving traits and correlated response (CR)
in calving traits as a result of selection for higher BCS at 30 d before calving ............................. 57
Table 15. Heritabilities of EBV1 to EBV7 and correlated response to selection on PR while selecting
on EBV1 to EBV7. .............................................................................................................................. 65

List of tables
118
Table 16. Correlations between EBV1 to EBV7 and breeding values of the economically important
traits. .................................................................................................................................................. 66
Table 17. Pearson (above the diagonal) and Spearman (below the diagonal) correlations among
EBV1 to EBV7. .................................................................................................................................... 66
Table 18. Descriptive statistics of the data set after preliminary edits and of the data set used for
variance components estimation ...................................................................................................... 73
Table 19. Averaged daily genetic correlations between production traits and fatty acid contents in
milk (g/dL); average daily genetic correlations were calculated as the correlations between
daily breeding values of cows having records and averaged for DIM between 5 and 305 .......... 80
Table 20. Averaged daily genetic correlations among fatty acids in milk (g/dL); average daily
genetic correlations were calculated as the correlations between daily breeding values of
cows having records and averaged for DIM between 5 and 305 ................................................... 83
Table 21. Mean and standard deviation of days open (n = 29,792) and production and FA traits
(n = 143,332) in the data set used for genetic correlations estimation; lactation heritability
estimates 2
305dh , average daily heritability estimates 2
dh , and lactation genetic correlations
with days open (r305d) are also presented. ....................................................................................... 93
Table 22. Assumed genetic standard deviation ( ), heritability ( ), repeatability ( ), and
phenotypic ( ) and genetic ( ) correlations with DO. ................................................................ 107
Table 23. Accuracy of an index for fertility including either days open (DO), nadir body condition
score (BCS), C10:0 at 5 days in milk (DIM; g/dl), C12:0 at 5 DIM (g/dl), or C18:1 cis-9 at 5
DIM (g/dl) estimated for a bull having a varying number of daughters with records (p=20,
100, 200) .......................................................................................................................................... 108

119
List of figures
Figure 1. Number of BCS records for first-lactation Holstein cows (/10) and Ayrshire cows across
DIM .............................................................................................................................................. 35
Figure 2. Trend (daily means) of BCS records for first-lactation Holstein and Ayrshire cows across
DIM .............................................................................................................................................. 36
Figure 3. Variance component (averaged for each breed across the six 2-trait analyses) of BCS
for first-parity Ayrshire (AY) and Holstein (HO) cows across DIM ............................................... 36
Figure 4. Daily heritabilities (averaged for each breed across the six 2-trait analyses) of BCS for
first-parity Ayrshire and Holstein cows across DIM ..................................................................... 38
Figure 5. Genetic correlations between BCS and fertility traits: calving to first service (CTFS), first
service to conception (FSTC), days open (DO), and 56-d nonreturn rate at first insemination
(NRR) for first-parity Ayrshire cows across DIM. ......................................................................... 40
Figure 6. Genetic correlations between BCS and fertility traits: calving to first service (CTFS), first
service to conception (FSTC), days open (DO), and 56-d nonreturn rate at first insemination
(NRR) for first-parity Holstein cows across DIM. ......................................................................... 40
Figure 7. Genetic correlations between BCS and calving traits: calving ease maternal (CEm) and
direct (CEd) and calf survival maternal (CSm) and direct (CSd) for first-parity Ayrshire cows
across DIM................................................................................................................................... 43
Figure 8. Genetic correlations between BCS and calving traits: calving ease maternal (CEm) and
direct (CEd) and calf survival maternal (CSm) and direct (CSd) for first-parity Holstein cows
across DIM................................................................................................................................... 43
Figure 9. Average daily BCS for Ayrshire cows from 100 d before second calving to 335 d after
calving.......................................................................................................................................... 54
Figure 10. Daily heritabilities and their 99.7% confidence interval (±3 SE) for BCS in Ayrshire cows
from 100 d before second calving to 335 d after calving. ............................................................ 54
Figure 11. Genetic correlations and their 99.7% confidence interval (±3 SE) of BCS from 100 d
before second calving to 335 d after calving with maternal calving ease (CEm) and direct
calving ease (CEd). ..................................................................................................................... 55
Figure 12. Genetic correlations and their 99.7% confidence interval (±3 SE) of BCS from 100 d
before second calving to 335 d after calving with maternal calf survival (CSm) and direct
calf survival (CSd)........................................................................................................................ 56
Figure 13. Daily heritabilities of angularity and BCS across days in milk. ............................................ 64
Figure 14. Daily genetic correlations among BCS1, BCS2, BCS3, and angularity across days
in milk........................................................................................................................................... 65
Figure 15. Concentration of group and individual fatty acids in milk [saturated (SFA),
monounsaturated (MUFA), unsaturated (UFA), short-chain (SC), medium-chain (MC), long-
chain (LC) fatty acids, C4:0, C6:0, C8:0, C10:0, C12:0, C14:0, C16:0, C17:0, C18:0, C18:1,
C18:1 cis, and C18:1 cis-9] at the following classes of DIM: 1-20, 21-40, 41-60, and 61-80
as a proportion of their concentration at class 81-100 DIM. ........................................................ 76
Figure 16. Daily heritabilities of milk, fat, and protein yields, fat and protein contents, and groups
and individual fatty acid contents: saturated (SFA), monounsaturated (MUFA), unsaturated
(UFA), short-chain (SC), medium-chain (MC), long-chain (LC) fatty acids, C4:0, C6:0, C8:0,
C10:0, C12:0, C14:0, C16:0, C17:0, C18:0, C18:1, C18:1 cis, and C18:1 cis-9. ........................ 78

List of tables
120
Figure 17 Daily genetic correlations between milk yield (kg) and fat content (%), and contents
(g/dL) of the following individual fatty acids or groups of fatty acids: C4:0, C6:0, C8:0, C10:0,
C12:0, C14:0, C16:0, C17:0, C18:0, C18:1 cis-9, and polyunsaturated fatty acids (PUFA).
Daily genetic correlations were calculated as correlations between daily breeding values of
cows with records. ....................................................................................................................... 81
Figure 18. Daily genetic correlations between the content in milk (g/dL) of C18:1 cis-9 and the
content in milk (g/dL) of the following individual fatty acids or groups of fatty acids: C4:0,
C6:0, C8:0, C10:0, C12:0, C14:0, C16:0, C17:0, C18:0, and polyunsaturated fatty acids
(PUFA).Daily genetic correlations were calculated as correlations between daily breeding
values of cows with records......................................................................................................... 84
Figure 19. Daily genetic correlations between days open (DO) and milk, fat, and protein yields,
and fat and protein contents in milk. Standard errors of estimates ranged from 0.07 to 0.12. .... 96
Figure 20. Daily genetic correlations between days open (DO) and groups of FA content in milk
(g/dL of milk): SFA, MUFA, PUFA, unsaturated FA (UFA), short-chain FA (SCFA), medium-
chain FA (MCFA), and long-chain FA (LCFA). Standard errors of estimates ranged from
0.07 to 0.13.................................................................................................................................. 97
Figure 21. Daily genetic correlations between days open (DO) and individual FA content in milk
(g/dL of milk): C4:0, C6:0, C8:0, C10:0, C12:0, C14:0, C16:0, C17:0, C18:0, and C18:1 cis-9.
Standard errors of estimates ranged from 0.07 to 0.13. .............................................................. 98