Embed Size (px)
Citation preview
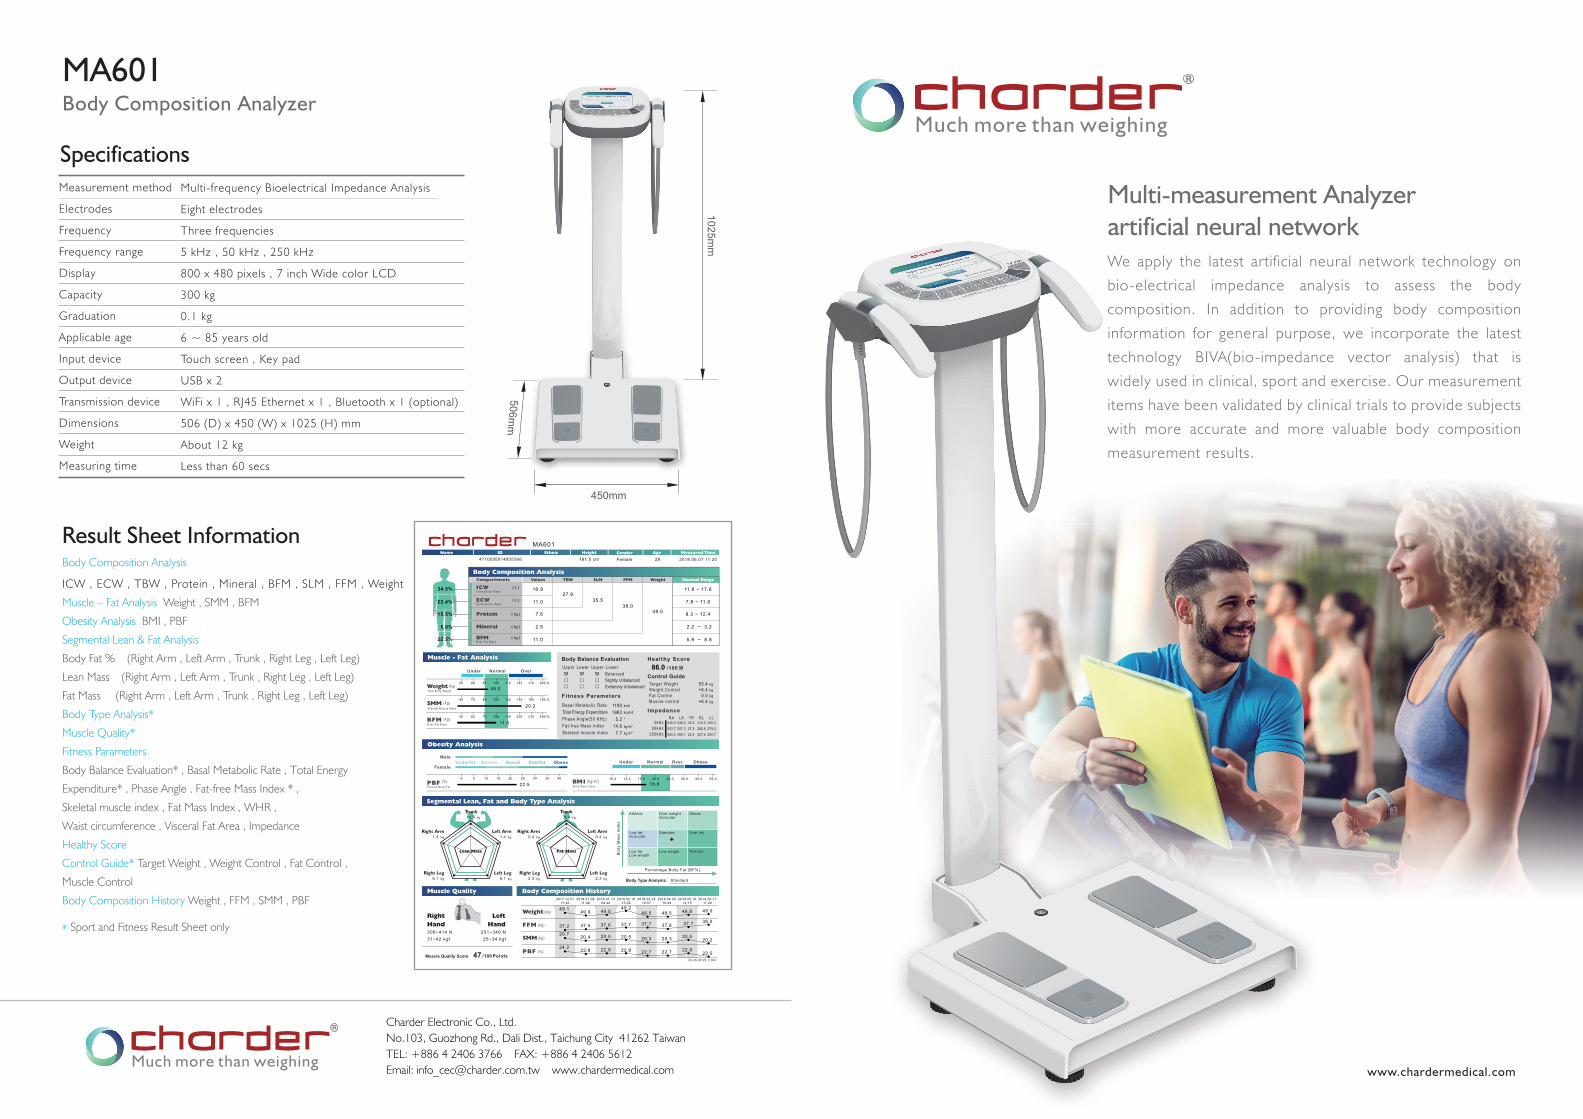
Multi-measurement Analyzerartificial neural networkWe apply the latest artificial neural network technology on
bio-electrical impedance analysis to assess the body
composition. In addition to providing body composition
information for general purpose, we incorporate the latest
technology BIVA(bio-impedance vector analysis) that is
widely used in clinical, sport and exercise. Our measurement
items have been validated by clinical trials to provide subjects
with more accurate and more valuable body composition
measurement results.
Measurement method
Electrodes
Frequency
Frequency range
Display
Capacity
Graduation
Applicable age
Input device
Output device
Transmission device
Dimensions
Weight
Measuring time
Multi-frequency Bioelectrical Impedance Analysis
Eight electrodes
Three frequencies
5 kHz , 50 kHz , 250 kHz
800 x 480 pixels , 7 inch Wide color LCD
300 kg
0.1 kg
6 ~ 85 years old
Touch screen , Key pad
USB x 2
WiFi x 1 , RJ45 Ethernet x 1 , Bluetooth x 1 (optional)
506 (D) x 450 (W) x 1025 (H) mm
About 12 kg
Less than 60 secs
Specifications
MA601Body Composition Analyzer
Result Sheet InformationBody Composition Analysis
ICW , ECW , TBW , Protein , Mineral , BFM , SLM , FFM , Weight
Muscle – Fat Analysis Weight , SMM , BFM
Obesity Analysis BMI , PBF
Segmental Lean & Fat Analysis
Body Fat % (Right Arm , Left Arm , Trunk , Right Leg , Left Leg)
Lean Mass (Right Arm , Left Arm , Trunk , Right Leg , Left Leg)
Fat Mass (Right Arm , Left Arm , Trunk , Right Leg , Left Leg)
Body Type Analysis*
Muscle Quality*
Fitness Parameters
Body Balance Evaluation* , Basal Metabolic Rate , Total Energy
Expenditure* , Phase Angle , Fat-free Mass Index * ,
Skeletal muscle index , Fat Mass Index , WHR ,
Waist circumference , Visceral Fat Area , Impedance
Healthy Score
Control Guide* Target Weight , Weight Control , Fat Control ,
Muscle Control
Body Composition History Weight , FFM , SMM , PBF
* Sport and Fitness Result Sheet only
1025mm
450mm
506mm
Charder Electronic Co., Ltd. No.103, Guozhong Rd., Dali Dist., Taichung City 41262 Taiwan TEL: +886 4 2406 3766 FAX: +886 4 2406 5612Email: [email protected] www.chardermedical.com
Lean Mass
Right Arm
Right Leg Left Leg
Left Arm
6.1 kg
1.4 kg1.4 kg
6.1 kg
Body Balance Evaluation
□ □ □ Balanced□ □ □ Slightly Unbalanced□ □ □ Extremely Unbalanced
Upper Lower Upper-Lower
Segmental Lean, Fat and Body Type Analysis
50 68 85 100 115 143 172 200 %
%
%
60 70 80 100 120 140 160 180
50 60 70 100 130 220 310 400
49.0
20.2
11.0
Total Body Weight(kg)
(kg)
(kg)
Skeletal Muscle Mass
Body Fat Mass
Under OverNormal
Weight
SMM
BFM
Muscle - Fat Analysis
MA601
2018.06.07 11:204710095914805566 161.5 cmHeight
FemaleGender
28AgeIDName Measured Time
27.935.5
38.049.0
11.8 ~ 17.6
7.8 ~ 11.6
8.3 ~ 12.4
2.2 ~ 3.2
5.9 ~ 8.8
Values TBW SLM FFM Weight Normal RangeCompartments
Body Composition Analysis
Intracel lular WaterICW ( L )
Extracel lu lar WaterECW ( L )
Protein ( kg )
Mineral ( kg )
Body Fat MassBFM ( kg )
11.0
7.6
2.5
11.0
16.9
Ethnic
0 5 10 15 20 25 30 35
22.5Percent Body FatPBF
Obesity Analysis
(%)
22.4%
15.5%
5.0%
22.5%
34.5%
Fat Mass
Trunk4.4 kg
Body Composition History
Healthy Score/100 分86.0
Control GuideTarget WeightWeight ControlFat ControlMuscle control
55.4+6.4
0.0+6.4
kgkgkgkg
Fitness ParametersBasal Metabol ic RateTotal Energy ExpenditurePhase Angle(50 KHz)Fat- free Mass IndexSkeletal muscle index
kcal
kcal/d
°
kg/m2
11901983
5.214.6
7.7 kg/m2
5kHz50kHz
250kHz
RA548.0 548.2 30.2 312.6 305.3503.7 507.3 27.5 282.6 279.2463.2 469.1 25.4 257.6 255.7
LA TR RL LLImpedance
Male
FemaleUnderfat Athlete Nomal Overfat Obese
40
Muscle Quality
306~414 N31~42 kgf
251~340 N25~34 kgf
/100 Points47Muscle Quality Score
RightHand
LeftHand
Right Arm
Right Leg Left Leg
Left Arm
2.3 kg
0.4 kg0.4 kg
2.3 kg
Trunk14.9 kg
Body Mass IndexBMI (kg/m )2 10.0 14.2 18.5 22.0 25.0 30.0 45.0 55.0
18.8
Under OverNormal Obese
Athletic Obese
Low fat muscular
Standard Over fat
Low fatLow weight
Low weight Thin fat
Percentage Body Fat (BF%)
Over weightmuscular
Body Type Analysis: Standard
Bod
y M
ass
Inde
x
2017.12.0111:40
2018.01.0811:48
2018.01.1309:40
2018.02.1915:26
2018.03.2410:57
2018.04.0310:49
2018.05.1014:15
2018.06.1711:20
49.1 49.0 49.049.2
48.5 48.5 48.8 49.0
37.2 37.5 37.6 37.7 37.7 37.6 37.7 38.0
20.7 20.4 20.5 20.5 20.3 20.3 20.520.2
24.2 22.8 22.9 22.9 22.7 22.7 22.922.5
(kg)Weight
(kg)FFM
(kg)SMM
(%)PBFCD-IN-00129_V.00A
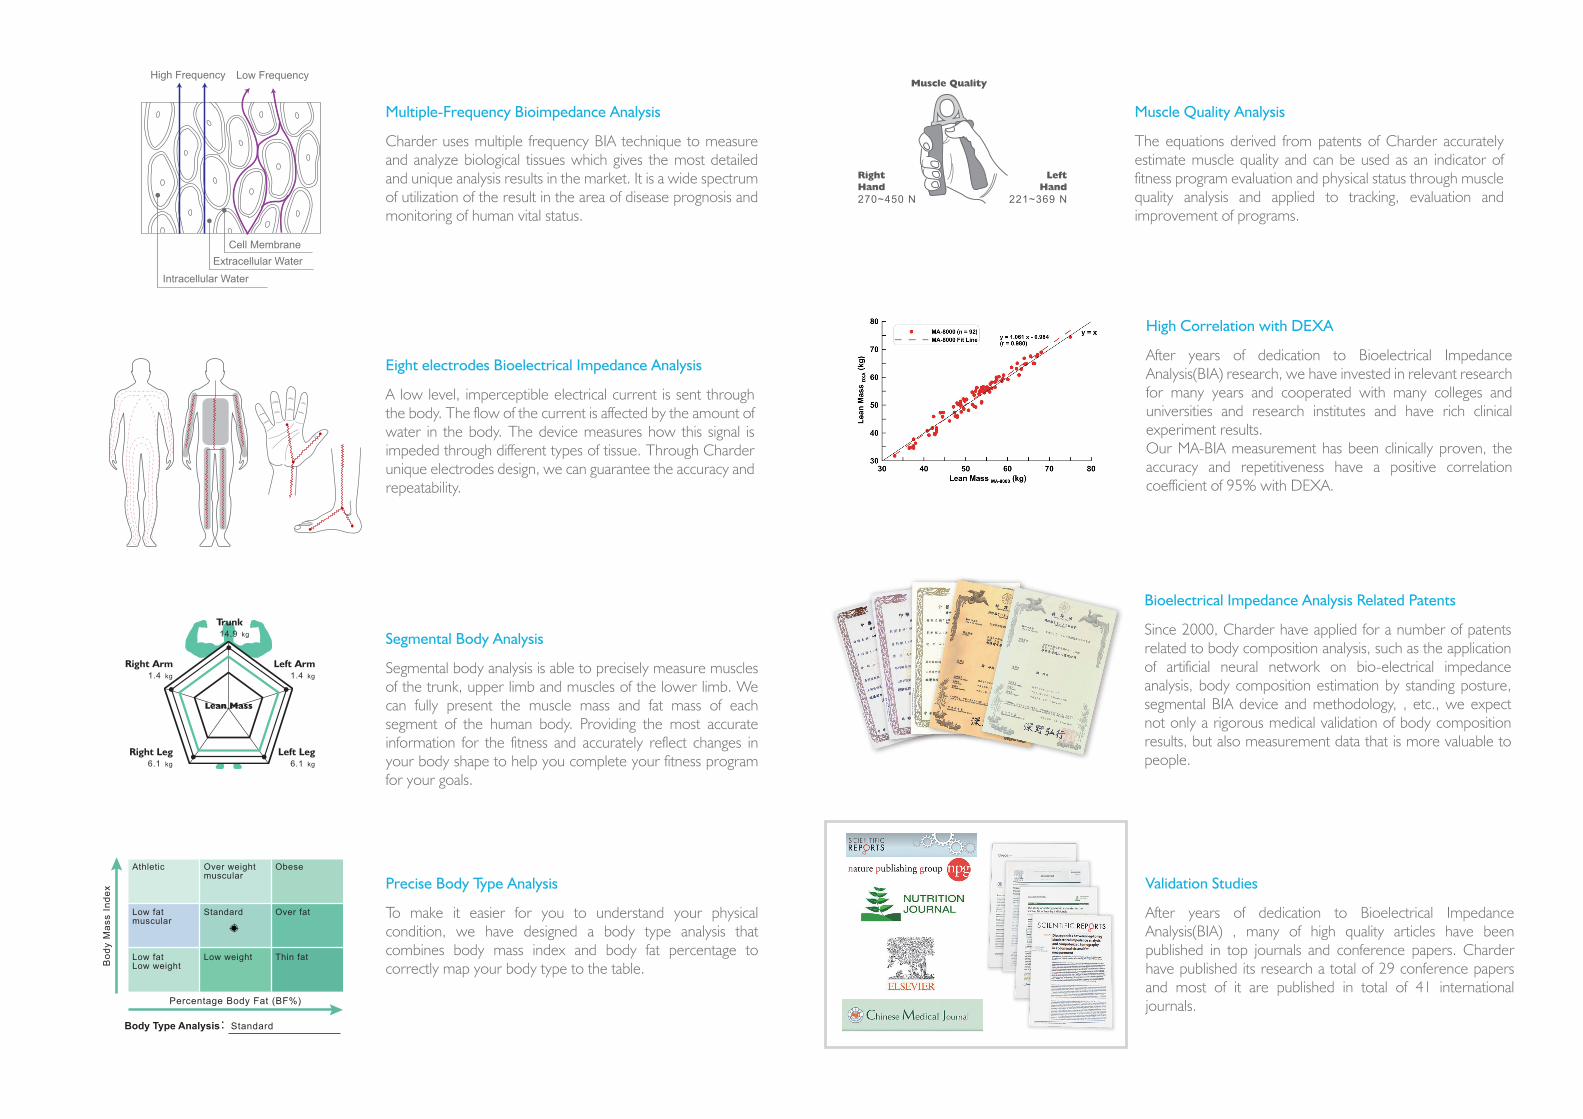
Bioelectrical Impedance Analysis Related Patents
Since 2000, Charder have applied for a number of patents related to body composition analysis, such as the application of artificial neural network on bio-electrical impedance analysis, body composition estimation by standing posture, segmental BIA device and methodology, , etc., we expect not only a rigorous medical validation of body composition results, but also measurement data that is more valuable to people.
Eight electrodes Bioelectrical Impedance Analysis
A low level, imperceptible electrical current is sent through the body. The flow of the current is affected by the amount of water in the body. The device measures how this signal is impeded through different types of tissue. Through Charder unique electrodes design, we can guarantee the accuracy and repeatability.
Segmental Body Analysis
Segmental body analysis is able to precisely measure muscles of the trunk, upper limb and muscles of the lower limb. We can fully present the muscle mass and fat mass of each segment of the human body. Providing the most accurate information for the fitness and accurately reflect changes in your body shape to help you complete your fitness program for your goals.
Precise Body Type Analysis
To make it easier for you to understand your physical condition, we have designed a body type analysis that combines body mass index and body fat percentage to correctly map your body type to the table.
→→→→→→→→→→→→→→→
→→ → → → → → → → →
→→→→→→→→→→→→→→
→→→→→→→→→→→→→
→→ → →
→
→
→
→
→
→
→
→
→
→
→
→
→
→→→→→
→→→→→→→→→→→→→→→→→→→→→→→→→→→→→→→→
→
→
→
→
→
→
→
→
→
→
→
→
→
→
→
→
→
→
→
→
→
→
→
→
→
→
→
→
→
→
→
→
→
→
→
→→→→→→→→→→→→→→→→→→→→→→→→→
→ → →
→→→→→→→→→→→→→→→→→→→→→→→→
→→→→→→→→→→→→→→→→→→→→→→→→
→→→→→→→→→→→→→→→→→→→→→→→→→
High Correlation with DEXA
After years of dedication to Bioelectrical Impedance Analysis(BIA) research, we have invested in relevant research for many years and cooperated with many colleges and universities and research institutes and have rich clinical experiment results.Our MA-BIA measurement has been clinically proven, the accuracy and repetitiveness have a positive correlation coefficient of 95% with DEXA.
Validation Studies
After years of dedication to Bioelectrical Impedance Analysis(BIA) , many of high quality articles have been published in top journals and conference papers. Charder have published its research a total of 29 conference papers and most of it are published in total of 41 international journals.
Multiple-Frequency Bioimpedance Analysis
Charder uses multiple frequency BIA technique to measure and analyze biological tissues which gives the most detailed and unique analysis results in the market. It is a wide spectrum of utilization of the result in the area of disease prognosis and monitoring of human vital status.
Intracellular WaterExtracellular Water
Cell Membrane
Low FrequencyHigh Frequency
Muscle Quality Analysis
The equations derived from patents of Charder accurately estimate muscle quality and can be used as an indicator of fitness program evaluation and physical status through muscle quality analysis and applied to tracking, evaluation and improvement of programs.
RightHand270~450 N
Muscle Quality
LeftHand
221~369 N
Lean Mass
Right Arm
Right Leg Left Leg
Left Arm
6.1 kg
1.4 kg1.4 kg
6.1 kg
Trunk14.9 kg
Athletic Obese
Low fat muscular
Standard Over fat
Low fatLow weight
Low weight Thin fat
Percentage Body Fat (BF%)
Over weightmuscular
Body Type Analysis: Standard
Bod
y M
ass
Inde
x