Embed Size (px)
Citation preview

Abstract—Aims: In this analysis of body composition such
as body weight, BMI, body fat percentage, segmental
subcutaneous fat & skeletal muscle percentage (whole body,
trunk, legs and arms), resting metabolism, visceral fat level
and body age is done by bioelectrical impedance technique
and results are interpreted and corresponding instructions for
better health improvement is given.
Methods: Body composition analysis of teaching and non-
teaching staff members of Brijlal Biyani Science College
Amravati Maharashtra India using bioelectrical impedance
analysis method is done. For ideal weight management and for
a more accurate and precise body composition analysis full
body sensing technology karada scan body composition
monitor – HBF-375 is used. The general principle behind
bioelectrical impedance analysis is that two or more
conductors are attached to a person's body and a small electric
current is sent through the body. The resistance between the
conductors provides a measure of body fat between a pair of
electrodes, since the resistance to electricity varies between
adipose, muscular and skeletal tissue.
Result: Interpretation of body composition analysis report
of Teaching Staff members (Senior College) shows that
overweight person is 70.6 %; that of Junior College is 73.3 %;
that of non-teaching staff members (laboratory) is 52.4 %
while; that of office is 76.9 %; and that of library is 100 %.
Index Terms—Body age, body fat, BMI, RM, skeletal muscle,
subcutaneous fat, visceral fat.
I. INTRODUCTION
Bioelectrical impedance analysis (BIA) is a commonly
used method for estimating body composition, and in
particular body fat. Since the advent of the first
commercially available devices in the mid-1980s the
method has become popular owing to its ease of use,
portability of the equipment and it’s relatively low cost
compared to some of the other methods of body
composition analysis. It is familiar in the consumer market
as a simple instrument for estimating body fat. BIA actually
determines the electrical impedance, or opposition to the
flow of an electric current through body tissues which can
then be used to calculate an estimate of total body water
(TBW). TBW can be used to estimate fat-free body mass
and, by difference with body weight, body fat [1].
Many of the early research studies showed that BIA was
quite variable and it was not regarded by many as providing
an accurate measure of body composition. In recent years
technological improvements have made BIA a more reliable
and therefore more acceptable way of measuring body
Manscript received November 15, 2013; revised January 19, 2014.
Swaroopa Rani N. Gupta is with the Department of Chemistry, Brijlal
Biyani Science College Amravati, Maharashtra, India (email:
composition. Nevertheless it is not a “gold standard” or
reference method. Like all assessment tools, the result is
only as good as the test done. Although the instruments are
straightforward to use, careful attention to the method of use
(as described by the manufacturer) should be given.
Simple devices to estimate body fat, often using BIA, are
available to consumers as body fat meters. These
instruments are generally regarded as being less accurate
than those used clinically or in nutritional and medical
practice. They tend to under-read body fat percentage [2].
Dehydration is a recognized factor affecting BIA
measurements as it causes an increase in the
body's electrical resistance, so has been measured to cause a
5 kg underestimation of fat-free mass i.e. an overestimation
of body fat [3].
Body fat measurements are lower when measurements
are taken shortly after consumption of a meal, causing a
variation between highest and lowest readings of body fat
percentage taken throughout the day of up to 9.9% [4].
Moderate exercise before BIA measurements lead to an
overestimation of fat-free mass and an underestimation of
body fat percentage due to reduced impedance [5]. For
example moderate intensity exercise for 90–120 minutes
before BIA measurements causes nearly a 12 kg
overestimation of fat-free mass, i.e. body fat is significantly
underestimated [6]. Therefore it's recommended not to
perform BIA for several hours after moderate or high
intensity exercise [7].
BIA is considered reasonably accurate for measuring
groups, or for tracking body composition in an individual
over a period of time, but is not considered sufficiently
accurate for recording of single measurements of
individuals [8].
The accuracy of consumer grade devices for measuring
BIA has not been found to be sufficiently accurate for single
measurement use and is better suited for use to measure
changes in body composition over time for individuals [9].
Bioelectrical impedance analysis (BIA) is widely used in
clinics and research to measure body composition. However,
the results of BIA validation with reference methods are
contradictory, and few data are available on the influence of
adiposity on the measurement of body composition by BIA.
BIA is a good alternative for estimating %BF when subjects
are within a normal body fat range. BIA tends to
overestimate %BF in lean subjects and underestimate %BF
in obese subjects [10].
Bioelectrical impedance analysis (BIA) is a promising
tool in the evaluation of body composition in large
population studies because it is fast, is inexpensive, and
does not require extensive operator training or cross-
validation. The empiric nature of the relation between
Body Composition Analysis of Staff members of College
Using Bioelectrical Impedance Analysis Method
Swaroopa Rani N. Gupta
International Journal of Chemical Engineering and Applications, Vol. 5, No. 3, June 2014
259DOI: 10.7763/IJCEA.2014.V5.390

resistance and reactance measured by BIA and body
composition has led to the development of equations that
translate the raw data into liters of body water or kilograms
of fat-free mass (FFM) or fat mass. These equations may
not be easily transferred from one population to another if
the populations differ significantly in important
determinants of body composition such as age, obesity, and
illness. Review of two recent studies from the Framingham
Heart Study in which BIA was first compared with dual-
energy X-ray absorptiometry (DXA) as a validation
technique, and then compared with the body mass index
(BMI, in kg/m2) as an alternative estimate of body fat. BIA
was a good predictor of DXA-derived FFM (r = 0.85-0.88,
P < 0.001) and was superior to BMI as an estimator of body
fat [11].
Over the past decade, considerable attention has been
paid to accurately measuring body composition in diverse
populations. Recently, the use of air-displacement
plethysmography (AP) was proposed as an accurate,
comfortable, and accessible method of body-composition
analysis. AP is an accurate method for assessing body
composition in healthy adults. Future studies should assess
further the cause of the individual variations with this new
method [12].
Obesity continues increasing at epidemic levels
worldwide, as does the number of genetic studies that focus
on obesity. Body mass index (BMI) is often used to
characterize weight phenotypes and obesity status due to its
simplicity. Refined measurements of body composition may
be needed to understand variations in gene expression. This
study explores gene expression when individuals are
characterized as overweight based on BMI versus body fat
percent. Individuals were recruited to a natural history
protocol at the National Institutes of Health. Twelve
Caucasian participants with the highest and lowest BMI
were included. Whole-body air displacement
plethysmography was performed to calculate body fat
percent, and BMI was calculated. Fasting whole blood was
collected and RNA extracted. Quantitative real time PCR
array was used to determine expression of 96 obesity related
genes. The PCR array from participants with high BMI
compared to low BMI showed dysregulation of four genes:
peroxisome proliferator-activated receptor gamma
coactivator 1-alpha (PPARGC1A), pro-opiomelanocortin
(POMC), growth hormone secretagogue receptor (GHSR),
and leptin (LEP), whereas participants with high body fat
compared to low body fat showed dysregulation of one gene:
PPARGC1A. This research showed differential gene
expression and clinical indices depending on method of
weight Classification [13].
The study aims to improve accuracy of Bioelectrical
Impedance Analysis (BIA) prediction equations for
estimating fat free mass (FFM) of the elderly by using non-
linear Back Propagation Artificial Neural Network (BP-
ANN) model and to compare the predictive accuracy with
the linear regression model by using energy dual X-ray
absorptiometry (DXA) as reference method. When
compared the performance of developed prediction
equations for estimating reference FFMDXA, the linear model
has lower r2 with a larger SD in predictive results than that
of BP-ANN model, which indicated ANN model is more
suitable for estimating FFM [14].
Although international interest in classifying subject
health status according to adiposity is increasing, no
accepted published ranges of percentage body fat currently
exist. Empirically identified limits, population percentiles,
and scores have all been suggested as means of setting
percentage body fat guidelines, although each has major
limitations. A convenient sample of 1626 adults with BMIs
≤35 was evaluated. Independent percentage body fat
predictor variables in multiple regression models included
1/BMI, sex, age, and ethnic group (R values from 0.74 to
0.92 and SEEs from 2.8 to 5.4% fat). The prediction
formulas were then used to prepare provisional healthy
percentage body fat ranges based on published BMI limits
for underweight (<18.5), overweight (≥25), and obesity
(≥30). This proposed approach and initial findings provide
the groundwork and stimulus for establishing international
healthy body fat ranges [15].
Several studies have raised the suspicion that the body
mass index (BMI) cut-off for overweight as defined by the
WHO may not adequately reflect the actual overweight
status. The present study looked at the relationship between
BMI and body fat per cent (BF %) / health risks
(hypertension and type 2 diabetes) in male residents of
Lucknow city, north India to evaluate the validity of BMI
cut-off points for overweight. The study subjects showed
higher body fat percentage and risk factors like hypertension
and type 2 diabetes at normal BMI range proposed by the
WHO. The cut-off for BMI was proposed to be 24.5
kg/m2 for our study population. If overweight is regarded as
an excess of body fat and not as an excess of weight
(increased BMI), the cut-off points for overweight based on
BMI would need to be lowered. However, the confidence of
estimate of the BMI cut-off in the present study may be
considered with the limitations of BI analysis studies [16].
Body composition assessment in patients with chronic
renal failure is of paramount importance since studies have
demonstrated the association of protein-energy malnutrition
with an increased morbidity and mortality in this population.
However, practical and sensible indicators of body
compartments are still needed for clinical purposes. Thus,
we aimed to evaluate the simple methods of skinfold
thicknesses (SKF) and bioelectrical impedance analysis
(BIA), using dual-energy X-ray absorptiometry (DEXA) as
a reference method, for the assessment of body fat in
patients on long-term haemodialysis therapy [17].
In this analysis of body composition such as Body
Weight, BMI, Body Fat Percentage, Segmental
Subcutaneous Fat & Skeletal Muscle Percentage (Whole
Body, Trunk, Legs and Arms), Resting Metabolism,
Visceral Fat Level and Body Age is done by Bioelectrical
impedance technique and results are interpreted and
corresponding instructions for better health improvement is
given.
II. MATERIALS AND METHODS
Body Composition Analysis of Teaching and Non
Teaching Staff members of Brijlal Biyani Science College
Amravati Maharashtra India Using Bioelectrical Impedance
Analysis method is done. For ideal weight management and
International Journal of Chemical Engineering and Applications, Vol. 5, No. 3, June 2014
260

for a more accurate and precise body composition analysis
full Body Sensing Technology Karada Scan Body
Composition Monitor – HBF-375 as shown in figure 1 is
used which measures body composition- weight, body fat
percentage, visceral fat level, subcutaneous fat and skeletal
muscle percentage, RM, BMI and Body age. The general
principle behind bioelectrical impedance analysis is that two
or more conductors are attached to a person's body and a
small electric current is sent through the body. The
resistance between the conductors will provide a measure of
body fat between a pair of electrodes, since the resistance to
electricity varies between adipose, muscular and skeletal
tissue. Fat-free mass (muscle) is a good conductor as it
contains a large amount of water (approximately 73%) and
electrolytes, while fat is anhydrous and a poor conductor of
electric current. Each (bare) foot may be placed on an
electrode, with the current sent up one leg, across the
abdomen and down the other leg. There is little scope for
technician error as such, but factors such as eating, drinking
and exercising must be controlled since hydration level is an
important source of error in determining the flow of the
electric current to estimate body fat. The instructions for use
of instruments typically recommended not making
measurements soon after drinking or eating or exercising, or
when dehydrated. Instruments require details such as sex
and age to be entered, and use formulae taking these into
account; for example, men and women store fat differently
around the abdomen and thigh region.
BMI: Body mass index is defined as the individual's
body mass divided by the square of his or her height. The
formulae universally used in medicine produce a unit of
measure of kg/m2.
BMI = Weight (Kg) / [height (m)] 2
Body fat percentage:
Body fat percentage = [Body fat Mass (Kg) / Body
weight (Kg) ] × 100
Visceral Fat: Adipose tissue is one of the main types
of connective tissue. In biology, adipose tissue or body
fat or fat depot or just fat is loose connective
tissue composed of adipocytes.
BMR (RMR): Basal metabolic rate (BMR), and the
closely related resting metabolic rate (RMR), is the amount
of energy expended daily by humans and other animals at
rest. Rest is defined as existing in a
neutrally temperate environment while in the post-
absorptive state.
Skeletal muscle: Skeletal muscle is a form of striated
muscle tissue existing throughout the human body, and
which is under control of the somatic nervous system; that is
to say, it is voluntarily controlled. It is one of three major
muscle types, the others being cardiac and smooth muscle.
As their name suggests, most skeletal muscles are attached
to bones by bundles of collagen fibers known as tendons.
Biological (Real) Age: Biological age is how time and
lifestyle have affected organs and cells compared to other
people of chronological age. Factors of biological aging
include changes in the physical structure of the body as well
as changes in the performance of motor skills and sensory
awareness. Chronological age is current age in years,
calculated from birth date. Interpretation of Bioelectrical
Impedance Analysis report is shown in Table I.
Body composition analysis of Teaching Staff members
(Senior College & Junior College) & Non Teaching Staff
members (Laboratory, Office & Library) is shown in Table
II
Fig 1. Omron Body Composition Scale Karada Scan HBF-375.
TABLE I: INTERPRETATION OF BIOELECTRICAL IMPEDANCE ANALYSIS
Interpretation of Body Composition Report
Body
Fat %
Gender Low Normal High Very High
Female Up to 19.9 20-29.9 30-34.9 35 & more
Male Up to 9.9 10-19.9 20-24.9 25 & more
Trunk Fat
%
Normal High Very high
<15 16-18 18+
Visceral Fat % 0 (Normal) + (High) ++ (Very High)
0.5-9.5 10.0-14.5 15.0-30.0
Skeletal
Muscle
%
Gender Age -(Low) 0 (Normal) + (High) ++ (Very High)
Female
18-39 < 24.3 24.3-30.3 30.4-35.3 ≥ 35.4
40-59 < 24.1 24.1-30.1 30.2-35.1 ≥ 35.2
60-80 < 23.9 23.9-29.9 30.0-34.9 ≥ 35.0
Male
18-39 < 33.3 33.3-39.3 39.4-44.0 ≥ 44.1
40-59 < 33.1 33.1-39.1 39.2-43.8 ≥ 43.9
60-80 < 32.9 32.9-38.9 39.0-43.6 ≥ 43.7
BMI Under wt Normal Over wt Obese
Up to18.4 18.5-24.9 25-29.9 30 & more
International Journal of Chemical Engineering and Applications, Vol. 5, No. 3, June 2014
261
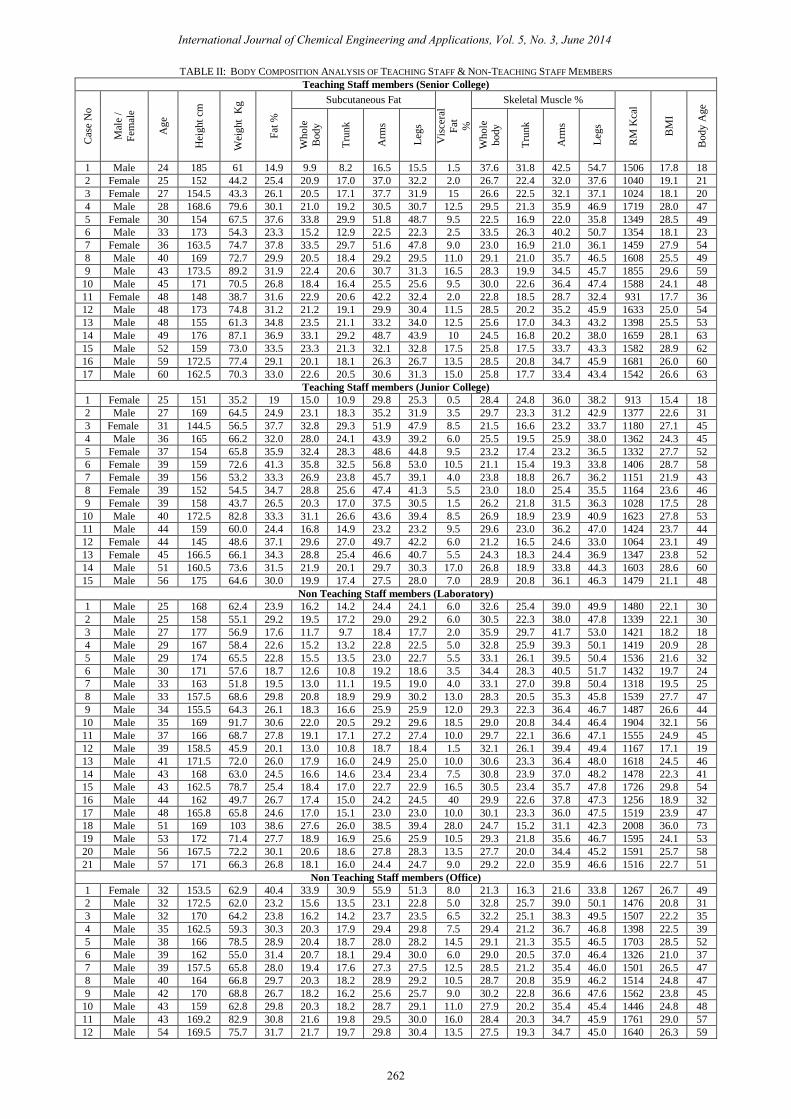
TABLE II: BODY COMPOSITION ANALYSIS OF TEACHING STAFF & NON-TEACHING STAFF MEMBERS
Teaching Staff members (Senior College) C
ase
No
Mal
e /
Fem
ale
Ag
e
Hei
ght
cm
Wei
ght
Kg
Fat
%
Subcutaneous Fat
Vis
cera
l
Fat
%
Skeletal Muscle %
RM
Kca
l
BM
I
Body
Age
Wh
ole
Body
Tru
nk
Arm
s
Leg
s
Wh
ole
body
Tru
nk
Arm
s
Leg
s
1 Male 24 185 61 14.9 9.9 8.2 16.5 15.5 1.5 37.6 31.8 42.5 54.7 1506 17.8 18
2 Female 25 152 44.2 25.4 20.9 17.0 37.0 32.2 2.0 26.7 22.4 32.0 37.6 1040 19.1 21
3 Female 27 154.5 43.3 26.1 20.5 17.1 37.7 31.9 15 26.6 22.5 32.1 37.1 1024 18.1 20
4 Male 28 168.6 79.6 30.1 21.0 19.2 30.5 30.7 12.5 29.5 21.3 35.9 46.9 1719 28.0 47
5 Female 30 154 67.5 37.6 33.8 29.9 51.8 48.7 9.5 22.5 16.9 22.0 35.8 1349 28.5 49
6 Male 33 173 54.3 23.3 15.2 12.9 22.5 22.3 2.5 33.5 26.3 40.2 50.7 1354 18.1 23
7 Female 36 163.5 74.7 37.8 33.5 29.7 51.6 47.8 9.0 23.0 16.9 21.0 36.1 1459 27.9 54
8 Male 40 169 72.7 29.9 20.5 18.4 29.2 29.5 11.0 29.1 21.0 35.7 46.5 1608 25.5 49
9 Male 43 173.5 89.2 31.9 22.4 20.6 30.7 31.3 16.5 28.3 19.9 34.5 45.7 1855 29.6 59
10 Male 45 171 70.5 26.8 18.4 16.4 25.5 25.6 9.5 30.0 22.6 36.4 47.4 1588 24.1 48
11 Female 48 148 38.7 31.6 22.9 20.6 42.2 32.4 2.0 22.8 18.5 28.7 32.4 931 17.7 36
12 Male 48 173 74.8 31.2 21.2 19.1 29.9 30.4 11.5 28.5 20.2 35.2 45.9 1633 25.0 54
13 Male 48 155 61.3 34.8 23.5 21.1 33.2 34.0 12.5 25.6 17.0 34.3 43.2 1398 25.5 53
14 Male 49 176 87.1 36.9 33.1 29.2 48.7 43.9 10 24.5 16.8 20.2 38.0 1659 28.1 63
15 Male 52 159 73.0 33.5 23.3 21.3 32.1 32.8 17.5 25.8 17.5 33.7 43.3 1582 28.9 62
16 Male 59 172.5 77.4 29.1 20.1 18.1 26.3 26.7 13.5 28.5 20.8 34.7 45.9 1681 26.0 60
17 Male 60 162.5 70.3 33.0 22.6 20.5 30.6 31.3 15.0 25.8 17.7 33.4 43.4 1542 26.6 63
Teaching Staff members (Junior College)
1 Female 25 151 35.2 19 15.0 10.9 29.8 25.3 0.5 28.4 24.8 36.0 38.2 913 15.4 18
2 Male 27 169 64.5 24.9 23.1 18.3 35.2 31.9 3.5 29.7 23.3 31.2 42.9 1377 22.6 31
3 Female 31 144.5 56.5 37.7 32.8 29.3 51.9 47.9 8.5 21.5 16.6 23.2 33.7 1180 27.1 45
4 Male 36 165 66.2 32.0 28.0 24.1 43.9 39.2 6.0 25.5 19.5 25.9 38.0 1362 24.3 45
5 Female 37 154 65.8 35.9 32.4 28.3 48.6 44.8 9.5 23.2 17.4 23.2 36.5 1332 27.7 52
6 Female 39 159 72.6 41.3 35.8 32.5 56.8 53.0 10.5 21.1 15.4 19.3 33.8 1406 28.7 58
7 Female 39 156 53.2 33.3 26.9 23.8 45.7 39.1 4.0 23.8 18.8 26.7 36.2 1151 21.9 43
8 Female 39 152 54.5 34.7 28.8 25.6 47.4 41.3 5.5 23.0 18.0 25.4 35.5 1164 23.6 46
9 Female 39 158 43.7 26.5 20.3 17.0 37.5 30.5 1.5 26.2 21.8 31.5 36.3 1028 17.5 28
10 Male 40 172.5 82.8 33.3 31.1 26.6 43.6 39.4 8.5 26.9 18.9 23.9 40.9 1623 27.8 53
11 Male 44 159 60.0 24.4 16.8 14.9 23.2 23.2 9.5 29.6 23.0 36.2 47.0 1424 23.7 44
12 Female 44 145 48.6 37.1 29.6 27.0 49.7 42.2 6.0 21.2 16.5 24.6 33.0 1064 23.1 49
13 Female 45 166.5 66.1 34.3 28.8 25.4 46.6 40.7 5.5 24.3 18.3 24.4 36.9 1347 23.8 52
14 Male 51 160.5 73.6 31.5 21.9 20.1 29.7 30.3 17.0 26.8 18.9 33.8 44.3 1603 28.6 60
15 Male 56 175 64.6 30.0 19.9 17.4 27.5 28.0 7.0 28.9 20.8 36.1 46.3 1479 21.1 48
Non Teaching Staff members (Laboratory)
1 Male 25 168 62.4 23.9 16.2 14.2 24.4 24.1 6.0 32.6 25.4 39.0 49.9 1480 22.1 30
2 Male 25 158 55.1 29.2 19.5 17.2 29.0 29.2 6.0 30.5 22.3 38.0 47.8 1339 22.1 30
3 Male 27 177 56.9 17.6 11.7 9.7 18.4 17.7 2.0 35.9 29.7 41.7 53.0 1421 18.2 18
4 Male 29 167 58.4 22.6 15.2 13.2 22.8 22.5 5.0 32.8 25.9 39.3 50.1 1419 20.9 28
5 Male 29 174 65.5 22.8 15.5 13.5 23.0 22.7 5.5 33.1 26.1 39.5 50.4 1536 21.6 32
6 Male 30 171 57.6 18.7 12.6 10.8 19.2 18.6 3.5 34.4 28.3 40.5 51.7 1432 19.7 24
7 Male 33 163 51.8 19.5 13.0 11.1 19.5 19.0 4.0 33.1 27.0 39.8 50.4 1318 19.5 25
8 Male 33 157.5 68.6 29.8 20.8 18.9 29.9 30.2 13.0 28.3 20.5 35.3 45.8 1539 27.7 47
9 Male 34 155.5 64.3 26.1 18.3 16.6 25.9 25.9 12.0 29.3 22.3 36.4 46.7 1487 26.6 44
10 Male 35 169 91.7 30.6 22.0 20.5 29.2 29.6 18.5 29.0 20.8 34.4 46.4 1904 32.1 56
11 Male 37 166 68.7 27.8 19.1 17.1 27.2 27.4 10.0 29.7 22.1 36.6 47.1 1555 24.9 45
12 Male 39 158.5 45.9 20.1 13.0 10.8 18.7 18.4 1.5 32.1 26.1 39.4 49.4 1167 17.1 19
13 Male 41 171.5 72.0 26.0 17.9 16.0 24.9 25.0 10.0 30.6 23.3 36.4 48.0 1618 24.5 46
14 Male 43 168 63.0 24.5 16.6 14.6 23.4 23.4 7.5 30.8 23.9 37.0 48.2 1478 22.3 41
15 Male 43 162.5 78.7 25.4 18.4 17.0 22.7 22.9 16.5 30.5 23.4 35.7 47.8 1726 29.8 54
16 Male 44 162 49.7 26.7 17.4 15.0 24.2 24.5 40 29.9 22.6 37.8 47.3 1256 18.9 32
17 Male 48 165.8 65.8 24.6 17.0 15.1 23.0 23.0 10.0 30.1 23.3 36.0 47.5 1519 23.9 47
18 Male 51 169 103 38.6 27.6 26.0 38.5 39.4 28.0 24.7 15.2 31.1 42.3 2008 36.0 73
19 Male 53 172 71.4 27.7 18.9 16.9 25.6 25.9 10.5 29.3 21.8 35.6 46.7 1595 24.1 53
20 Male 56 167.5 72.2 30.1 20.6 18.6 27.8 28.3 13.5 27.7 20.0 34.4 45.2 1591 25.7 58
21 Male 57 171 66.3 26.8 18.1 16.0 24.4 24.7 9.0 29.2 22.0 35.9 46.6 1516 22.7 51
Non Teaching Staff members (Office)
1 Female 32 153.5 62.9 40.4 33.9 30.9 55.9 51.3 8.0 21.3 16.3 21.6 33.8 1267 26.7 49
2 Male 32 172.5 62.0 23.2 15.6 13.5 23.1 22.8 5.0 32.8 25.7 39.0 50.1 1476 20.8 31
3 Male 32 170 64.2 23.8 16.2 14.2 23.7 23.5 6.5 32.2 25.1 38.3 49.5 1507 22.2 35
4 Male 35 162.5 59.3 30.3 20.3 17.9 29.4 29.8 7.5 29.4 21.2 36.7 46.8 1398 22.5 39
5 Male 38 166 78.5 28.9 20.4 18.7 28.0 28.2 14.5 29.1 21.3 35.5 46.5 1703 28.5 52
6 Male 39 162 55.0 31.4 20.7 18.1 29.4 30.0 6.0 29.0 20.5 37.0 46.4 1326 21.0 37
7 Male 39 157.5 65.8 28.0 19.4 17.6 27.3 27.5 12.5 28.5 21.2 35.4 46.0 1501 26.5 47
8 Male 40 164 66.8 29.7 20.3 18.2 28.9 29.2 10.5 28.7 20.8 35.9 46.2 1514 24.8 47
9 Male 42 170 68.8 26.7 18.2 16.2 25.6 25.7 9.0 30.2 22.8 36.6 47.6 1562 23.8 45
10 Male 43 159 62.8 29.8 20.3 18.2 28.7 29.1 11.0 27.9 20.2 35.4 45.4 1446 24.8 48
11 Male 43 169.2 82.9 30.8 21.6 19.8 29.5 30.0 16.0 28.4 20.3 34.7 45.9 1761 29.0 57
12 Male 54 169.5 75.7 31.7 21.7 19.7 29.8 30.4 13.5 27.5 19.3 34.7 45.0 1640 26.3 59
International Journal of Chemical Engineering and Applications, Vol. 5, No. 3, June 2014
262

Non Teaching Staff members (Library)
1 Male 36 168.5 70.3 26.9 18.5 16.6 26.4 26.5 9.5 30.4 22.9 37.3 47.7 1587 24.8 44
2 Male 40 161 63.3 25.8 17.8 15.9 24.9 25.0 10.0 29.7 22.7 36.6 47.1 1474 24.4 44
3 Male 44 163.5 68.6 30.3 28.1 23.5 40.1 35.6 7.0 27.3 20.3 27.5 41.1 1414 25.7 50
4 Male 50 167 74.4 27.8 19.4 17.6 25.7 26.0 13.5 29.0 21.5 35.4 46.4 1640 26.7 55
III. RESULT AND DISCUSSION
The ideal BMI is 22. Maintaining an ideal weight can
help prevent obesity or weight loss and other diseases, and
lead a longer life. The ideal weight for BMI of 22 is
calculated as follows.
Ideal Weight (Kg) = 22 × [height (m)]2
However this method of ideal weight calculation may not
be applicable for professional athletes and body builders,
who have higher muscles ratio in their bodies.
Correct Weight Reduction: If we lose weight by going
on a diet instead of doing exercise and neglecting nutrition
balance, even if our weight is reduced, resting metabolism
will decrease as muscle (Skeletal muscle) decreases and we
are more likely to become fatter. We should build up non-fat
physique by increasing skeletal muscle and improving
resting metabolism.
Interpretation of body composition analysis report of
teaching Staff members (Senior College & Junior College)
& Non Teaching Staff members (Laboratory, Office &
Library) is shown in Table III.
TABLE III: INTERPRETATION OF BODY COMPOSITION ANALYSIS REPORT OF TEACHING & NON-TEACHING STAFF MEMBERS
Teaching Staff members (Senior College)
Cas
e N
o
Idea
l w
t (K
g)
=
22 ×
[h
t (m
)]2
Ov
er w
t /
Und
er
wt
Kg
Per
iod
req
uir
ed
for
wt
Lo
ss /
Gai
n a
t th
e ra
te o
f
1.5
kg p
er m
onth
Per
iod
req
uir
ed
for
wt
mai
nta
in
Fat
%
Su
bcu
tan
eou
s
Fat
% (
Tru
nk
)
Vis
cera
l F
at %
Sk
elet
al
Mu
scle
%
(W
hole
body
) R
M K
cal
BM
I
Body
Age
1 75.3 ↑ 14.3 Kg Under wt 9.5 Month 9.5 Month Normal Normal Normal Normal ↑ ↑ Under wt ↑
2 50.8 ↑ 6.6 Kg Under wt 4 Month 4 Month Normal ↓ High Normal Normal ↑ Normal ↑
3 52.5 ↑ 9.2 Kg Under wt 6 Month 6 Month Normal ↓ High ↓ Very High Normal ↑ ↑ Under wt ↑
4 62.5 ↓ 17.1 Kg Over wt 11.5 Month 11.5 Month ↓ Very High ↓ Very high ↓ High ↑ Low ↑ ↓ Over wt ↓
5 52.2 ↓15.3 Kg Over wt 10 Month 10 Month ↓ Very High ↓ Very High Normal ↑ Low ↑ ↓ Over wt ↓
6 65.8 ↑ 11.5 Kg Under wt 8 Month 8 Month ↓ High Normal Normal Normal ↑ ↑ Under wt ↑
7 58.8 ↓ 15.9 Kg Over wt 11 Month 11 Month ↓ Very High ↓ Very High Normal ↑ Low ↑ ↓ Over wt ↓
8 62.8 ↓ 9.9 Kg Over wt 6.5 Month 6.5 Month ↓ Very High ↓ Very High ↓ High ↑ Low ↑ ↓ Over wt ↓
9 66.2 ↓ 23 Kg Over wt 15 Month 15 Month ↓ Very High ↓ Very High ↓Very High ↑ Low ↑ ↓ Over wt ↓
10 64.3 ↓ 6.2 Kg Over wt 4 Month 4 Month ↓ Very High ↓ High Normal ↑ Low ↑ Normal ↓
11 48.2 ↑ 9.5 Kg Under wt 7 Month 7 Month ↓ Very High Normal Normal Normal ↑ ↑ Under wt ↑
12 65.8 ↓ 9 Kg Over wt 6 Month 6 Month ↓ Very High ↓ Very High ↓ High ↑ Low ↑ ↓ Over wt ↓
13 52.9 ↓ 8.4 Kg Over wt 6 Month 6 Month ↓ Very High ↓ Very High ↓ High ↑ Low ↑ ↓ Over wt ↓
14 68.1 ↓ 19 Kg Over wt 13 Month 13 Month ↓ Very High ↓ Very High ↓ High ↑ Low ↑ ↓ Over wt ↓
15 55.6 ↓ 17.4 Kg Over wt 12 Month 12 Month ↓ Very High ↓ Very High ↓ Very High ↑ Low ↑ ↓ Over wt ↓
16 65.5 ↓ 11.9 Kg Over wt 8 Month 8 Month Normal ↓ Very High ↓ High ↑ Low ↑ ↓ Over wt ↓
17 58.1 ↓ 12.2 Kg Over wt 8 Month 8 Month ↓ Very High ↓ Very High ↓ Very High ↑ Low ↑ ↓ Over wt ↓
Teaching Staff members (Junior College)
1 50.2 ↑ 15 Kg Under wt 10 Month 10 Month ↑ Low Normal Normal Normal ↑ ↑ Under wt ↑
2 66.8 ↓ 1.7 Kg Over wt 1 Month 1 Month ↓ High ↓ Very High Normal ↑ Low ↑ Normal ↓
3 45.9 ↓ 10.6 Kg Over wt 7 Month 7 Month ↓ Very High ↓ Very high Normal ↑ Low ↑ ↓ Over wt ↓
4 59.9 ↓ 6.3 Kg Over wt 4 Month 4 Month ↓ Very High ↓ Very high Normal ↑ Low ↑ Normal ↓
5 52.2 ↓13.6 Kg Over wt 9 Month 9 Month ↓ Very High ↓ Very High Normal ↑ Low ↑ ↓ Over wt ↓
6 55.6 ↓ 17 Kg Over wt 11 Month 11 Month ↓ Very High ↓ Very High ↓ High ↑ Low ↑ ↓ Over wt ↓
7 53.5 ↑ 0.3 Kg Under wt 8 Days 8 Days ↓ High ↓ Very high Normal ↑ Low ↑ Normal ↓
8 50.8 ↓ 3.7 Kg Over wt 2.5 Month 2.5 Month ↓ High ↓ Very High Normal ↑ Low ↑ Normal ↓
9 54.9 ↑ 11.2 Kg Under wt 7.5 Month 7.5 Month Normal ↓ High Normal Normal ↑ ↑ Under wt ↑
10 65.5 ↓ 17.3 Kg Over wt 11.5 Month 11.5 Month ↓ Very High ↓ Very High Normal ↑ Low ↑ ↓ Over wt ↓
11 55.6 ↓4.4 Kg Over wt 3 Month 3 Month ↓ High Normal Normal ↑ Low ↑ Normal -
12 46.3 ↓ 2.3 Kg Over wt 1.5 Month 1.5 Month ↓ Very High ↓ Very High Normal ↑ Low ↑ Normal ↓
13 61.0 ↓ 5.1 Kg Over wt 3.5 Month 3.5 Month ↓ High ↓ Very High Normal Normal ↑ Normal ↓
14 56.7 ↓ 16.9 Kg Over wt 11 Month 11 Month ↓ Very High ↓ Very High ↓ Very High ↑ Low ↑ ↓ Over wt ↓
15 67.4 ↑ 2.8 Kg Under wt 2 Month 2 Month ↓ Very High ↓ High Normal ↑ Low ↑ Normal ↑
Non Teaching Staff members (Laboratory)
1 62.1 ↓ 0.3 Kg Over wt 7 days 7 days ↓ High Normal Normal ↑ Low ↑ Normal ↓
2 54.9 ↓ 0.2 Kg Over wt 7 days 7 days ↓ Very High ↓ High Normal ↑ Low ↑ Normal ↓
3 68.9 ↑ 12 Kg Under wt 8 Month 8 Month Normal Normal Normal Normal ↑ ↑ Under wt ↑
4 61.4 ↑ 3 Kg Under wt 2 Month 2 Month ↓ High Normal Normal ↑ Low ↑ Normal ↑
5 66.6 ↑ 1.1 Kg Under wt 1 Month 1 Month ↓ High Normal Normal ↑ Low ↑ Normal ↓
6 64.3 ↑ 6.7 Kg Under wt 4.5 Month 4.5 Month ↑ Low Normal Normal Normal ↑ Normal ↑
7 58.5 ↑ 6.7 Kg Under wt 4.5 Month 4.5 Month Normal Normal Normal ↑ Low ↑ Normal ↑
8 54.6 ↓ 14 Kg Over wt 9 Month 9 Month Normal ↓ Very High ↓ High ↑ Low ↑ ↓ Over wt ↓
9 53.2 ↓ 11.1 Kg Over wt 7.5 Month 7.5 Month Normal ↓ Very High ↓ High ↑ Low ↑ ↓ Over wt ↓
10 62.8 ↓ 28.8 Kg Over wt 19 Month 19 Month ↓ Very High ↓ Very High ↓ Very High ↑ Low ↑ ↓ Obese ↓
International Journal of Chemical Engineering and Applications, Vol. 5, No. 3, June 2014
263

11 60.6 ↓ 8.1 Kg Over wt 5.5 Month 5.5 Month ↓ Very High ↓ High ↓ High ↑ Low ↑ Normal ↓
12 55.3 ↑ 12.4 Kg Under wt 8 Month 8 Month Normal Normal Normal ↑ Low ↑ ↑ Under wt ↑
13 64.7 ↓ 7.3 Kg Over wt 5 Month 5 Month ↓ Very High ↓ High ↓ High ↑ Low ↑ Normal ↓
14 62.1 ↓ 0.9 Kg Over wt 15 Days 15 Days ↓ Very High Normal Normal ↑ Low ↑ Normal ↑
15 58.1 ↓ 20.6 Kg Over wt 14 Month 14 Month ↓ Very High ↓ High ↓ Very High ↑ Low ↑ ↓ Over wt ↓
16 57.7 ↑ 8 Kg Under wt 5 Month 5 Month ↓ Very High Normal ↓ Very High ↑ Low ↑ Normal ↑
17 60.5 ↓ 5.3 Kg Over wt 3.5 Month 3.5 Month ↓ High Normal ↓ High ↑ Low ↑ Normal ↑
18 62.8 ↓ 40 Kg Over wt 27 Month 27 Month ↓ Very High ↓ Very High ↓ Very High ↑ Low ↑ ↓ Obese ↓
19 65.1 ↓ 6.3 Kg Over wt 4 Month 4 Month ↓ Very High ↓ High ↓ High ↑ Low ↑ Normal -
20 61.7 ↓ 10.5 Kg Over wt 7 Month 7 Month ↓ Very High ↓ Very High ↓ High ↑ Low ↑ ↓ Over wt ↓
21 64.3 ↓ 2 Kg Over wt 1 Month 1 Month ↓ Very High ↓ High Normal ↑ Low ↑ Normal ↑
Non Teaching Staff members (Office)
1 51.8 ↓ 11.1 Kg Over wt 7.5 Month 7.5 Month ↓ Very High ↓ Very High Normal ↑ Low ↑ ↓ Over wt ↓
2 65.5 ↑ 3.5 Kg Under wt 2 Month 2 Month ↓ High Normal Normal ↑ Low ↑ Normal ↑
3 63.6 ↓ 0.6 Kg Over wt 15 Days 15 Days ↓ High Normal Normal ↑ Low ↑ Normal ↓
4 58.1 ↓ 1.2 Kg Over wt 1 Month 1 Month ↓ Very High ↓ High Normal ↑ Low ↑ Normal ↓
5 60.6 ↓ 17.9 Kg Over wt 12 Month 12 Month ↓ Very High ↓ Very High ↓ High ↑ Low ↑ ↓ Over wt ↓
6 57.7 ↑ 2.7 Kg Under wt 2 Month 2 Month ↓ Very High ↓ Very High Normal ↑ Low ↑ Normal ↑
7 54.6 ↓ 11.2 Kg Over wt 7.5 Month 7.5 Month ↓ Very High ↓ Very High ↓ High ↑ Low ↑ ↓ Over wt ↓
8 59.2 ↓ 7.6 Kg Over wt 5 Month 5 Month ↓ Very High ↓ Very High ↓ High ↑ Low ↑ Normal ↓
9 63.6 ↓ 5.2 Kg Over wt 3.5 Month 3.5 Month ↓ Very High ↓ High Normal ↑ Low ↑ Normal ↓
10 55.6 ↓ 7.2 Kg Over wt 5 Month 5 Month ↓ Very High ↓ Very High ↓ High ↑ Low ↑ Normal ↓
11 63.0 ↓ 19.9 Kg Over wt 13 Month 13 Month ↓ High ↓ Very High ↓ Very High ↑ Low ↑ ↓ Over wt ↓
12 63.2 ↓ 12.5 Kg Over wt 8 Month 8 Month ↓ Very High ↓ Very High ↓ High ↑ Low ↑ ↓ Over wt ↓
Non Teaching Staff members (Library)
1 62.5 ↓ 7.8 Kg Over wt 5 Month 5 Month ↓ Very High ↓ High Normal Normal ↑ Normal ↓
2 57.0 ↓ 6.3 Kg Over wt 4 Month 4 Month ↓ Very High Normal ↓ High ↑ Low ↑ Normal ↓
3 58.8 ↓ 9.8 Kg Over wt 6.5 Month 6.5 Month ↓ Very High ↓ Very High Normal ↑ Low ↑ ↓ Over wt ↓
4 61.4 ↓ 13 Kg Over wt 9 Month 9 Month ↓ Very High ↓ High ↓ High ↑ Low ↑ ↓ Over wt ↓
In Table III sign ↑ indicates corresponding value should
increase and sign ↓ indicates corresponding value should
decrease during weight loss or weight gain programme.
Interpretation of body composition analysis report of
Teaching Staff members (Senior College) shows that
overweight person is 70.6 % while that of underweight
person is 29.4 % and normal person is 0 %.
Interpretation of body composition analysis report of
Teaching Staff members (Junior College) shows that
overweight person is 73.3 % while that of underweight
person is 20.0 % and normal person is 6.7 %.
Interpretation of body composition analysis report of Non
Teaching Staff members (Laboratory) shows that
overweight person is 52.4 % while that of underweight
person is 42.9 % and normal person is 4.8 %.
Interpretation of body composition analysis report of Non
Teaching Staff members (Office) shows that overweight
person is 76.9 % while that of underweight person is 16.7 %
and normal person is 0 %.
Interpretation of body composition analysis report of Non
Teaching Staff members (Library) shows that overweight
person is 100 % while that of underweight person is 0 % and
normal person is 0 %.
IV. CONCLUSION
In Teaching Staff members (Senior College) case number
1 - RM has to be increased so that BMI and body age can
be increased and has to undergo 9.5 month weight gain (at
the rate of 1.5 kg per month) programme to increase 14.3
kg weight. And has to undergo 9.5 month weight maintain
programme.
In case number 2 - Subcutaneous trunk Fat % has to be
decreased and RM has to be increased so that body age can
be increased. And has to undergo 4 month weight gain
programme to increase 6.6 Kg weight. And has to undergo 4
month weight maintain programme.
In case number 3 - Subcutaneous trunk Fat % and visceral
fat % has to be decreased and RM has to be increased so that
BMI and body age can be increased. And has to undergo 6
month weight gain programme to increase 9.2 Kg weight.
And has to undergo 6 month weight maintain programme.
In case number 4 – Fat %, subcutaneous trunk Fat % and
visceral fat % has to be decreased and whole body skeletal
muscle % and RM has to be increased so that BMI and body
age can be decreased. And has to undergo 11.5 month
weight loss programme to decrease 17.1 Kg weight. And has
to undergo 11.5 month weight maintain programme.
In case number 5 – Fat % and Subcutaneous trunk Fat %
has to be decreased and whole body skeletal muscle % and
RM has to be increased so that BMI and body age can be
decreased. And has to undergo 10 month weight loss
programme to decrease 15.3 Kg weight. And has to undergo
10 month weight maintain programme.
Likewise conclusion from other cases can be drawn.
REFERENCES
[1] U. G. Kyle et al., “Bioelectrical impedance analysis—part I: review
of principles and methods,” Clinical Nutrition, vol. 23, no. 5, pp.
1226 43, June 2004. [2] Body fat scales review and compare, January 2010.
[3] H. C. Lukaski, W. W. Bolonchuk, C. B. Hall, and W. A.
Siders, “Validation of tetrapolar bioelectrical impedance method to assess human body composition,” J. Appl. Physiol., vol. 60, no. 4, pp.
1327–32, April 1986.
[4] F. Slinde and L. Rossander-Hulthén, “Bioelectrical impedance: Effect of 3 identical meals on diurnal impedance variation and calculation of
body composition,” Am. J. Clin. Nutr., vol. 74, no. 4, pp. 4748,
October, 2001. [5] R. F. Kushner, R. Gudivaka, and D. A. Schoeller, “Clinical
characteristics influencing bioelectrical impedance analysis measurements,” Am. J. Clin. Nutr., vol. 64, 3 suppl, pp. 423S–427S,
September 1996.
[6] M. Abu Khaled, M. J. McCutcheon, S. Reddy, P. L. Pearman, G. R. Hunter, and R. L. Weinsier, “Electrical impedance in assessing human
body composition: the BIA method,” Am. J. Clin. Nutr., vol. 47, no. 5,
pp. 789–92, May 1988.
International Journal of Chemical Engineering and Applications, Vol. 5, No. 3, June 2014
264

[7] M. Dehghan and A. T. Merchant, “Is bioelectrical impedance accurate
for use in large epidemiological studies?” Nutr J, vol. 7, pp. 26, 2008.
[8] A. C. Buchholz, C. Bartok, and D. A. Schoeller, “The validity of bioelectrical impedance models in clinical populations,” Nutr Clin
Pract, vol. 19, no. 5, pp. 433–46, October 2004.
[9] J. T. Peterson, W. E. S. Repovich, and C. R. Parascand, “Accuracy of consumer grade bioelectrical impedance analysis devices compared
to air displacement plethysmography,” Int J Exerc Sci, vol. 4, no. 3,
pp. 176–184, 2011. [10] G. Sun, C. R. French, G. R. Martin, B. Younghusband, R. C. Green,
Y. G. Xie, M. Mathews, J. R. Barron, D. G. Fitzpatrick, W. Gulliver,
and H. Zhang, “Comparison of multifrequency bioelectrical impedance analysis with dual-energy X-ray absorptiometry for
assessment of percentage body fat in a large, healthy population,” Am
J Clin Nutr., vol. 81, no. 1, pp. 74-8, Jan. 2005. [11] R. Roubenoff, “Applications of bioelectrical impedance analysis for
body composition to epidemiologic studies,” Am J Clin Nutr., vol. 64 ,
3 supp, pp. 459S-462S, Sep. 1996. [12] R. R. Biaggi, M. W. Vollman, M. A. Nies, C. E. Brener, P. J.
Flakoll, D. K. Levenhagen, M. Sun, Z. Karabulut, and K. Y. Chen,
“Comparison of air-displacement plethysmography with hydrostatic weighing and bioelectrical impedance analysis for the assessment of
body composition in healthy adults,” Am J Clin Nutr., vol. 69, no. 5,
pp. 898-903, May 1999. [13] V. L. Peterson1, A. C. Martino, A. Y. Del Valle-Pinero1, N. S. Patel,
X. Zhao, and W. A. Henderson, “Bentham weight phenotype
diagnostic test method: body mass index or body fat percent for gene expression,” The Open Obesity Journal, 2012, vol. 4, 18-221876-
8237/12, 2012.
[14] K. C. Hsieh, Y. J. Chen, H. K. Lu, L. C. Lee, Y. C. Huang, and Y. Y. Chen, “The novel application of artificial neural network on
bioelectrical impedance analysis to assess the body composition in
elderly,” Nutrition Journal, vol. 12, pp. 21, 2013. [15] D. Gallagher, S. B. Heymsfield, M. Heo, S. A. Jebb, P. R.
Murgatroyd, and Y. Sakamoto, “Healthy percentage body fat ranges:
an approach for developing guidelines based on body mass index1,2,3,”
The American Journal of Clinical Nutrition, Am J Clin Nutr, vol. 72,
no. 3, pp. 694-70, September 2000. [16] C. N. Kesavachandran, V. Bihari, and N. Mathur, “The normal range
of body mass index with high body fat percentage among male
residents of Lucknow city in north India,” Indian J Med Res., vol. 135, no. 1, pp. 72–77, January 2012.
[17] M. A. Kamimura, C. M. Avesani, M. Cendoroglo, M. E. Canziani, S.
A. Draibe, and L. Cuppari, “Comparison of skinfold thicknesses and bioelectrical impedance analysis with dual-energy X-ray
absorptiometry for the assessment of body fat in patients on long-term
haemodialysis therapy,” Nephrol Dial Transplant, vol. 18, no. 1, pp. 101-5, Jan. 2003.
International Journal of Chemical Engineering and Applications, Vol. 5, No. 3, June 2014
265
Swaroopa Rani N. Gupta was born on February 28,
1965 in Nagpur, Maharashtra, India. She got herS.S.C. in Somalwar High School, Khamla, Nagpur,
Maharashtra, India. Maths, science, social science in
1981; H.S.S.C. in Hislop College, Nagpur, Maharashtra, India. Maths & statistics, chemistry,
biology in 1983; B.Sc. in Shivaji Science College,
Nagpur, Maharashtra, India. Chemistry, zoology, microbiology in 1986; M.Sc. in Post Graduate
Teaching Department of Chemistry, Nagpur, Maharashtra, India.
Chemistry Specialization: Analytical Chemistry in 1988; M.Phil. Post Graduate Teaching Department of Chemistry, Nagpur, Maharashtra, India.
Coordination Chemistry, Polymer Chemistry in 1989; Ph.D. in Post
Graduate Teaching Department of Chemistry, Nagpur, Maharashtra, India-Chemistry in 1993.
She was now an associate professor in the Department of Chemistry,
Brijlal Biyani Science College, Amravati, Maharashtra, IndiaHer research interests are in the field of chemistry especially analytical
chemistry, environmental science and recent technologies connected to
different field. Want to explore world through great research interest in all aspect of world problem.