Embed Size (px)
Citation preview
BOBLME-2014-Ecology-18
The designations employed and the presentation of material in this publication do not imply the expression of any opinion whatsoever on the part of Food and Agriculture Organization of the United Nations concerning the legal and development status of any country, territory, city or area or of its authorities, or concerning the delimitation of its frontiers or boundaries. The BOBLME Project encourages the use of this report for study, research, news reporting, criticism or review. Selected passages, tables or diagrams may be reproduced for such purposes provided acknowledgment of the source is included. Major extracts or the entire document may not be reproduced by any process without the written permission of the BOBLME Project Regional Coordinator. BOBLME contract: LOA/RAP/2013/97 For bibliographic purposes, please reference this publication as: BOBLME (2014) Understanding nutrient loading and sources in the Bay of Bengal Large Marine Ecosystem BOBLME-2014-Ecology-18
1
Understanding nutrient loading and sources in the Bay of Bengal Large Marine Ecosystem
Prepared by: S.P. Seitzinger1, S. Pedde2, C. Kroeze2, E. Mayorga3 1International Geosphere-Biosphere Program, Stockholm, Sweden 2University Wageningen, Environmental Systems Analysis Group, Wageningen, The Netherlands 3University Washington, Applied Physics Laboratory, Seattle, Washington, USA
Summary
River inputs of nitrogen (N), phosphorus (P) and dissolved silica (DSi) from watersheds draining in to the Bay of Bengal Large Marine Ecosystem (BOBLME) for contemporary conditions, and for one future scenario for the years 2030 and 2050 as calculated by the Global NEWS model are presented. The major N and P sources are identified, and the Indicator of Coastal Eutrophication (ICEP) is calculated for rivers draining into the BOBLME. In 2000, a total of 7.1 Tg N and 1.5 Tg P was transported to the mouth of rivers in the BOBLME. Three rivers (Ganges, Godavari, Irrawaddy) account to approximately 75-80% of the total river transport of N and P. Based on the scenario analysis, by 2050 the river N load is projected to increase to 8.6 Tg, while the P load is not expected to change much. This is the net effect of increasing loads for dissolved N and P, and decreasing loads for particulate N and P.
Rivers draining into the western BOBLME generally have higher N and P export compared to eastern BOBLME rivers. The dominant sources of the different forms of N and P differ across basins; however, anthropogenic sources usually dominate both N and P in western BOBLME basins. Future changes in nutrient export, as well as the relative contribution of different sources, are projected to be quite variable among rivers. The increases in dissolved N and P export can be large, up to more than a factor of 5 for DIP and more than a doubling for DIN and DON. The increases in dissolved N and P loads are associated primarily with increased N and P in agriculture and with an increasing population and economic development. Particulate N and P export in many basins are projected to decrease and are associated with changes in hydrology and with damming of rivers. Based on nutrient export ratios (N and P relative to DSi) we generally calculate positive ICEP values for BOBLME rivers, indicating a risk for development of non-siliceous algal species which can potentially produce toxins and otherwise disrupt nearshore coastal ecosystems. In the future the risk for coastal eutrophication may increase due to both changing nutrient ratios (ICEP) and increasing nutrient loads. Effective management of coastal eutrophication calls for a basin-specific approach.
2
List of acronyms
AM Adapting Mosaic scenario BOB BOBLME
Bay of Bengal Bay of Bengal Large Marine Ecosystem
DIN Dissolved Inorganic Nitrogen DIP DOC
Dissolved Inorganic Phosphorus Dissolved Organic Carbon
DON Dissolved Organic Nitrogen DOP Dissolved Organic Phosphorus DSi Dissolved Silica GEF Global Environment Facility GDP Gross Domestic Product GHAAS Global Hydrologic Archive and Analysis System Global NEWS See NEWS GO Global Orchestration scenario ICEP Indicator for Coastal Eutrophication Potential IMAGE Integrated Model for the Assessment of the Global Environment LME Large Marine Ecosystem MEA Millennium Ecosystem Assessment N N-ICEP NEWS N-Flx
Nitrogen ICEP defined relative to nitrogen Nutrient Export to WaterSheds model Fluxes (yields) of total nitrogen delivered at river mouth
OS Order from Strength scenario P P-ICEP P-Flx
Phosphorus ICEP defined relative to phosphorus Fluxes (yields) of total phosphorus delivered at river mouth
PN POC
Particulate Nitrogen Particulate Organic Carbon
PP Particulate Phosphorus Si Si-Flx
Silica Fluxes (yields) of dissolved silica delivered at river mouth
STN-30p Simulated Topological Network at 0.5-degree x 0.5-degree grid-cell spatial resolution TG Tg
TechnoGarden scenario Teragrams equals1012 grams
TSS Total Suspended Solid TWAP Transboundary Water Assessment Project WBMplus Water Balance Model plus
3
Table of Contents
1. Introduction ............................................................................................................................................... 6
2. Method ...................................................................................................................................................... 6
2.1 Global NEWS model ............................................................................................................................ 6
2.2 Preparation of Global NEWS model for application to BOBLME watersheds ..................................... 8
2.3 Future scenario analysis for 2030 and 2050 ....................................................................................... 9
2.4 Application of gridded databases to Global NEWS for contemporary conditions and validation .... 10
2.5 Application of gridded databases to Global NEWS for 2030 and 2050 future scenario analysis ..... 10
2.6 Indicator for Coastal Eutrophication Potential (ICEP) ....................................................................... 13
3. Nutrient exports and eutrophication potential in the Bay of Bengal from 2000 to 2050 ...................... 13
3.1 Drivers of N and P export by rivers ................................................................................................... 13
3.2 River export of nutrients in the BOBLME (2000-2050) ..................................................................... 15
3.3 Patterns in nutrient export and source attribution across BOBLME watersheds (2000-2050) ........ 17
3.3.1 Nutrient loads and yields ........................................................................................................... 17
3.3.2 Nutrient sources ......................................................................................................................... 21
3.3.3 Potential for coastal eutrophication .......................................................................................... 24
4. Discussion and Conclusions ..................................................................................................................... 27
5. References ............................................................................................................................................... 29
ANNEX 1: Original Global NEWS Basins .......................................................................................................... 31
4
List of Figures
Figure 1: Conceptual diagram of the Global NEWS model construction, submodels and parameters (from Glibert et al. 2010 modified from Seitzinger et al. 2010) ................................................................................. 7
Figure 2: The 22 combined river basins draining into the Bay of Bengal LME as included in this study (>10 grid cells). .......................................................................................................................................................... 9
Figure 3: River export of nitrogen and phosphorus to the Bay of Bengal for the years 2000, 2030 and 2050 (Global Orchestration Scenario). The graphs present dissolved inorganic N and P (DIN and DIP), organic N and P (DON and DOP) and particulate N and P (PN and PP). ......................................................................... 15
Figure 4: Relative share of sources (%) in river export of nitrogen for the three largest three basins (Ganges, Irrawaddy, Godavari) and the total drainage area of the BOBLME for the years 2000, 2030 and 2050 (future scenarios for Global Orchestration). ......................................................................................... 16
Figure 5: Relative share of sources (%) in river export of phosphorus for the three largest three basins (Ganges, Irrawaddy, Godavari) and the total drainage area of the Bay of Bengal for the years 2000, 2030 and 2050 (future scenarios for Global Orchestration). .................................................................................. 16
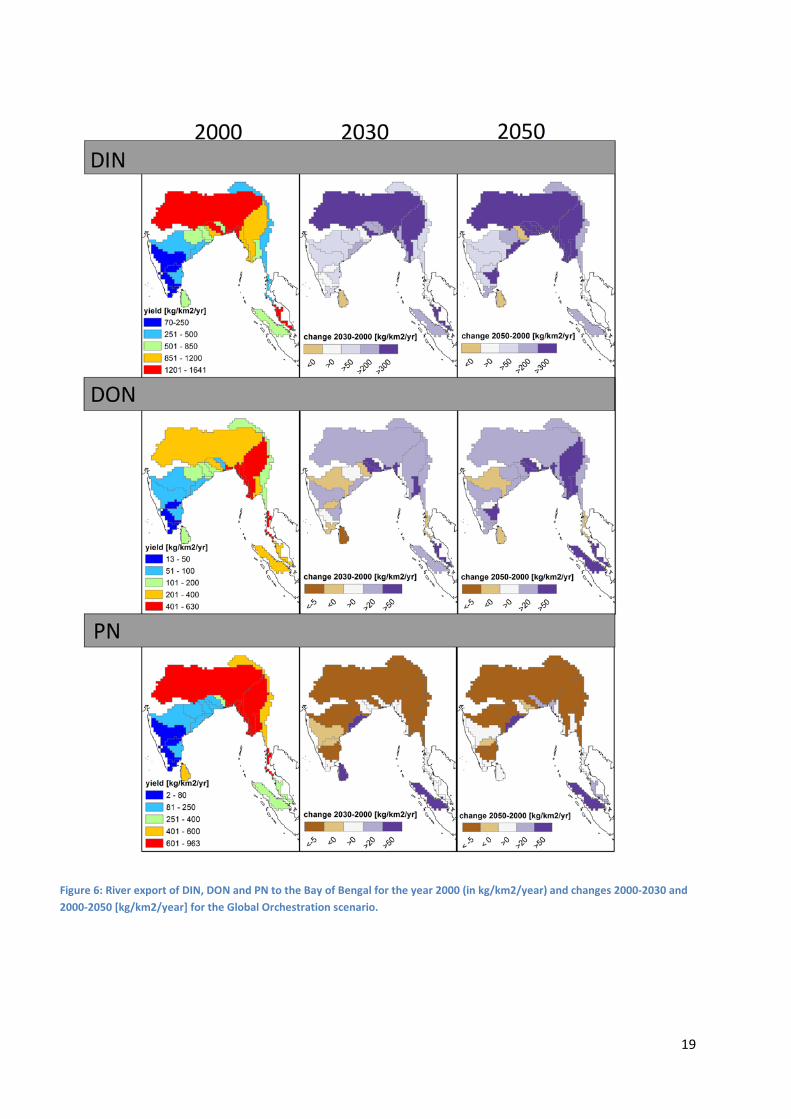
Figure 6: River export of DIN, DON and PN to the Bay of Bengal for the year 2000 (in kg/km2/year) and changes 2000-2030 and 2000-2050 [kg/km2/year] for the Global Orchestration scenario. ......................... 19
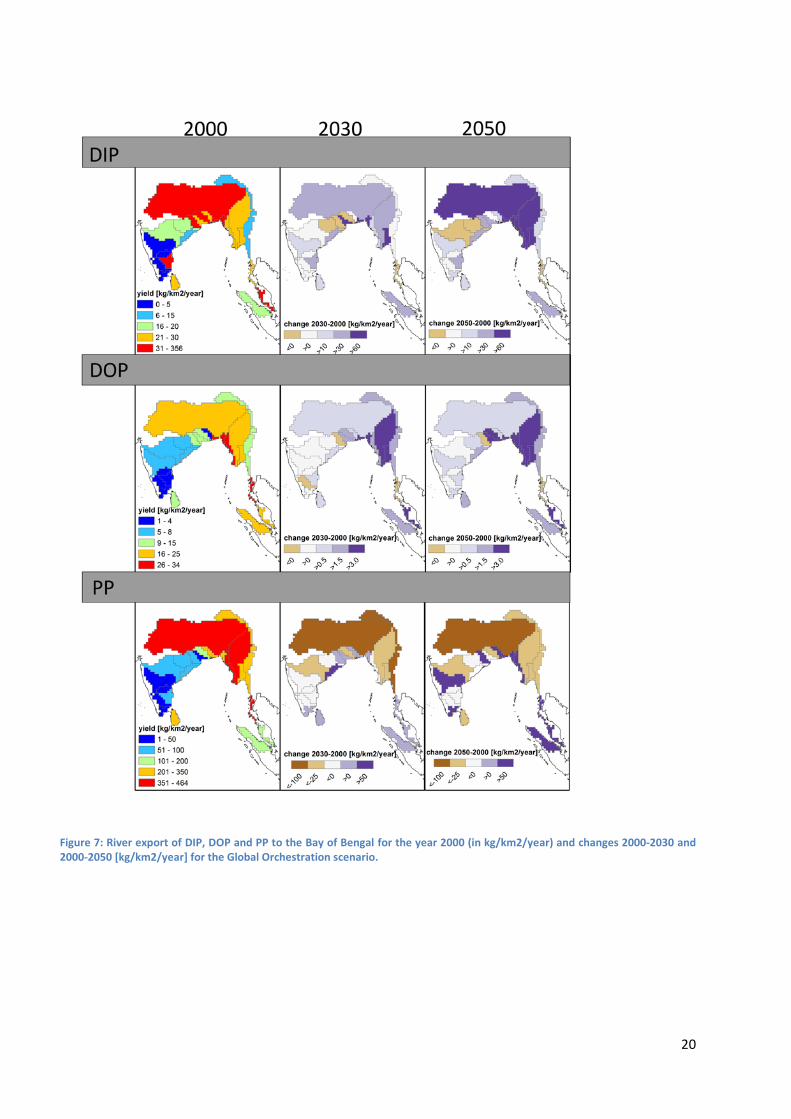
Figure 7: River export of DIP, DOP and PP to the Bay of Bengal for the year 2000 (in kg/km2/year) and changes 2000-2030 and 2000-2050 [kg/km2/year] for the Global Orchestration scenario. ......................... 20
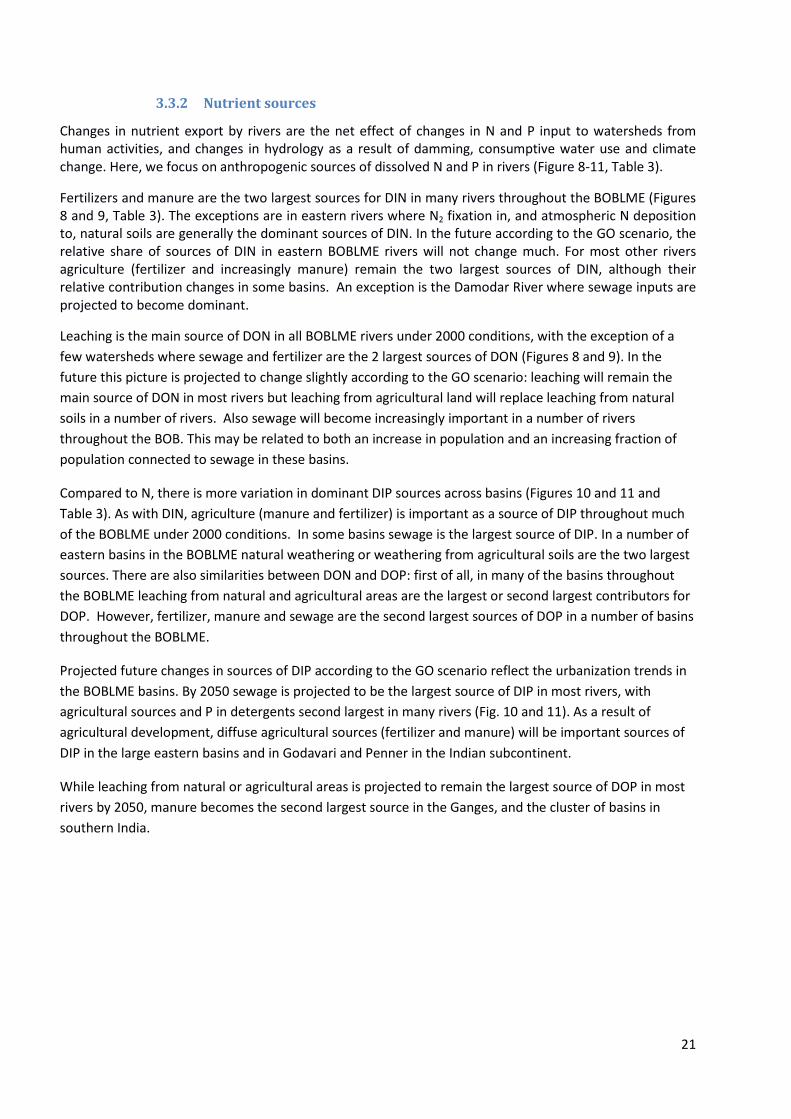
Figure 8: Largest source of DIN and DON yields transported from watersheds to the mouth of rivers in the BOBLME in 2000, and according to the Global Orchestration scenario in 2030 and 2050. ........................... 22
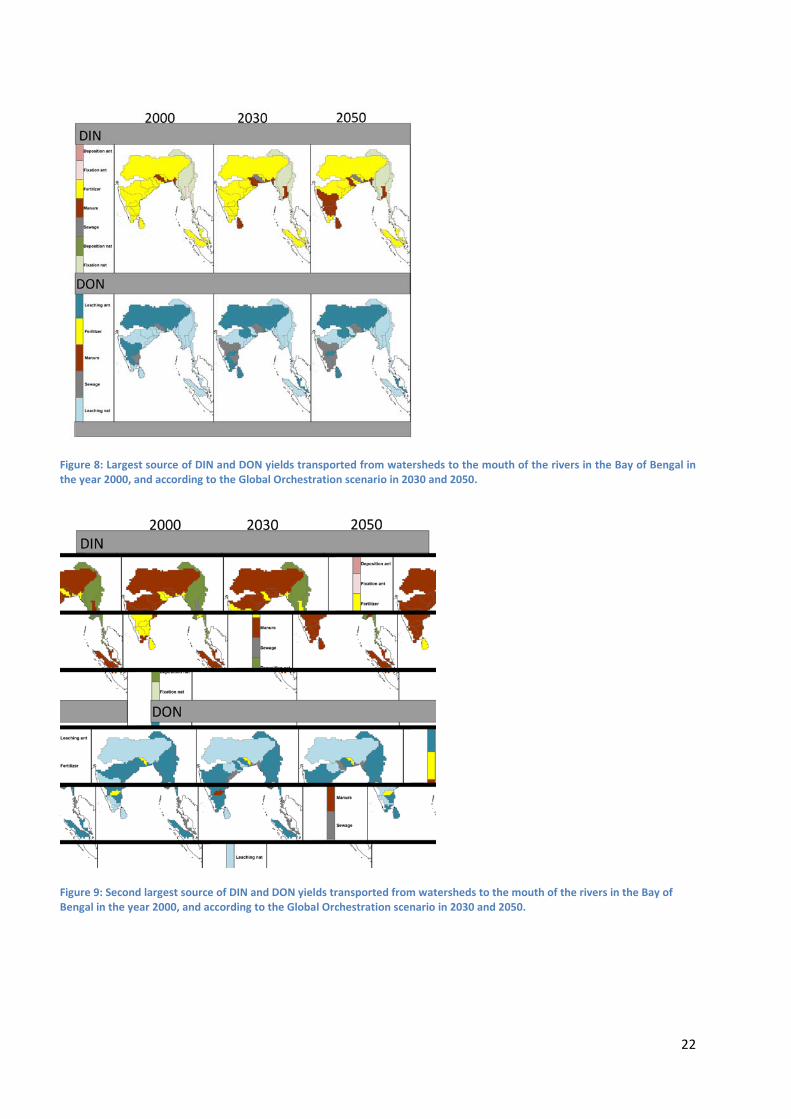
Figure 9: Second largest source of DIN and DON yields transported from watersheds to the mouth of the rivers in the Bay of Bengal in the years 2000, and according to the Global Orchestration scenario in 2030 and 2050. ........................................................................................................................................................ 22
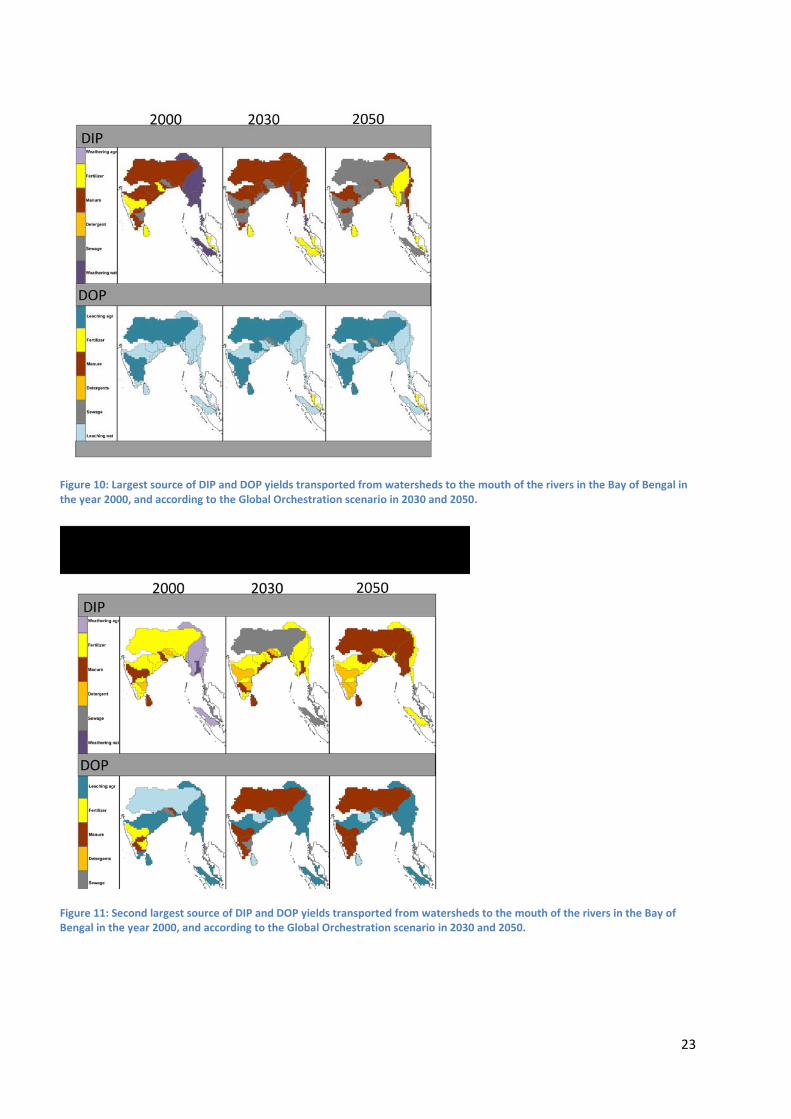
Figure 10: Largest source of DIP and DOP yields transported from watersheds to the mouth of rivers in the BOBLME in 2000, and according to the Global Orchestration scenario in 2030 and 2050. ........................... 23
Figure 11: Second largest source of DIP and DOP yields transported from watersheds to the mouth of rivers in the BOBLME in 2000, and according to the Global Orchestration scenario in 2030 and 2050. ....... 23
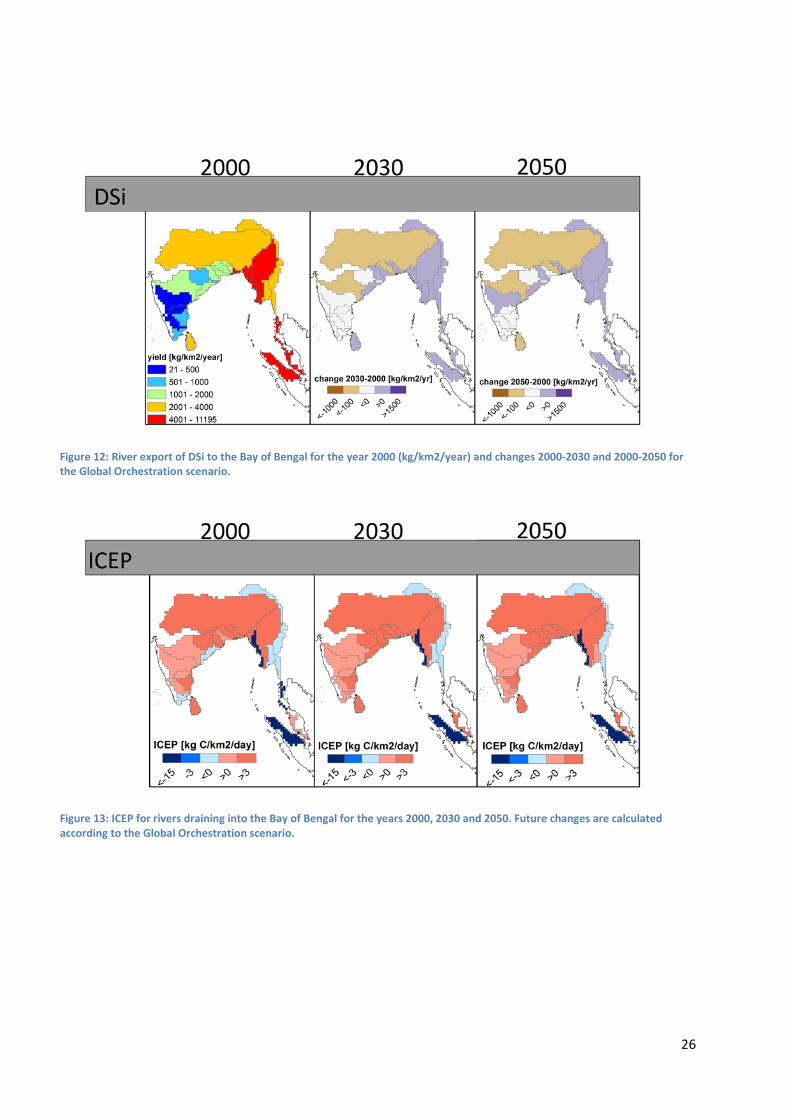
Figure 12: River export of DSi to the BOBLME for the year 2000 (kg/km2/year) and changes 2000-2030 and 2000-2050 for the Global Orchestration scenario. ......................................................................................... 26
Figure 13: ICEP for rivers draining into the Bay of Bengal for the years 2000, 2030 and 2050. Future changes are calculated according to the Global Orchestration scenario. ...................................................... 26
Figure A-1: The 133 original river basins draining into the Bay of Bengal assigned to the BOBLME before aggregation of small basins …………………………………………………………………………………………………………………….31
5
List of Tables
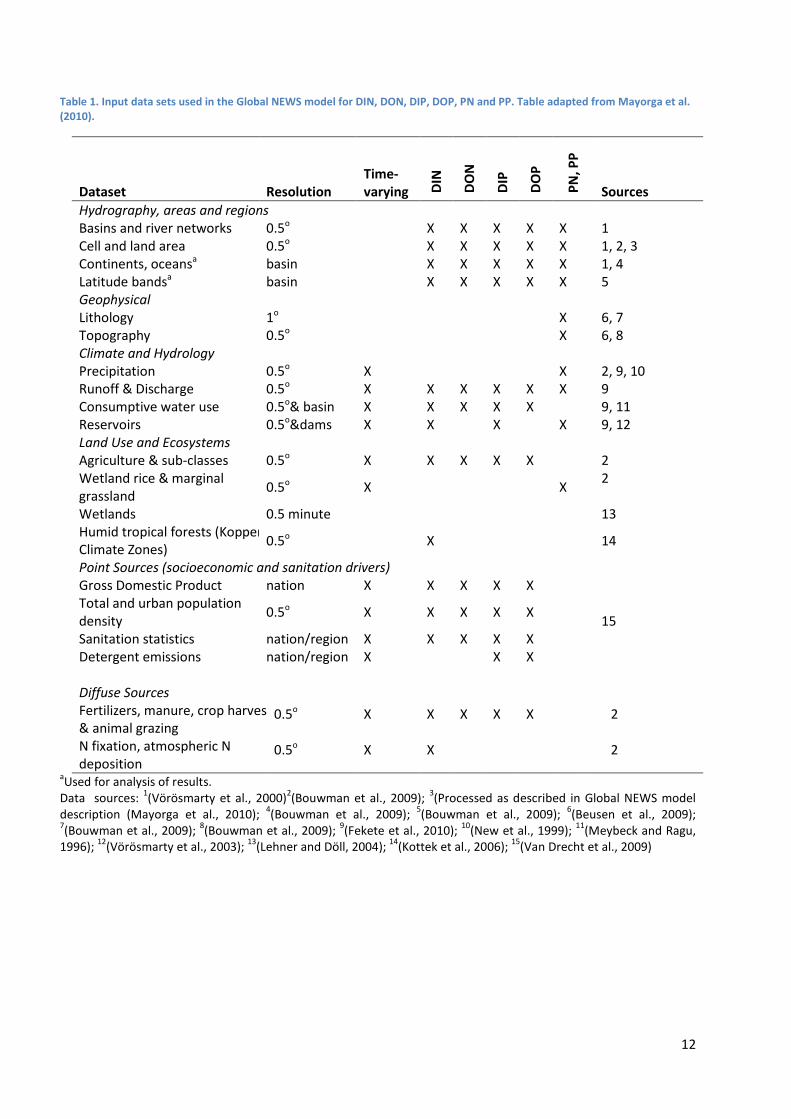
Table 1: Input data sets used in the Global NEWS model for DIN, DON, DIP, DOP, PN and PP. Table adapted from Mayorga et al. (2010). ............................................................................................................................ 12
Table 2: Selected drivers of river export of nutrients to the Bay of Bengal for the years 2000, 2030 and 2050 (percentage change relative to the year 2000) for the Global Orchestration (GO) scenario. ............... 14
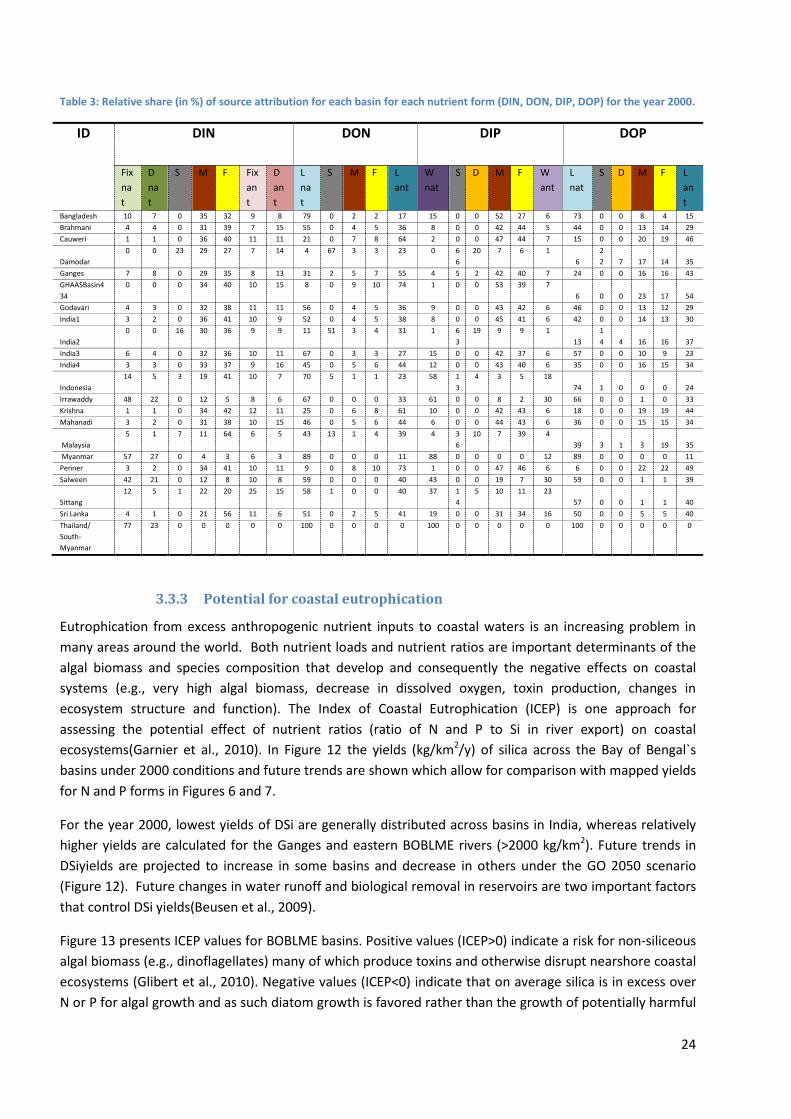
Table 3: Relative share (in %) of source attribution for each basin for each nutrient form (DIN, DON, DIP, DOP) for the year 2000. .................................................................................................................................. 24
Table A-4: List of selected basins of the Bay of Bengal study area................................................................. 32
6
1. Introduction
Land use and human activities in watersheds draining into the Bay of Bengal Large Marine Ecosystem (BOBLME) are affecting nutrients transported by rivers to the BOBLME. River transported nutrients can have positive effects on coastal systems by increasing coastal ecosystem productivity. However, excess nutrients or changes in nutrient ratios can lead to a number of negative changes in coastal ecosystems including algal blooms, alterations in community composition, production of toxic algae, hypoxic or anoxic conditions, and increased turbidity (Glibert et al. 2010).
The major anthropogenic sources of river nutrient loading are primarily associated with the production of food and energy. This includes, for example, runoff from fertilizer use and livestock production, sewage, and atmospheric deposition of nitrogen. Understanding the sources of nutrients in a watershed that are transported by rivers is important in managing current and understanding potential future loadings and effects. Future anthropogenic drivers of nutrient export to coastal waters, for example increases in population and urbanization, may increase pressures on the BOBLME.
There are few measurements available of river nutrient loadings over annual cycles in rivers discharging to the BOBLME. There also are few analyses of what the major nutrient sources are in these watersheds that contribute to the nutrient loading.
In this study we focus on contemporary and future trends in river export of nutrients to the Bay of Bengal. The information on nutrient loadings can be used in designing current and future policy actions for management measures to improve the ecosystem health of the BOBLME.
River delivered inputs of nitrogen (N), phosphorus (P) and silica (Si) to the Bay of Bengal for contemporary conditions, and for one future scenario for the years 2030 and 2050 as calculated by the Global NEWS model are presented (Seitzinger et al., 2010, Mayorga et al., 2010, Beusen et al., 2009). The major N and P sources are identified (e.g., sewage, agriculture from crops and from livestock, atmospheric deposition directly to watershed). We also present the Indicator of Coastal Eutrophication (ICEP) (Garnier et al., 2010) for rivers draining watersheds of the BOBLME. The calculations for future years are based on one scenario developed from the Millennium Ecosystem Assessment (MEA).
Relation to Transboundary Water Assessment Project (TWAP). This study directly builds on the river basin and LME components of the Global Environment Facility (GEF) TWAP. Both the GEF TWAP and this BOBLME project use the Global NEWS model and both address contemporary conditions, and 2030 and 2050 assessments from the MEA Global Orchestration scenario. However, this BOBLME project goes substantially beyond the TWAP in both the level of spatial detail of nutrient input to the LME (individual river basin information) and in providing N and P source information in the river basins draining into the BOBLME. In the TWAP, LME level information – not individual river basin information – is developed, and nutrient source attribution is not included.
2. Method
2.1 Global NEWS model
The Global NEWS model consists of spatially explicit and internally consistent sub-models unified in a single modelling framework quantifying multi-form and multi-element nutrient export loads of >5000
7
world rivers to coastal waters (Seitzinger et al., 2010, Mayorga et al., 2010, Beusen et al., 2009). It represents river networks and basins using the Simulated Topological Network at 0.5-degree x 0.5-degree grid-cell spatial resolution (STN-30p, version 6.01) (Mayorga et al., 2010, Vörösmarty et al., 2000). The relevant output of Global NEWS with respect to this project consists of basin scale annual export at the river mouth of: dissolved inorganic N and P (DIN and DIP), dissolved organic N and P (DON, DOP), and particulate forms of N and P (PN, PP) and dissolved silica (DSi).
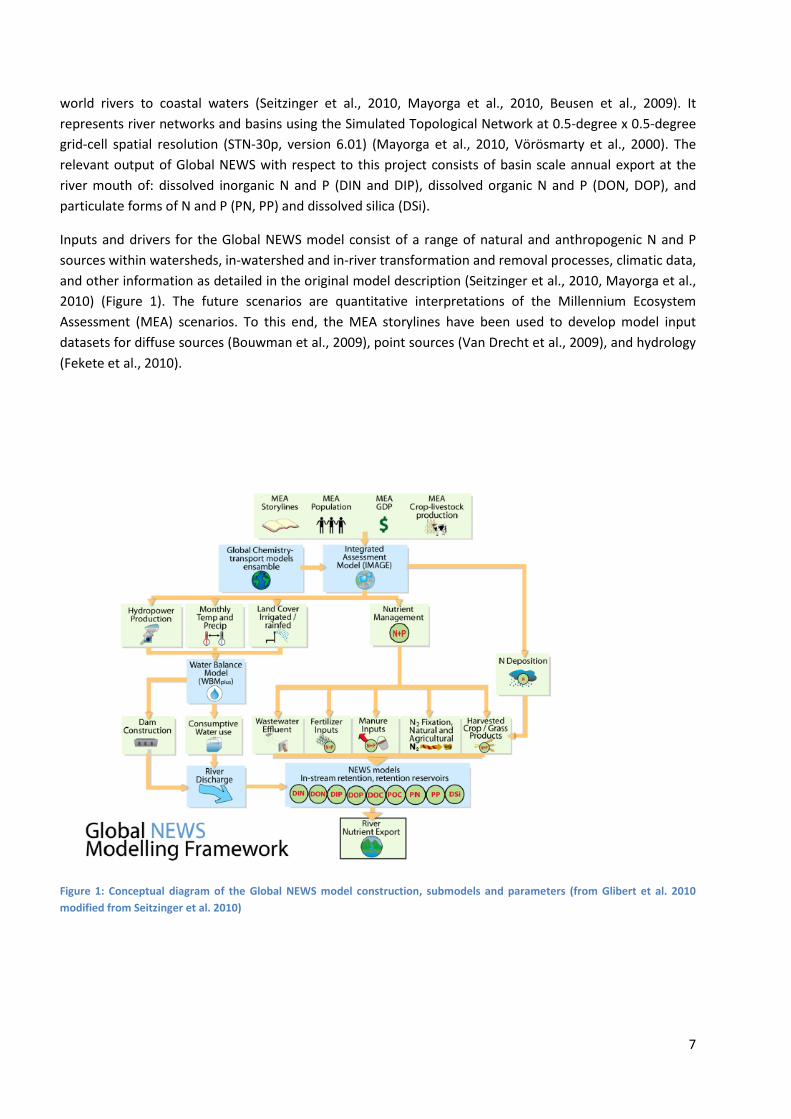
Inputs and drivers for the Global NEWS model consist of a range of natural and anthropogenic N and P sources within watersheds, in-watershed and in-river transformation and removal processes, climatic data, and other information as detailed in the original model description (Seitzinger et al., 2010, Mayorga et al., 2010) (Figure 1). The future scenarios are quantitative interpretations of the Millennium Ecosystem Assessment (MEA) scenarios. To this end, the MEA storylines have been used to develop model input datasets for diffuse sources (Bouwman et al., 2009), point sources (Van Drecht et al., 2009), and hydrology (Fekete et al., 2010).
Figure 1: Conceptual diagram of the Global NEWS model construction, submodels and parameters (from Glibert et al. 2010 modified from Seitzinger et al. 2010)
8
Global NEWS applies both process-based modeling approaches and more statistical methods and calibrated coefficients (Kroeze et al., 2012, Mayorga et al., 2010). The model consists of two sets of sub-models: (1) dissolved sub-models (N, P) based on a mass-balance approach for the riverine system, which allows for source attribution analysis to total export at the river mouth and (2) particulate sub-models and DSi built on lumped, multiple regression approaches unsuitable for source attribution. The source attribution analysis of the N and P dissolved sub-models (DIN, DON, DIP and DOP) are categorized in diffuse sources from natural processes, fertilizer leaching from crop production, livestock production, and atmospheric N deposition, and point sources from urban wastewater (human sewage) treatment.
Global NEWS was developed to estimate nutrient export from watersheds globally, to see overall spatial trends, and to elucidate changes over time under a range of scenarios. It was not developed for accuracy to any one river basin. A major strength of this model is its ability to model river export of multiple nutrients in several forms simultaneously in a comprehensive and spatially explicit manner. Moreover, it is the only globally applicable nutrient export model that can identify the sources of dissolved N and P in rivers. Furthermore, because it includes N, P and Si, Global NEWS can be used to calculate the Index of Coastal Eutrophication (ICEP). It should be recognized that the NEWS model was developed for application to watersheds globally, and was not specifically developed for the Bay of Bengal. The lack of nutrient monitoring data for many rivers throughout the BOBLME hampers the development of a model specifically for the Bay of Bengal, justifying the use of Global NEWS. Furthermore, while the model has been applied with global databases to watersheds globally, it has also been applied with more in-depth analysis to some specific world regions (Yasin et al., 2010, Yan et al., 2010, Van der Struijk and Kroeze, 2010).
2.2 Preparation of Global NEWS model for application to BOBLME watersheds
The BOBLME is bordered by Bangladesh, India, Indonesia, Malaysia, the Maldives, Myanmar, Sri Lanka and Thailand (Figure 2).
For this work we selected Global NEWS basins that drain into the BOBLME using the 2013 revision of the LME polygon boundaries shapefile obtained from http://www.lme.noaa.gov.
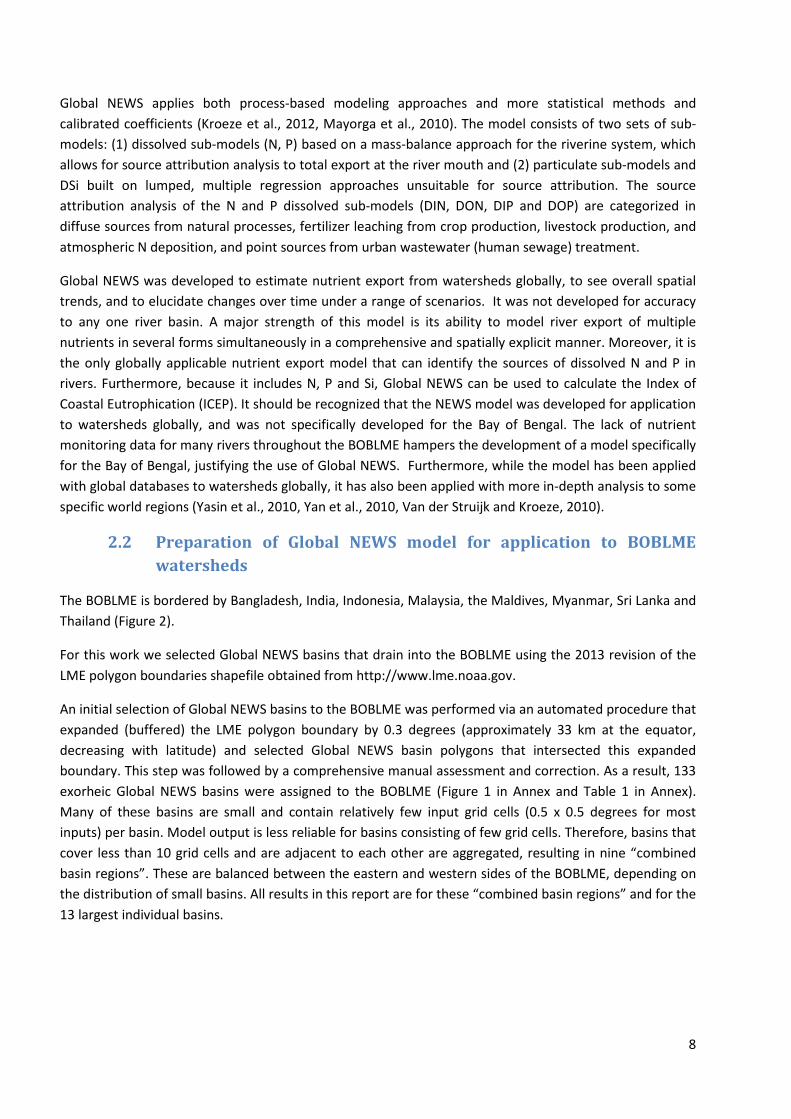
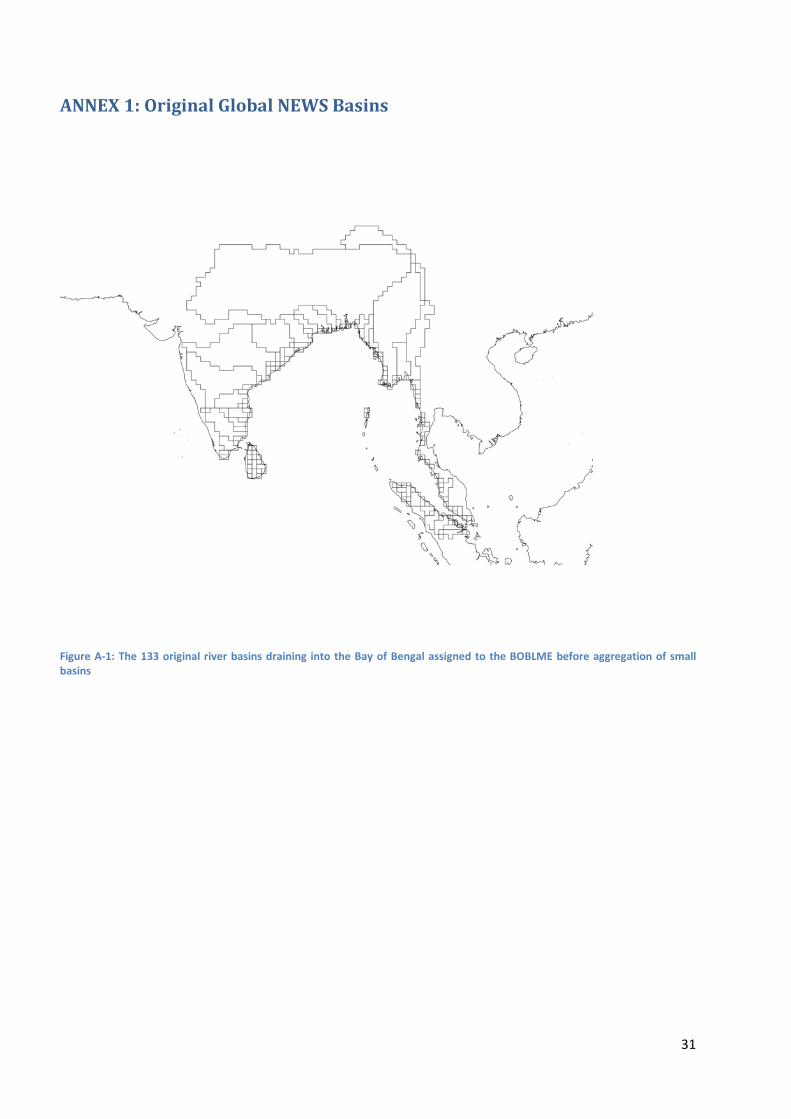
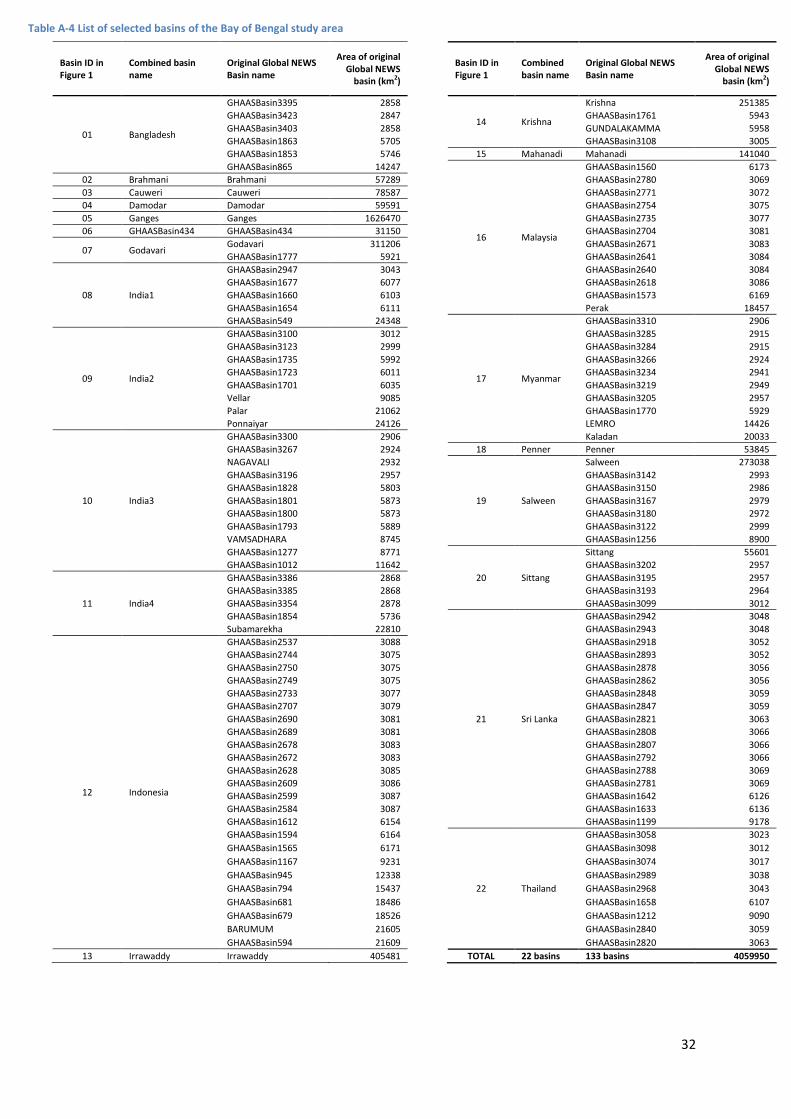
An initial selection of Global NEWS basins to the BOBLME was performed via an automated procedure that expanded (buffered) the LME polygon boundary by 0.3 degrees (approximately 33 km at the equator, decreasing with latitude) and selected Global NEWS basin polygons that intersected this expanded boundary. This step was followed by a comprehensive manual assessment and correction. As a result, 133 exorheic Global NEWS basins were assigned to the BOBLME (Figure 1 in Annex and Table 1 in Annex). Many of these basins are small and contain relatively few input grid cells (0.5 x 0.5 degrees for most inputs) per basin. Model output is less reliable for basins consisting of few grid cells. Therefore, basins that cover less than 10 grid cells and are adjacent to each other are aggregated, resulting in nine “combined basin regions”. These are balanced between the eastern and western sides of the BOBLME, depending on the distribution of small basins. All results in this report are for these “combined basin regions” and for the 13 largest individual basins.
9
Figure 2: The 22 combined river basins draining into the Bay of Bengal LME as included in this study (>10 grid cells).
The Global NEWS model was then used to analyze the following model output by river basin: annual river export of N by form (dissolved inorganic N, dissolved organic N, particulate N), total N (sum of N forms), P by form (dissolved inorganic P, dissolved organic P, particulate P), total P (sum of P forms), and dissolved Si. River export of nutrients is presented as load (Tg/year) or yield (kg/km2 basin/year). Moreover, the relative share of sources of nutrients in rivers are identified, including diffuse and point sources. Diffuse sources include natural soils, fertilizer leaching from crop production and animal production, and atmospheric N deposition. Point sources are from urban wastewater (human sewage) exports. Modeled yields for “combined basin regions” have been aggregated by summing the loads of the individual basins and dividing by total basin area as in equation 1:
( )∑
∑=
=⋅
= n
i
n
i
w
xwx
1 basin area
1 yieldbasin areayield (1)
2.3 Future scenario analysis for 2030 and 2050
Results for one future scenario for the years 2030 and 2050 were developed, based on the Global Orchestration MEA scenario. This scenario was chosen in consultation with BOBLME leadership.
Input databases to Global NEWS for future scenario analysis include several anthropogenic drivers derived directly from the MEA storylines (Figure 1). Additional inputs for nutrient management scenarios have been developed and added to these storylines to generate quantitative nutrient management scenarios and the input datasets for the Global NEWS model.
10
In brief, the MEA scenarios consist of internally consistent, plausible global futures and their implications for ecosystem services which differ in terms of environmental management (proactive and reactive) and in their degree and scale of international integration (globalization or regionalization) growth(Alcamo et al., 2005). These four scenarios are Global Orchestration (GO), Order from Strength (OS), TechnoGarden (TG), and Adapting Mosaic (AM). GO describes a globalized world with a focus on economic development with rapid economic and urbanization growth, and a reactive environmental management. OS describes a regionalized and segregated world with a focus on security and a reactive approach to environmental issues. TG describes a globalized world with a focus on environmentally sound technology and highly managed engineering solutions. AM describes a regionalized world with proactive socio-ecological management at regional and local scales, mostly through simple and economically feasible options.
As increased urbanization, and intensification of agriculture and economic activities are likely major drivers of increased nutrient loads in the Bay of Bengal, future trends for the years 2030 and 2050 are analyzed for the GO scenario. This scenario is also the most straightforward for interpretation against current conditions, and provides a reference point if additional analysis of one or more of the other MEA scenarios is undertaken in a future project. The GO scenario is also used in the river basin and LME components of the TWAP.
2.4 Application of gridded databases to Global NEWS for contemporary conditions and validation
Input datasets used in the Global NEWS model include various components of hydrography (areas and regions), geophysical, climate and hydrology, land use and ecosystems, and point and diffuse sources of nutrients (Table 1). The input datasets for the BOBLME watersheds were extracted from published global spatially gridded (generally 0.5o latitude x 0.5o longitude) data sources and applied to Global NEWS. Compared to earlier publications of the current version of Global NEWS, in this study we use a more realistic simulation for contemporary hydrological conditions (described in Mayorga et al., 2010) using climate observations (New et al., 1999) as drivers for the hydrological model (Water Balance Model Plus, WBMplus), and the discharge-gauge correction (Fekete et al., 2002). As in the global application, contemporary conditions correspond broadly to the year 2000 (Seitzinger et al., 2010, Mayorga et al., 2010).
The Global NEWS model has been validated and calibrated at the global scale, and has been used to analyze global trends in nutrient export by rivers (Seitzinger et al., 2010, Mayorga et al., 2010). It has also been successfully applied in continental scale studies for South America(Van der Struijk and Kroeze, 2010), Africa (Yasin et al., 2010) and China (Qu and Kroeze, 2010, Qu and Kroeze, 2012), and validated for the Bay of Bengal (Sattar et al., 2014).
2.5 Application of gridded databases to Global NEWS for 2030 and 2050 future scenario analysis
Input datasets for the 2030 and 2050 Global Orchestration (GO) scenario analysis were developed for Global NEWS (Seitzinger et al., 2010) and are summarized here. Inputs for population, Gross Domestic Product (GDP) and crop-livestock production were taken from the MEA directly. Additional input data sets were developed by interpreting the original MEA scenario. For example agricultural areas used net surface
11
N and P balances as input. These surface balances were based on N and P inputs from fertilizer use, animal manure application, N2-fixation by crops, atmospheric N deposition, and sewage N and P, minus N and P removal from crop harvest and animal grazing (Bouwman et al., 2009). The surface nutrient balances form the basis of the scenario assumptions for nutrient management in agriculture. Quantitative nutrient management scenarios used an updated version (2.4) of the Integrated Model for the Assessment of the Global Environment (IMAGE) (Bouwman et al., 2006). Regional scenarios for N and P fertilizer use were based on efficiency of N and P uptake in crop production (Bouwman et al., 2009). Manure production was computed from livestock production, animal numbers and excretion rates, and distributed over different animal manure managements systems (Bouwman et al., 2009). Livestock production was related to a number of factors including human population and diet. Atmospheric N deposition from natural and anthropogenic sources to all watersheds was from Bouwman et al. (2009). Natural ecosystem inputs include biological N2-fixation and atmospheric nitrogen deposition.
N and P flows in urban wastewater for 2030 and 2050 were calculated from influents to wastewater treatment systems computed from per capita incomes and stemming from human N and P emissions and P-based detergent use (Van Drecht et al., 2009). Each MEA storyline was interpreted to generate differing degrees of access to improved sanitation, connection to sewage systems, and nutrient removal in wastewater treatment systems (Van Drecht et al., 2009).
For hydropower production, the WBMplus hydrological model was driven with scenario estimates of monthly temperature and precipitation, land use, and irrigated and rainfed crop production areas from the IMAGE model to develop projections for construction of reservoirs (dams) and consumptive water use and irrigation (Fekete et al., 2010).
The published global scenario application of Global NEWS was based on modeled climate drivers (“Modeled Hydrology”) for both contemporary (year 2000) and future conditions (Seitzinger et al., 2010). To adjust modeled results for future conditions to the “Realistic Hydrology” baseline for contemporary conditions used here, we scaled published future nutrient exports (“X”) as follows:
Xyear = (X2000 Realistic Hydrology / X2000 Modeled Hydrology) * Xyear Modeled Hydrology (2)
where “year” is the scenario year (2030 or 2050) and (X2000 Realistic Hydrology / X2000 Modeled Hydrology) is the scaling factor.
12
Table 1. Input data sets used in the Global NEWS model for DIN, DON, DIP, DOP, PN and PP. Table adapted from Mayorga et al. (2010).
Dataset Resolution Time- varying DI
N
DON
DIP
DOP
PN, P
P
Sources Hydrography, areas and regions Basins and river networks 0.5o X X X X X 1 Cell and land area 0.5o X X X X X 1, 2, 3 Continents, oceansa basin X X X X X 1, 4 Latitude bandsa basin X X X X X 5 Geophysical Lithology 1o X 6, 7 Topography 0.5o X 6, 8 Climate and Hydrology Precipitation 0.5o X X 2, 9, 10 Runoff & Discharge 0.5o X X X X X X 9 Consumptive water use 0.5o& basin X X X X X 9, 11 Reservoirs 0.5o&dams X X X X 9, 12 Land Use and Ecosystems Agriculture & sub-classes 0.5o X X X X X 2 Wetland rice & marginal grassland 0.5o X X 2
Wetlands 0.5 minute 13 Humid tropical forests (Koppen Climate Zones) 0.5o X 14
Point Sources (socioeconomic and sanitation drivers) Gross Domestic Product nation X X X X X
15 Total and urban population density 0.5o X X X X X
Sanitation statistics nation/region X X X X X Detergent emissions nation/region X X X Diffuse Sources Fertilizers, manure, crop harves & animal grazing N fixation, atmospheric N deposition
0.5o X X X X X 2
0.5o X X 2
aUsed for analysis of results. Data sources: 1(Vörösmarty et al., 2000)2(Bouwman et al., 2009); 3(Processed as described in Global NEWS model description (Mayorga et al., 2010); 4(Bouwman et al., 2009); 5(Bouwman et al., 2009); 6(Beusen et al., 2009); 7(Bouwman et al., 2009); 8(Bouwman et al., 2009); 9(Fekete et al., 2010); 10(New et al., 1999); 11(Meybeck and Ragu, 1996); 12(Vörösmarty et al., 2003); 13(Lehner and Döll, 2004); 14(Kottek et al., 2006); 15(Van Drecht et al., 2009)
13
2.6 Indicator for Coastal Eutrophication Potential (ICEP)
In order to estimate the potential for eutrophication in the near shore waters of the Bay of Bengal we calculate, for each river basin, an Indicator for Coastal Eutrophication (ICEP), which is based on the Redfield molar ratio (C:N:P:Si=106:16:1:20) (Garnier et al., 2010). This indicator assumes that N and P levels in excess of Si may favour growth of potentially harmful non-siliceous algae.
According to Garnier et al. (2010), ICEP is calculated for N (when N is limiting) and P (when P is limiting) as follows:
N-ICEP = [NFlx/14·16 - SiFlx/28·20] ·106·12 (3)
P-ICEP = [PFlx/31 - SiFlx/28·20] ·106·12 (4)
Where
PFlx, NFlx and SiFlx are the fluxes (yields) of total N (TN), total P (TP) and dissolved silica (DSi), respectively, delivered at the mouth of river. N, P and silica fluxes are expressed in kg/km2 basin/day. ICEP is expressed in kg C/km2/day. Total N and P fluxes are calculated as the sum of the three constituent elemental forms as shown in equations (5) and (6), respectively, whereas silica fluxes are derived from Beusen et al. (2009):
NFlx = DINyield + DONyield + PNyield (5)
PFlx = DIPyield + DOPyield + PPyield (6)
Considering that the N:P ratio is indicative of which nutrient (N or P) is most limiting, we have opted for a combined ICEP (indicated simply as ICEP) for which we use the N or P ICEP with the lowest value (Garnier et al. 2010).
A negative ICEP (ICEP<0) indicates a low potential for coastal eutrophication as a result of non-siliceous algae development. A positive ICEP (ICEP >0) indicates a potential risk of coastal eutrophication.
3. Nutrient exports and eutrophication potential in the Bay of Bengal from 2000 to 2050
3.1 Drivers of N and P export by rivers
Important drivers of changes in N and P export by rivers include trends in population, GDP and the associated N and P inputs to soils and changes in hydrology (Table 2).
According to the GO scenario, GDP increases faster between 2000 and 2050 than the population in the BOBLME. The population density increases by about one-third, and the urban population by about two-thirds. GDP is projected to increase by a factor 7-11.
Total inputs of N and P to rivers from point sources (sewage) are projected to increase by more than a factor of three between 2000 and 2050 based on the GO scenario. This is a result of the population increase and the assumed increase in the percentage of people connected to sewage systems (Van Drecht
14
et al., 2009). In addition, the amount of P in sewage may increase because a more widespread use of P detergents.
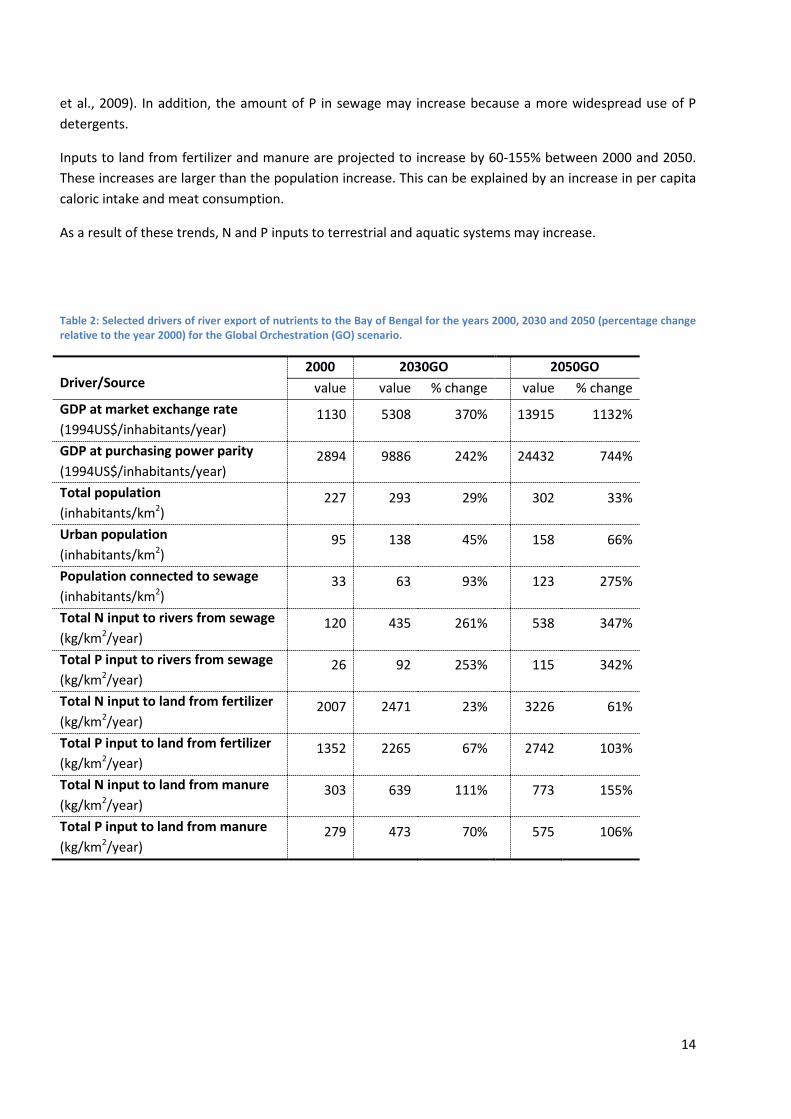
Inputs to land from fertilizer and manure are projected to increase by 60-155% between 2000 and 2050. These increases are larger than the population increase. This can be explained by an increase in per capita caloric intake and meat consumption.
As a result of these trends, N and P inputs to terrestrial and aquatic systems may increase.
Table 2: Selected drivers of river export of nutrients to the Bay of Bengal for the years 2000, 2030 and 2050 (percentage change relative to the year 2000) for the Global Orchestration (GO) scenario.
Driver/Source 2000 2030GO 2050GO
value value % change value % change GDP at market exchange rate (1994US$/inhabitants/year)
1130 5308 370% 13915 1132%
GDP at purchasing power parity (1994US$/inhabitants/year)
2894 9886 242% 24432 744%
Total population (inhabitants/km2)
227 293 29% 302 33%
Urban population (inhabitants/km2)
95 138 45% 158 66%
Population connected to sewage (inhabitants/km2)
33 63 93% 123 275%
Total N input to rivers from sewage (kg/km2/year)
120 435 261% 538 347%
Total P input to rivers from sewage (kg/km2/year)
26 92 253% 115 342%
Total N input to land from fertilizer (kg/km2/year)
2007 2471 23% 3226 61%
Total P input to land from fertilizer (kg/km2/year)
1352 2265 67% 2742 103%
Total N input to land from manure (kg/km2/year)
303 639 111% 773 155%
Total P input to land from manure (kg/km2/year)
279 473 70% 575 106%
15
3.2 River export of nutrients in the BOBLME (2000-2050)
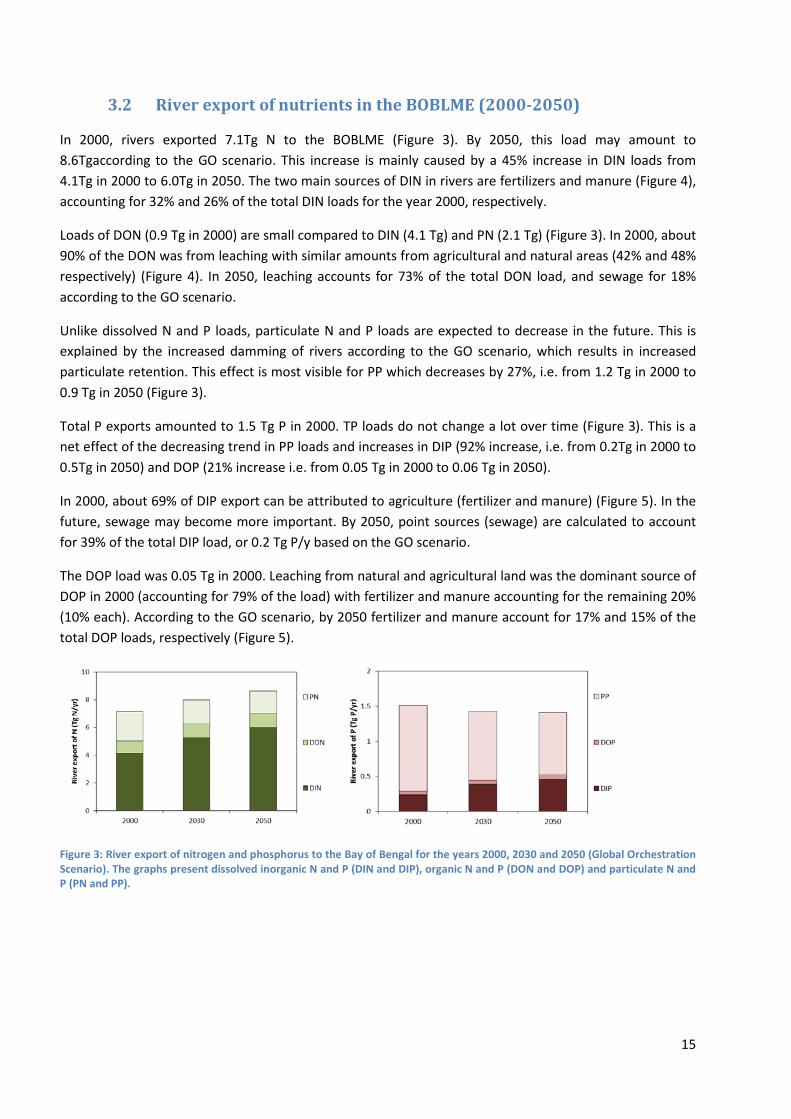
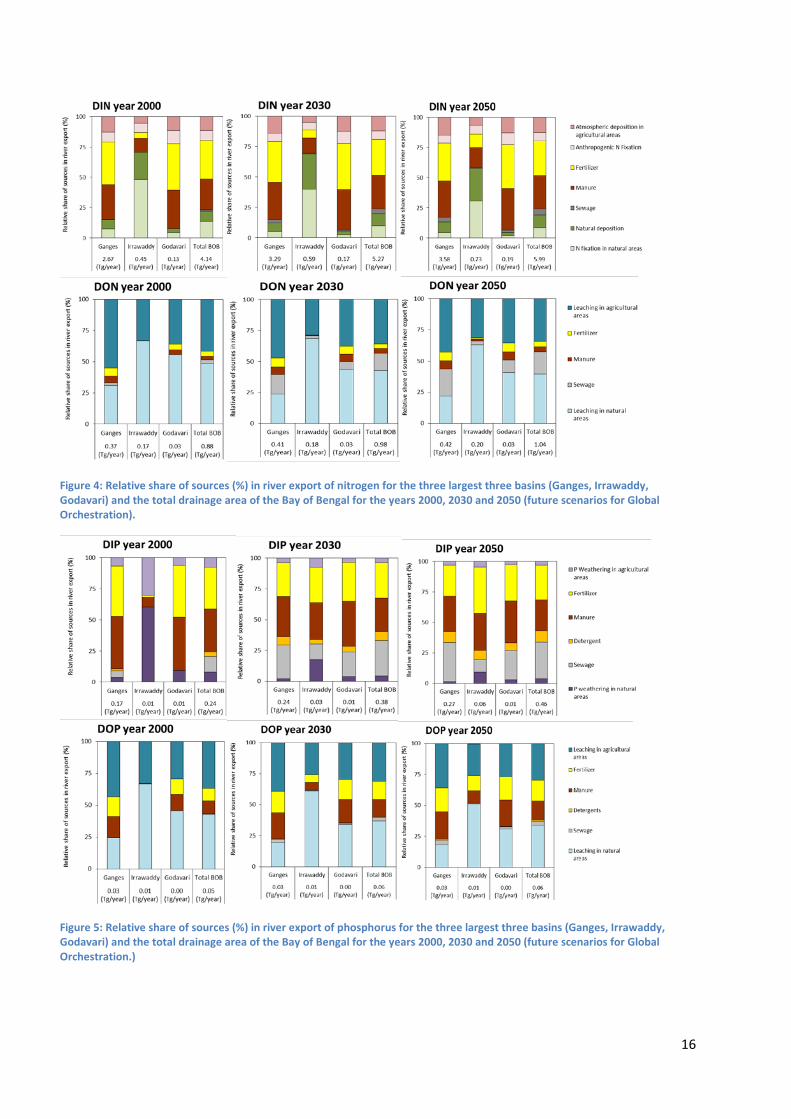
In 2000, rivers exported 7.1Tg N to the BOBLME (Figure 3). By 2050, this load may amount to 8.6Tgaccording to the GO scenario. This increase is mainly caused by a 45% increase in DIN loads from 4.1Tg in 2000 to 6.0Tg in 2050. The two main sources of DIN in rivers are fertilizers and manure (Figure 4), accounting for 32% and 26% of the total DIN loads for the year 2000, respectively.
Loads of DON (0.9 Tg in 2000) are small compared to DIN (4.1 Tg) and PN (2.1 Tg) (Figure 3). In 2000, about 90% of the DON was from leaching with similar amounts from agricultural and natural areas (42% and 48% respectively) (Figure 4). In 2050, leaching accounts for 73% of the total DON load, and sewage for 18% according to the GO scenario.
Unlike dissolved N and P loads, particulate N and P loads are expected to decrease in the future. This is explained by the increased damming of rivers according to the GO scenario, which results in increased particulate retention. This effect is most visible for PP which decreases by 27%, i.e. from 1.2 Tg in 2000 to 0.9 Tg in 2050 (Figure 3).
Total P exports amounted to 1.5 Tg P in 2000. TP loads do not change a lot over time (Figure 3). This is a net effect of the decreasing trend in PP loads and increases in DIP (92% increase, i.e. from 0.2Tg in 2000 to 0.5Tg in 2050) and DOP (21% increase i.e. from 0.05 Tg in 2000 to 0.06 Tg in 2050).
In 2000, about 69% of DIP export can be attributed to agriculture (fertilizer and manure) (Figure 5). In the future, sewage may become more important. By 2050, point sources (sewage) are calculated to account for 39% of the total DIP load, or 0.2 Tg P/y based on the GO scenario.
The DOP load was 0.05 Tg in 2000. Leaching from natural and agricultural land was the dominant source of DOP in 2000 (accounting for 79% of the load) with fertilizer and manure accounting for the remaining 20% (10% each). According to the GO scenario, by 2050 fertilizer and manure account for 17% and 15% of the total DOP loads, respectively (Figure 5).
Figure 3: River export of nitrogen and phosphorus to the Bay of Bengal for the years 2000, 2030 and 2050 (Global Orchestration Scenario). The graphs present dissolved inorganic N and P (DIN and DIP), organic N and P (DON and DOP) and particulate N and P (PN and PP).
16
Figure 4: Relative share of sources (%) in river export of nitrogen for the three largest three basins (Ganges, Irrawaddy, Godavari) and the total drainage area of the Bay of Bengal for the years 2000, 2030 and 2050 (future scenarios for Global Orchestration).
Figure 5: Relative share of sources (%) in river export of phosphorus for the three largest three basins (Ganges, Irrawaddy, Godavari) and the total drainage area of the Bay of Bengal for the years 2000, 2030 and 2050 (future scenarios for Global Orchestration.)
17
3.3 Patterns in nutrient export and source attribution across BOBLME watersheds (2000-2050)
3.3.1 Nutrient loads and yields
Two units for nutrient export are used in this study, load and yield. Load is expressed as the total amount of an element (e.g., N, P, Si by form) exported from the watersheds to the mouth of the river, in units of Tg per year (Tg = 1012 g). Yield is also the amount of an element exported to the mouth of the river but is normalized by basin areas with units of kg per km2 of watershed per year. Yield can provide insight into the intensity of anthropogenic activity in a watershed. Yield is particularly useful in comparing the intensity of nutrient export across watersheds of widely different sizes. Eutrophication in coastal systems is related more to the amount (load) rather than the yield of nutrients exported. In addition the ratio of nutrients (N, P and Si) is important in determining the response of coastal systems to nutrient export, as discussed later. Algal blooms develop locally and temporally, and depend on nutrient loads, ratios and local conditions. The river nutrient loads and ratios from BOBLME rivers likely most directly affect the near coastal regions (estuaries, bays), as they would be substantially altered through biological processing and dilution both within near coastal regions and in open waters of the BOBLME. Beyond nutrients, the particular morphological, climatic and hydrological conditions, including temporal variations, also are important in determining the response of both near coastal systems and the open waters of the BOBLME to nutrient loads and ratios. Evaluating the exact response of the BOBLME to the river nutrient export would require further modeling and analysis with coastal hydrological-biogeochemical-ecosystem models.
The analysis of the total loads in the Bay of Bengal in the previous section gives insight in the
magnitude of the total nutrient inputs to the BOBLME. Three rivers have a relatively large share in the total nutrient export: the Godavari, Ganges and Irrawaddy. In the year 2000, these three basins were responsible for 79% of total DIN river export (load) to the BOBLME, 65% of total DON load, 76% of total DIP load and 68% of total DOP load. The six rivers with the highest DIN loads are the Ganges, Irrawaddy, Godavari, Salween, Indonesia, and Mahanadi1 which are also 6 of the 7 largest basins of the Bay of Bengal. As noted above, the degree of eutrophication (algal blooms, anoxia, etc.) in response to nutrient loads will be a function of not only the magnitude of the nutrient loading but also will depend on the local morphological and hydrological conditions. Therefore, rivers with smaller nutrient loads can also lead to eutrophication in estuaries and bays. Furthermore, rivers with large discharges might rapidly transport their nutrients and their effects further offshore.
For the year 2000 the six rivers with the highest DIN yields include the Ganges, Bangladesh, Malaysia
and Damodar (>1200 kg N/km2/y) and Irrawaddy, Myanmar, and India4 (>850 kg N/km2/y) (Figure 6), indicating high intensity of land use (nutrient input to the watersheds). A number of basins in Europe and North America have similarly high DIN yields (Seitzinger et al. 2010).
Dissolved N and P yields and loads are projected to increase between 2000 and 2050 from most basins
as a result of increased N and P inputs within the river basins (Figure 4-6; Table 2 Annex). These increases can be large, up to more than a factor of 5 for DIP and more than a doubling for DIN and DON. For a few basins a small decrease is calculated.
1 For river basin names, please refer to Table A-4 (Annex): List of selected basins of the Bay of Bengal study area
18
River export of particulate N and P decreases in all large basins and in some smaller basins as well (both yield and loads). This can be explained by changes in hydrology largely associated with damming of rivers and consumptive water use based on GO scenario.
It is interesting to note that for some western BOB basins the DIP yields decrease between 2000 and
2030, and increase between 2030 and 2050. This is caused by assumed damming of rivers between 2000 and 2030, increasing DIP retention in the reservoirs. From 2030 onwards DIP yields increase again as a result of human activities increasing P input to the landscape and rivers.
19
Figure 6: River export of DIN, DON and PN to the Bay of Bengal for the year 2000 (in kg/km2/year) and changes 2000-2030 and 2000-2050 [kg/km2/year] for the Global Orchestration scenario.
20
Figure 7: River export of DIP, DOP and PP to the Bay of Bengal for the year 2000 (in kg/km2/year) and changes 2000-2030 and 2000-2050 [kg/km2/year] for the Global Orchestration scenario.
21
3.3.2 Nutrient sources
Changes in nutrient export by rivers are the net effect of changes in N and P input to watersheds from human activities, and changes in hydrology as a result of damming, consumptive water use and climate change. Here, we focus on anthropogenic sources of dissolved N and P in rivers (Figure 8-11, Table 3).
Fertilizers and manure are the two largest sources for DIN in many rivers throughout the BOBLME (Figures 8 and 9, Table 3). The exceptions are in eastern rivers where N2 fixation in, and atmospheric N deposition to, natural soils are generally the dominant sources of DIN. In the future according to the GO scenario, the relative share of sources of DIN in eastern BOBLME rivers will not change much. For most other rivers agriculture (fertilizer and increasingly manure) remain the two largest sources of DIN, although their relative contribution changes in some basins. An exception is the Damodar River where sewage inputs are projected to become dominant.
Leaching is the main source of DON in all BOBLME rivers under 2000 conditions, with the exception of a few watersheds where sewage and fertilizer are the 2 largest sources of DON (Figures 8 and 9). In the future this picture is projected to change slightly according to the GO scenario: leaching will remain the main source of DON in most rivers but leaching from agricultural land will replace leaching from natural soils in a number of rivers. Also sewage will become increasingly important in a number of rivers throughout the BOB. This may be related to both an increase in population and an increasing fraction of population connected to sewage in these basins.
Compared to N, there is more variation in dominant DIP sources across basins (Figures 10 and 11 and Table 3). As with DIN, agriculture (manure and fertilizer) is important as a source of DIP throughout much of the BOBLME under 2000 conditions. In some basins sewage is the largest source of DIP. In a number of eastern basins in the BOBLME natural weathering or weathering from agricultural soils are the two largest sources. There are also similarities between DON and DOP: first of all, in many of the basins throughout the BOBLME leaching from natural and agricultural areas are the largest or second largest contributors for DOP. However, fertilizer, manure and sewage are the second largest sources of DOP in a number of basins throughout the BOBLME.
Projected future changes in sources of DIP according to the GO scenario reflect the urbanization trends in the BOBLME basins. By 2050 sewage is projected to be the largest source of DIP in most rivers, with agricultural sources and P in detergents second largest in many rivers (Fig. 10 and 11). As a result of agricultural development, diffuse agricultural sources (fertilizer and manure) will be important sources of DIP in the large eastern basins and in Godavari and Penner in the Indian subcontinent.
While leaching from natural or agricultural areas is projected to remain the largest source of DOP in most rivers by 2050, manure becomes the second largest source in the Ganges, and the cluster of basins in southern India.
22
Figure 8: Largest source of DIN and DON yields transported from watersheds to the mouth of the rivers in the Bay of Bengal in the year 2000, and according to the Global Orchestration scenario in 2030 and 2050.
Figure 9: Second largest source of DIN and DON yields transported from watersheds to the mouth of the rivers in the Bay of Bengal in the year 2000, and according to the Global Orchestration scenario in 2030 and 2050.
23
Figure 10: Largest source of DIP and DOP yields transported from watersheds to the mouth of the rivers in the Bay of Bengal in the year 2000, and according to the Global Orchestration scenario in 2030 and 2050.
Figure 11: Second largest source of DIP and DOP yields transported from watersheds to the mouth of the rivers in the Bay of Bengal in the year 2000, and according to the Global Orchestration scenario in 2030 and 2050.
24
Table 3: Relative share (in %) of source attribution for each basin for each nutrient form (DIN, DON, DIP, DOP) for the year 2000.
ID DIN DON DIP DOP
Fix nat
D nat
S M F Fix ant
D ant
L nat
S M F L ant
W nat
S D M F W ant
L nat
S D M F L ant
Bangladesh 10 7 0 35 32 9 8 79 0 2 2 17 15 0 0 52 27 6 73 0 0 8 4 15 Brahmani 4 4 0 31 39 7 15 55 0 4 5 36 8 0 0 42 44 5 44 0 0 13 14 29 Cauweri 1 1 0 36 40 11 11 21 0 7 8 64 2 0 0 47 44 7 15 0 0 20 19 46
Damodar 0 0 23 29 27 7 14 4 67 3 3 23 0 6
6 20 7 6 1
6 22 7 17 14 35
Ganges 7 8 0 29 35 8 13 31 2 5 7 55 4 5 2 42 40 7 24 0 0 16 16 43 GHAASBasin434
0 0 0 34 40 10 15 8 0 9 10 74 1 0 0 53 39 7 6 0 0 23 17 54
Godavari 4 3 0 32 38 11 11 56 0 4 5 36 9 0 0 43 42 6 46 0 0 13 12 29 India1 3 2 0 36 41 10 9 52 0 4 5 38 8 0 0 45 41 6 42 0 0 14 13 30
India2 0 0 16 30 36 9 9 11 51 3 4 31 1 6
3 19 9 9 1
13 14 4 16 16 37
India3 6 4 0 32 36 10 11 67 0 3 3 27 15 0 0 42 37 6 57 0 0 10 9 23 India4 3 3 0 33 37 9 16 45 0 5 6 44 12 0 0 43 40 6 35 0 0 16 15 34
Indonesia 14 5 3 19 41 10 7 70 5 1 1 23 58 1
3 4 3 5 18
74 1 0 0 0 24 Irrawaddy 48 22 0 12 5 8 6 67 0 0 0 33 61 0 0 8 2 30 66 0 0 1 0 33 Krishna 1 1 0 34 42 12 11 25 0 6 8 61 10 0 0 42 43 6 18 0 0 19 19 44 Mahanadi 3 2 0 31 38 10 15 46 0 5 6 44 6 0 0 44 43 6 36 0 0 15 15 34
Malaysia 5 1 7 11 64 6 5 43 13 1 4 39 4 3
6 10 7 39 4
39 3 1 3 19 35 Myanmar 57 27 0 4 3 6 3 89 0 0 0 11 88 0 0 0 0 12 89 0 0 0 0 11 Penner 3 2 0 34 41 10 11 9 0 8 10 73 1 0 0 47 46 6 6 0 0 22 22 49 Salween 42 21 0 12 8 10 8 59 0 0 0 40 43 0 0 19 7 30 59 0 0 1 1 39
Sittang 12 5 1 22 20 25 15 58 1 0 0 40 37 1
4 5 10 11 23
57 0 0 1 1 40 Sri Lanka 4 1 0 21 56 11 6 51 0 2 5 41 19 0 0 31 34 16 50 0 0 5 5 40 Thailand/ South-Myanmar
77 23 0 0 0 0 0 100 0 0 0 0 100 0 0 0 0 0 100 0 0 0 0 0
3.3.3 Potential for coastal eutrophication
Eutrophication from excess anthropogenic nutrient inputs to coastal waters is an increasing problem in many areas around the world. Both nutrient loads and nutrient ratios are important determinants of the algal biomass and species composition that develop and consequently the negative effects on coastal systems (e.g., very high algal biomass, decrease in dissolved oxygen, toxin production, changes in ecosystem structure and function). The Index of Coastal Eutrophication (ICEP) is one approach for assessing the potential effect of nutrient ratios (ratio of N and P to Si in river export) on coastal ecosystems(Garnier et al., 2010). In Figure 12 the yields (kg/km2/y) of silica across the Bay of Bengal`s basins under 2000 conditions and future trends are shown which allow for comparison with mapped yields for N and P forms in Figures 6 and 7.
For the year 2000, lowest yields of DSi are generally distributed across basins in India, whereas relatively higher yields are calculated for the Ganges and eastern BOBLME rivers (>2000 kg/km2). Future trends in DSiyields are projected to increase in some basins and decrease in others under the GO 2050 scenario (Figure 12). Future changes in water runoff and biological removal in reservoirs are two important factors that control DSi yields(Beusen et al., 2009).
Figure 13 presents ICEP values for BOBLME basins. Positive values (ICEP>0) indicate a risk for non-siliceous algal biomass (e.g., dinoflagellates) many of which produce toxins and otherwise disrupt nearshore coastal ecosystems (Glibert et al., 2010). Negative values (ICEP<0) indicate that on average silica is in excess over N or P for algal growth and as such diatom growth is favored rather than the growth of potentially harmful
25
algal species. However, negative ICEP values do not guarantee that there is no coastal eutrophication, since high biomass algal blooms (e.g. diatoms) may develop due to high nutrient loads. Neither nutrient loads nor ICEP take into account the particular morphological, climatic and hydrological conditions, including temporal variations, which also are important in determining the response of algae in coastal systems. However, as Garnier et al. (2010) have shown, positive ICEP values indicate that the yearly averaged N and P loads favor non-siliceous algal species, and should therefore be considered a strong indication that the coastal waters are at risk. As noted above for nutrient loads (Section 3.3.1), the effects of river delivery of nutrients (loads and ratios) is likely most strongly expressed in near shore receiving waters (estuaries and bays).
For the BOBLME basins, we generally calculate positive ICEP values (Figure 13) indicating a risk for development of non-siliceous algal biomass in the near coastal zone. According to the GO scenario by 2050, the ICEP values for a number of basins become more positive relative to 2000, indicating an increased risk. There are a few exceptions. For Salween and Sittang the present low potential for non-siliceous algal biomass will remain low (for Sittang there will be a decrease after 2030). The decrease in river export of particulate nutrients (especially for Salween) and an increase in DSi (especially for Sittang) compensate for an overall increase in dissolved N and P over time. We calculate a decreasing potential for coastal eutrophication for a number of smaller coastal river basins around the BOBLME. This is mostly associated with increasing DSi yields (e.g., Krishna and Indonesia).
26
Figure 12: River export of DSi to the Bay of Bengal for the year 2000 (kg/km2/year) and changes 2000-2030 and 2000-2050 for the Global Orchestration scenario.
Figure 13: ICEP for rivers draining into the Bay of Bengal for the years 2000, 2030 and 2050. Future changes are calculated according to the Global Orchestration scenario.
27
4. Discussion, Conclusions and Future Directions
The Global NEWS model has been applied to watersheds throughout the BOBLME for approximate year 2000 conditions and future trends. The future trends that we present here are based on the Global Orchestration scenario, which is one of the Millennium Ecosystem Assessment scenarios. We selected this scenario because it assumes a globalized socio-economic development, and a reactive approach towards ecosystem management. It should be noted however, that other scenarios may be as likely as this scenario. We also would like to stress that the scenario is a “what if” scenario, projecting environmental changes on the basis of assumptions on human activities in the future.
The important conclusions of this study include:
• In 2000, rivers exported 7.1 Tg N and 1.5 Tg P to the BOBLME. By 2050, the N load may amount to 8.6 Tg, while the P load will not change much. This is the net effect of increasing loads for dissolved N and P, and decreasing loads for particulate N and P.
• Future trends in N and P river export differ substantially among basins. • Dissolved N and P yields are projected to increase between 2000 and 2050 from most basins.
These increases can be large, up to more than a factor of 5 for DIP and more than a doubling for DIN and DON.
• The increases in dissolved N and P loads are associated primarily with increased N and P in agriculture and with an increasing population and economic development.
• The decreases in particulate N and P loads are associated with changes in hydrology, and most importantly with damming of rivers, increasing the retention of total suspended solids.
• We generally calculate positive ICEP values for BOBLME rivers, indicating a risk for coastal eutrophication of non-siliceous algal blooms. In the future, based on the Global Orchestration scenario, the ICEP values are generally higher than in 2000, indicating an increased risk.
• The dominant sources of the different forms of N and P differ across basins. Thus effective management of coastal eutrophication calls for a basin-specific approach. In general, we may conclude that agriculture is an important source of dissolved inorganic N in rivers, and sewage of dissolved inorganic P.
Future directions:
Next steps to consider for open waters of the BOBLME. A few large rivers (Ganges, Godavari and Irrawaddy) contribute approximately 75-80% of the N and P loads to the BOBLME overall. It follows that, in order to reduce eutrophication effects in the open waters of the BOBLME, reductions in nutrient loads from those major rivers would be targeted for reduction using the information in this report. Coupled hydrodynamic-biogeochemical-ecosystem models of the BOBLME coupled with river nutrient loads provided in this report would be useful in understanding the effects of current, and potential future, nutrient loading from BOBLME watersheds on the BOBLME ecosystem (e.g., algal blooms, hypoxic conditions, etc.). One such modeling effort is under development by the Sustained Indian Ocean Biogeochemistry and Ecosystem Research activity (SIBER) of IGBP’s Integrated Marine Biogeochemistry and Ecosystem Research (IMBER) project (http://www.imber.info/index.php/Science/Regional-Programmes/SIBER).
28
Next steps to consider for Bay of Bengal near coastal systems (estuaries, bays) would be to identify those near coastal systems with signs of eutrophication (e.g., high phytoplankton biomass, high abundances of harmful non-siliceous phytoplankton species such as dinoflagellates, low oxygen conditions, degradation of seagrass environments). The river basins draining into those coastal systems could then be targeted for nutrient reductions using the information on major nutrient sources provided in this report. Projected future trends in nutrient loadings based on the scenario analyses presented here also could be used to avoid future eutrophication in specific coastal areas.
Improvements in the accuracy of current and future river nutrient export and source identification will be facilitated by monitoring of nutrient export in BOBLME rivers (for comparison with model predictions and refinement of model parameterization), development of higher resolution gridded databases of nutrient use, nutrient management practices, hydrology, etc. for the river basins, and monitoring of environmental conditions in coastal ecosystems.
29
5. References ALCAMO, J., VAN VUUREN, D., CRAMER, W., ALDER, J., BENNETT, E., CARPENTER, S., CHRISTENSEN, V.,
FOLEY, J., MAERKER, M., MASUI, T., MORITA, T., O’NEILL, B., PETERSON, B., RINGLER, C., ROSEGRANT, M., SCHULZE, R., BOUWMAN, L., EICKHOUT, B., FLOERKE, M., LAL, R., K., T., SINH, B. T., HAMMOND, A. & FIELD, C. 2005. Chapter 9. Changes in Ecosystem Services and Their Drivers across the Scenarios. In: CARPENTER, S., PINGALI, P., BENNET, E. & ZUREK, M. (eds.) Millennium Ecosystem Assessment. Volume 2: Scenarios. Washington: Island Press.
BEUSEN, A. H. W., BOUWMAN, A. F., DÜRR, H. H., DEKKERS, A. L. M. & HARTMANN, J. 2009. Global patterns of dissolved silica export to the coastal zone: Results from a spatially explicit global model. Global Biogeochem. Cycles, 23, GB0A02, doi:10.1029/2008GB003281
BOUWMAN, A. F., BEUSEN, A. H. W. & BILLEN, G. 2009. Human alteration of the global nitrogen and phosphorus soil balances for the period 1970-2050. Global Biogeochemical Cycles, 23, GB0A04, doi:10.1029/2009GB003576
BOUWMAN, A. F., KRAM, T. & KLEIN GOLDEWIJK, K. (eds.) 2006. Integrated Modelling of Global Environmental Change. An overview of IMAGE 2.4, Bilthoven: Netherlands Environmental Assessment Agency (MNP).
FEKETE, B., VÖRÖSMARTY, C. & GRABS, W. 2002. High-resolution fields of global runoff combining observed river discharge and simulated water balances. Global Biogeochemical Cycles 16 Glob Biogeochem Cycles, 16, 1042, doi:10.1029/1999GB001254.
FEKETE, B. M., WISSER, D., KROEZE, C., MAYORGA, E., BOUWMAN, A. F., WOLLHEIM, W. M. & VÖRÖSMARTY, C. J. 2010. Millennium Ecosystem Assessment Scenario drivers (1970-2050): Climate and hydrological alterations. Global Biogeochemical Cycles, doi:10.1029/2009GB003593.
GARNIER, J., BEUSEN, A. H. W., THIEU, V., BILLEN, G. & BOUWMAN, A. F. 2010. N:P:Si nutrient export ratios and ecological consequences in coastal seas evaluated by the ICEP approach Global Biogeochemical Cycles, doi:10.1029/2009GB003583.
GLIBERT, P.M., ALLEN, J.I., BOUWMAN, A.F., BROWN, C.W., FLYNN, K.J., LEWITUS, A.J & MADDEN, C.J. 2010. Modeling of HABs and eutrophication: Status, avances, challenges. Journal of Marine Systems, 83, 262-275.
KOTTEK, M., GRIESER, J., RGEN, BECK, C., RUDOLF, B. & RUBEL, F. 2006. World Map of the Koppen-Geiger climate classification updated. Meteorologische Zeitschrift, 15, 259-263.
KROEZE, C., BOUWMAN, L. & SEITZINGER, S. 2012. Modeling global nutrient export from watersheds. Current Opinion in Environmental Sustainability, 4, 195-202.
LEHNER, B. & DÖLL, P. 2004. Development and validation of a global database of lakes, reservoirs and wetlands. Journal of Hydrology, 296, 1-22.
MAYORGA, E., SEITZINGER, S. P., HARRISON, J. A., DUMONT, E., BEUSEN, A. H. W., BOUWMAN, A. F., FEKETE, B. M., KROEZE, C. & VAN DRECHT, G. 2010. Global Nutrient Export from WaterSheds 2 (NEWS 2): Model development and implementation. Environmental Modelling & Software, 25, 837-853.
MEYBECK, M. & RAGU, A. 1996. River discharges to the oceans: An assessment of suspended solids, major ions, and nutrients, Paris, U.N. Environment Programme.
NEW, M., HULME, M. & JONES, P. 1999. Representing Twentieth-Century Time Climate Variability. Part I: Development of a Mean Monthly Terrestrial Climatology. Journal of Climate, 12, 829-856.
QU, H. & KROEZE, C. 2012. Nutrient export by rivers to the coastal waters of China: Management strategies and future trends. Regional Environmental Change, 12, 153-167.
QU, H. J. & KROEZE, C. 2010. Past and future trends in nutrients export by rivers to the coastal waters of China. Science of The Total Environment, 408, 2075-2086.
SATTAR, M. A., KROEZE, C. & STROKAL, M. 2014. The increasing impact of food production on nutrient export by rivers to the Bay of Bengal 1970-2050. Mar. Pollut. Bull., 8, 168-178.
SEITZINGER, S., EMILIO MAYORGA, E., BOUWMAN, A. F., KROEZE, C., BEUSEN, A. H. W., BILLEN, G., VAN DRECHT, G., DUMONT, E., FEKETE, B. M., GARNIER, J. & HARRISON, J. 2010. Global River Nutrient
30
Export: A Scenario Analysis of Past and Future Trends. Global Biogeochemical Cycles, doi:10.1029/2009GB003587.
VAN DER STRUIJK, F. & KROEZE, C. 2010. Future Trends in Nutrient Export to the Coastal Waters of South America: Implications for Occurrence of Eutrophication. Global Biogeochemical Cycles, doi:10.1029/2009GB003572.
VAN DRECHT, G., BOUWMAN, A. F., HARRISON, J. & KNOOP, J. M. 2009. Global nitrogen and phosphate in urban wastewater for the period 1970 to 2050. Global Biogeochem. Cycles, 23, GB0A03.
VÖRÖSMARTY, C., MEYBECK, M., FEKETE, B., SHARMA, K., GREEN, P. & SYVITSKI, J. P. M. 2003. Anthropogenic sediment retention: major global impact from registered river impoundments. Global and Planetary Change, 39, 169-190.
VÖRÖSMARTY, C. J., FEKETE, B. M., MEYBECK, M. & LAMMERS, R. B. 2000. Global system of rivers: Its role in organizing continental land mass and defining land-to-ocean linkages. Global Biogeochemical Cycles, 14, 599-621.
YAN, W., MAYORGA, E., LI, X., SEITZINGER, S. P. & BOUWMAN, A. F. 2010. Increasing anthropogenic nitrogen inputs and riverine DIN exports from the Changjiang River basin under changing human pressures. Global Biogeochemical Cycles, doi:10.1029/2009GB003575.
YASIN, J. A., KROEZE, C. & MAYORGA, E. 2010. Nutrients export by rivers to the coastal waters of Africa: Past and future trends. Global Biogeochemical Cycles, 24, GB0A07.
31
ANNEX 1: Original Global NEWS Basins
Figure A-1: The 133 original river basins draining into the Bay of Bengal assigned to the BOBLME before aggregation of small basins
32
Basin ID in Figure 1
Combined basin name
Original Global NEWS Basin name
Area of original Global NEWS
basin (km2)
Basin ID in Figure 1
Combined basin name
Original Global NEWS Basin name
Area of original Global NEWS
basin (km2)
01 Bangladesh
GHAASBasin3395 2858
14 Krishna
Krishna 251385 GHAASBasin3423 2847
GHAASBasin1761 5943
GHAASBasin3403 2858
GUNDALAKAMMA 5958 GHAASBasin1863 5705
GHAASBasin3108 3005
GHAASBasin1853 5746
15 Mahanadi Mahanadi 141040 GHAASBasin865 14247
16 Malaysia
GHAASBasin1560 6173 02 Brahmani Brahmani 57289
GHAASBasin2780 3069
03 Cauweri Cauweri 78587
GHAASBasin2771 3072 04 Damodar Damodar 59591
GHAASBasin2754 3075
05 Ganges Ganges 1626470
GHAASBasin2735 3077 06 GHAASBasin434 GHAASBasin434 31150
GHAASBasin2704 3081
07 Godavari Godavari 311206
GHAASBasin2671 3083
GHAASBasin1777 5921
GHAASBasin2641 3084
08 India1
GHAASBasin2947 3043
GHAASBasin2640 3084 GHAASBasin1677 6077
GHAASBasin2618 3086
GHAASBasin1660 6103
GHAASBasin1573 6169 GHAASBasin1654 6111
Perak 18457
GHAASBasin549 24348
17 Myanmar
GHAASBasin3310 2906
09 India2
GHAASBasin3100 3012
GHAASBasin3285 2915 GHAASBasin3123 2999
GHAASBasin3284 2915
GHAASBasin1735 5992
GHAASBasin3266 2924 GHAASBasin1723 6011
GHAASBasin3234 2941
GHAASBasin1701 6035
GHAASBasin3219 2949 Vellar 9085
GHAASBasin3205 2957
Palar 21062
GHAASBasin1770 5929 Ponnaiyar 24126
LEMRO 14426
10 India3
GHAASBasin3300 2906
Kaladan 20033 GHAASBasin3267 2924
18 Penner Penner 53845
NAGAVALI 2932
19 Salween
Salween 273038 GHAASBasin3196 2957
GHAASBasin3142 2993
GHAASBasin1828 5803
GHAASBasin3150 2986 GHAASBasin1801 5873
GHAASBasin3167 2979
GHAASBasin1800 5873
GHAASBasin3180 2972 GHAASBasin1793 5889
GHAASBasin3122 2999
VAMSADHARA 8745
GHAASBasin1256 8900 GHAASBasin1277 8771
20 Sittang
Sittang 55601 GHAASBasin1012 11642
GHAASBasin3202 2957
11 India4
GHAASBasin3386 2868
GHAASBasin3195 2957 GHAASBasin3385 2868
GHAASBasin3193 2964
GHAASBasin3354 2878
GHAASBasin3099 3012 GHAASBasin1854 5736
21 Sri Lanka
GHAASBasin2942 3048 Subamarekha 22810
GHAASBasin2943 3048
12 Indonesia
GHAASBasin2537 3088
GHAASBasin2918 3052 GHAASBasin2744 3075
GHAASBasin2893 3052
GHAASBasin2750 3075
GHAASBasin2878 3056 GHAASBasin2749 3075
GHAASBasin2862 3056
GHAASBasin2733 3077
GHAASBasin2848 3059 GHAASBasin2707 3079
GHAASBasin2847 3059
GHAASBasin2690 3081
GHAASBasin2821 3063 GHAASBasin2689 3081
GHAASBasin2808 3066
GHAASBasin2678 3083
GHAASBasin2807 3066 GHAASBasin2672 3083
GHAASBasin2792 3066
GHAASBasin2628 3085
GHAASBasin2788 3069 GHAASBasin2609 3086
GHAASBasin2781 3069
GHAASBasin2599 3087
GHAASBasin1642 6126 GHAASBasin2584 3087
GHAASBasin1633 6136
GHAASBasin1612 6154
GHAASBasin1199 9178 GHAASBasin1594 6164
22 Thailand
GHAASBasin3058 3023 GHAASBasin1565 6171
GHAASBasin3098 3012
GHAASBasin1167 9231
GHAASBasin3074 3017 GHAASBasin945 12338
GHAASBasin2989 3038
GHAASBasin794 15437
GHAASBasin2968 3043 GHAASBasin681 18486
GHAASBasin1658 6107
GHAASBasin679 18526
GHAASBasin1212 9090 BARUMUM 21605
GHAASBasin2840 3059
GHAASBasin594 21609
GHAASBasin2820 3063 13 Irrawaddy Irrawaddy 405481
TOTAL 22 basins 133 basins 4059950
Table A-4 List of selected basins of the Bay of Bengal study area
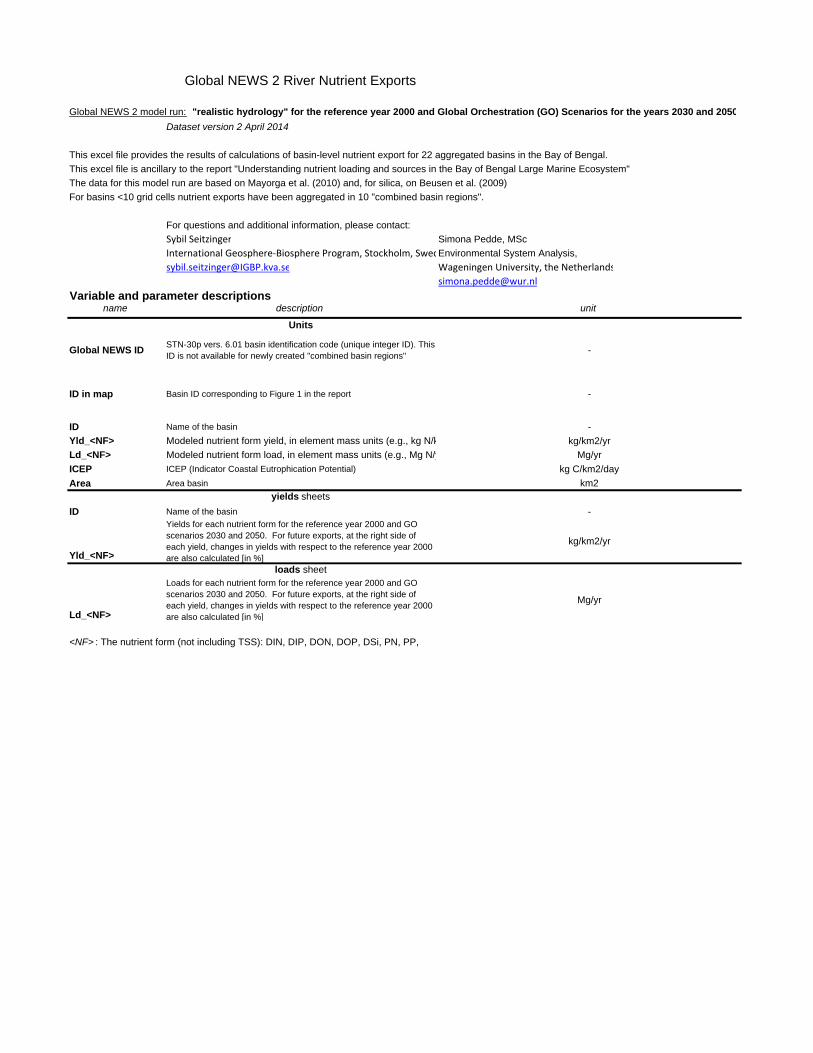
Global NEWS 2 River Nutrient Exports
Global NEWS 2 model run: "realistic hydrology" for the reference year 2000 and Global Orchestration (GO) Scenarios for the years 2030 and 2050Dataset version 2 April 2014
This excel file provides the results of calculations of basin-level nutrient export for 22 aggregated basins in the Bay of Bengal. This excel file is ancillary to the report "Understanding nutrient loading and sources in the Bay of Bengal Large Marine Ecosystem"The data for this model run are based on Mayorga et al. (2010) and, for silica, on Beusen et al. (2009) For basins <10 grid cells nutrient exports have been aggregated in 10 "combined basin regions".
For questions and additional information, please contact:Sybil Seitzinger Simona Pedde, MSc International Geosphere‐Biosphere Program, Stockholm, SwedEnvironmental System Analysis, [email protected] Wageningen University, the Netherlands
Variable and parameter descriptionsname description unit
Units
Global NEWS ID STN-30p vers. 6.01 basin identification code (unique integer ID). This ID is not available for newly created "combined basin regions" -
ID in map Basin ID corresponding to Figure 1 in the report -
ID Name of the basin -Yld_<NF> Modeled nutrient form yield, in element mass units (e.g., kg N/k kg/km2/yrLd_<NF> Modeled nutrient form load, in element mass units (e.g., Mg N/y Mg/yrICEP ICEP (Indicator Coastal Eutrophication Potential) kg C/km2/dayArea Area basin km2
yields sheetsID Name of the basin -
Yld_<NF>
Yields for each nutrient form for the reference year 2000 and GO scenarios 2030 and 2050. For future exports, at the right side of each yield, changes in yields with respect to the reference year 2000 are also calculated [in %]
kg/km2/yr
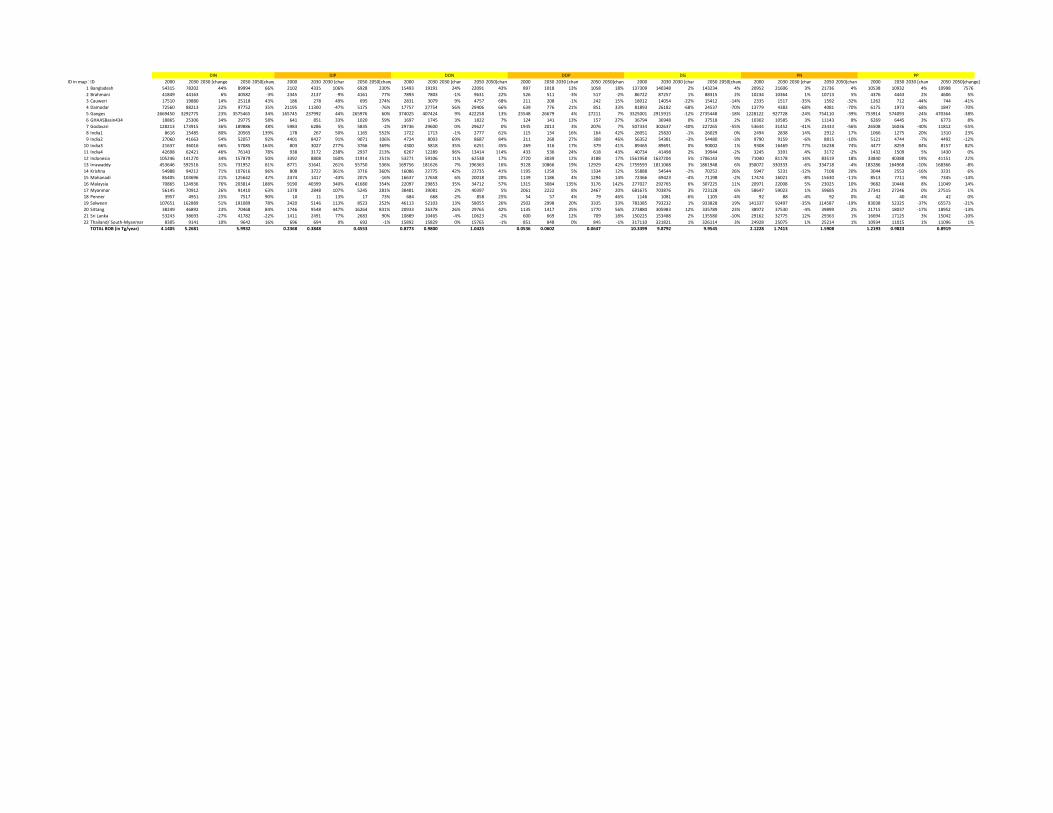
loads sheet
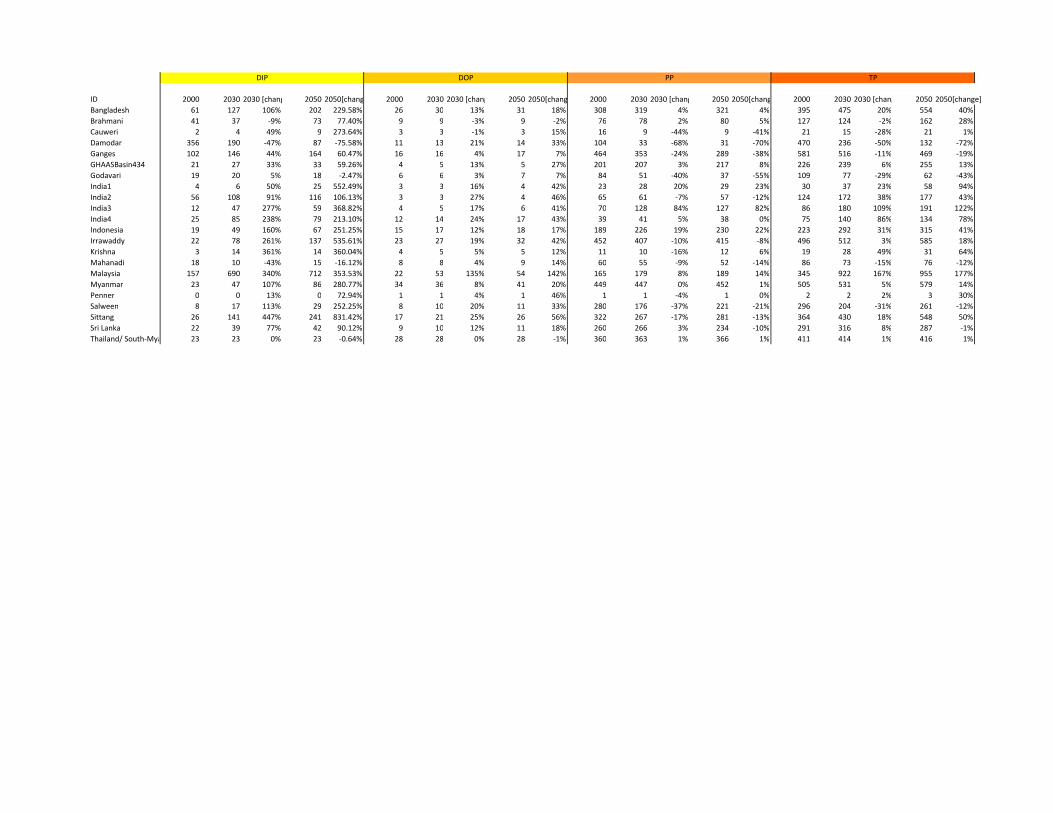
Ld_<NF>
Loads for each nutrient form for the reference year 2000 and GO scenarios 2030 and 2050. For future exports, at the right side of each yield, changes in yields with respect to the reference year 2000 are also calculated [in %]
Mg/yr
<NF> : The nutrient form (not including TSS): DIN, DIP, DON, DOP, DSi, PN, PP,
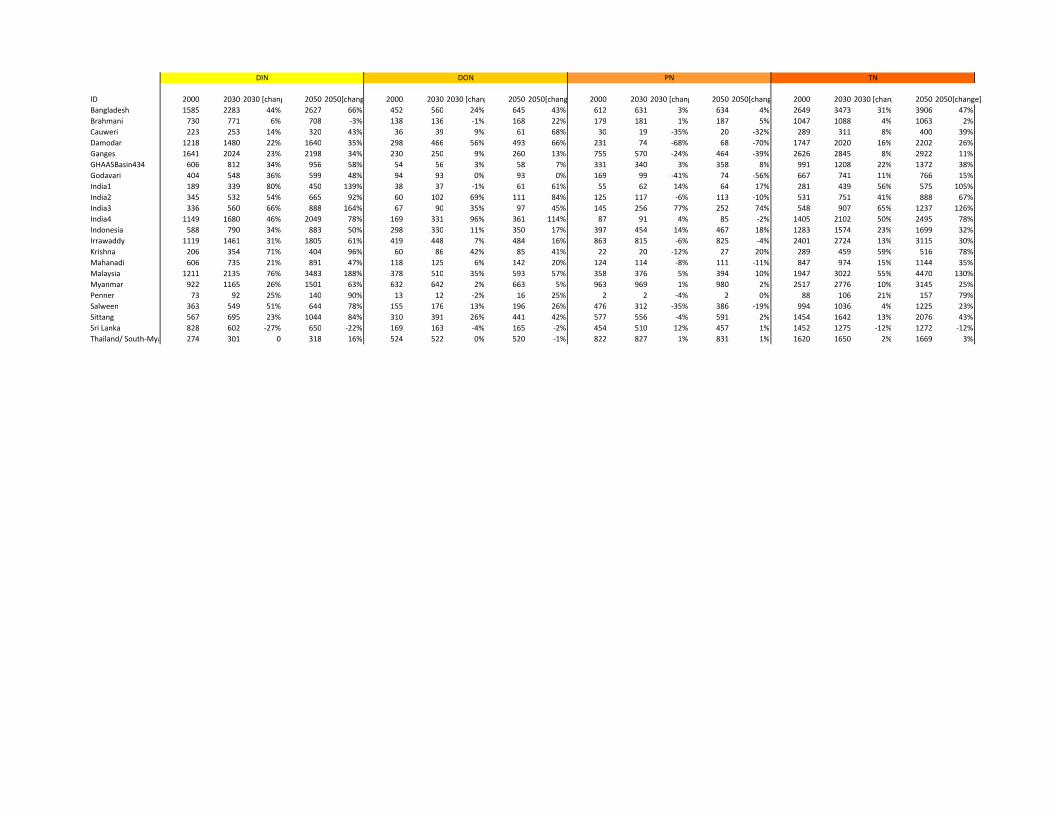
ID 2000 2030 2030 [chang 2050 2050[chang 2000 2030 2030 [chang 2050 2050[chang 2000 2030 2030 [chang 2050 2050[chang 2000 2030 2030 [chang 2050 2050[change]
Bangladesh 1585 2283 44% 2627 66% 452 560 24% 645 43% 612 631 3% 634 4% 2649 3473 31% 3906 47%
Brahmani 730 771 6% 708 ‐3% 138 136 ‐1% 168 22% 179 181 1% 187 5% 1047 1088 4% 1063 2%
Cauweri 223 253 14% 320 43% 36 39 9% 61 68% 30 19 ‐35% 20 ‐32% 289 311 8% 400 39%
Damodar 1218 1480 22% 1640 35% 298 466 56% 493 66% 231 74 ‐68% 68 ‐70% 1747 2020 16% 2202 26%
Ganges 1641 2024 23% 2198 34% 230 250 9% 260 13% 755 570 ‐24% 464 ‐39% 2626 2845 8% 2922 11%
GHAASBasin434 606 812 34% 956 58% 54 56 3% 58 7% 331 340 3% 358 8% 991 1208 22% 1372 38%
Godavari 404 548 36% 599 48% 94 93 0% 93 0% 169 99 ‐41% 74 ‐56% 667 741 11% 766 15%
India1 189 339 80% 450 139% 38 37 ‐1% 61 61% 55 62 14% 64 17% 281 439 56% 575 105%
India2 345 532 54% 665 92% 60 102 69% 111 84% 125 117 ‐6% 113 ‐10% 531 751 41% 888 67%
India3 336 560 66% 888 164% 67 90 35% 97 45% 145 256 77% 252 74% 548 907 65% 1237 126%
India4 1149 1680 46% 2049 78% 169 331 96% 361 114% 87 91 4% 85 ‐2% 1405 2102 50% 2495 78%
Indonesia 588 790 34% 883 50% 298 330 11% 350 17% 397 454 14% 467 18% 1283 1574 23% 1699 32%
Irrawaddy 1119 1461 31% 1805 61% 419 448 7% 484 16% 863 815 ‐6% 825 ‐4% 2401 2724 13% 3115 30%
Krishna 206 354 71% 404 96% 60 86 42% 85 41% 22 20 ‐12% 27 20% 289 459 59% 516 78%
Mahanadi 606 735 21% 891 47% 118 125 6% 142 20% 124 114 ‐8% 111 ‐11% 847 974 15% 1144 35%
Malaysia 1211 2135 76% 3483 188% 378 510 35% 593 57% 358 376 5% 394 10% 1947 3022 55% 4470 130%
Myanmar 922 1165 26% 1501 63% 632 642 2% 663 5% 963 969 1% 980 2% 2517 2776 10% 3145 25%
Penner 73 92 25% 140 90% 13 12 ‐2% 16 25% 2 2 ‐4% 2 0% 88 106 21% 157 79%
Salween 363 549 51% 644 78% 155 176 13% 196 26% 476 312 ‐35% 386 ‐19% 994 1036 4% 1225 23%
Sittang 567 695 23% 1044 84% 310 391 26% 441 42% 577 556 ‐4% 591 2% 1454 1642 13% 2076 43%
Sri Lanka 828 602 ‐27% 650 ‐22% 169 163 ‐4% 165 ‐2% 454 510 12% 457 1% 1452 1275 ‐12% 1272 ‐12%
Thailand/ South‐Mya 274 301 0 318 16% 524 522 0% 520 ‐1% 822 827 1% 831 1% 1620 1650 2% 1669 3%
DIN DON PN TN
ID 2000 2030 2030 [chang 2050 2050[chang 2000 2030 2030 [chang 2050 2050[chang 2000 2030 2030 [chang 2050 2050[chang 2000 2030 2030 [chang 2050 2050[change]
Bangladesh 61 127 106% 202 229.58% 26 30 13% 31 18% 308 319 4% 321 4% 395 475 20% 554 40%
Brahmani 41 37 ‐9% 73 77.40% 9 9 ‐3% 9 ‐2% 76 78 2% 80 5% 127 124 ‐2% 162 28%
Cauweri 2 4 49% 9 273.64% 3 3 ‐1% 3 15% 16 9 ‐44% 9 ‐41% 21 15 ‐28% 21 1%
Damodar 356 190 ‐47% 87 ‐75.58% 11 13 21% 14 33% 104 33 ‐68% 31 ‐70% 470 236 ‐50% 132 ‐72%
Ganges 102 146 44% 164 60.47% 16 16 4% 17 7% 464 353 ‐24% 289 ‐38% 581 516 ‐11% 469 ‐19%
GHAASBasin434 21 27 33% 33 59.26% 4 5 13% 5 27% 201 207 3% 217 8% 226 239 6% 255 13%
Godavari 19 20 5% 18 ‐2.47% 6 6 3% 7 7% 84 51 ‐40% 37 ‐55% 109 77 ‐29% 62 ‐43%
India1 4 6 50% 25 552.49% 3 3 16% 4 42% 23 28 20% 29 23% 30 37 23% 58 94%
India2 56 108 91% 116 106.13% 3 3 27% 4 46% 65 61 ‐7% 57 ‐12% 124 172 38% 177 43%
India3 12 47 277% 59 368.82% 4 5 17% 6 41% 70 128 84% 127 82% 86 180 109% 191 122%
India4 25 85 238% 79 213.10% 12 14 24% 17 43% 39 41 5% 38 0% 75 140 86% 134 78%
Indonesia 19 49 160% 67 251.25% 15 17 12% 18 17% 189 226 19% 230 22% 223 292 31% 315 41%
Irrawaddy 22 78 261% 137 535.61% 23 27 19% 32 42% 452 407 ‐10% 415 ‐8% 496 512 3% 585 18%
Krishna 3 14 361% 14 360.04% 4 5 5% 5 12% 11 10 ‐16% 12 6% 19 28 49% 31 64%
Mahanadi 18 10 ‐43% 15 ‐16.12% 8 8 4% 9 14% 60 55 ‐9% 52 ‐14% 86 73 ‐15% 76 ‐12%
Malaysia 157 690 340% 712 353.53% 22 53 135% 54 142% 165 179 8% 189 14% 345 922 167% 955 177%
Myanmar 23 47 107% 86 280.77% 34 36 8% 41 20% 449 447 0% 452 1% 505 531 5% 579 14%
Penner 0 0 13% 0 72.94% 1 1 4% 1 46% 1 1 ‐4% 1 0% 2 2 2% 3 30%
Salween 8 17 113% 29 252.25% 8 10 20% 11 33% 280 176 ‐37% 221 ‐21% 296 204 ‐31% 261 ‐12%
Sittang 26 141 447% 241 831.42% 17 21 25% 26 56% 322 267 ‐17% 281 ‐13% 364 430 18% 548 50%
Sri Lanka 22 39 77% 42 90.12% 9 10 12% 11 18% 260 266 3% 234 ‐10% 291 316 8% 287 ‐1%
Thailand/ South‐Mya 23 23 0% 23 ‐0.64% 28 28 0% 28 ‐1% 360 363 1% 366 1% 411 414 1% 416 1%
DIP DOP PP TP
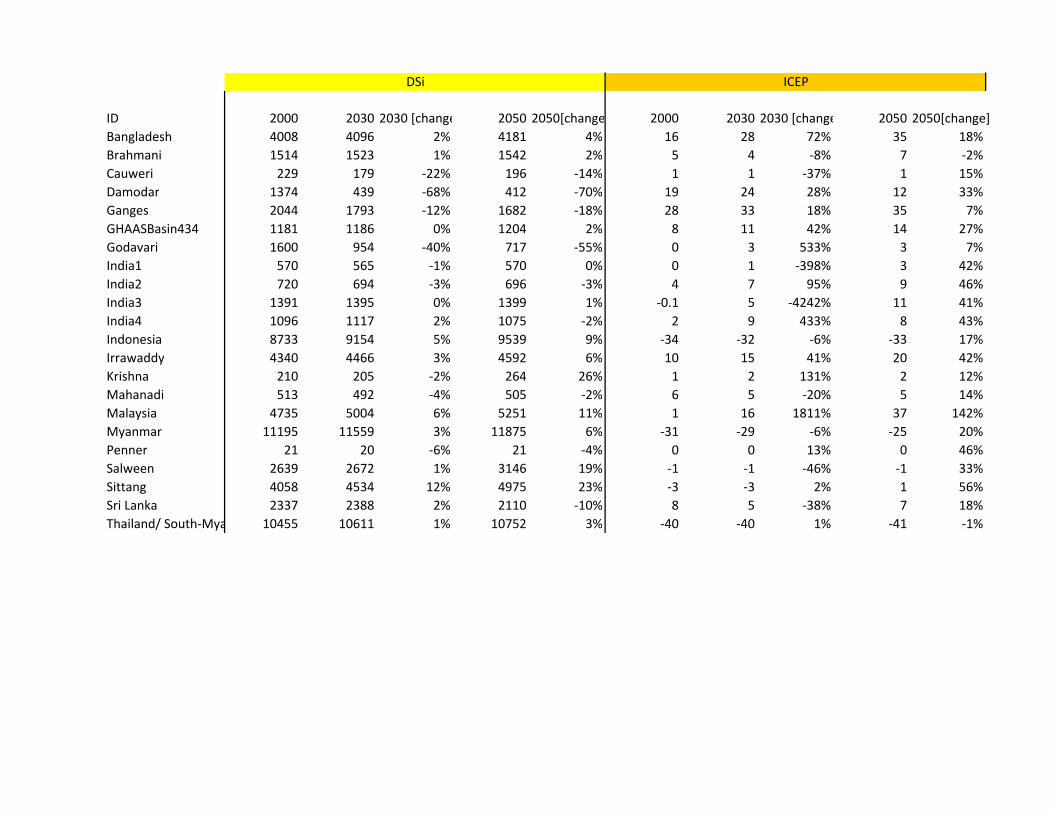
ID 2000 2030 2030 [change 2050 2050[change 2000 2030 2030 [change 2050 2050[change]
Bangladesh 4008 4096 2% 4181 4% 16 28 72% 35 18%
Brahmani 1514 1523 1% 1542 2% 5 4 ‐8% 7 ‐2%
Cauweri 229 179 ‐22% 196 ‐14% 1 1 ‐37% 1 15%
Damodar 1374 439 ‐68% 412 ‐70% 19 24 28% 12 33%
Ganges 2044 1793 ‐12% 1682 ‐18% 28 33 18% 35 7%
GHAASBasin434 1181 1186 0% 1204 2% 8 11 42% 14 27%
Godavari 1600 954 ‐40% 717 ‐55% 0 3 533% 3 7%
India1 570 565 ‐1% 570 0% 0 1 ‐398% 3 42%
India2 720 694 ‐3% 696 ‐3% 4 7 95% 9 46%
India3 1391 1395 0% 1399 1% ‐0.1 5 ‐4242% 11 41%
India4 1096 1117 2% 1075 ‐2% 2 9 433% 8 43%
Indonesia 8733 9154 5% 9539 9% ‐34 ‐32 ‐6% ‐33 17%
Irrawaddy 4340 4466 3% 4592 6% 10 15 41% 20 42%
Krishna 210 205 ‐2% 264 26% 1 2 131% 2 12%
Mahanadi 513 492 ‐4% 505 ‐2% 6 5 ‐20% 5 14%
Malaysia 4735 5004 6% 5251 11% 1 16 1811% 37 142%
Myanmar 11195 11559 3% 11875 6% ‐31 ‐29 ‐6% ‐25 20%
Penner 21 20 ‐6% 21 ‐4% 0 0 13% 0 46%
Salween 2639 2672 1% 3146 19% ‐1 ‐1 ‐46% ‐1 33%
Sittang 4058 4534 12% 4975 23% ‐3 ‐3 2% 1 56%
Sri Lanka 2337 2388 2% 2110 ‐10% 8 5 ‐38% 7 18%
Thailand/ South‐Mya 10455 10611 1% 10752 3% ‐40 ‐40 1% ‐41 ‐1%
DSi ICEP
ID in map 1ID 2000 2030 2030 [change 2050 2050[chang 2000 2030 2030 [chan 2050 2050[chang 2000 2030 2030 [chan 2050 2050[chang 2000 2030 2030 [chan 2050 2050[chang 2000 2030 2030 [chan 2050 2050[chang 2000 2030 2030 [chan 2050 2050[chang 2000 2030 2030 [chan 2050 2050[change]
1 Bangladesh 54315 78202 44% 89994 66% 2102 4335 106% 6928 230% 15493 19191 24% 22091 43% 897 1018 13% 1058 18% 137309 140348 2% 143234 4% 20952 21606 3% 21736 4% 10538 10932 4% 10998 7576
2 Brahmani 41849 44163 6% 40582 ‐3% 2345 2137 ‐9% 4161 77% 7893 7803 ‐1% 9631 22% 526 511 ‐3% 517 ‐2% 86722 87257 1% 88315 2% 10234 10364 1% 10713 5% 4376 4443 2% 4606 5%
3 Cauweri 17510 19880 14% 25118 43% 186 278 49% 695 274% 2831 3079 9% 4757 68% 211 208 ‐1% 242 15% 18012 14054 ‐22% 15412 ‐14% 2335 1517 ‐35% 1592 ‐32% 1262 712 ‐44% 744 ‐41%
4 Damodar 72560 88213 22% 97752 35% 21195 11300 ‐47% 5175 ‐76% 17757 27754 56% 29406 66% 639 776 21% 851 33% 81893 26182 ‐68% 24537 ‐70% 13779 4383 ‐68% 4081 ‐70% 6175 1973 ‐68% 1847 ‐70%
5 Ganges 2669450 3292775 23% 3575465 34% 165745 237992 44% 265976 60% 374025 407424 9% 422258 13% 25548 26679 4% 27211 7% 3325001 2915915 ‐12% 2735448 ‐18% 1228122 927728 ‐24% 754110 ‐39% 753914 574093 ‐24% 470364 ‐38%
6 GHAASBasin434 18865 25306 34% 29775 58% 641 851 33% 1020 59% 1697 1745 3% 1822 7% 124 141 13% 157 27% 36794 36948 0% 37518 2% 10302 10585 3% 11143 8% 6269 6445 3% 6773 8%
7 Godavari 128213 173915 36% 189886 48% 5983 6286 5% 5835 ‐2% 29736 29600 0% 29627 0% 1945 2013 3% 2076 7% 507334 302637 ‐40% 227265 ‐55% 53644 31452 ‐41% 23433 ‐56% 26508 16036 ‐40% 11812 ‐55%
8 India1 8616 15485 80% 20565 139% 178 267 50% 1165 552% 1722 1713 ‐1% 2777 61% 115 134 16% 164 42% 26051 25820 ‐1% 26029 0% 2494 2838 14% 2912 17% 1066 1275 20% 1310 23%
9 India2 27060 41663 54% 52057 92% 4401 8427 91% 9071 106% 4724 8003 69% 8687 84% 211 268 27% 308 46% 56352 54381 ‐3% 54480 ‐3% 9790 9159 ‐6% 8815 ‐10% 5121 4744 ‐7% 4492 ‐12%
10 India3 21637 36016 66% 57085 164% 803 3027 277% 3766 369% 4300 5818 35% 6251 45% 269 316 17% 379 41% 89465 89691 0% 90002 1% 9308 16469 77% 16238 74% 4477 8259 84% 8157 82%
11 India4 42698 62421 46% 76143 78% 938 3172 238% 2937 213% 6267 12289 96% 13414 114% 433 536 24% 618 43% 40734 41498 2% 39944 ‐2% 3245 3391 4% 3172 ‐2% 1432 1509 5% 1430 0%
12 Indonesia 105246 141270 34% 157879 50% 3392 8808 160% 11914 251% 53271 59106 11% 62538 17% 2720 3039 12% 3188 17% 1561958 1637204 5% 1706143 9% 71040 81178 14% 83519 18% 33840 40388 19% 41151 22%
13 Irrawaddy 453646 592516 31% 731952 61% 8771 31641 261% 55750 536% 169756 181626 7% 196363 16% 9128 10866 19% 12929 42% 1759593 1811068 3% 1861948 6% 350072 330333 ‐6% 334718 ‐4% 183286 164968 ‐10% 168366 ‐8%
14 Krishna 54988 94212 71% 107616 96% 808 3722 361% 3716 360% 16086 22775 42% 22735 41% 1195 1259 5% 1334 12% 55888 54544 ‐2% 70252 26% 5947 5231 ‐12% 7108 20% 3044 2553 ‐16% 3231 6%
15 Mahanadi 85405 103696 21% 125642 47% 2474 1417 ‐43% 2075 ‐16% 16637 17658 6% 20018 20% 1139 1186 4% 1294 14% 72366 69423 ‐4% 71198 ‐2% 17474 16021 ‐8% 15630 ‐11% 8513 7711 ‐9% 7345 ‐14%
16 Malaysia 70865 124936 76% 203814 188% 9190 40399 340% 41680 354% 22097 29853 35% 34712 57% 1315 3084 135% 3176 142% 277027 292765 6% 307225 11% 20971 22008 5% 23025 10% 9682 10446 8% 11049 14%
17 Myanmar 56145 70912 26% 91410 63% 1378 2848 107% 5245 281% 38481 39081 2% 40397 5% 2061 2222 8% 2467 20% 681675 703876 3% 723128 6% 58647 59023 1% 59685 2% 27341 27246 0% 27515 1%
18 Penner 3957 4951 25% 7517 90% 10 11 13% 17 73% 684 668 ‐2% 858 25% 54 57 4% 79 46% 1146 1081 ‐6% 1105 ‐4% 92 88 ‐4% 92 0% 42 40 ‐4% 42 0%
19 Salween 107651 162889 51% 191089 78% 2420 5146 113% 8523 252% 46113 52103 13% 58055 26% 2502 2998 20% 3335 33% 783385 793232 1% 933828 19% 141337 92497 ‐35% 114587 ‐19% 83038 52325 ‐37% 65573 ‐21%
20 Sittang 38249 46892 23% 70468 84% 1746 9548 447% 16264 831% 20933 26378 26% 29765 42% 1135 1417 25% 1770 56% 273880 305983 12% 335789 23% 38972 37530 ‐4% 39899 2% 21715 18037 ‐17% 18952 ‐13%
21 Sri Lanka 53243 38693 ‐27% 41782 ‐22% 1411 2491 77% 2683 90% 10889 10465 ‐4% 10623 ‐2% 600 669 12% 709 18% 150225 153488 2% 135580 ‐10% 29162 32775 12% 29363 1% 16694 17125 3% 15042 ‐10%
22 Thailand/ South‐Myanmar 8305 9141 10% 9642 16% 696 694 0% 692 ‐1% 15892 15829 0% 15765 ‐1% 851 848 0% 845 ‐1% 317110 321821 1% 326114 3% 24928 25075 1% 25214 1% 10934 11015 1% 11096 1%
TOTAL BOB (in Tg/year) 4.1405 5.2681 5.9932 0.2368 0.3848 0.4553 0.8773 0.9800 1.0425 0.0536 0.0602 0.0647 10.3399 9.8792 9.9545 2.1228 1.7413 1.5908 1.2193 0.9823 0.8919
PPDIN DIP DON DOP DSi PN