Embed Size (px)
Citation preview
Copyr i gh t © 2012, SAS Ins t i tu te Inc . A l l r i gh ts reserved .
THE ANALYTICS DILEMMA: WORKING IN THE SUPPLY CHAIN
BOB DAVIS, PRINCIPAL INDUSTRY CONSULTANT
C o p y r i g h t © 2 0 1 2 , S A S In s t i t u t e In c . A l l r i g h t s r e s e r ve d .
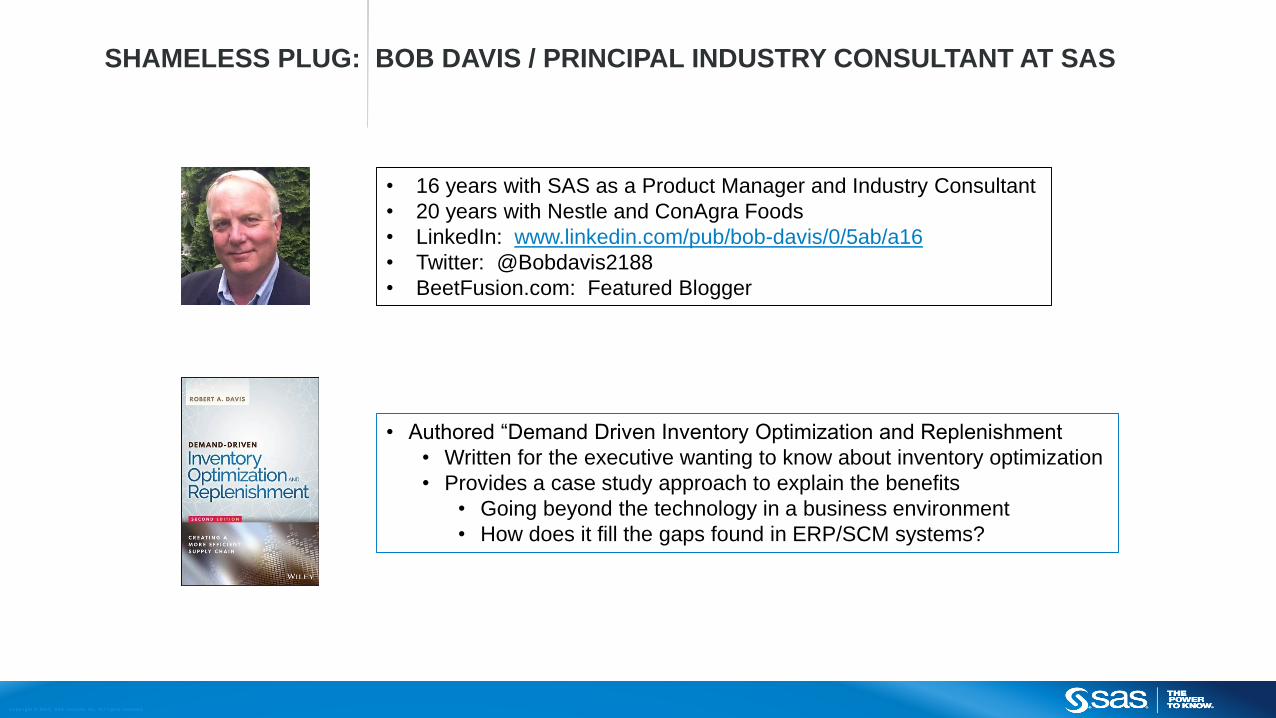
SHAMELESS PLUG: BOB DAVIS / PRINCIPAL INDUSTRY CONSULTANT AT SAS
• Authored “Demand Driven Inventory Optimization and Replenishment
• Written for the executive wanting to know about inventory optimization
• Provides a case study approach to explain the benefits
• Going beyond the technology in a business environment
• How does it fill the gaps found in ERP/SCM systems?
• 16 years with SAS as a Product Manager and Industry Consultant
• 20 years with Nestle and ConAgra Foods
• LinkedIn: www.linkedin.com/pub/bob-davis/0/5ab/a16
• Twitter: @Bobdavis2188
• BeetFusion.com: Featured Blogger
C o p y r i g h t © 2 0 1 2 , S A S In s t i t u t e In c . A l l r i g h t s r e s e r ve d .
AGENDA
• The Analytics Dilemma
• Structured Analytics in the Supply Chain
• Five Case Studies Using A Structured Analytics Approach

Copyr i gh t © 2012, SAS Ins t i tu te Inc . A l l r i gh ts reserved .
THE ANALYTICS DILEMMA
CHANGING A CULTURE

C o p y r i g h t © 2 0 1 2 , S A S In s t i t u t e In c . A l l r i g h t s r e s e r ve d .
ANALYTICS IN THE
SUPPLY CHAIN?“I WANT IT, BUT I DON’T WANT TO CHANGE!”

C o p y r i g h t © 2 0 1 2 , S A S In s t i t u t e In c . A l l r i g h t s r e s e r ve d .
SUPPLY CHAIN
ANALYTICSWHERE ARE YOU ON THE JOURNEY?
Reactive or Proactive?

C o p y r i g h t © 2 0 1 2 , S A S In s t i t u t e In c . A l l r i g h t s r e s e r ve d .
ANALYTICS INTELLIGENCE AND COMPETITIVE ADVANTAGE
Source: Competing on AnalyticsThomas Davenport and Jeanne Harris
Proactive
Reactive

C o p y r i g h t © 2 0 1 2 , S A S In s t i t u t e In c . A l l r i g h t s r e s e r ve d .
THE ANALYTICS-
SUPPLY CHAIN
DILEMMA
USING REACTIVE METHODS TO PREDICT THE FUTURE
Industry Week 2016

C o p y r i g h t © 2 0 1 2 , S A S In s t i t u t e In c . A l l r i g h t s r e s e r ve d .
25 YEARS OF
ANALYTIC
INNOVATION LATER…
Why is it that excel spreadsheets are still the
“analytics of choice” in supply chains?

C o p y r i g h t © 2 0 1 2 , S A S In s t i t u t e In c . A l l r i g h t s r e s e r ve d .
CHANGE IS HARD IT LOOKS EASY NOW, BUT AT THE TIME IT WAS HARD TO LET GO

C o p y r i g h t © 2 0 1 2 , S A S In s t i t u t e In c . A l l r i g h t s r e s e r ve d .
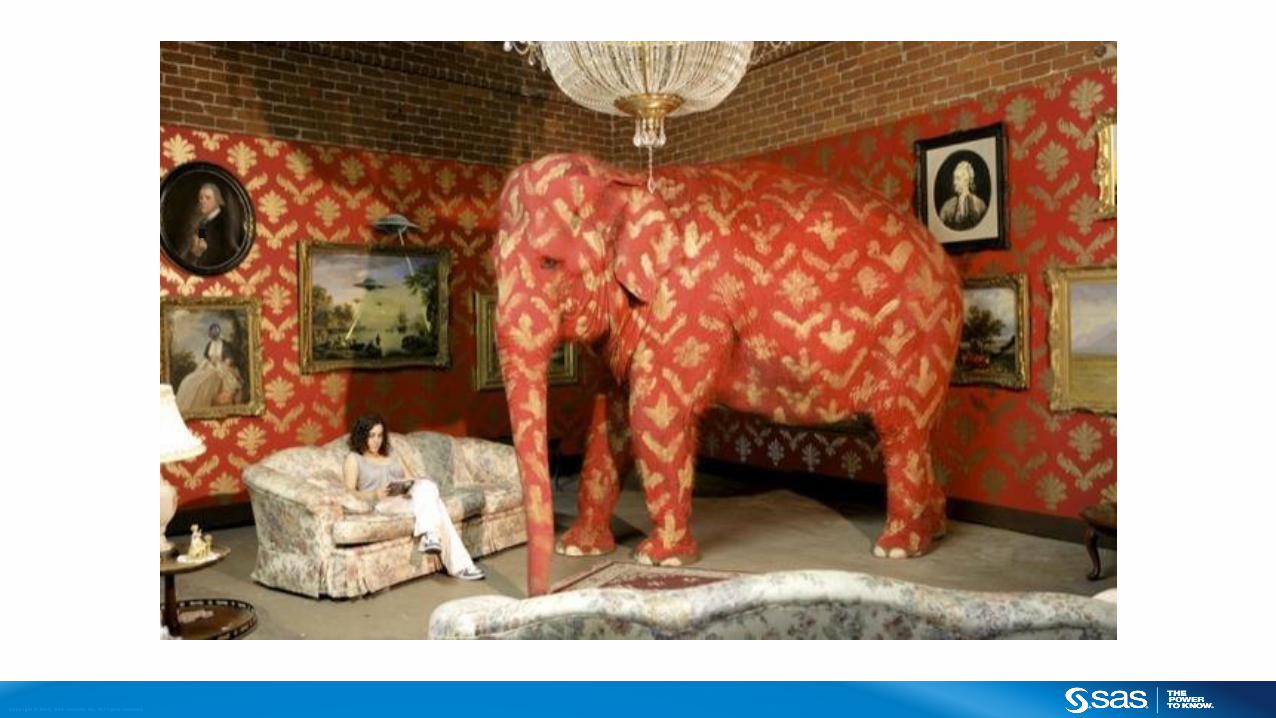
REACTIVE ANALYTICS
Reactive analytics leads to gaps in knowledge
“The blind man and the elephant…”

C o p y r i g h t © 2 0 1 2 , S A S In s t i t u t e In c . A l l r i g h t s r e s e r ve d .
Is there anything else
you should know?
C o p y r i g h t © 2 0 1 2 , S A S In s t i t u t e In c . A l l r i g h t s r e s e r ve d .

C op yr i g h t © 2012 , SAS Ins t i t u te Inc . A l l r i g h ts r eser v ed .
BUSINESS INSIGHT FROM YOUR INFORMATION IS KEY TO FINANCIAL PERFORMANCE
Copyright © 2015, SAS Inst i tute Inc. Al l r ights reserved.
15 percent of organizations will modernize their strategy
for information management capability and exhibit a
20% higher financial performance than their peers
according to Gartner
C op yr i g h t © 2012 , SAS Ins t i t u te Inc . A l l r i g h ts r eser v ed .
ANALYTICS ARE FAR MORE THAN TECHNOLOGY

C op yr i g h t © 2012 , SAS Ins t i t u te Inc . A l l r i g h ts r eser v ed .
TRANSFORMATION JOURNEY TO A HIGHER MATURITY LEVEL
Why a structured approach to transformation is important?
Before you can go forward, you must first:
• Know where your are
• Identify landmarks
• Understand how organization
dimensions work together
• Chart your course
Copyright © 2015, SAS Inst i tute Inc. Al l r ights reserved.

C op yr i g h t © 2012 , SAS Ins t i t u te Inc . A l l r i g h ts r eser v ed .
A STRUCTURED ANALYTICS APPROACH

C op yr i g h t © 2012 , SAS Ins t i t u te Inc . A l l r i g h ts r eser v ed .
GARTNER WHAT’S STOPPING THE SUPPLY CHAIN ACHIEVING GOALS…

C op yr i g h t © 2012 , SAS Ins t i t u te Inc . A l l r i g h ts r eser v ed .
THE “ANALYTICAL” SUPPLY CHAIN
Inventory
Optimization
Demand Sensing
Demand Shaping
Demand Shifting
Outside-In
Focused
Proactive
Process
Collaborative
Planning
Market Supplier
Demand
Driven
Outside-In
Focused
Proactive
Process
Synchronized
Replenishment
Supply Shaping
Sales Marketing & Operations Planning
Market
Driven
Selling through the channel (pull)
Supply
Driven
15-30%5-7%Sales OrdersPOS
Lean
Forecasting
FVA
Demand
Driven
Lean
Manufacturing

C op yr i g h t © 2012 , SAS Ins t i t u te Inc . A l l r i g h ts r eser v ed .
THE “ANALYTICAL” SUPPLY CHAIN
Inventory
Optimization
Demand Sensing
Demand Shaping
Demand Shifting
Outside-In
Focused
Proactive
Process
Consensus
Forecasting
FVA
Market Supplier
Demand
Driven
Outside-In
Focused
Proactive
Process
Synchronized
Replenishment
Supply Shaping
Sales Marketing & Operations Planning
Market
Driven
Selling through the channel (pull) Selling into the channel (push)
Supply
Driven
15-30%5-7%Sales OrdersPOS
Lean
Manufacturing
Lean
Forecasting
FVA

C op yr i g h t © 2012 , SAS Ins t i t u te Inc . A l l r i g h ts r eser v ed .
SAS®
DEMAND-DRIVEN PLANNING AND OPTIMIZATION
Get a holistic view of all demand & planning related data• Track Merchandising activities,
competitors information, new product launches and social media feedback from consumers to drive decision making for the supply chain
Improve forecast accuracy of new product launches & have product available for sell• Use structured judgment
process to define the best “as like” products for new launch forecasting
Optimize planning and be more efficient in the collaborative planning process• Unite statistical forecast with domain
expertise in order to come up with the most accurate consensus plan
Demand
intelligence
Higher Availability & Service Levels to lower capital costs • Combine statistical forecasting &
Inventory Optimization across a multi echelon distribution network
• Create what if scenarios to lower inventories while increasing service levels
Improve Forecast Accuracy; Lower inventory & scrap costs• Use historical data & causal
factors data to generate highly-accurate forecasts of future demand
• Sense demand signals• Shape future demand• Reduce touch points with the
forecast / manual planning and become analytic driven
• Forecast Valued Added
Fo
recasti
ng
Collaboration
Dem
an
d R
ep
osito
ry

C op yr i g h t © 2012 , SAS Ins t i t u te Inc . A l l r i g h ts r eser v ed .
5 CASE STUDIES USING STRUCTURED ANALYTICS

C op yr i g h t © 2012 , SAS Ins t i t u te Inc . A l l r i g h ts r eser v ed .
AMWAY CHINA DISTRIBUTION
BUSINESS ISSUE
• Lacked a forward-looking view and accuracy in its inventory,
distribution and replenishment planning process.
•
SOLUTION
• SAS Forecasting and Inventory Optimization
RESULTS
• Reduced stock levels, balanced product distribution, and boosted
customer satisfaction.
• Increase customer satisfaction to 97%
• Improve replenishment times by 20%
• Reduce stock levels by 10%
• The system enormously improves Amway China’s operational efficiency
and shortens replenishment time from the logistics center to the retail
outlets
HTTP://WWW.SAS.COM/SUCCESS/AMWAY
CHINA.HTML
“With SAS predictive analysis and
inventory optimization, we can keep
inventory at the right level at the
right time. When business or
customer demands change, we can
quickly adjust via the flexible
inventory optimization system. With
the IOS, Amway China cannot only
reduce logistics costs, but also
enhance customer satisfaction and
improve its competitive edge.”
Raymond Hui
Distribution Vice President
Demand Driven Supply

C op yr i g h t © 2012 , SAS Ins t i t u te Inc . A l l r i g h ts r eser v ed .
ELECTROLUX APPLIANCES
MANUFACTURING
• BUSINESS ISSUE
• Electrolux has worked hard to put in place a cross-functional S&OP
process but forecast is only 50-60% accurate.
• Customer service levels are around 80%, inventory levels are too high
• Electrolux’s greatest challenge is forecasting the correct product mix
SOLUTION
• SAS® Demand-Driven Planning & Optimization: FAW, CFW, IOW
RESULTS
• SAS conducted a SVA/POC built business case with Electrolux data and
this conservatively increased customer service levels >95%,
• Reduced inventory 15%
• Improved forecast accuracy >90%
• NPV in excess of $20m and payback within 1 year
DEMAND DRIVEN SUPPLY
Title
C op yr i g h t © 2015 , SAS Ins t i t u te Inc . A l l r i g h ts r eser v ed .
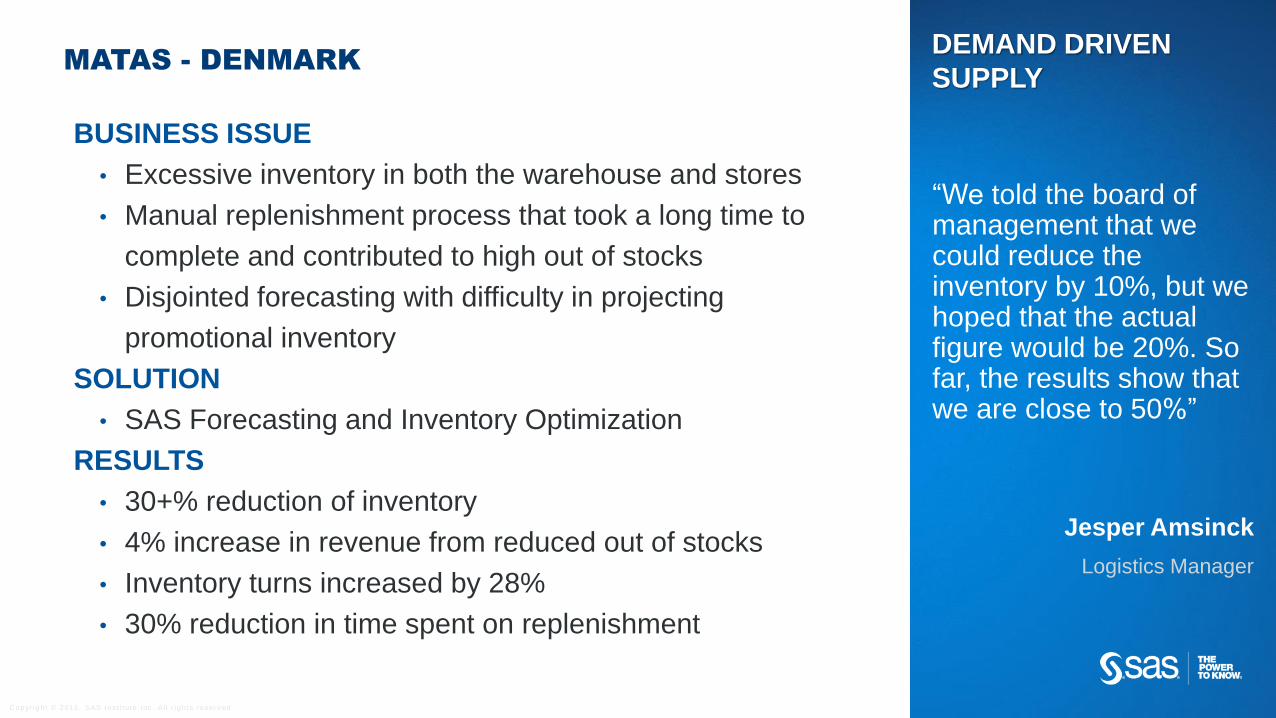
MATAS - DENMARKDEMAND DRIVEN
SUPPLY
BUSINESS ISSUE
• Excessive inventory in both the warehouse and stores
• Manual replenishment process that took a long time to
complete and contributed to high out of stocks
• Disjointed forecasting with difficulty in projecting
promotional inventory
SOLUTION
• SAS Forecasting and Inventory Optimization
RESULTS
• 30+% reduction of inventory
• 4% increase in revenue from reduced out of stocks
• Inventory turns increased by 28%
• 30% reduction in time spent on replenishment
“We told the board of management that we could reduce the inventory by 10%, but we hoped that the actual figure would be 20%. So far, the results show that we are close to 50%”
Jesper Amsinck
Logistics Manager

C op yr i g h t © 2012 , SAS Ins t i t u te Inc . A l l r i g h ts r eser v ed .
A BLUE JEAN
MANUFACTURER
BUSINESS ISSUE• Existing VMI vendor dropping support, must bring the capability in-house
• Trying grow their VMI (Vendor-Managed Inventory) customer base.
SOLUTION• SAS Analytics, SAS Retail Forecasting and SAS® DDPO/IOW Workbench
RESULTS• Increased sales at accounts (sales uplift).
• Higher in-stocks
• Estimated 3% more shipments across all accounts.
“THIS SOLVES THE BUSINESS
CHALLENGE OF SUCCESSFULLY
AUTOMATING THE PROCESS OF
RECOMMENDING THE RIGHT QUANTITY
OF A STYLE IN THE RIGHT SIZE AT THE
RIGHT LOCATION FOR THE CUSTOMER
TO EXECUTE IN THEIR PURCHASE
ORDER ENVIRONMENT. THIS IS A
CHALLENGE ALL SOFT LINE RETAILERS
AND WHOLESALERS HAVE. THE
SUCCESS OF THIS DIRECTLY
CONTRIBUTES TO THE BOTTOM LINE OF
THE COMPANY.”
Demand Driven
Supply
Customer Validation Slide – For One-to-One Customer Use Only
Sr Director - Planning Development

C op yr i g h t © 2015 , SAS Ins t i t u te Inc . A l l r i g h ts r eser v ed .
BIG GROCERY RETAILER GROUP IN...FRANCE
BUSINESS ISSUES
• Problems with forecast accuracy on promotions
• 90,000 “promotions” per week
• Inability to calculate demand forecast and inventory levels
• Too much perishable inventory…huge issue with waste
SOLUTION
• SAS DDPO (Forecasting)
RESULTS
• More accurate demand forecasts for whole assortment
• Structured process to handle promotional items
• Dramatic reduction in perishable waste
• Increased margins by avoiding stockouts and overstocks

C op yr i g h t © 2012 , SAS Ins t i t u te Inc . A l l r i g h ts r eser v ed .
THANK YOU