Embed Size (px)
Citation preview

Date of Meeting: October 15, 2012
BOARD OF SUPERVISORS
ECONOMIC DEVELOPMENT COMMITTEE
INFORMATION ITEM
#5 SUBJECT: Briefing on Air Cargo Initiative
ELECTION DISTRICT: Countywide
STAFF CONTACT: Tom Flynn, Director, Department of Economic Development
BACKGROUND:
In January 2011, the Metropolitan Washington Airports Authority (MWAA) and the Department
of Economic Development began a partnership to double air cargo at Washington-Dulles
International Airport over the next ten years. As the airline industry continues to operate on
tighter margins, airlines are increasingly looking to off-set costs with revenues from the cargo
industry, particularly on international routes, thus leading to the air cargo initiative. While
Dulles Airport has the on-airport capability to expand cargo operations, off-site operations are
critical to the success of expanding the cluster. Freight forwarders, critical to air cargo
operations; often prefer to locate off airport. Loudoun offers approximately 500 acres of
industrial zoned land in close proximity to the airport.
This information item will update the ED Committee on the air cargo initiative, including
opportunities, barriers and next steps for Dulles Airport and Loudoun County. Mr. Joe Maly,
Head of Air Cargo Development for Washington-Dulles International Airport, will be present to
brief the Committee along with Tom Flynn, Director of Economic Development.
ATTACHMENT(S):
I. MWAA Air Cargo Presentation
II. Loudoun Economic Development Air Cargo Presentation

May 2012
Metropolitan Washington
Airports Authority
Washington Dulles
International Air Cargo
Joe Maly - Head of Air Cargo Development
1
Seek the best air service and price mix in air transportation for passengers and shippers;
Improve access to global destinations and markets;
Retain and support current domestic and international service in the market;
Establish Dulles International as an integrator and forwarder gateway; and
Promote air service at Reagan National and Dulles International with international, national, and regional groups and businesses.
Air Service Development Objectives
Airports Authority Mission
To develop, promote, and safely operate National and Dulles Airports, continually
striving to improve our efficiency, customer orientation, and the level of air
service offered.
2
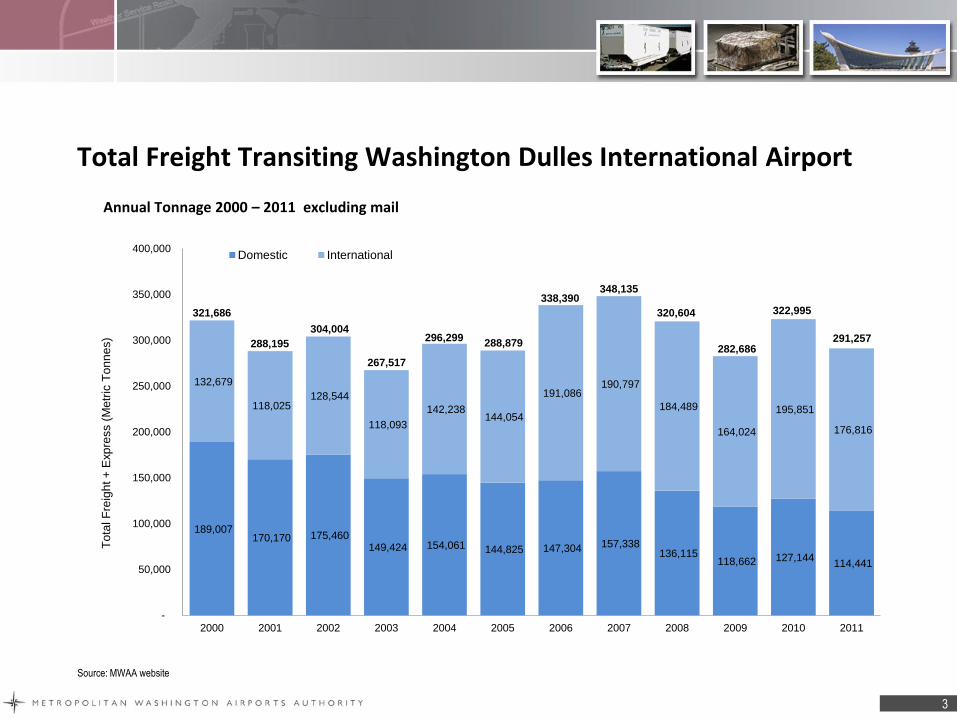
Total Freight Transiting Washington Dulles International Airport
Annual Tonnage 2000 – 2011 excluding mail
Source: MWAA website
189,007 170,170 175,460
149,424 154,061 144,825 147,304 157,338 136,115
118,662 127,144 114,441
132,679
118,025 128,544
118,093
142,238 144,054
191,086 190,797
184,489
164,024
195,851
176,816
-
50,000
100,000
150,000
200,000
250,000
300,000
350,000
400,000
2000 2001 2002 2003 2004 2005 2006 2007 2008 2009 2010 2011
To
tal F
reig
ht +
Exp
ress (
Me
tric
To
nn
es)
Domestic International
321,686
288,195
304,004
267,517
296,299 288,879
338,390 348,135
320,604
282,686
322,995
291,257
3
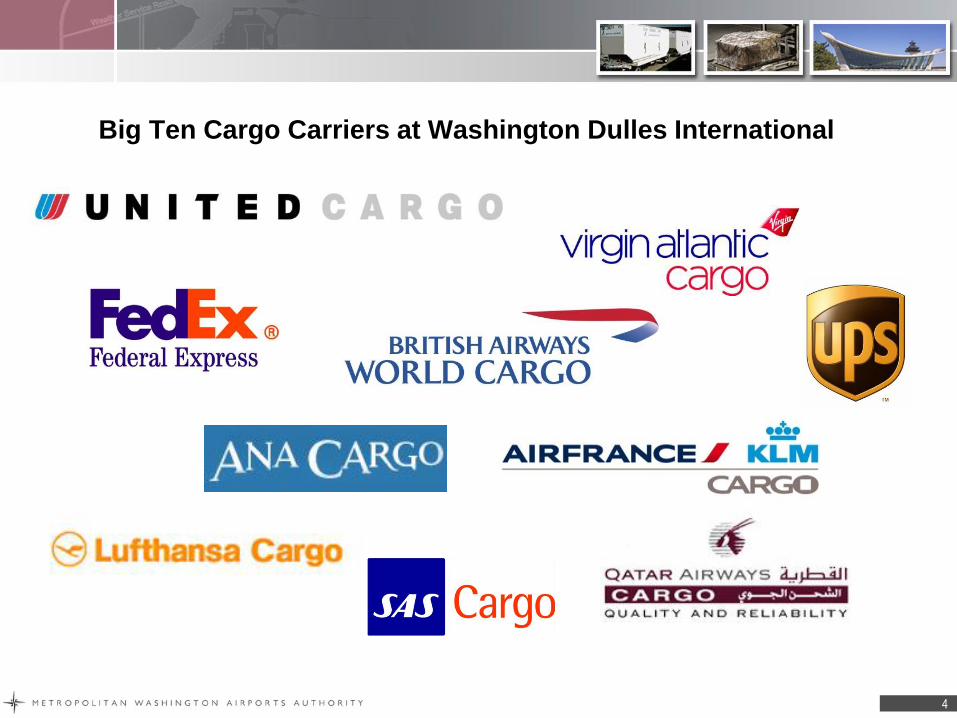
Big Ten Cargo Carriers at Washington Dulles International
4

Major Freight Forwarders at Washington Dulles
5

Domestic Nonstop Service at Washington Dulles International
Source: OAG, June 15-21, 2012
83 Destinations
7 Carriers
319 Daily Departures
Domestic U.S.
6
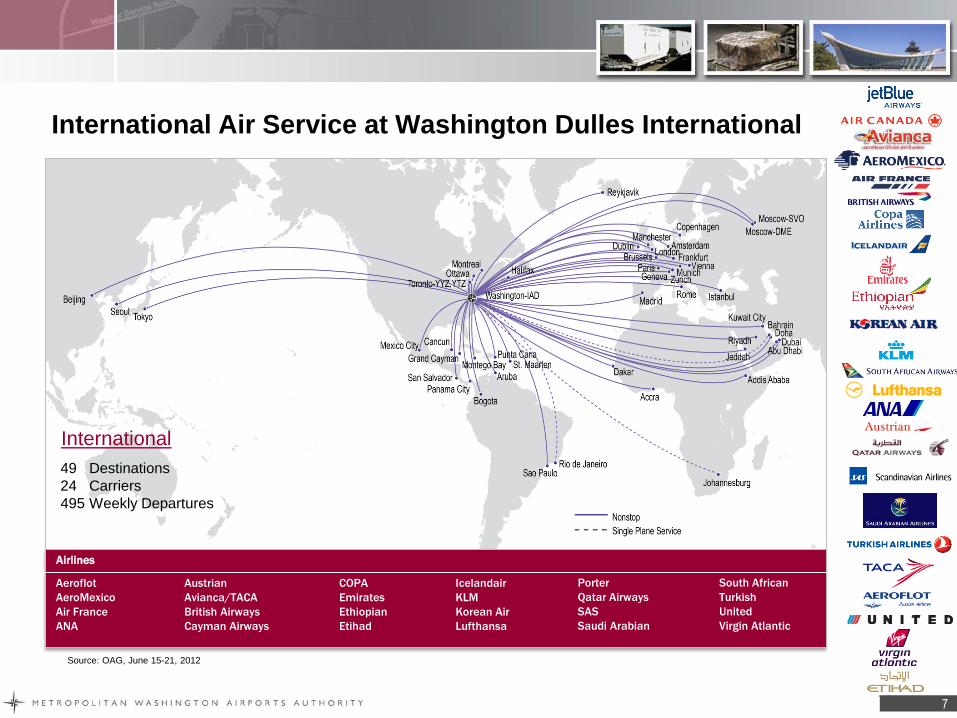
International Air Service at Washington Dulles International
Source: OAG, June 15-21, 2012
49 Destinations
24 Carriers
495 Weekly Departures
International
Airlines
Aeroflot
AeroMexico
Air France
ANA
COPA
Emirates
Ethiopian
Etihad
Austrian
Avianca/TACA
British Airways
Cayman Airways
Icelandair
KLM
Korean Air
Lufthansa
Porter
Qatar Airways
SAS
Saudi Arabian
South African
Turkish
United
Virgin Atlantic
7

New Air Service Coming to Washington Dulles International
United daily service to Doha via Dubai started April 30, 2012
United daily service to Manchester, UK started May 1, 2012
Aeromexico daily service to Mexico City starts May 21, 2012
United daily service to Dublin starts June 7, 2012
United daily service to Honolulu starts June 7, 2012
Emirates daily service to Dubai starts September 12, 2012
Etihad daily service to Abu Dhabi starts March 31, 2013
8

Silk Way Airlines Freighter Service coming to Dulles! ** Subject to Governmental Approvals **
• Based in Baku, Azerbaijan
• 747-400F Equipment
• Bi-Weekly Service
• Local Sales Office
9
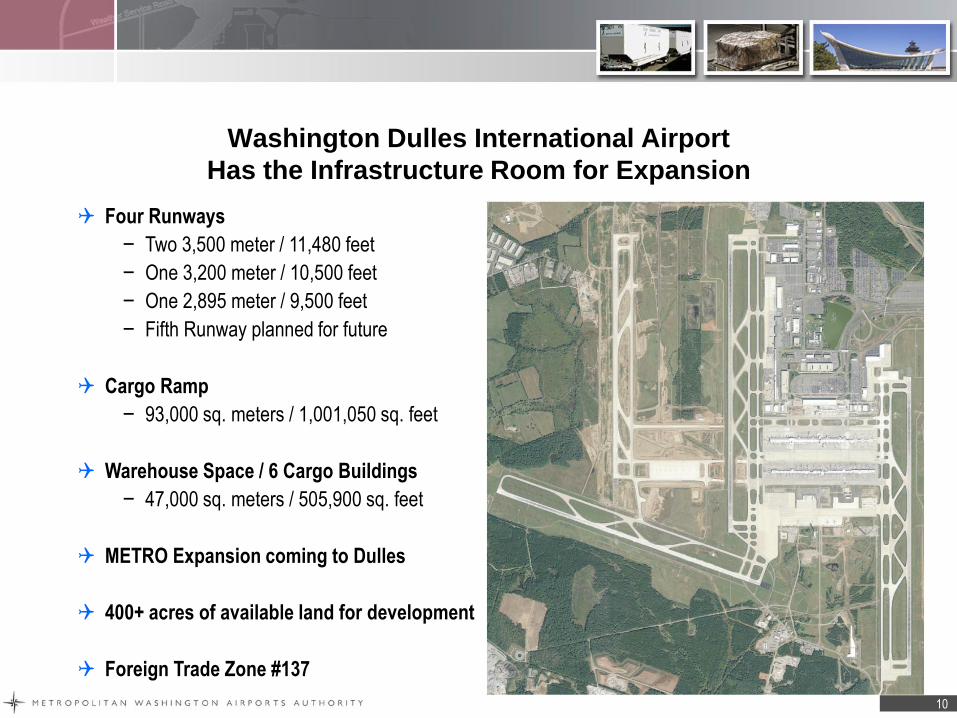
Washington Dulles International Airport
Has the Infrastructure Room for Expansion
Four Runways
− Two 3,500 meter / 11,480 feet
− One 3,200 meter / 10,500 feet
− One 2,895 meter / 9,500 feet
− Fifth Runway planned for future
Cargo Ramp
− 93,000 sq. meters / 1,001,050 sq. feet
Warehouse Space / 6 Cargo Buildings
− 47,000 sq. meters / 505,900 sq. feet
METRO Expansion coming to Dulles
400+ acres of available land for development
Foreign Trade Zone #137
10

Washington Dulles International Western Land Area
Dulles Cargo Expansion Initiative - Airport Support Zone
11
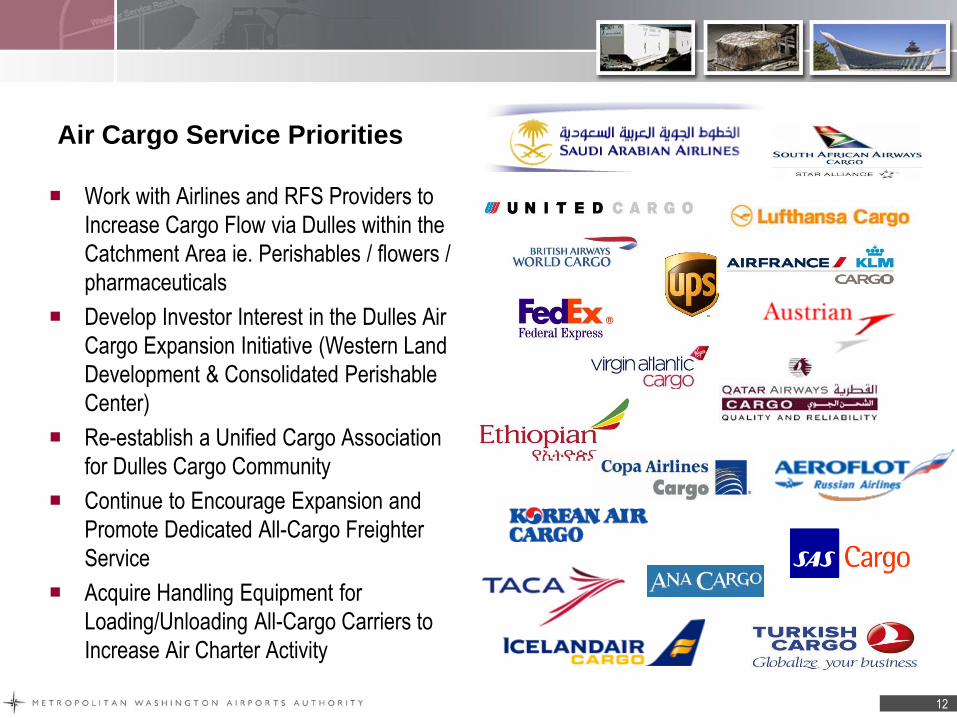
Air Cargo Service Priorities
Work with Airlines and RFS Providers to
Increase Cargo Flow via Dulles within the
Catchment Area ie. Perishables / flowers /
pharmaceuticals
Develop Investor Interest in the Dulles Air
Cargo Expansion Initiative (Western Land
Development & Consolidated Perishable
Center)
Re-establish a Unified Cargo Association
for Dulles Cargo Community
Continue to Encourage Expansion and
Promote Dedicated All-Cargo Freighter
Service
Acquire Handling Equipment for
Loading/Unloading All-Cargo Carriers to
Increase Air Charter Activity
12

Marketing Washington Dulles
International’s Cargo Advantages
Cost advantages vs. other airports (landing
fees, fuel etc.)
Available land for development, unique to
congested East Coast
Cooperative Work Environment (Economic
Development Agencies)
Cooperative Promotional Program for
Airlines
Catchment area which covers entire east
coast within one-day drive, combined with
extensive nonstop international network
24 carriers servicing 49 International
Destinations
13
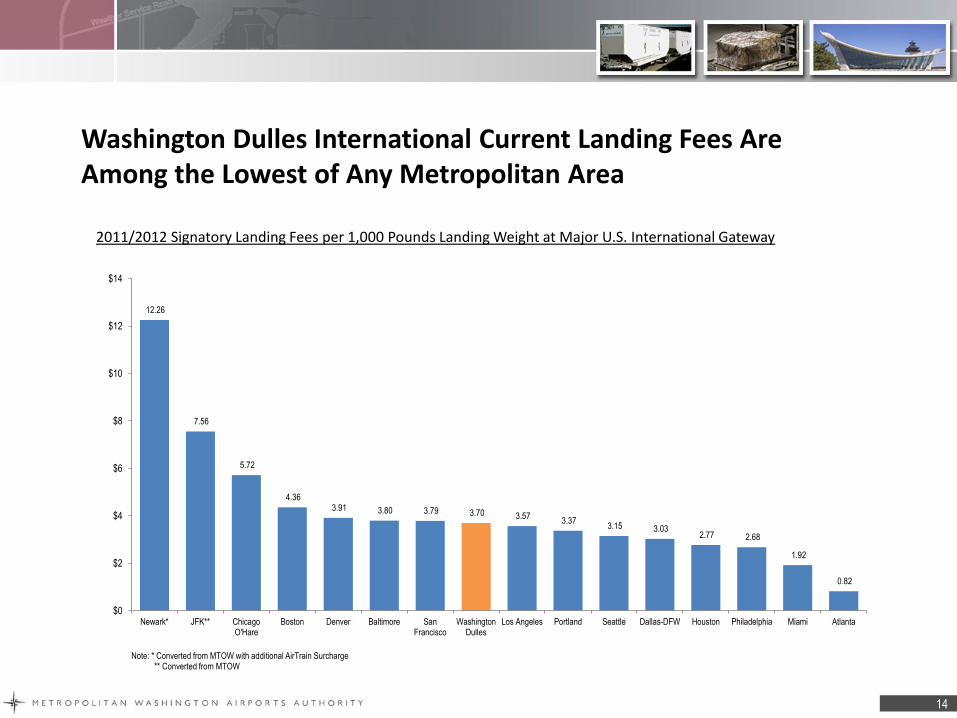
Washington Dulles International Current Landing Fees Are Among the Lowest of Any Metropolitan Area
2011/2012 Signatory Landing Fees per 1,000 Pounds Landing Weight at Major U.S. International Gateway
12.26
7.56
5.72
4.36 3.91 3.80 3.79 3.70 3.57
3.37 3.15 3.03
2.77 2.68
1.92
0.82
$0
$2
$4
$6
$8
$10
$12
$14
Newark* JFK** ChicagoO'Hare
Boston Denver Baltimore SanFrancisco
WashingtonDulles
Los Angeles Portland Seattle Dallas-DFW Houston Philadelphia Miami Atlanta
Note: * Converted from MTOW with additional AirTrain Surcharge** Converted from MTOW
14
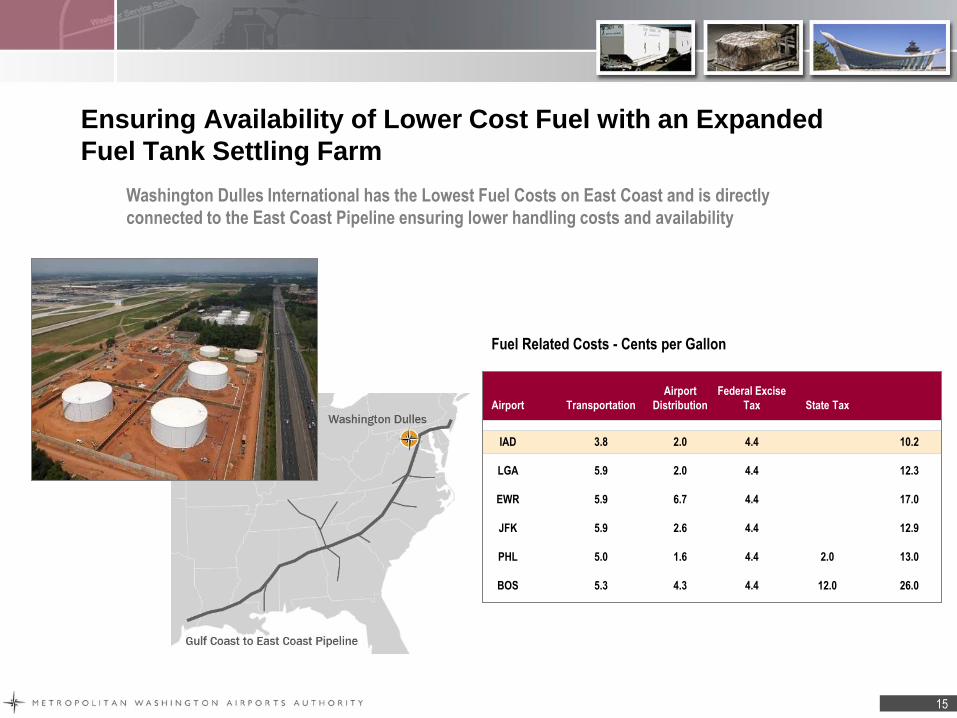
Ensuring Availability of Lower Cost Fuel with an Expanded
Fuel Tank Settling Farm
Washington Dulles International has the Lowest Fuel Costs on East Coast and is directly
connected to the East Coast Pipeline ensuring lower handling costs and availability
Airport Transportation
Airport
Distribution
Federal Excise
Tax State Tax
Total
IAD
LGA
EWR
JFK
PHL
BOS
3.8
5.9
5.9
5.9
5.0
5.3
2.0
2.0
6.7
2.6
1.6
4.3
4.4
4.4
4.4
4.4
4.4
4.4
2.0
12.0
10.2
12.3
17.0
12.9
13.0
26.0
Fuel Related Costs - Cents per Gallon
15

The Dulles Air Cargo Catchment Area Covers 25 States and
Canada with Next Day Service
Dulles International is strategically located at the heart of
the East Coast air cargo market
Based on RFS Schedules, Dulles serves
25 East Coast states and Canada in one day
From Dulles International, airlines will reach all major
Eastern, Midwestern and Canadian markets overnight
Approximately 56% of the U.S. population resides in
areas with overnight delivery from Dulles International
Transit Distance/Time
from Dulles International
Boston: 747 km 8:00 hrs
New York: 401 km 5:00 hrs
Atlanta: 1049 km 11:00 hrs
Miami: 1731 km 16:25 hrs
12-hour drive time map
16
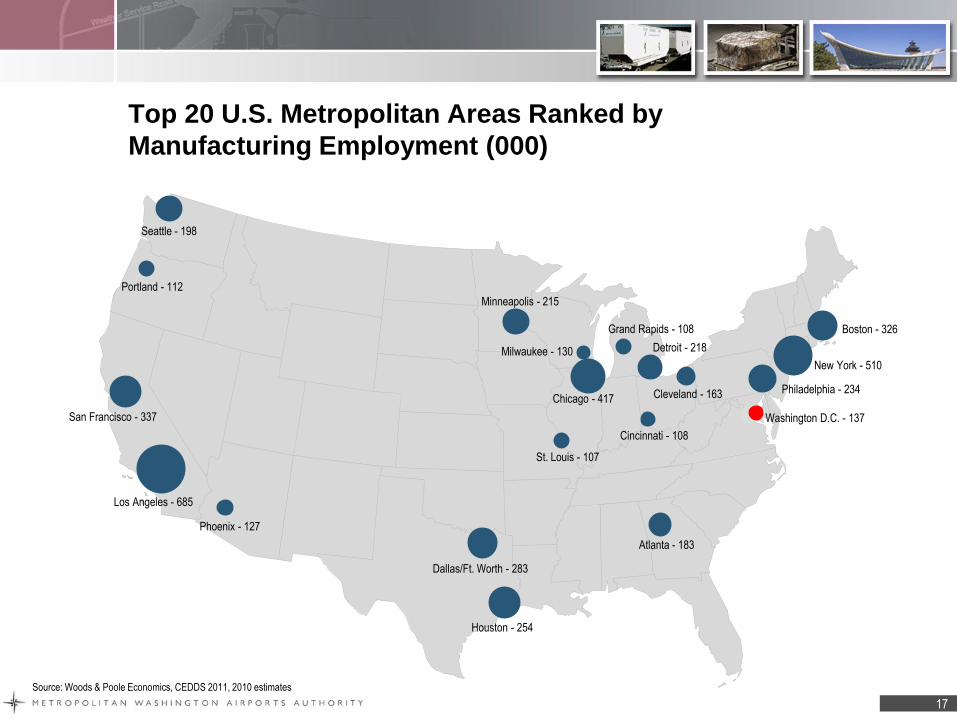
Top 20 U.S. Metropolitan Areas Ranked by
Manufacturing Employment (000)
Los Angeles - 685
New York - 510
Chicago - 417
Dallas/Ft. Worth - 283
Boston - 326
St. Louis - 107
Washington D.C. - 137 San Francisco - 337
Houston - 254
Philadelphia - 234
Detroit - 218
Minneapolis - 215
Seattle - 198
Atlanta - 183
Cleveland - 163
Milwaukee - 130
Phoenix - 127
Portland - 112
Grand Rapids - 108
Cincinnati - 108
Source: Woods & Poole Economics, CEDDS 2011, 2010 estimates
17

Cargo Commodities & Flows at
Washington Dulles International Airport
May 2012
18

2011 Top 10 Air Exports Commodities Transiting Washington Dulles International
Ranked by Weight and Value
Source: U.S. Department of Commerce, Foreign Trade Statistics, 2011
Weight Value
Top Exports By Air Via IAD (Metric Ton) Top Exports By Air Via IAD (Millions $)
Nuclear Reactors, Boilers, Machinery Etc. 10,462 Nuclear Reactors, Boilers, Machinery, Etc. 914
Electric Machinery 5,226 Aircraft and Spacecraft 770
Plastics 3,660 Electric Machinery 765
Optical, Photo, Medical, Or Surgical Instruments 3,495 Optical, Photo, Medical, Or Surgical Instruments 698
Miscellaneous Chemical Products 2,406 Pharmaceutical Products 691
Pharmaceutical Products 2,223 Miscellaneous Chemical Products 197
Non-Railway Vehicles 1,922 Special Classification Provisions 89
Fish, Crustaceans & Aquatic Invertebrates 1,915 Plastics 88
Iron Or Steel Articles 1,840 Organic Chemicals 61
Meat 1,593 Printed Books and Newspapers 54
19

2011 Top 10 Air Imports Commodities Transiting Washington Dulles International
Ranked by Weight and Value
Source: U.S. Department of Commerce, Foreign Trade Statistics, 2011
Weight Value
Top Imports By Air Via IAD (Metric Ton) Top Imports By Air Via IAD (Millions $)
Nuclear Reactors, Boilers, Machinery, Etc. 19,472 Organic Chemicals 45,991
Electric Machinery 11,429 Pharmaceutical Products 32,331
Non-Railway Vehicles 10,908 Electric Machinery 13,528
Pharmaceutical Products 8,434 Nuclear Reactors, Boilers, Machinery, Etc. 12,375
Optical, Photo, Medical, Or Surgical Instruments 5,129 Optical, Photo, Medical, Or Surgical Instruments 10,736
Apparel Articles and Accessories 2,994 Special Classification Provisions 3,246
Plastics 2,845 Miscellaneous Chemical Products 1,994
Non-Knit Apparel Articles And Accessories 2,776 Non-Railway Vehicles 1,258
Fish, Crustaceans & Aquatic Invertebrates 2,035 Non-Knit Apparel Articles And Accessories 1,097
Organic Chemicals 1,595 Aircraft and Spacecraft 1,055
20
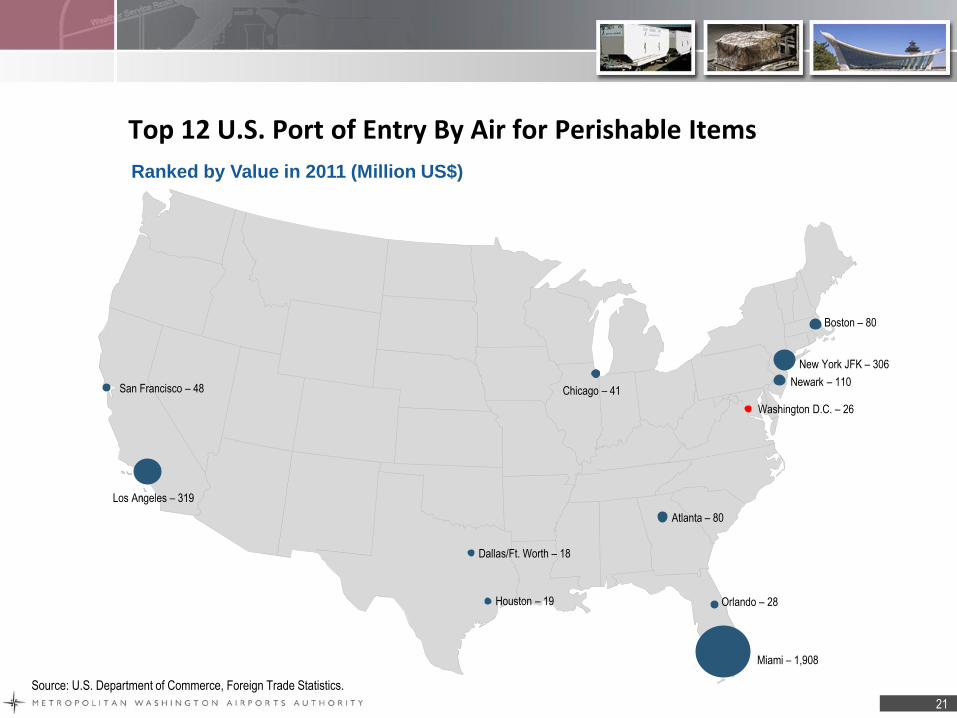
Top 12 U.S. Port of Entry By Air for Perishable Items
Miami – 1,908
Los Angeles – 319
New York JFK – 306
Chicago – 41
Dallas/Ft. Worth – 18
Boston – 80
San Francisco – 48
Atlanta – 80
Orlando – 28
Washington D.C. – 26
Ranked by Value in 2011 (Million US$)
Source: U.S. Department of Commerce, Foreign Trade Statistics.
Newark – 110
Houston – 19
21
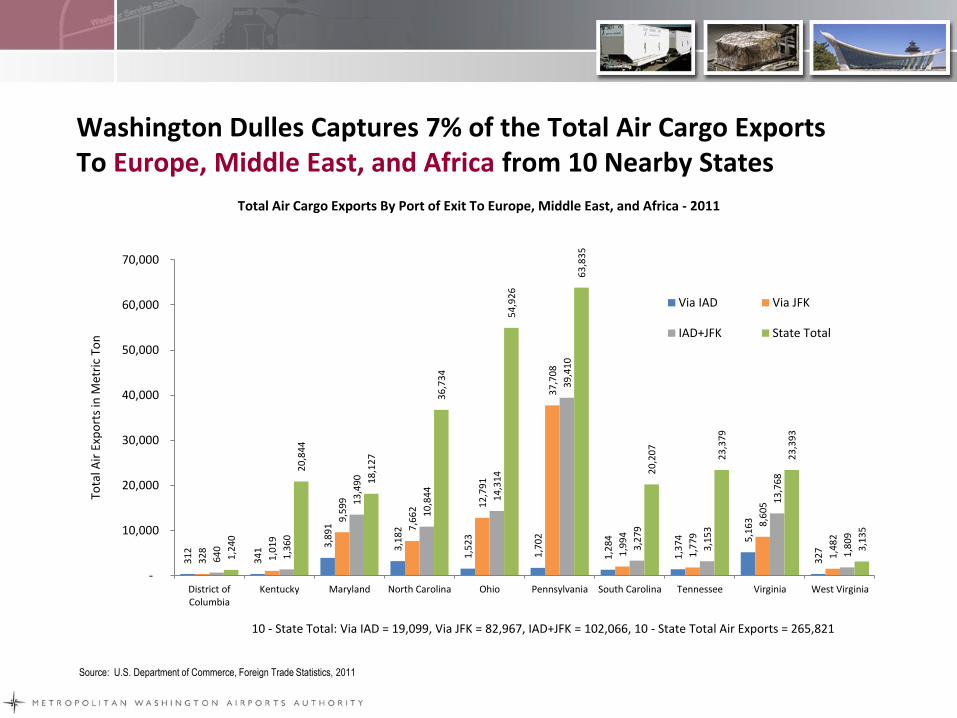
Washington Dulles Captures 7% of the Total Air Cargo Exports To Europe, Middle East, and Africa from 10 Nearby States
Source: U.S. Department of Commerce, Foreign Trade Statistics, 2011
31
2
34
1 3
,89
1
3,1
82
1,5
23
1,7
02
1,2
84
1,3
74
5,1
63
32
7
32
8
1,0
19
9,5
99
7,6
62
12
,79
1
37
,70
8
1,9
94
1,7
79
8,6
05
1,4
82
64
0
1,3
60
13
,49
0
10
,84
4
14
,31
4
39
,41
0
3,2
79
3,1
53
13
,76
8
1,8
09
1,2
40
20
,84
4
18
,12
7
36
,73
4
54
,92
6
63
,83
5
20
,20
7
23
,37
9
23
,39
3
3,1
35
-
10,000
20,000
30,000
40,000
50,000
60,000
70,000
District ofColumbia
Kentucky Maryland North Carolina Ohio Pennsylvania South Carolina Tennessee Virginia West Virginia
Tota
l Air
Exp
ort
s in
Met
ric
Ton
10 - State Total: Via IAD = 19,099, Via JFK = 82,967, IAD+JFK = 102,066, 10 - State Total Air Exports = 265,821
Total Air Cargo Exports By Port of Exit To Europe, Middle East, and Africa - 2011
Via IAD Via JFK
IAD+JFK State Total
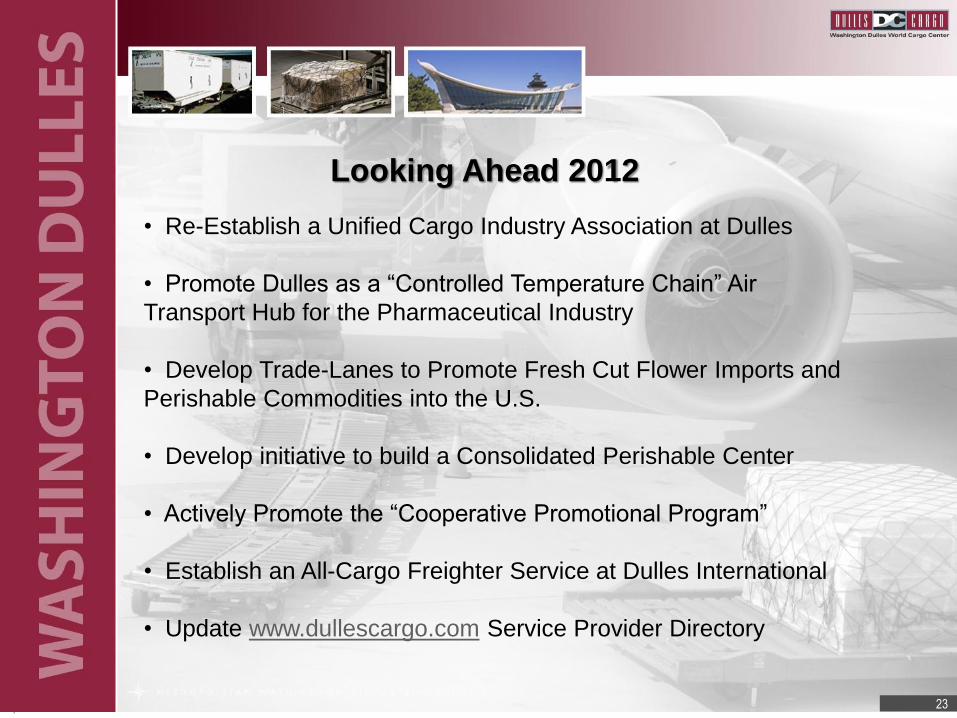
• Re-Establish a Unified Cargo Industry Association at Dulles
• Promote Dulles as a “Controlled Temperature Chain” Air
Transport Hub for the Pharmaceutical Industry
• Develop Trade-Lanes to Promote Fresh Cut Flower Imports and
Perishable Commodities into the U.S.
• Develop initiative to build a Consolidated Perishable Center
• Actively Promote the “Cooperative Promotional Program”
• Establish an All-Cargo Freighter Service at Dulles International
• Update www.dullescargo.com Service Provider Directory
Looking Ahead 2012
23
May 2012
Thank you!
24