Embed Size (px)
Citation preview
Agenda Item 19
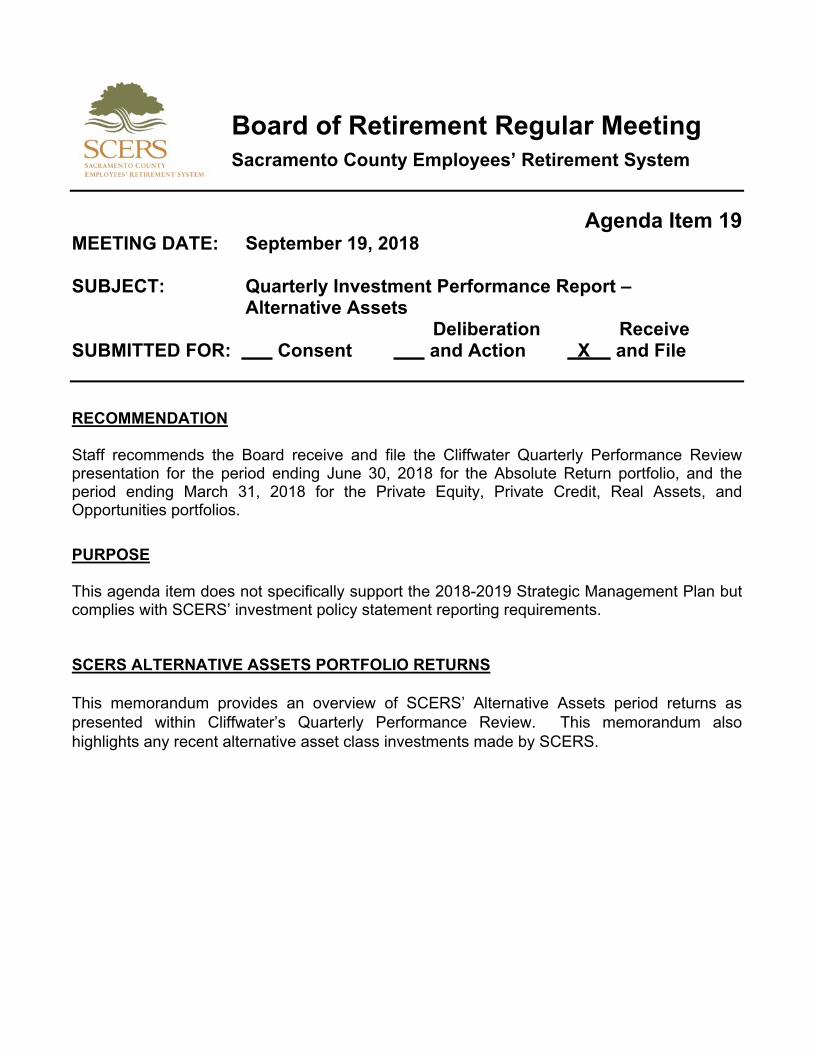
MEETING DATE: September 19, 2018 SUBJECT: Quarterly Investment Performance Report – Alternative Assets Deliberation Receive SUBMITTED FOR: Consent and Action X and File
RECOMMENDATION Staff recommends the Board receive and file the Cliffwater Quarterly Performance Review presentation for the period ending June 30, 2018 for the Absolute Return portfolio, and the period ending March 31, 2018 for the Private Equity, Private Credit, Real Assets, and Opportunities portfolios.
PURPOSE This agenda item does not specifically support the 2018-2019 Strategic Management Plan but complies with SCERS’ investment policy statement reporting requirements. SCERS ALTERNATIVE ASSETS PORTFOLIO RETURNS This memorandum provides an overview of SCERS’ Alternative Assets period returns as presented within Cliffwater’s Quarterly Performance Review. This memorandum also highlights any recent alternative asset class investments made by SCERS.
Board of Retirement Regular Meeting Sacramento County Employees’ Retirement System
September 19, 2018 Page 2 of 8 Agenda Item 19
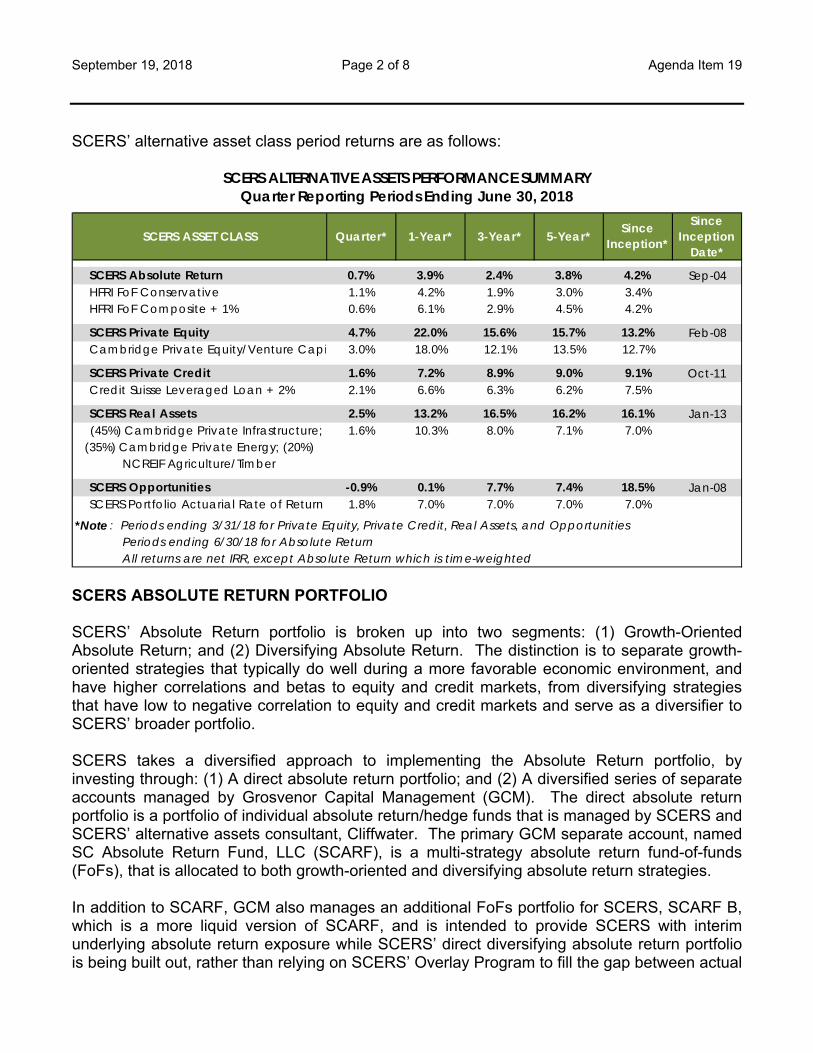
SCERS’ alternative asset class period returns are as follows:
SCERS ABSOLUTE RETURN PORTFOLIO SCERS’ Absolute Return portfolio is broken up into two segments: (1) Growth-Oriented Absolute Return; and (2) Diversifying Absolute Return. The distinction is to separate growth-oriented strategies that typically do well during a more favorable economic environment, and have higher correlations and betas to equity and credit markets, from diversifying strategies that have low to negative correlation to equity and credit markets and serve as a diversifier to SCERS’ broader portfolio. SCERS takes a diversified approach to implementing the Absolute Return portfolio, by investing through: (1) A direct absolute return portfolio; and (2) A diversified series of separate accounts managed by Grosvenor Capital Management (GCM). The direct absolute return portfolio is a portfolio of individual absolute return/hedge funds that is managed by SCERS and SCERS’ alternative assets consultant, Cliffwater. The primary GCM separate account, named SC Absolute Return Fund, LLC (SCARF), is a multi-strategy absolute return fund-of-funds (FoFs), that is allocated to both growth-oriented and diversifying absolute return strategies. In addition to SCARF, GCM also manages an additional FoFs portfolio for SCERS, SCARF B, which is a more liquid version of SCARF, and is intended to provide SCERS with interim underlying absolute return exposure while SCERS’ direct diversifying absolute return portfolio is being built out, rather than relying on SCERS’ Overlay Program to fill the gap between actual
SCERS ASSET CLASS Quarter* 1-Year* 3-Year* 5-Year* Since Inception*
Since Inception
Date*
SCERS Absolute Return 0.7% 3.9% 2.4% 3.8% 4.2% Sep-04 HFRI FoF Conservative 1.1% 4.2% 1.9% 3.0% 3.4% HFRI FoF Composite + 1% 0.6% 6.1% 2.9% 4.5% 4.2%
SCERS Private Equity 4.7% 22.0% 15.6% 15.7% 13.2% Feb-08 Cambridge Private Equity/Venture Capi 3.0% 18.0% 12.1% 13.5% 12.7%
SCERS Private Credit 1.6% 7.2% 8.9% 9.0% 9.1% Oct-11 Credit Suisse Leveraged Loan + 2% 2.1% 6.6% 6.3% 6.2% 7.5%
SCERS Real Assets 2.5% 13.2% 16.5% 16.2% 16.1% Jan-13 (45%) Cambridge Private Infrastructure;
(35%) Cambridge Private Energy; (20%) NCREIF Agriculture/Timber
1.6% 10.3% 8.0% 7.1% 7.0%
SCERS Opportunities -0.9% 0.1% 7.7% 7.4% 18.5% Jan-08 SCERS Portfolio Actuarial Rate of Return 1.8% 7.0% 7.0% 7.0% 7.0%
*Note : Periods ending 3/31/18 for Private Equity, Private Credit, Real Assets, and Opportunities Periods ending 6/30/18 for Absolute Return All returns are net IRR, except Absolute Return which is time-weighted
SCERS ALTERNATIVE ASSETS PERFORMANCE SUMMARYQuarter Reporting Periods Ending June 30, 2018
September 19, 2018 Page 3 of 8 Agenda Item 19
and target Absolute Return allocations. While SCARF B is intended to be a liquidating portfolio, SCARF is considered a long-term strategic allocation within SCERS’ Absolute Return portfolio. SCARF B transitioned during the first quarter to only managing diversifying absolute return strategies. Quarter ended June 30, 2018:
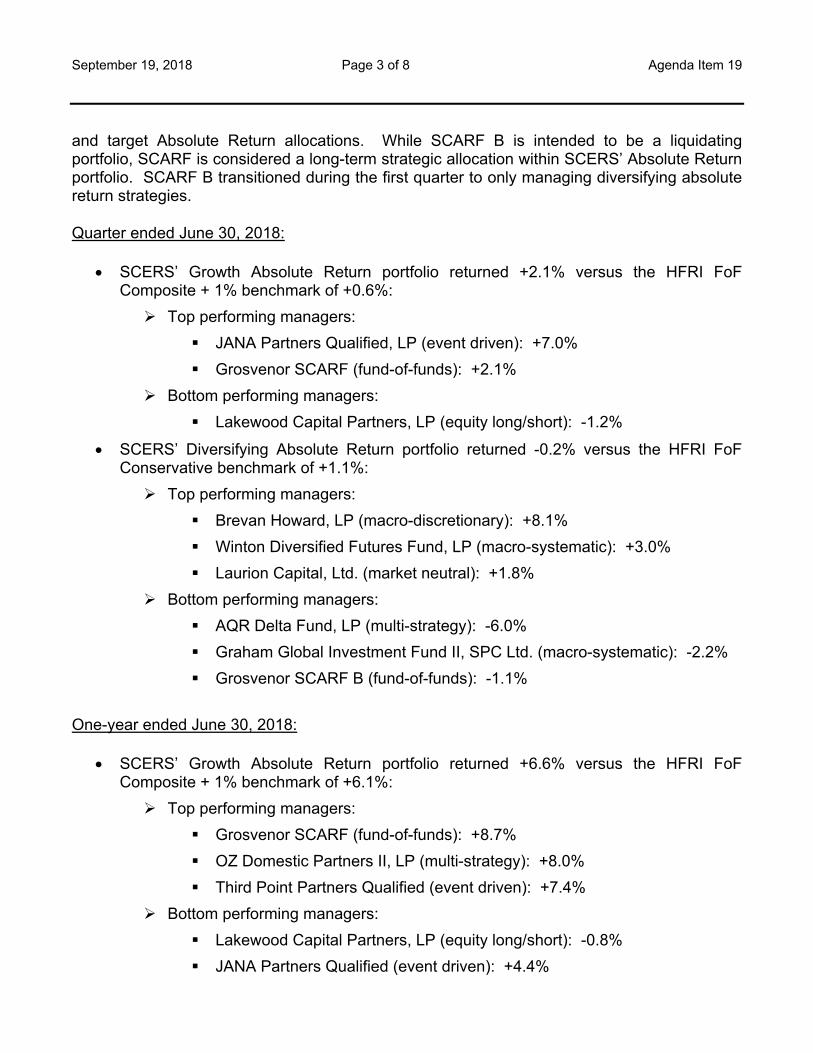
SCERS’ Growth Absolute Return portfolio returned +2.1% versus the HFRI FoF Composite + 1% benchmark of +0.6%:
Top performing managers:
JANA Partners Qualified, LP (event driven): +7.0%
Grosvenor SCARF (fund-of-funds): +2.1%
Bottom performing managers:
Lakewood Capital Partners, LP (equity long/short): -1.2%
SCERS’ Diversifying Absolute Return portfolio returned -0.2% versus the HFRI FoF Conservative benchmark of +1.1%:
Top performing managers:
Brevan Howard, LP (macro-discretionary): +8.1%
Winton Diversified Futures Fund, LP (macro-systematic): +3.0%
Laurion Capital, Ltd. (market neutral): +1.8%
Bottom performing managers:
AQR Delta Fund, LP (multi-strategy): -6.0%
Graham Global Investment Fund II, SPC Ltd. (macro-systematic): -2.2%
Grosvenor SCARF B (fund-of-funds): -1.1%
One-year ended June 30, 2018:
SCERS’ Growth Absolute Return portfolio returned +6.6% versus the HFRI FoF Composite + 1% benchmark of +6.1%:
Top performing managers:
Grosvenor SCARF (fund-of-funds): +8.7%
OZ Domestic Partners II, LP (multi-strategy): +8.0%
Third Point Partners Qualified (event driven): +7.4%
Bottom performing managers:
Lakewood Capital Partners, LP (equity long/short): -0.8%
JANA Partners Qualified (event driven): +4.4%
September 19, 2018 Page 4 of 8 Agenda Item 19
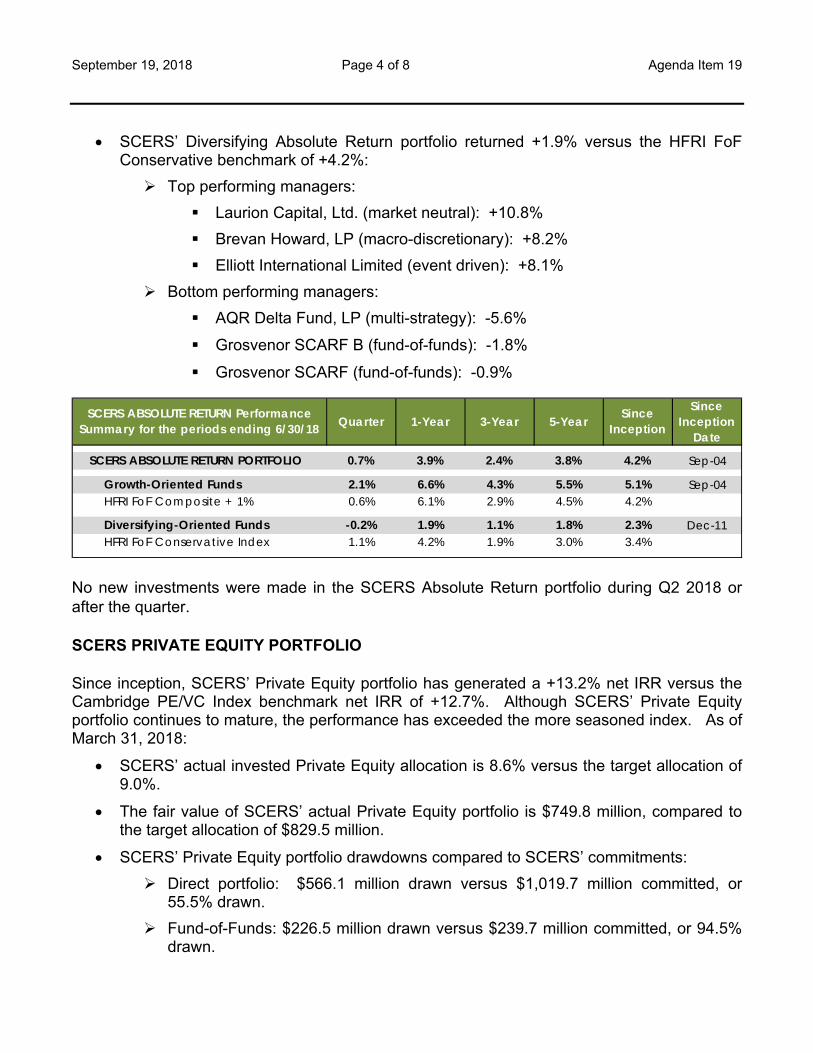
SCERS’ Diversifying Absolute Return portfolio returned +1.9% versus the HFRI FoF Conservative benchmark of +4.2%:
Top performing managers:
Laurion Capital, Ltd. (market neutral): +10.8%
Brevan Howard, LP (macro-discretionary): +8.2%
Elliott International Limited (event driven): +8.1%
Bottom performing managers:
AQR Delta Fund, LP (multi-strategy): -5.6%
Grosvenor SCARF B (fund-of-funds): -1.8%
Grosvenor SCARF (fund-of-funds): -0.9%
No new investments were made in the SCERS Absolute Return portfolio during Q2 2018 or after the quarter. SCERS PRIVATE EQUITY PORTFOLIO Since inception, SCERS’ Private Equity portfolio has generated a +13.2% net IRR versus the Cambridge PE/VC Index benchmark net IRR of +12.7%. Although SCERS’ Private Equity portfolio continues to mature, the performance has exceeded the more seasoned index. As of March 31, 2018:
SCERS’ actual invested Private Equity allocation is 8.6% versus the target allocation of 9.0%.
The fair value of SCERS’ actual Private Equity portfolio is $749.8 million, compared to the target allocation of $829.5 million.
SCERS’ Private Equity portfolio drawdowns compared to SCERS’ commitments:
Direct portfolio: $566.1 million drawn versus $1,019.7 million committed, or 55.5% drawn.
Fund-of-Funds: $226.5 million drawn versus $239.7 million committed, or 94.5% drawn.
SCERS ABSOLUTE RETURN Performance Summary for the periods ending 6/30/18 Quarter 1-Year 3-Year 5-Year Since
Inception
Since Inception
Date
SCERS ABSOLUTE RETURN PORTFOLIO 0.7% 3.9% 2.4% 3.8% 4.2% Sep-04
Growth-Oriented Funds 2.1% 6.6% 4.3% 5.5% 5.1% Sep-04 HFRI FoF Composite + 1% 0.6% 6.1% 2.9% 4.5% 4.2%
Diversifying-Oriented Funds -0.2% 1.9% 1.1% 1.8% 2.3% Dec-11 HFRI FoF Conservative Index 1.1% 4.2% 1.9% 3.0% 3.4%
September 19, 2018 Page 5 of 8 Agenda Item 19
It is industry practice to measure Private Equity returns over vintage years. SCERS’ Private Equity portfolio vintage year since inception net IRRs versus the respective Cambridge PE/VC vintage year benchmarks:
Fund-of-Funds portfolio net IRRs since inception versus the respective Cambridge PE/VC vintage year benchmarks:
2006: +10.6% versus +7.2%
2008: +11.8% versus +8.6%
Direct portfolio net IRRs since inception versus the respective Cambridge PE/VC vintage year benchmarks:
2011: +29.7% versus +13.5%
2012: +12.9% versus +13.2%
2013: +10.1% versus +13.4%
2014: +17.1% versus +13.6%
2015: +21.9% versus +12.8%
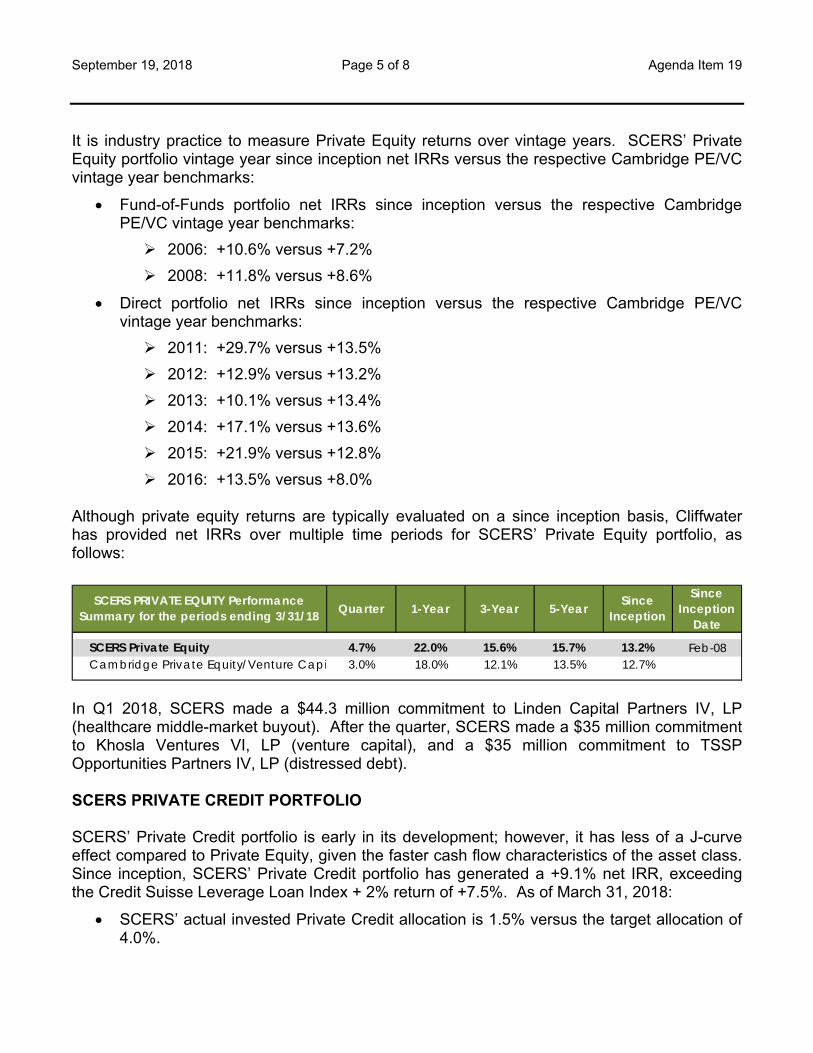
2016: +13.5% versus +8.0% Although private equity returns are typically evaluated on a since inception basis, Cliffwater has provided net IRRs over multiple time periods for SCERS’ Private Equity portfolio, as follows:
In Q1 2018, SCERS made a $44.3 million commitment to Linden Capital Partners IV, LP (healthcare middle-market buyout). After the quarter, SCERS made a $35 million commitment to Khosla Ventures VI, LP (venture capital), and a $35 million commitment to TSSP Opportunities Partners IV, LP (distressed debt). SCERS PRIVATE CREDIT PORTFOLIO SCERS’ Private Credit portfolio is early in its development; however, it has less of a J-curve effect compared to Private Equity, given the faster cash flow characteristics of the asset class. Since inception, SCERS’ Private Credit portfolio has generated a +9.1% net IRR, exceeding the Credit Suisse Leverage Loan Index + 2% return of +7.5%. As of March 31, 2018:
SCERS’ actual invested Private Credit allocation is 1.5% versus the target allocation of 4.0%.
SCERS PRIVATE EQUITY Performance Summary for the periods ending 3/31/18 Quarter 1-Year 3-Year 5-Year Since
Inception
Since Inception
Date
SCERS Private Equity 4.7% 22.0% 15.6% 15.7% 13.2% Feb-08 Cambridge Private Equity/Venture Capi 3.0% 18.0% 12.1% 13.5% 12.7%
September 19, 2018 Page 6 of 8 Agenda Item 19
The fair value of SCERS’ actual Private Credit portfolio is $89.6 million, compared to the target allocation of $368.7 million.
SCERS’ Private Credit portfolio has drawn $137.7 million of its $312.0 million commitment, or 44.1% drawn.
It is industry practice to measure Private Credit returns over vintage years. SCERS’ net IRRs since inception versus the respective Credit Suisse Leverage Loan Index + 2% vintage year benchmarks returns are as follows:
2011: +9.2% versus Not Available
2014: +9.9% versus +3.8%
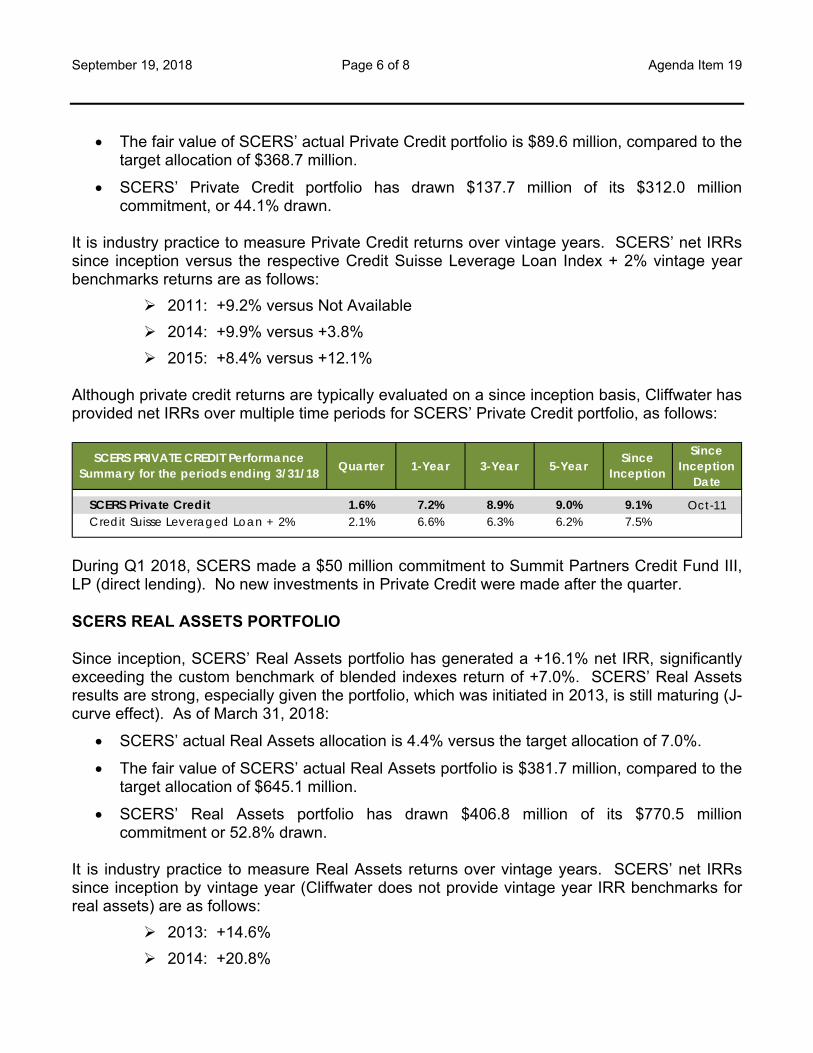
2015: +8.4% versus +12.1% Although private credit returns are typically evaluated on a since inception basis, Cliffwater has provided net IRRs over multiple time periods for SCERS’ Private Credit portfolio, as follows:
During Q1 2018, SCERS made a $50 million commitment to Summit Partners Credit Fund III, LP (direct lending). No new investments in Private Credit were made after the quarter. SCERS REAL ASSETS PORTFOLIO Since inception, SCERS’ Real Assets portfolio has generated a +16.1% net IRR, significantly exceeding the custom benchmark of blended indexes return of +7.0%. SCERS’ Real Assets results are strong, especially given the portfolio, which was initiated in 2013, is still maturing (J-curve effect). As of March 31, 2018:
SCERS’ actual Real Assets allocation is 4.4% versus the target allocation of 7.0%.
The fair value of SCERS’ actual Real Assets portfolio is $381.7 million, compared to the target allocation of $645.1 million.
SCERS’ Real Assets portfolio has drawn $406.8 million of its $770.5 million commitment or 52.8% drawn.
It is industry practice to measure Real Assets returns over vintage years. SCERS’ net IRRs since inception by vintage year (Cliffwater does not provide vintage year IRR benchmarks for real assets) are as follows:
2013: +14.6%
2014: +20.8%
SCERS PRIVATE CREDIT Performance Summary for the periods ending 3/31/18 Quarter 1-Year 3-Year 5-Year Since
Inception
Since Inception
Date
SCERS Private Credit 1.6% 7.2% 8.9% 9.0% 9.1% Oct-11 Credit Suisse Leveraged Loan + 2% 2.1% 6.6% 6.3% 6.2% 7.5%
September 19, 2018 Page 7 of 8 Agenda Item 19
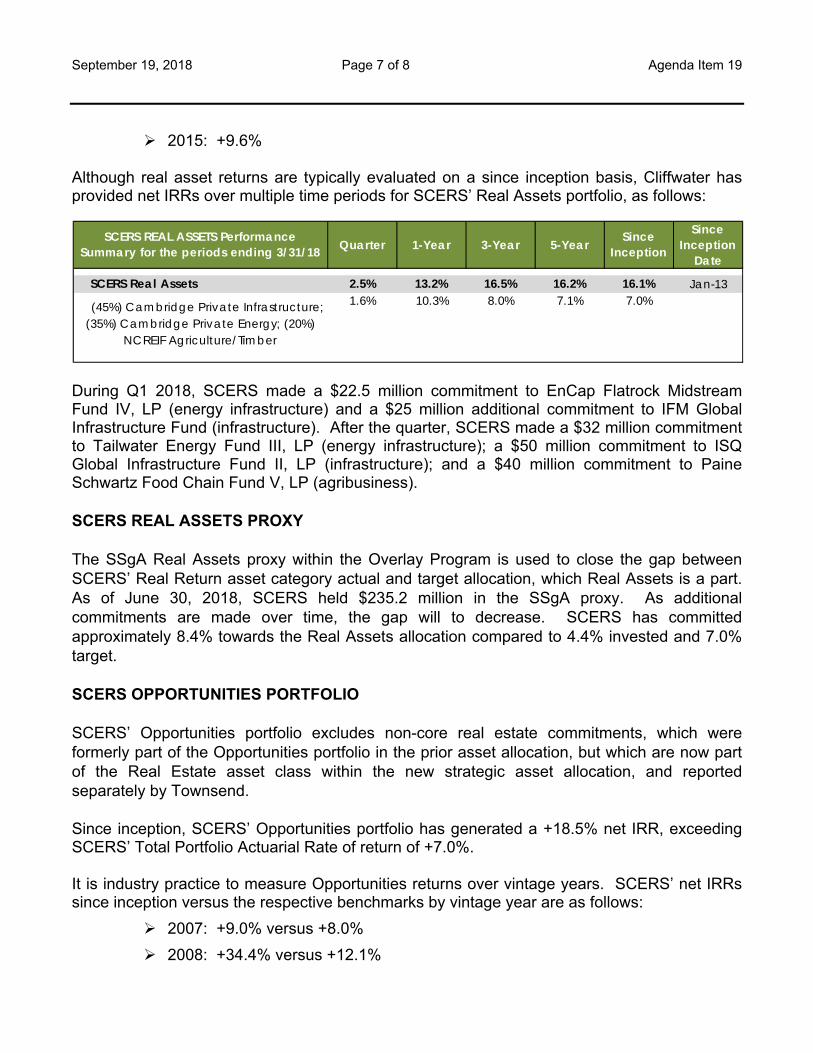
2015: +9.6% Although real asset returns are typically evaluated on a since inception basis, Cliffwater has provided net IRRs over multiple time periods for SCERS’ Real Assets portfolio, as follows:
During Q1 2018, SCERS made a $22.5 million commitment to EnCap Flatrock Midstream Fund IV, LP (energy infrastructure) and a $25 million additional commitment to IFM Global Infrastructure Fund (infrastructure). After the quarter, SCERS made a $32 million commitment to Tailwater Energy Fund III, LP (energy infrastructure); a $50 million commitment to ISQ Global Infrastructure Fund II, LP (infrastructure); and a $40 million commitment to Paine Schwartz Food Chain Fund V, LP (agribusiness). SCERS REAL ASSETS PROXY The SSgA Real Assets proxy within the Overlay Program is used to close the gap between SCERS’ Real Return asset category actual and target allocation, which Real Assets is a part. As of June 30, 2018, SCERS held $235.2 million in the SSgA proxy. As additional commitments are made over time, the gap will to decrease. SCERS has committed approximately 8.4% towards the Real Assets allocation compared to 4.4% invested and 7.0% target. SCERS OPPORTUNITIES PORTFOLIO SCERS’ Opportunities portfolio excludes non-core real estate commitments, which were formerly part of the Opportunities portfolio in the prior asset allocation, but which are now part of the Real Estate asset class within the new strategic asset allocation, and reported separately by Townsend. Since inception, SCERS’ Opportunities portfolio has generated a +18.5% net IRR, exceeding SCERS’ Total Portfolio Actuarial Rate of return of +7.0%. It is industry practice to measure Opportunities returns over vintage years. SCERS’ net IRRs since inception versus the respective benchmarks by vintage year are as follows:
2007: +9.0% versus +8.0%
2008: +34.4% versus +12.1%
SCERS REAL ASSETS Performance Summary for the periods ending 3/31/18 Quarter 1-Year 3-Year 5-Year Since
Inception
Since Inception
Date
SCERS Real Assets 2.5% 13.2% 16.5% 16.2% 16.1% Jan-13
(45%) Cambridge Private Infrastructure; (35%) Cambridge Private Energy; (20%)
NCREIF Agriculture/Timber
1.6% 10.3% 8.0% 7.1% 7.0%
September 19, 2018 Page 8 of 8 Agenda Item 19
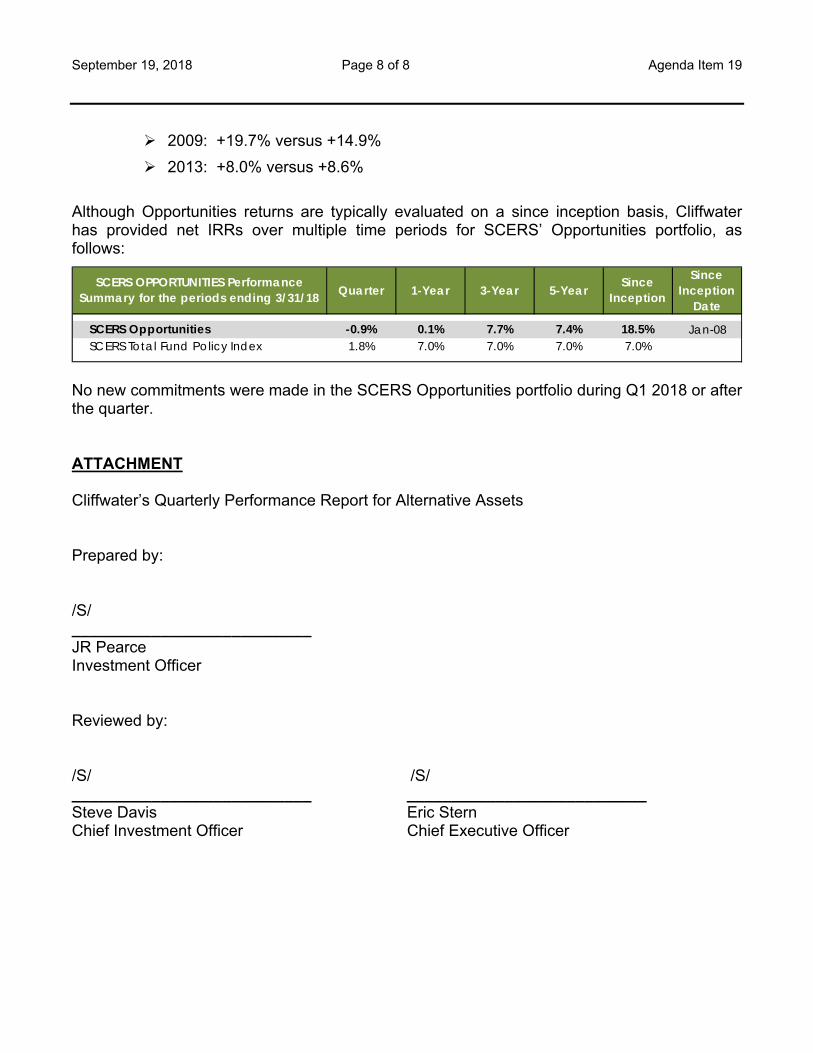
2009: +19.7% versus +14.9%
2013: +8.0% versus +8.6%
Although Opportunities returns are typically evaluated on a since inception basis, Cliffwater has provided net IRRs over multiple time periods for SCERS’ Opportunities portfolio, as follows:
No new commitments were made in the SCERS Opportunities portfolio during Q1 2018 or after the quarter. ATTACHMENT Cliffwater’s Quarterly Performance Report for Alternative Assets Prepared by: /S/ ___________________________ JR Pearce Investment Officer Reviewed by: /S/ /S/ ___________________________ ___________________________ Steve Davis Eric Stern Chief Investment Officer Chief Executive Officer
SCERS OPPORTUNITIES Performance Summary for the periods ending 3/31/18 Quarter 1-Year 3-Year 5-Year Since
Inception
Since Inception
Date
SCERS Opportunities -0.9% 0.1% 7.7% 7.4% 18.5% Jan-08 SCERS Total Fund Policy Index 1.8% 7.0% 7.0% 7.0% 7.0%
I N V E S T M E N T A D V I S O R Y S E R V I C E S
Los Angeles • New York
Sacramento County Employees’ Retirement SystemQuarterly Performance Review
September 19, 2018
2
Executive Summary
3
Absolute Return Portfolio Performance Summary – as of June 30, 2018
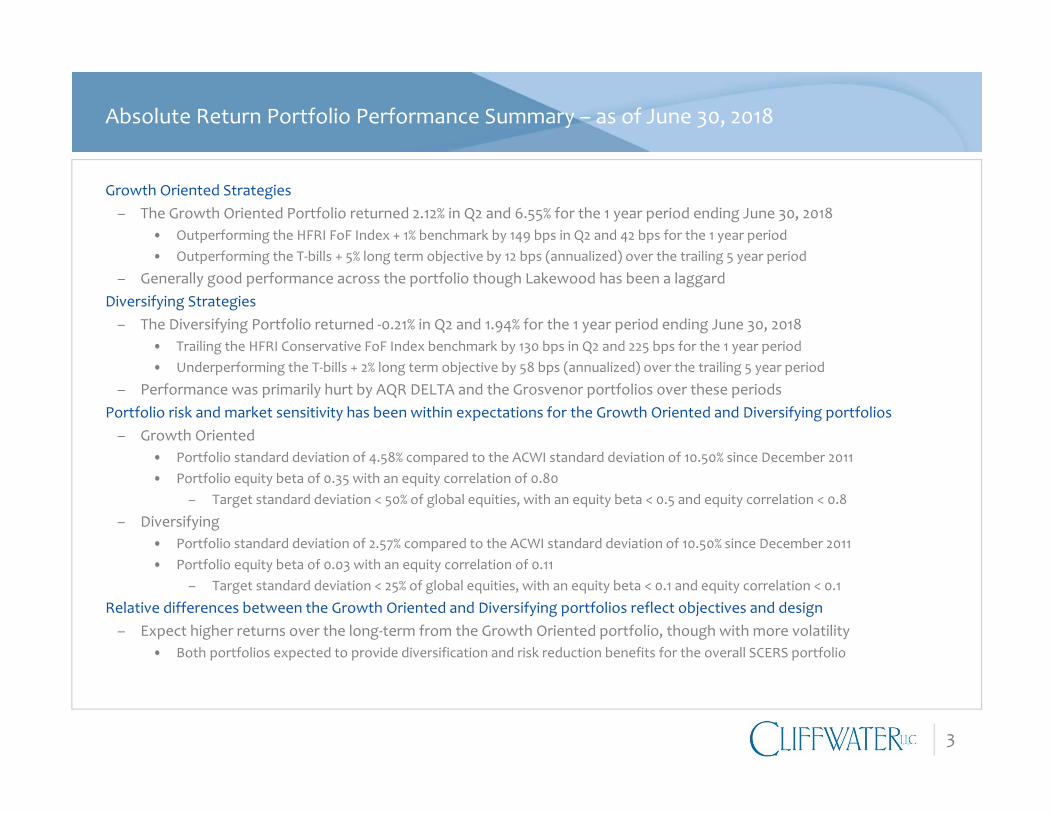
Growth Oriented Strategies– The Growth Oriented Portfolio returned 2.12% in Q2 and 6.55% for the 1 year period ending June 30, 2018
• Outperforming the HFRI FoF Index + 1% benchmark by 149 bps in Q2 and 42 bps for the 1 year period• Outperforming the T‐bills + 5% long term objective by 12 bps (annualized) over the trailing 5 year period
– Generally good performance across the portfolio though Lakewood has been a laggardDiversifying Strategies– The Diversifying Portfolio returned ‐0.21% in Q2 and 1.94% for the 1 year period ending June 30, 2018
• Trailing the HFRI Conservative FoF Index benchmark by 130 bps in Q2 and 225 bps for the 1 year period• Underperforming the T‐bills + 2% long term objective by 58 bps (annualized) over the trailing 5 year period
– Performance was primarily hurt by AQR DELTA and the Grosvenor portfolios over these periodsPortfolio risk and market sensitivity has been within expectations for the Growth Oriented and Diversifying portfolios– Growth Oriented
• Portfolio standard deviation of 4.58% compared to the ACWI standard deviation of 10.50% since December 2011• Portfolio equity beta of 0.35 with an equity correlation of 0.80
– Target standard deviation < 50% of global equities, with an equity beta < 0.5 and equity correlation < 0.8
– Diversifying• Portfolio standard deviation of 2.57% compared to the ACWI standard deviation of 10.50% since December 2011• Portfolio equity beta of 0.03 with an equity correlation of 0.11
– Target standard deviation < 25% of global equities, with an equity beta < 0.1 and equity correlation < 0.1
Relative differences between the Growth Oriented and Diversifying portfolios reflect objectives and design– Expect higher returns over the long‐term from the Growth Oriented portfolio, though with more volatility
• Both portfolios expected to provide diversification and risk reduction benefits for the overall SCERS portfolio
4
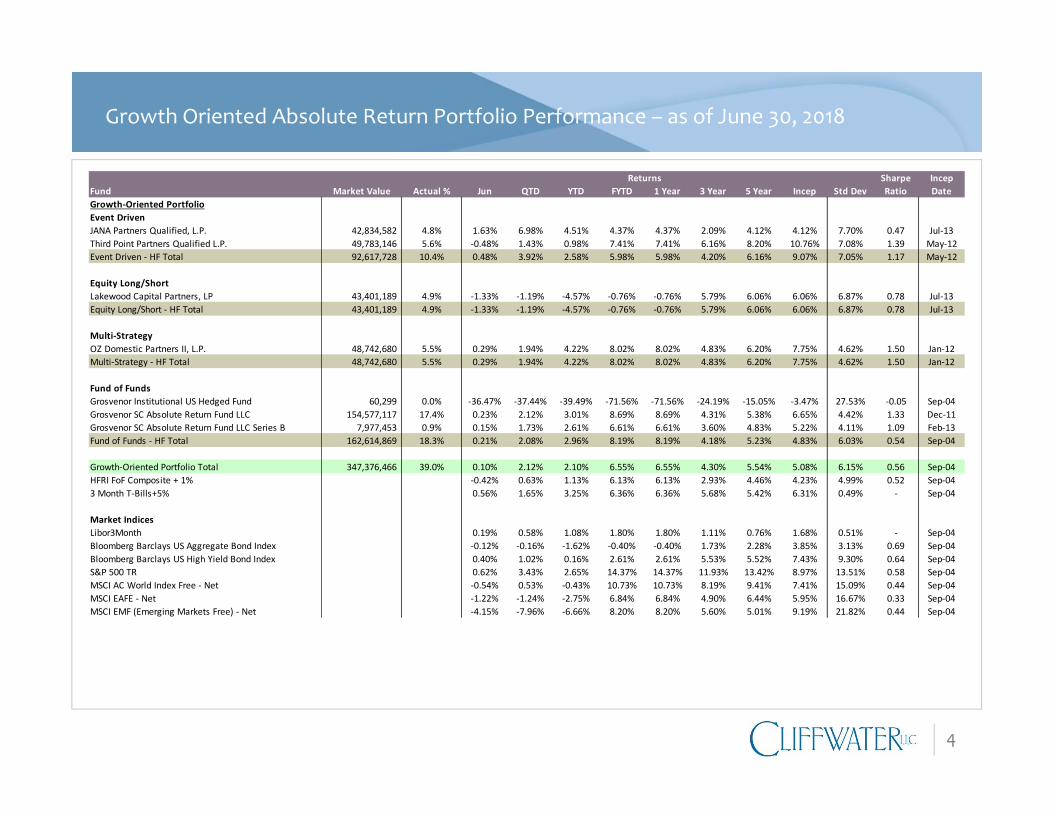
Growth Oriented Absolute Return Portfolio Performance – as of June 30, 2018
Sharpe IncepFund Market Value Actual % Jun QTD YTD FYTD 1 Year 3 Year 5 Year Incep Std Dev Ratio DateGrowth‐Oriented PortfolioEvent DrivenJANA Partners Qualified, L.P. 42,834,582 4.8% 1.63% 6.98% 4.51% 4.37% 4.37% 2.09% 4.12% 4.12% 7.70% 0.47 Jul‐13Third Point Partners Qualified L.P. 49,783,146 5.6% ‐0.48% 1.43% 0.98% 7.41% 7.41% 6.16% 8.20% 10.76% 7.08% 1.39 May‐12Event Driven ‐ HF Total 92,617,728 10.4% 0.48% 3.92% 2.58% 5.98% 5.98% 4.20% 6.16% 9.07% 7.05% 1.17 May‐12
Equity Long/ShortLakewood Capital Partners, LP 43,401,189 4.9% ‐1.33% ‐1.19% ‐4.57% ‐0.76% ‐0.76% 5.79% 6.06% 6.06% 6.87% 0.78 Jul‐13Equity Long/Short ‐ HF Total 43,401,189 4.9% ‐1.33% ‐1.19% ‐4.57% ‐0.76% ‐0.76% 5.79% 6.06% 6.06% 6.87% 0.78 Jul‐13
Multi‐StrategyOZ Domestic Partners II, L.P. 48,742,680 5.5% 0.29% 1.94% 4.22% 8.02% 8.02% 4.83% 6.20% 7.75% 4.62% 1.50 Jan‐12Multi‐Strategy ‐ HF Total 48,742,680 5.5% 0.29% 1.94% 4.22% 8.02% 8.02% 4.83% 6.20% 7.75% 4.62% 1.50 Jan‐12
Fund of FundsGrosvenor Institutional US Hedged Fund 60,299 0.0% ‐36.47% ‐37.44% ‐39.49% ‐71.56% ‐71.56% ‐24.19% ‐15.05% ‐3.47% 27.53% ‐0.05 Sep‐04Grosvenor SC Absolute Return Fund LLC 154,577,117 17.4% 0.23% 2.12% 3.01% 8.69% 8.69% 4.31% 5.38% 6.65% 4.42% 1.33 Dec‐11Grosvenor SC Absolute Return Fund LLC Series B 7,977,453 0.9% 0.15% 1.73% 2.61% 6.61% 6.61% 3.60% 4.83% 5.22% 4.11% 1.09 Feb‐13Fund of Funds ‐ HF Total 162,614,869 18.3% 0.21% 2.08% 2.96% 8.19% 8.19% 4.18% 5.23% 4.83% 6.03% 0.54 Sep‐04
Growth‐Oriented Portfolio Total 347,376,466 39.0% 0.10% 2.12% 2.10% 6.55% 6.55% 4.30% 5.54% 5.08% 6.15% 0.56 Sep‐04HFRI FoF Composite + 1% ‐0.42% 0.63% 1.13% 6.13% 6.13% 2.93% 4.46% 4.23% 4.99% 0.52 Sep‐043 Month T‐Bills+5% 0.56% 1.65% 3.25% 6.36% 6.36% 5.68% 5.42% 6.31% 0.49% ‐ Sep‐04
Market IndicesLibor3Month 0.19% 0.58% 1.08% 1.80% 1.80% 1.11% 0.76% 1.68% 0.51% ‐ Sep‐04Bloomberg Barclays US Aggregate Bond Index ‐0.12% ‐0.16% ‐1.62% ‐0.40% ‐0.40% 1.73% 2.28% 3.85% 3.13% 0.69 Sep‐04Bloomberg Barclays US High Yield Bond Index 0.40% 1.02% 0.16% 2.61% 2.61% 5.53% 5.52% 7.43% 9.30% 0.64 Sep‐04S&P 500 TR 0.62% 3.43% 2.65% 14.37% 14.37% 11.93% 13.42% 8.97% 13.51% 0.58 Sep‐04MSCI AC World Index Free ‐ Net ‐0.54% 0.53% ‐0.43% 10.73% 10.73% 8.19% 9.41% 7.41% 15.09% 0.44 Sep‐04MSCI EAFE ‐ Net ‐1.22% ‐1.24% ‐2.75% 6.84% 6.84% 4.90% 6.44% 5.95% 16.67% 0.33 Sep‐04MSCI EMF (Emerging Markets Free) ‐ Net ‐4.15% ‐7.96% ‐6.66% 8.20% 8.20% 5.60% 5.01% 9.19% 21.82% 0.44 Sep‐04
Returns
5
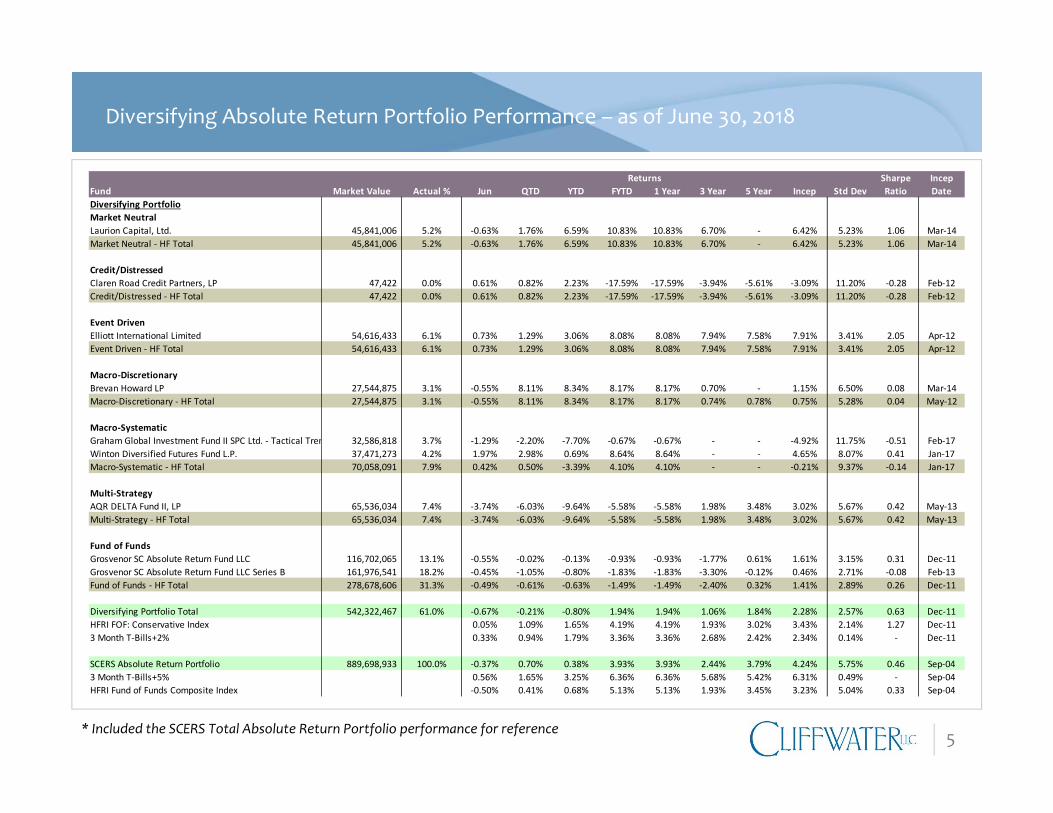
Diversifying Absolute Return Portfolio Performance – as of June 30, 2018
* Included the SCERS Total Absolute Return Portfolio performance for reference
Sharpe IncepFund Market Value Actual % Jun QTD YTD FYTD 1 Year 3 Year 5 Year Incep Std Dev Ratio DateDiversifying PortfolioMarket NeutralLaurion Capital, Ltd. 45,841,006 5.2% ‐0.63% 1.76% 6.59% 10.83% 10.83% 6.70% ‐ 6.42% 5.23% 1.06 Mar‐14Market Neutral ‐ HF Total 45,841,006 5.2% ‐0.63% 1.76% 6.59% 10.83% 10.83% 6.70% ‐ 6.42% 5.23% 1.06 Mar‐14
Credit/DistressedClaren Road Credit Partners, LP 47,422 0.0% 0.61% 0.82% 2.23% ‐17.59% ‐17.59% ‐3.94% ‐5.61% ‐3.09% 11.20% ‐0.28 Feb‐12Credit/Distressed ‐ HF Total 47,422 0.0% 0.61% 0.82% 2.23% ‐17.59% ‐17.59% ‐3.94% ‐5.61% ‐3.09% 11.20% ‐0.28 Feb‐12
Event DrivenElliott International Limited 54,616,433 6.1% 0.73% 1.29% 3.06% 8.08% 8.08% 7.94% 7.58% 7.91% 3.41% 2.05 Apr‐12Event Driven ‐ HF Total 54,616,433 6.1% 0.73% 1.29% 3.06% 8.08% 8.08% 7.94% 7.58% 7.91% 3.41% 2.05 Apr‐12
Macro‐DiscretionaryBrevan Howard LP 27,544,875 3.1% ‐0.55% 8.11% 8.34% 8.17% 8.17% 0.70% ‐ 1.15% 6.50% 0.08 Mar‐14Macro‐Discretionary ‐ HF Total 27,544,875 3.1% ‐0.55% 8.11% 8.34% 8.17% 8.17% 0.74% 0.78% 0.75% 5.28% 0.04 May‐12
Macro‐SystematicGraham Global Investment Fund II SPC Ltd. ‐ Tactical Tren 32,586,818 3.7% ‐1.29% ‐2.20% ‐7.70% ‐0.67% ‐0.67% ‐ ‐ ‐4.92% 11.75% ‐0.51 Feb‐17Winton Diversified Futures Fund L.P. 37,471,273 4.2% 1.97% 2.98% 0.69% 8.64% 8.64% ‐ ‐ 4.65% 8.07% 0.41 Jan‐17Macro‐Systematic ‐ HF Total 70,058,091 7.9% 0.42% 0.50% ‐3.39% 4.10% 4.10% ‐ ‐ ‐0.21% 9.37% ‐0.14 Jan‐17
Multi‐StrategyAQR DELTA Fund II, LP 65,536,034 7.4% ‐3.74% ‐6.03% ‐9.64% ‐5.58% ‐5.58% 1.98% 3.48% 3.02% 5.67% 0.42 May‐13Multi‐Strategy ‐ HF Total 65,536,034 7.4% ‐3.74% ‐6.03% ‐9.64% ‐5.58% ‐5.58% 1.98% 3.48% 3.02% 5.67% 0.42 May‐13
Fund of FundsGrosvenor SC Absolute Return Fund LLC 116,702,065 13.1% ‐0.55% ‐0.02% ‐0.13% ‐0.93% ‐0.93% ‐1.77% 0.61% 1.61% 3.15% 0.31 Dec‐11Grosvenor SC Absolute Return Fund LLC Series B 161,976,541 18.2% ‐0.45% ‐1.05% ‐0.80% ‐1.83% ‐1.83% ‐3.30% ‐0.12% 0.46% 2.71% ‐0.08 Feb‐13Fund of Funds ‐ HF Total 278,678,606 31.3% ‐0.49% ‐0.61% ‐0.63% ‐1.49% ‐1.49% ‐2.40% 0.32% 1.41% 2.89% 0.26 Dec‐11
Diversifying Portfolio Total 542,322,467 61.0% ‐0.67% ‐0.21% ‐0.80% 1.94% 1.94% 1.06% 1.84% 2.28% 2.57% 0.63 Dec‐11HFRI FOF: Conservative Index 0.05% 1.09% 1.65% 4.19% 4.19% 1.93% 3.02% 3.43% 2.14% 1.27 Dec‐113 Month T‐Bills+2% 0.33% 0.94% 1.79% 3.36% 3.36% 2.68% 2.42% 2.34% 0.14% ‐ Dec‐11
SCERS Absolute Return Portfolio 889,698,933 100.0% ‐0.37% 0.70% 0.38% 3.93% 3.93% 2.44% 3.79% 4.24% 5.75% 0.46 Sep‐043 Month T‐Bills+5% 0.56% 1.65% 3.25% 6.36% 6.36% 5.68% 5.42% 6.31% 0.49% ‐ Sep‐04HFRI Fund of Funds Composite Index ‐0.50% 0.41% 0.68% 5.13% 5.13% 1.93% 3.45% 3.23% 5.04% 0.33 Sep‐04
Returns
6
$1.25
$1.16
$0.90
$0.95
$1.00
$1.05
$1.10
$1.15
$1.20
$1.25
$1.30
SCERS HFRI Cons. FoF T‐Bills+2%
$1.54
$1.36$1.41
$0.80
$0.90
$1.00
$1.10
$1.20
$1.30
$1.40
$1.50
$1.60
SCERS HFRI FoF+1% T‐Bills+5%
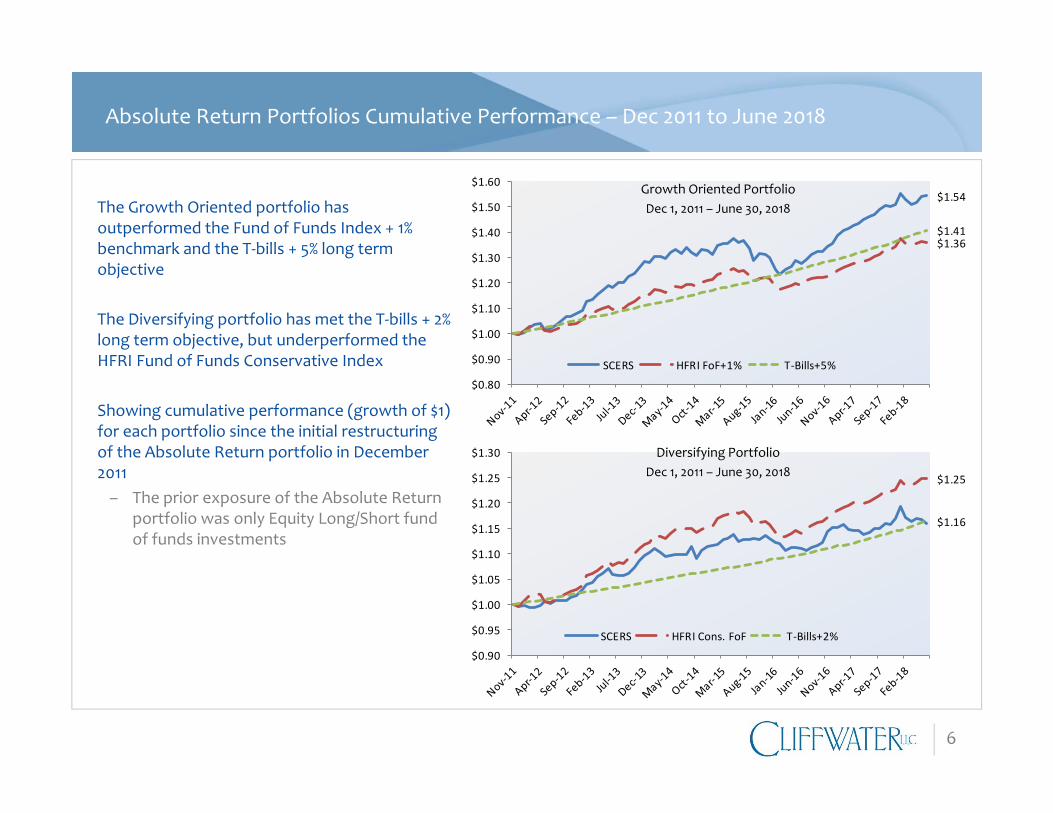
Absolute Return Portfolios Cumulative Performance – Dec 2011 to June 2018
The Growth Oriented portfolio has outperformed the Fund of Funds Index + 1% benchmark and the T‐bills + 5% long term objective
The Diversifying portfolio has met the T‐bills + 2% long term objective, but underperformed the HFRI Fund of Funds Conservative Index
Showing cumulative performance (growth of $1) for each portfolio since the initial restructuring of the Absolute Return portfolio in December 2011– The prior exposure of the Absolute Return
portfolio was only Equity Long/Short fund of funds investments
Diversifying PortfolioDec 1, 2011 – June 30, 2018
Growth Oriented PortfolioDec 1, 2011 – June 30, 2018
7
Private Equity Portfolio – as of March 31, 2018
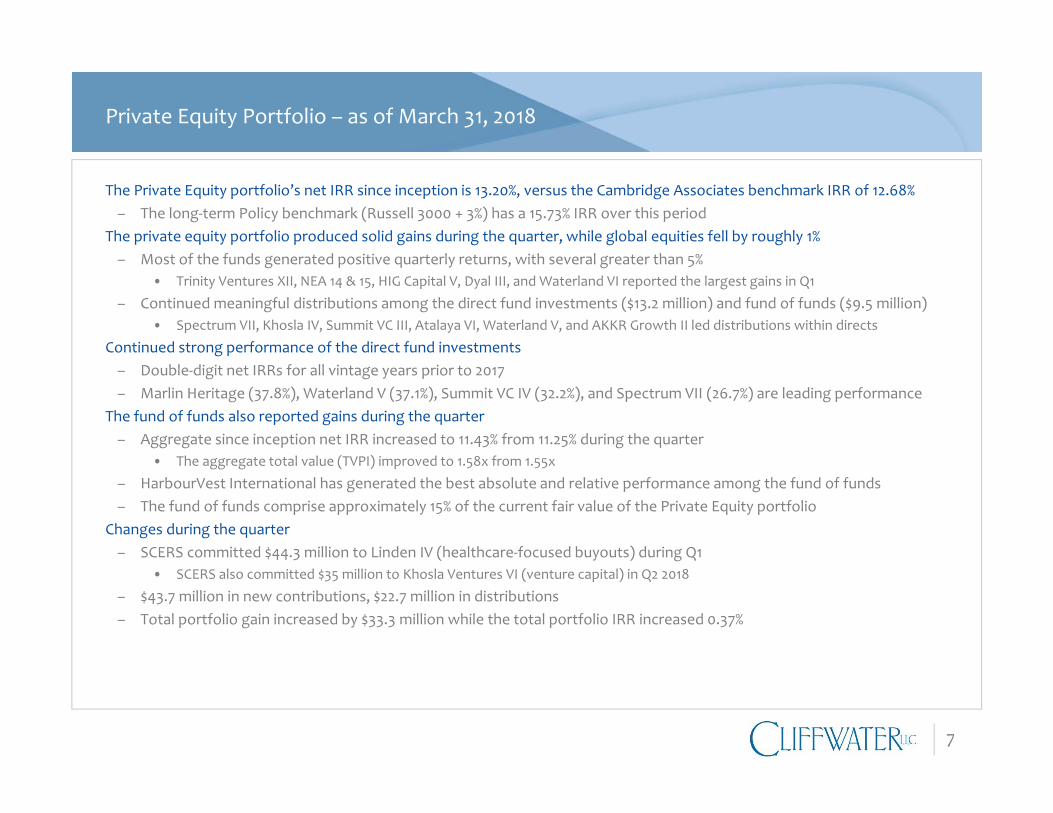
The Private Equity portfolio’s net IRR since inception is 13.20%, versus the Cambridge Associates benchmark IRR of 12.68%– The long‐term Policy benchmark (Russell 3000 + 3%) has a 15.73% IRR over this period
The private equity portfolio produced solid gains during the quarter, while global equities fell by roughly 1%– Most of the funds generated positive quarterly returns, with several greater than 5%
• Trinity Ventures XII, NEA 14 & 15, HIG Capital V, Dyal III, and Waterland VI reported the largest gains in Q1
– Continued meaningful distributions among the direct fund investments ($13.2 million) and fund of funds ($9.5 million)• Spectrum VII, Khosla IV, Summit VC III, Atalaya VI, Waterland V, and AKKR Growth II led distributions within directs
Continued strong performance of the direct fund investments– Double‐digit net IRRs for all vintage years prior to 2017– Marlin Heritage (37.8%), Waterland V (37.1%), Summit VC IV (32.2%), and Spectrum VII (26.7%) are leading performance
The fund of funds also reported gains during the quarter– Aggregate since inception net IRR increased to 11.43% from 11.25% during the quarter
• The aggregate total value (TVPI) improved to 1.58x from 1.55x
– HarbourVest International has generated the best absolute and relative performance among the fund of funds– The fund of funds comprise approximately 15% of the current fair value of the Private Equity portfolio
Changes during the quarter– SCERS committed $44.3 million to Linden IV (healthcare‐focused buyouts) during Q1
• SCERS also committed $35 million to Khosla Ventures VI (venture capital) in Q2 2018
– $43.7 million in new contributions, $22.7 million in distributions– Total portfolio gain increased by $33.3 million while the total portfolio IRR increased 0.37%
8
Private Equity Portfolio Characteristics as of March 31, 2018
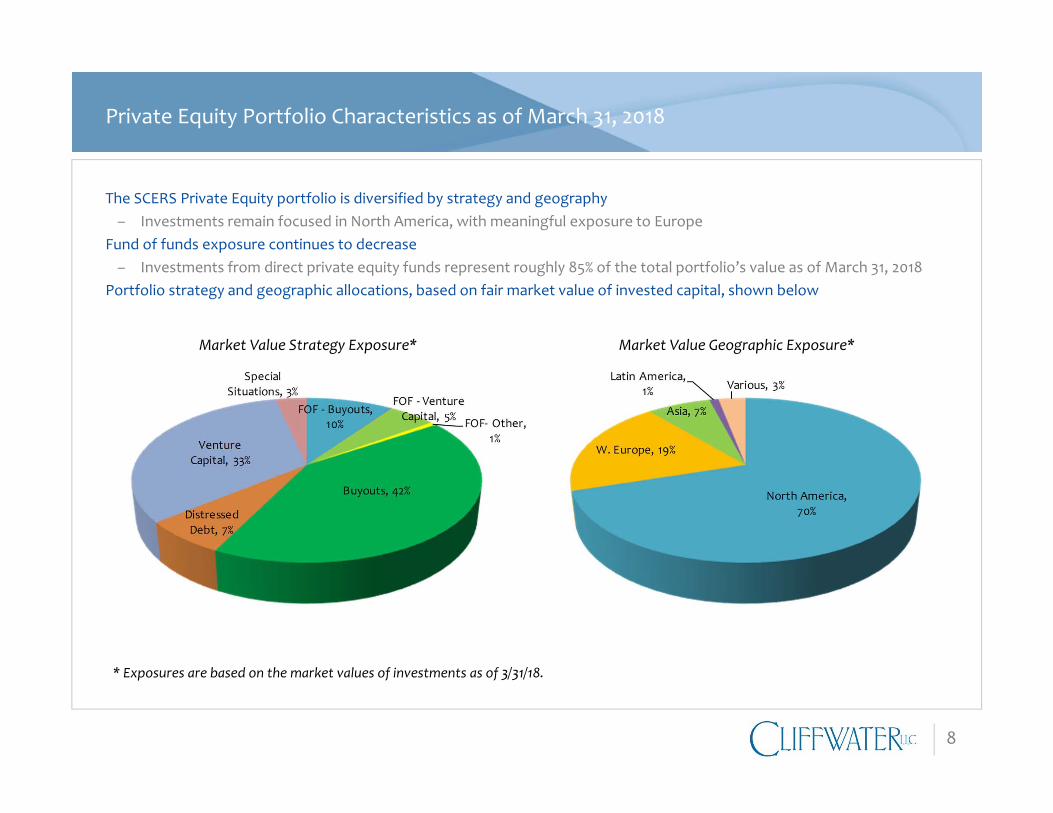
The SCERS Private Equity portfolio is diversified by strategy and geography– Investments remain focused in North America, with meaningful exposure to Europe
Fund of funds exposure continues to decrease– Investments from direct private equity funds represent roughly 85% of the total portfolio’s value as of March 31, 2018
Portfolio strategy and geographic allocations, based on fair market value of invested capital, shown below
Market Value Strategy Exposure* Market Value Geographic Exposure*
* Exposures are based on the market values of investments as of 3/31/18.
9
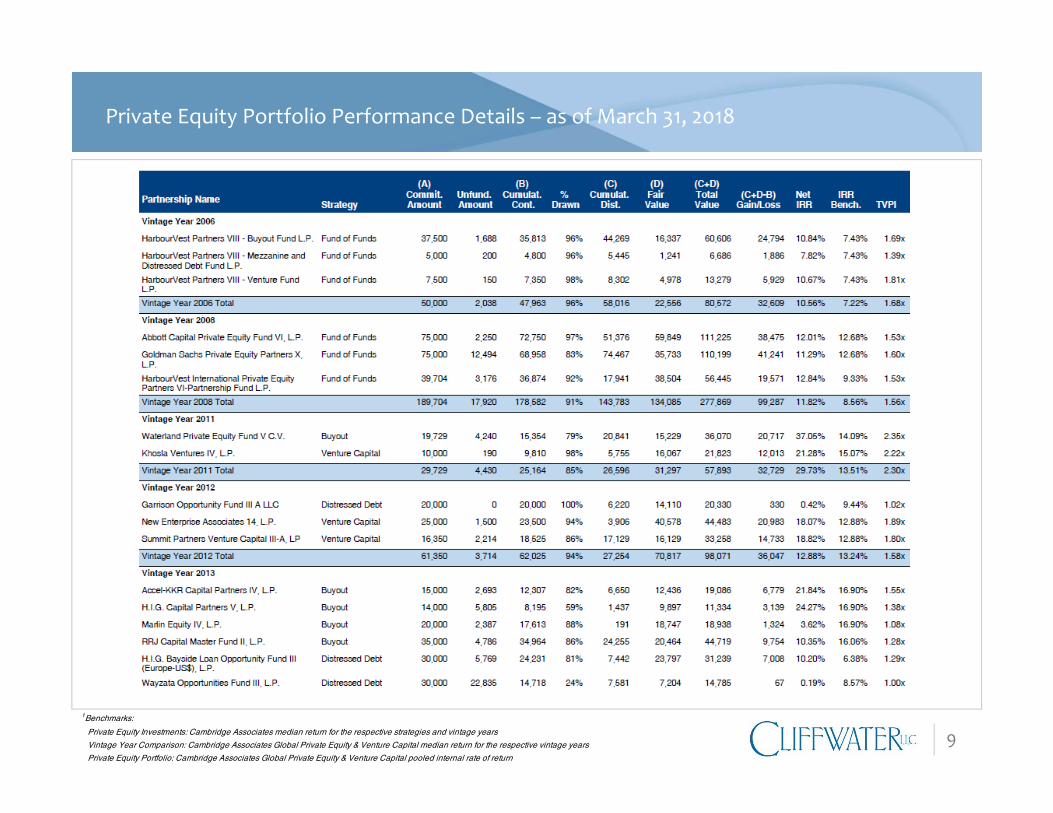
Private Equity Portfolio Performance Details – as of March 31, 2018
1Benchmarks:
Private Equity Investments: Cambridge Associates median return for the respective strategies and vintage years
Vintage Year Comparison: Cambridge Associates Global Private Equity & Venture Capital median return for the respective vintage years
Private Equity Portfolio: Cambridge Associates Global Private Equity & Venture Capital pooled internal rate of return
10
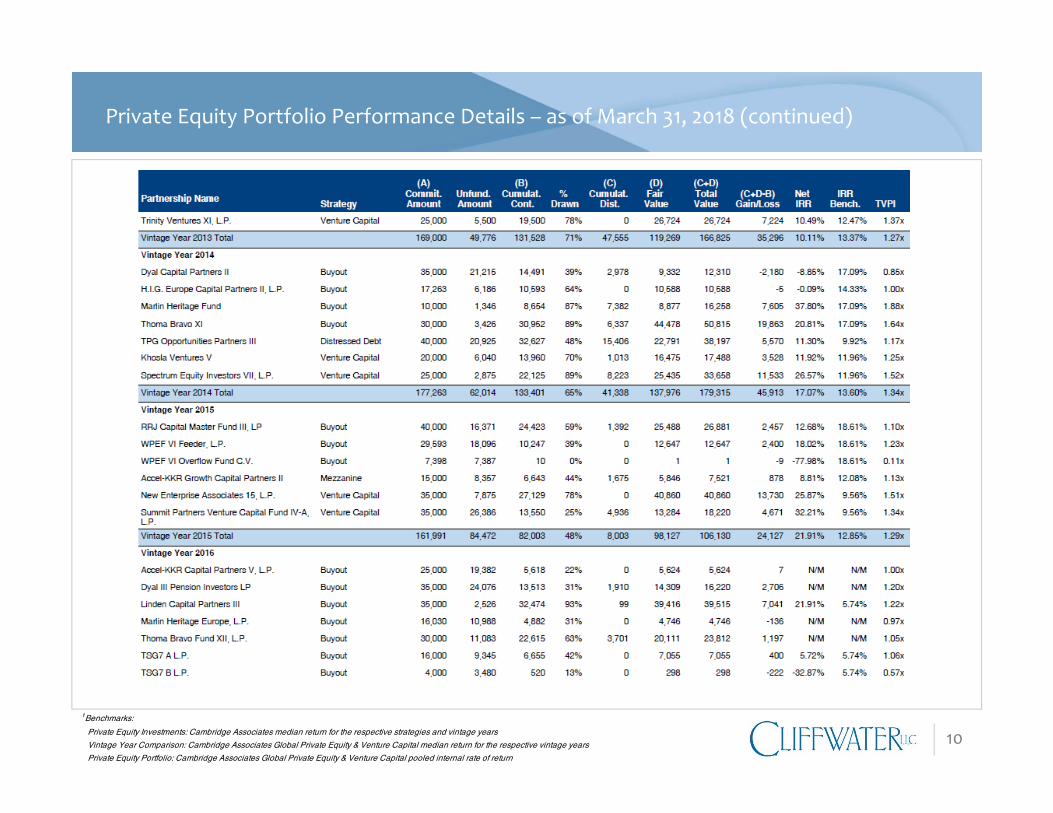
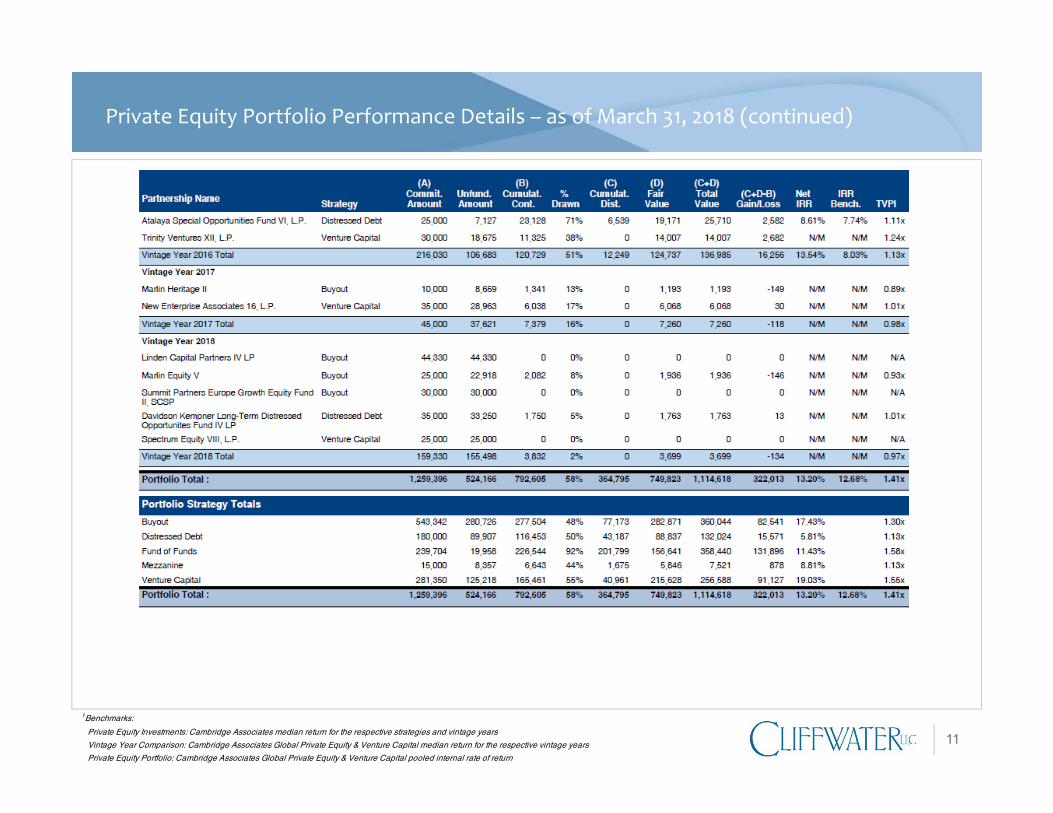
Private Equity Portfolio Performance Details – as of March 31, 2018 (continued)
1Benchmarks:
Private Equity Investments: Cambridge Associates median return for the respective strategies and vintage years
Vintage Year Comparison: Cambridge Associates Global Private Equity & Venture Capital median return for the respective vintage years
Private Equity Portfolio: Cambridge Associates Global Private Equity & Venture Capital pooled internal rate of return
11
Private Equity Portfolio Performance Details – as of March 31, 2018 (continued)
1Benchmarks:
Private Equity Investments: Cambridge Associates median return for the respective strategies and vintage years
Vintage Year Comparison: Cambridge Associates Global Private Equity & Venture Capital median return for the respective vintage years
Private Equity Portfolio: Cambridge Associates Global Private Equity & Venture Capital pooled internal rate of return
12
Private Credit Portfolio – as of March 31, 2018
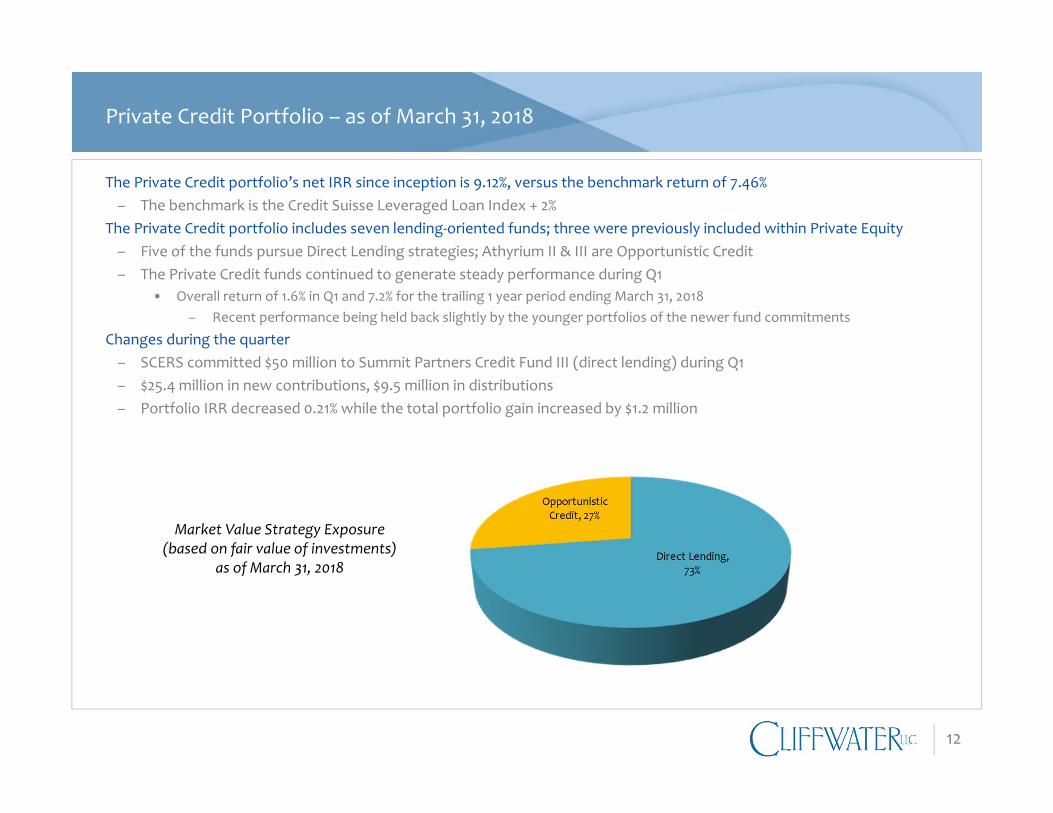
The Private Credit portfolio’s net IRR since inception is 9.12%, versus the benchmark return of 7.46%– The benchmark is the Credit Suisse Leveraged Loan Index + 2%
The Private Credit portfolio includes seven lending‐oriented funds; three were previously included within Private Equity– Five of the funds pursue Direct Lending strategies; Athyrium II & III are Opportunistic Credit– The Private Credit funds continued to generate steady performance during Q1
• Overall return of 1.6% in Q1 and 7.2% for the trailing 1 year period ending March 31, 2018– Recent performance being held back slightly by the younger portfolios of the newer fund commitments
Changes during the quarter– SCERS committed $50 million to Summit Partners Credit Fund III (direct lending) during Q1– $25.4 million in new contributions, $9.5 million in distributions– Portfolio IRR decreased 0.21% while the total portfolio gain increased by $1.2 million
Market Value Strategy Exposure(based on fair value of investments)
as of March 31, 2018
13
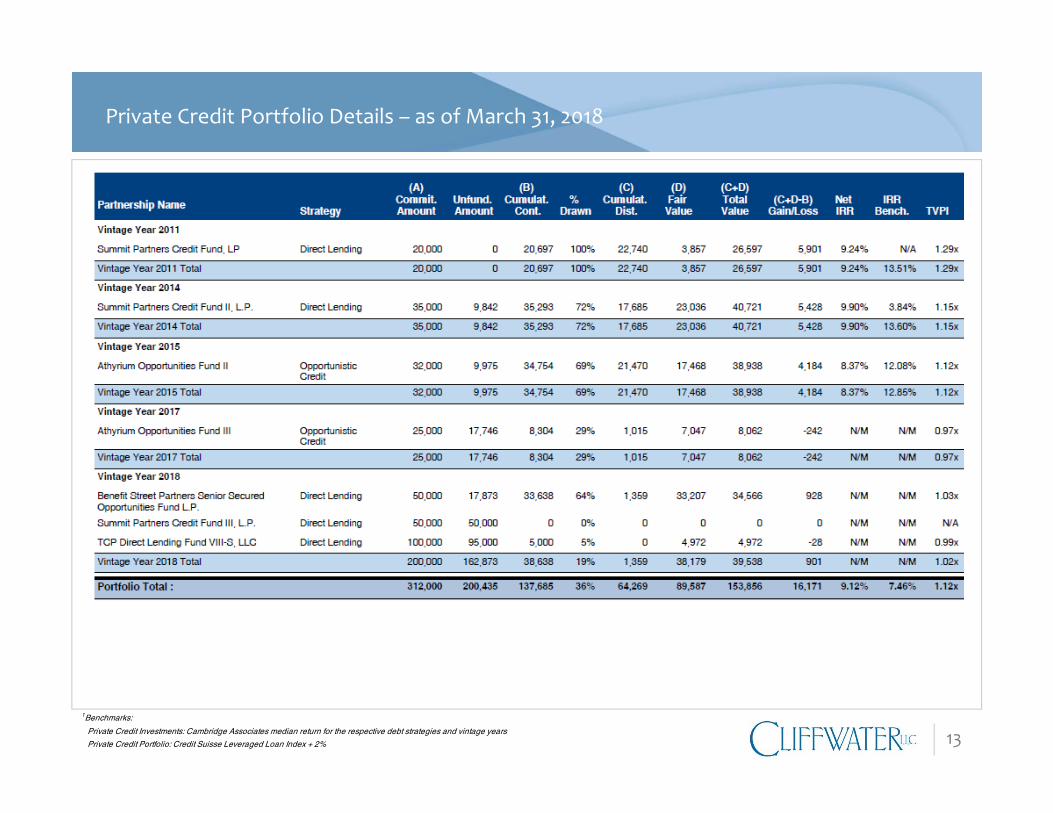
Private Credit Portfolio Details – as of March 31, 2018
1Benchmarks:
Private Credit Investments: Cambridge Associates median return for the respective debt strategies and vintage years
Private Credit Portfolio: Credit Suisse Leveraged Loan Index + 2%
14
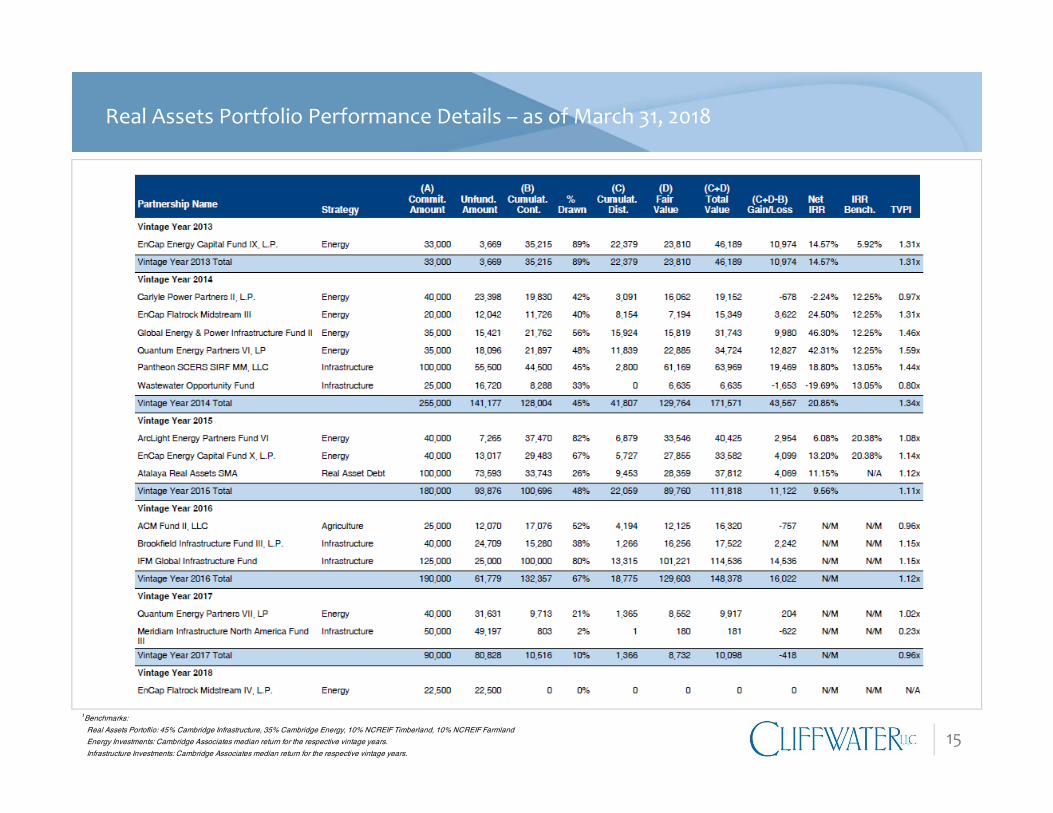
Real Assets Portfolio – as of March 31, 2018
The Real Assets portfolio’s net IRR since inception is 16.12%, versus the blended benchmark return of 6.97%– The Real Assets portfolio includes private Infrastructure, Energy, and Agriculture, Timber and Other
• This is consistent with SCERS’ 2017 asset class structures
– Real Assets is part of the broader Real Return asset categoryThe Real Assets portfolio is primarily Energy and Infrastructure partnerships– Both Energy and Infrastructure partnerships have performed well since inception
• Since inception net IRRs of 17.2% for Energy and 16.6% for Infrastructure
– The Real Asset Debt separate account, though smaller, has also performed well with an 11.2% since inception net IRRThe portfolio generated a 2.5% net return for the quarter despite headwinds in the Energy sector during Q1– The Real Asset Debt separate account performed the best, followed by the Infrastructure funds– EnCap Energy IX and Wastewater were the laggards and saw modest declines during the quarter
• The Wastewater fund has had a relatively slow investment pace with weak performance thus far
Changes during the quarter– SCERS committed $22.5 million to EnCap Flatrock IV (midstream energy) during Q1
• SCERS also increased its commitment to IFM Global Infrastructure Fund by $25 million in Q1
– $27.4 million in new contributions, $27.5 million in distributions– Portfolio IRR decreased 0.95% while the total portfolio gain increased by $9.5 million
15
Real Assets Portfolio Performance Details – as of March 31, 2018
1Benchmarks:
Real Assets Portoflio: 45% Cambridge Infrastructure, 35% Cambridge Energy, 10% NCREIF Timberland, 10% NCREIF Farmland
Energy Investments: Cambridge Associates median return for the respective vintage years.
Infrastructure Investments: Cambridge Associates median return for the respective vintage years.
16
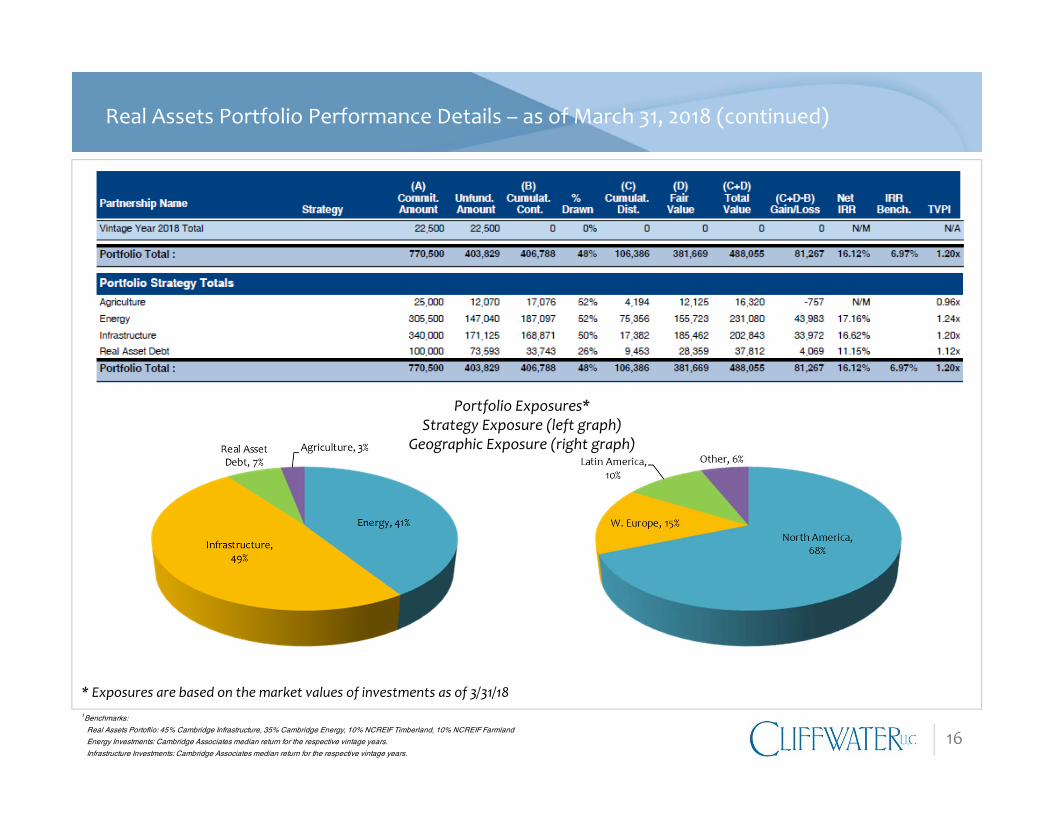
Real Assets Portfolio Performance Details – as of March 31, 2018 (continued)
* Exposures are based on the market values of investments as of 3/31/181Benchmarks:
Real Assets Portoflio: 45% Cambridge Infrastructure, 35% Cambridge Energy, 10% NCREIF Timberland, 10% NCREIF Farmland
Energy Investments: Cambridge Associates median return for the respective vintage years.
Infrastructure Investments: Cambridge Associates median return for the respective vintage years.
Portfolio Exposures*Strategy Exposure (left graph)
Geographic Exposure (right graph)
17
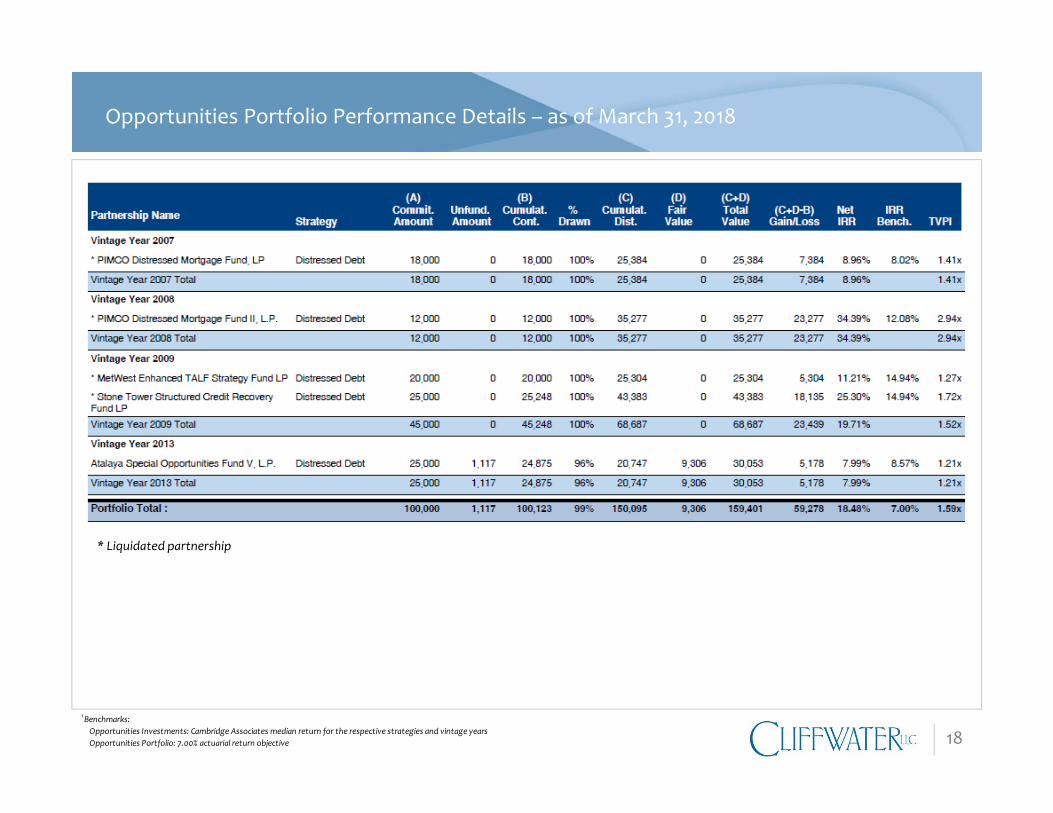
Opportunities Portfolio – as of March 31, 2018
The Opportunities portfolio’s net IRR since inception is 18.48%– The long‐term benchmark is SCERS’ 7.00% total portfolio actuarial return objective– Also tracking the portfolio’s 3 year IRR versus an intermediate‐term benchmark
• 7.65% portfolio IRR v 5.06% IRR for the SCERS’ total portfolio policy weighted benchmark over the last 3 years
– The portfolio only includes legacy distressed debt funds (fully liquidated) and one post‐2009 distressed fund (Atalaya V)• Previously‐reported real estate funds are included within Real Estate• This is consistent with SCERS’ 2017 asset class structures
The legacy distressed funds performed very well, the current fund is performing at expectations– SCERS’ earlier vintage distressed debt funds are liquidated and have distributed significant capital back to SCERS
• Stone Tower, MetWest TALF, and PIMCO have distributed $129.3 million
– Atalaya SOF V, a vintage 2013 fund, has produced a 7.99% net IRR since inceptionChanges during the quarter– SCERS made no new commitments categorized as Opportunities funds during Q1 2018– No new contributions, $0.5 million in distributions– Portfolio IRR decreased 0.05%, total portfolio gain decreased slightly
As mentioned, the Opportunities portfolio only includes certain distressed debt funds– SCERS has additional distressed debt investments within its Private Equity portfolio– Categorizations were made at the time of each investment
18
Opportunities Portfolio Performance Details – as of March 31, 2018
* Liquidated partnership
1Benchmarks:Opportunities Investments: Cambridge Associates median return for the respective strategies and vintage yearsOpportunities Portfolio: 7.00% actuarial return objective
19
Cliffwater Disclosures
Important Notice
This presentation was prepared exclusively for information and discussion purposes, and is not meant to be, nor shall it beconstrued as, an attempt to define all information that may be material to you. All information including opinions or factsexpressed herein are current as of the date appearing in this presentation and is subject to change without notice. All third partyinformation has been obtained from sources believed to be reliable. No representation, warranty, or undertaking, express orimplied, is given as to the accuracy or completeness of the information or opinions contained in this presentation. Pastperformance does not guarantee future performance.
This presentation may include sample or pro forma performance. Such information is presented for illustrative purposes only andis based on various assumptions, not all of which are described herein. Such assumptions, data, or projections may have a materialimpact on the returns shown.
References to market or composite indices (such as the S&P 500), benchmarks or other measures of relative market performanceover a specified period of time (each, an “index”) are provided for information only. Reference to an index does not imply that aportfolio will achieve returns, volatility or other results similar to the index. The composition of an index may not reflect themanner in which a portfolio is constructed in relation to expected or achieved returns, portfolio guidelines, restrictions, sectors,correlations, concentrations, volatility or tracking error targets, all of which are subject to change over time.
– Hedge Fund Research, Inc. (“HFR”) is the source and owner of the HFR data contained or reflected in this report and alltrademarks related thereto.
– Frank Russell Company (“FRC”) is the source and owner of the Russell Index data contained or reflected in this material andall trademarks and copyrights related thereto. The Russell Index data may contain confidential information andunauthorized use, disclosure, copying, dissemination or redistribution is strictly prohibited.
– Thomson Financial Inc. is the owner and/or licensor of the Cambridge Associates LLC data contained or reflected in thismaterial.