Embed Size (px)
Citation preview

Board of Regents Report for May 2014
Texas Tech University Endowment
31st May 2014
Contents
Asset Class Allocation: Actual vs. Target
Asset Class Performance: Actual vs. Policy
Long Term Risk/Return of Endowment vs. 60/40 Portfolio and Policy Returns
Performance Best/Worst
Asset Class & Sub-Asset Class Twelve Month Performance
Risk Profile
Performance Heat Maps - Three Month Performance
Overview- Equity- Debt- Liquid Real Assets- Cash & Alpha Pool- Private Equity- Private Credit- Private Real Assets
Appendix I – Sub-Asset Detail
Appendix II – Private Market Reports
Appendix III – Glossary
Page
3
4
6
7
8
9
10
11121314151617
18
20
22

Target Allocation
Actual Allocation
Asset Class Allocation: Actual vs. Target
31st May 2014
35.00%
25.00%
10.00%
30.00% 8%
8%
6%
5%
8%
5%
5%15%
10%
10%
10%
10%
34.57%
20.28%2.71%
16.80%
23.10%
2.53%
7.22%
7.95%
8.37%
7.13%
3.91%
8.25%
5.26%6.77%2.71%
7.42%
9.38%
8.01%
6.91%
8.19%2.53%
Asset Class Sub-Asset ClassActual $ Allocation
Total % Allocation
Target % Allocation Target Range
Physical Synthetic Total
Equity
US Equity 36,817,779 36,508,500 73,326,279 7.22% 8%
Global Equity 80,693,327 80,693,327 7.95% 8%
Non US Developed Equity 84,991,237 84,991,237 8.37% 6%
Non US Emerging Markets Equity 72,371,806 72,371,806 7.13% 5%
Alternative Equity 39,684,062 39,684,062 3.91% 8%
Sub-Total 314,558,211 36,508,500 351,066,711 34.57% 35% 30% - 40%
Debt
Sovereign/Investment Grade Bonds 33,602,262 50,202,422 83,804,684 8.25% 5%
Credit 53,418,359 53,418,359 5.26% 15%
Emerging Markets Debt 68,723,482 68,723,482 6.77% 5%
Sub-Total 155,744,103 50,202,422 205,946,525 20.28% 25% 20% - 30%
Liquid Real Assets 27,564,880 0 27,564,880 2.71% 10% 5% - 15%
Cash & Alpha Pool
Cash 92,678,216 -17,342,184 75,336,031 7.42%
Alpha Pool 164,612,063 -69,368,738 95,243,326 9.38%
Sub-Total 257,290,279 -86,710,922 170,579,357 16.80% 0% 0% - 10%
Private Investments
Private Equity 81,312,429 81,312,429 8.01% 10%
Private Credit 70,120,115 70,120,115 6.91% 10%
Private Real Assets 83,176,882 83,176,882 8.19% 10%
Sub-Total 234,609,426 0 234,609,426 23.10% 30% 10% - 55%
Liquidating 25,713,059 0 25,713,059 2.53% 0%
Total 1,015,479,958 0 1,015,479,958 100% 100%
3

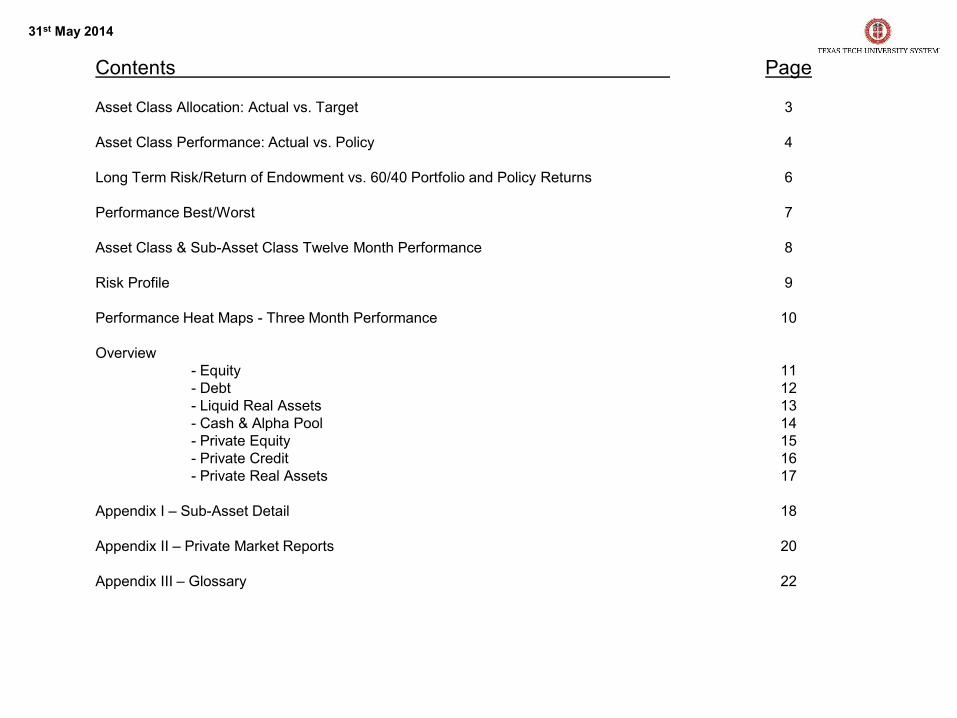
Asset Class Performance: Actual vs. Policy
431st May 2014
One Month Performance
QTD Performance
0.00%
0.41%
0.84%
0.99%
1.21%
1.53%
2.00%
2.60%
3.66%
4.02%
-1.00%
0.00%
0.00%
0.00%
0.00%
-2% -1% 0% 1% 2% 3% 4% 5%
Liquid Real Assets
Private Equity
Private Real Assets
Cash
Private Credit
Credit
Liquidating
Alpha Pool
US Equity
Sov/IG Bonds
Alternative Equity
Non US Dev Equity
Non US EM Equity
EM Debt
Global Equity
0.00%
0.09%
0.52%
0.88%
1.70%
2.37%
2.90%
3.32%
5.12%
-1.76%
-1.57%
-1.39%
-0.21%
-0.36%
0.00%
-3% -2% -1% 0% 1% 2% 3% 4% 5% 6%
Alternative Equity
Credit
Liquidating
US Equity
Cash
Private Equity
Private Real Assets
Private Credit
Liquid Real Assets
Alpha Pool
Sov/IG Bonds
Non US Dev Eq
Global Equity
Non US EM Equity
EM Debt
Asset Class Sub-Asset Class
Month QTD
Physical Return
Synthetic Overlay
Alpha Pool + Cash
Total Return Policy Physical
ReturnSynthetic Overlay
Alpha Pool + Cash
Total Return Policy
Equity
US Equity 0.20% 2.17% 0.67% 0.99% -0.99% 2.17% 0.67% -0.21%
Global Equity 4.02% 4.02% 2.90% 2.90%
Non US Developed Equity 2.00% 2.00% 2.37% 2.37%
Non US Emerging Markets Equity 2.60% 2.60% 3.32% 3.32%
Alternative Equity 1.53% 1.53% -1.76% -1.76%
Sub-Total 2.08% 2.17% 0.67% 2.14% 2.21% 1.48% 2.17% 0.67% 1.55% 3.24%
Debt
Sovereign/Investment Grade Bonds 1.25% 0.52% 0.67% 1.21% 2.00% 0.80% 0.71% 1.70%
Credit 0.00% 0.00% -1.57% -1.57%
Emerging Markets Debt 3.66% 3.66% 5.12% 5.12%
Sub-Total 2.31% 0.52% 0.67% 1.99% 1.14% 2.91% 0.80% 0.71% 2.50% 1.99%
Liquid Real Assets -1.00% -1.00% 0.68% 0.52% 0.52% 1.35%
Cash & Alpha Pool
Cash 0.00% 0.00% 0.00% 0.00%
Alpha Pool 0.84% 0.84% 0.88% 0.88%
Sub-Total 0.67% 0.67% 0.00% 0.69% 0.69% 0.01%
Private Investments
Private Equity 0.00% 0.00% 0.00% 0.00%
Private Credit 0.00% 0.00% 0.09% 0.09%
Private Real Assets 0.00% 0.00% 0.00% 0.00%
Sub-Total 0.00% 0.00% 0.00% 0.03% 0.03% 0.00%
Liquidating 0.41% 0.41% -1.39% -1.39%
Total 1.20% 1.21% 0.67% 1.26% 1.13% 1.02% 1.49% 0.71% 1.10% 1.73%

Asset Class Performance: Actual vs. Policy (cont.)
531st May 2014
Calendar YTD Performance
One Year Performance
-2.14%
0.00%
0.60%
1.49%
1.66%
1.94%
2.73%
3.26%
3.36%
3.36%
4.40%
5.50%
9.12%
-4.83%
-4.58%
-6% -4% -2% 0% 2% 4% 6% 8% 10%
Alternative Equity
Liquidating
Credit
Cash
Private Equity
Private Credit
US Equity
Private Real Assets
Sov/IG Bonds
Non US Dev Equity
Global Equity
Alpha Pool
Liquid Real Assets
Non US EM Equity
EM Debt
0.00%
0.61%
0.98%
4.28%
4.49%
5.49%
5.93%
6.48%
7.24%
10.43%
15.30%
16.98%
18.92%
21.51%
-0.35%
-5% 0% 5% 10% 15% 20% 25%
Liquidating
Cash
Liquid Real Assets
Sov/IG Bonds
Alternative Equity
Non US EM Equity
Private Real Assets
Credit
EM Debt
Alpha Pool
Private Equity
Private Credit
US Equity
Non US Dev Equity
Global Equity
Asset Class Sub-Asset Class
Calendar YTD 1 Year
Physical Return
Synthetic Overlay
Alpha Pool + Cash
Total Return Policy Physical
ReturnSynthetic Overlay
Alpha Pool + Cash
Total Return Policy
Equity
US Equity 0.86% 2.17% 0.67% 1.66% 16.06% 2.17% 0.67% 16.98%
Global Equity 3.36% 3.36% 21.51% 21.51%
Non US Developed Equity 3.26% 3.26% 18.92% 18.92%
Non US Emerging Markets Equity 5.50% 5.50% 4.49% 4.49%
Alternative Equity -4.83% -4.83% 4.28% 4.28%
Sub-Total 2.28% 2.17% 0.67% 2.34% 4.49% 14.70% 2.17% 0.67% 14.77% 17.75%
Debt
Sovereign/Investment Grade Bonds 3.03% 0.80% 0.71% 2.73% 1.27% 0.80% 0.71% 0.98%
Credit -2.14% -2.14% 5.93% 5.93%
Emerging Markets Debt 9.12% 9.12% 6.48% 6.48%
Sub-Total 5.31% 0.80% 0.71% 4.88% 3.87% 5.59% 0.80% 0.71% 5.16% 2.71%
Liquid Real Assets 4.40% 4.40% 3.78% 0.61% 0.61% 6.28%
Cash & Alpha Pool
Cash 0.00% 0.00% 0.00% 0.00%
Alpha Pool 3.36% 3.36% 7.24% 7.24%
Sub-Total 2.07% 2.07% 0.02% 4.96% 4.96% 0.05%
Private Investments
Private Equity 0.60% 0.60% 10.43% 10.43%
Private Credit 1.49% 1.49% 15.30% 15.30%
Private Real Assets 1.94% 1.94% 5.49% 5.49%
Sub-Total 1.32% 1.32% 6.66% 9.78% 9.78% 20.27%
Liquidating -4.58% -4.58% -0.35% -0.35%
Total 1.85% 1.49% 0.71% 1.94% 4.84% 9.57% 1.49% 0.71% 9.66% 14.11%

Long Term Risk/Return of Endowment vs. 60/40 Portfolio & Policy Returns
1 Year 2 Years
3 Years 5 Years
Commentary
• The Texas Tech portfolio generates a higher risk adjusted return than a 60/40 portfolio.
• The Texas Tech portfolio is less volatile than a 60/40 portfolio and policy portfolio over a 5 year horizon.
• The 60/40 portfolio has the most volatile returns over all periods.
6
FYTD
31st May 2014
Return: 13.27%SD: 4.28%
Return: 12.65%SD: 5.41%
Return: 10.92%SD: 4.94%
0%
2%
4%
6%
8%
10%
12%
14%
0.00% 1.00% 2.00% 3.00% 4.00% 5.00% 6.00%
FYTD
Ret
urn
Annualized Standard Deviation
Policy 60/40 Texas Tech
Return: 14.11%SD: 4.66%
Return: 11.63%SD: 6.62%Return: 9.66%
SD: 5.59%
0%
2%
4%
6%
8%
10%
12%
14%
16%
0.00% 1.00% 2.00% 3.00% 4.00% 5.00% 6.00% 7.00%
1 Ye
ar R
etur
n
Annualized Standard Deviation
Policy 60/40 Texas TechReturn: 14.84%
SD: 4.35%
Return: 13.69%SD: 5.40%
Return: 11.93%SD: 4.60%
0%
2%
4%
6%
8%
10%
12%
14%
16%
0.00% 1.00% 2.00% 3.00% 4.00% 5.00% 6.00%
2 Ye
ar A
nnua
lized
Ret
urn
Annualized Standard Deviation
Policy 60/40 Texas Tech
Return: 8.53%SD: 6.23%
Return: 7.41%SD: 8.39%Return: 7.03%
SD: 6.51%
0%1%2%3%4%5%6%7%8%9%
0.00% 1.00% 2.00% 3.00% 4.00% 5.00% 6.00% 7.00% 8.00% 9.00%
3 Ye
ar A
nnua
lized
Ret
urn
Annualized Standard Deviation
Policy 60/40 Texas Tech
Return: 11.58%SD: 6.63%
Return: 10.81%SD: 8.84%
Return: 9.84%SD: 6.50%
0%
2%
4%
6%
8%
10%
12%
14%
0.00% 1.00% 2.00% 3.00% 4.00% 5.00% 6.00% 7.00% 8.00% 9.00% 10.00%
5 Ye
ar A
nnua
lized
Ret
urn
Annualized Standard Deviation
Policy 60/40 Texas Tech

• Sub-Asset Class : Worst Performing• Sub-Asset Class : Best Performing
Performance – Best/Worst (Absolute)
7
The total NAV as of May 31st 2014 is $1,015,479,958
31st May 2014
• Sub Asset Class : Worst Performing• Sub Asset Class : Best Performing
One Month Performance
Trailing Three Month Performance
Sub-Asset Class Asset ClassMay Performance$ %
Global Equity Equity 3,115,095 4.02%
Emerging Markets Debt Debt 2,427,448 3.66%
Non US EM Equity Equity 1,836,266 2.60%
Sub-Asset Class Asset ClassMay Performance$ %
Liquid Real Assets Liquid Real Assets (279,438) -1.00%
Credit Debt 0 0.00%
Alpha Pool Cash & Alpha Pool 1,368,118 0.84%
Sub-Asset Class Asset ClassPerformance
$ %Non US EM Equity Equity 4,778,316 7.06%
Emerging Markets Debt Debt 3,973,930 6.54%
Non US Developed Equity Equity 1,535,361 1.33%
Sub-Asset Class Asset ClassPerformance
$ %Alternative Equity Equity (3,239,037) -7.18%
Credit Debt (326,669) -1.38%
Global Equity Equity (580,073) -0.71%
Performance – Best/Worst (Relative)
One Month Performance
• Sub-Asset Class : Best Performing
Sub-Asset Class Asset ClassMay Relative Return
%
Global Equity Equity 1.81%
Emerging Markets Debt Debt 0.46%
Non US Developed Equity Equity 0.25%
• Sub-Asset Class : Worst Performing
Sub-Asset Class Asset ClassMay Relative Return
%
Liquid Real Assets Liquid Real Assets -1.69%
US Equity Equity -1.36%
Credit Debt -1.14%
Trailing Three Month Performance
• Sub Asset Class : Best Performing • Sub Asset Class : Worst Performing
Sub-Asset Class Asset ClassRelative Return
%
Alpha Pool Cash & Alpha Pool 1.49%
Emerging Markets Debt Debt 0.41%
Non US Emerging Markets Equity Equity -0.05%
Sub-Asset Class Asset Class Relative Return
%
Alternative Equity Equity -10.93%
Global Equity Equity -4.46%
US Equity Equity -4.33%

Commentary• May was a largely positive month for equity and fixed income markets. Economic data for May met or exceeded expectations, and perceived geopolitical risk in Ukraine and Thailand seemed to fade.• Central banks were also at the forefront of positive sentiment in markets, as the European Central Bank cut the official policy rate to 0.15%, and announced a negative deposit rate of -0.1%.• Emerging markets outperformed developed markets.• Unemployment in the US dropped to 6.3%, with 217k jobs added in May. UK unemployment also decreased, with the jobless rate the lowest since 2008.• European Union Quarter 1 growth disappointed at 0.2% Quarter on Quarter, and Purchasing Managers Index declined but stayed above 50.• The International Monetary Fund forecasted global growth of 3.6% for 2014, up from 3% in 2013.
Asset Class & Sub Asset Class Twelve Month Performance
831st May 2014
-10%
-5%
0%
5%
10%
15%
20%
05/31/2013 06/30/2013 07/31/2013 08/31/2013 09/30/2013 10/31/2013 11/30/2013 12/31/2013 01/31/2014 02/28/2014 03/31/2014 04/30/2014 05/31/2014
12 Month Compounded Performance by Asset Class
Equity
Debt
Liquid Real Assets
Cash & Alpha Pool
Private Investments
Liquidating
Source – JP Morgan
-10%
-5%
0%
5%
10%
15%
20%
25%
05/31/2013 06/30/2013 07/31/2013 08/31/2013 09/30/2013 10/31/2013 11/30/2013 12/31/2013 01/31/2014 02/28/2014 03/31/2014 04/30/2014 05/31/2014
12 Month Compounded Performance by Sub-Asset Class (top and bottom performers)
Alternative Equity
Global Equity
Sov/IG Bonds
Liquid Real Assets
Liquidating
Non US Dev Equity
Private Credit
US Equity

• The Texas Tech portfolio has a 5% chance of losing $42 million (or more) in a month with a 1% chance of losing $63 million (or more) in a month based on observed portfolio volatility.
• Non US Emerging Markets Equity, Private Real Assets and Emerging Market Debt have generated the lowest risk adjusted returns.
• The Texas Tech portfolio exhibits less value at risk than the policy portfolio and a 60/40 portfolio.
The below graph shows how each risk factor in the sample set impacts the various sub-asset classes.
• Sub Asset Classes with large Value at Risk:
• Sub Asset Classes with small Value at Risk:
Risk Profile (VaR) Risk Profile
• Alpha Pool, Private Equity and Private Credit have provided the highest risk adjusted returns.
• Non US Emerging Market Equity, Private Real Assets and Emerging Market Debt have generated the lowest risk adjusted returns.
Factor Analysis
• The model analyses historical returns of the portfolio against the returns and volatility of key indicators:
• Credit is benchmarked against the High Yield North American CDX Index.• Risk-Free is benchmarked against the US 10 Year Treasury Bond.• Volatility is benchmarked against the VIX Index.• Equity Markets is benchmarked against the MSCI AC World IMI (Gross).
• The model shows that performance and volatility of both the Texas Tech portfolio and a 60/40 portfolio are well explained by the 4 factor model.
• The Texas Tech portfolio exhibits a lower correlation to the Equities and Credit markets than the 60/40 portfolio and a higher correlation to the risk free index.
• The model shows that Investment Grade Bonds and Private Real Assets look like a good hedge on the Equity markets.
9
Factor Analysis is calculated using the monthly return over the period January 2009 – current month.
31st May 2014
Annualized Standard Deviation
12 M
onth
Ret
urn
12 Month Return vs Standard DeviationValue at Risk – One Month – 95% Confidence
Portfolio Credit Risk Free Volatility Equity R2
Texas Tech 0.79 0.31 -0.72 0.93 0.84
60/40 0.81 0.18 -0.69 0.99 0.84
Policy 0.76 0.21 -0.65 0.95 0.80
Sub-Asset Class5 % chance of
losing$
Non US Emerging Markets Equity 6,477,070
Non US Developed Equity 5,978,266
Alternative Equity 5,095,800
-1.00
-0.80
-0.60
-0.40
-0.20
0.00
0.20
0.40
0.60
0.80
1.00
1.20
Credit Risk Free Volatility Equity
Sub-Asset Class5 % chance of
losing$
Sovereign/Investment Grade Bonds 1,191,220
Private Equity 1,565,739
Credit 1,687,277
US Equity
Global Equity
Global Equity
Global Equity
Non US Dev Eq
Non US EM Eq
Alternative Equity
Sov/IG Bonds
Sov/IG Bonds
EM DebtCredit
Liquid Real Assets
Alpha Pool Priv. Eq
Priv. CreditPriv. Real
-5
0
5
10
15
20
25
30
35
40
45
50
Texas Tech Policy 60/40
Mill
ions
Policy
Liquidating
US Eq
Global Eq
Non US Dev Eq
Non US EM Eq
Alt Eq
Sov/IG Bonds
Credit
EM Debt
Priv. Eq
Priv. Credit
Priv. Real
Liq. RealCash
Alpha PoolTexas Tech
60/40
-5%
0%
5%
10%
15%
20%
25%
0.00% 2.00% 4.00% 6.00% 8.00% 10.00% 12.00% 14.00%

Three Month Performance
1031st May 2014
-5.00% -2.00% -1.00% -0.50% 0.00% 0.50% 1.00% 2.00% 5.00%
Alternative Equity
Emerging Markets Debt
Liquid Real Assets
Alpha Pool Private Real Assets
Liquidating
Non US EM Equity
Credit
Cash
Private Credit
Non US Developed Equity
Sov/IG Bonds
Private Equity
Golbal Equity
US Equity
0
50
100
150
200
250
300
350
400
Equity Debt Liquid Real Assets Cash & Alpha Pool Private Investments Liquidating
Mill
ions

Equity (Total NAV: $351,066,711)
Exposure (Sub Asset Class)
12 M
onth
Ret
urn
Commentary
• Globally, equities again produced positive returns for the month of May.
• Emerging Market equities outperformed developed markets. Latin America lagged in the emerging markets in the terms of performance.
• Japanese and Hong Kong markets led developed markets in terms of performance.
Overview and Risk Profile by Asset Class
Risk vs. Return (Sub Assets)
1131st May 2014
2010 2011 2012 2013 YTD MayMSCI Asia ex
JapanUS S&P 500 Japan TOPIX Japan TOPIX MSCI Europe ex
UKMSCI Asia ex
Japan15.60% 2.10% 20.90% 54.40% 7.90% 3.40%
US S&P 500 UK FTSE 100 MSCI Europe ex UK
US S&P 500 US S&P 500 Japan TOPIX
15.10% -2.20% 20.00% 32.40% 5.00% 3.40%MSCI EM MSCI Europe ex
UKMSCI Asia ex
JapanMSCI Europe ex
UKUK FTSE 100 MSCI EM
14.40% -12.10% 19.70% 24.20% 3.20% 2.90%UK FTSE 100 MSCI EM MSCI EM UK FTSE 100 MSCI Asia ex
JapanMSCI Europe ex
UK12.60% -12.50% 17.40% 18.70% 2.80% 2.90%
MSCI Europe ex UK
MSCI Asia ex Japan
US S&P 500 MSCI Asia ex Japan
MSCI EM US S&P 500
5.10% -14.60% 16.00% 6.20% 2.30% 2.30%Japan TOPIX Japan TOPIX UK FTSE 100 MSCI EM Japan TOPIX UK FTSE 100
1.00% -17.00% 10.00% 3.80% -6.80% 1.40%
Source – JP Morgan
Annualized Standard Deviation
20.89%73.3
22.99%80.7
24.21%85.0
20.61%72.4
11.30%39.7
0
10
20
30
40
50
60
70
80
90
US Equity Global Equity Non US DevelopedEquity
Non US EmergingMarkets Equity
Alternative Equity
Mill
ions
US Eq
Global Eq
Non US Dev Eq
Non US EM EqAlt Eq
Policy
Texas Tech
0%
5%
10%
15%
20%
25%
0.00% 2.00% 4.00% 6.00% 8.00% 10.00% 12.00% 14.00%
One Year
US EqGlobal Eq
Alt Eq
Non US Dev Eq
Non US EM Eq
Policy
Texas Tech
-8%
-6%
-4%
-2%
0%
2%
4%
6%
8%
0.00% 2.00% 4.00% 6.00% 8.00% 10.00% 12.00%
3M
onth
Ret
urn
Annualized Standard Deviation
Three Months
*Performance is calculated using time weighted Cash on Cash returns. This is an industry standard and allows direct comparison between manager returns and policy returns.

Debt (Total NAV: $205,946,525)
Exposure (Sub Asset Class)
12 M
onth
Ret
urn
Annualized Standard Deviation
CommentaryGlobal bond yields fell in May• In May, Most major developed markets saw a decrease in 10 year government bond yields. • US 10yr yield declined 17bps to 2.48%.
Investment Grade Bonds posted strong performance in May.• In May, Investment Grade securities outperformed Government debt.• High Yield led Government bonds, but lagged Investment Grade• Emerging Market debt performance was particularly strong in May.
According to Guggenheim, spreads should not widen for any another two years based on the below analysis:
Overview and Risk Profile by Asset Class
Three Months One Year
1231st May 2014
Source –CS, Guggenheim
40.69%83.8
25.94%53.4
33.37%68.7
0
10
20
30
40
50
60
70
80
90
Sovereign/Investment Grade Bonds Credit Emerging Markets Debt
Mill
ions
Risk vs. Return (Sub Assets)
Sov/IG Bonds
CreditEM Debt
Policy
Texas Tech
0%
1%
2%
3%
4%
5%
6%
7%
0.00% 1.00% 2.00% 3.00% 4.00% 5.00% 6.00% 7.00% 8.00% 9.00% 10.00%
Credit
Sov/IG Bonds
EM Debt
Policy
Texas Tech
-2%
-1%
0%
1%
2%
3%
4%
5%
6%
7%
0.00% 0.50% 1.00% 1.50% 2.00% 2.50% 3.00% 3.50% 4.00%
Annualized Standard Deviation
3M
onth
Ret
urn
*Performance is calculated using time weighted Cash on Cash returns. This is an industry standard and allows direct comparison between manager returns and policy returns.

Liquid Real Assets(Total NAV: $27,564,880)
Exposure (Strategy)
Risk vs. Return (Strategy)
12 M
onth
Ret
urn
Commentary
• Commodities posted a performance decline of 2.9% in May, narrowing the year to date advantage held over equities.
• Natural Gas prices fell 5.7% after gaining 10% in April.
• Precious metals were performance was dragged down by gold and silver, down 3.9 and 2.6% respectively.
• Infrastructure stocks gained 3.2%, as measured by the Dow Jones Brookfield Infrastructure Index.
• Rising natural liquid gas prices and demand during the unusually cold winter led to good first quarter earnings for pipeline companies.
• The precious metals sector (-3.6%) was pulled lower by gold and silver, down 3.9% and 2.6%, respectively. Investors moved away from these safe-haven assets amid more-positive leading economic indicators.
• Grains (-8.0%) mostly declined as farmers made measurable planting progress in the U.S. and as winter wheat crop conditions stabilized.
Overview and Risk Profile by Asset Class
Three Months One Year
1331st May 2014
Source – Cohen & Steers
Annualized Standard DeviationAnnualized Standard Deviation
3M
onth
Ret
urn
Long Commodities
Policy
Texas Tech0%
1%
2%
3%
4%
5%
6%
7%
0.00% 1.00% 2.00% 3.00% 4.00% 5.00% 6.00% 7.00% 8.00% 9.00% 10.00%
Long Commodities
Policy
Texas Tech
0%
1%
2%
3%
0.00% 0.50% 1.00% 1.50% 2.00% 2.50% 3.00% 3.50% 4.00%
100%27.6
0
5
10
15
20
25
30
Long Commodities
Mill
ions
*Performance is calculated using time weighted Cash on Cash returns. This is an industry standard and allows direct comparison between manager returns and policy returns.

Cash & Alpha Pool (Total NAV: $170,579,357)
Exposure (Strategy)
Risk vs. Return (Strategy)
12 M
onth
Ret
urn
Annualized Standard Deviation
Commentary
• A recent article by Northern Trusts’ Chief Investment Strategist includes a study that shows little relationship between market volatility and the subsequent returns of the equity market at a time when Investor uncertainty is at a multi year low. The article goes on to predict that the key drivers of asset class returns during the next year will be global growth and inflation.
Overview and Risk Profile by Asset Class
Three Months One Year
1431st May 2014
Source –Northern Trust
Annualized Standard Deviation
3M
onth
Ret
urn
12.17%11.6
48.22%45.9
39.61%37.7
0
5
10
15
20
25
30
35
40
45
50
Event-Driven Multi-Strategy Credit
Mill
ions
Multi-Strategy
Event-Driven
Credit
Policy
Texas Tech
-0.5%
0.0%
0.5%
1.0%
1.5%
2.0%
2.5%
0.00% 0.50% 1.00% 1.50% 2.00% 2.50% 3.00%
Event-Driven
Multi-Strategy
Credit
Policy
Texas Tech
0%
1%
2%
3%
4%
5%
6%
7%
8%
9%
10%
0.00% 1.00% 2.00% 3.00% 4.00% 5.00% 6.00% 7.00%
*Performance is calculated using time weighted Cash on Cash returns. This is an industry standard and allows direct comparison between manager returns and policy returns.

Private Equity (Total NAV: $81,312,429)
Exposure (Strategy)
Risk vs. Return (Strategy)
12 M
onth
Ret
urn
Annualized Standard Deviation
Commentary
• A recent article by the Wall Street Journal shows that Private Equity dry powder reached a record high in 2013. Dry powder is defined as the amount of money raised by private equity firms but not yet invested.
• According to the article, The economic recovery is making it harder for PE firms to put money to work and achieving a high exit multiple.
Overview and Risk Profile by Asset Class
Three Months One Year
1531st May 2014
Source – Wall Street Journal
Fund Type 2004 2005 2006 2007 2008 2009 2010 2011 2012 2013
Buyout 176.6 258.5 379.9 439.3 482.9 482.0 424.0 389.4 354.4 397.2
Distressed 18.5 20.4 36.7 61.0 55.5 55.9 68.1 72.1 64.5 74.3
Growth 10.7 16.4 25.5 36.7 45.9 47.5 55.2 69.7 69.8 75.9
Mezzanine 18.2 21.5 33.6 34.2 42.3 40.5 38.6 45.8 38.6 42.6
Real Estate 55.1 98.1 132.6 166.9 171.4 180.5 154.3 166.9 156.4 185.4
Venture Capital 91.4 93.0 103.0 123.6 121.3 114.8 109.5 114.5 110.9 114.4
Other 34.7 51.1 86.9 139.3 148.1 139.9 137.8 148.0 148.6 183.8
Total 405.2 559.0 798.2 1,001.0 1,067.4 1,061.1 987.5 1,006.4 943.2 1,073.6
Annualized Standard Deviation
3M
onth
Ret
urn
40.85%33.2
12.03%9.8
15.97%13.0
31.15%25.3
0
5
10
15
20
25
30
35
Buyout Growth Equity Opportunistic Secondaries
Mill
ions
Buyout
Growth Equity
Opportunistic
Secondaries
Policy
Texas Tech
0%
1%
2%
3%
4%
5%
6%
7%
8%
0.00% 2.00% 4.00% 6.00% 8.00% 10.00% 12.00% 14.00%
Buyout
Growth Equity
Opportunistic
Secondaries
Policy
Texas Tech
0%
5%
10%
15%
20%
25%
0.00% 1.00% 2.00% 3.00% 4.00% 5.00% 6.00% 7.00% 8.00% 9.00%
*Performance is calculated using time weighted Cash on Cash returns. This is an industry standard and allows direct comparison between manager returns and policy returns. IRR returns can be seen in appendix 2.

Private Credit (Total NAV: $70,120,115)
Exposure (Strategy)
Risk vs. Return (Strategy)
12 M
onth
Ret
urn
Annualized Standard Deviation
Commentary
• Oaktree were said to cut the $3bn funding goal on new fund - Oaktree Principal Fund - by around 40%. The anticipated life of the fund is also cut from five years to three years. The decrease in funding target and fund duration is said to be a result of a paucity of attractive deals amid the economic recovery.
• Liquidity requirements are the most popular motivation for selling private commitments in the secondary market, according to a recent Preqin survey.
Overview and Risk Profile by Asset Class
Three Months One Year
1631st May 2014
Source – Preqin, Bloomberg
0 10 20 30 40 50 60
Change in strategy(exit non-core assets)
Exit poorperforming funds
PortfolioRebalancing
LiquidityRequirements
Proportion of Respondents
2014
2013
2011
Annualized Standard Deviation
3M
onth
Ret
urn
67.46%47.3
19.02%13.3
13.53%9.5
0
5
10
15
20
25
30
35
40
45
50
Distressed Loans Opportunistic
Mill
ions
Distressed
Loans
Opportunistic
Policy
Texas Tech
0%
1%
2%
3%
4%
5%
6%
7%
8%
0.00% 2.00% 4.00% 6.00% 8.00% 10.00% 12.00% 14.00%
Distressed
Loans
Opportunistic
Policy
Texas Tech
0%
5%
10%
15%
20%
25%
0.00% 1.00% 2.00% 3.00% 4.00% 5.00% 6.00% 7.00% 8.00% 9.00% 10.00%
*Performance is calculated using time weighted Cash on Cash returns. This is an industry standard and allows direct comparison between manager returns and policy returns. IRR returns can be seen in appendix 2.

Private Real Assets (Total NAV: $83,176,882)
Exposure (Strategy)
Risk vs. Return (Strategy)
12 M
onth
Ret
urn
Commentary
• The Pension Real Estate Association on Monday released the latest results of its Consensus Forecast Survey. The average expected total return for the NCREIF Property index in 2014 is 9.5%, up 80bps from the Q1 survey.
Overview and Risk Profile by Asset Class
Three Months One Year
1731st May 2014
0.00%
2.50%
5.00%
7.50%
10.00%
12.50%
National, allproperty types
Office Retail Industrial Apartment
Tota
l Ret
urn 2014
2015
2016
Source – Pension Real Estate Association
Annualized Standard DeviationAnnualized Standard Deviation
3M
onth
Ret
urn
69.66%57.9
30.34%25.2
0
10
20
30
40
50
60
Energy Real Estate
Mill
ions
Energy Real Estate
Policy
Texas Tech
0%
1%
2%
3%
4%
5%
6%
7%
8%
0.00% 2.00% 4.00% 6.00% 8.00% 10.00% 12.00% 14.00%
Energy
Real Estate
Policy
Texas Tech
0%
5%
10%
15%
20%
25%
8.40% 8.60% 8.80% 9.00% 9.20% 9.40% 9.60% 9.80% 10.00%
*Performance is calculated using time weighted Cash on Cash returns. This is an industry standard and allows direct comparison between manager returns and policy returns. IRR returns can be seen in appendix 2.

Appendix 1 – Sub-Asset Detail
1831st May 2014
*Cash is adjusted for synthetic exposures.
Fund Current Exposure MTD Perf. 3 Mo. Perf. Calendar YTD Fiscal YTD Nacubo YTD 1 Year Perf. 3 Year Perf. 5 Year Perf.TOTAL 1,180,092,022 1.26% 1.02% 1.94% 10.92% 11.66% 9.66% 7.03% 9.84%
Policy 1.13% 3.67% 4.84% 13.27% 14.69% 14.11% 8.53% 11.58%Equity 351,066,711 2.14% 0.55% 2.34% 15.53% 17.32% 14.77% 10.01% 13.12%
US Equity 73,326,279 0.99% -0.36% 1.66% 15.68% 18.49% 16.98% 9.78% 13.71%Benchmark: S&P 500 Total Return 2.35% 3.97% 4.97% 19.64% 22.09% 20.45% 15.15% 18.40%
Global Equity 80,693,327 4.02% -0.71% 3.36% 20.39% 23.48% 21.51% 18.49% 10.71%Benchmark: MSCI ACWI 2.21% 3.75% 4.49% 18.08% 21.24% 17.75% 9.58% 14.32%
Non US Developed Equity 84,991,237 2.00% 1.33% 3.26% 18.73% 22.61% 18.92% 8.83% 12.09%Benchmark: MSCI EAFE 1.76% 2.73% 4.11% 18.26% 22.87% 18.54% 7.79% 11.92%
Non US Emerging Markets Equity 72,371,806 2.60% 7.06% 5.50% 13.43% 11.06% 4.49% 0.74% 7.46%Benchmark: MSCI EMF 3.51% 7.11% 3.52% 12.34% 11.67% 4.61% -1.44% 8.71%
Alternative Equity 39,684,062 1.53% -7.18% -4.83% 4.05% 3.52% 4.28% 26.12% 16.29%Benchmark: MSCI ACWI 2.21% 3.75% 4.49% 18.08% 21.24% 17.75% 9.58% 14.32%
Debt 205,946,525 1.99% 3.04% 4.88% 8.91% 8.44% 5.16% 7.21% 9.97%Sovereign/Investment Grade Bonds 83,804,684 1.21% 1.10% 2.73% 4.56% 3.71% 0.98% 3.07% 4.28%
Benchmark: Barclays Global Aggregate 1.14% 1.82% 3.87% 4.71% 4.32% 2.71% 3.55% 4.96%Credit 53,418,359 0.00% -1.38% -2.14% 5.16% 7.08% 5.93% 9.76% 12.71%
Benchmark: Barclays Global Aggregate 1.14% 1.82% 3.87% 4.71% 4.32% 2.71% 3.55% 4.96%Emerging Markets Debt 68,723,482 3.66% 6.54% 9.12% 13.98% 12.17% 6.48% 8.49% 8.92%
Benchmark: JP Morgan EM Bond Index 3.19% 6.13% 8.45% 12.36% 10.39% 4.84% 7.82% 10.59%Liquid Real Assets 27,564,880 -1.00% 0.49% 4.40% -0.16% 5.66% 0.61% -8.10% 0.17%
Benchmark: CPI + 4% 0.68% 2.34% 3.78% 4.81% 5.67% 6.28% 5.87% 6.31%Cash & Alpha Pool 335,191,421 0.67% 0.88% 2.07% 5.49% 5.84% 4.96% 4.84% 4.76%
Cash* 170,579,357 0.67% 0.88% 0.00% 5.49% 5.84% 4.96% 4.84% 4.76%Benchmark: Citigroup 3 month Tbill 0.00% 0.00% 0.00% 0.00% 0.00% 0.00% 0.05% 0.07%
Alpha Pool 164,612,063 0.84% 1.14% 3.36% 8.00% 8.64% 7.24% 7.21% 8.67%Benchmark: HFRI FOF Index 1.16% -0.35% 0.87% 6.01% 6.32% 4.84% 2.44% 4.07%
Liquidating 25,713,059 0.41% -2.14% -4.58% 2.92% 2.03% -0.35% -1.39% 4.03%

Appendix 1 – Sub-Asset Detail
1931st May 2014
Fund Current Exposure 1 Year Performance 3 Year Performance 5 Year PerformancePrivate Investments 234,609,426 9.78% 9.68% 12.42%
Benchmark: Private Market Index (90% VE, 10% NCREIF) 20.27% 14.22% 9.77%Private Equity 81,312,429 10.43% 8.94% 10.20%Private Credit 70,120,115 15.30% 9.65% 16.63%Private Real Assets 83,176,882 5.49% 10.30% 11.46%
*Performance is calculated using time weighted Cash on Cash returns. This is an industry standard and allows direct comparison between manager returns and policy returns. IRR returns can be seen in appendix 2.

Appendix 2 - Private Markets Report (as of March 31st 2014) - Total Commitment
20
Private Equity, 150,500,000
Private Credit, 137,000,000
Private Real Assets, 149,500,000
Private Real Estate, 59,085,500
Private Equity, 40,154,124
Private Credit, 28,902,540
Private Real Assets, 35,224,657
Private Real Estate, 7,328,309
Total Commitment Total Unfunded
-
10
20
30
40
50
60
70
80
2004 2005 2006 2007 2008 2009 2010 2011 2012 2013
Mill
ions Opportunistic Real Estate
Value Add
Power
Energy (Midstream / Infrastructure)
Energy (Upstream)
Opportunistic Credit
Mezzanine
Distressed
Secondaries
Opportunistic Equity
Growth Equity
Buyout
Commitment by Vintage Year
Data Provided by Texas Tech University SystemReported Valuations through December 31, 2013 StatementsAdjusted Valuations included all cashflows through March 31, 2014
31st May 2014

Asset Class Strategy # of Funds Commitment Contributions Distributions % Drawn Reported Valuation Adjusted Valuation IRR MOCPrivate Equity Buyout 6 $61,500,000 $53,807,598 $57,578,016 87% $38,128,266 $34,733,936 14.73% 1.67
Growth Equity 2 $32,500,000 $8,591,598 $72,459 26% $8,660,621 $9,592,385 3.12% 1.04
Opportunistic 2 $35,000,000 $30,400,000 $14,248,734 87% $18,341,240 $18,850,510 2.16% 1.09
Secondaries 3 $27,500,000 $20,542,750 $10,345,015 75% $19,324,575 $18,604,021 9.42% 1.39
Total 13 $156,500,000 $113,341,946 $82,244,224 72% $84,454,702 $81,780,852 10.24% 1.41
Private Credit Distressed 10 $99,500,000 $89,147,883 $80,184,481 90% $46,327,934 $47,624,854 13.11% 1.43
Mezzanine 1 $10,000,000 $1,603,725 $578,416 16% $1,761,263 $1,825,549 11.89% 1.13
Opportunistic 2 $27,500,000 $16,608,962 $255,833 60% $6,044,301 $17,500,963 8.93% 1.06
Total 13 $137,000,000 $107,360,570 $81,018,730 78% $54,133,498 $66,951,366 12.97% 1.37
Private Real Assets Upstream 7 $112,000,000 $93,656,468 $115,531,468 84% $31,506,503 $30,578,571 27.13% 1.53
Midstream 3 $42,500,000 $27,167,828 $20,675,858 64% $20,817,981 $22,337,907 35.69% 1.52
Power 1 $10,000,000 $8,231,817 $2,997,000 82% $2,543,927 $2,890,650 -17.03% 0.7
Total 11 $164,500,000 $129,056,113 $139,204,326 78% $54,868,411 $55,807,128 25.84% 1.48
Private Real Estate Value Add 3 $31,585,500 $28,824,135 $22,210,443 91% $14,413,138 $11,952,759 4.09% 1.18
Opportunistic 3 $27,500,000 $22,790,580 $2,936,579 83% $11,884,132 $11,676,588 -9.96% 0.64
Total 6 $59,085,500 $51,614,715 $25,147,022 87% $26,297,270 $23,629,347 -1.46% 0.94
Appendix 2 - Private Markets Report (as of March 31st 2014) - Performance Analysis by Strategy Type & Asset Class
21
Asset Class # of Funds Commitment Contributions Distributions % Drawn Reported Valuation Adjusted Valuation IRR MOC
Private Equity 13 $156,500,000 $113,341,946 $82,244,224 72% $84,454,701 $81,780,852 10.24% 1.41
Private Credit 13 $137,000,000 $107,360,570 $81,018,730 78% $54,133,498 $66,951,366 12.97% 1.37
Private Real Assets 11 $164,500,000 $129,056,113 $139,204,326 78% $54,868,411 $55,807,128 25.84% 1.48
Private Real Estate 6 $59,085,500 $51,614,715 $25,147,022 87% $26,297,270 $23,629,347 -1.46% 0.94
Total 43 $517,085,500 $401,373,344 $327,614,302 78% $219,753,880 $228,168,693 12.04% 1.36
Performance by Strategy Type
Performance by Asset Class
Returns are time weighted cash on cash returns to allow comparison to the policy benchmark. IRR returns can be seen in Appendix II (Page 20).
31st May 2014

Appendix 3 – Glossary
2231st May 2014
Alpha Pool: Investments that tend to be uncorrelated with “traditional” stock and bond investments. Not technically an asset class, but rather an investment construct within a *portable alpha framework
Cash & Equivalents: Cash and short term investments held in lieu of cash and readily converted into cash within a short time span (i.e., CDs, commercial paper, Treasury bills, etc.)
Global Debt: Investments in debt instruments located in developed markets, may include various credit, mortgage-backed and emerging markets debt securities
Global Equity: Investments in companies domiciled in developed market countries and may include opportunistic investments in emerging market countries
Liquidating: The residual investment in terminated managers
Liquid Real Assets: Liquid investments in strategies whose values are sensitive to inflation
Private Equity: Investments in equity securities and debt in operating companies that are not publicly traded on a stock exchange
Private Real Assets: Investments in equity securities and debt in operating companies that are not publicly traded on a stock exchange and whose strategies are sensitive to inflation
Alternative Equity: Investments in companies globally through both long and short positions and may include non-equity instruments such as fixed income, commodities, CDS, options, etc.
Credit: Investments in companies, often stressed or distressed, principally through the debt portion of capital structure
Emerging Market Debt: Investments in debt securities in emerging market countries, primarily in three categories - external sovereign, local sovereign, and corporate debt
Emerging Market Equity: Investments in companies located in emerging market countries
Investment Grade Bonds: Investments in investment grade rated debt securities
Non-US Developed Equity: Investments in companies domiciled in developed market countries
US Equity: Investments in companies domiciled in the US
Major Asset Classes
Sub-Asset Classes

Appendix 3 – Glossary (cont.)
2331st May 2014
Active Premium: A measure of the investment’s annualized return minus the benchmark’s annualized return
Alpha: Return generated by the manager that is not explained by the returns of the benchmark. A measure of a fund’s performance beyond what its benchmark would predict
Annual Return: The annual rate at which an investment would have grown, if it had grown at a steady rate. Also called “Compound Annual Growth Rate” (CAGR), or the “Compound Rate of Return Annualized” (Compound RoR)
Annual Volatility: A statistical measure of the dispersion of returns around the average (mean) return. Often used as a measure of investment risk with a higher value indicating higher risk
Arbitrage: The simultaneous purchase and sale of an asset in order to profit from a difference in the price
Beta: A measure of the risk of the fund relative to the benchmark. Beta describes the sensitivity of the investment to benchmark movements where the benchmark is always assigned a beta of 1.0
Calmar Ratio: A return/risk ratio calculated over the last three year period as [annual compounded return / (Maximum Drawdown)]
Capital Commitment: Every investor in a private equity fund commits to investing a specified sum of money in the fund partnership over a specified period of time.
Capital Distribution: The returns that an investor in a private equity fund receives; the income and capital realized from investments less expenses and liabilities
Carried Interest: The share of profits that the fund manager is due once it has returned the cost of investment to investors
Catch up: A clause that allows the general partner to take, for a limited period of time, a greater share of the carried interest than would normally be allowed. This continues until the time when the carried interest allocation, as agreed in the limited partnership, has been reached.
Clawback: Ensures that a general partner does not receive more than its agreed percentage of carried interest over the life of the fund
Correlation: A measure between +1 and -1 that explains the degree to which the returns of the fund and a benchmark are related
Down Capture: Measures how much of the benchmark’s return the fund captures when the benchmark is negative
Down Number: The percentage of the time the fund was down when the benchmark was down
Drawdown: When a private equity firm has decided where it would like to invest, it will approach its own investors in order to draw down the money. The money will already have been pledged to the fund but this is the actual act of transferring the money so that it reaches the investment target
Excess Kurtosis: Measures the distribution of observed data around the mean with an emphasis on “outlier” data, both positive and negative
Exit: The means by which a fund is able to realize its investment in a company – by an initial public offering, a trade sale, selling to another private equity firm or a company buy-back
Fundraising: The process by which a private equity firm solicits financial commitments from limited partners for a fund
General Partner: This can refer to the top-ranking partner(s) at a private equity firm as well as the firm managing the private equity fund
Investment Terms/Performance Statistics

Appendix 3 – Glossary (cont.)
2431st May 2014
Gross Exposure: Aggregate of long and short investment positions in relation to the Net Asset Value (NAV)
Holding Period: The length of time that an investment is held
Information Ratio: The Active Premium divided by the Tracking Error. This measure explicitly relates the degree by which an investment has beaten the benchmark to the consistency by which the investment has beaten the benchmark
Internal Rate of Return: A time-weighted return expressed as a percentage that uses the present sum of cash drawdowns (money invested), the present value of distributions (money returned from investments) and the current value of unrealized investments and applies a discount
Leverage: Increasing exposure to markets (both long and short) by borrowing or the use of derivatives
Limited Partnership: The standard vehicle for investment in private equity funds
Long Position: Owning a security
Management Fee: The annual fee paid to the general partner
Max Drawdown: The largest percentage loss of Net Asset Value (NAV) as measured from peak-to-trough
Net Exposure: Difference between the long and short positions, representing the exposure to market fluctuations
Preferred Return: This is the minimum amount of return that is distributed to the limited partners until the time when the general partner is eligible to deduct carried interest
Omega Ratio: The weighted gain/loss ratio relative to the average monthly historical return; captures the effects of extreme returns and conveys the preference for positive volatility versus negative volatility
Sharpe Ratio: A return/risk ratio calculated as: [(annual compounded return - risk-free rate) / (annual volatility of returns)]
Skewness: A measure of the symmetry of return distribution, as compared with a normal (bell-shaped) distribution
Sortino Ratio: A return/risk ratio calculated as such: [(annual compounded return – minimum acceptable return (MAR) / (downside deviation of returns below MAR)]. This ratio was developed to differentiate between good (upside) and bad (downside) volatility
Standard Deviation: Measures the dispersal or uncertainty in a random variable (in this case, investment returns). It measures the degree of variation of returns around the mean (average) return
Short Position: Selling a security
Tracking Error: A measure of the unexplained portion of an investments performance relative to a benchmark
Up Capture: Measures the percentage of the benchmark’s return the fund captures when the benchmark is positive
Up Number: The percentage of the time the fund was up when the benchmark was up
Value at Risk (VAR): The maximum loss that can be expected within a specified holding period with a specified confidence level
Investment Terms/Performance Statistics (cont.)