Embed Size (px)
Citation preview
Board of Governors of the Federal Reserve System
International Finance Discussion Papers
Number 755
January 2003
Diversification, Original Sin, and International Bond Portfolios
John D. Burger and Francis E. Warnock
NOTE: International Finance Discussion Papers are preliminary materials circulated to stimulatediscussion and critical comment. References in publications to International Finance Discussion Papers(other than an acknowledgment that the writer has had access to unpublished material) should be clearedwith the author or authors. Recent IFDPs are available on the Web at www.federalreserve.gov/pubs/ifdp/.
Diversification, Original Sin, and International Bond Portfolios
John D. Burger and Francis E. Warnock *
Abstract: This paper has two main goals: to analyze country allocations in international bond portfoliosand to describe the development of bond markets around the world. In the primary analysis, we find thatcountry weights in U.S. investors’ foreign bond portfolios are determined by the openness of capitalaccounts and potential diversification benefits. Positions in local-currency-denominated bonds areparticularly sensitive to past and prospective volatility of returns. Analysis of reallocations in bondportfolios from 1997 to 2001 reveals a flight to quality from countries with low and declining creditratings; reallocations in U.S. investors' equity portfolios also reveal a discriminating flight from highercredit risks. In the secondary analysis, we present measures of the size and currency composition of bondmarkets and analyze the development of local currency bond markets. We find that while country sizeand the level of economic development influence the level of bond market development, past policies—asevidenced in the level and volatility of historical inflation—play an important role. An implication fordeveloping countries is that creditor friendly policies, such as vigilance on the inflation front, can enablelocal bond market development and in turn attract global investors, in part by promoting the developmentof derivative instruments that allow the decoupling of bond and currency investments.
Keywords: portfolio choice, bond market development, flight to quality, home bias, emerging market debtJEL Classification: F30, G11, G15, O16
* The authors are, respectively, Assistant Professor at the Sellinger School of Business and Managementat Loyola College of Maryland and Economist in the International Finance Division of the Board ofGovernors of the Federal Reserve System. The authors thank William Griever, Thomas Jans, Denis Petre,and Maria Toyoda for invaluable assistance with data; JP Morgan for providing data on bond returns;Morris Goldstein, Bill Helkie, Steve Kamin, Ross Levine, Ugo Panizza, Vincent Reinhart and participantsat the IF Monday Workshop for helpful comments; and Tamara Hayford and Sara Holland for researchassistance. All errors are our own. John Burger acknowledges support from the Sellinger School JuniorSabbatical Program. The views in this paper are solely the responsibility of the authors and should not beinterpreted as reflecting the views of the Board of Governors of the Federal Reserve System, or of anyother person associated with the Federal Reserve System. Email: [email protected],[email protected]
1
1. Introduction
The presumption that investors can and do take positions in international bonds is central to many
models in economics and finance. International macroeconomic models—from Mundell-Fleming to
portfolio balance to new open economy macroeconomic models—typically assume that representative
agents can engage in cross-border trading of bonds.1 Central to models of consumption smoothing or risk
sharing is the presumption of internationally tradable bonds.2 And cross-border bond positions are, of
course, prevalent in portfolio diversification models.
Comparatively little empirical work, however, has been conducted on the extent and determinants
of investors’ positions in international bonds. In the Bekaert and Harvey (2003) survey on emerging
market finance, the literature on international bonds is presented in just one short subsection and is
limited to a discussion of returns. In the Karolyi and Stulz (2002) survey on international asset pricing
and home bias, empirical research on international bonds is mentioned only in passing. In the Lewis
(1999) survey on home bias, discussion of bonds is limited to noting the Tesar and Werner (1995)
evidence that cross-border bond positions are relatively small.
We aim to fill this gap by analyzing U.S. investors’ international bond portfolios across 50
countries. Empirical work on international bond portfolios has been impeded by the (lack of ) availability
of three vital types of data. First, to analyze bond portfolios, scaling factors—the size of countries’ bond
markets—are needed. One contribution of this paper is the presentation and analysis of the size of 50
countries’ total, local-currency-denominated, and dollar-denominated bond markets.3 Second, until
recently accurate estimates of cross-border bond positions did not exist. We use high quality data on
1 See Fleming (1962); Mundell (1963, 1968); Branson and Henderson (1985); Obstfeld and Rogoff (1995); andLane (2001).2 See, for example, Obstfeld (1994) and Lewis (1996).3 One source of information on the size of bond markets across countries is Merrill Lynch’s annual Size & Structureof the World Bond Market. Merrill’s data, however, are delineated by currency (i.e,. the U.S. dollar bond market,the sterling market, etc.). For our analysis, we require bond data categorized by the residence of the issuer. Otherrecent discussions of bond market development include IMF (2002) and Mihaljek, Scatigna, and Villar (2002).
2
international bond positions from recent benchmark surveys of U.S. investors’ holdings.4 Third, until
recently historical returns data were available for only a few large countries. With the development of
emerging market bond indices, many of which begin in the early 1990s, we now have sufficient historical
time series of bond returns.
Our analysis is relevant for the literatures on portfolio choice, finance and growth, and financial
crises. Research on international portfolio choice has focused to date on equity portfolios. What do we
learn from analyzing another asset class? Are there interactions between allocations in equity and bond
portfolios? Past work suggests that foreign equity investors tend to be momentum traders (Bohn and
Tesar (1996); Bekaert, Harvey, and Lumsdaine (2002); Froot, O’Connell, and Seasholes (2001)). Do
investors in foreign bonds exhibit similar tendencies? Research on finance and growth has focused on
equity markets and banking sector development (Levine (1997), Levine and Zervos (1998)). What
contribution does an analysis of bond market development offer? Although bonds play an important role
in capital inflows, research on financial crises has yet to focus on local bond markets. The burgeoning
literature on ‘original sin’, for example, has focused exclusively on external bond markets (Eichengreen,
Hausmann, and Panizza (2002)). What are the implications for original sin when data on local bond
market development are included in the analysis? Our study addresses each of these questions.
We begin in Section 2 by presenting the ex post diversification gains associated with adding
foreign bonds to a domestic bond portfolio. This highlights two aspects of international bonds that will
influence our analysis of portfolios. First, currency denomination matters. The optimal portfolio rarely
includes substantial unhedged positions in local-currency foreign bonds. That is, over most horizons
from one to fifteen years, autarky dominates unhedged positions in a reward-to-risk sense. Not knowing
the extent to which investors hedged international bond positions, in our quantitative analysis we use both
4 Tesar and Werner (1995) estimate aggregate bond positions for three countries and the U.S. Bureau of EconomicAnalysis (BEA) presents aggregate U.S. positions annually. It is well known, however, that estimates of aggregateand, especially, bilateral positions from financial flow data can be extremely inaccurate (Warnock and Cleaver(forthcoming)). See Griever, Lee, and Warnock (2001) for a primer on the benchmark surveys.

3
hedged and unhedged returns and differentiate between holdings in the issuer’s currency (i.e., local-
currency denominated) and holdings in the investor’s currency (in this case, dollar denominated).
We provide a formal statistical analysis of the country distribution of U.S. investors’ international
bond portfolios in Section 3. We find that country weights in U.S. investors’ foreign bond portfolios are
related to the openness of capital accounts and potential diversification benefits as given by historical
correlations. Separating positions by currency, similar factors influence portfolio weights in dollar-
denominated bonds, but for local-currency-denominated bonds we find a noteworthy aversion to countries
with higher past and prospective returns volatility. In Section 4 our analysis of portfolio reallocations
between 1997 and 2001 reveals evidence of a discriminating flight to quality: U.S. investors pulled back
from countries with low or declining credit ratings. We analyze reallocations in equity portfolios, too,
and find a similar flight to quality.
Finally, in Section 5 we focus on the implications of our work for emerging markets. We show in
our sample of 50 countries—half of which are emerging markets—that countries with more stable
policies (as evidenced by more stable inflation and exchange rates) have greater bond market
development and higher foreign participation. U.S. investors’ aversion to returns volatility in local
currency bond markets suggests that local currency bonds do not sufficiently compensate foreign
investors for exchange rate risk. The key, therefore, to attracting global investors may be the
development of both local bond markets and the concomitant development of derivative instruments.5
Well-functioning derivatives markets would enable investors to transfer currency risk to those more
willing to bear it. Moreover, shifting the focus toward local bond market development has the added
advantage that deeper local bond markets would help provide a redundancy of funding sources,
something that may well ameliorate financial crises (Greenspan (1999)).
5 Many others promote local bond market development. For example, it figures prominently in the plan put forwardin Goldstein (2002).

4
2. Risk and Return Characteristics of International Bond Portfolios
It is well known that whereas portfolio theory predicts internationally diversified portfolios,
investors tend to exhibit a bias towards local or domestic securities. Much of the home bias literature has
focused on international equities (see the surveys by Karolyi and Stulz (2002) and Lewis (1999)). But
there is also a literature on the potential diversification gains from holding international bonds. The
benefits of including foreign bonds in a portfolio has been documented by Levy and Lerman (1988),
Jorion, (1991), and Levich and Thomas (1993), among others.
Unlike foreign equities, foreign bonds may be denominated in various currencies and the holder
must decide whether to take on the currency risk or hedge against it. Levich and Thomas (1993) show
that the optimal unhedged bond portfolio over the 1977 to 1990 period for a U.S. investor would have
been composed (ex post) mainly of U.S. bonds, because the substantial currency volatility more than
outweighed the increased returns provided by foreign bonds. In sharp contrast, however, is the optimal
hedged portfolio, which would have had a zero weight on U.S. bonds.
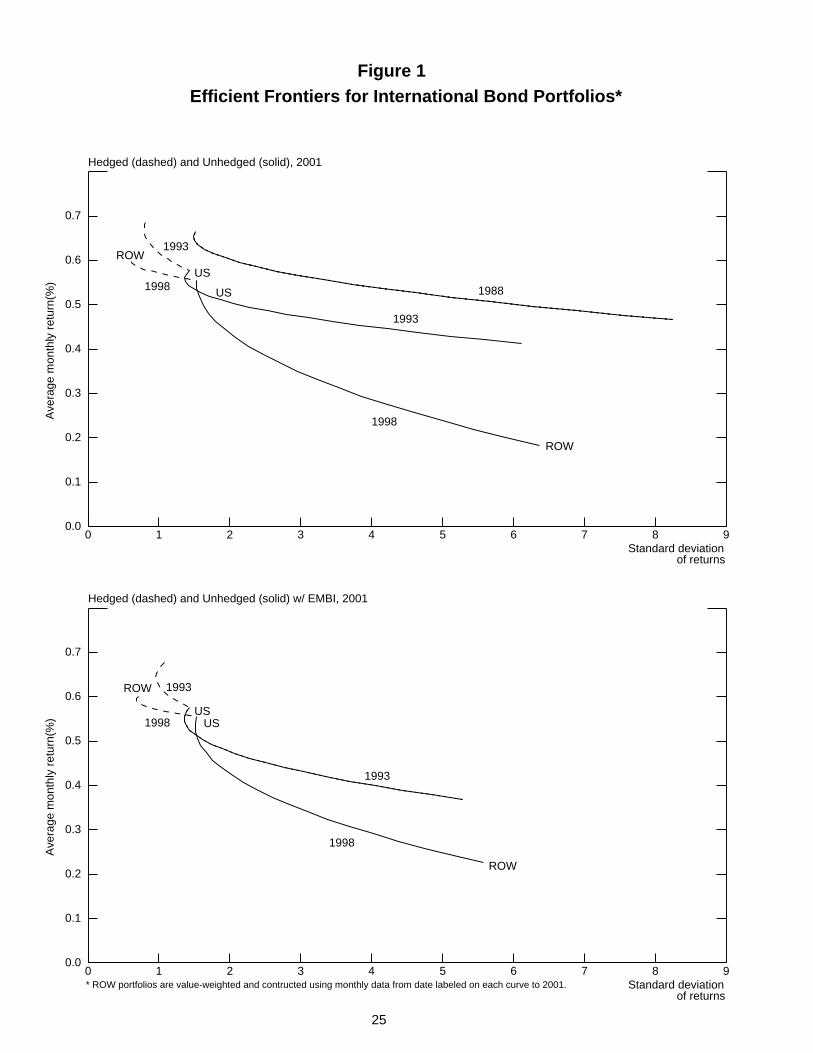
The concern with any ex post analysis is that the results are sample specific. While we do not
eliminate this concern, we show in Figure 1 evidence that the risk-reward tradeoffs for portfolios of U.S.
and foreign bonds that were documented in earlier work—work that used returns data from the 1970s and
1980s—are qualitatively similar when data through 2001 are used. We plot risk-return profiles for both
hedged and unhedged portfolios for four-, nine-, and fourteen-year holding periods ending in December
2001. 6
Focusing first on historical returns, the figure indicates that over longer horizons returns on
foreign industrial-country bonds, whether hedged or unhedged, are similar to returns on U.S. bonds. See,
for example, the solid line labeled ‘1988’, which represents unhedged portfolios held from 1988 to 2001.
An all-U.S. portfolio (the leftmost point) would have earned on average about 0.65 percent per month (7.8
6 The foreign portfolio is a value-weighted composition of bonds from Japan, Canada, United Kingdom, andEuroland, where the weights are given by the size of the individual markets as of end-1997. The hedged portfolioassumes a passive all-hedged strategy; active hedging strategies are analyzed in Levich and Thomas (1993).
5
percent per year). Not too far behind is an unhedged all-foreign portfolio (rightmost point) at 0.50
percent per month (6 percent per year).7 Hedged all-foreign portfolios for the 1993-2001 and 1998-2001
periods provided somewhat higher monthly returns of 0.68 and 0.60 percent, respectively. In all, the
difference in average monthly returns on all-U.S. and all-foreign portfolios, whether hedged for currency
risk or not, is at most 20 basis points.
Over the periods presented in Figure 1, returns on unhedged foreign bond portfolios were not
only lower than on a portfolio of U.S. bonds, but they were also extremely volatile. The difference in
historical volatility is so large that even during periods when unhedged foreign bonds earn a higher return
than U.S. bonds, one’s tolerance for risk would have to be substantial for the higher returns to sufficiently
compensate for the increased risk. The rather extreme risk is, of course, due mainly to the high volatility
of exchange rates.8 If we rule out the option of currency hedging, the optimal portfolio is comprised
almost exclusively of U.S. bonds. In fact, regardless of risk tolerance and sample period, a portfolio with
greater than ten percent dedicated to unhedged foreign bonds is inefficient.
By eliminating currency risk, hedged foreign bonds dominated unhedged ones in this sample.
Moreover, over these horizons hedged positions dominated a portfolio of only U.S. bonds. This is due to
slightly higher historical returns on foreign bonds, but more importantly to the reduction in risk associated
with greater diversification. 9 Indeed, if we assume currency risk is completely hedged, the optimal
allocation is reversed: The optimal portfolio is comprised almost entirely of non-U.S. bonds.10
7 That dollar returns on U.S. and foreign bond portfolios over a long period are broadly similar is evidence insupport of uncovered interest parity (UIP). For a formal empirical test of UIP, see Cumby and Obstfeld (1981).8 As pointed out in Levich (2001), a negative covariance between currency and bond returns—caused perhaps bytight monetary policy that results in bond losses but capital inflows that appreciate the currency—would reduce thevariance of unhedged foreign currency positions. However, this covariance term is likely orders of magnitudesmaller than the variance of the change in the exchange rate. Recent papers on exchange rate volatility includeBayoumi and Eichengreen (1998) and Devereux and Lane (forthcoming).9 The domination of hedged over unhedged bond international portfolios was also evident in earlier decades andspawned a series of ‘free lunch’ papers. For opposing views on the apparent free lunch in hedged international bondportfolios, see Rosenberg (1990) and Perold and Shulman (1988).10 Foreign portfolios that also include emerging market debt result in broadly similar efficient frontiers (bottom halfof Figure 1), because even though returns on emerging market and industrial country debt are less correlated,emerging market debt is only a small fraction of the global bond market.
6
The risk-return tradeoff for unhedged positions indicates that global fixed income investors are
not sufficiently compensated for the currency risk inherent in local bond markets. This suggests that to
attract global investors a country must either have a well developed derivatives market in its currency (so
global bond investors can shed the currency risk) or issue in foreign currency (so currency risk, from the
perspective of the investor, is eliminated).
What is the actual allocation between U.S. and foreign bonds in U.S. investors’ bond portfolios?
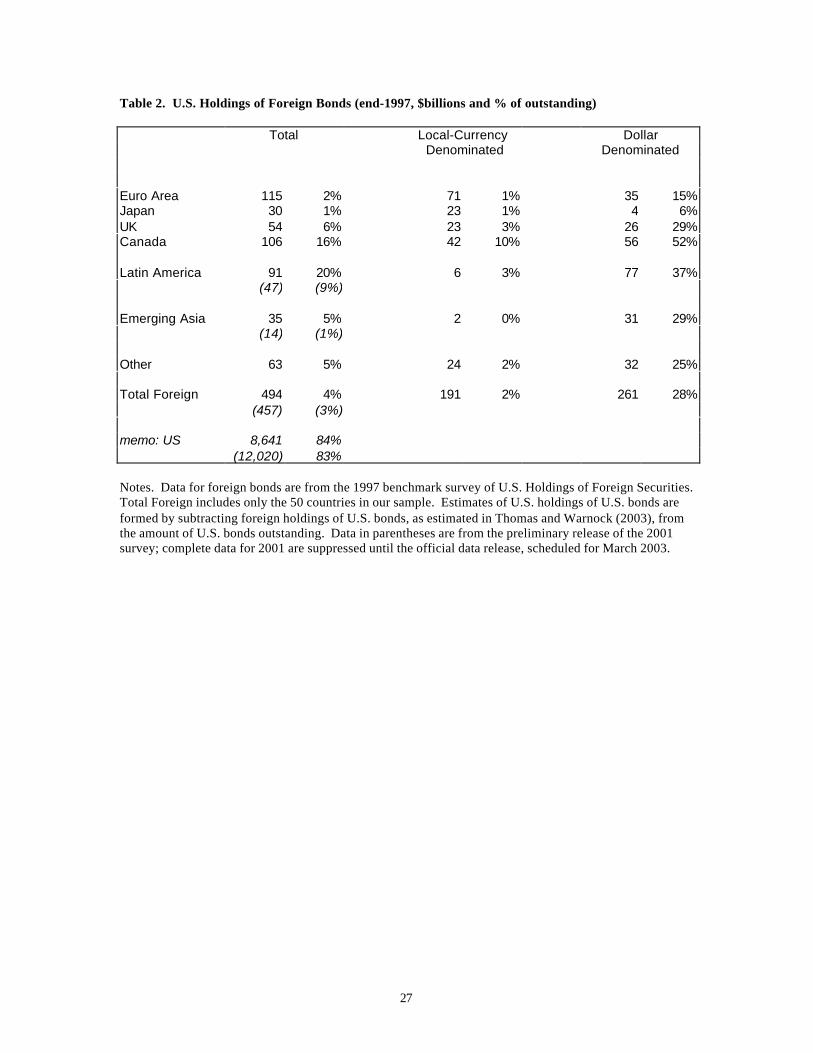
As of the end of 2001, U.S. positions in the bonds of the 50 foreign countries in our sample amounted to
$457 billion dollars (Table 2); including countries, mainly Caribbean financial centers, that we have
omitted from our analysis puts the amount at $508 billion. Although not part of the survey, U.S.
investors’ end-2001 positions in U.S. bonds are estimated to be about $12,020 billion (Thomas and
Warnock (2003)). Thus, foreign bonds comprise about 4 percent of the U.S. investors’ bond portfolios,
down from 6 percent in 1997 and well below the approximately 50 percent share of foreign bonds in the
global bond market. In terms of the efficient frontiers of Figure 1, this approaches the all U.S. allocation.
Relative to the size of foreign bond markets—which comprise about half the global bond
market—U.S. positions in foreign bonds are quite small. This represents a large departure from the
predicted allocations of the ICAPM and is still more evidence of the home bias in asset positions. In our
analysis of U.S. bond portfolios, we will not attempt to model this home bias at the aggregate level.
Rather, we aim to explain the country weights in U.S. bond portfolios. We turn to this exercise next.
3. Country Weights in International Bond Portfolios
The framework underlying our empirical investigation of international bond portfolios is the
traditional portfolio theory developed by Sharpe (1964) and Lintner (1965). In particular, we model
deviations from portfolio weights predicted by the international version of the classical capital asset
pricing model (ICAPM). The ICAPM predicts that portfolio weights are given by market weights; we
effectively model the weight in U.S. portfolios relative to the market weight in the world market portfolio.
7
As explanatory variables we use candidate causes for deviations from ICAPM weights, such as direct and
indirect barriers to international investment. For example, investors might deviate from ICAPM
allocations because of direct barriers, such as capital controls or high transaction costs, or indirect
barriers, such as information asymmetries. Information asymmetries could, for example, prompt returns-
chasing behavior; to allow for such behavior, we examine the extent to which the mean (and volatility) of
past returns affects asset allocations.
3.1 The Dependent Variable
We aim to explain the country allocation in U.S. investors’ foreign bond portfolios. Analogous to
the measure of equity home bias used in Dahlquist, Pinkowitz, Stulz, and Williamson (forthcoming) and
Ahearne, Griever, and Warnock (forthcoming), the deviation of country i’s weight in U.S. investors’
portfolios from its ICAPM weight is given by the following:
DevICAPM i = (USHoldingsi / US Bond Portfolio) / (Bond Marketi / World Bond Market) (1)
In cross-sectional work, the size of the U.S. bond portfolio relative to the world bond market is a constant
equal to about one-half in 2001. Thus, for ease of interpretation we analyze the following measure that is
observationally equivalent to equation (1):
ShareUS iT = USHoldingsi
T / Bond MarketiT (2)
where i denotes the country, T (T = total, dollar-denominated, or local-currency-denominated) is the type
of bonds analyzed, and the holdings data are from the 1997 and 2001 comprehensive benchmark surveys
of U.S. investors’ positions in foreign securities. ShareUSi is the relative importance of U.S. investors in
bond market of country i, which is observationally equivalent to a home bias or deviation from ICAPM
measure and identical to measures used in Falkenstein (1996) and Gompers and Metrick (2001).
8
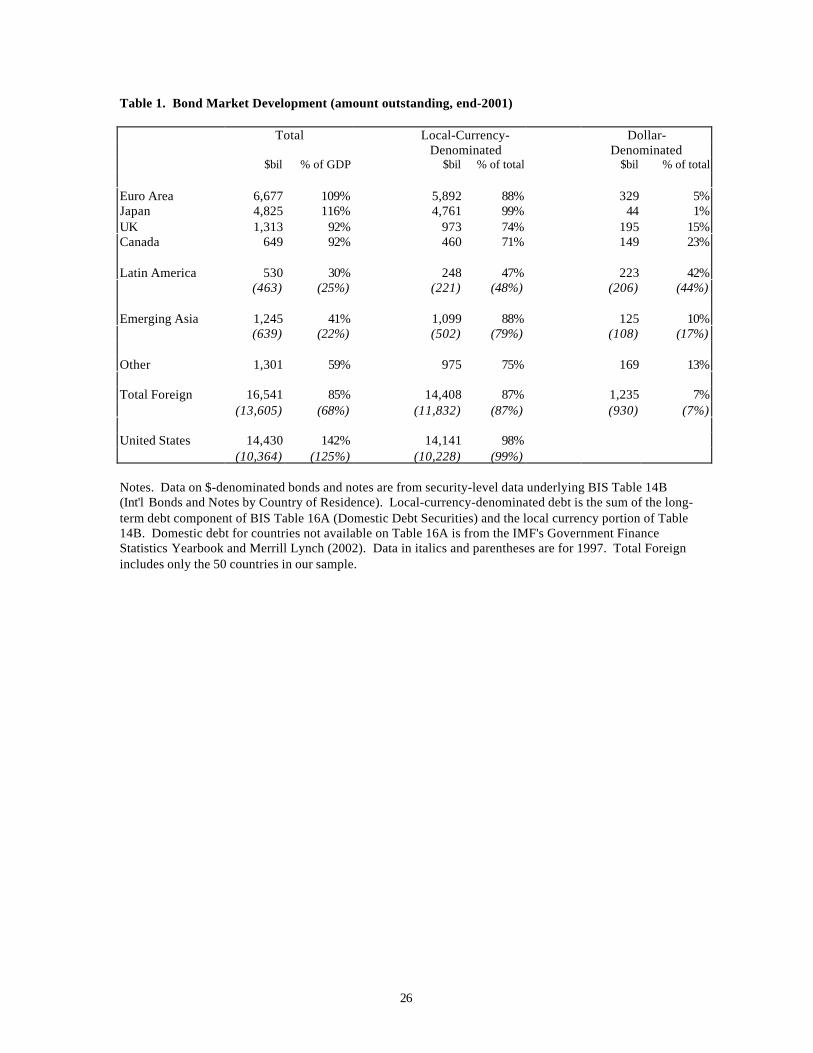
The denominator of ShareUS i requires data on the size and currency composition of foreign bond
markets, a summary of which is provided in Table 1. Our primary source for calculating the size of bond
markets is unpublished data from the Bank for International Settlements (BIS). For local-currency bonds
that are placed in the domestic market, we use the unpublished data on long-term debt underlying BIS
Quarterly Review Table 16A on domestic debt outstanding. For international bonds (i.e., those in foreign
currencies or placed abroad), we use the security-level data behind BIS Quarterly Review Table 14B. The
security-level nature of these data allow us to break out issuance by country and by currency, which is
essential to our calculation of the size of dollar-denominated debt outstanding by country, but also to
capture the local-currency-denominated debt issued abroad.11
In theory, we would like to measure not the size of the entire bond market, but the float, or
tradable portion. In the literature on equity portfolios, the size of the tradable market is calculated by
excluding shares held by insiders; see, for example, Dahlquist et al. (forthcoming). To calculate the float
for bonds we should subtract from the size of a bond market all government agencies' (including pension
funds) holdings of their own government's bonds. In practice, such information is not available across a
wide range of countries, although we are able to exclude a subset of government holdings—central bank
holdings of their own government's bonds—which is presented for most countries in the IMF’s
International Financial Statistics (line 12a). Note that this 'float' adjustment affects only local currency
issuance; we assume governments do not hold their own foreign-currency-denominated debt.
Summary data for our dependent variable is displayed in Table 2. The top rows show 1997 U.S.
positions as a share of the total bond market in selected countries. Perhaps surprisingly, U.S. holdings are
quite similar across industrial and emerging market countries. In the industrial countries listed, U.S.
investors’ positions, as a share of the market, range from one percent in Japan to 16 percent in Canada.
11 The BIS security-level international bond data combines information from Capital DATA (Bondware), ThomsonFinancial Securities Data (Platinum), and Euroclear. BIS then identifies and removes duplicates, corrects mistakes,ensures a consistent classification of issuers across the different sources, and performs general quality control. Thus,it appears to be the most comprehensive data set on international bonds. It does not, however, include informationon Brady bonds, which we obtained from Merrill Lynch (2002). BIS data on domestic debt is not collected at the

9
U.S. investors hold similar shares of emerging market debt. Among emerging markets, U.S. positions are
substantial in Latin America (20 percent) but more limited in emerging Asia (five percent).
This similarity of U.S. holdings across industrial and emerging markets is also evident when we
examine holdings of local-currency- and dollar-denominated bonds. U.S. positions in local-currency
bonds (as a share of total local-currency bonds outstanding) are quite small across the board. As of
December 1997, holdings in emerging Asia, Japan, and the euro area were in the 0-1% range, while U.S.
investors held 3 and 10 percent of local-currency bonds in Latin America and Canada. Importantly, these
shares do not appear to vary systematically across types of countries. We see little evidence that
emerging markets are strikingly less able to market their local-currency bonds to U.S. investors—this is
true across all countries. Finally, of the dollar-denominated issuance by the countries listed, U.S.
investors held 28 percent of the amount outstanding in 1997. Again, the shares do not differ much across
emerging markets and industrial countries.12
3.2 Explanatory Variables
Table 2 demonstrates that the nature of U.S. positions is somewhat similar across different types
of countries. This broad similarity does not preclude important differences across individual countries.
To analyze the cross-sectional variation in U.S. bond positions, we first need to identify candidate causes
for deviations from the ICAPM allocation. These include:
Historical Performance. Historical risk-return tradeoffs are sample dependent. Nonetheless, the
story from the efficient frontiers of Figure 1 is striking. If global bond investors are momentum traders
who use past performance as some indication of future performance, historical risk-return tradeoffs could
lead to deviations from ICAPM allocations. We construct historical risk and return measures using
monthly observations of JPMorgan country-level bond indices. For emerging markets, we use JPMorgan
Emerging Market Bond Index (EMBI) Global, which consists of dollar-denominated bonds. For
security level but should by definition contain only local-currency-denominated bonds placed locally; for Argentinaand Peru, however, it contains some foreign currency issues, which we have recategorized.
10
industrial countries we rely on the JPMorgan Government Bond Index (GBI), which consists of
government bonds denominated in local currency. Because we are interested in returns to U.S. investors,
we utilize GBI returns expressed in dollars. In all, the JPMorgan indices provide coverage for 45
countries in our sample. For each country we calculate the average return (MEAN), variance of return
(VAR), Sharpe ratio (SHARPE), and correlation with U.S. bond returns (CORR) over a four-year period
ending December 2001.13 Because it is an open issue as to what extent global investors hedge foreign
bond positions, we generate these variables using both hedged (H) and unhedged (U) returns.14
Some studies have found that business cycle variables have predictive power for returns (Keim
and Stambaugh (1986), Chen (1991), and Ilmanen (1995)). Following these studies, we form detrended
GDP and stock market variables, but these have no explanatory power for holdings across countries and
are not reported in what follows.
Liquidity. Investors who value liquidity may be willing to deviate from ICAPM allocations.
Measuring the liquidity of individual debt securities can be nontrivial; measures of liquidity across our
sample of fifty markets are nonexistent. An indication of trading volume would serve as a good proxy for
liquidity, but because bond trading is not conducted on organized exchanges, such a measure does not
exist at the country level across many countries. Instead we rely on McCauley and Remolona (2000),
who show that size is a reasonable but imperfect proxy for liquidity, and construct a variable, BDDEV,
defined as the size of the bond market normalized by GDP. This measure of bond market development is
akin to measures of stock or financial market development found in Levine and Zervos (1998), and will
capture any preference U.S. investors might have for large or small bond markets.15
12 Table 2 will be updated with complete data for 2001 after the official data release (expected March 2003).13 The Sharpe ratio is calculated as (Ri-RF)/σ(Ri). One-month U.S. Treasury bill returns from CRSP are used as therisk-free return series.14 For industrial countries, the GBI has both hedged and unhedged dollar returns. For emerging markets, we formunhedged returns on local currency bonds by adding currency returns to EMBI bond returns.15 Ahearne et al (forthcoming) find that small stock markets have greater relative weights in U.S. investors’ foreignequity portfolios.
11
Credit Ratings. Country credit ratings (CR) might have predictive power for risk and thus
influence portfolio allocations. We translate Standard & Poor’s ratings on long-term foreign-currency
denominated debt into a numeric score ranging from one (AAA) to 21 (C).16
Direct Barriers to International Investment. While direct barriers to international investment
have fallen greatly over the past few decades, some restrictions still exist. There is no numeric indicator
of bond market openness, so we rely on the more general Quinn (1997) measure of capital account
openness (CA97), which is used in Quinn, Inclan, and Toyoda (2001) and ranges from 0 (completely
closed) to 4 (completely open). The measure is available only through 1997; if sustained and credible
changes in capital account openness are infrequent, this historical measure should be satisfactory.
Real Linkages. The extent of real linkages could affect deviations from ICAPM allocations. As
in Ahearne et al (forthcoming) we use as a measure of real linkages TRADE, the importance of trade with
the United States (bilateral exports plus imports over GDP).
Summary statistics for the explanatory variables are provided in Table 3a – 3c.
3.3 The Determinants of Country Weights
The results of bivariate regressions of the percentage of a country’s overall bond market held by
U.S. investors as of end-2001 are presented in the ‘t-stat’ column of Table 3(a). The bivariate results
show that countries with greater bilateral trade linkages (TRADE) and more open capital accounts
(CA97) have greater weights in U.S. portfolios. Since we do not know the extent to which bond positions
in industrial countries are hedged against currency risk, Table 3(a) includes variables based on both
hedged (prefix H) and unhedged (prefix U) returns. The t-stat of –1.714 on UCORR suggests that U.S.
investors’ international bond portfolios are more heavily weighted towards countries whose returns are
less correlated with U.S. returns, consistent with the theory of portfolio diversification. 17
16 See Cantor and Packer (1996) and Ammer (1998) for analysis of the determinants and information content ofcredit ratings.17 This result, however, is not very robust, disappearing when holdings are broken out by currency denomination.
12
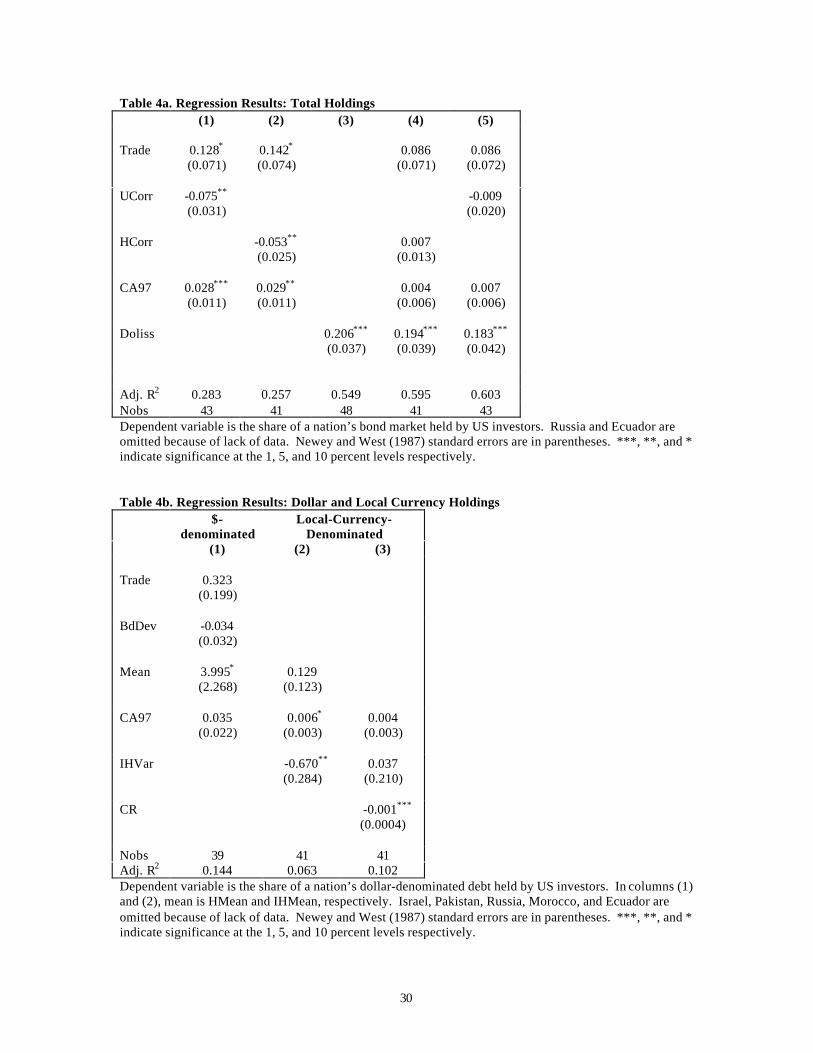
Multivariate results, reported in Table 4(a), indicate that trade, capital account openness, and
correlation are again statistically significant. These variables combine to explain 25 to 30 percent of the
variation in U.S. investors’ bond holdings. In addition, the estimated coefficients are economically
significant. The estimated coefficient for CA97 suggests that U.S. investors’ holdings of the Chinese
bond market would increase from 0.2% to 7.7% if China opened its market (from current level of CA97
of 1.5 to max of 4.0).18 The estimated coefficient for HCORR indicates that if a market highly correlated
with the U.S. (e.g., Germany) had instead only an average correlation, U.S. investors would have had
significantly higher holdings (for Germany, holdings would have doubled from 2.3% to 4.6%). Finally,
the coefficient on TRADE is somewhat less powerful, indicating that a sizable 10% increase in bilateral
trade as a share of GDP would increase holdings by less than 1.5 percentage points.19
These results notwithstanding, there is one variable that is an even more important determinant of
U.S. holdings, the percentage of a country’s outstanding debt that is dollar denominated (DOLISS). This
variable alone explains 55% of the cross-country variation in U.S. holdings and its inclusion in
multivariate regressions renders other variables insignificant. We do not, however, view this as a
satisfactory explanation of U.S. holdings. Instead, we take this as evidence that it is important to analyze
U.S. holdings of dollar- and local-currency-denominated bonds separately.
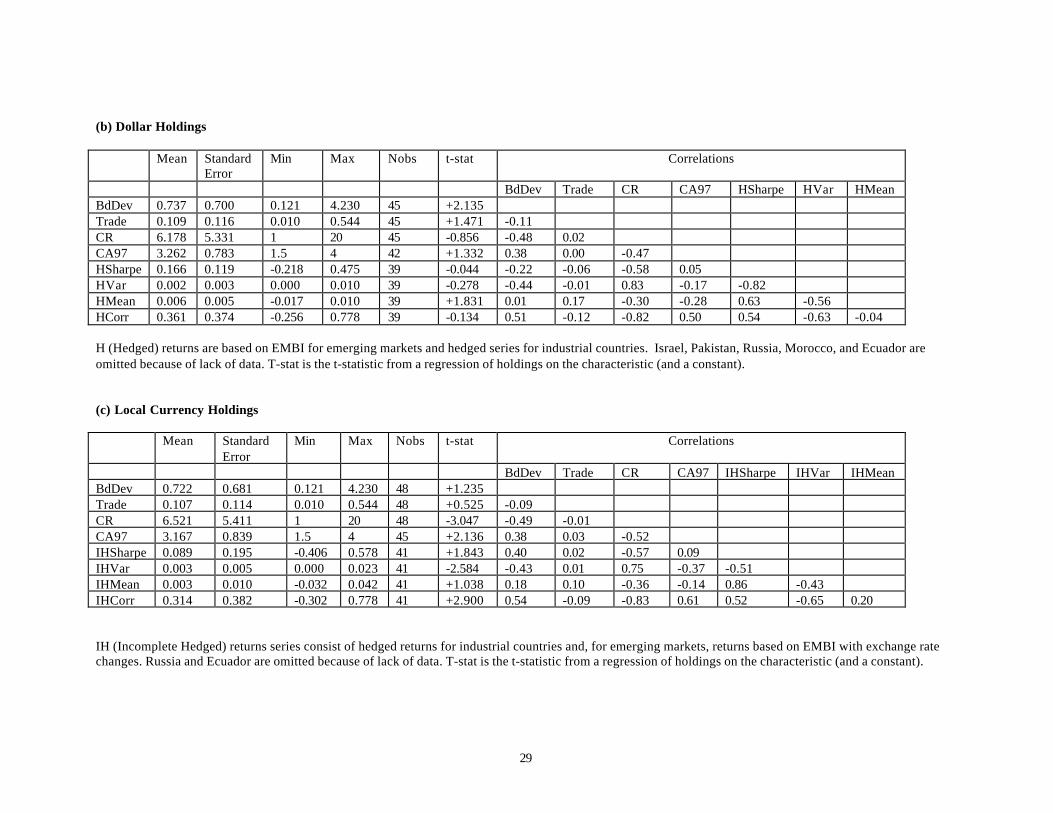
3.4 Positions in Dollar- and Local-Currency-Denominated Bonds
The bivariate results in Table 3(b) show that dollar-denominated bonds issued by countries with
deeper bond markets (BDDEV) and higher historical returns (HMEAN) have greater weights in U.S.
portfolios.20 The multivariate results, reported in column (1) of Table 4(b), indicate that only historical
returns retain statistical significance.
18 We recognize that in a general equilibrium world this and other such statements that follow require the ceterisparibus assumption.19 The statistical significance of TRADE in Tables 3a and 4a is tenuous. Dropping one outlier (Canada) greatlydiminishes the significance of its coefficient.20 For industrial countries, returns series on dollar denominated bonds are not available. We utilize hedged returnson local currency denominated debt, a reasonable substitute given low hedging costs for these industrial countries.

13
Turning back to the bivariate results reported in Table 3(c), we find that the determinants of
holdings of local-currency-denominated bonds differ. For local-currency holdings, the most important
variables are those associated with risk and volatility: credit rating and variance of past returns.21 In
multivariate regressions (Table 4b, column 3), the credit rating seems to be the dominant factor.
The contrasting results for the determinants of local-currency and dollar-denominated bond
holdings are consistent with the distinction between hedged and unhedged bond portfolios made in
Section 2. Given the risk associated with unhedged positions in foreign bonds (illustrated in Figure 1), it
is not surprising that measures of risk and volatility are particularly important in explaining holdings of
local-currency denominated debt. Furthermore, for dollar-denominated bonds the primary source of
volatility has been eliminated, justifying a greater emphasis by U.S. investors on the level of returns.
4. Reallocations in International Bond and Equity Portfolios
We have shown that at a point in time (end-2001) U.S. posit ions in foreign bonds are driven
mainly by the openness of capital accounts and measures of past and prospective volatility. In this
section, we investigate the determinants of changes in U.S. portfolio weights from 1997 to 2001 as
defined by:
−
= 1997
1997
2001
2001
i
i
i
ii MarketSize
USHoldingsMarketSizeUSHoldings
Dhold (3)
For completeness, after analyzing the reallocations in international bond portfolios, we update the
Ahearne et al (forthcoming) analysis of changes in equity portfolios.
21 Correlation is significant (and positive) in bivariate but not multivariate regressions. In this sample, the effect ofcorrelation is indistinguishable from credit risk given their correlation of –0.83.
14
4.1 Bond Portfolio Reallocations
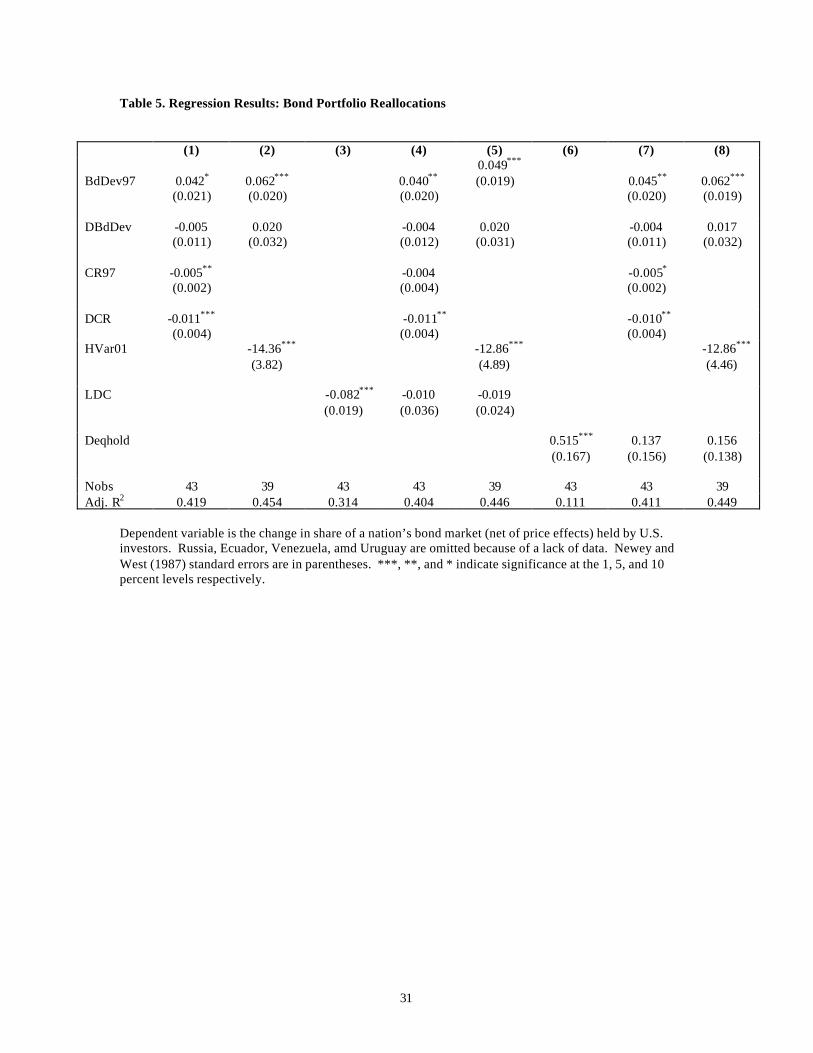
Table 5 displays regression results for the change in bond holdings on various factors. Since our
holdings data are at current value but the issuance data are valued at face, we deflate 2001 holdings by the
price change from 1997 to 2001. 22 We include in the first regression the initial 1997 levels and changes
from 1997 to 2001 of BDDEV and CR. The results indicate that U.S. investors moved into more
developed bond markets and away from smaller ones. There is also strong evidence that investors moved
away from countries with poor 1997 credit ratings, and more so from those whose credit rating was
subsequently downgraded. For example, our coefficients indicate that Malaysia, with its 1997 credit
rating of A, would have seen more U.S. disinvestment than a more highly rated country—2.5 percentage
points more than a country with a 5-step higher credit rating of AAA. More important, however, was its
3-step downgrade to BBB, accounting for a 3.3 percentage point decrease (of 8.4% total).
Over this period, poor and declining credit ratings were highly correlated with greater returns
volatility; column (2) shows that U.S. investors fled volatile returns. The regressions in columns (1) and
(2) each explain more than 40 percent of the variation in the change in holdings. Our finding that
investors sought out more developed bond markets while avoiding credit risks and volatile returns appears
to indicate a flight to quality from 1997 to 2001.
That U.S. investors shifted out of the bonds of countries with small markets, lower credit ratings,
and more volatile returns raises the question of whether this was simply an exodus from emerging
markets. Indeed, the most striking change in U.S. investors’ bond positions between 1997 and 2001 is a
retrenchment from emerging market debt. In 1997, U.S. investors’ held twenty and five percent,
respectively, of Latin American and emerging Asian debt, but by 2001 those shares had fallen to nine and
one percent. Moreover, the eight largest declines in U.S. positions (as a share of the market) occurred in
emerging markets.
22 We use total returns indexes to deflate holdings. Straight price indexes would be preferable, but they are notavailable for all countries.

15
To investigate whether investors blindly dumped emerging market debt or were more
discriminating in their portfolio adjustments, we introduce a binary dummy variable for LDCs. In column
(3) of Table 5 we find that the LDC dummy variable is negative and highly statistically significant in a
bivariate regression: investors did reduce their allocations to emerging markets. However, even in the
presence of a LDC dummy, our other explanatory variables retain statistical significance (columns (4) and
(5)). These results suggest that within the category of LDC debt, U.S. investors considered characteristics
such as credit risk when adjusting their portfolios.
Finally, in columns (6)-(8) we investigate whether U.S. investors’ bond reallocations followed the
pattern of equity reallocations (DEQHOLD).23 Column (6) indicates that bond and equity portfolio shifts
did indeed have much in common—US investors tended to move out of particular countries’ bond and
equity markets. But columns (7) and (8) demonstrate that underlying factors such as credit ratings and the
variance of past returns drove the reallocations, not just flight from certain countries.
4.2 Equity Portfolio Reallocations
Our analysis of the change in U.S. investors’ international bond portfolios from 1997 to 2001
reveals a flight to quality. The statistical evidence rejects the hypothesis that this was a blind flight from
emerging markets and instead supports the notion that U.S. investors considered a number of risk factors
when adjusting their portfolios. We now turn to an investigation of the change in U.S. equity holdings
over the same period to see if a similar pattern emerges.
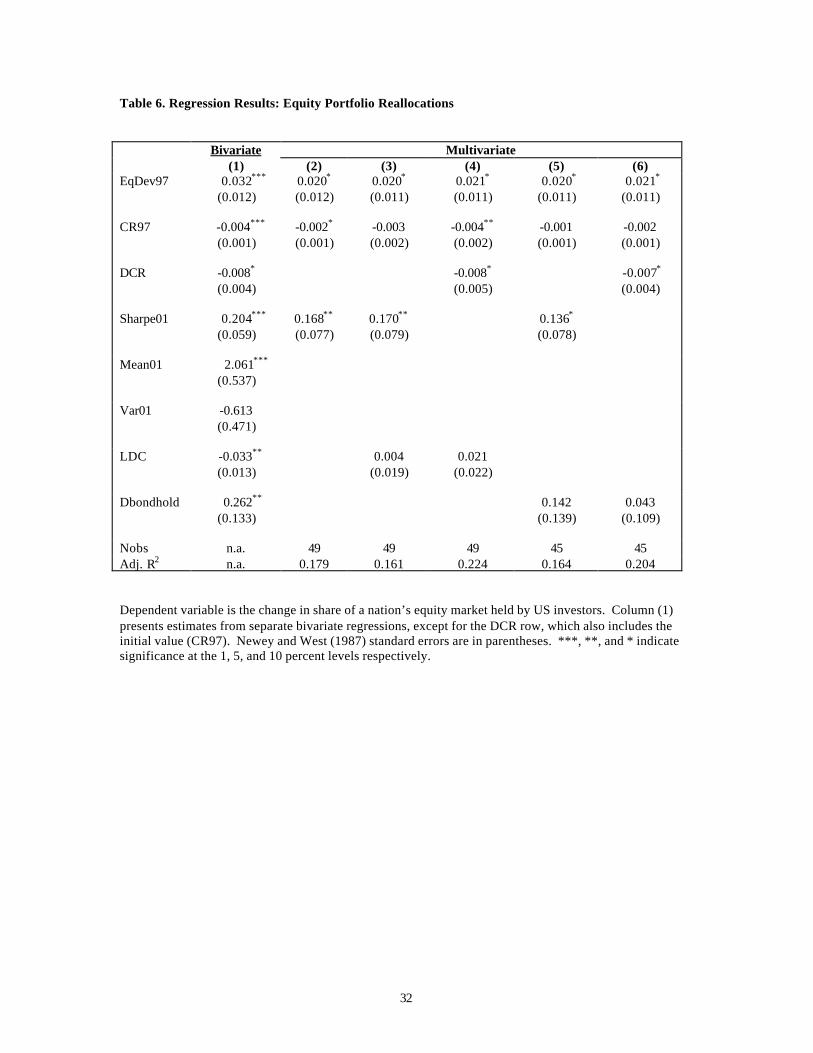
Column (1) of Table 6 displays bivariate regression results for the change in equity holdings on
various factors.24 Some of the results match those for bond portfolios; for example, U.S. investors moved
into more developed equity markets and decreased holdings in countries with poor or declining credit
ratings. In contrast to the findings for bond holdings, equity investors seem to be primarily driven by the
23 The patterns of equity and bond positions at a point time are not significantly related.24 The exception is the coefficient for DCR which is generated in a multivariate regression including the initial value(CR97).
16
mean rather than the variance of past returns; the Sharpe ratio is a significant predictor of the change in
equity holdings, but the explanatory power is in the numerator rather than the denominator.
In columns (2)-(4) we test whether the explanatory variables are simply capturing a flight from
emerging market equities. Columns (3) and (4) indicate that, even in the presence of a LDC dummy, the
other explanatory variables retain statistical significance. Consistent with our earlier findings for bonds,
these results suggest that within the category of emerging market equities, U.S. investors considered risk
and return proxies when adjusting their portfolios. Finally, the results in columns (5) and (6) confirm that
bond and equity portfolio reallocations are not significantly linked once we control for risk and return.
5. Implications for Emerging Markets
Issues facing emerging markets have spawned a growing literature that is of particular interest
after the series of financial crises that began in the mid-1990s. Our analysis of U.S. investors’
international bond portfolios has a number of important implications for emerging markets. In this
section we discuss the implications of our results for bond market development, original sin, and foreign
participation in emerging local bond markets.
5.1 Bond Market Development and Original Sin
The (in)ability of emerging markets to issue bonds in local currency that are attractive to
international investors has received considerable attention in the currency crisis literature. A new and
growing literature on the “original sin hypothesis” attributes much of the financial instability in emerging
economies to incomplete financial markets. Eichengreen and Hausmann (1999) describe original sin as,
“… a situation in which the domestic currency cannot be used to borrow abroad or to borrow long term,
even domestically.” Countries suffering from this affliction have, among other things, less flexibility in
economic policy. For example, if a large portion of a country’s debt is denominated in foreign currency,
a depreciation immediately increases the pain of debt service payments.
17
The Eichengreen and Hausmann (1999) definition suggests that a country free from original sin is
one that has developed a mature local-currency bond market. Recent work, however, has focused on a
more narrow measure of original sin, namely the fraction of a country’s external bonds denominated in
foreign currency (Eichengreen, Hausmann, and Panizza (2002) – henceforth EHP). The exclusion of
local bond markets has been influential. Indeed, the stylized facts of external bond markets (bonds placed
abroad) figure prominently in many theoretical papers; see, for example, Caballero and Krishnamurthy
(forthcoming). The exclusion, though, is defendable only if global investors do not participate in local
bond markets. However, the 1997 U.S. holdings data in Table 2, discussed above and addressed again in
the next subsection, suggests that U.S. investors do indeed hold local emerging market bonds, and to a
similar extent that they hold local bonds of industrial countries.
In column 4 of Table 1 we present the share of outstanding bonds that is denominated in the
local currency. This is similar to an original sin measure used in EHP, but it is more encompassing as it
includes local bond markets. The data indicate that the contrast between industrial countries and
emerging markets is not as stark as one might have imagined. For emerging Asia the fraction of the total
bond market denominated in local currency exceeds that of the UK and Canada, although Latin America’s
local currency issuance is below that of other regions.
More informative than the local currency share of a country’s bond market is the actual
development of the local currency bond market. Consider, for example, a country with an
underdeveloped bond market—say 10% of GDP—wholly comprised of local-currency-denominated
securities. Is this country free from original sin? A measure focused strictly on the local currency share
would indicate that it is. However, such a country has only a limited ability “to borrow long term, even
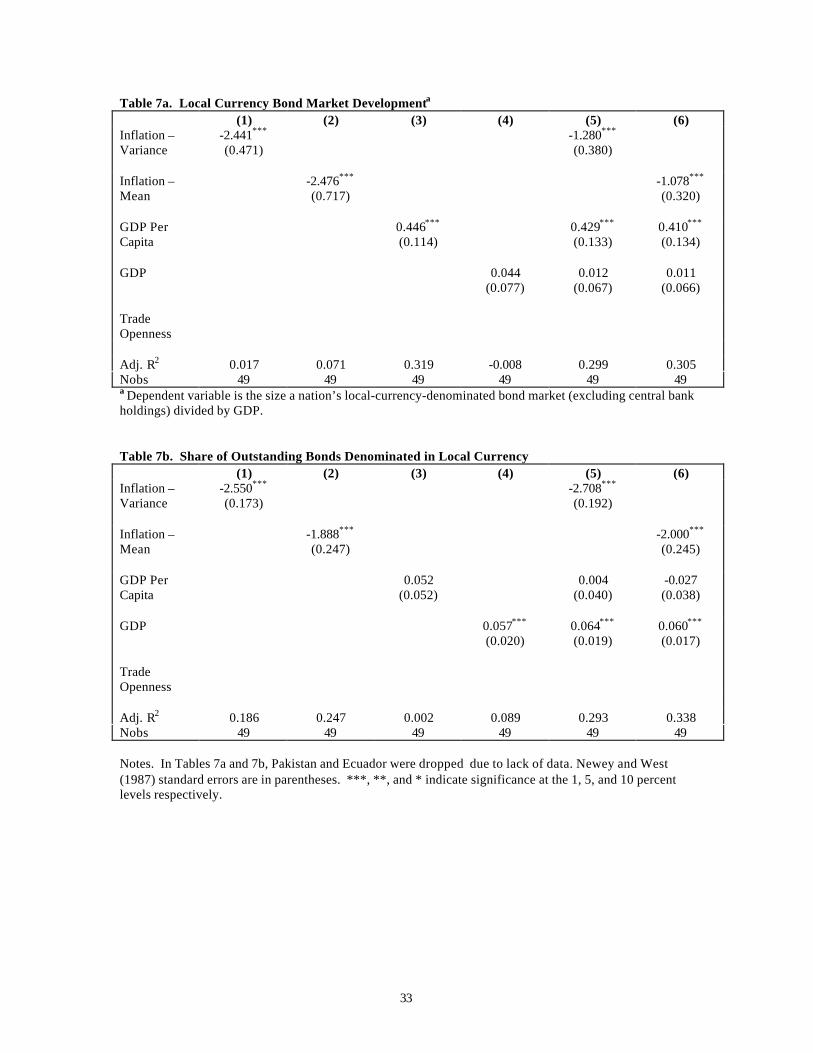
domestically.” We therefore construct a measure of local-currency bond market development defined as
the size of a nation’s local-currency-denominated bond market (excluding central bank holdings) divided
by GDP. The regressions reported in Table 7a seek to explain the cross-country variation in local-
currency bond market development. The results suggest a prominent role for past policy. In our sample,
countries with lower or less volatile inflation (and thus likely more stable monetary and fiscal policies)
18
have better developed bond markets. In addition, the level of economic development, as measured by
GDP per capita, is significantly related to bond market development, but country size (GDP) is not.25
For completeness, we also analyze the share of outstanding bonds denominated in the local
currency (Table 7b), the measure most closely related to one employed by EHP (2002). We find, as they
do, that country size is highly significant but that the level of economic development is not. Contrary to
their findings, however, is the importance of past inflation. Countries that have had higher or more
variable historic inflation tend to issue more foreign-currency-denominated debt. This suggests, as in the
model of Jeanne (2002), an important role for monetary policy credibility in explaining the currency
composition of a country’s debt.
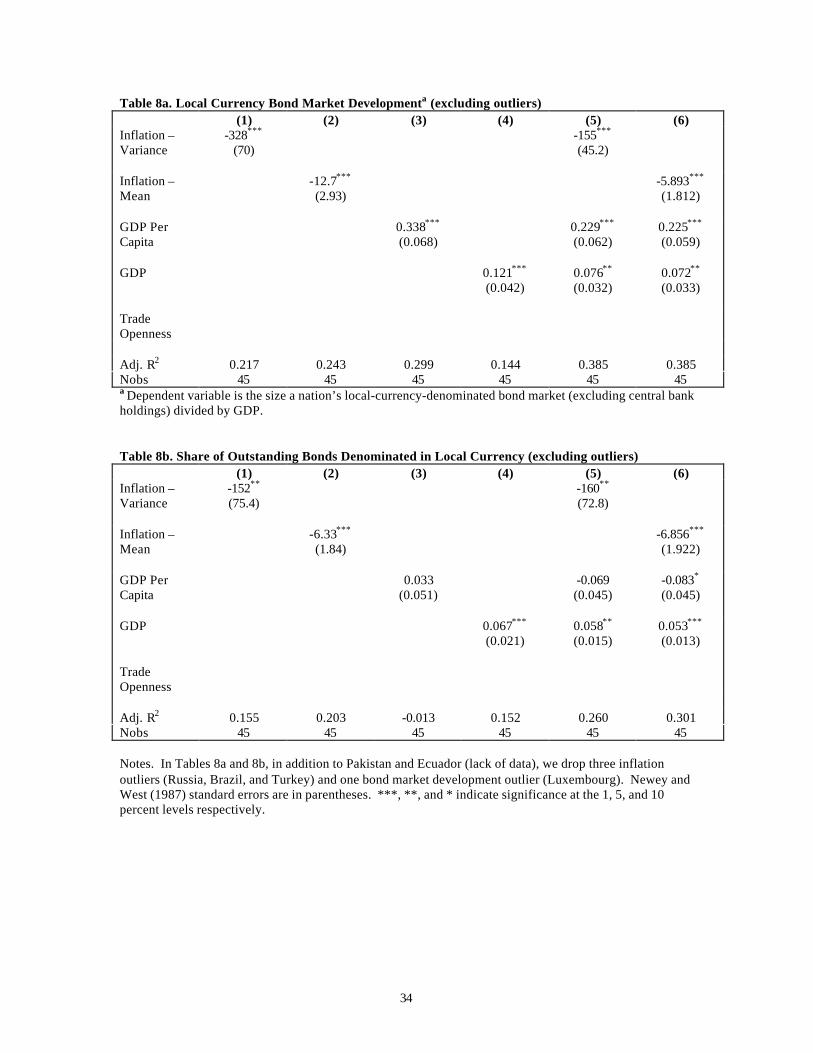
The regressions reported in Tables 7a and 7b include some outliers. For example, Brazil, Russia,
and Turkey had extremely high inflation during our sample period. And Luxembourg’s bond market
development (which is, recall, expressed as a percent of GDP) is more than three times greater than the
country with next most developed market. In Tables 8a and 8b we rerun the regressions without the
outliers. The results are broadly similar. Variables that are significant in Table 7 tend to be so in Table 8.
In summary, the results in Tables 7 and 8 indicate an important role for past policies in the
current state of both the development and currency composition of countries’ bond markets. Moreover,
the fact that per capita GDP is significant in regressions of bond market development but not in
regressions of the currency composition of outstanding bonds is telling. It suggests that the primary
distinction between emerging markets and industrial countries is the level of overall bond market
development, not the currency denomination of outstanding debt.
5.2 Foreign Participation in Emerging Local Bond Markets
As we noted, the literature’s focus on external bond markets is defendable if foreigners do not
participate in emerging local bond markets. To the contrary, the data indicate that as of end-1997, U.S.
25 Results for overall bond market development – that is, the amount of outstanding bonds denominated in bothlocal and foreign currencies – are qualitatively identical to those presented in Table 7a.
19
investors held a non-trivial amount of local-currency-denominated debt issued by emerging markets.
Between 1997 and 2001, there was a clear flight to quality, although not a blind one: U.S. investors were
discriminating in their flight, considering characteristics such as credit risk and returns volatility when
adjusting their portfolios.
Our analysis suggests that emerging markets can attract global bond investors through enhanced
development of the local market. Local bond market development is greater in countries with lower
historic inflation, so a necessary step is improved performance on the inflation front. The development of
the bond market may even protect against future inflationary episodes. As suggested in Eichengreen and
Hausmann (1999), a well-developed domestic bond market may generate a political constituency opposed
to inflationary policies.
Local bond market development will also lead to the creation of a yield curve, which will enable
global investors to decouple the bond and currency investments. The importance of hedging instruments
is evident in our results: Global bond investors flee volatility, suggesting that from the perspective of the
foreign investor volatility is not properly priced. It is not surprising that local bond markets do not price
bonds to compensate foreigners for exchange rate volatility (which itself may owe to policies in the
investors’ countries). It should be noted that the top half of Figure 1 indicates that the volatility facing
foreign investors is not priced in industrial countries’ local bond markets, either. The well-developed
yield curves in these countries, however, enable the decoupling of bond and currency investments, which
in turn allow industrial countries to attract and maintain some level of foreign participation.
The reader should note that our results indicate that foreigners do not flee volatility in emerging
equity markets. There are at least two possible reasons for this. First, stock market volatility is by no
means restricted to emerging economies. Also, the effect of exchange rate changes on the equity of a firm
that may well derive a substantial portion of its income from abroad is ambiguous.
20
6. Conclusion
Our aim in this paper is to describe and understand country weights in U.S. investors’
international bond portfolios. In doing so we find that important factors include the openness of capital
accounts and potential diversification benefits as given by historical correlations. We fine-tune the
analysis by separating dollar and local currency portfolios and find that for positions in local-currency-
denominated bonds there is a noteworthy emphasis on measures of past and prospective volatility. Our
analysis of portfolio reallocations from 1997 to 2001 reveals a flight to quality—not a blind one, but a
discriminating flight from those countries with poor or declining credit ratings.
To carry out the goal of this paper required measures of the size of bond markets across many
countries. No such measures existed, so another contribution of this paper is our presentation of the size
and currency composition of bond markets across 50 countries. This in itself has implications for a
number of literatures. The empirical literature on finance and growth, which has hitherto excluded bond
market development in its analysis, might begin to include debt markets. Perhaps more important is our
potential contribution to the ‘original sin’ literature, which has focused on bonds placed abroad. Our
analysis of emerging local bond markets suggests a refinement of the original sin hypothesis. The share
of a country’s overall bond issuance that is denominated in its local currency does not differ substantively
between emerging and more developed markets. The legacy of original sin is, rather, that emerging bond
markets are in general much less developed. We find, moreover, that the cause is not a mystery, but
related to policies of the not-so-distant past.
Looking at the trends in the data, we find mixed evidence regarding the prospects for absolution
of original sin. While local-currency-denominated debt in emerging markets, especially in Asia, grew
substantially between 1997 and 2001, U.S. positions in such debt dropped precipitously. The question
going forward is whether this represents a temporary flight to quality or a more permanent change in
preferences. In either case, emerging economies can attract global investors through the development of
21
deeper local bond markets. Local bond market development can, in turn, lead to the creation of a yield
curve and derivative instruments that enable the decoupling of the bond and currency investment.
Finally, some limitations of our study should be noted. In particular, we caution readers that our
currency-specific results may not tell the complete story. For both issuance and portfolios, we know the
currency denomination but not whether the bonds are indexed to inflation or an exchange rate. Thus,
some of the bonds included in our local currency analysis, especially for Latin America, may behave a lot
like foreign-currency securities. On the portfolio side, we do not want to imply that our study speaks to
the currency exposure of U.S. investors. Not knowing the extent of derivatives positions, for example,
makes our snapshot of currency exposure incomplete.
22
References
Ahearne, A., W. Griever, and F. Warnock, forthcoming. “Information Costs and Home Bias: An Analysisof U.S. Holdings of Foreign Equities,” Journal of International Economics.
Ammer, J., 1998. Sovereign Credit Ratings and International Debt Markets. mimeo, Board of Governorsof the Federal Reserve System.
Bayoumi, T., and B. Eichengreen, 1998. Exchange rate volatility and intervention: implications of thetheory of optimum currency areas. Journal of International Economics 45: 191-209.
Bekaert, G., and C. Harvey, 2003. Emerging Market Finance. Journal of Empirical Finance.
Bekaert, G., C. Harvey, and R. Lumsdaine, 2002. The Dynamics of Emerging Market Equity Flows.Journal of International Money and Finance 21, 295-350.
Bohn, H., and L. Tesar, 1996. U.S. Equity Investment in Foreign Markets: Portfolio Rebalancing orReturn Chasing? American Economic Review 86(2), 77-81.
Branson, W. and D. Henderson, 1985. The Specification and Influence of Asset Markets,” in Handbookof International Economics. Vol. 2. Eds.: R. Jones and P. Kenen. Amsterdam, Elsevier Press.
Caballero, R., and A. Krishnamurthy, forthcoming. Excessive Dollar Debt: Financial Development andUnderinsurance. Journal of Finance.
Cantor, R., and F. Packer, 1996. Determinants and Impact of Sovereign Credit Ratings. FRBNY EconomicPolicy Review 37-53.
Chen, N., 1991. Financial Investment Opportunities and the Macroeconomy. Journal of Finance 46(2):529-554.
Cumby, R., and M. Obstfeld, 1981. A note on exchange-rate expectations and nominal interestdifferentials: A test of the Fisher hypothesis. Journal of Finance36(3): 697-703.
Dahlquist, M., L. Pinkowitz, R. Stulz, and R. Williamson, forthcoming. Corporate Governance and theHome Bias. Journal of Financial and Quantitative Analysis.
Devereux, M., and P. Lane, forthcoming. Understanding bilateral exchange rate variability. Journal ofInternational Economics.
Eichengreen, B., and R. Hausmann, 1999. Exchange Rates and Financial Fragility. NBER WP#7418.
Eichengreen, B., R. Hausmann, and U. Panizza, 2002. Original Sin: The Pain, the Mystery, and the Roadto Redemption. Paper Presented at the IADB Conference “Currency and Maturity Matchmaking:Redeeming Debt from Original Sin.”
Falkenstein, E., 1996. Preferences for Stock Characteristics As Revealed by Mutual Fund PortfolioHoldings. Journal of Finance 51(1): 111-135.
Fleming, M., 1962. Domestic Financial Policies Under Fixed and Under Floating Exchange Rates.International Monetary Fund Staff Papers 9: 369-79.

23
Froot, K., P. O’Connell, and M. Seasholes, 2001. The Portfolio Flows of International Investors. Journalof Financial Economics 59: 151-194.
Goldstein, M., 2002. Managed Floating Plus. Institute for International Economics, Washington DC.
Gompers, P., and A. Metrick, 2001. Institutional Investors and Equity Prices. Quarterly Journal ofEconomics (February) 229-259.
Greenspan, A., 1999. Lessons from the Global Crises. Remarks before the World Bank Group andInternational Monetary Fund, Annual Meetings Program of Seminars, Washington, September 27.
Griever, W., G. Lee, and F. Warnock, 2001. The U.S. System for Measuring Cross-Border Investment inSecurities: A Primer with a Discussion of Recent Developments. Federal Reserve Bulletin (October).
Ilmanen, A., 1995. Time-varying expected returns in international bond markets. Journal of Finance 50:481-506.
International Monetary Fund, 2002. Emerging Local Bond Markets. Global Financial Stability Report(September, Chapter 4).
Jeanne, O., 2002. Why do emerging economies borrow in foreign currency? Paper Presented at the IADBConference “Currency and Maturity Matchmaking: Redeeming Debt from Original Sin.”
Jorion, P., 1991. International Bonds: The Asset Class. in R. Aliber and B. Bruce (eds.) Global Portfolios.Homewood, IL: Business One Irwin.
Karolyi, G.A., and R. Stulz, 2002. Are financial assets priced locally or globally? NBER WP#8994.
Keim, D., and R. Stambaugh, 1986. Predicting returns in the stock and bond markets. Journal ofFinancial Economics 17: 357-390.
Lane, P., 2001. “The New Open Economy Macroeconomics: A Survey.” Journal of InternationalEconomics 54(2): 235-266.
Levich, R., 2001. International Financial Markets: Prices and Policies (2nd edition). Boston: McGraw-Hill Irwin.
Levich, R., and L. Thomas, 1993. The merits of active currency risk management: evidence frominternational bond portfolios. Financial Analysts Journal 49(5): 63-70.
Levine, R., 1997. Financial development and economic growth: Views and agenda. Journal of EconomicLiterature 35: 688-726.
Levine, R., and S. Zervos, 1998. Stock markets, banks, and economic growth. American EconomicReview 88(3): 537-588.
Levy, H., and Z. Lerman, 1988. The benefits of international diversification in bonds. Financial AnalystsJournal 44(5): 56-64.
Lewis, K., 1996. “What can explain the apparent lack of international consumption risk sharing?” Journalof Political Economy 104: 267-97.
24
Lewis, K., 1999. “Trying to Explain the Home Bias in Equities and Consumption,” Journal of EconomicLiterature, 37: pp. 571-608.
Lintner, J., 1965. The valuation of risky assets and the selection of risky investment in stock portfolioand capital budgets. Review of Economics and Statistics, 47: 103-124.
McCauley, R., and Remolona, E., 2000. Size and liquidity of government bond markets. BIS QuarterlyReview (November).
Merrill Lynch, 2002. The Size and Structure of the World Bond Market: 2001.
Mihaljek, D., M. Scatigna, and A. Villar, 2002. Recent Trends in Bond Markets. BIS Papers No 11.
Mundell, R., 1963. Capital Mobility and Stabilization Policy Under Fixed and Flexible Exchange Rates.Canadian Journel of Economics 29:475-85.
______, 1968. International Economics. New York: MacMillan.
Obstfeld, M., 1994. “Risk-taking, global diversification and growth.” American Economic Review 85:1310-29.
Obstfeld, M., and K. Rogoff, 1995. “Exchange Rate Dynamics Redux.” Journal of Political Economy103: 624-660.
Perold, A., and E. Shulman, 1988. The free lunch in currency hedging: implications for investmentpolicies and performance standards. Financial Analysts Journal 44(4): 45-50.
Quinn, D., 1997. “The Correlates of Changes in International Financial Regulation,” American PoliticalScience Review, 91: pp. 531-551.
Quinn, D., C. Inclan, and M. Toyoda, 2001. How and where capital account liberalization leads togrowth. Working Paper, Georgetown University.
Rosenberg, M., 1990. Why there is no free lunch in currency hedging. in L. Thomas (ed.) The Currency-Hedging Debate. London: IFR Publishing.
Sharpe, W., 1964. Capital asset prices: A theory of market equilibrium under the condition of risk.Journal of Finance, 19: 425-442.
Tesar, L., and I. Werner, 1995. Home bias and high turnover. Journal of International Money andFinance 14, 467-493.
Thomas, C., and F. Warnock, 2003. International Equity and Bond Portfolios. mimeo, Federal ReserveBoard.
Treasury Department, 1998. Report on Foreign Portfolio Investment in the United States as of December31, 1997.
Warnock, F., and C. Cleaver, forthcoming. Financial Centers and the Geography of Capital Flows.International Finance.
Efficient Frontiers for International Bond Portfolios*
0 1 2 3 4 5 6 7 8 90.0
0.1
0.2
0.3
0.4
0.5
0.6
0.7
Hedged (dashed) and Unhedged (solid), 2001
1998
1993
1988US
ROW
1998
1993
US
ROW
Figure 1
Standard deviationof returns
Ave
rage
mon
thly
ret
urn(
%)
0 1 2 3 4 5 6 7 8 90.0
0.1
0.2
0.3
0.4
0.5
0.6
0.7
Hedged (dashed) and Unhedged (solid) w/ EMBI, 2001
1998
1993
US
ROW
1998
1993
US
ROW
* ROW portfolios are value-weighted and contructed using monthly data from date labeled on each curve to 2001.
25
Standard deviationof returns
Ave
rage
mon
thly
ret
urn(
%)
26
Table 1. Bond Market Development (amount outstanding, end-2001)
Total Local-Currency- Dollar- Denominated Denominated
$bil % of GDP $bil % of total $bil % of total
Euro Area 6,677 109% 5,892 88% 329 5%Japan 4,825 116% 4,761 99% 44 1%UK 1,313 92% 973 74% 195 15%Canada 649 92% 460 71% 149 23%
Latin America 530 30% 248 47% 223 42%(463) (25%) (221) (48%) (206) (44%)
Emerging Asia 1,245 41% 1,099 88% 125 10%(639) (22%) (502) (79%) (108) (17%)
Other 1,301 59% 975 75% 169 13%
Total Foreign 16,541 85% 14,408 87% 1,235 7%(13,605) (68%) (11,832) (87%) (930) (7%)
United States 14,430 142% 14,141 98%(10,364) (125%) (10,228) (99%)
Notes. Data on $-denominated bonds and notes are from security-level data underlying BIS Table 14B(Int'l Bonds and Notes by Country of Residence). Local-currency-denominated debt is the sum of the long-term debt component of BIS Table 16A (Domestic Debt Securities) and the local currency portion of Table14B. Domestic debt for countries not available on Table 16A is from the IMF's Government FinanceStatistics Yearbook and Merrill Lynch (2002). Data in italics and parentheses are for 1997. Total Foreignincludes only the 50 countries in our sample.
27
Table 2. U.S. Holdings of Foreign Bonds (end-1997, $billions and % of outstanding)
Total Local-Currency Dollar Denominated Denominated
Euro Area 115 2% 71 1% 35 15%Japan 30 1% 23 1% 4 6%UK 54 6% 23 3% 26 29%Canada 106 16% 42 10% 56 52%
Latin America 91 20% 6 3% 77 37%(47) (9%)
Emerging Asia 35 5% 2 0% 31 29%(14) (1%)
Other 63 5% 24 2% 32 25%
Total Foreign 494 4% 191 2% 261 28%(457) (3%)
memo: US 8,641 84%(12,020) 83%
Notes. Data for foreign bonds are from the 1997 benchmark survey of U.S. Holdings of Foreign Securities.Total Foreign includes only the 50 countries in our sample. Estimates of U.S. holdings of U.S. bonds areformed by subtracting foreign holdings of U.S. bonds, as estimated in Thomas and Warnock (2003), fromthe amount of U.S. bonds outstanding. Data in parentheses are from the preliminary release of the 2001survey; complete data for 2001 are suppressed until the official data release, scheduled for March 2003.

28
Table 3. Summary Statistics(a) Total Holdings
Mean StandardError
Min Max Nobs t-stat Correlations
BdDev Trade CR CA97 USharpe UVar UMeanBdDev 0.722 0.681 0.121 4.230 48 -0.317Trade 0.107 0.114 0.010 0.544 48 +2.266 -0.09CR 6.521 5.411 1 20 48 +0.912 -0.49 -0.01CA97 3.167 0.839 1.5 4 45 +1.776 0.38 0.03 -0.52USharpe 0.018 0.182 -0.238 0.505 43 +0.828 -0.49 0.01 0.51 -0.61UVar 0.002 0.002 0.000 0.010 43 +0.522 -0.35 -0.07 0.75 -0.17 -0.07UMean 0.004 0.007 -0.017 0.033 43 +0.627 -0.31 0.10 0.33 -0.61 0.86 -0.12UCorr 0.249 0.301 -0.333 0.578 43 -1.714 0.46 -0.13 -0.75 0.54 -0.34 -0.58 -0.48
HSharpe HVar HMeanHSharpe 0.172 0.128 -0.218 0.505 41 -1.044 0.16 -0.07 -0.40 -0.06HVar 0.002 0.003 0.000 0.010 41 +0.675 -0.46 -0.04 0.84 -0.23 -0.68HMean 0.007 0.006 -0.017 0.033 41 +0.071 -0.08 0.06 -0.03 -0.42 0.69 -0.30HCorr 0.331 0.388 -0.333 0.778 41 -1.009 0.52 -0.06 -0.83 0.57 0.36 -0.65 -0.23
Notes: All variables are for 2001 unless noted. U(H) indicates industrial country returns are unhedged (hedged). Returns for emerging markets are based ondollar-denominated bonds comprising the EMBIG indexes. T-stat is the t-statistic from a regression of holdings on the characteristic (and a constant).
29
(b) Dollar Holdings
Mean StandardError
Min Max Nobs t-stat Correlations
BdDev Trade CR CA97 HSharpe HVar HMeanBdDev 0.737 0.700 0.121 4.230 45 +2.135Trade 0.109 0.116 0.010 0.544 45 +1.471 -0.11CR 6.178 5.331 1 20 45 -0.856 -0.48 0.02CA97 3.262 0.783 1.5 4 42 +1.332 0.38 0.00 -0.47HSharpe 0.166 0.119 -0.218 0.475 39 -0.044 -0.22 -0.06 -0.58 0.05HVar 0.002 0.003 0.000 0.010 39 -0.278 -0.44 -0.01 0.83 -0.17 -0.82HMean 0.006 0.005 -0.017 0.010 39 +1.831 0.01 0.17 -0.30 -0.28 0.63 -0.56HCorr 0.361 0.374 -0.256 0.778 39 -0.134 0.51 -0.12 -0.82 0.50 0.54 -0.63 -0.04
H (Hedged) returns are based on EMBI for emerging markets and hedged series for industrial countries. Israel, Pakistan, Russia, Morocco, and Ecuador areomitted because of lack of data. T-stat is the t-statistic from a regression of holdings on the characteristic (and a constant).
(c) Local Currency Holdings
Mean StandardError
Min Max Nobs t-stat Correlations
BdDev Trade CR CA97 IHSharpe IHVar IHMeanBdDev 0.722 0.681 0.121 4.230 48 +1.235Trade 0.107 0.114 0.010 0.544 48 +0.525 -0.09CR 6.521 5.411 1 20 48 -3.047 -0.49 -0.01CA97 3.167 0.839 1.5 4 45 +2.136 0.38 0.03 -0.52IHSharpe 0.089 0.195 -0.406 0.578 41 +1.843 0.40 0.02 -0.57 0.09IHVar 0.003 0.005 0.000 0.023 41 -2.584 -0.43 0.01 0.75 -0.37 -0.51IHMean 0.003 0.010 -0.032 0.042 41 +1.038 0.18 0.10 -0.36 -0.14 0.86 -0.43IHCorr 0.314 0.382 -0.302 0.778 41 +2.900 0.54 -0.09 -0.83 0.61 0.52 -0.65 0.20
IH (Incomplete Hedged) returns series consist of hedged returns for industrial countries and, for emerging markets, returns based on EMBI with exchange ratechanges. Russia and Ecuador are omitted because of lack of data. T-stat is the t-statistic from a regression of holdings on the characteristic (and a constant).
30
Table 4a. Regression Results: Total Holdings(1) (2) (3) (4) (5)
Trade 0.128*
(0.071)0.142*
(0.074)0.086
(0.071)0.086
(0.072)
UCorr -0.075**
(0.031)-0.009(0.020)
HCorr -0.053**
(0.025)0.007
(0.013)
CA97 0.028***
(0.011)0.029**
(0.011)0.004
(0.006)0.007
(0.006)
Doliss 0.206***
(0.037)0.194***
(0.039)0.183***
(0.042)
Adj. R2 0.283 0.257 0.549 0.595 0.603Nobs 43 41 48 41 43Dependent variable is the share of a nation’s bond market held by US investors. Russia and Ecuador areomitted because of lack of data. Newey and West (1987) standard errors are in parentheses. ***, **, and *indicate significance at the 1, 5, and 10 percent levels respectively.
Table 4b. Regression Results: Dollar and Local Currency Holdings$-
denominatedLocal-Currency-
Denominated(1) (2) (3)
Trade 0.323(0.199)
BdDev -0.034(0.032)
Mean 3.995*
(2.268)0.129
(0.123)
CA97 0.035(0.022)
0.006*
(0.003)0.004
(0.003)
IHVar -0.670**
(0.284)0.037
(0.210)
CR -0.001***
(0.0004)
Nobs 39 41 41Adj. R2 0.144 0.063 0.102Dependent variable is the share of a nation’s dollar-denominated debt held by US investors. In columns (1)and (2), mean is HMean and IHMean, respectively. Israel, Pakistan, Russia, Morocco, and Ecuador areomitted because of lack of data. Newey and West (1987) standard errors are in parentheses. ***, **, and *indicate significance at the 1, 5, and 10 percent levels respectively.
31
Table 5. Regression Results: Bond Portfolio Reallocations
(1) (2) (3) (4) (5) (6) (7) (8)
BdDev97 0.042*
(0.021)0.062***
(0.020)0.040**
(0.020)
0.049***
(0.019) 0.045**
(0.020) 0.062***
(0.019)
DBdDev -0.005(0.011)
0.020(0.032)
-0.004(0.012)
0.020(0.031)
-0.004(0.011)
0.017(0.032)
CR97 -0.005**
(0.002)-0.004(0.004)
-0.005*
(0.002)
DCR -0.011***
(0.004) -0.011**
(0.004) -0.010**
(0.004)HVar01 -14.36***
(3.82) -12.86***
(4.89) -12.86***
(4.46)
LDC -0.082***
(0.019)-0.010(0.036)
-0.019(0.024)
Deqhold 0.515***
(0.167)0.137
(0.156)0.156
(0.138)
Nobs 43 39 43 43 39 43 43 39Adj. R2 0.419 0.454 0.314 0.404 0.446 0.111 0.411 0.449
Dependent variable is the change in share of a nation’s bond market (net of price effects) held by U.S.investors. Russia, Ecuador, Venezuela, amd Uruguay are omitted because of a lack of data. Newey andWest (1987) standard errors are in parentheses. ***, **, and * indicate significance at the 1, 5, and 10percent levels respectively.
32
Table 6. Regression Results: Equity Portfolio Reallocations
Bivariate Multivariate(1) (2) (3) (4) (5) (6)
EqDev97 0.032***
(0.012)0.020*
(0.012)0.020*
(0.011)0.021*
(0.011) 0.020*
(0.011) 0.021*
(0.011)
CR97 -0.004***
(0.001)-0.002*
(0.001)-0.003(0.002)
-0.004**
(0.002)-0.001(0.001)
-0.002(0.001)
DCR -0.008*
(0.004)-0.008*
(0.005) -0.007*
(0.004)
Sharpe01 0.204***
(0.059)0.168**
(0.077)0.170**
(0.079)0.136*
(0.078)
Mean01 2.061***
(0.537)
Var01 -0.613(0.471)
LDC -0.033**
(0.013)0.004
(0.019)0.021
(0.022)
Dbondhold 0.262**
(0.133)0.142
(0.139)0.043
(0.109)
Nobs n.a. 49 49 49 45 45Adj. R2 n.a. 0.179 0.161 0.224 0.164 0.204
Dependent variable is the change in share of a nation’s equity market held by US investors. Column (1)presents estimates from separate bivariate regressions, except for the DCR row, which also includes theinitial value (CR97). Newey and West (1987) standard errors are in parentheses. ***, **, and * indicatesignificance at the 1, 5, and 10 percent levels respectively.
33
Table 7a. Local Currency Bond Market Developmenta
(1) (2) (3) (4) (5) (6)Inflation –Variance
-2.441***
(0.471)-1.280***
(0.380)
Inflation –Mean
-2.476***
(0.717)-1.078***
(0.320)
GDP PerCapita
0.446***
(0.114)0.429***
(0.133)0.410***
(0.134)
GDP 0.044(0.077)
0.012(0.067)
0.011(0.066)
TradeOpenness
Adj. R2 0.017 0.071 0.319 -0.008 0.299 0.305Nobs 49 49 49 49 49 49a Dependent variable is the size a nation’s local-currency-denominated bond market (excluding central bankholdings) divided by GDP.
Table 7b. Share of Outstanding Bonds Denominated in Local Currency(1) (2) (3) (4) (5) (6)
Inflation –Variance
-2.550***
(0.173)-2.708***
(0.192)
Inflation –Mean
-1.888***
(0.247)-2.000***
(0.245)
GDP PerCapita
0.052(0.052)
0.004(0.040)
-0.027(0.038)
GDP 0.057***
(0.020)0.064***
(0.019)0.060***
(0.017)
TradeOpenness
Adj. R2 0.186 0.247 0.002 0.089 0.293 0.338Nobs 49 49 49 49 49 49
Notes. In Tables 7a and 7b, Pakistan and Ecuador were dropped due to lack of data. Newey and West(1987) standard errors are in parentheses. ***, **, and * indicate significance at the 1, 5, and 10 percentlevels respectively.
34
Table 8a. Local Currency Bond Market Developmenta (excluding outliers)(1) (2) (3) (4) (5) (6)
Inflation –Variance
-328***
(70)-155***
(45.2)
Inflation –Mean
-12.7***
(2.93)-5.893***
(1.812)
GDP PerCapita
0.338***
(0.068)0.229***
(0.062)0.225***
(0.059)
GDP 0.121***
(0.042)0.076**
(0.032)0.072**
(0.033)
TradeOpenness
Adj. R2 0.217 0.243 0.299 0.144 0.385 0.385Nobs 45 45 45 45 45 45a Dependent variable is the size a nation’s local-currency-denominated bond market (excluding central bankholdings) divided by GDP.
Table 8b. Share of Outstanding Bonds Denominated in Local Currency (excluding outliers)(1) (2) (3) (4) (5) (6)
Inflation –Variance
-152**
(75.4)-160**
(72.8)
Inflation –Mean
-6.33***
(1.84)-6.856***
(1.922)
GDP PerCapita
0.033(0.051)
-0.069(0.045)
-0.083*
(0.045)
GDP 0.067***
(0.021)0.058**
(0.015)0.053***
(0.013)
TradeOpenness
Adj. R2 0.155 0.203 -0.013 0.152 0.260 0.301Nobs 45 45 45 45 45 45
Notes. In Tables 8a and 8b, in addition to Pakistan and Ecuador (lack of data), we drop three inflationoutliers (Russia, Brazil, and Turkey) and one bond market development outlier (Luxembourg). Newey andWest (1987) standard errors are in parentheses. ***, **, and * indicate significance at the 1, 5, and 10percent levels respectively.