Embed Size (px)
Citation preview

Board of Governors of the Federal Reserve System
International Finance Discussion Papers
Number 770
July 2003
Cross-Border Listings, Capital Controls, and Equity Flows to Emerging Markets
Hali J. Edison and Francis E. Warnock
NOTE: International Finance Discussion Papers are preliminary materials circulated to stimulatediscussion and critical comment. References in publications to International Finance Discussion Papers(other than an acknowledgment that the writer has had access to unpublished material) should be clearedwith the author or authors. Recent IFDPs are available on the Web at www.federalreserve.gov/pubs/ifdp/.
Cross-Border Listings, Capital Controls, and Equity Flows to Emerging Markets
Hali J. Edison and Francis E. Warnock*
Abstract:We analyze capital flows to emerging markets in a framework that incorporates two quantitativemeasures of financial integration, the intensity of capital controls and the extent of cross-border listings, whilecontrolling for traditional global (push) and country-specific (pull) factors. Two important results emerge.First, the cross-listing of an emerging market firm on a U.S. exchange is an important but short-lived capitalflows event, suggesting that the cross-listed stock is in effect a new security that U.S. investors quickly bringinto their portfolios. Second, the effect of financial liberalization on capital flows is more nuanced than issuggested by event studies: A reduction in capital controls results in increased inflows only when the controlswere binding. Among the standard push and pull factors, global factors are important—slack U.S. economicactivity is associated with increased flows to emerging markets—and U.S. investors appear to chase expected,but not past, returns.
Keywords: portfolio equity flows, capital flows, emerging markets, ADRsJEL Classification: G11, G15, F3
* The authors are, respectively, Senior Economist in the Research Department of the IMF and Economist inthe International Finance Division of the Board of Governors of the Federal Reserve System. The authorsthank for helpful comments and suggestions Campbell Harvey, Jean Imbs, Assaf Razin, Leigh Riddick,Jonathan Wright, and participants at the following conferences and seminars: CEPR/London Business SchoolConference on International Capital Flows, Kellogg School of Management Conference on Investments inImperfect Capital Markets, International Finance Division’s Monday Workshop, Federal Reserve Bank ofNew York, University of Sydney, Washington Area Finance Association, Western Economic Association,and World Bank. We also thank Jean Tobin at the NYSE for data on listings of foreign stocks; Alka Banerjeeof Standard and Poor’s for helping us with the S&P/IFC data; and Nancy Baer, Sara Holland, and Ben Suttonfor research assistance. The views in this paper are solely the responsibility of the authors and should not beinterpreted as reflecting the views of the Board of Governors of the Federal Reserve System or theInternational Monetary Fund, or of any other person associated with the Federal Reserve System or the IMF.email: [email protected], [email protected]

1. Introduction
International capital flows have skyrocketed over the past decade. Net private capital flows
to emerging market countries tripled from $50 billion a year during 1987-89 to more than $150
billion a year over 1995-97. These flows, however, receded somewhat with the 1997-99 financial
crises that spread from Asia to Russia and on to Latin America. During much of this period
policymakers in emerging markets have been confronted with the challenges posed by capital
inflows and, more recently, the concern of the impact of dramatic reversals. Although countries
have shared increases in capital flows, there has also been considerable variation among countries
in the timing, duration, and magnitude of these flows and their reversals.
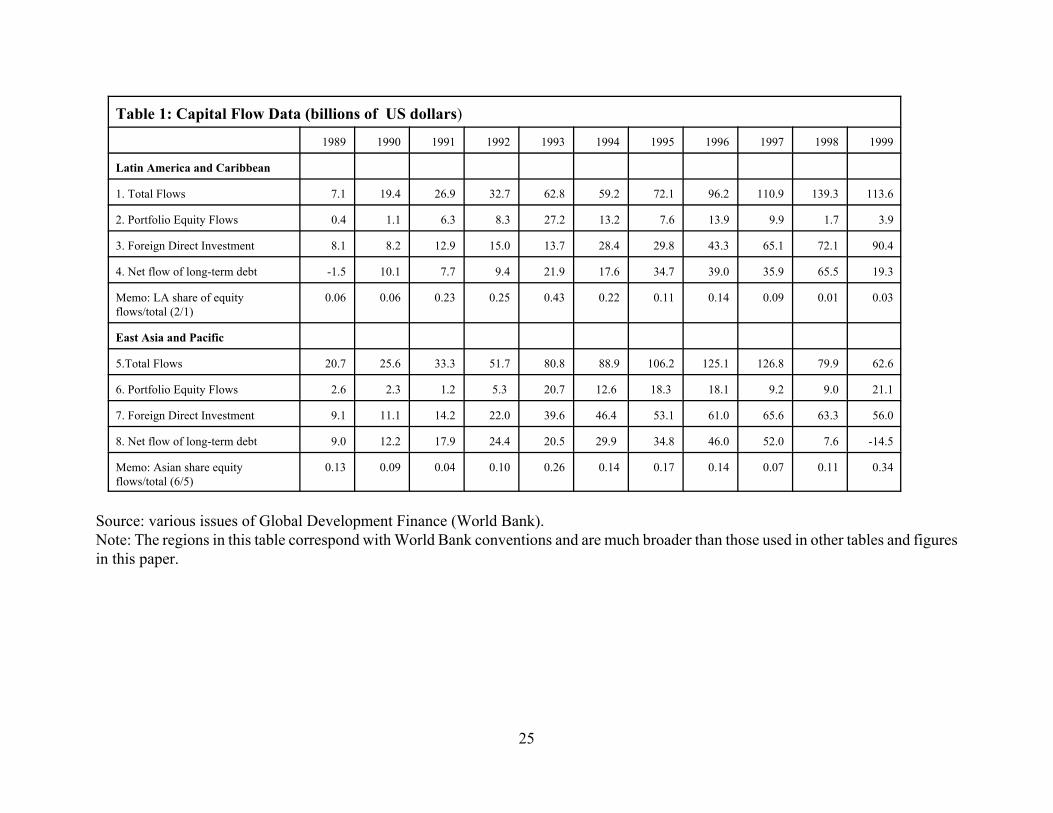
Table 1 presents data on private capital flows to Latin America and Asia. Portfolio equity
flows are usually smaller than direct investment or bond flows, but their share can be quite volatile.
In both Latin America and emerging Asia, the share of equity inflows increased in the early 1990s
and peaked in 1993. By 1998, equity flows had all but dried up in Latin America, but were
somewhat more resilient in Asia; in 1999 equities represented 34 percent of net inflows into Asia.
The goal of this paper is to explain the factors motivating the relatively volatile portfolio
equity flows that appear in Table 1. To do so we synthesize two strands of the international finance
literature: (i) analysis of international financial integration represented by two factors, the degree
of international financial liberalization and the wave of cross-border equity listings, and (ii) push-
pull analysis of capital flows that investigates the roles of global factors beyond the control of
emerging economies (push factors) and local economic conditions and policies (pull factors).
We extend the capital flows literature by analyzing the role of two integration variables: an
explicit quantitative measure of the intensity of capital controls and a measure of the extent of cross-
border listings. Capital controls are explicitly addressed in the capital flows studies of Montiel and
Reinhart (1999), who analyze annual flows and model capital controls as a (0, 1, 2) variable, and
Bekaert, Harvey, and Lumsdaine (2002), who model capital controls as a zero-one dummy variable
based on the date of the initial opening of a market to foreign investment. We use the Edison and
Warnock (2003a) capital controls measure, which captures not only the date of the initial opening
of a market, but also the extent of that opening and the evolution and intensity of subsequent
changes in controls. Based on this measure, our results suggest that the relaxation of binding capital
controls leads to increased inflows, consistent with the event study findings of Bekaert, Harvey, and
Lumsdaine (2002) and Edison and Warnock (2003a). Our results do not, however, imply that every
loosening of capital controls will spark inflows; for example, the easing of non-binding capital

1 For papers on securities migration, see Claessens, Klingebiel, and Schmukler (2002), Karolyi(2003), and Pulatkonak and Sofianos (1999).
2 The view that an equity newly listed on a U.S. exchange is in effect a new security consistentwith the evidence of divergent behavior of owners of Mexican local and cross-listed firms (Tribukait,2003) and abnormal returns in the run-up to the listing (Foerster and Karolyi, 1999).
3 Chuhan, Claessens, and Mamingi (1998) found that push factors—the decrease in U.S. interestrates and the slowdown in U.S. industrial production—help explain flows to both Latin American andemerging Asian countries from 1988 to 1992, and that pull factors such as equity returns or credit ratingsmatter for flows to Asia but not necessarily for Latin American flows. Calvo, Leiderman, and Reinhart(1993) also find evidence of an important role for global factors.
4 The evidence on past-returns-chasing behavior is mixed. Using monthly data, Bohn and Tesar(1996) find that investors chase past returns in 7 of 22 markets. The literature that focuses on informationasymmetries using high frequency flows provides conflicting evidence; see, for example, Dvorak (2002),
2
controls by some East Asian countries during the financial crisis of 1997 did not immediately result
in increased inflows.
Our second integration variable measures the extent of cross-border listings, or securities
migration, from developing to industrial country markets. The analysis of cross-border listings is
important because it is an open question whether access to global investors is generally available
to emerging markets or limited to those firms that go through the process of listing on developed
country exchanges.1 While we cannot directly answer this question with our data set—firm-level
capital flows data are required—we can address it indirectly by analyzing the effect of cross-border
listings on capital flows. We find that international financing does appear to be limited in time and
scope to the cross-listing event. The cross-listing results in an immediate surge in capital inflows,
but with little if any follow through, suggesting that an equity newly listed on a U.S. exchange is in
effect a new security that is quickly incorporated into U.S. portfolios. All of these stocks were
available to U.S. investors prior to the cross-listing, so it is natural to ask why they should be treated
as new securities. A plausible answer is that the information content inherent in U.S. investor
protection regulations (or IPRs)—which includes reconciliation to U.S. GAAP and adherence to the
SEC’s disclosure requirements and securities laws—transforms the existing security.2
While our analysis of the effects of capital controls and cross-border listings provides novel
results, in line with previous research we find important roles for global “push” factors, such as U.S.
economic activity and U.S. interest rates.3 We also find evidence that investors are chasing
prospective returns, as proxied by dividend yields, but not past returns.4 Thus, our empirical results

Choe, Kho, and Stulz (2001), and Seasholes (2000).
3
tell the following story: Emerging markets experience increased inflows when U.S. economic
activity is weak (and hence profit prospects for U.S. firms are weak), U.S. interest rates are low
(causing investors to seek higher returns, but also reducing emerging market borrowing costs),
binding capital controls are relaxed, prospective returns increase, and, most importantly, when
individual equities are cross-listed.
The paper is organized as follows. The next section highlights the modeling framework we
employ, discusses the role of cross-border equity listings in equity flows, and describes our capital
controls variable and the data used in the empirical analysis. Section 3 presents our single-country
and panel regression results along with robustness checks. Section 4 contains concluding remarks.
2. The Modeling Framework and Data
We augment a standard asset pricing/capital flows model with integration variables that
capture the intensity of both capital controls and cross-border listings. In a standard framework of
capital flows in a capital asset pricing setting, as in Bohn and Tesar (1996) and Chuhan et al. (1998),
the desired portfolio weights at time t for assets in N countries is
(1)
where p is an Nx1 vector of portfolio shares, ( is a risk aversion parameter, < is an Nx1 vector of
expected excess returns, S is the NxN covariance matrix of expected returns, and 0 is the component
of portfolio unrelated to returns. With time-varying expected returns and heterogenous investors,
the portfolio weights in (1) will change and net equity flows will occur.
In the remainder of this section, we describe the flows data and our explanatory variables in
greater detail.
2.1 Bilateral Equity Flows – A Short Primer
The capital flows data we analyze are monthly portfolio equity flows from the United States
to emerging market countries, compiled by the U.S. Treasury International Capital (TIC) Reporting

5 Griever, Lee, and Warnock (2001) is a primer on the TIC data, which have been used in Tesarand Werner (1994), Brennan and Cao (1997), Taylor and Sarno (1997), Chuhan et al. (1998), and Bekaertet al. (2002). Other sources on capital flows data exist. Global (not bilateral) flows are available from theIMF’S International Financial Statistics database, but not for all countries and typically only annually orat best quarterly. High frequency capital flows data are available from proprietary sources, although it isdifficult to gauge the scope of their coverage. Froot, O’Connell, Seasholes (2001) use proprietary datathat include only transactions by State Street clients for which the countries of the currency and theforeign equity are the same. This excludes trading in ADRs, which are likely a large and variable portionof cross-border trading (Pulatkonak and Sofianos, 1999; Ahearne, Griever, and Warnock, forthcoming). Our data include transactions in ADRs. High frequency flows over short periods have also been analyzedby Richards (2002) and Griffin, Nadari, and Stulz (2002).
4
System.5 U.S. net purchases of securities in a given country are defined as gross purchases of
foreign securities by U.S. residents from residents of that country minus gross sales of foreign
securities from U.S. residents to residents of that country.
Figure 1 gives a sense of the nature of the monthly capital flow data and illustrates three
facts. First, U.S. investors “discovered” Latin American equity markets in the early 1990s, but did
not begin to invest in Asian emerging markets until a few years later. Second, the effects of two
crises are evident. The Mexican crisis of 1994 coincided with a prolonged period of relatively small
inflows to Latin America, but only a brief pause in flows to Asia. In contrast, the effects of the
Asian financial crisis of 1997/1998 appear to be greater in Latin American countries, which saw
U.S. investors sell their equities on net, than in Asia, where equity purchases by U.S. investors only
slowed. Finally, the figures highlight a feature of the flow data that any modeling approach must
address, the lumpiness in equity purchases that appears as large spikes in the data. We aim to model
the spikes, but also smooth the data by estimating long-horizon regressions.
There are three aspects of the monthly TIC data that can confound the analysis of capital
flows: coverage is limited to flows that involve U.S. residents, trades through third countries result
in a geographical bias in bilateral flows data, and equity financing of cross-border mergers makes
it increasingly difficult to analyze equity flows. In the remainder of this section, we consider the
effects of these three issues on our sample.
2.1.1 Coverage is Limited to U.S. Investors
The TIC data are bilateral portfolio flows into and out of the United States and, hence, do
not include other countries’ investments in emerging markets. The ideal data for a study of capital
flows is a world matrix of flows at the highest frequency possible, with the i,j element giving the net
5
flow from country i into country j’s securities. Unfortunately, such a data set does not exist, as very
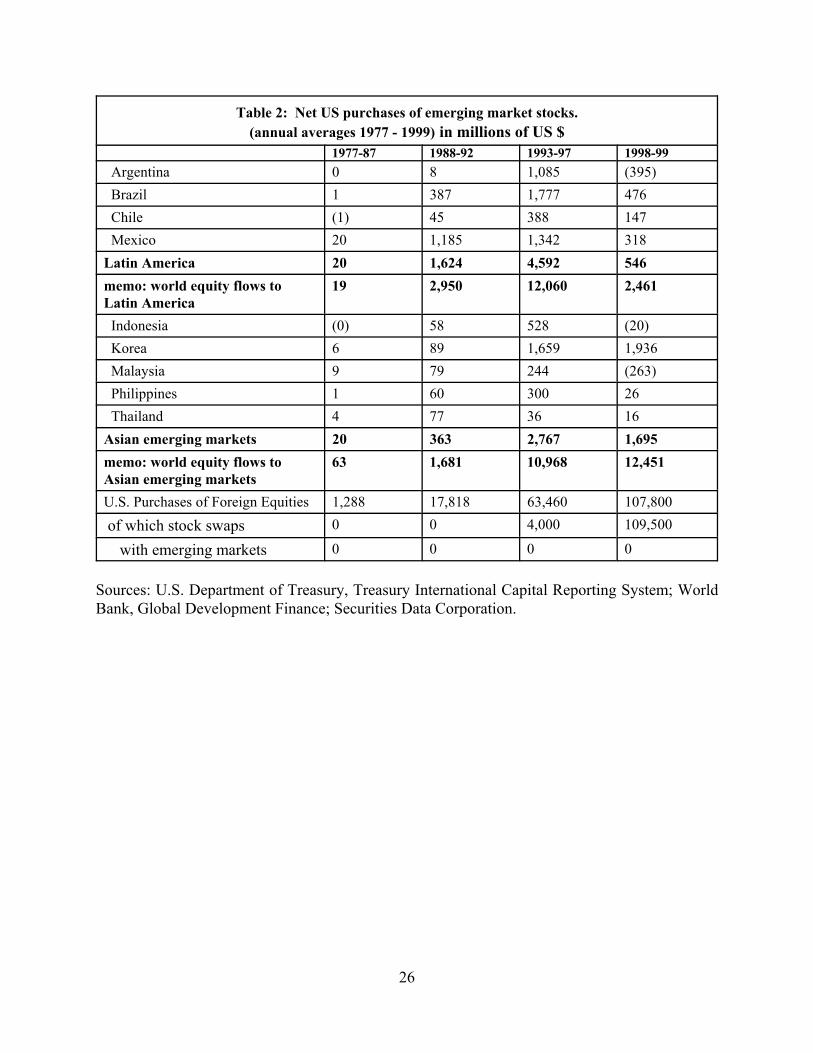
few countries collect bilateral capital flows data. As Table 2 implies, equity flows from other
countries are also important—the share of U.S. to global flows to these regions ranges from 15 to
50 percent—but since so few countries collect bilateral capital flows data, we cannot expect much
better coverage than the TIC data.
2.1.2 Trades through Third Countries
A strong but common assumption—that the countries of the foreign intermediary and foreign
issuer are identical—must be made when using transactions-based capital flows data. It is by now
well understood that capital flows data collected for balance of payments purposes are based on the
country of the foreign intermediary, which is not necessarily the country in which the issuer of the
foreign security resides. The common assumption that the countries of the intermediary and issuer
are the same is clearly is not true for trades through financial centers, which skew the geography of
capital flows (Warnock and Cleaver, 2003).
To determine whether the TIC data for the countries in our sample are accurate, following
Warnock and Cleaver (2003) we use the flows data to estimate positions and compare the estimated
position to a measured amount from a benchmark survey (Figure 2). While there are many other
variables that go into the calculation of the estimates—for example, valuation
adjustments—egregious discrepancies between the estimate and the survey amount suggest
problems with the country attribution of the capital flows data. As can be seen in the figure, with
the possible exception of Brazil, the TIC flows data appear to be rather accurate for these countries,
especially given the large valuation changes associated with the Asian crisis.
2.1.3 Merger-Related Stock Swaps
Cross-border mergers and acquisitions have increasingly been financed by “stock swaps”
whereby shareholders of the target company receive shares in the new (or existing) foreign
company. For example, when Daimler acquired Chrysler, shares of Chrysler were “swapped” for
Daimler Chrysler shares. Such acquisitions are not included in the TIC data, but any “flowback”

6 Consider, for example, three strategies that were available to Chrysler shareholders who werecontent with the share of foreign equities in their portfolios prior to the swap. They could have soldChrysler after the merger was announced but before it occurred, which would have no confounding effecton capital flows data. If they decided that Daimler Chrysler was a better way to get exposure to Germanythan other German equities, they might have rebalanced their portfolios by selling other German stocksbefore or after the swap. Such sales would appear in the TIC data, so the swap should be added to theflows data as a purchase. Finally, they could have sold Daimler Chrysler after the swap, which wouldalso appear as sales in the TIC data; again, the swap should be entered as a purchase.
7 In this paper, as is customary in the international finance literature, we typically use the termfinancial liberalization when international financial liberalization (i.e., the opening of capital markets toforeigners or a reduction in capital controls) would be more appropriate. For a discussion of the linkbetween domestic and international financial liberalization, see Levine (2001).
6
is.6 This has a greater impact on studies of industrial country capital flows, such as flows opposite
Germany or the United Kingdom, because of the large Daimler Chrysler and BP Amoco mergers.
The bottom line of Table 2 shows, however, that stock swaps do not affect our emerging markets
sample.
2.2 International Financial Integration
In this subsection we discuss two new variables that we use to capture financial integration,
a capital controls variable and a measure of cross-listings.
2.2.1 Capital Controls
Many countries opened their financial markets to foreign investment to various degrees
during our sample period. In the model of Bacchetta and van Wincoop (2000), integration with
world financial markets results in a sharp increase in capital inflows (as global investors include the
country’s equities in their portfolios) that eventually levels out after portfolios have been rebalanced.
The first part of this process—the post-liberalization increase in inflows—has been documented in
Bekaert et al. (2002) and Edison and Warnock (2003a).
That countries experience inflows when they open their financial markets should not come
as a surprise. The liberalization process, however, is not a one-time event that is uniform across
countries. Financial liberalizations vary greatly in their extent (full or incomplete) and evolution
(one-time event or gradual).7 To capture this we use the monthly the monthly measure of the

8 Other measures of capital controls exist, but are annual or do not capture the intensity ofcontrols. See, for example, Alesina, Grilli and Milesi-Ferretti (1994), Quinn (1997), Rodrik (1998),Montiel and Reinhart (1999), and the survey by Eichengreen (2001).
9 If, for example, bank stocks are not available to foreigners, a pure banking sector shock wouldchange the relative price of investable stocks and, hence, change relative market capitalizations.
7
intensity of capital controls developed in Edison and Warnock (2003a).8 The measure uses the fact
that the International Finance Corporation’s Global Index (IFCG) is designed to capture the entire
market and an individual stock’s weight in the Investable Index (IFCI) is determined mainly by legal
restrictions. Thus, the ratio of the market capitalizations behind the IFCI and IFCG is an indication
of a country’s openness, and the following formula provides a measure of the intensity of foreign
ownership restrictions:
(2)
where P denotes the price indices and MC denotes the market capitalization of the index. Deflating
by the price indices eliminates relative market capitalization changes that might arise from
asymmetric shocks to investable and global stocks.9 The measure is narrow in that it focuses on just
one component of capital controls, although an appropriate one for modeling equity flows.
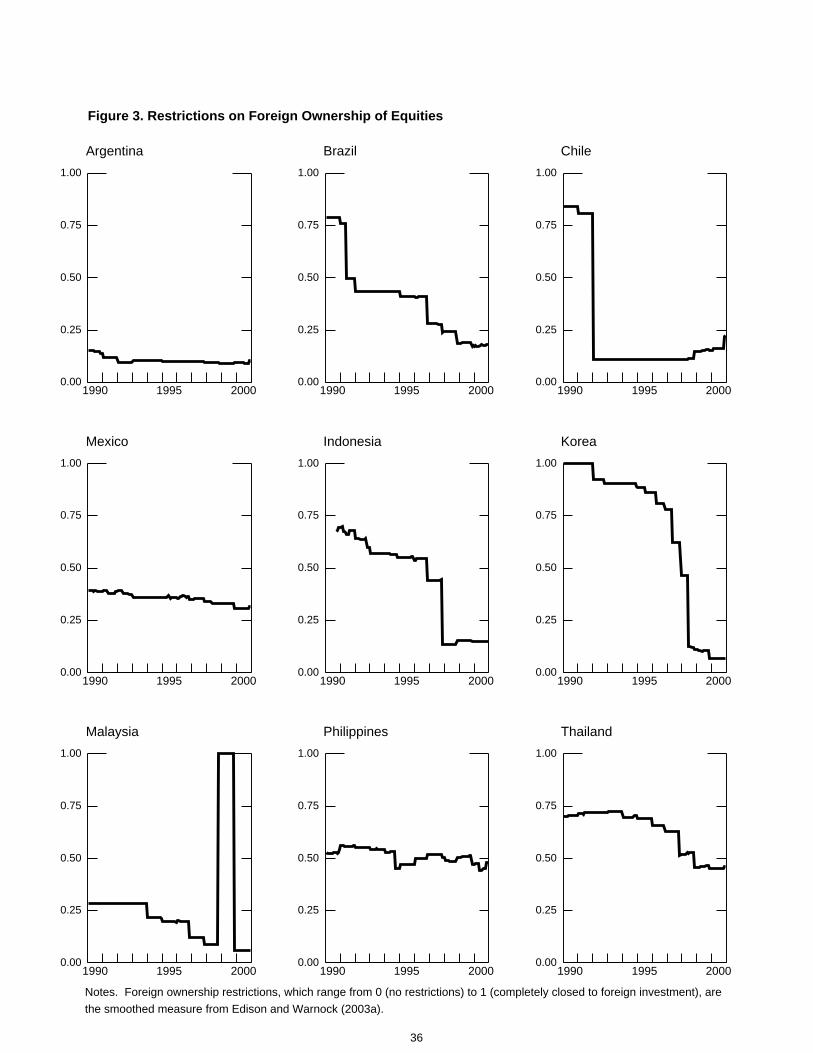
Figure 3 shows the measure of foreign ownership restrictions from 1989 through 2000 for
the nine countries in our sample. FOR can vary from zero to one, with zero representing a
completely open market with no restrictions, and a value of one indicating that the market is
completely closed. The figures underscore regional differences in initial liberalizations and the
evolution of the liberalization process. Latin American economies liberalized much earlier and more
completely than emerging Asia, where the liberalization process was more gradual. This echos the
intuition in Bacchetta and van Wincoop (2000) and Bekaert and Harvey (1995) and begs the
following question: What is the effect on inflows of a marginal liberalization?
In theory the likely effect of changes in capital controls on U.S. equity investment in
emerging markets is straightforward—a loosening of controls should expand the investment
opportunity set and result in increased purchases. In practice, the effect is ambiguous. For example,

10 Studies of cross-listing behavior include Karolyi (1998), Pagano, Roell, and Zechner (2002),Lins, Strickland, and Zenner (2000), and Claessens, Klingebiel, and Schmukler (2002).
11 In U.S. capital flows data, ADRs are treated just as any other foreign stock. Transactionsbetween a U.S. resident and a foreign resident are recorded, while those between two foreign or twodomestic parties are not.
8
if binding foreign ownership restrictions (such as when a market is completely closed) are relaxed,
we would expect increased net purchases. However, if foreign ownership restrictions are non-
binding—such as during a financial crisis when capital flows dry up—a relaxation might not result
in increased inflows.
2.2.2 Cross-Border Listings
A further complicating factor in analyzing capital flows to emerging markets is the wave of
cross-border listings of equities, which began in earnest in the 1990s. On U.S. exchanges, the stock
can be directly listed, but the usual vehicle is a listing through a Level II or Level III ADR. The
potential advantages of listing on a U.S. exchange include an enlarged investor base, increased
visibility, a highly liquid secondary market, and the opportunity to raise new capital.10 From the
investor’s perspective, the cross-listing mitigates some of the uncertainties and costs involved with
making direct purchases in foreign markets. Investing directly in a foreign market involves not only
higher transaction costs and a greater likelihood of failed trades, but also potentially poor financial
information that owes to varied accounting practices, disclosure requirements, and enforcement.
All of these costs—direct and informational—are likely alleviated when a foreign firm lists on a
U.S. exchange. Indeed, compared to firms that are only available on home exchanges, cross-listed
firms have higher valuations (Doidge, Karolyi, and Stulz, forthcoming); more accurate analyst
forecasts (Lang, Lins, and Miller, forthcoming); and less evidence of insider trading (Tribukait,
2003). Moreover, Edison and Warnock (2003b) show that U.S. investors are more likely to hold a
foreign stock that is listed on a U.S. exchange.
The improvement in the quality of financial information associated with the listing leads us
to think of a cross-border listing as a new security, whether or not it is an IPO. Standard portfolio
theory suggests that when a new security becomes available, investors will immediately include it
in their portfolios at the desired weight. The likely effect on equity flows data is clear: At the time
of the listing, equity flows should exhibit a sharp increase.11 An interesting empirical question is

12 Foreign securities that trade only as private placements (through rule 144A) or over the counter(Level I and unsponsored) may have reduced transaction costs compared to securities that trade only inemerging markets, because the need to hire a global custodian in the local market is circumvented andliquidity may be better in New York.
13 Because international securities transactions are reported to the TIC system using settlementdate accounting, we move to the following month any listing that occurs in the last three business days ofa month (last five days of the month for listings prior to June 1995).
14 Figure 4a and 4b do not give an indication of the portion of each country’s market listed onU.S. exchanges at a point in time. By the end of 1999, stocks representing about half of the Mexican,Argentinian, Chilean, Korean and Philippine markets, and about one quarter of the Brazilian andIndonesian markets, were cross-listed on the NYSE and NASDAQ.
9
whether the increase persists or is temporary. That is, is the international financing associated with
a cross-listing ongoing or a one-time event?
Our cross-border listing variable, CBL, includes equities that are listed on U.S. exchanges
either directly or as exchange-traded (or Levels II and III) ADRs, because these are the only foreign
securities that are subject to the SEC’s stringent disclosure and reconciliation requirements.12 CBL
is the share of a country’s stock market that is newly listed on a U.S. exchange in a given month.
For example, BAESA was 2.3% of the Argentinian market when it listed on the NYSE in May 1993;
in that month, CBL is 0.023 for Argentina. Figures 4a and 4b illustrate the timing of U.S. listings;
the size and dates of cross-listings are presented in Appendix B.13 Latin American cross-listings
came in waves; they began in the early 1990s, surged in 1993 and 1994, slowed with the Peso crisis
of December 1994, and picked up by 1997 only to slow again with the Asian financial crisis. In
contrast, Asian cross-listings were much more muted, occurring primarily in the mid-1990s, when
large public utilities from Korea, Indonesia, and the Philippines listed on the NYSE. Moreover, no
firms from Malaysia or Thailand listed on a U.S. exchange in our entire sample period. Finally, the
effect of the Asian financial crisis is clear in Figure 4b; no firm from emerging Asia listed on a U.S.
exchange between the fall of 1997 and mid-1999, and then only Korean ones.14
2.3 Proxies for Expected Risk and Return: The Standard Push and Pull Factors
Net equity inflows into emerging markets should be related to changes in expected risk and
return. No direct measures of expected risk and return are available, so we follow the literature and
rely on proxies—the so-called global “push” and country-specific “pull” factors.

15 Credit spreads on secondary market debt prices are another indicator of investment prospects,but are not available for a wide range of countries and, where available, start only in the early 1990s.
10
We include two country-specific factors that capture past and prospective returns. As in
Bekaert et al. (2002), we include lagged excess returns (excess of the foreign market over the U.S.
market) to capture returns-chasing or positive feedback trading. For expected returns, we use the
dividend-price ratio, or dividend yield, which has been shown to have forecasting power for returns
(Fama and French, 1988; Campbell and Shiller, 1988; Harvey, 1995). If U.S. investors chase past
(prospective) returns, an increase in past returns (dividend yields) should be associated with
increased capital inflows. Regional aggregates illustrate that returns and dividend yields have been
much more volatile in Latin America than in emerging Asia (Figure 5).
For a risk measure we use the log of the International Country Risk Guide’s (ICRG)
Composite Index, which Erb, Harvey, and Viskanta (1996) show to have predicted power for
expected returns.15 The ICRG rating is such that a higher number indicates less risk, so we expect
higher ICRG risk ratings (that is, lower risk) to be associated with higher equity inflows.
The global factors that we consider are U.S. interest rates and the deviation from trend
growth in U.S. industrial production. As U.S. interest rates increase, so does U.S. investors’ risk-
free rate of return; for constant relative returns, foreign investment becomes less attractive and lower
cross-border net purchases are likely. An increase in U.S. interest rates also increases borrowing
costs for emerging markets, thereby reducing expected profits. Stronger economic activity in the
U.S. points toward higher future profits for U.S. firms and, hence, less equity investment abroad;
counteracting this, however, may be a wealth effect that prompts U.S. investors to invest more.
The work of Calvo et al. (1993) told us that low interest rates and slack economic activity
in the United States coincides with greater capital flows to emerging markets. Our somewhat longer
sample, however, suggests that this result should be revisited. To be sure, a comparison of Figures
6 and 1 shows that the initial surge in equity flows to Latin America coincided with falling U.S.
interest rates and below-trend U.S. economic activity. Faced with these conditions, U.S. investors
ventured abroad and Latin America, particularly Mexico, saw inflows increase substantially. And
increasing U.S. interest rates in 1994 coincided with a substantial slowdown in flows to Latin
America, as predicted by the evidence in Calvo et al. (1993). However, at the same time flows to

11
Asia were quite strong and flows did not increase to either region in late 1998 when U.S. rates
decreased sharply, suggesting that a re-examination of the role of push factors is warranted.
3. Empirical Results
We estimate regional (fixed effects) panel regressions and, to determine the extent that
factors significant for flows to the regions are also important for individual countries, single-
equation country-level regressions. In our regressions, all explanatory variables are dated at month
t, except CBL t+1. The dependent variable is (average) monthly equity inflows from month t+1 to
month t+k scaled by local market capitalization, where k=12 (long-horizon 12-month ahead flows)
or k=1 (short-horizon one-month ahead flows). In particular, we estimate equations for , net U.S.
purchases of stocks in country i scaled by country i’s market capitalization, of the following form:
(3)
where the country-specific variables for country i are
period t ICRG Composite Risk Index (logged)
period t returns relative to returns on S&P500
period t dividend yield
new exchange-traded cross-border listing in period t + 1
(as a share of the foreign market capitalization)
FOR t period t foreign ownership restrictions
and for all countries the U.S. factors are
period t deviation of U.S. industrial production from a linear trend
period t interest rate on a 10-year U.S. Treasury bond

16 Long-horizon regressions are often used when modeling stocks returns; see the discussion inCampbell, Lo and MacKinlay (1997). Note that the long-horizon regressions impose an overlappingstructure on the data that induces correlation in the errors. To correct for this autocorrelation—which for12-month ahead regressions cannot be of order greater than eleven—we use Newey and West (1987)standard errors that effectively widen traditional standard errors on persistent explanatory variables.
12
Based on the discussion in the previous section, we expect the coefficients on RET, DY, RISK, and
CBL to be positive; USIP and USBOND to be negative; and FOR to be positive or negative
depending on the environment in which capital controls were adjusted. Summary statistics for our
dependent variables are presented in Table 3.
We estimate long-horizon regressions for two reasons. First, long-horizon regressions
alleviate endogeneity issues. Whereas past or current equity flows may well influence governments’
decisions to adjust capital controls or firms’ decisions to cross-list on foreign stock exchanges, it is
less likely that the decisions to cross-list or adjust capital controls today are influenced by flows over
the subsequent twelve months. Second, long horizons effectively smooth the very volatile data on
net purchases without aggregating and discarding information.16
3.1 Results from Long-Horizon Regressions
The effects of U.S. factors, standard local factors, the intensity of capital controls, and cross-
border listings on 12-month ahead equity flows are shown in the regional panel results reported in
Table 4. The table shows results over the January 1989 to December 1999 period for Latin America
and emerging Asia, as well as a slightly shorter emerging Asia sample that also includes Indonesia.
In both Latin America and emerging Asia, U.S. factors matter. Higher U.S. interest
rates—which can lead to higher borrowing costs and reduced output in emerging markets—lead to
reduced flows, but only significantly so in the Asia ex Indonesia sample. In every sample, above
trend U.S. economic activity—which could signal greater prospective profits and, hence, higher
expected returns for U.S. companies—results in significantly lower equity flows to EMEs over the
next year. For example, with U.S. industrial production running about 10 percent below trend in the
early 1990s, long-horizon flows to Latin America and emerging Asia increased about 0.1 and 0.02
percent of market capitalization per month. Over a twelve-month period, these flows amount to 1.2
and 0.24 percent of market capitalization, respectively, economically significant amounts.

13
There is no evidence in Table 4 that U.S. investors chase past returns—RET is insignificant
in every regression—but evidence of prospective returns chasing is apparent, as higher dividend
yields result in greater inflows over the next year, significantly so in one sample (Asia ex Indonesia).
The level of risk, as measured by the ICRG Composite Index (for which a higher number
corresponds with less risk), in not significant in any of our samples.
The impact of the integration variables varies across regions. A reduction in capital controls
results in a significant increase in long-horizon equity flows to emerging Asia, but not to Latin
America. A cross-border listing has a positive long-horizon effect on equity flows to Latin America
but not emerging Asia. It should be noted that the sample of cross-listed emerging Asian firms is
quite limited; compared to 72 Latin American cross-listings, only 15 Asian firms cross-listed on U.S.
exchanges in our sample, five of which are from Indonesia (and therefore excluded from the ex.
Indonesia sample).
As we have noted, the overlapping nature of long-horizon flows induces autocorrelation.
While the Newey-West standard errors in our long-horizon regressions address this issue, a
reasonable skeptic might note that two variables in particular—capital controls and risk
ratings—have trended downward over the course of our sample and, hence, might produce spurious
correlations. Table 4a presents our long-horizon panel results with FOR and RISK entered as first
differences rather than levels. The results are nearly identical to those in Table 4.
Table 5 presents country-level regressions that may shed more light on the panel results. In
general, the county-level results are consistent with the panel results but, not surprisingly, effects
differ across countries. For example, a reduction in capital controls leads to increased long-horizon
flows to five of the nine countries. In Korea, however, reduced capital controls are associated with
lower long-horizon inflows; we address this case in greater detail below. The chasing of past returns
is evident in only one country (Mexico), but prospective returns are important in five country-level
regressions. U.S. factors—industrial production more so than bond rates—are important factors for
flows to most countries. The long-term effect of a cross-listing is positive and significant in only
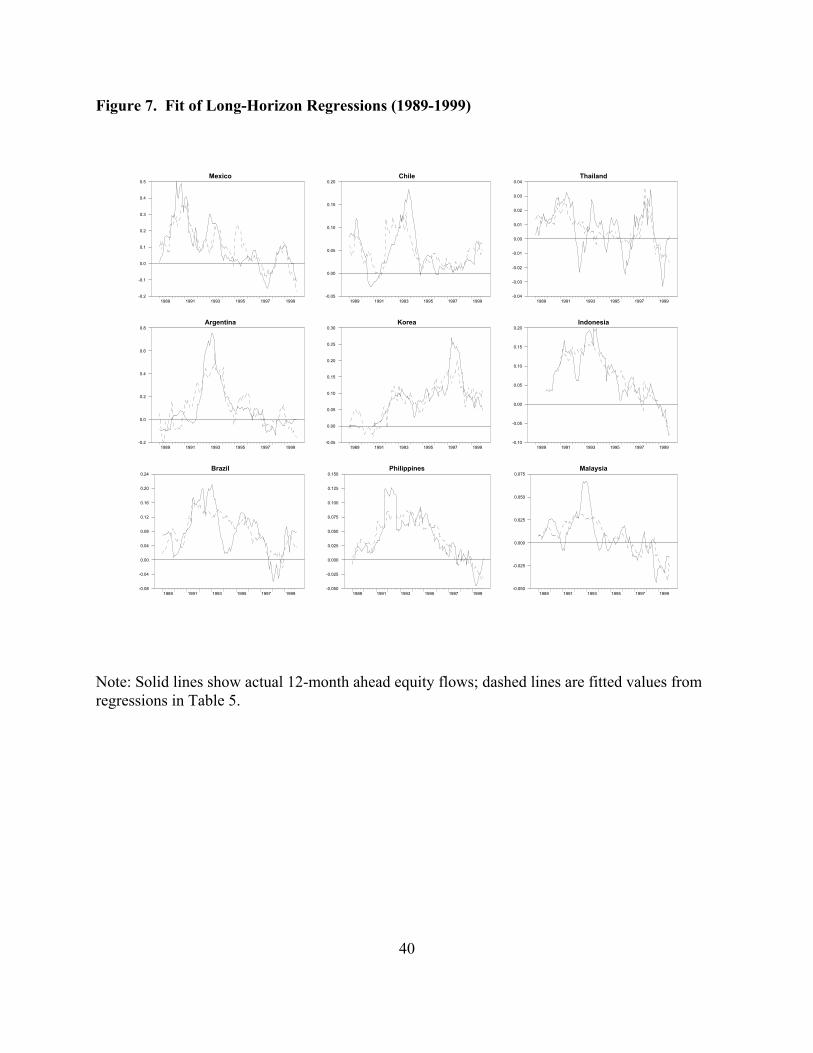
two (Argentina and Chile) of the seven countries that have ADR programs. Figure 7 shows the fit
of our long-horizon regressions; in most countries, our regressions adequately capture the main
trends in 12-month ahead flows.

17 The cross-listing effect might be greater if the variable was based on the firm’s float instead ofits market capitalization, but float data are not available back to 1989. Also, abnormal returns prior to across-listing (Foerster and Karolyi, 1999; Miller, 1999) suggest that some buying might occur before theactual cross-listing.
14
3.2 Results from Short-Horizon Regressions
Table 6 presents our panel results on the determinants of short-horizon equity flows. U.S.
factors are again very important—perhaps more so than in the long-horizon regressions—and there
is some evidence of prospective returns chasing behavior. In contrast to the long-horizon results,
higher past returns lead to short-horizon inflows, at least in Latin America. As with the long-horizon
regressions, a reduction in capital controls results in inflows that are statistically significant in Asia.
The coefficients on CBL are large and highly significant in all but the Asia ex Indonesia sample
(which, recall, has only 10 instances of a cross-border listing).
To compare the magnitudes of coefficient estimates in Tables 4 and 6, note that Table 4 is
a regression of average monthly flows over the next year, while Table 6 models flows over the next
month. In Table 4, to calculate the effect on cumulated flows over an entire year, multiply the
coefficient estimate by twelve. Thus, if the coefficients are the same across the tables, the effect
over the year is twelve times that of the one-month effect and the effect has persistence. If the
coefficient in Table 4 is one-twelfth of that in Table 6, the one-month effect is equivalent to the
cumulated effect over the entire year and the effect is transitory.
Comparing the coefficient estimates shows that they are similar across the two tables for
many of the significant variables, suggesting that the short-horizon effects continue over an entire
year. For example, the coefficients on U.S. IP in Tables 4 and 6 are identical, indicating that IP’s
one-period effect persists over the long horizon. For one variable, however, the contrast between
the long- and short-horizon coefficients is striking. The coefficients for the cross-listing variable
are much more significant but also much larger in the short-horizon regressions, suggesting that the
portfolio rebalancing effect is very important but also short-lived. For example, a new ADR
program by a firm that is ten percent of the home market raises equity inflows that month by 0.574
percent and 0.466 percent of market capitalization in Latin America and Asia, respectively. But the
longer run effect is insignificant in Asia, and only .0875 percent per month, or 1 percent over twelve
months, in Latin America. Thus, most if not all of the effect of a cross-listing occurs in the month
of the listing.17 The significant but short-lived portfolio rebalancing effect is even more striking in
18 Our risk ratings variable, RISK, was included to capture such changes in the investmentenvironment. We tried other variables, including measures of exchange rate variability, to no avail.
15
the regressions for individual countries. Comparing Tables 5 and 7, short-horizon coefficients are
about ten times greater than long-horizon coefficients, suggesting that most of the effect occurs in
the month of the listing.
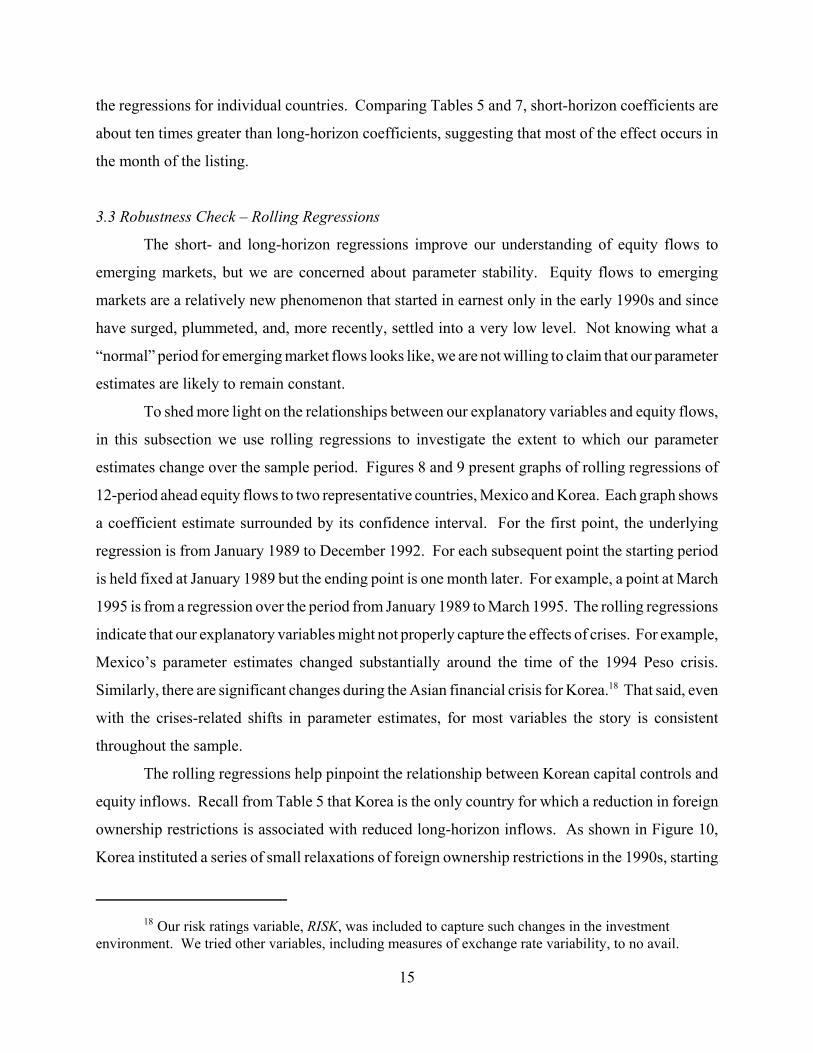
3.3 Robustness Check – Rolling Regressions
The short- and long-horizon regressions improve our understanding of equity flows to
emerging markets, but we are concerned about parameter stability. Equity flows to emerging
markets are a relatively new phenomenon that started in earnest only in the early 1990s and since
have surged, plummeted, and, more recently, settled into a very low level. Not knowing what a
“normal” period for emerging market flows looks like, we are not willing to claim that our parameter
estimates are likely to remain constant.
To shed more light on the relationships between our explanatory variables and equity flows,
in this subsection we use rolling regressions to investigate the extent to which our parameter
estimates change over the sample period. Figures 8 and 9 present graphs of rolling regressions of
12-period ahead equity flows to two representative countries, Mexico and Korea. Each graph shows
a coefficient estimate surrounded by its confidence interval. For the first point, the underlying
regression is from January 1989 to December 1992. For each subsequent point the starting period
is held fixed at January 1989 but the ending point is one month later. For example, a point at March
1995 is from a regression over the period from January 1989 to March 1995. The rolling regressions
indicate that our explanatory variables might not properly capture the effects of crises. For example,
Mexico’s parameter estimates changed substantially around the time of the 1994 Peso crisis.
Similarly, there are significant changes during the Asian financial crisis for Korea.18 That said, even
with the crises-related shifts in parameter estimates, for most variables the story is consistent
throughout the sample.
The rolling regressions help pinpoint the relationship between Korean capital controls and
equity inflows. Recall from Table 5 that Korea is the only country for which a reduction in foreign
ownership restrictions is associated with reduced long-horizon inflows. As shown in Figure 10,
Korea instituted a series of small relaxations of foreign ownership restrictions in the 1990s, starting

16
in 1992 with its initial opening to foreign investment and culminating with a series of incremental
reductions of restrictions from late 1994 to early 1997. Over those periods, restrictions were binding
and one would expect a relaxation to result in increased capital inflows. This was indeed what
occurred; the coefficient estimates suggest that the slight (one percentage point) loosening of
restrictions at the end of 1994 resulted in an increase in inflows of about .004 percent of market
capitalization per month (or .048 percent overall) over the subsequent 12-month period. But during
the Asian financial crisis, Korea greatly relaxed non-binding capital controls and flows did not
increase; during the crisis the coefficient estimate of FOR shoots toward zero. Overall, since controls
were relaxed in very different environments over the entire sample, the measure of foreign
ownership restrictions loses most of its significance by mid-1997.
3.4 Summary of Results and Comparison with Past Results
Table 8 summarizes the evidence from our long- and short-horizon regressions. For each
variable, a cell indicates the ratio of significant coefficients to total regressions, as well as the sign.
For example, the coefficient on U.S. industrial production, when significant, is negative (indicated
by the negative sign in each cell in its row). It is significant more often than any other variable: in
all three panel regressions for both long and short horizons, eight of nine long-horizon country-level
regressions, and six of nine short-horizon country regressions.
Our two integration variables produced interesting and new results. First, the portfolio
rebalancing associated with the cross-listing of an emerging market equity on a U.S. exchange is a
very important determinant of short-horizon flows (two of three in the panel and four of seven in
country regressions); the effect, however, is not long-lasting because the CBL coefficient, when
significant in long-horizon regression, is of a much smaller magnitude. Second, our finding of an
important role relationship between capital controls and capital flows is novel. Using annual dummy
measures of capital controls, Montiel and Reinhart (1999) found no link between capital controls
and the amount of capital inflows. Bekaert et al. (2002) find a post-liberalization increase in inflows
of 1.4 percent per year; Edison and Warnock (2003a) fine tune this and show that it is 1.9 percent
for a full opening, but only 0.2 percent for a smaller (10 percent) opening. We show here that the
effect of changes in capital controls depend on whether they were binding. Analyses of
liberalizations are by design studies of the relaxation of binding controls. Our results suggest that
relaxations of non-binding controls are not associated with inflows.

17
A standard result in the literature is that U.S. or global factors play important roles in capital
flows to emerging markets (Chuhan et al., 1998; Montiel and Reinhart, 1999; Calvo et al., 1993).
Our results point to a greater effect for economic activity than interest rates (which are not
significant in the majority of our regressions), so that strong prospective returns on U.S. equities
rather than high rates on U.S. fixed income securities seem to be important. This is consistent with
the Bekaert et al. (2002) finding of no significant effect for U.S. interest rates, but we should add
a caveat. In our sample, U.S. interest rates and foreign capital controls are highly correlated (0.51
in Latin America); if FOR is removed from the regressions, US Bond is significant. Thus, we
conclude that U.S. factors matter, but we leave for further work the exact role of U.S. interest rates.
On the returns-chasing hypothesis, our results show that investors chase past returns in only
a few markets—one of nine in long-horizon regressions and two of nine in the short horizon—which
is not dissimilar to the results of Bohn and Tesar (1996). We found much more evidence of chasing
prospective returns as proxied by dividend yields (five of nine in long horizon), consistent with
evidence in Bekaert et al. (2002).
4. Conclusion
The purpose of this paper is to model portfolio equity flows to emerging markets. We model
these flows using two new integration variables that measure the intensity of capital controls and
cross-border listings, as well as standard global and country-specific factors. Our results differ from
previous work along two important lines. First, we find that the effects of changes in capital controls
on capital flows depend importantly on whether controls were binding. Second, we provide the first
documentation of the immediate but short-lived effect of cross-border listings on capital flows to
emerging markets.
With country-level flows data, we can only speculate that the flows associated with a cross-
listing are purchases of the cross-listed firm. Another alternative is that investors become more
aware of the emerging market at the time of the cross-listing and reconsider all of its equities.
Evidence from Edison and Warnock (2003b), which uses firm-level data on positions (not flows),
suggests that the listing effect might be limited to the cross-listed firm and not extend to other firms
in the country; combined with the results for country-level capital flows in this paper, this suggests
that the firm gets funding at the time of the cross-listing and the story ends: The emerging market

18
does not enjoy widespread foreign buying, nor does foreign investment in the cross-listed firm
subsequently increase.

19
References
Ahearne, A., W. Griever, and F.Warnock, forthcoming. Information Costs and Home Bias: AnAnalysis of U.S. Holdings of Foreign Equities. Journal of International Economics.
Alesina, A., V. Grilli, and G.M. Milesi-Ferretti, 1994. The Political Economy of Capital Controls,in L. Leiderman and A. Razin, Capital Mobility: The Impact on Consumption, Investment andGrowth, Cambridge: Cambridge University Press.
Bacchetta, P., and E. van Wincoop, 2000. Capital Flows to Emerging Markets: Liberalization,Overshooting, and Volatility. in S. Edwards, Capital Flows and the Emerging Economies, NBERand University of Chicago Press.
Bekaert, G., and C.R. Harvey, 1995. Time-varying Word Market Integration. Journal of Finance,50, 403-444.
Bekaert G. , C.R. Harvey and R. Lumsdaine, 2002. The Dynamics of Emerging Market EquityFlows, Journal of International Money and Finance, 21(3): 295-350.
Bohn, H., and L. Tesar, 1996. U.S. Equity Investment in Foreign Markets: Portfolio Rebalancingor Returns Chasing? American Economic Review 86(2): 77-81.
Brennan, M., and H. Cao, 1997. International Portfolio Flows. Journal of Finance 52: 1851-1880.
Calvo, G., L. Leiderman, and C. Reinhart, 1993. Capital Inflows to Latin America: The Role ofExternal Factors. IMF Staff Papers 40: 108-151.
Campbell, J.Y., A.W. Lo, and A.C. McKinlay, 1997. The Econometrics of Financial Markets.Princeton University Press. Princeton.
Campbell, J.Y., and R. Shiller, 1988. Stock Prices, Earnings, and Expected Dividends. Journal ofFinance 43(3): 661-76.
Choe, H., B-C Kho, and R. Stulz, 1999. Do Foreign Investors Destabilize Stock Markets? TheKorean Experience in 1997. Journal of Financial Economics, 54(2), 227-264.
Chuhan, P., S. Claessens, and N. Mamingi, 1998. Equity and Bond flows to Latin America andAsia:the role of global and country factors. Journal of Development Economics, 55, 439 - 463.
Claessens, S., D. Klingebiel, and S. Schmukler, 2002. The Future of Stock Exchanges in EmergingEconomies: Evolution and Prospects. Brookings-Wharton Papers on Financial Services, 167-202.
Doidge, C., A. Karolyi, and R. Stulz, forthcoming. Why are Foreign Firms Listed in the U.S. WorthMore? Journal of Financial Economics.

20
Dvorak, T., 2002. Do Domestic Investors Have an Information Advantage? Evidence fromIndonesia. mimeo, Union College.
Edison, H. J., and F. Warnock, 2003a. A Simple Measure of the Intensity of Capital Controls.Journal of Empirical Finance 10(½): 81-103.
Edison, H. J., and F. Warnock, 2003b. U.S. Investors’ Emerging Market Equity Portfolios: ASecurity-Level Analysis. International Finance Discussion Paper #771, Board of Governors of theFederal Reserve System.
Eichengreen, B., 2001. Capital Account Liberalizations: What Do Cross-Country Studies Tell Us?World Bank Economic Review, 15(3), 341-365.
Erb, C., C. Harvey, and T. Viskanta, 1996. Political Risk, Economic Risk, and Financial Risk.Financial Analysts Journal 52(6), 28-46.
Fama, E., and K. French, 1988. Dividend Yields and Expected Stock Returns. Journal of FinancialEconomics 22, 3-16.
Foerster, S., and G.A. Karolyi, 1999. The Effects of Market Segmentation and Investor Recognitionon Asset Prices: Evidence from Foreign Stocks Listing in the U.S. Journal of Finance 54(3).
Froot, K., P.G. O’Connell, and M. Seasholes, 2001. The Portfolio Flows of InternationalInvestors. Journal of Financial Economics 59, 151-194.
Griever, W., G. Lee, and F. Warnock, 2001. The U.S. System for Measuring Cross-BorderInvestment in Securities: A Primer with a Discussion of Recent Developments. Federal ReserveBulletin 87(10): 633-650.
Griffin, J., F. Nardari, and R. Stulz, 2002. Are Daily Cross-Border Flows Pushed or Pulled? mimeo,Arizona State University and Ohio State University.
Harvey, C., 1995. Predictable Risk and Returns in Emerging Markets. Review of Financial Studies8(3): 773-816.
Karolyi, G.A., 1998. Why Do Companies List Shares Abroad?: A Survey of the Evidence and ItsManagerial Implications. Financial Markets, Institutions & Instruments, 7(1).
Karolyi, G.A., 2003. The Role of ADRs in the Development and Integration of Emerging EquityMarkets. mim
Lang, M., Lins, K., and Miller, D., forthcoming. ADRs, analysts, and accuracy: Does cross listingin the U.S. improve and firm’s information environment and increase market value? Journal ofAccounting Research.

21
Levine, R., 2001. International Financial Liberalization and Economic Growth. Review ofInternational Economics.
Lins, K., D. Strickland, and M. Zenner. Do Non-U.S. Firms Issue Equity on U.S. Stock Exchangesto Relax Capital Constraints? Working Paper, Ohio State University.
Miller, D., 1999. The market reaction to international cross-listings: evidence from DepositaryReceipts. Journal of Financial Economics, 51: 103-123.
Montiel, P., and C. Reinhart, 1999. Do Capital Controls and Macroeconomic Policies Influence theVolume and Composition of Capital Flows? Evidence from the 1990s. Journal of InternationalMoney and Finance, 18, 619-635.
Newey, W., and K. West, 1987. A Simple, Positive Semi-Definite, Heteroskedasticity andAutocorrelation Consistent Covariance Matrix,” Econometrica, 55, 703-708.
Pagano, M., A. Roell, and J. Zechner, 2002. The Geography of Equity Listing: Why Do EuropeanCompanies List Abroad? Journal of Finance 57(6), 2651-2694.
Pulatkonak, M., and G. Sofianos, 1999. The Distribution of Global Trading in NYSE-ListedNon-U.S. Stocks. NYSE Working Paper #99-03.
Quinn, D., 1997. The Correlates of Changes in International Financial Regulation. AmericanPolitical Science Review, 91, 531-551.
Richards, A., 2002. Big Fish in Small Ponds: The Momentum Investing and Price Impact of ForeignInvestors in Asian Emerging Equity Markets. working paper, Reserve Bank of Australia and IMF.
Rodrik, D., 1998. Who Needs Capital-Account Convertibility? in Should the IMF Pursue Capital-Account Convertibility? Essays in International Finance edited by Stanley Fischer et al., PrincetonUnversity.
Seasholes, M., 2000. Smart Foreign Traders in Emerging Markets. mimeo, UC-Berkeley.
Taylor, M., and L. Sarno, 1997. Capital Flows to Developing Countries: Long- and Short-TermDeterminants. World Bank Economic Review, 11(3): 451-470.
Tesar, L., and I. Werner, 1994. International Equity Transactions and U.S. Portfolio Choice, in J.Frankel, The Internationalization of Equity Markets, NBER and University of Chicago Press.
Tribukait, H., 2003. The invisible enforcer? price behavior of Mexican firms cross-listed on theNYSE around earnings announcements. mimeo, Harvard University.
Warnock, F., and C. Cleaver, 2003. Financial Centers and the Geography of Capital Flows.International Finance 6(1): 27-59.
22
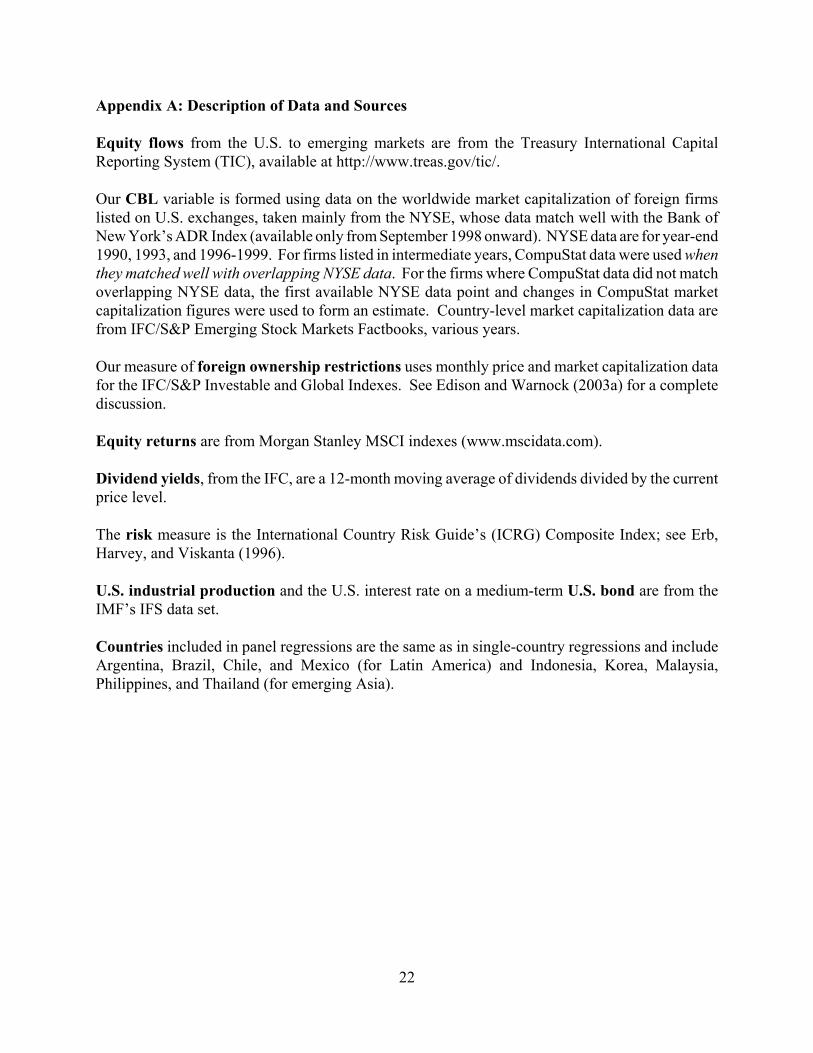
Appendix A: Description of Data and Sources
Equity flows from the U.S. to emerging markets are from the Treasury International CapitalReporting System (TIC), available at http://www.treas.gov/tic/.
Our CBL variable is formed using data on the worldwide market capitalization of foreign firmslisted on U.S. exchanges, taken mainly from the NYSE, whose data match well with the Bank ofNew York’s ADR Index (available only from September 1998 onward). NYSE data are for year-end1990, 1993, and 1996-1999. For firms listed in intermediate years, CompuStat data were used whenthey matched well with overlapping NYSE data. For the firms where CompuStat data did not matchoverlapping NYSE data, the first available NYSE data point and changes in CompuStat marketcapitalization figures were used to form an estimate. Country-level market capitalization data arefrom IFC/S&P Emerging Stock Markets Factbooks, various years.
Our measure of foreign ownership restrictions uses monthly price and market capitalization datafor the IFC/S&P Investable and Global Indexes. See Edison and Warnock (2003a) for a completediscussion.
Equity returns are from Morgan Stanley MSCI indexes (www.mscidata.com).
Dividend yields, from the IFC, are a 12-month moving average of dividends divided by the currentprice level.
The risk measure is the International Country Risk Guide’s (ICRG) Composite Index; see Erb,Harvey, and Viskanta (1996).
U.S. industrial production and the U.S. interest rate on a medium-term U.S. bond are from theIMF’s IFS data set.
Countries included in panel regressions are the same as in single-country regressions and includeArgentina, Brazil, Chile, and Mexico (for Latin America) and Indonesia, Korea, Malaysia,Philippines, and Thailand (for emerging Asia).

Appendix B: Listings on US Stock Exchanges
Country Symbol Company Date Listed Size
Argentina BAE BAESA 5/5/93 2.3%YPF YPF 6/29/93 20.8%BFR Banco Frances del Rio 11/24/93 3.2%TAR TELEFONICA DE ARGENTINA 3/8/94 16.9%MGS METROGAS SA 11/17/94 1.4%TGS TRANSPORT GAS SUR 11/17/94 4.0%TEO TELECOM ARGENTINA STET FRANC 12/9/94 13.8%IRS IRSA INVERSIONES Y 12/20/94 0.8%LQU QUILMES INDL QUINSA -ADR 3/28/96 2.4%DXO DISCO SA 4/3/96 1.0%CRESY Cresud S.A.C.I.F. y A.(NASDAQ) 3/19/97 0.5%NTL Nortel Inversora S.A. 6/17/97 1.1%BRS Banco Rio de la Plata S.A. (Banco Río) 10/10/97 3.1%PC Perez Companc 1/26/00 1.4%GGAL Grupo Financiero Galicia S. A.(NASDAQ) 6/22/00 0.7%APSA Alto Palmero(NASDAQ) 11/10/00 0.2%
Brazil ARA Aracruz Celulose 5/27/92 2.1%TBR TELEC BRASILEIRAS- 11/1/95 9.9%GLCBY Globo Cabo S.A.(NASDAQ) 11/1/96 0.6%UBB União de Bancos Brasileiros S.A. (Unibanco) 5/22/97 1.3%CBD Companhia Brasileira de Distribuição 5/29/97 0.2%BRH Companhia Cervejaria Brahma 6/4/97 1.2%ELP Companhia Paranaense de Energia-COPEL 7/30/97 1.1%SID Companhia Siderurgica Nacional (CSN) 11/14/97 7.0%PNE Copene-Petroquimica do Nordeste S. 12/21/98 0.1%GGB Gerdau 3/10/99 0.5%UGP Ultra Participacoes SA 10/7/99 0.0%VCP Votorantim Celulose E Papel 4/14/00 0.2%PBR Petroleo Brasiliero S.A. 8/10/00 7.1%PDA Perdigao S.A. 10/20/00 0.1%ERJ Embraer 7/21/00 1.3%RIO Companhia Vale Do Rio Doce (CVRD) 6/20/00
Chile CTC Cia. De Telefonos de Chile 7/20/90 5.4%CU Comp.Cervecerias Unidas SA(NASDAQ) 9/25/92 3.4%MAD Madeco 5/28/93 2.1%MYS MASISA 6/17/93 1.3%SQM SQM-Soc Quim.y Minera 9/21/93 1.5%ENI Enersis 10/20/93 6.2%CGW CRISTALERIAS CHILE 1/25/94 0.5%LBC LABORATORIO CHILE 6/29/94 0.5%AKOA EMBOTELLA ANDINA 7/6/94 2.2%CHR Gener S.A. formerly (chiligener) 7/19/94 2.2%EOC EMP NAC ELECTRICID 7/24/94 10.2%BSB Banco Santander-Chile 11/4/94 1.8%TL Empresas Telex Chile S.A. 10/14/94 0.9%VCO VINA CONCHA Y TORO 10/14/94 0.3%PVD ADMIN FONDOS PENSIONS -ADR 11/16/94 0.4%ISA SANTA ISABEL SA 7/25/95 0.7%AED BCO DE A EDWARDS 11/3/95 0.9%BB BANCO BHIF 6/19/96 0.3%SAN Banco Santiago 1/13/97 2.5%UNR Supermercados Unimarc S.A. 5/9/97 0.4%LQ QUIÑENCO S.A.* 6/25/97 1.3%DYS Distribución y Servicio D&S S.A. (D&S) 10/8/97 1.8%LFL Lan Chile S.A. 11/7/97 1.1%SQMA SQM-Sociedad Química y Minera de Chile, S.A.* 4/8/99 1.3%

Country Symbol Company Date Listed Size
Mexico TMX Telefonos de Mex. 5/14/91 8.1%VTO Vitro 11/19/91 0.8%ICA Empresas ICA 4/9/92 1.4%TMM Transportacion Maritima Mexicana 6/10/92 0.2%DIN Consorcio G Gpo Dina 3/31/93 0.2%RC Gpo. Radio Centro 7/1/93 0.2%KOF Coca-Cola Femsa 9/14/93 0.8%GTR Gpo. Tribasa 9/22/93 1.2%GBI Bufete Industrial 11/4/93 0.1%SFN Gpo. Financiero Serfin 12/1/93 0.5%ATY Grupo Casa Autrey 12/7/93 0.1%GMD Gpo. Mex de Desarrollo 12/14/93 0.2%TV Gpo. Televisa 12/14/93 1.7%ELM EMPRESAS LA MODERN 2/2/94 1.9%GEM Pepsi-Gemex 3/29/94 0.2%MSK GPO IND MASECA 5/17/94 0.8%CEL GRUPO IUSACELL 6/15/94 1.4%SDK GRUPO SIDEK (removed 3/21/97) 7/12/94 0.8%DES DESC SA DE CV 7/14/94 1.2%GID GPO IND DURANGO 7/15/94 0.3%EKT GPO ELEKTRA 12/5/94 1.9%ICM INTL DE CERAMICA 12/8/94 0.3%MCM CONTROL COM MEX 10/11/96 0.9%IAM ALTOS HORNOS MEXIC 12/11/96 0.8%IMY GRUPO IMSA SA DE CV -ADS 12/11/96 0.6%TZA TV Azteca, S.A. 8/15/97 2.0%IBA Industrias Bachoco, S.A. de C.V. (Bachoco) 9/19/97 0.6%FMX Fomento Económico Mexicano, S.A. de C.V. * (FEMSA) 5/11/98 3.2%BIPRY BIPER SA (NASDAQ) 9/28/98 0.1%GMK Gruma S.A. de C.V.* 11/6/98 1.0%CX Cemex 9/15/99 13.1%ASR Grupo Aeroportuario del Sureste 10/3/00 0.3%
Indonesia IIT INDOSAT 10/18/94 7.8%TLK TELEKOMUNIKASI IND 11/14/95 17.7%TPI PT TRI POLYTA INDONSIA -ADR 3/14/96 0.2%PSNRE P.T. Pasifik Satelit Nusantara(NASDAQ) 6/11/96 0.4%GRL Gulf Indonesia Resources Limited 9/30/97 5.4%
Korea PKX POHANG IRON&STEEL 10/14/94 3.3%KEP KOREA ELEC POWER 10/27/94 10.7%SKM SK Telecom Co. Ltd. (formerly Korea Mobile Telec) 6/27/96 2.2%KTC Korea Telcom Corp. 5/26/99 11.0%KOREA KoreaThrunet Co. Ltd (NASDAQ) 11/1/99 1.5%MRAE Mirae Corporation (NASDAQ) 11/1/99 0.3%HANA Hanaro Telecom Inc.(NASDAQ) 3/30/00 0.3%HCB H & CB 9/29/00 1.4%
Philippines PHI PHILIPPINE LNG DIS 10/19/94 5.3%PHIPRA Philippine Long Distance Telephone Company*** (PFD) 11/22/94PSIT PSI Technologies Holdings, Inc.(NASDAQ) 3/21/00 0.1%
Notes: All listings are on the NYSE unless otherwise noted. Size refers to firm's size relative to the country's marketcapitalization, calculated by the authors using year-end values. Settlement conventions are such that listingson the last three to five trading days of a month appear in the following month's capital flow data.No firms from Malaysia or Thailand listed on a U.S. exchange between 1988 and 1999.
25
Table 1: Capital Flow Data (billions of US dollars)
1989 1990 1991 1992 1993 1994 1995 1996 1997 1998 1999
Latin America and Caribbean
1. Total Flows 7.1 19.4 26.9 32.7 62.8 59.2 72.1 96.2 110.9 139.3 113.6
2. Portfolio Equity Flows 0.4 1.1 6.3 8.3 27.2 13.2 7.6 13.9 9.9 1.7 3.9
3. Foreign Direct Investment 8.1 8.2 12.9 15.0 13.7 28.4 29.8 43.3 65.1 72.1 90.4
4. Net flow of long-term debt -1.5 10.1 7.7 9.4 21.9 17.6 34.7 39.0 35.9 65.5 19.3
Memo: LA share of equityflows/total (2/1)
0.06 0.06 0.23 0.25 0.43 0.22 0.11 0.14 0.09 0.01 0.03
East Asia and Pacific
5.Total Flows 20.7 25.6 33.3 51.7 80.8 88.9 106.2 125.1 126.8 79.9 62.6
6. Portfolio Equity Flows 2.6 2.3 1.2 5.3 20.7 12.6 18.3 18.1 9.2 9.0 21.1
7. Foreign Direct Investment 9.1 11.1 14.2 22.0 39.6 46.4 53.1 61.0 65.6 63.3 56.0
8. Net flow of long-term debt 9.0 12.2 17.9 24.4 20.5 29.9 34.8 46.0 52.0 7.6 -14.5
Memo: Asian share equityflows/total (6/5)
0.13 0.09 0.04 0.10 0.26 0.14 0.17 0.14 0.07 0.11 0.34
Source: various issues of Global Development Finance (World Bank).Note: The regions in this table correspond with World Bank conventions and are much broader than those used in other tables and figuresin this paper.
26
Table 2: Net US purchases of emerging market stocks.(annual averages 1977 - 1999) in millions of US $
1977-87 1988-92 1993-97 1998-99 Argentina 0 8 1,085 (395) Brazil 1 387 1,777 476 Chile (1) 45 388 147 Mexico 20 1,185 1,342 318Latin America 20 1,624 4,592 546memo: world equity flows toLatin America
19 2,950 12,060 2,461
Indonesia (0) 58 528 (20) Korea 6 89 1,659 1,936 Malaysia 9 79 244 (263) Philippines 1 60 300 26 Thailand 4 77 36 16Asian emerging markets 20 363 2,767 1,695memo: world equity flows toAsian emerging markets
63 1,681 10,968 12,451
U.S. Purchases of Foreign Equities 1,288 17,818 63,460 107,800
of which stock swaps 0 0 4,000 109,500
with emerging markets 0 0 0 0
Sources: U.S. Department of Treasury, Treasury International Capital Reporting System; WorldBank, Global Development Finance; Securities Data Corporation.

27
Table 3: Summary Statistics for Latin American panel
Correlations
mean min max stderr Yt+1 / 1 RISK DY RET CBLt+1 USIP USBOND FOR
Yt+12 / 12 0.084 -0.156 0.752 0.135 0.473 -0.018 -0.140 0.009 0.157 -0.440 -0.171 -0.023
Yt+1 / 1 0.084 -1.280 2.376 0.263 0.035 -0.080 0.092 0.386 -0.238 -0.108 -0.025
RISK 4.215 3.784 4.425 0.115 -0.074 -0.159 0.076 0.154 -0.496 -0.342
DY 3.043 0.090 22.910 2.451 -0.163 -0.020 0.187 0.307 0.302
RET 1.103 -69.004 95.841 14.011 -0.012 -0.111 0.069 0.064
CBLt+1 0.003 0.000 0.208 0.017 -0.042 -0.085 -0.089
USIP -1.973 -9.464 11.112 5.624 -0.089 -0.235
USBOND 6.238 4.170 9.610 1.318 0.513
FOR 0.319 0.092 0.894 0.239
Variables are defined under equation (3). Summary statistics for the emerging Asian panel are similar and available upon request.

28
Table 4: Panel data estimates of 12-month ahead equity flows
start date
Latin America
1989:1
Asia ex. Indonesia
1989:1
Asia
1990:11
RISK -0.000(0.999)
-0.008(0.844)
0.069(0.131)
DY 0.006(0.218)
0.009**
(0.036)0.007
(0.105)
RET -1.3E-4(0.745)
3.4E-5(0.830)
3.5E-6(0.982)
FOR -0.026(0.779)
-0.067***
( 0.002)-0.036
(0.101)
CBLt+1 0.875**
(0.022)0.096
(0.886)-0.108(0.683)
USIP -0.012***
(0.000)-0.002***
(0.007)-0.003***
(0.000)
USBOND -0.022(0.299)
-0.007***
(0.010)-0.006(0.207)
R2 0.28 0.48 0.50Notes. Dependent variable is average 12-period ahead net US purchases of the country’s equities normalized by its marketcapitalization. Samples are through 1999. All independent variables are at time t, except CBL, the relative size of a period t+1 listingon a US exchange. RISK is the log of the ICRG Composite Risk; RET is the difference in rates of return between the country andthe US; DY is the dividend yield; FOR is the intensity of foreign ownership restrictions; USIP is the deviation of US industrialproduction from a time trend; and USBOND is the rate on a US medium-term bond. Constants are included but not reported. P-values computed using Newey and West (1987) standard errors are in parentheses. ***, **, and * indicate significance at the 1, 5, and10 percent levels.

29
Table 4a: Panel data estimates of 12-month ahead equity flows
start date
Latin America
1989:1
Asia ex. Indonesia
1989:1
Asia
1990:11
RISK -0.111(0.656)
0.017(0.910)
-0.052(0.696)
DY 0.006(0.208)
0.009**
(0.029)0.005
(0.218)
RET -1.4E-4(0.678)
2.8E-5(0.861)
-1.2E-4(0.464)
FOR 0.043(0.662)
-0.064*
( 0.067)-0.052**
(0.014)
CBLt+1 0.877**
(0.018)0.513
(0.273)-0.003(0.993)
USIP -0.012***
(0.000)-1.4E-3(0.125)
-0.003***
(0.001)
USBOND -0.024*
(0.093)-0.008***
(0.008)-0.006(0.224)
R2 0.28 0.42 0.48Notes. Dependent variable is average 12-period ahead net US purchases of the country’s equities normalized by its marketcapitalization. Samples are through 1999. Independent variables are as in Table 4, except RISK is the log first difference of theICRG Composite Risk and FOR is the first difference of the intensity of foreign ownership restrictions.Constants are included butnot reported. P-values computed using Newey and West (1987) standard errors are in parentheses. ***, **, and * indicate significanceat the 1, 5, and 10 percent levels.

30
Table 5: Estimation results, 12-month ahead equity flows
Latin America Asia
Mexico Argentina Brazil Chile Korea Indonesia Malaysia Philippines Thailand
RISK -1.264*
(0.06)-0.458(0.26)
-0.434***
(0.00)-0.447***
(0.002)0.176(0.28)
0.082(0.33)
0.113***
(0.008)-0.008(0.90)
-0.077**
(0.02)
DY 0.105***
(0.00)0.030*
(0.08)-0.001(0.41)
0.010***
(0.00)0.029***
(0.002)0.003(0.58)
0.005(0.90)
-0.018(0.11)
0.005***
(0.00)
RET 0.002*
(0.06)-0.001(0.24)
-0.00007(0.54)
0.0003(0.52)
0.0002(0.40)
0.00003(0.80)
0.00006(0.65)
-0.00007(0.96)
-0.00001(0.21)
FOR -0.421**
(0.03)-2.272(0.44)
-0.282***
(0.00)-0.141***
(0.01)0.192**
(0.03)-0.275*
(0.09)-0.021***
(0.0003)-0.166(0.15)
-0.026(0.70)
CBLt+1 0.147(0.58)
0.680**
(0.04)0.193(0.35)
0.565**
(0.02)-1.631***
(0.01)-0.027(0.86) n.a -0.263
(0.20) n.a
USIP -0.018***
(0.00)-0.024***
(0.00)-0.011***
(0.00)-0.003*
(0.07)0.014***
(0.00)-0.016***
(0.00)-0.003***
(0.00)-0.006***
(0.00)-0.001(0.23)
USBOND -0.009(0.57)
-0.104***
(0.00)0.010(0217)
-0.012*
(0.06)-0.034***
(0.00)-0.001(0.85)
-0.004(0.26)
-0.004(0.33)
0.002(0.47)
R2 0.62 0.66 0.49 0.46 0.68 0.80 0.53 0.71 0.41
Notes. Dependent variable is average 12-period ahead net US purchases of the country’s equities scaled by market capitalization. See Table 4 for a description of the independentvariables. All regressions are estimated over the period from January 1989 to December 1999, except the regression for Indonesia, which starts in November 1990. P-values computedusing Newey and West (1987) standard errors are in parentheses. ***, **, and * indicate significance at the 1, 5, and 10 percent levels.

31
Table 6: Panel data estimates of one-month ahead equity flows
start date
Latin America
1989:1
Asia ex. Indonesia
1989:1
Asia
1990:11
RISK 0.140(0.303)
-0.011(0.789)
0.076**
(0.014)
DY 0.008*
(0.058)0.006
(0.113)0.0034(0.558)
RET 0.002**
(0.020)5.2E-4(0.295)
4.4E-4(0.357)
FOR -0.033(0.601)
-0.092***
( 0.000)-0.058***
(0.006)
CBLt+1 5.74***
(0.004)0.522
(0.661)4.66***
(0.005)
USIP -0.012***
(0.000)-0.002***
(0.008)-0.003***
(0.000)
USBOND -0.017(0.162)
-0.011***
(0.000)-0.015***
(0.001)
R2 0.21 0.14 0.18
Notes. Dependent variable is one-period ahead net U.S. purchases of the country’s equities normalized by its market capitalization. Samples are through 1999. See Table 4 for adescription of the independent variables. P-values are in parentheses. ***, **, and * indicate significance at the 1, 5, and 10 percent levels.

32
Table 7: Estimation results, one-month ahead equity flows
Latin America Asia
Mexico Argentina Brazil Chile Korea Indonesia Malaysia Philippines Thailand
RISK 0.496(0.55)
0.232(0.59)
-0.455*
(0.09)-0.234(0.17)
-0.660**
(0.02)0.317*
(0.10)-0.039(0.70)
0.013(0.91)
-0.050(0.53)
DY 0.148***
(0.005)0.033(0.12)
-0.006(0.23)
0.011*
(0.07)-0.001(0.95)
-0.041*
(0.08)0.009(0.22)
-0.011(0.71)
0.004(0.25)
RET 0.006**
(0.05)0.002(0.15)
0.0003(0.69)
0.0006(0.55)
0.0001(0.91)
0.0003(0.73)
0.0009**
(0.04)0.0008(0.35)
0.0002(0.58)
FOR -0.447*
(0.10)2.097(0.57)
-0.205(0.31)
-0.120**
(0.03)0.540***
(0.00)-0.591*
(0.06)-0.051**
(0.02)-0.628(0.13)
-0.245(0.88)
CBLt+1 5.783***
(0.003)5.948***
(0.00)-0.294(0.82)
4.765***
(0.00)3.696(0.25)
6.591***
(0.00) n.a -1.839(0.28) n.a
USIP -0.020***
(0.0003)-0.021***
(0.0004)-0.010**
(0.03)-0.002(0.11)
0.027***
(0.00)-0.018***
(0.01)-0.003***
(0.001)-0.007***
(0.005)-0.0004(0.11)
USBOND -0.024(0.42)
-0.083***
(0.01)-0.006(0.76)
0.006(0.53)
-0.080***
(0.00)-0.010(0.53)
-0.005(0.18)
-0.012(0.22)
0.0003(0.55)
R20.19 0.38 0.11 0.21 0.18 0.34 0.18 0.13 0.01
Notes. Dependent variable is one-period ahead net US purchases of the country’s equities scaled by market capitalization. See Table 4 for a description of theindependent variables. All regressions are estimated over the period from January 1989 to December 1999, except the regression for Indonesia, which starts inNovember 1990. P-values computed using Newey and West (1987) standard errors are in parentheses. ***, **, and * indicate significance at the 1, 5, and 10 percentlevels.

33
Table 8. Summary of results
Long Horizon Short Horizon
Panel Countries Panel Countries
RISK 0 - 4/9 + 1/3 - 2/9
DY + 1/3 + 5/9 + 1/3 + 2/9
RET 0 + 1/9 + 1/3 + 2/9
FOR - 1/3 - 5/9 - 2/3 - 4/9
CBLt+1 + 1/3 + 2/7 + 2/3 + 4/7
USIP - 3/3 - 8/9 - 3/3 - 6/9
USBOND - 1/3 - 3/9 - 2/3 - 2/9
Note. The table summarizes significant coefficients from Tables 4, 5, 6, and 7. Listed in each cell is the sign of significant coefficients, followed by the ratio of thenumber of significant coefficients to the number of regressions. For example, + 1/3 indicates that the variable was positive and significant in one of three panelregressions, while - 4/9 indicates negative and significant coefficients in 4 of 9 country-level regressions. If a coefficient was significant and both positive and negative,we report the sign of the most occurrences.

34
(a) Latin America
1988 1989 1990 1991 1992 1993 1994 1995 1996 1997 1998 1999 2000-1500
-1000
-500
0
500
1000
1500
2000
2500
(b) Emerging Asia
1988 1989 1990 1991 1992 1993 1994 1995 1996 1997 1998 1999 2000-1500
-1000
-500
0
500
1000
1500
2000
2500
Figure 1. Monthly Net Purchases of Equities by U.S. Investors (millions of USD)

1994 1995 1996 19970
5
10
15
Figure 2. U.S. Positions in Emerging Market Equities ($ billions): Estimated ( ) and Benchmark (x)
x
x
Argentina
1994 1995 1996 19970
10
20
30
40
x
x
Brazil
1994 1995 1996 19970
5
10
15
x
x
Chile
1994 1995 1996 19970
10
20
30
40
x x
Mexico
1994 1995 1996 19970
5
10
15
xx
Indonesia
1994 1995 1996 19970
5
10
15
x x
Korea
1994 1995 1996 19970
5
10
15
x
x
Malaysia
1994 1995 1996 19970
5
10
15
xx
Philippines
1994 1995 1996 19970
5
10
15
x
x
35
Thailand
1990 1995 20000.00
0.25
0.50
0.75
1.00
Figure 3. Restrictions on Foreign Ownership of Equities
Argentina
1990 1995 20000.00
0.25
0.50
0.75
1.00
Brazil
1990 1995 20000.00
0.25
0.50
0.75
1.00
Chile
1990 1995 20000.00
0.25
0.50
0.75
1.00
Mexico
1990 1995 20000.00
0.25
0.50
0.75
1.00
Indonesia
1990 1995 20000.00
0.25
0.50
0.75
1.00
Korea
1990 1995 20000.00
0.25
0.50
0.75
1.00
Notes. Foreign ownership restrictions, which range from 0 (no restrictions) to 1 (completely closed to foreign investment), are
the smoothed measure from Edison and Warnock (2003a).
Malaysia
1990 1995 20000.00
0.25
0.50
0.75
1.00
Philippines
1990 1995 20000.00
0.25
0.50
0.75
1.00
36
Thailand

37
(a) Latin American Cross-Listings
1988 1989 1990 1991 1992 1993 1994 1995 1996 1997 1998 1999 20000
1
2
3
4
5
(b) Asian Cross-Listings
1988 1989 1990 1991 1992 1993 1994 1995 1996 1997 1998 1999 20000
1
2
3
4
5
Figure 4. New Listings of Emerging Market Stocks on U.S. Exchanges (percent of localmarket capitalization)

38
(a) Latin American Excess Returns
1988 1990 1992 1994 1996 1998 2000-40
-30
-20
-10
0
10
20
30
(c) Asian Excess Returns
1988 1990 1992 1994 1996 1998 2000-40
-30
-20
-10
0
10
20
30
(b) Latin American Dividend Yields
1988 1990 1992 1994 1996 1998 20000.0
2.5
5.0
7.5
10.0
12.5
15.0
(d) Asian Dividend Yields
1988 1990 1992 1994 1996 1998 20000.0
2.5
5.0
7.5
10.0
12.5
15.0
Figure 5. Standard Country-Specific (or “Pull”) Factors
Note: Monthly excess returns are relative to U.S. returns.

39
(a) U.S. Industrial Production
1988 1989 1990 1991 1992 1993 1994 1995 1996 1997 1998 1999 2000-10
-5
0
5
10
15
(b) U.S. Bond Rate (%)
1988 1989 1990 1991 1992 1993 1994 1995 1996 1997 1998 1999 20000.0
2.5
5.0
7.5
10.0
Figure 6. Global (or “Push”) Factors
Notes: IP is the deviation from a 1984 - 2000 time trend. Bond rate (%) is medium-term.
40
Mexico
1989 1991 1993 1995 1997 1999-0.2
-0.1
0.0
0.1
0.2
0.3
0.4
0.5
Argentina
1989 1991 1993 1995 1997 1999-0.2
0.0
0.2
0.4
0.6
0.8
Brazil
1989 1991 1993 1995 1997 1999-0.08
-0.04
0.00
0.04
0.08
0.12
0.16
0.20
0.24
Chile
1989 1991 1993 1995 1997 1999-0.05
0.00
0.05
0.10
0.15
0.20
Korea
1989 1991 1993 1995 1997 1999-0.05
0.00
0.05
0.10
0.15
0.20
0.25
0.30
Philippines
1989 1991 1993 1995 1997 1999-0.050
-0.025
0.000
0.025
0.050
0.075
0.100
0.125
0.150
Thailand
1989 1991 1993 1995 1997 1999-0.04
-0.03
-0.02
-0.01
0.00
0.01
0.02
0.03
0.04
Indonesia
1989 1991 1993 1995 1997 1999-0.10
-0.05
0.00
0.05
0.10
0.15
0.20
Malaysia
1989 1991 1993 1995 1997 1999-0.050
-0.025
0.000
0.025
0.050
0.075
Figure 7. Fit of Long-Horizon Regressions (1989-1999)
Note: Solid lines show actual 12-month ahead equity flows; dashed lines are fitted values fromregressions in Table 5.

41
Recursive estimates of Constant
1993 1994 1995 1996 1997 1998 1999-2.5
0.0
2.5
5.0
7.5
10.0
12.5
15.0
17.5
20.0
Recursive estimates of RISK
1993 1994 1995 1996 1997 1998 1999-4.8
-4.0
-3.2
-2.4
-1.6
-0.8
-0.0
0.8
Recursive estimates of FOR
1993 1994 1995 1996 1997 1998 1999-1.12
-0.96
-0.80
-0.64
-0.48
-0.32
-0.16
0.00
0.16
Recursive estimates of CBL
1993 1994 1995 1996 1997 1998 1999-3.0
-2.5
-2.0
-1.5
-1.0
-0.5
0.0
0.5
1.0
1.5
Recursive estimates of RET
1993 1994 1995 1996 1997 1998 1999-0.0025
0.0000
0.0025
0.0050
Recursive estimates of DY
1993 1994 1995 1996 1997 1998 19990.000
0.025
0.050
0.075
0.100
0.125
0.150
0.175
Recursive estimates of US IP
1993 1994 1995 1996 1997 1998 1999-0.08
-0.06
-0.04
-0.02
0.00
0.02
0.04
Recursive estimates of US Bond
1993 1994 1995 1996 1997 1998 1999-0.125
-0.100
-0.075
-0.050
-0.025
-0.000
0.025
0.050
0.075
Figure 8. Coefficient Estimates from Rolling Regressions – Mexico
Note: In each panel, the coefficient estimate (middle line) is surrounded by two lines depicting a10 percent confidence interval.
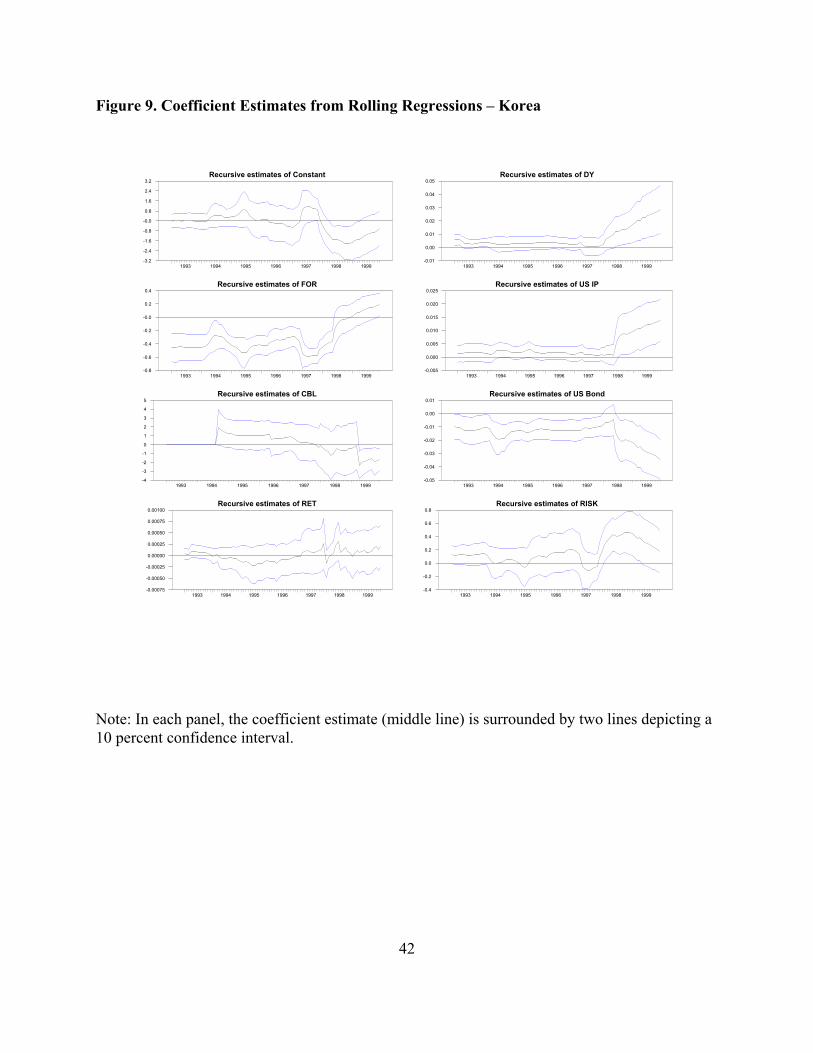
42
Recursive estimates of Constant
1993 1994 1995 1996 1997 1998 1999-3.2
-2.4
-1.6
-0.8
-0.0
0.8
1.6
2.4
3.2
Recursive estimates of FOR
1993 1994 1995 1996 1997 1998 1999-0.8
-0.6
-0.4
-0.2
-0.0
0.2
0.4
Recursive estimates of CBL
1993 1994 1995 1996 1997 1998 1999-4
-3
-2
-1
0
1
2
3
4
5
Recursive estimates of RET
1993 1994 1995 1996 1997 1998 1999-0.00075
-0.00050
-0.00025
0.00000
0.00025
0.00050
0.00075
0.00100
Recursive estimates of DY
1993 1994 1995 1996 1997 1998 1999-0.01
0.00
0.01
0.02
0.03
0.04
0.05
Recursive estimates of US IP
1993 1994 1995 1996 1997 1998 1999-0.005
0.000
0.005
0.010
0.015
0.020
0.025
Recursive estimates of US Bond
1993 1994 1995 1996 1997 1998 1999-0.05
-0.04
-0.03
-0.02
-0.01
0.00
0.01
Recursive estimates of RISK
1993 1994 1995 1996 1997 1998 1999-0.4
-0.2
0.0
0.2
0.4
0.6
0.8
Figure 9. Coefficient Estimates from Rolling Regressions – Korea
Note: In each panel, the coefficient estimate (middle line) is surrounded by two lines depicting a10 percent confidence interval.
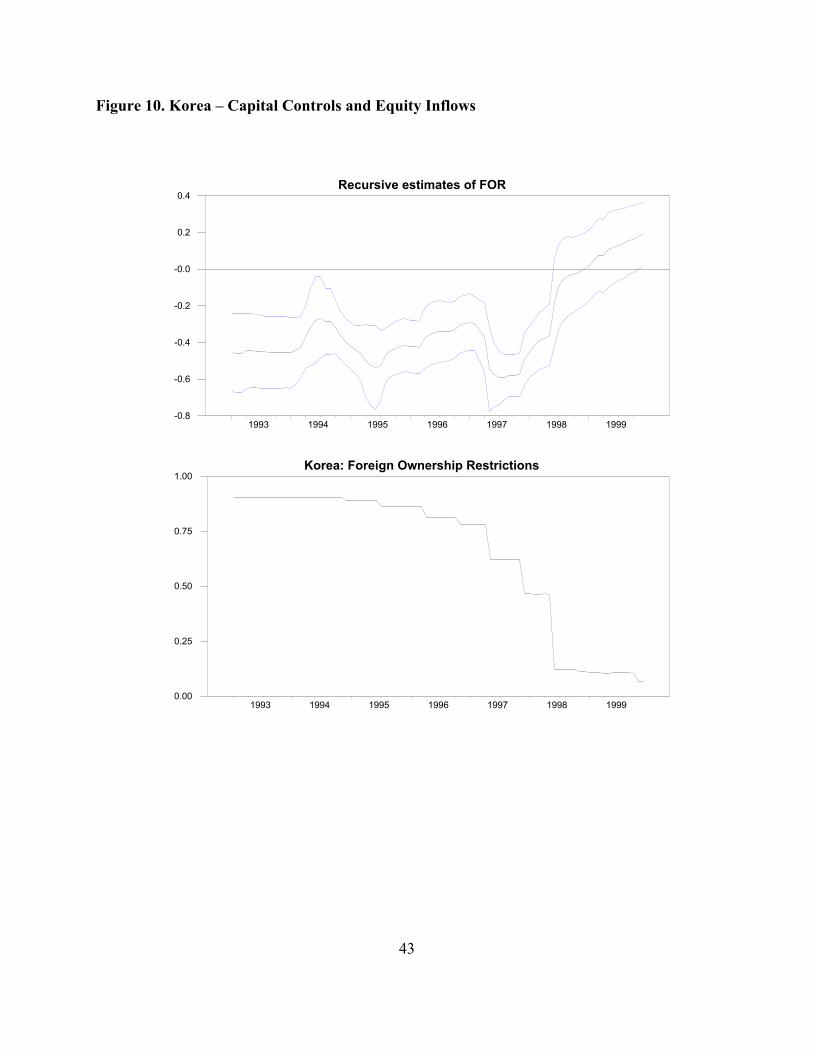
43
Recursive estimates of FOR
1993 1994 1995 1996 1997 1998 1999-0.8
-0.6
-0.4
-0.2
-0.0
0.2
0.4
Korea: Foreign Ownership Restrictions
1993 1994 1995 1996 1997 1998 19990.00
0.25
0.50
0.75
1.00
Figure 10. Korea – Capital Controls and Equity Inflows