Embed Size (px)
Citation preview
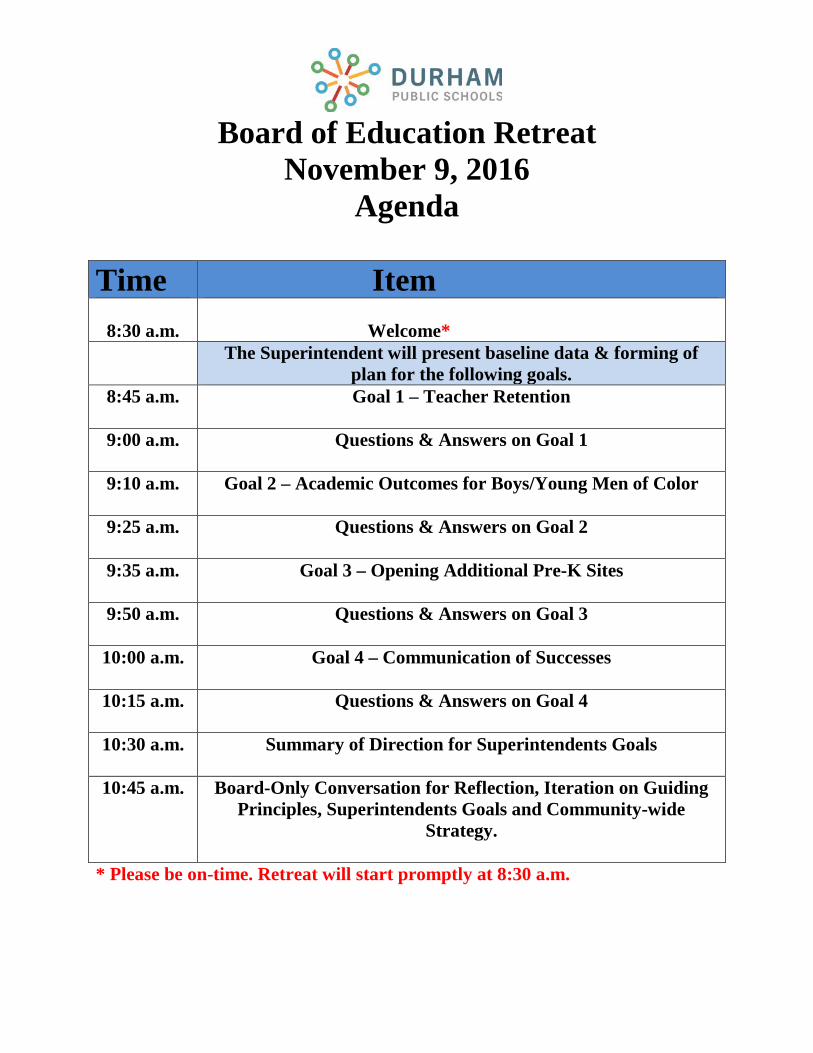
Board of Education Retreat November 9, 2016
Agenda
Time Item
8:30 a.m.
Welcome* The Superintendent will present baseline data & forming of
plan for the following goals. 8:45 a.m. Goal 1 – Teacher Retention
9:00 a.m. Questions & Answers on Goal 1
9:10 a.m. Goal 2 – Academic Outcomes for Boys/Young Men of Color
9:25 a.m. Questions & Answers on Goal 2
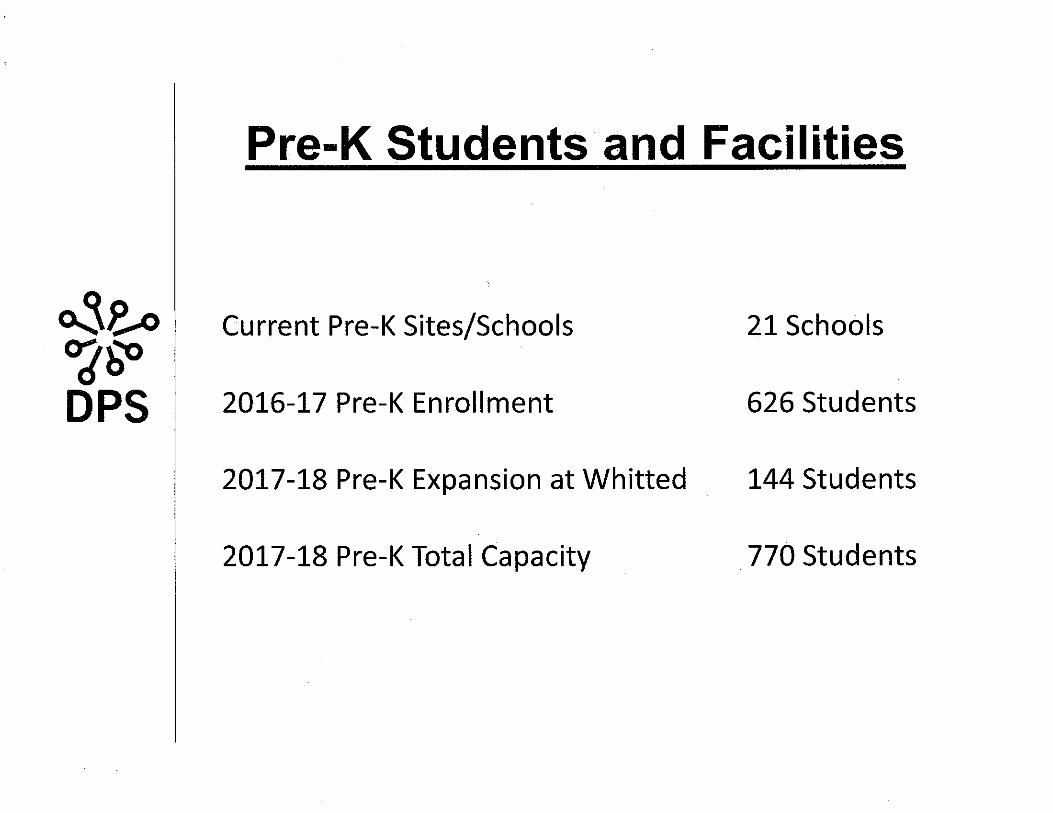
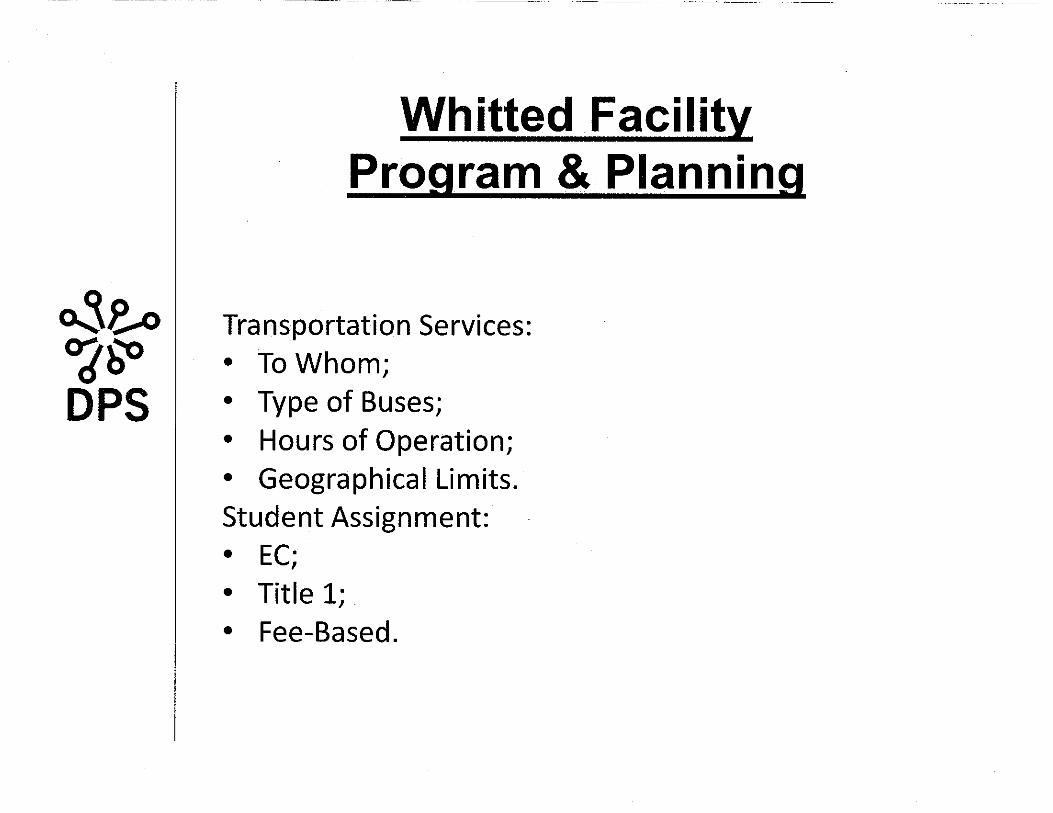
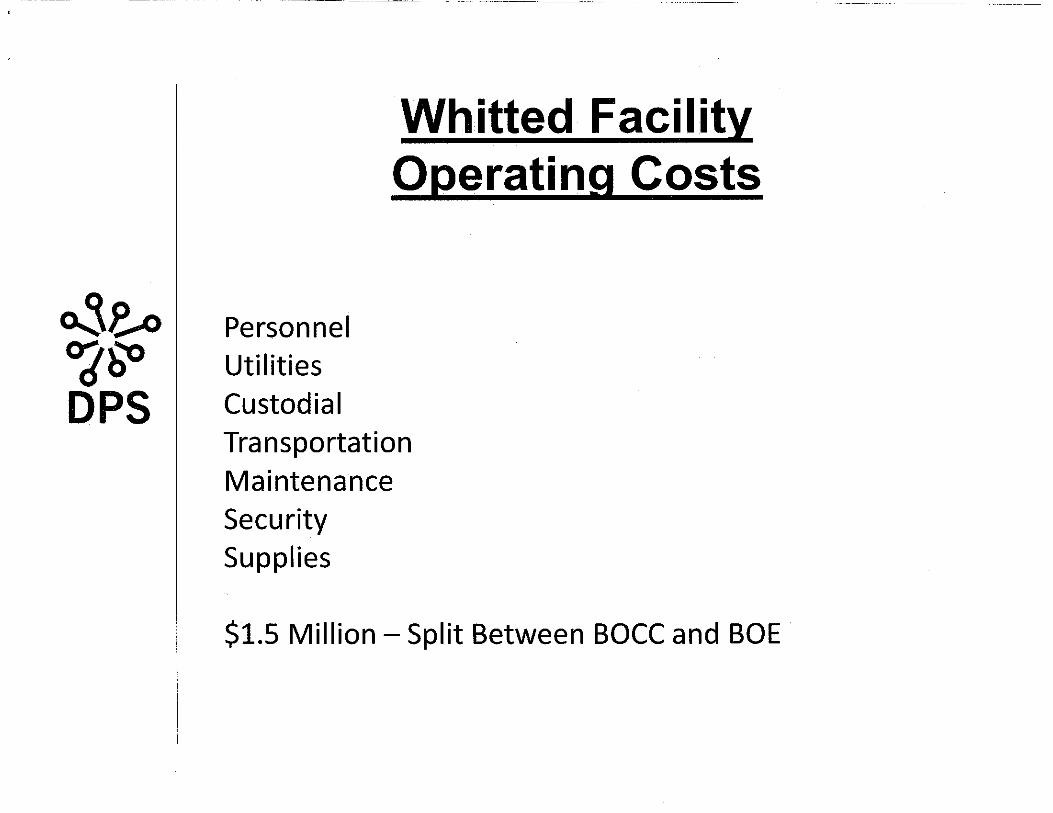
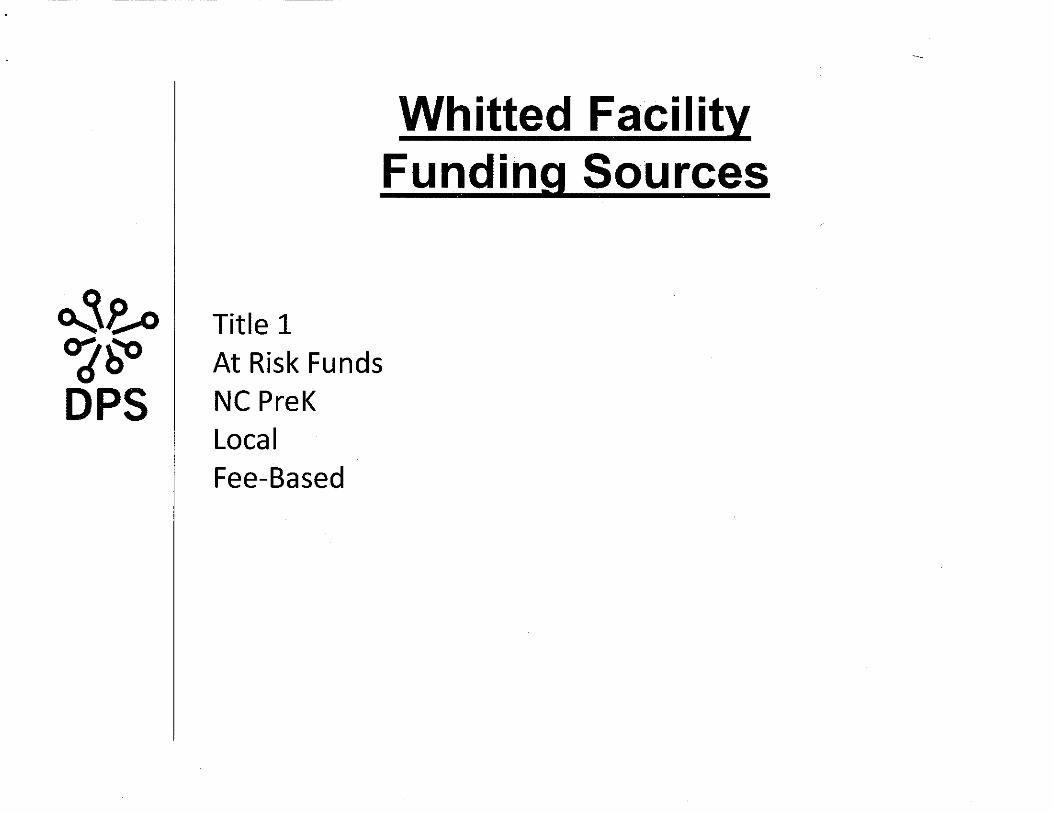
9:35 a.m. Goal 3 – Opening Additional Pre-K Sites
9:50 a.m. Questions & Answers on Goal 3
10:00 a.m. Goal 4 – Communication of Successes
10:15 a.m. Questions & Answers on Goal 4
10:30 a.m. Summary of Direction for Superintendents Goals
10:45 a.m. Board-Only Conversation for Reflection, Iteration on Guiding
Principles, Superintendents Goals and Community-wide Strategy.
* Please be on-time. Retreat will start promptly at 8:30 a.m.
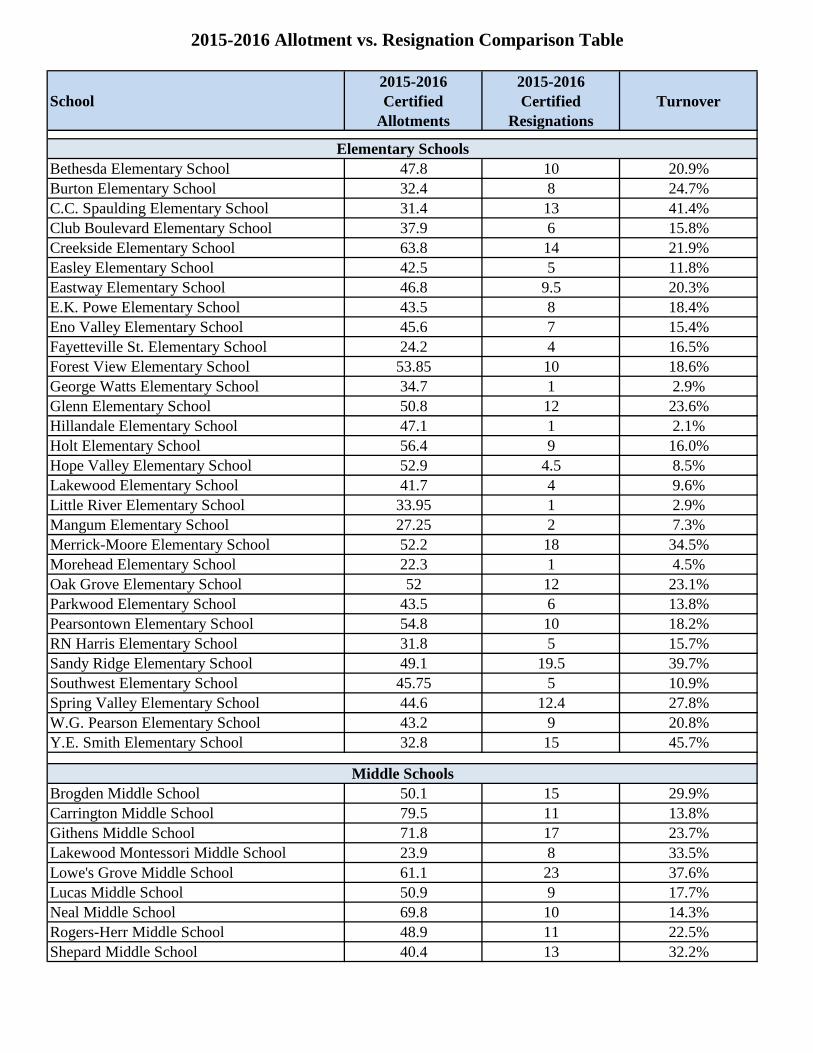
2015-2016 Allotment vs. Resignation Comparison Table
School2015-2016 Certified
Allotments
2015-2016 Certified
ResignationsTurnover
Bethesda Elementary School 47.8 10 20.9%Burton Elementary School 32.4 8 24.7%C.C. Spaulding Elementary School 31.4 13 41.4%Club Boulevard Elementary School 37.9 6 15.8%Creekside Elementary School 63.8 14 21.9%Easley Elementary School 42.5 5 11.8%Eastway Elementary School 46.8 9.5 20.3%E.K. Powe Elementary School 43.5 8 18.4%Eno Valley Elementary School 45.6 7 15.4%Fayetteville St. Elementary School 24.2 4 16.5%Forest View Elementary School 53.85 10 18.6%George Watts Elementary School 34.7 1 2.9%Glenn Elementary School 50.8 12 23.6%Hillandale Elementary School 47.1 1 2.1%Holt Elementary School 56.4 9 16.0%Hope Valley Elementary School 52.9 4.5 8.5%Lakewood Elementary School 41.7 4 9.6%Little River Elementary School 33.95 1 2.9%Mangum Elementary School 27.25 2 7.3%Merrick-Moore Elementary School 52.2 18 34.5%Morehead Elementary School 22.3 1 4.5%Oak Grove Elementary School 52 12 23.1%Parkwood Elementary School 43.5 6 13.8%Pearsontown Elementary School 54.8 10 18.2%RN Harris Elementary School 31.8 5 15.7%Sandy Ridge Elementary School 49.1 19.5 39.7%Southwest Elementary School 45.75 5 10.9%Spring Valley Elementary School 44.6 12.4 27.8%W.G. Pearson Elementary School 43.2 9 20.8%Y.E. Smith Elementary School 32.8 15 45.7%
Brogden Middle School 50.1 15 29.9%Carrington Middle School 79.5 11 13.8%Githens Middle School 71.8 17 23.7%Lakewood Montessori Middle School 23.9 8 33.5%Lowe's Grove Middle School 61.1 23 37.6%Lucas Middle School 50.9 9 17.7%Neal Middle School 69.8 10 14.3%Rogers-Herr Middle School 48.9 11 22.5%Shepard Middle School 40.4 13 32.2%
Middle Schools
Elementary Schools
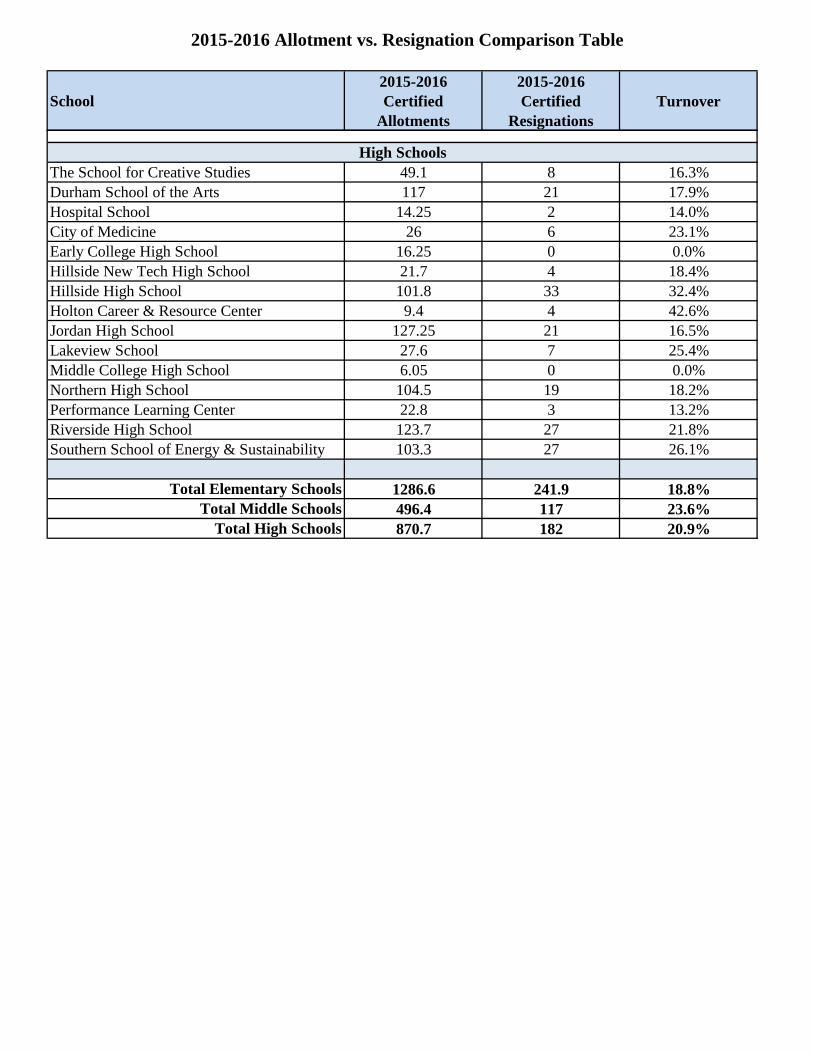
2015-2016 Allotment vs. Resignation Comparison Table
School2015-2016 Certified
Allotments
2015-2016 Certified
ResignationsTurnover
The School for Creative Studies 49.1 8 16.3%Durham School of the Arts 117 21 17.9%Hospital School 14.25 2 14.0%City of Medicine 26 6 23.1%Early College High School 16.25 0 0.0%Hillside New Tech High School 21.7 4 18.4%Hillside High School 101.8 33 32.4%Holton Career & Resource Center 9.4 4 42.6%Jordan High School 127.25 21 16.5%Lakeview School 27.6 7 25.4%Middle College High School 6.05 0 0.0%Northern High School 104.5 19 18.2%Performance Learning Center 22.8 3 13.2%Riverside High School 123.7 27 21.8%Southern School of Energy & Sustainability 103.3 27 26.1%
Total Elementary Schools 1286.6 241.9 18.8%Total Middle Schools 496.4 117 23.6%
Total High Schools 870.7 182 20.9%
High Schools
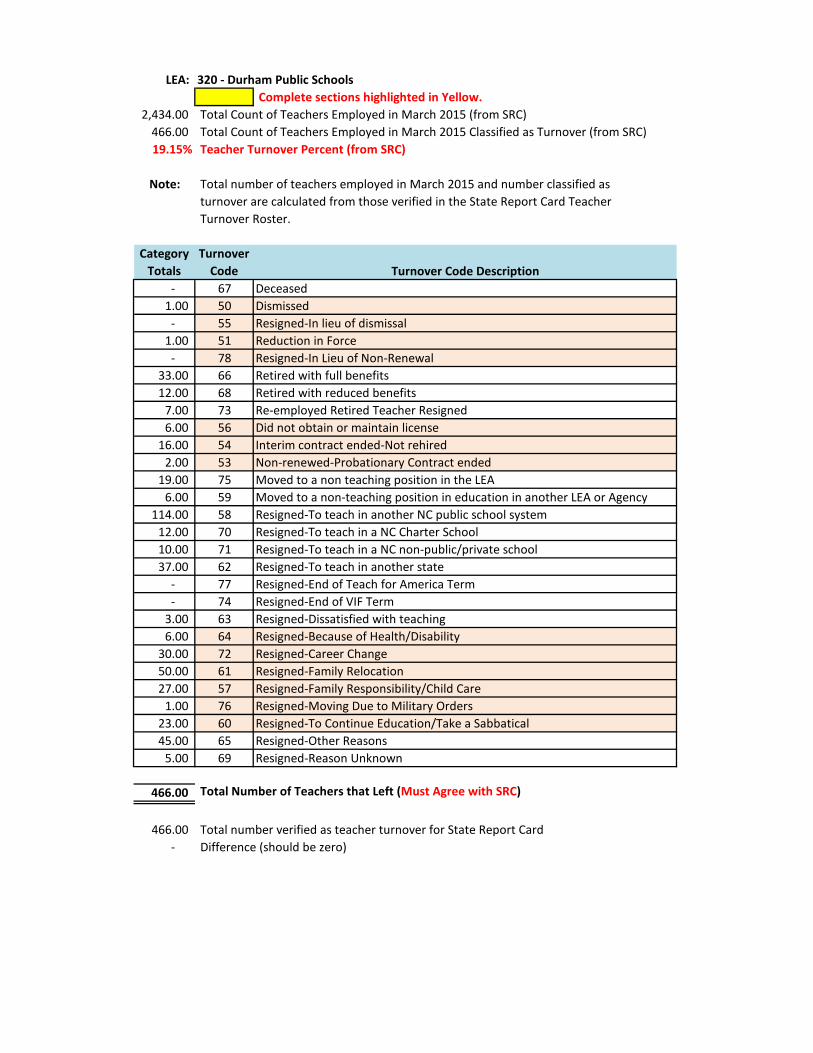
LEA: 320 - Durham Public Schools Complete sections highlighted in Yellow.
2,434.00 Total Count of Teachers Employed in March 2015 (from SRC)466.00 Total Count of Teachers Employed in March 2015 Classified as Turnover (from SRC)19.15% Teacher Turnover Percent (from SRC)
Note: Total number of teachers employed in March 2015 and number classified as turnover are calculated from those verified in the State Report Card Teacher Turnover Roster.
Category Totals
Turnover Code Turnover Code Description
- 67 Deceased1.00 50 Dismissed
- 55 Resigned-In lieu of dismissal1.00 51 Reduction in Force
- 78 Resigned-In Lieu of Non-Renewal33.00 66 Retired with full benefits12.00 68 Retired with reduced benefits
7.00 73 Re-employed Retired Teacher Resigned6.00 56 Did not obtain or maintain license
16.00 54 Interim contract ended-Not rehired2.00 53 Non-renewed-Probationary Contract ended
19.00 75 Moved to a non teaching position in the LEA6.00 59 Moved to a non-teaching position in education in another LEA or Agency
114.00 58 Resigned-To teach in another NC public school system12.00 70 Resigned-To teach in a NC Charter School10.00 71 Resigned-To teach in a NC non-public/private school37.00 62 Resigned-To teach in another state
- 77 Resigned-End of Teach for America Term- 74 Resigned-End of VIF Term
3.00 63 Resigned-Dissatisfied with teaching6.00 64 Resigned-Because of Health/Disability
30.00 72 Resigned-Career Change50.00 61 Resigned-Family Relocation27.00 57 Resigned-Family Responsibility/Child Care
1.00 76 Resigned-Moving Due to Military Orders23.00 60 Resigned-To Continue Education/Take a Sabbatical45.00 65 Resigned-Other Reasons
5.00 69 Resigned-Reason Unknown
466.00 Total Number of Teachers that Left (Must Agree with SRC)
466.00 Total number verified as teacher turnover for State Report Card- Difference (should be zero)
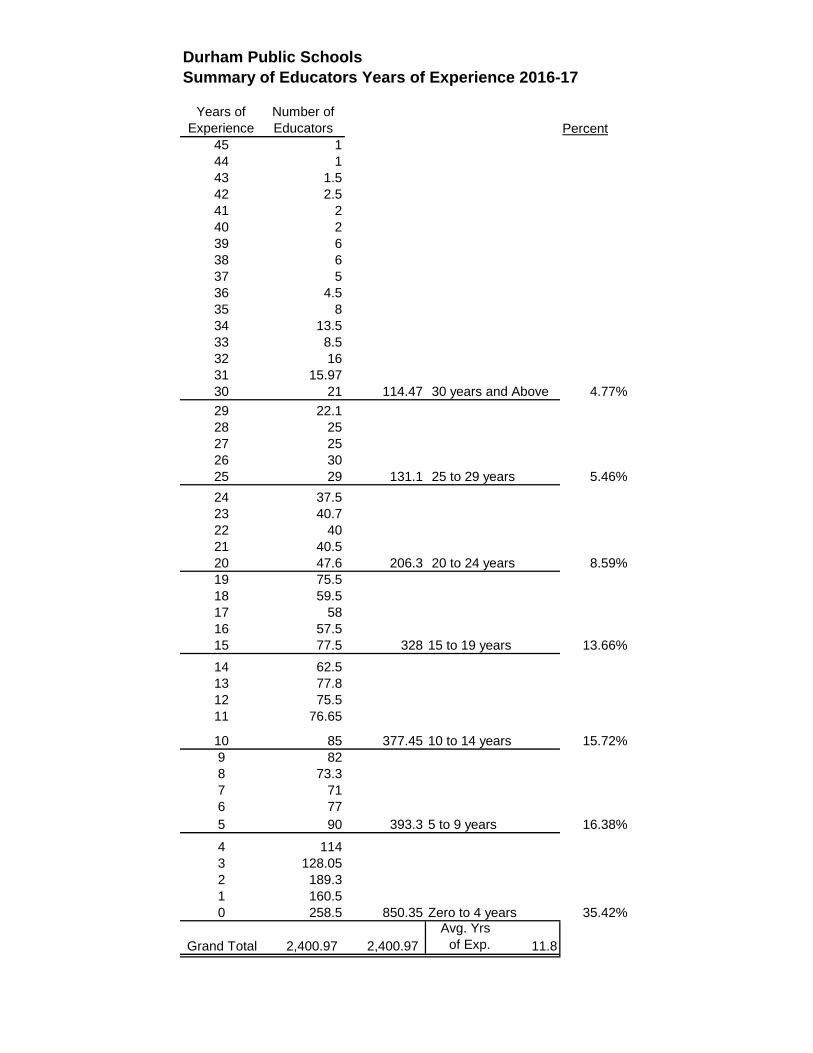
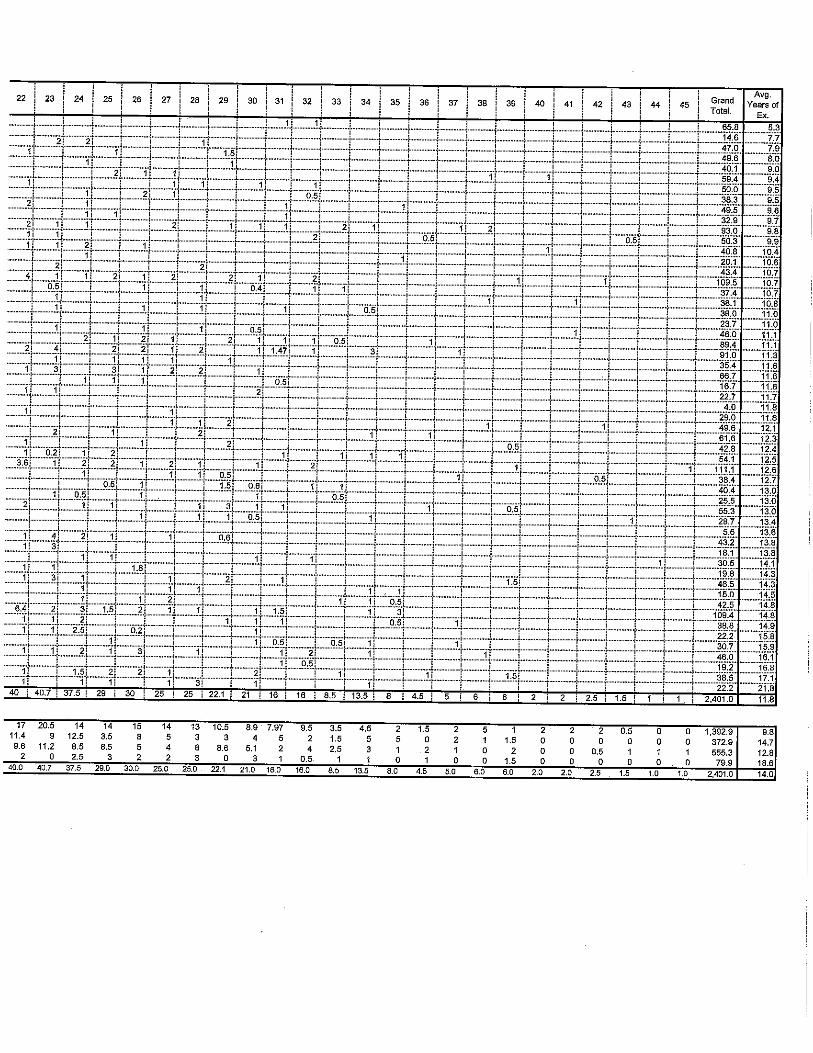
Durham Public Schools Summary of Educators Years of Experience 2016-17
Years of Experience
Number of Educators Percent
45 144 143 1.542 2.541 240 239 638 637 536 4.535 834 13.533 8.532 1631 15.9730 21 114.47 30 years and Above 4.77%29 22.128 2527 2526 3025 29 131.1 25 to 29 years 5.46%24 37.523 40.722 4021 40.520 47.6 206.3 20 to 24 years 8.59%19 75.518 59.517 5816 57.515 77.5 328 15 to 19 years 13.66%14 62.513 77.812 75.511 76.65
10 85 377.45 10 to 14 years 15.72%9 828 73.37 716 775 90 393.3 5 to 9 years 16.38%
4 1143 128.052 189.31 160.50 258.5 850.35 Zero to 4 years 35.42%
Grand Total 2,400.97 2,400.97 Avg. Yrs
of Exp. 11.8

Teacher Recruitment and Retention Plan
Goal
Teacher Retention and district average experience level rates should begin to improve this year.
Recruitment Strategies
• Maintaining and strengthening current relationships with local universities, including North Carolina Central University, Duke, UNC- Greensboro, North Carolina State University, UNC – Chapel Hill, and Appalachian State.
• Updating marketing brochure to include a polished presentation of Durham Public School’s finest teachers. Showcasing our three Most Outstanding Beginning Teachers.
• Doubling the number of early contracts from 25 to 50 for 2016-2017 through increased use of Skype interviewing targeting student teachers, recent graduates from College/Universities visited and candidates from virtual Educational Fairs.
• Selecting and attending effective jobs fairs with strong teaching programs (see attached recruiting schedule).
• Intentional and increased outreach to HBCUs student teaching programs and recruitment fairs.
• Targeting current MSA Student Teachers with closing ceremony and priority interviews. • Sponsoring the Durham Public Schools Teacher Career Fair on April 1, 2017 which will
be a month ahead of district spring break and Wake County’s job fair. • Identify Durham Public Schools high schools with Future Teacher programs/clubs and
begin to develop a pool of future Durham Public Schools teachers through mentorship and career shadowing opportunities.
Retention Strategies
• Increase local teacher supplements. • Professional Development opportunities. • Electronic Exit Survey. • Beginning Teacher Program.
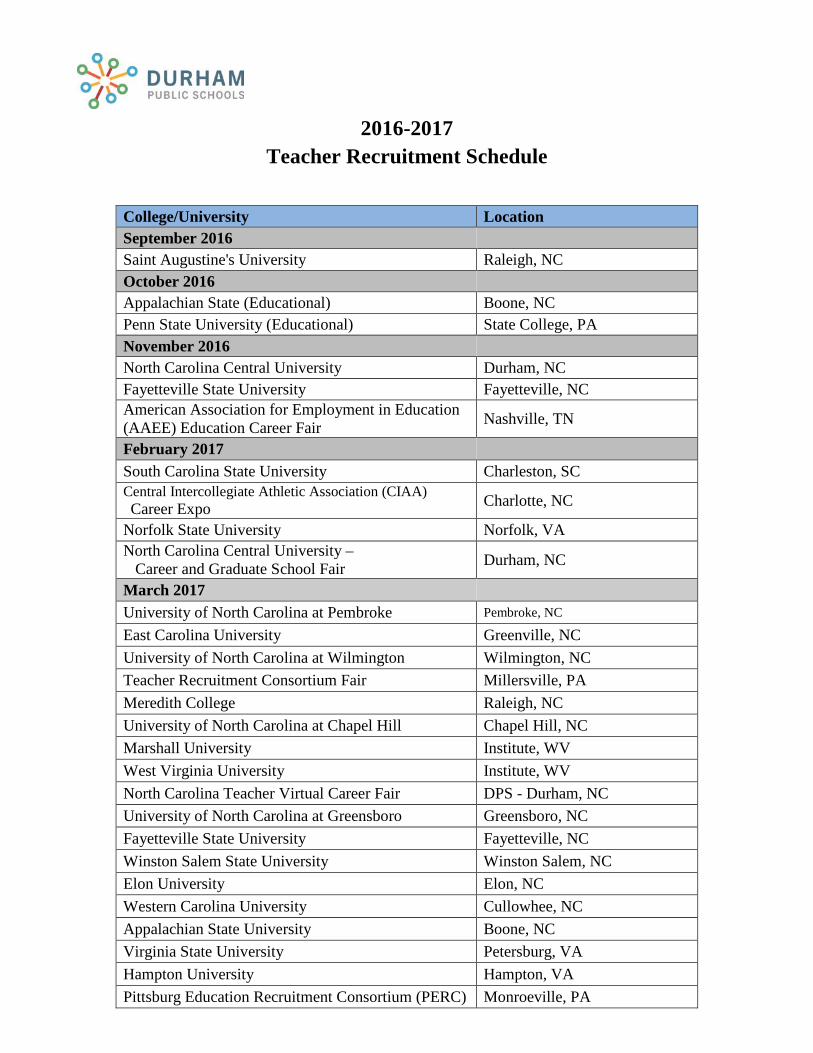
2016-2017 Teacher Recruitment Schedule
College/University Location September 2016
Saint Augustine's University Raleigh, NC October 2016
Appalachian State (Educational) Boone, NC Penn State University (Educational) State College, PA November 2016
North Carolina Central University Durham, NC Fayetteville State University Fayetteville, NC American Association for Employment in Education (AAEE) Education Career Fair Nashville, TN
February 2017
South Carolina State University Charleston, SC Central Intercollegiate Athletic Association (CIAA) Career Expo Charlotte, NC
Norfolk State University Norfolk, VA North Carolina Central University – Career and Graduate School Fair Durham, NC
March 2017
University of North Carolina at Pembroke Pembroke, NC
East Carolina University Greenville, NC University of North Carolina at Wilmington Wilmington, NC Teacher Recruitment Consortium Fair Millersville, PA Meredith College Raleigh, NC University of North Carolina at Chapel Hill Chapel Hill, NC Marshall University Institute, WV West Virginia University Institute, WV North Carolina Teacher Virtual Career Fair DPS - Durham, NC University of North Carolina at Greensboro Greensboro, NC Fayetteville State University Fayetteville, NC Winston Salem State University Winston Salem, NC Elon University Elon, NC Western Carolina University Cullowhee, NC Appalachian State University Boone, NC Virginia State University Petersburg, VA Hampton University Hampton, VA Pittsburg Education Recruitment Consortium (PERC) Monroeville, PA
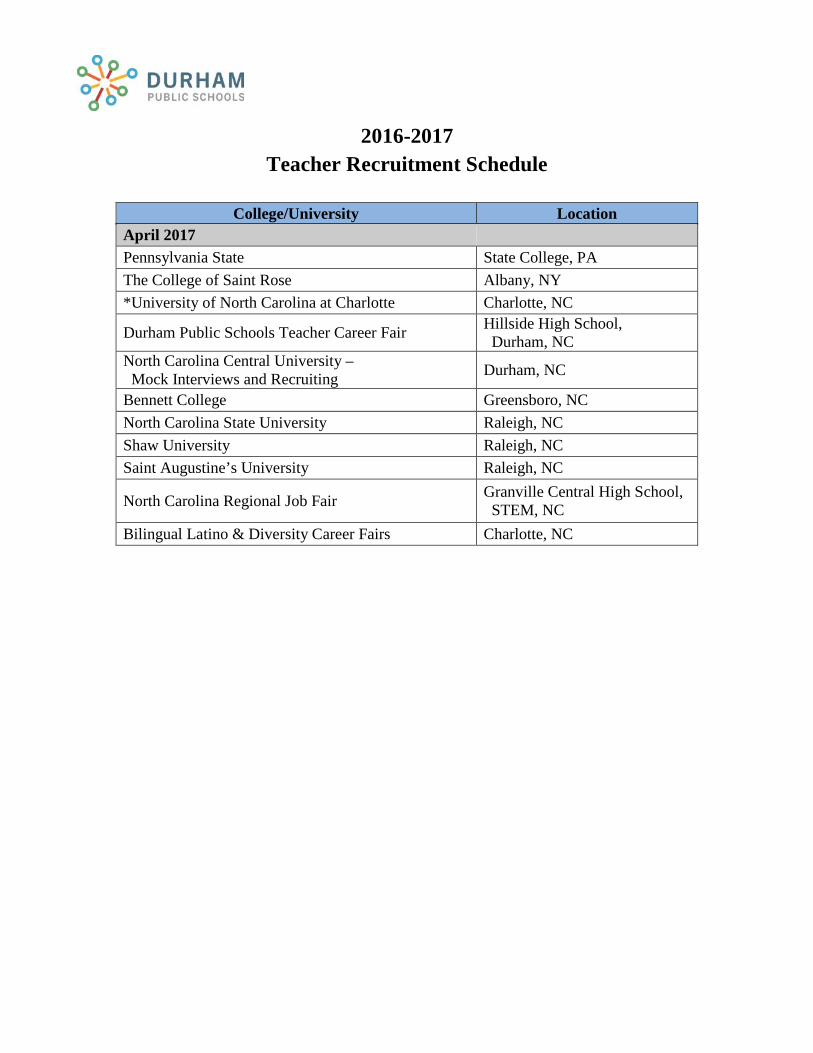
2016-2017 Teacher Recruitment Schedule
College/University Location April 2017 Pennsylvania State State College, PA The College of Saint Rose Albany, NY *University of North Carolina at Charlotte Charlotte, NC
Durham Public Schools Teacher Career Fair Hillside High School, Durham, NC
North Carolina Central University – Mock Interviews and Recruiting Durham, NC
Bennett College Greensboro, NC North Carolina State University Raleigh, NC Shaw University Raleigh, NC Saint Augustine’s University Raleigh, NC
North Carolina Regional Job Fair Granville Central High School, STEM, NC
Bilingual Latino & Diversity Career Fairs Charlotte, NC
ALL GENDER BLACK HISP WHITE OTHER
District School Assessment Total
TestedTotal % Prof
%Prof (#Tested)
M
%Prof (#Tested)
F
%Prof (#Tested)
M
%Prof (#Tested)
F
%Prof (#Tested)
M
%Prof (#Tested)
F
%Prof (#Tested)
M
%Prof (#Tested)
F
%Prof (#Tested)
M
%Prof (#Tested)
F
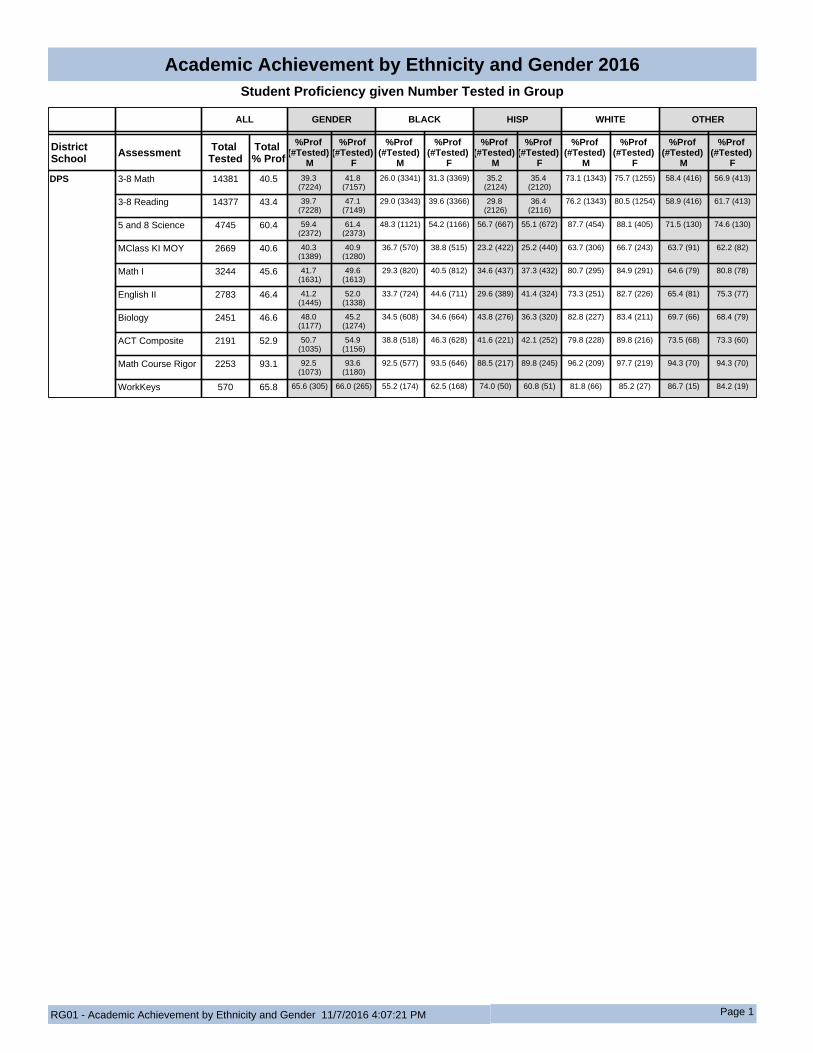
DPS 3-8 Math 14381 40.5 39.3 (7224)
41.8 (7157)
26.0 (3341) 31.3 (3369) 35.2 (2124)
35.4 (2120)
73.1 (1343) 75.7 (1255) 58.4 (416) 56.9 (413)
3-8 Reading 14377 43.4 39.7 (7228)
47.1 (7149)
29.0 (3343) 39.6 (3366) 29.8 (2126)
36.4 (2116)
76.2 (1343) 80.5 (1254) 58.9 (416) 61.7 (413)
5 and 8 Science 4745 60.4 59.4 (2372)
61.4 (2373)
48.3 (1121) 54.2 (1166) 56.7 (667) 55.1 (672) 87.7 (454) 88.1 (405) 71.5 (130) 74.6 (130)
MClass KI MOY 2669 40.6 40.3 (1389)
40.9 (1280)
36.7 (570) 38.8 (515) 23.2 (422) 25.2 (440) 63.7 (306) 66.7 (243) 63.7 (91) 62.2 (82)
Math I 3244 45.6 41.7 (1631)
49.6 (1613)
29.3 (820) 40.5 (812) 34.6 (437) 37.3 (432) 80.7 (295) 84.9 (291) 64.6 (79) 80.8 (78)
English II 2783 46.4 41.2 (1445)
52.0 (1338)
33.7 (724) 44.6 (711) 29.6 (389) 41.4 (324) 73.3 (251) 82.7 (226) 65.4 (81) 75.3 (77)
Biology 2451 46.6 48.0 (1177)
45.2 (1274)
34.5 (608) 34.6 (664) 43.8 (276) 36.3 (320) 82.8 (227) 83.4 (211) 69.7 (66) 68.4 (79)
ACT Composite 2191 52.9 50.7 (1035)
54.9 (1156)
38.8 (518) 46.3 (628) 41.6 (221) 42.1 (252) 79.8 (228) 89.8 (216) 73.5 (68) 73.3 (60)
Math Course Rigor 2253 93.1 92.5 (1073)
93.6 (1180)
92.5 (577) 93.5 (646) 88.5 (217) 89.8 (245) 96.2 (209) 97.7 (219) 94.3 (70) 94.3 (70)
WorkKeys 570 65.8 65.6 (305) 66.0 (265) 55.2 (174) 62.5 (168) 74.0 (50) 60.8 (51) 81.8 (66) 85.2 (27) 86.7 (15) 84.2 (19)
RG01 - Academic Achievement by Ethnicity and Gender 11/7/2016 4:07:21 PM Page 1
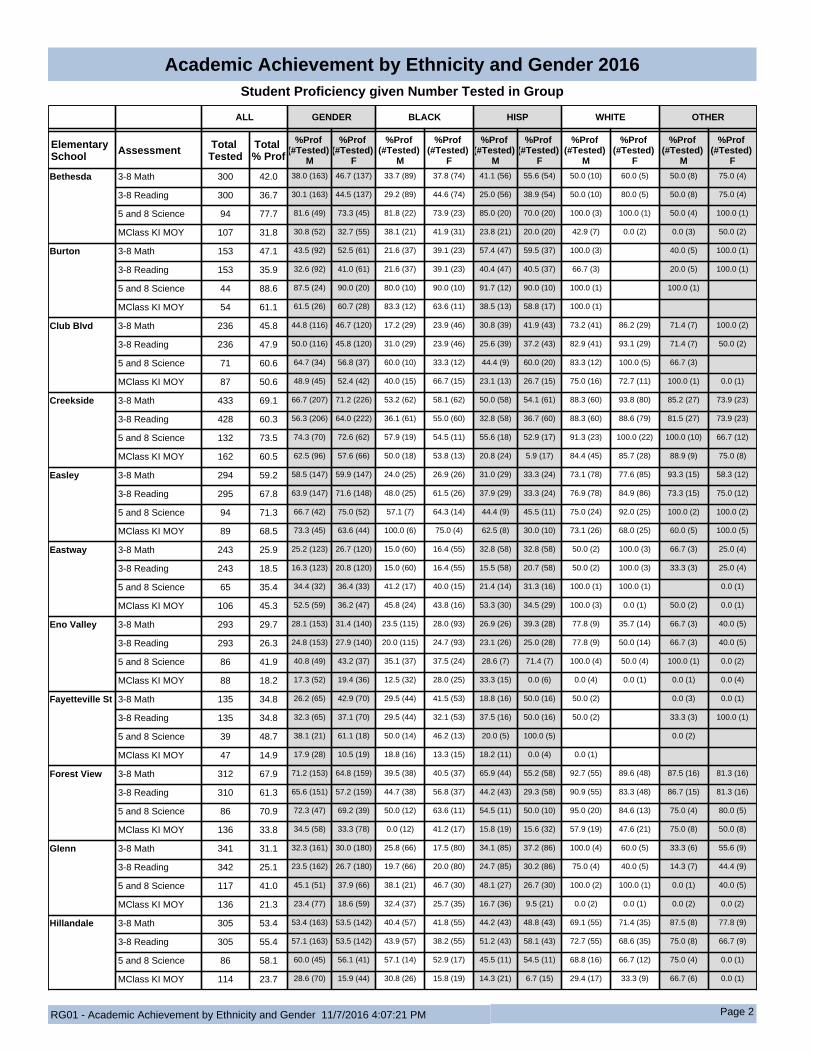
Academic Achievement by Ethnicity and Gender 2016Student Proficiency given Number Tested in Group
Research and Accountability
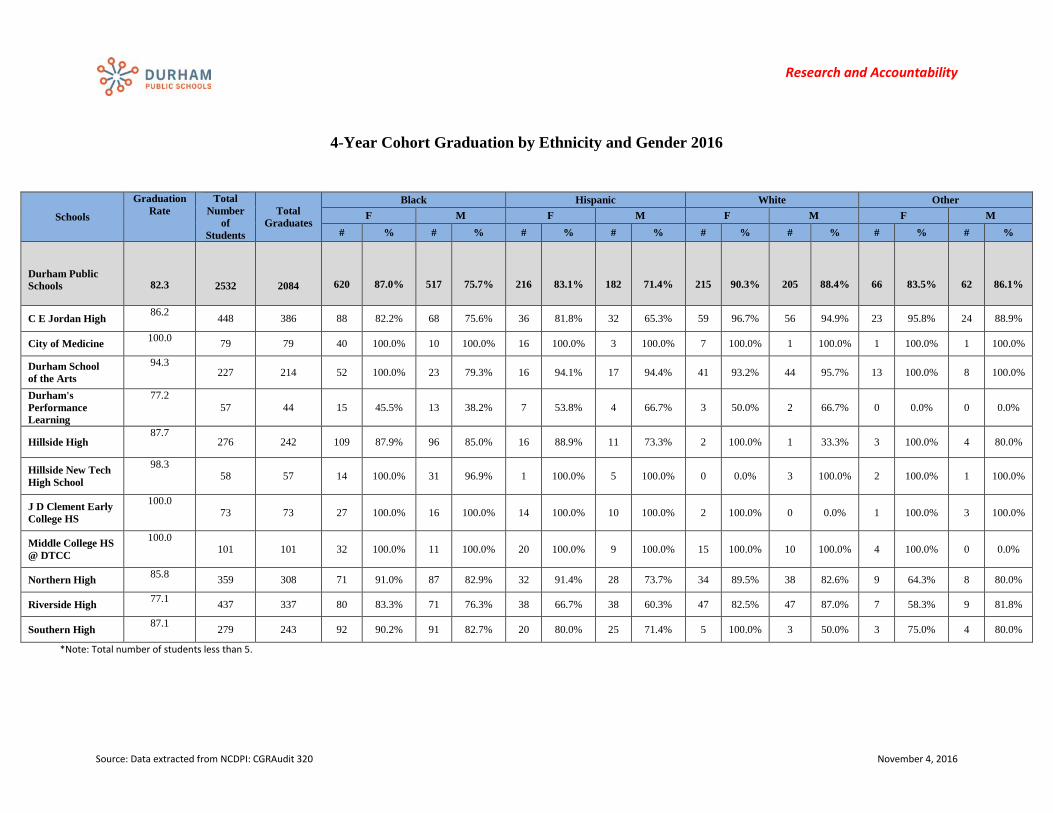
4-Year Cohort Graduation by Ethnicity and Gender 2016
*Note: Total number of students less than 5.
Schools
Graduation Rate
Total Number
of Students
Total Graduates
Black Hispanic White Other F M F M F M F M
# % # % # % # % # % # % # % # %
Durham Public Schools
82.3 2532 2084 620 87.0% 517 75.7% 216 83.1% 182 71.4% 215 90.3% 205 88.4% 66 83.5% 62 86.1%
C E Jordan High 86.2 448 386 88 82.2% 68 75.6% 36 81.8% 32 65.3% 59 96.7% 56 94.9% 23 95.8% 24 88.9%
City of Medicine 100.0 79 79 40 100.0% 10 100.0% 16 100.0% 3 100.0% 7 100.0% 1 100.0% 1 100.0% 1 100.0%
Durham School of the Arts
94.3 227 214 52 100.0% 23 79.3% 16 94.1% 17 94.4% 41 93.2% 44 95.7% 13 100.0% 8 100.0%
Durham's Performance Learning
77.2 57 44 15 45.5% 13 38.2% 7 53.8% 4 66.7% 3 50.0% 2 66.7% 0 0.0% 0 0.0%
Hillside High 87.7
276 242 109 87.9% 96 85.0% 16 88.9% 11 73.3% 2 100.0% 1 33.3% 3 100.0% 4 80.0%
Hillside New Tech High School
98.3 58 57 14 100.0% 31 96.9% 1 100.0% 5 100.0% 0 0.0% 3 100.0% 2 100.0% 1 100.0%
J D Clement Early College HS
100.0 73 73 27 100.0% 16 100.0% 14 100.0% 10 100.0% 2 100.0% 0 0.0% 1 100.0% 3 100.0%
Middle College HS @ DTCC
100.0 101 101 32 100.0% 11 100.0% 20 100.0% 9 100.0% 15 100.0% 10 100.0% 4 100.0% 0 0.0%
Northern High 85.8 359 308 71 91.0% 87 82.9% 32 91.4% 28 73.7% 34 89.5% 38 82.6% 9 64.3% 8 80.0%
Riverside High 77.1 437 337 80 83.3% 71 76.3% 38 66.7% 38 60.3% 47 82.5% 47 87.0% 7 58.3% 9 81.8%
Southern High 87.1 279 243 92 90.2% 91 82.7% 20 80.0% 25 71.4% 5 100.0% 3 50.0% 3 75.0% 4 80.0%
Source: Data extracted from NCDPI: CGRAudit 320 November 4, 2016
ALL GENDER BLACK HISP WHITE OTHER
Elementary School Assessment Total
TestedTotal % Prof
%Prof (#Tested)
M
%Prof (#Tested)
F
%Prof (#Tested)
M
%Prof (#Tested)
F
%Prof (#Tested)
M
%Prof (#Tested)
F
%Prof (#Tested)
M
%Prof (#Tested)
F
%Prof (#Tested)
M
%Prof (#Tested)
F
Bethesda 3-8 Math 300 42.0 38.0 (163) 46.7 (137) 33.7 (89) 37.8 (74) 41.1 (56) 55.6 (54) 50.0 (10) 60.0 (5) 50.0 (8) 75.0 (4)
3-8 Reading 300 36.7 30.1 (163) 44.5 (137) 29.2 (89) 44.6 (74) 25.0 (56) 38.9 (54) 50.0 (10) 80.0 (5) 50.0 (8) 75.0 (4)
5 and 8 Science 94 77.7 81.6 (49) 73.3 (45) 81.8 (22) 73.9 (23) 85.0 (20) 70.0 (20) 100.0 (3) 100.0 (1) 50.0 (4) 100.0 (1)
MClass KI MOY 107 31.8 30.8 (52) 32.7 (55) 38.1 (21) 41.9 (31) 23.8 (21) 20.0 (20) 42.9 (7) 0.0 (2) 0.0 (3) 50.0 (2)
Burton 3-8 Math 153 47.1 43.5 (92) 52.5 (61) 21.6 (37) 39.1 (23) 57.4 (47) 59.5 (37) 100.0 (3) 40.0 (5) 100.0 (1)
3-8 Reading 153 35.9 32.6 (92) 41.0 (61) 21.6 (37) 39.1 (23) 40.4 (47) 40.5 (37) 66.7 (3) 20.0 (5) 100.0 (1)
5 and 8 Science 44 88.6 87.5 (24) 90.0 (20) 80.0 (10) 90.0 (10) 91.7 (12) 90.0 (10) 100.0 (1) 100.0 (1)
MClass KI MOY 54 61.1 61.5 (26) 60.7 (28) 83.3 (12) 63.6 (11) 38.5 (13) 58.8 (17) 100.0 (1)
Club Blvd 3-8 Math 236 45.8 44.8 (116) 46.7 (120) 17.2 (29) 23.9 (46) 30.8 (39) 41.9 (43) 73.2 (41) 86.2 (29) 71.4 (7) 100.0 (2)
3-8 Reading 236 47.9 50.0 (116) 45.8 (120) 31.0 (29) 23.9 (46) 25.6 (39) 37.2 (43) 82.9 (41) 93.1 (29) 71.4 (7) 50.0 (2)
5 and 8 Science 71 60.6 64.7 (34) 56.8 (37) 60.0 (10) 33.3 (12) 44.4 (9) 60.0 (20) 83.3 (12) 100.0 (5) 66.7 (3)
MClass KI MOY 87 50.6 48.9 (45) 52.4 (42) 40.0 (15) 66.7 (15) 23.1 (13) 26.7 (15) 75.0 (16) 72.7 (11) 100.0 (1) 0.0 (1)
Creekside 3-8 Math 433 69.1 66.7 (207) 71.2 (226) 53.2 (62) 58.1 (62) 50.0 (58) 54.1 (61) 88.3 (60) 93.8 (80) 85.2 (27) 73.9 (23)
3-8 Reading 428 60.3 56.3 (206) 64.0 (222) 36.1 (61) 55.0 (60) 32.8 (58) 36.7 (60) 88.3 (60) 88.6 (79) 81.5 (27) 73.9 (23)
5 and 8 Science 132 73.5 74.3 (70) 72.6 (62) 57.9 (19) 54.5 (11) 55.6 (18) 52.9 (17) 91.3 (23) 100.0 (22) 100.0 (10) 66.7 (12)
MClass KI MOY 162 60.5 62.5 (96) 57.6 (66) 50.0 (18) 53.8 (13) 20.8 (24) 5.9 (17) 84.4 (45) 85.7 (28) 88.9 (9) 75.0 (8)
Easley 3-8 Math 294 59.2 58.5 (147) 59.9 (147) 24.0 (25) 26.9 (26) 31.0 (29) 33.3 (24) 73.1 (78) 77.6 (85) 93.3 (15) 58.3 (12)
3-8 Reading 295 67.8 63.9 (147) 71.6 (148) 48.0 (25) 61.5 (26) 37.9 (29) 33.3 (24) 76.9 (78) 84.9 (86) 73.3 (15) 75.0 (12)
5 and 8 Science 94 71.3 66.7 (42) 75.0 (52) 57.1 (7) 64.3 (14) 44.4 (9) 45.5 (11) 75.0 (24) 92.0 (25) 100.0 (2) 100.0 (2)
MClass KI MOY 89 68.5 73.3 (45) 63.6 (44) 100.0 (6) 75.0 (4) 62.5 (8) 30.0 (10) 73.1 (26) 68.0 (25) 60.0 (5) 100.0 (5)
Eastway 3-8 Math 243 25.9 25.2 (123) 26.7 (120) 15.0 (60) 16.4 (55) 32.8 (58) 32.8 (58) 50.0 (2) 100.0 (3) 66.7 (3) 25.0 (4)
3-8 Reading 243 18.5 16.3 (123) 20.8 (120) 15.0 (60) 16.4 (55) 15.5 (58) 20.7 (58) 50.0 (2) 100.0 (3) 33.3 (3) 25.0 (4)
5 and 8 Science 65 35.4 34.4 (32) 36.4 (33) 41.2 (17) 40.0 (15) 21.4 (14) 31.3 (16) 100.0 (1) 100.0 (1) 0.0 (1)
MClass KI MOY 106 45.3 52.5 (59) 36.2 (47) 45.8 (24) 43.8 (16) 53.3 (30) 34.5 (29) 100.0 (3) 0.0 (1) 50.0 (2) 0.0 (1)
Eno Valley 3-8 Math 293 29.7 28.1 (153) 31.4 (140) 23.5 (115) 28.0 (93) 26.9 (26) 39.3 (28) 77.8 (9) 35.7 (14) 66.7 (3) 40.0 (5)
3-8 Reading 293 26.3 24.8 (153) 27.9 (140) 20.0 (115) 24.7 (93) 23.1 (26) 25.0 (28) 77.8 (9) 50.0 (14) 66.7 (3) 40.0 (5)
5 and 8 Science 86 41.9 40.8 (49) 43.2 (37) 35.1 (37) 37.5 (24) 28.6 (7) 71.4 (7) 100.0 (4) 50.0 (4) 100.0 (1) 0.0 (2)
MClass KI MOY 88 18.2 17.3 (52) 19.4 (36) 12.5 (32) 28.0 (25) 33.3 (15) 0.0 (6) 0.0 (4) 0.0 (1) 0.0 (1) 0.0 (4)
Fayetteville St 3-8 Math 135 34.8 26.2 (65) 42.9 (70) 29.5 (44) 41.5 (53) 18.8 (16) 50.0 (16) 50.0 (2) 0.0 (3) 0.0 (1)
3-8 Reading 135 34.8 32.3 (65) 37.1 (70) 29.5 (44) 32.1 (53) 37.5 (16) 50.0 (16) 50.0 (2) 33.3 (3) 100.0 (1)
5 and 8 Science 39 48.7 38.1 (21) 61.1 (18) 50.0 (14) 46.2 (13) 20.0 (5) 100.0 (5) 0.0 (2)
MClass KI MOY 47 14.9 17.9 (28) 10.5 (19) 18.8 (16) 13.3 (15) 18.2 (11) 0.0 (4) 0.0 (1)
Forest View 3-8 Math 312 67.9 71.2 (153) 64.8 (159) 39.5 (38) 40.5 (37) 65.9 (44) 55.2 (58) 92.7 (55) 89.6 (48) 87.5 (16) 81.3 (16)
3-8 Reading 310 61.3 65.6 (151) 57.2 (159) 44.7 (38) 56.8 (37) 44.2 (43) 29.3 (58) 90.9 (55) 83.3 (48) 86.7 (15) 81.3 (16)
5 and 8 Science 86 70.9 72.3 (47) 69.2 (39) 50.0 (12) 63.6 (11) 54.5 (11) 50.0 (10) 95.0 (20) 84.6 (13) 75.0 (4) 80.0 (5)
MClass KI MOY 136 33.8 34.5 (58) 33.3 (78) 0.0 (12) 41.2 (17) 15.8 (19) 15.6 (32) 57.9 (19) 47.6 (21) 75.0 (8) 50.0 (8)
Glenn 3-8 Math 341 31.1 32.3 (161) 30.0 (180) 25.8 (66) 17.5 (80) 34.1 (85) 37.2 (86) 100.0 (4) 60.0 (5) 33.3 (6) 55.6 (9)
3-8 Reading 342 25.1 23.5 (162) 26.7 (180) 19.7 (66) 20.0 (80) 24.7 (85) 30.2 (86) 75.0 (4) 40.0 (5) 14.3 (7) 44.4 (9)
5 and 8 Science 117 41.0 45.1 (51) 37.9 (66) 38.1 (21) 46.7 (30) 48.1 (27) 26.7 (30) 100.0 (2) 100.0 (1) 0.0 (1) 40.0 (5)
MClass KI MOY 136 21.3 23.4 (77) 18.6 (59) 32.4 (37) 25.7 (35) 16.7 (36) 9.5 (21) 0.0 (2) 0.0 (1) 0.0 (2) 0.0 (2)
Hillandale 3-8 Math 305 53.4 53.4 (163) 53.5 (142) 40.4 (57) 41.8 (55) 44.2 (43) 48.8 (43) 69.1 (55) 71.4 (35) 87.5 (8) 77.8 (9)
3-8 Reading 305 55.4 57.1 (163) 53.5 (142) 43.9 (57) 38.2 (55) 51.2 (43) 58.1 (43) 72.7 (55) 68.6 (35) 75.0 (8) 66.7 (9)
5 and 8 Science 86 58.1 60.0 (45) 56.1 (41) 57.1 (14) 52.9 (17) 45.5 (11) 54.5 (11) 68.8 (16) 66.7 (12) 75.0 (4) 0.0 (1)
MClass KI MOY 114 23.7 28.6 (70) 15.9 (44) 30.8 (26) 15.8 (19) 14.3 (21) 6.7 (15) 29.4 (17) 33.3 (9) 66.7 (6) 0.0 (1)
RG01 - Academic Achievement by Ethnicity and Gender 11/7/2016 4:07:21 PM Page 2
Academic Achievement by Ethnicity and Gender 2016Student Proficiency given Number Tested in Group
ALL GENDER BLACK HISP WHITE OTHER
Elementary School Assessment Total
TestedTotal % Prof
%Prof (#Tested)
M
%Prof (#Tested)
F
%Prof (#Tested)
M
%Prof (#Tested)
F
%Prof (#Tested)
M
%Prof (#Tested)
F
%Prof (#Tested)
M
%Prof (#Tested)
F
%Prof (#Tested)
M
%Prof (#Tested)
F
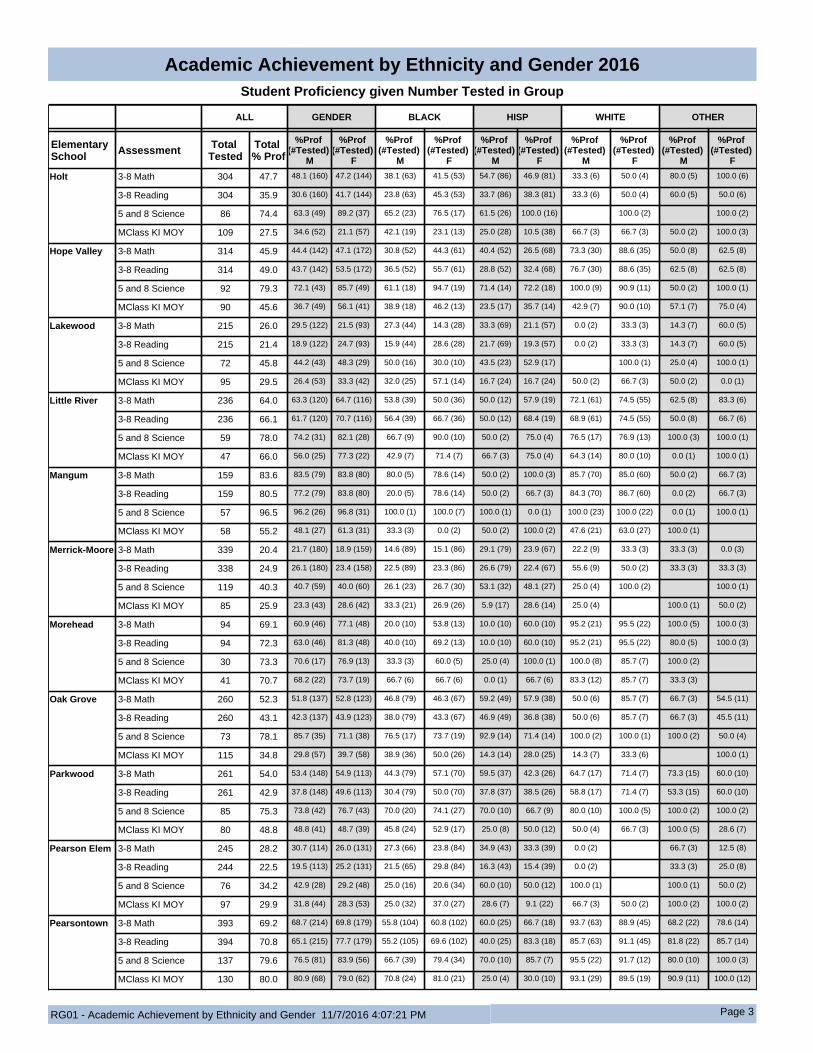
Holt 3-8 Math 304 47.7 48.1 (160) 47.2 (144) 38.1 (63) 41.5 (53) 54.7 (86) 46.9 (81) 33.3 (6) 50.0 (4) 80.0 (5) 100.0 (6)
3-8 Reading 304 35.9 30.6 (160) 41.7 (144) 23.8 (63) 45.3 (53) 33.7 (86) 38.3 (81) 33.3 (6) 50.0 (4) 60.0 (5) 50.0 (6)
5 and 8 Science 86 74.4 63.3 (49) 89.2 (37) 65.2 (23) 76.5 (17) 61.5 (26) 100.0 (16) 100.0 (2) 100.0 (2)
MClass KI MOY 109 27.5 34.6 (52) 21.1 (57) 42.1 (19) 23.1 (13) 25.0 (28) 10.5 (38) 66.7 (3) 66.7 (3) 50.0 (2) 100.0 (3)
Hope Valley 3-8 Math 314 45.9 44.4 (142) 47.1 (172) 30.8 (52) 44.3 (61) 40.4 (52) 26.5 (68) 73.3 (30) 88.6 (35) 50.0 (8) 62.5 (8)
3-8 Reading 314 49.0 43.7 (142) 53.5 (172) 36.5 (52) 55.7 (61) 28.8 (52) 32.4 (68) 76.7 (30) 88.6 (35) 62.5 (8) 62.5 (8)
5 and 8 Science 92 79.3 72.1 (43) 85.7 (49) 61.1 (18) 94.7 (19) 71.4 (14) 72.2 (18) 100.0 (9) 90.9 (11) 50.0 (2) 100.0 (1)
MClass KI MOY 90 45.6 36.7 (49) 56.1 (41) 38.9 (18) 46.2 (13) 23.5 (17) 35.7 (14) 42.9 (7) 90.0 (10) 57.1 (7) 75.0 (4)
Lakewood 3-8 Math 215 26.0 29.5 (122) 21.5 (93) 27.3 (44) 14.3 (28) 33.3 (69) 21.1 (57) 0.0 (2) 33.3 (3) 14.3 (7) 60.0 (5)
3-8 Reading 215 21.4 18.9 (122) 24.7 (93) 15.9 (44) 28.6 (28) 21.7 (69) 19.3 (57) 0.0 (2) 33.3 (3) 14.3 (7) 60.0 (5)
5 and 8 Science 72 45.8 44.2 (43) 48.3 (29) 50.0 (16) 30.0 (10) 43.5 (23) 52.9 (17) 100.0 (1) 25.0 (4) 100.0 (1)
MClass KI MOY 95 29.5 26.4 (53) 33.3 (42) 32.0 (25) 57.1 (14) 16.7 (24) 16.7 (24) 50.0 (2) 66.7 (3) 50.0 (2) 0.0 (1)
Little River 3-8 Math 236 64.0 63.3 (120) 64.7 (116) 53.8 (39) 50.0 (36) 50.0 (12) 57.9 (19) 72.1 (61) 74.5 (55) 62.5 (8) 83.3 (6)
3-8 Reading 236 66.1 61.7 (120) 70.7 (116) 56.4 (39) 66.7 (36) 50.0 (12) 68.4 (19) 68.9 (61) 74.5 (55) 50.0 (8) 66.7 (6)
5 and 8 Science 59 78.0 74.2 (31) 82.1 (28) 66.7 (9) 90.0 (10) 50.0 (2) 75.0 (4) 76.5 (17) 76.9 (13) 100.0 (3) 100.0 (1)
MClass KI MOY 47 66.0 56.0 (25) 77.3 (22) 42.9 (7) 71.4 (7) 66.7 (3) 75.0 (4) 64.3 (14) 80.0 (10) 0.0 (1) 100.0 (1)
Mangum 3-8 Math 159 83.6 83.5 (79) 83.8 (80) 80.0 (5) 78.6 (14) 50.0 (2) 100.0 (3) 85.7 (70) 85.0 (60) 50.0 (2) 66.7 (3)
3-8 Reading 159 80.5 77.2 (79) 83.8 (80) 20.0 (5) 78.6 (14) 50.0 (2) 66.7 (3) 84.3 (70) 86.7 (60) 0.0 (2) 66.7 (3)
5 and 8 Science 57 96.5 96.2 (26) 96.8 (31) 100.0 (1) 100.0 (7) 100.0 (1) 0.0 (1) 100.0 (23) 100.0 (22) 0.0 (1) 100.0 (1)
MClass KI MOY 58 55.2 48.1 (27) 61.3 (31) 33.3 (3) 0.0 (2) 50.0 (2) 100.0 (2) 47.6 (21) 63.0 (27) 100.0 (1)
Merrick-Moore 3-8 Math 339 20.4 21.7 (180) 18.9 (159) 14.6 (89) 15.1 (86) 29.1 (79) 23.9 (67) 22.2 (9) 33.3 (3) 33.3 (3) 0.0 (3)
3-8 Reading 338 24.9 26.1 (180) 23.4 (158) 22.5 (89) 23.3 (86) 26.6 (79) 22.4 (67) 55.6 (9) 50.0 (2) 33.3 (3) 33.3 (3)
5 and 8 Science 119 40.3 40.7 (59) 40.0 (60) 26.1 (23) 26.7 (30) 53.1 (32) 48.1 (27) 25.0 (4) 100.0 (2) 100.0 (1)
MClass KI MOY 85 25.9 23.3 (43) 28.6 (42) 33.3 (21) 26.9 (26) 5.9 (17) 28.6 (14) 25.0 (4) 100.0 (1) 50.0 (2)
Morehead 3-8 Math 94 69.1 60.9 (46) 77.1 (48) 20.0 (10) 53.8 (13) 10.0 (10) 60.0 (10) 95.2 (21) 95.5 (22) 100.0 (5) 100.0 (3)
3-8 Reading 94 72.3 63.0 (46) 81.3 (48) 40.0 (10) 69.2 (13) 10.0 (10) 60.0 (10) 95.2 (21) 95.5 (22) 80.0 (5) 100.0 (3)
5 and 8 Science 30 73.3 70.6 (17) 76.9 (13) 33.3 (3) 60.0 (5) 25.0 (4) 100.0 (1) 100.0 (8) 85.7 (7) 100.0 (2)
MClass KI MOY 41 70.7 68.2 (22) 73.7 (19) 66.7 (6) 66.7 (6) 0.0 (1) 66.7 (6) 83.3 (12) 85.7 (7) 33.3 (3)
Oak Grove 3-8 Math 260 52.3 51.8 (137) 52.8 (123) 46.8 (79) 46.3 (67) 59.2 (49) 57.9 (38) 50.0 (6) 85.7 (7) 66.7 (3) 54.5 (11)
3-8 Reading 260 43.1 42.3 (137) 43.9 (123) 38.0 (79) 43.3 (67) 46.9 (49) 36.8 (38) 50.0 (6) 85.7 (7) 66.7 (3) 45.5 (11)
5 and 8 Science 73 78.1 85.7 (35) 71.1 (38) 76.5 (17) 73.7 (19) 92.9 (14) 71.4 (14) 100.0 (2) 100.0 (1) 100.0 (2) 50.0 (4)
MClass KI MOY 115 34.8 29.8 (57) 39.7 (58) 38.9 (36) 50.0 (26) 14.3 (14) 28.0 (25) 14.3 (7) 33.3 (6) 100.0 (1)
Parkwood 3-8 Math 261 54.0 53.4 (148) 54.9 (113) 44.3 (79) 57.1 (70) 59.5 (37) 42.3 (26) 64.7 (17) 71.4 (7) 73.3 (15) 60.0 (10)
3-8 Reading 261 42.9 37.8 (148) 49.6 (113) 30.4 (79) 50.0 (70) 37.8 (37) 38.5 (26) 58.8 (17) 71.4 (7) 53.3 (15) 60.0 (10)
5 and 8 Science 85 75.3 73.8 (42) 76.7 (43) 70.0 (20) 74.1 (27) 70.0 (10) 66.7 (9) 80.0 (10) 100.0 (5) 100.0 (2) 100.0 (2)
MClass KI MOY 80 48.8 48.8 (41) 48.7 (39) 45.8 (24) 52.9 (17) 25.0 (8) 50.0 (12) 50.0 (4) 66.7 (3) 100.0 (5) 28.6 (7)
Pearson Elem 3-8 Math 245 28.2 30.7 (114) 26.0 (131) 27.3 (66) 23.8 (84) 34.9 (43) 33.3 (39) 0.0 (2) 66.7 (3) 12.5 (8)
3-8 Reading 244 22.5 19.5 (113) 25.2 (131) 21.5 (65) 29.8 (84) 16.3 (43) 15.4 (39) 0.0 (2) 33.3 (3) 25.0 (8)
5 and 8 Science 76 34.2 42.9 (28) 29.2 (48) 25.0 (16) 20.6 (34) 60.0 (10) 50.0 (12) 100.0 (1) 100.0 (1) 50.0 (2)
MClass KI MOY 97 29.9 31.8 (44) 28.3 (53) 25.0 (32) 37.0 (27) 28.6 (7) 9.1 (22) 66.7 (3) 50.0 (2) 100.0 (2) 100.0 (2)
Pearsontown 3-8 Math 393 69.2 68.7 (214) 69.8 (179) 55.8 (104) 60.8 (102) 60.0 (25) 66.7 (18) 93.7 (63) 88.9 (45) 68.2 (22) 78.6 (14)
3-8 Reading 394 70.8 65.1 (215) 77.7 (179) 55.2 (105) 69.6 (102) 40.0 (25) 83.3 (18) 85.7 (63) 91.1 (45) 81.8 (22) 85.7 (14)
5 and 8 Science 137 79.6 76.5 (81) 83.9 (56) 66.7 (39) 79.4 (34) 70.0 (10) 85.7 (7) 95.5 (22) 91.7 (12) 80.0 (10) 100.0 (3)
MClass KI MOY 130 80.0 80.9 (68) 79.0 (62) 70.8 (24) 81.0 (21) 25.0 (4) 30.0 (10) 93.1 (29) 89.5 (19) 90.9 (11) 100.0 (12)
RG01 - Academic Achievement by Ethnicity and Gender 11/7/2016 4:07:21 PM Page 3
Academic Achievement by Ethnicity and Gender 2016Student Proficiency given Number Tested in Group
ALL GENDER BLACK HISP WHITE OTHER
Elementary School Assessment Total
TestedTotal % Prof
%Prof (#Tested)
M
%Prof (#Tested)
F
%Prof (#Tested)
M
%Prof (#Tested)
F
%Prof (#Tested)
M
%Prof (#Tested)
F
%Prof (#Tested)
M
%Prof (#Tested)
F
%Prof (#Tested)
M
%Prof (#Tested)
F
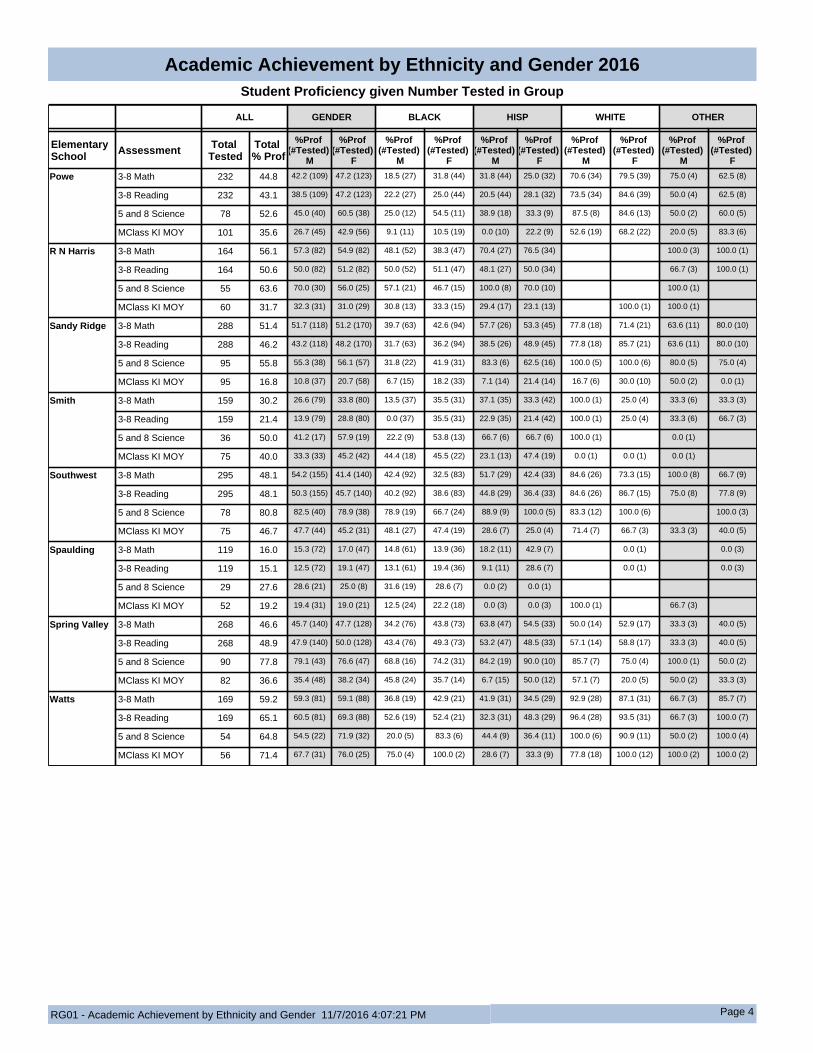
Powe 3-8 Math 232 44.8 42.2 (109) 47.2 (123) 18.5 (27) 31.8 (44) 31.8 (44) 25.0 (32) 70.6 (34) 79.5 (39) 75.0 (4) 62.5 (8)
3-8 Reading 232 43.1 38.5 (109) 47.2 (123) 22.2 (27) 25.0 (44) 20.5 (44) 28.1 (32) 73.5 (34) 84.6 (39) 50.0 (4) 62.5 (8)
5 and 8 Science 78 52.6 45.0 (40) 60.5 (38) 25.0 (12) 54.5 (11) 38.9 (18) 33.3 (9) 87.5 (8) 84.6 (13) 50.0 (2) 60.0 (5)
MClass KI MOY 101 35.6 26.7 (45) 42.9 (56) 9.1 (11) 10.5 (19) 0.0 (10) 22.2 (9) 52.6 (19) 68.2 (22) 20.0 (5) 83.3 (6)
R N Harris 3-8 Math 164 56.1 57.3 (82) 54.9 (82) 48.1 (52) 38.3 (47) 70.4 (27) 76.5 (34) 100.0 (3) 100.0 (1)
3-8 Reading 164 50.6 50.0 (82) 51.2 (82) 50.0 (52) 51.1 (47) 48.1 (27) 50.0 (34) 66.7 (3) 100.0 (1)
5 and 8 Science 55 63.6 70.0 (30) 56.0 (25) 57.1 (21) 46.7 (15) 100.0 (8) 70.0 (10) 100.0 (1)
MClass KI MOY 60 31.7 32.3 (31) 31.0 (29) 30.8 (13) 33.3 (15) 29.4 (17) 23.1 (13) 100.0 (1) 100.0 (1)
Sandy Ridge 3-8 Math 288 51.4 51.7 (118) 51.2 (170) 39.7 (63) 42.6 (94) 57.7 (26) 53.3 (45) 77.8 (18) 71.4 (21) 63.6 (11) 80.0 (10)
3-8 Reading 288 46.2 43.2 (118) 48.2 (170) 31.7 (63) 36.2 (94) 38.5 (26) 48.9 (45) 77.8 (18) 85.7 (21) 63.6 (11) 80.0 (10)
5 and 8 Science 95 55.8 55.3 (38) 56.1 (57) 31.8 (22) 41.9 (31) 83.3 (6) 62.5 (16) 100.0 (5) 100.0 (6) 80.0 (5) 75.0 (4)
MClass KI MOY 95 16.8 10.8 (37) 20.7 (58) 6.7 (15) 18.2 (33) 7.1 (14) 21.4 (14) 16.7 (6) 30.0 (10) 50.0 (2) 0.0 (1)
Smith 3-8 Math 159 30.2 26.6 (79) 33.8 (80) 13.5 (37) 35.5 (31) 37.1 (35) 33.3 (42) 100.0 (1) 25.0 (4) 33.3 (6) 33.3 (3)
3-8 Reading 159 21.4 13.9 (79) 28.8 (80) 0.0 (37) 35.5 (31) 22.9 (35) 21.4 (42) 100.0 (1) 25.0 (4) 33.3 (6) 66.7 (3)
5 and 8 Science 36 50.0 41.2 (17) 57.9 (19) 22.2 (9) 53.8 (13) 66.7 (6) 66.7 (6) 100.0 (1) 0.0 (1)
MClass KI MOY 75 40.0 33.3 (33) 45.2 (42) 44.4 (18) 45.5 (22) 23.1 (13) 47.4 (19) 0.0 (1) 0.0 (1) 0.0 (1)
Southwest 3-8 Math 295 48.1 54.2 (155) 41.4 (140) 42.4 (92) 32.5 (83) 51.7 (29) 42.4 (33) 84.6 (26) 73.3 (15) 100.0 (8) 66.7 (9)
3-8 Reading 295 48.1 50.3 (155) 45.7 (140) 40.2 (92) 38.6 (83) 44.8 (29) 36.4 (33) 84.6 (26) 86.7 (15) 75.0 (8) 77.8 (9)
5 and 8 Science 78 80.8 82.5 (40) 78.9 (38) 78.9 (19) 66.7 (24) 88.9 (9) 100.0 (5) 83.3 (12) 100.0 (6) 100.0 (3)
MClass KI MOY 75 46.7 47.7 (44) 45.2 (31) 48.1 (27) 47.4 (19) 28.6 (7) 25.0 (4) 71.4 (7) 66.7 (3) 33.3 (3) 40.0 (5)
Spaulding 3-8 Math 119 16.0 15.3 (72) 17.0 (47) 14.8 (61) 13.9 (36) 18.2 (11) 42.9 (7) 0.0 (1) 0.0 (3)
3-8 Reading 119 15.1 12.5 (72) 19.1 (47) 13.1 (61) 19.4 (36) 9.1 (11) 28.6 (7) 0.0 (1) 0.0 (3)
5 and 8 Science 29 27.6 28.6 (21) 25.0 (8) 31.6 (19) 28.6 (7) 0.0 (2) 0.0 (1)
MClass KI MOY 52 19.2 19.4 (31) 19.0 (21) 12.5 (24) 22.2 (18) 0.0 (3) 0.0 (3) 100.0 (1) 66.7 (3)
Spring Valley 3-8 Math 268 46.6 45.7 (140) 47.7 (128) 34.2 (76) 43.8 (73) 63.8 (47) 54.5 (33) 50.0 (14) 52.9 (17) 33.3 (3) 40.0 (5)
3-8 Reading 268 48.9 47.9 (140) 50.0 (128) 43.4 (76) 49.3 (73) 53.2 (47) 48.5 (33) 57.1 (14) 58.8 (17) 33.3 (3) 40.0 (5)
5 and 8 Science 90 77.8 79.1 (43) 76.6 (47) 68.8 (16) 74.2 (31) 84.2 (19) 90.0 (10) 85.7 (7) 75.0 (4) 100.0 (1) 50.0 (2)
MClass KI MOY 82 36.6 35.4 (48) 38.2 (34) 45.8 (24) 35.7 (14) 6.7 (15) 50.0 (12) 57.1 (7) 20.0 (5) 50.0 (2) 33.3 (3)
Watts 3-8 Math 169 59.2 59.3 (81) 59.1 (88) 36.8 (19) 42.9 (21) 41.9 (31) 34.5 (29) 92.9 (28) 87.1 (31) 66.7 (3) 85.7 (7)
3-8 Reading 169 65.1 60.5 (81) 69.3 (88) 52.6 (19) 52.4 (21) 32.3 (31) 48.3 (29) 96.4 (28) 93.5 (31) 66.7 (3) 100.0 (7)
5 and 8 Science 54 64.8 54.5 (22) 71.9 (32) 20.0 (5) 83.3 (6) 44.4 (9) 36.4 (11) 100.0 (6) 90.9 (11) 50.0 (2) 100.0 (4)
MClass KI MOY 56 71.4 67.7 (31) 76.0 (25) 75.0 (4) 100.0 (2) 28.6 (7) 33.3 (9) 77.8 (18) 100.0 (12) 100.0 (2) 100.0 (2)
RG01 - Academic Achievement by Ethnicity and Gender 11/7/2016 4:07:21 PM Page 4
Academic Achievement by Ethnicity and Gender 2016Student Proficiency given Number Tested in Group

ALL GENDER BLACK HISP WHITE OTHER
Middle School Assessment Total
TestedTotal % Prof
%Prof (#Tested)
M
%Prof (#Tested)
F
%Prof (#Tested)
M
%Prof (#Tested)
F
%Prof (#Tested)
M
%Prof (#Tested)
F
%Prof (#Tested)
M
%Prof (#Tested)
F
%Prof (#Tested)
M
%Prof (#Tested)
F
Brogden 3-8 Math 563 24.2 25.4 (279) 22.9 (284) 9.1 (110) 14.0 (136) 18.8 (101) 15.1 (93) 67.3 (55) 65.7 (35) 38.5 (13) 45.0 (20)
3-8 Reading 563 35.7 32.5 (280) 38.9 (283) 20.7 (111) 32.6 (135) 20.8 (101) 28.0 (93) 78.2 (55) 80.0 (35) 30.8 (13) 60.0 (20)
5 and 8 Science 210 48.6 48.5 (101) 48.6 (109) 30.4 (46) 45.1 (51) 41.9 (31) 35.0 (40) 89.5 (19) 100.0 (11) 100.0 (5) 71.4 (7)
Math I 25 96.0 92.3 (13) 100.0 (12) 100.0 (1) 100.0 (5) 100.0 (4) 100.0 (1) 87.5 (8) 100.0 (6)
Carrington 3-8 Math 983 30.2 27.2 (503) 33.3 (480) 13.2 (227) 27.5 (255) 23.8 (143) 27.8 (126) 57.6 (99) 52.0 (75) 47.1 (34) 66.7 (24)
3-8 Reading 981 36.0 30.7 (502) 41.5 (479) 16.8 (226) 36.5 (255) 20.3 (143) 32.0 (125) 68.7 (99) 68.0 (75) 55.9 (34) 62.5 (24)
5 and 8 Science 345 51.0 47.9 (188) 54.8 (157) 34.0 (94) 41.5 (82) 50.0 (48) 52.5 (40) 75.0 (36) 84.0 (25) 70.0 (10) 100.0 (10)
Math I 50 98.0 96.0 (25) 100.0 (25) 100.0 (3) 100.0 (6) 83.3 (6) 100.0 (4) 100.0 (13) 100.0 (11) 100.0 (3) 100.0 (4)
Githens 3-8 Math 885 28.7 29.2 (469) 28.1 (416) 12.8 (218) 17.7 (186) 18.0 (111) 17.8 (135) 73.8 (103) 68.2 (66) 35.1 (37) 51.7 (29)
3-8 Reading 884 35.7 35.0 (469) 36.6 (415) 20.6 (218) 30.3 (185) 20.7 (111) 25.2 (135) 75.7 (103) 71.2 (66) 48.6 (37) 51.7 (29)
5 and 8 Science 307 52.1 50.6 (156) 53.6 (151) 38.0 (79) 36.4 (66) 50.0 (34) 55.3 (47) 87.9 (33) 83.3 (30) 30.0 (10) 75.0 (8)
Math I 75 97.3 94.4 (36) 100.0 (39) 88.9 (9) 100.0 (9) 100.0 (2) 100.0 (7) 95.2 (21) 100.0 (18) 100.0 (4) 100.0 (5)
Lakewood Middle
3-8 Math 296 53.4 50.0 (142) 56.5 (154) 24.4 (41) 41.9 (31) 13.5 (37) 26.5 (34) 88.9 (54) 78.3 (69) 80.0 (10) 55.0 (20)
3-8 Reading 296 65.9 62.0 (142) 69.5 (154) 43.9 (41) 54.8 (31) 37.8 (37) 44.1 (34) 90.7 (54) 88.4 (69) 70.0 (10) 70.0 (20)
5 and 8 Science 93 68.8 65.8 (38) 70.9 (55) 64.3 (14) 50.0 (12) 22.2 (9) 46.2 (13) 100.0 (13) 91.3 (23) 50.0 (2) 85.7 (7)
Math I 32 100.0 100.0 (13) 100.0 (19) 100.0 (1) 100.0 (1) 100.0 (12) 100.0 (16) 100.0 (2)
Lowe's Grove 3-8 Math 663 19.6 18.1 (332) 21.1 (331) 13.7 (212) 19.7 (208) 21.7 (83) 19.6 (92) 34.8 (23) 62.5 (16) 35.7 (14) 6.7 (15)
3-8 Reading 663 33.0 27.7 (332) 38.4 (331) 21.7 (212) 35.1 (208) 32.5 (83) 40.2 (92) 43.5 (23) 81.3 (16) 64.3 (14) 26.7 (15)
5 and 8 Science 247 51.8 52.2 (115) 51.5 (132) 41.8 (67) 50.5 (93) 55.2 (29) 48.3 (29) 86.7 (15) 83.3 (6) 75.0 (4) 50.0 (4)
Math I 45 77.8 64.3 (14) 83.9 (31) 50.0 (6) 87.0 (23) 66.7 (3) 80.0 (5) 80.0 (5) 66.7 (3)
Lucas 3-8 Math 587 32.0 26.5 (279) 37.0 (308) 21.0 (143) 29.7 (138) 25.4 (59) 22.5 (80) 38.3 (60) 62.2 (74) 35.3 (17) 56.3 (16)
3-8 Reading 586 36.7 28.3 (279) 44.3 (307) 25.2 (143) 34.8 (138) 18.6 (59) 34.2 (79) 43.3 (60) 67.6 (74) 35.3 (17) 68.8 (16)
5 and 8 Science 234 63.2 64.5 (110) 62.1 (124) 55.2 (58) 59.3 (59) 71.4 (21) 50.0 (28) 75.0 (24) 74.2 (31) 85.7 (7) 83.3 (6)
Math I 23 100.0 100.0 (6) 100.0 (17) 100.0 (2) 100.0 (3) 100.0 (1) 100.0 (1) 100.0 (3) 100.0 (11) 100.0 (2)
Neal 3-8 Math 755 9.8 9.1 (397) 10.6 (358) 6.4 (219) 6.0 (201) 12.0 (142) 16.8 (119) 22.7 (22) 16.7 (18) 0.0 (14) 15.0 (20)
3-8 Reading 762 27.6 24.3 (403) 31.2 (359) 23.0 (222) 26.6 (203) 22.8 (145) 39.8 (118) 45.5 (22) 38.9 (18) 28.6 (14) 20.0 (20)
5 and 8 Science 282 37.6 42.0 (157) 32.0 (125) 36.8 (87) 28.8 (80) 46.6 (58) 36.1 (36) 62.5 (8) 50.0 (4) 50.0 (4) 40.0 (5)
Math I 7 100.0 100.0 (2) 100.0 (5) 100.0 (2) 100.0 (2) 100.0 (3)
Rogers-Herr 3-8 Math 623 59.6 59.0 (315) 60.1 (308) 50.7 (152) 55.3 (170) 36.8 (68) 44.4 (63) 91.4 (70) 94.0 (50) 80.0 (25) 64.0 (25)
3-8 Reading 623 59.9 55.2 (315) 64.6 (308) 47.4 (152) 61.2 (170) 25.0 (68) 50.8 (63) 94.3 (70) 86.0 (50) 76.0 (25) 80.0 (25)
5 and 8 Science 212 83.5 84.5 (103) 82.6 (109) 78.2 (55) 82.0 (61) 85.0 (20) 75.0 (24) 100.0 (19) 100.0 (18) 88.9 (9) 66.7 (6)
Math I 63 100.0 100.0 (31) 100.0 (32) 100.0 (8) 100.0 (10) 100.0 (2) 100.0 (5) 100.0 (19) 100.0 (13) 100.0 (2) 100.0 (4)
Shepard 3-8 Math 500 18.2 18.5 (249) 17.9 (251) 16.8 (185) 18.0 (178) 19.3 (57) 18.5 (65) 100.0 (1) 100.0 (1) 50.0 (6) 0.0 (7)
3-8 Reading 498 33.5 28.6 (248) 38.4 (250) 26.6 (184) 38.4 (177) 29.8 (57) 40.0 (65) 100.0 (1) 100.0 (1) 66.7 (6) 14.3 (7)
5 and 8 Science 164 51.2 47.2 (89) 56.0 (75) 45.6 (68) 59.6 (57) 50.0 (20) 43.8 (16) 100.0 (1) 50.0 (2)
RG01 - Academic Achievement by Ethnicity and Gender 11/7/2016 4:07:21 PM Page 5
Academic Achievement by Ethnicity and Gender 2016Student Proficiency given Number Tested in Group
ALL GENDER BLACK HISP WHITE OTHER
High School Assessment Total
TestedTotal % Prof
%Prof (#Tested)
M
%Prof (#Tested)
F
%Prof (#Tested)
M
%Prof (#Tested)
F
%Prof (#Tested)
M
%Prof (#Tested)
F
%Prof (#Tested)
M
%Prof (#Tested)
F
%Prof (#Tested)
M
%Prof (#Tested)
F
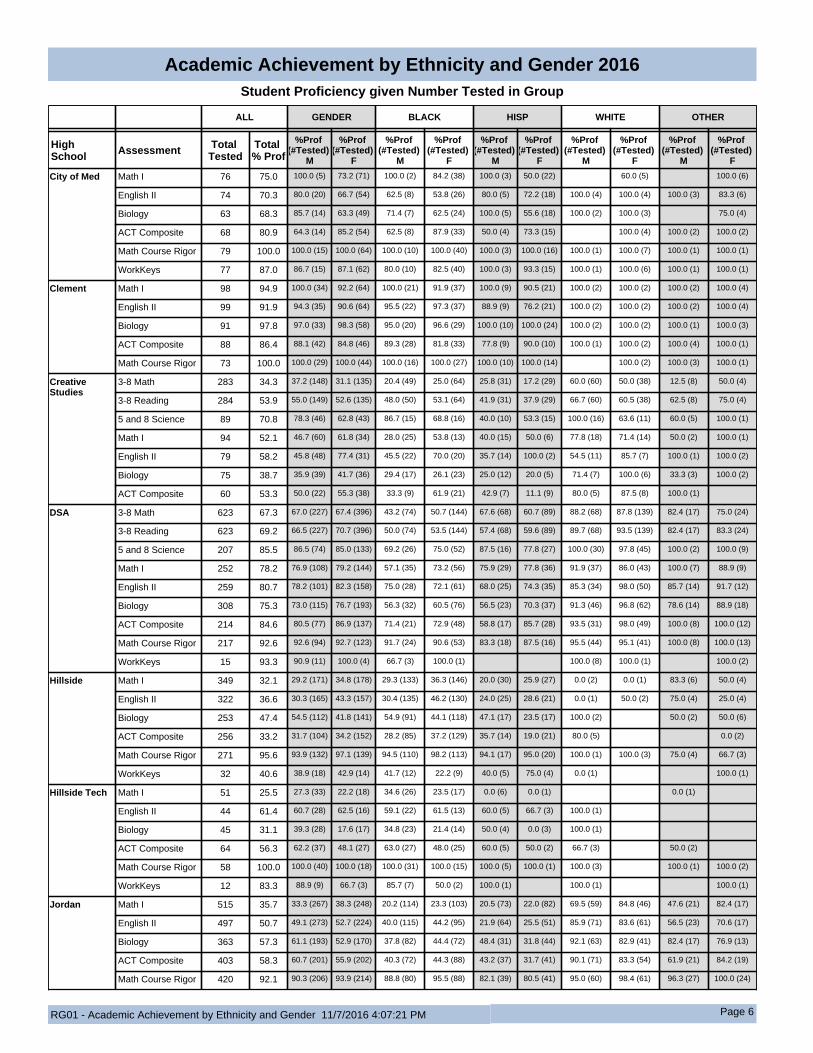
City of Med Math I 76 75.0 100.0 (5) 73.2 (71) 100.0 (2) 84.2 (38) 100.0 (3) 50.0 (22) 60.0 (5) 100.0 (6)
English II 74 70.3 80.0 (20) 66.7 (54) 62.5 (8) 53.8 (26) 80.0 (5) 72.2 (18) 100.0 (4) 100.0 (4) 100.0 (3) 83.3 (6)
Biology 63 68.3 85.7 (14) 63.3 (49) 71.4 (7) 62.5 (24) 100.0 (5) 55.6 (18) 100.0 (2) 100.0 (3) 75.0 (4)
ACT Composite 68 80.9 64.3 (14) 85.2 (54) 62.5 (8) 87.9 (33) 50.0 (4) 73.3 (15) 100.0 (4) 100.0 (2) 100.0 (2)
Math Course Rigor 79 100.0 100.0 (15) 100.0 (64) 100.0 (10) 100.0 (40) 100.0 (3) 100.0 (16) 100.0 (1) 100.0 (7) 100.0 (1) 100.0 (1)
WorkKeys 77 87.0 86.7 (15) 87.1 (62) 80.0 (10) 82.5 (40) 100.0 (3) 93.3 (15) 100.0 (1) 100.0 (6) 100.0 (1) 100.0 (1)
Clement Math I 98 94.9 100.0 (34) 92.2 (64) 100.0 (21) 91.9 (37) 100.0 (9) 90.5 (21) 100.0 (2) 100.0 (2) 100.0 (2) 100.0 (4)
English II 99 91.9 94.3 (35) 90.6 (64) 95.5 (22) 97.3 (37) 88.9 (9) 76.2 (21) 100.0 (2) 100.0 (2) 100.0 (2) 100.0 (4)
Biology 91 97.8 97.0 (33) 98.3 (58) 95.0 (20) 96.6 (29) 100.0 (10) 100.0 (24) 100.0 (2) 100.0 (2) 100.0 (1) 100.0 (3)
ACT Composite 88 86.4 88.1 (42) 84.8 (46) 89.3 (28) 81.8 (33) 77.8 (9) 90.0 (10) 100.0 (1) 100.0 (2) 100.0 (4) 100.0 (1)
Math Course Rigor 73 100.0 100.0 (29) 100.0 (44) 100.0 (16) 100.0 (27) 100.0 (10) 100.0 (14) 100.0 (2) 100.0 (3) 100.0 (1)
Creative Studies
3-8 Math 283 34.3 37.2 (148) 31.1 (135) 20.4 (49) 25.0 (64) 25.8 (31) 17.2 (29) 60.0 (60) 50.0 (38) 12.5 (8) 50.0 (4)
3-8 Reading 284 53.9 55.0 (149) 52.6 (135) 48.0 (50) 53.1 (64) 41.9 (31) 37.9 (29) 66.7 (60) 60.5 (38) 62.5 (8) 75.0 (4)
5 and 8 Science 89 70.8 78.3 (46) 62.8 (43) 86.7 (15) 68.8 (16) 40.0 (10) 53.3 (15) 100.0 (16) 63.6 (11) 60.0 (5) 100.0 (1)
Math I 94 52.1 46.7 (60) 61.8 (34) 28.0 (25) 53.8 (13) 40.0 (15) 50.0 (6) 77.8 (18) 71.4 (14) 50.0 (2) 100.0 (1)
English II 79 58.2 45.8 (48) 77.4 (31) 45.5 (22) 70.0 (20) 35.7 (14) 100.0 (2) 54.5 (11) 85.7 (7) 100.0 (1) 100.0 (2)
Biology 75 38.7 35.9 (39) 41.7 (36) 29.4 (17) 26.1 (23) 25.0 (12) 20.0 (5) 71.4 (7) 100.0 (6) 33.3 (3) 100.0 (2)
ACT Composite 60 53.3 50.0 (22) 55.3 (38) 33.3 (9) 61.9 (21) 42.9 (7) 11.1 (9) 80.0 (5) 87.5 (8) 100.0 (1)
DSA 3-8 Math 623 67.3 67.0 (227) 67.4 (396) 43.2 (74) 50.7 (144) 67.6 (68) 60.7 (89) 88.2 (68) 87.8 (139) 82.4 (17) 75.0 (24)
3-8 Reading 623 69.2 66.5 (227) 70.7 (396) 50.0 (74) 53.5 (144) 57.4 (68) 59.6 (89) 89.7 (68) 93.5 (139) 82.4 (17) 83.3 (24)
5 and 8 Science 207 85.5 86.5 (74) 85.0 (133) 69.2 (26) 75.0 (52) 87.5 (16) 77.8 (27) 100.0 (30) 97.8 (45) 100.0 (2) 100.0 (9)
Math I 252 78.2 76.9 (108) 79.2 (144) 57.1 (35) 73.2 (56) 75.9 (29) 77.8 (36) 91.9 (37) 86.0 (43) 100.0 (7) 88.9 (9)
English II 259 80.7 78.2 (101) 82.3 (158) 75.0 (28) 72.1 (61) 68.0 (25) 74.3 (35) 85.3 (34) 98.0 (50) 85.7 (14) 91.7 (12)
Biology 308 75.3 73.0 (115) 76.7 (193) 56.3 (32) 60.5 (76) 56.5 (23) 70.3 (37) 91.3 (46) 96.8 (62) 78.6 (14) 88.9 (18)
ACT Composite 214 84.6 80.5 (77) 86.9 (137) 71.4 (21) 72.9 (48) 58.8 (17) 85.7 (28) 93.5 (31) 98.0 (49) 100.0 (8) 100.0 (12)
Math Course Rigor 217 92.6 92.6 (94) 92.7 (123) 91.7 (24) 90.6 (53) 83.3 (18) 87.5 (16) 95.5 (44) 95.1 (41) 100.0 (8) 100.0 (13)
WorkKeys 15 93.3 90.9 (11) 100.0 (4) 66.7 (3) 100.0 (1) 100.0 (8) 100.0 (1) 100.0 (2)
Hillside Math I 349 32.1 29.2 (171) 34.8 (178) 29.3 (133) 36.3 (146) 20.0 (30) 25.9 (27) 0.0 (2) 0.0 (1) 83.3 (6) 50.0 (4)
English II 322 36.6 30.3 (165) 43.3 (157) 30.4 (135) 46.2 (130) 24.0 (25) 28.6 (21) 0.0 (1) 50.0 (2) 75.0 (4) 25.0 (4)
Biology 253 47.4 54.5 (112) 41.8 (141) 54.9 (91) 44.1 (118) 47.1 (17) 23.5 (17) 100.0 (2) 50.0 (2) 50.0 (6)
ACT Composite 256 33.2 31.7 (104) 34.2 (152) 28.2 (85) 37.2 (129) 35.7 (14) 19.0 (21) 80.0 (5) 0.0 (2)
Math Course Rigor 271 95.6 93.9 (132) 97.1 (139) 94.5 (110) 98.2 (113) 94.1 (17) 95.0 (20) 100.0 (1) 100.0 (3) 75.0 (4) 66.7 (3)
WorkKeys 32 40.6 38.9 (18) 42.9 (14) 41.7 (12) 22.2 (9) 40.0 (5) 75.0 (4) 0.0 (1) 100.0 (1)
Hillside Tech Math I 51 25.5 27.3 (33) 22.2 (18) 34.6 (26) 23.5 (17) 0.0 (6) 0.0 (1) 0.0 (1)
English II 44 61.4 60.7 (28) 62.5 (16) 59.1 (22) 61.5 (13) 60.0 (5) 66.7 (3) 100.0 (1)
Biology 45 31.1 39.3 (28) 17.6 (17) 34.8 (23) 21.4 (14) 50.0 (4) 0.0 (3) 100.0 (1)
ACT Composite 64 56.3 62.2 (37) 48.1 (27) 63.0 (27) 48.0 (25) 60.0 (5) 50.0 (2) 66.7 (3) 50.0 (2)
Math Course Rigor 58 100.0 100.0 (40) 100.0 (18) 100.0 (31) 100.0 (15) 100.0 (5) 100.0 (1) 100.0 (3) 100.0 (1) 100.0 (2)
WorkKeys 12 83.3 88.9 (9) 66.7 (3) 85.7 (7) 50.0 (2) 100.0 (1) 100.0 (1) 100.0 (1)
Jordan Math I 515 35.7 33.3 (267) 38.3 (248) 20.2 (114) 23.3 (103) 20.5 (73) 22.0 (82) 69.5 (59) 84.8 (46) 47.6 (21) 82.4 (17)
English II 497 50.7 49.1 (273) 52.7 (224) 40.0 (115) 44.2 (95) 21.9 (64) 25.5 (51) 85.9 (71) 83.6 (61) 56.5 (23) 70.6 (17)
Biology 363 57.3 61.1 (193) 52.9 (170) 37.8 (82) 44.4 (72) 48.4 (31) 31.8 (44) 92.1 (63) 82.9 (41) 82.4 (17) 76.9 (13)
ACT Composite 403 58.3 60.7 (201) 55.9 (202) 40.3 (72) 44.3 (88) 43.2 (37) 31.7 (41) 90.1 (71) 83.3 (54) 61.9 (21) 84.2 (19)
Math Course Rigor 420 92.1 90.3 (206) 93.9 (214) 88.8 (80) 95.5 (88) 82.1 (39) 80.5 (41) 95.0 (60) 98.4 (61) 96.3 (27) 100.0 (24)
RG01 - Academic Achievement by Ethnicity and Gender 11/7/2016 4:07:21 PM Page 6
Academic Achievement by Ethnicity and Gender 2016Student Proficiency given Number Tested in Group
ALL GENDER BLACK HISP WHITE OTHER
High School Assessment Total
TestedTotal % Prof
%Prof (#Tested)
M
%Prof (#Tested)
F
%Prof (#Tested)
M
%Prof (#Tested)
F
%Prof (#Tested)
M
%Prof (#Tested)
F
%Prof (#Tested)
M
%Prof (#Tested)
F
%Prof (#Tested)
M
%Prof (#Tested)
F
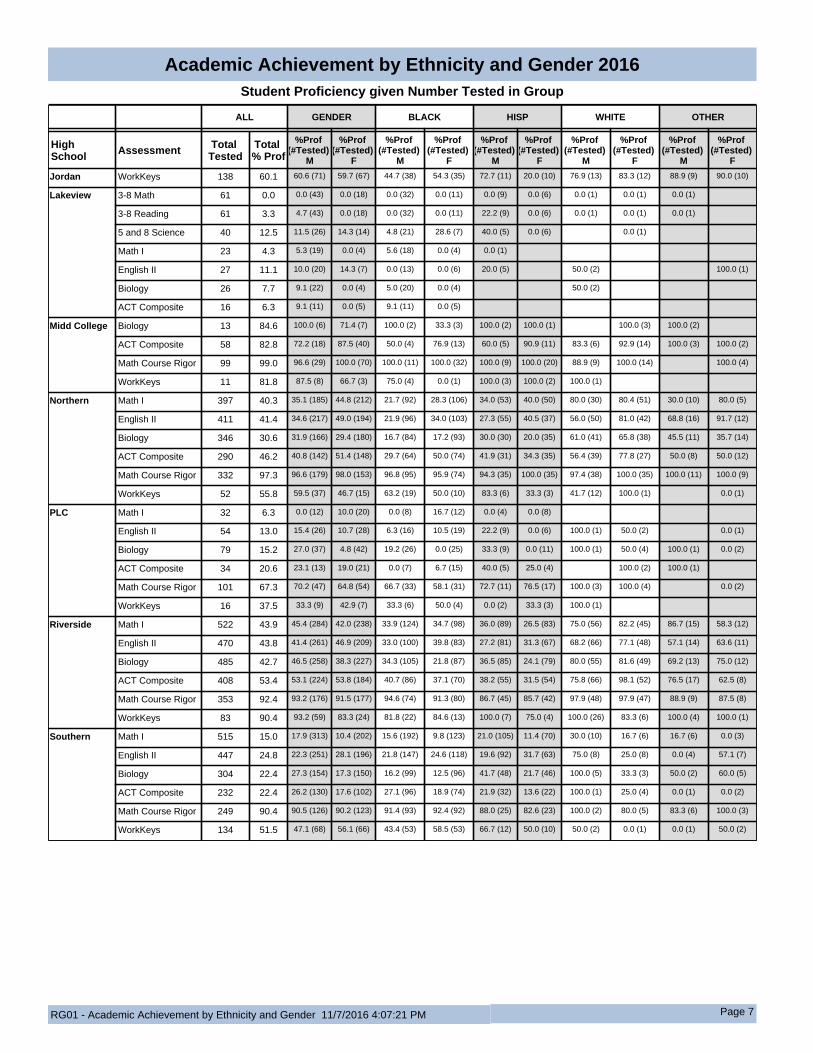
Jordan WorkKeys 138 60.1 60.6 (71) 59.7 (67) 44.7 (38) 54.3 (35) 72.7 (11) 20.0 (10) 76.9 (13) 83.3 (12) 88.9 (9) 90.0 (10)
Lakeview 3-8 Math 61 0.0 0.0 (43) 0.0 (18) 0.0 (32) 0.0 (11) 0.0 (9) 0.0 (6) 0.0 (1) 0.0 (1) 0.0 (1)
3-8 Reading 61 3.3 4.7 (43) 0.0 (18) 0.0 (32) 0.0 (11) 22.2 (9) 0.0 (6) 0.0 (1) 0.0 (1) 0.0 (1)
5 and 8 Science 40 12.5 11.5 (26) 14.3 (14) 4.8 (21) 28.6 (7) 40.0 (5) 0.0 (6) 0.0 (1)
Math I 23 4.3 5.3 (19) 0.0 (4) 5.6 (18) 0.0 (4) 0.0 (1)
English II 27 11.1 10.0 (20) 14.3 (7) 0.0 (13) 0.0 (6) 20.0 (5) 50.0 (2) 100.0 (1)
Biology 26 7.7 9.1 (22) 0.0 (4) 5.0 (20) 0.0 (4) 50.0 (2)
ACT Composite 16 6.3 9.1 (11) 0.0 (5) 9.1 (11) 0.0 (5)
Midd College Biology 13 84.6 100.0 (6) 71.4 (7) 100.0 (2) 33.3 (3) 100.0 (2) 100.0 (1) 100.0 (3) 100.0 (2)
ACT Composite 58 82.8 72.2 (18) 87.5 (40) 50.0 (4) 76.9 (13) 60.0 (5) 90.9 (11) 83.3 (6) 92.9 (14) 100.0 (3) 100.0 (2)
Math Course Rigor 99 99.0 96.6 (29) 100.0 (70) 100.0 (11) 100.0 (32) 100.0 (9) 100.0 (20) 88.9 (9) 100.0 (14) 100.0 (4)
WorkKeys 11 81.8 87.5 (8) 66.7 (3) 75.0 (4) 0.0 (1) 100.0 (3) 100.0 (2) 100.0 (1)
Northern Math I 397 40.3 35.1 (185) 44.8 (212) 21.7 (92) 28.3 (106) 34.0 (53) 40.0 (50) 80.0 (30) 80.4 (51) 30.0 (10) 80.0 (5)
English II 411 41.4 34.6 (217) 49.0 (194) 21.9 (96) 34.0 (103) 27.3 (55) 40.5 (37) 56.0 (50) 81.0 (42) 68.8 (16) 91.7 (12)
Biology 346 30.6 31.9 (166) 29.4 (180) 16.7 (84) 17.2 (93) 30.0 (30) 20.0 (35) 61.0 (41) 65.8 (38) 45.5 (11) 35.7 (14)
ACT Composite 290 46.2 40.8 (142) 51.4 (148) 29.7 (64) 50.0 (74) 41.9 (31) 34.3 (35) 56.4 (39) 77.8 (27) 50.0 (8) 50.0 (12)
Math Course Rigor 332 97.3 96.6 (179) 98.0 (153) 96.8 (95) 95.9 (74) 94.3 (35) 100.0 (35) 97.4 (38) 100.0 (35) 100.0 (11) 100.0 (9)
WorkKeys 52 55.8 59.5 (37) 46.7 (15) 63.2 (19) 50.0 (10) 83.3 (6) 33.3 (3) 41.7 (12) 100.0 (1) 0.0 (1)
PLC Math I 32 6.3 0.0 (12) 10.0 (20) 0.0 (8) 16.7 (12) 0.0 (4) 0.0 (8)
English II 54 13.0 15.4 (26) 10.7 (28) 6.3 (16) 10.5 (19) 22.2 (9) 0.0 (6) 100.0 (1) 50.0 (2) 0.0 (1)
Biology 79 15.2 27.0 (37) 4.8 (42) 19.2 (26) 0.0 (25) 33.3 (9) 0.0 (11) 100.0 (1) 50.0 (4) 100.0 (1) 0.0 (2)
ACT Composite 34 20.6 23.1 (13) 19.0 (21) 0.0 (7) 6.7 (15) 40.0 (5) 25.0 (4) 100.0 (2) 100.0 (1)
Math Course Rigor 101 67.3 70.2 (47) 64.8 (54) 66.7 (33) 58.1 (31) 72.7 (11) 76.5 (17) 100.0 (3) 100.0 (4) 0.0 (2)
WorkKeys 16 37.5 33.3 (9) 42.9 (7) 33.3 (6) 50.0 (4) 0.0 (2) 33.3 (3) 100.0 (1)
Riverside Math I 522 43.9 45.4 (284) 42.0 (238) 33.9 (124) 34.7 (98) 36.0 (89) 26.5 (83) 75.0 (56) 82.2 (45) 86.7 (15) 58.3 (12)
English II 470 43.8 41.4 (261) 46.9 (209) 33.0 (100) 39.8 (83) 27.2 (81) 31.3 (67) 68.2 (66) 77.1 (48) 57.1 (14) 63.6 (11)
Biology 485 42.7 46.5 (258) 38.3 (227) 34.3 (105) 21.8 (87) 36.5 (85) 24.1 (79) 80.0 (55) 81.6 (49) 69.2 (13) 75.0 (12)
ACT Composite 408 53.4 53.1 (224) 53.8 (184) 40.7 (86) 37.1 (70) 38.2 (55) 31.5 (54) 75.8 (66) 98.1 (52) 76.5 (17) 62.5 (8)
Math Course Rigor 353 92.4 93.2 (176) 91.5 (177) 94.6 (74) 91.3 (80) 86.7 (45) 85.7 (42) 97.9 (48) 97.9 (47) 88.9 (9) 87.5 (8)
WorkKeys 83 90.4 93.2 (59) 83.3 (24) 81.8 (22) 84.6 (13) 100.0 (7) 75.0 (4) 100.0 (26) 83.3 (6) 100.0 (4) 100.0 (1)
Southern Math I 515 15.0 17.9 (313) 10.4 (202) 15.6 (192) 9.8 (123) 21.0 (105) 11.4 (70) 30.0 (10) 16.7 (6) 16.7 (6) 0.0 (3)
English II 447 24.8 22.3 (251) 28.1 (196) 21.8 (147) 24.6 (118) 19.6 (92) 31.7 (63) 75.0 (8) 25.0 (8) 0.0 (4) 57.1 (7)
Biology 304 22.4 27.3 (154) 17.3 (150) 16.2 (99) 12.5 (96) 41.7 (48) 21.7 (46) 100.0 (5) 33.3 (3) 50.0 (2) 60.0 (5)
ACT Composite 232 22.4 26.2 (130) 17.6 (102) 27.1 (96) 18.9 (74) 21.9 (32) 13.6 (22) 100.0 (1) 25.0 (4) 0.0 (1) 0.0 (2)
Math Course Rigor 249 90.4 90.5 (126) 90.2 (123) 91.4 (93) 92.4 (92) 88.0 (25) 82.6 (23) 100.0 (2) 80.0 (5) 83.3 (6) 100.0 (3)
WorkKeys 134 51.5 47.1 (68) 56.1 (66) 43.4 (53) 58.5 (53) 66.7 (12) 50.0 (10) 50.0 (2) 0.0 (1) 0.0 (1) 50.0 (2)
RG01 - Academic Achievement by Ethnicity and Gender 11/7/2016 4:07:21 PM Page 7
Academic Achievement by Ethnicity and Gender 2016Student Proficiency given Number Tested in Group

Research and Accountability Student Enrollment (20 day) by Ethnicity and Gender 2016
School Total Enrollment
Black Hispanic White Other F M F M F M F M
Count Row % Count Row
% Count Row % Count Row
% Count Row % Count Row
% Count Row % Count Row %
Durham Public Schools 34,082 8075 24% 8081 24% 4790 14% 4976 15% 2989 9% 3244 10% 937 3% 990 3% Bethesda Elementary 655 173 26% 177 27% 115 18% 120 18% 9 1% 35 5% 11 2% 15 2% Brogden Middle 598 141 24% 119 20% 100 17% 106 18% 36 6% 55 9% 21 4% 20 3% Burton Elementary 361 57 16% 85 24% 94 26% 107 30% 1 0% 7 2% 4 1% 6 2% C C Spaulding Elementary 305 108 35% 139 46% 22 7% 23 8% 1 0% 2 1% 5 2% 5 2% C E Jordan High 1,997 393 20% 422 21% 232 12% 245 12% 241 12% 286 14% 78 4% 100 5% City of Medicine 303 139 46% 29 10% 72 24% 15 5% 20 7% 7 2% 15 5% 6 2% Club Blvd Elementary 492 74 15% 62 13% 97 20% 94 19% 58 12% 90 18% 5 1% 12 2% Creekside Elementary 918 118 13% 123 13% 119 13% 121 13% 169 18% 168 18% 45 5% 55 6% DPS Hospital School 38 7 18% 2 5% 2 5% 0 0% 21 55% 5 13% 0 0% 1 3% Durham Sch of the Arts 1,640 369 23% 200 12% 206 13% 155 9% 339 21% 237 14% 76 5% 58 4% Durham's Performance Learning 247 83 34% 73 30% 43 17% 31 13% 8 3% 4 2% 3 1% 2 1% E K Powe Elementary 520 98 19% 61 12% 58 11% 84 16% 97 19% 94 18% 16 3% 12 2% Easley Elementary 581 47 8% 52 9% 56 10% 62 11% 158 27% 151 26% 24 4% 31 5% Eastway Elementary 619 136 22% 129 21% 156 25% 168 27% 7 1% 6 1% 9 1% 8 1% Eno Valley Elementary 592 192 32% 224 38% 48 8% 68 11% 18 3% 16 3% 18 3% 8 1% Fayetteville Street Elementary 300 104 35% 101 34% 34 11% 51 17% 1 0% 5 2% 1 0% 3 1% Forest View Elementary 736 87 12% 84 11% 139 19% 127 17% 110 15% 118 16% 40 5% 31 4% George L Carrington Middle 1,002 252 25% 248 25% 118 12% 149 15% 74 7% 99 10% 26 3% 36 4% George Watts Elementary 407 35 9% 35 9% 67 16% 67 16% 89 22% 89 22% 14 3% 11 3% Glenn Elementary 701 165 24% 160 23% 150 21% 175 25% 8 1% 17 2% 12 2% 14 2% Hillandale Elementary 672 124 18% 145 22% 99 15% 90 13% 73 11% 101 15% 15 2% 25 4% Hillside High 1,307 558 43% 505 39% 101 8% 96 7% 6 0% 11 1% 14 1% 16 1% Hillside New Tech High School 225 71 32% 111 49% 7 3% 22 10% 0 0% 7 3% 2 1% 5 2% Holt Elementary 666 117 18% 123 18% 188 28% 177 27% 12 2% 23 3% 13 2% 13 2% Hope Valley Elementary 638 114 18% 113 18% 126 20% 103 16% 70 11% 63 10% 22 3% 27 4% J D Clement Early College HS 354 127 36% 87 25% 69 19% 39 11% 8 2% 5 1% 9 3% 10 3% James E Shepard Middle 512 185 36% 189 37% 65 13% 58 11% 1 0% 1 0% 7 1% 6 1% Lakeview School 42 7 17% 29 69% 0 0% 4 10% 0 0% 1 2% 0 0% 1 2% Lakewood Elementary 489 86 18% 101 21% 126 26% 139 28% 6 1% 7 1% 10 2% 14 3% Lakewood Middle Montessori 302 32 11% 42 14% 35 12% 37 12% 69 23% 54 18% 22 7% 11 4% Little River Elementary 407 59 14% 75 18% 31 8% 23 6% 88 22% 107 26% 11 3% 13 3% Lowe's Grove Middle 674 210 31% 223 33% 93 14% 85 13% 15 2% 21 3% 13 2% 14 2% Lucas Middle 620 150 24% 150 24% 85 14% 62 10% 76 12% 65 10% 17 3% 15 2% Mangum Elementary 327 19 6% 15 5% 10 3% 5 2% 129 39% 142 43% 4 1% 3 1% Merrick-Moore Elementary 692 177 26% 182 26% 120 17% 175 25% 9 1% 19 3% 8 1% 2 0% Middle College HS @ DTCC 159 46 29% 15 9% 31 19% 14 9% 28 18% 15 9% 7 4% 3 2% Morehead Montessori 261 34 13% 39 15% 32 12% 24 9% 59 23% 58 22% 4 2% 11 4%
511 Cleveland Street • P.O. Box 30002 • Durham, North Carolina 27702 • 919-560-2309 • 919-237-7242 fax • www.dpsnc.net
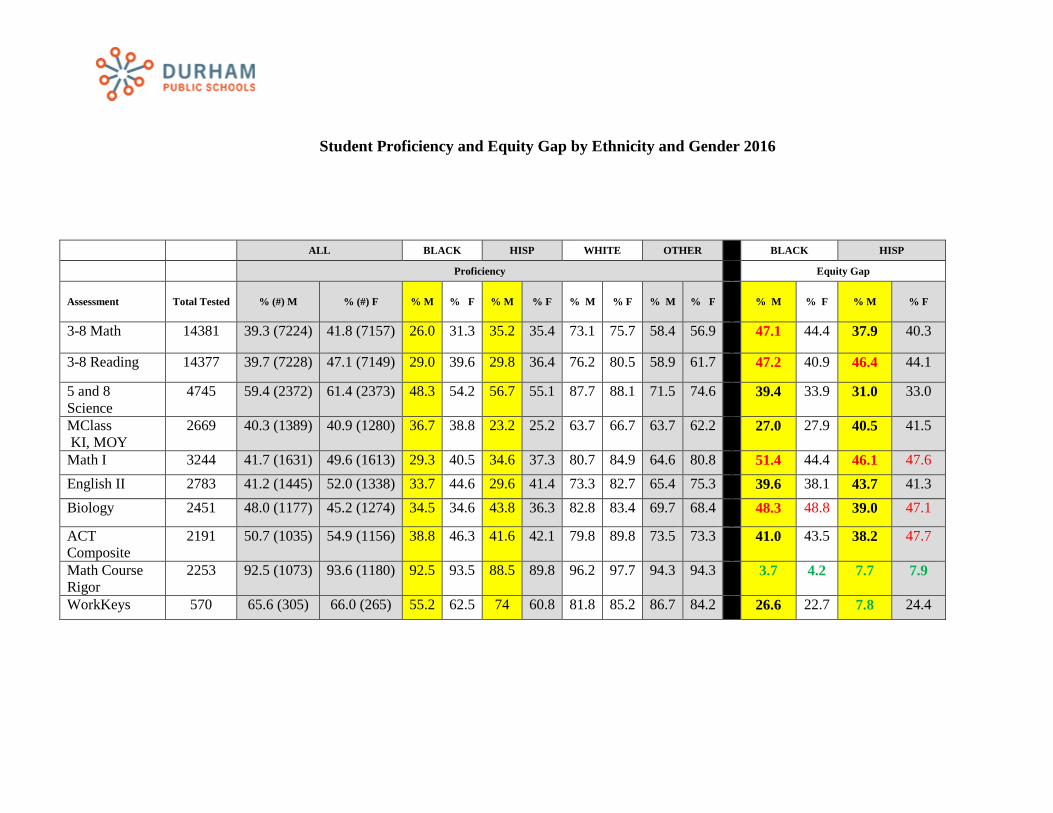
Student Proficiency and Equity Gap by Ethnicity and Gender 2016
ALL BLACK HISP WHITE OTHER BLACK HISP
Proficiency Equity Gap
Assessment Total Tested % (#) M % (#) F % M % F % M % F % M % F % M % F
% M % F % M % F
3-8 Math 14381 39.3 (7224) 41.8 (7157) 26.0 31.3 35.2 35.4 73.1 75.7 58.4 56.9
47.1 44.4 37.9 40.3
3-8 Reading 14377 39.7 (7228) 47.1 (7149) 29.0 39.6 29.8 36.4 76.2 80.5 58.9 61.7
47.2 40.9 46.4 44.1
5 and 8 Science
4745 59.4 (2372) 61.4 (2373) 48.3 54.2 56.7 55.1 87.7 88.1 71.5 74.6
39.4 33.9 31.0 33.0
MClass KI, MOY
2669 40.3 (1389) 40.9 (1280) 36.7 38.8 23.2 25.2 63.7 66.7 63.7 62.2
27.0 27.9 40.5 41.5
Math I 3244 41.7 (1631) 49.6 (1613) 29.3 40.5 34.6 37.3 80.7 84.9 64.6 80.8 51.4 44.4 46.1 47.6 English II 2783 41.2 (1445) 52.0 (1338) 33.7 44.6 29.6 41.4 73.3 82.7 65.4 75.3 39.6 38.1 43.7 41.3 Biology 2451 48.0 (1177) 45.2 (1274) 34.5 34.6 43.8 36.3 82.8 83.4 69.7 68.4
48.3 48.8 39.0 47.1
ACT Composite
2191 50.7 (1035) 54.9 (1156) 38.8 46.3 41.6 42.1 79.8 89.8 73.5 73.3
41.0 43.5 38.2 47.7
Math Course Rigor
2253 92.5 (1073) 93.6 (1180) 92.5 93.5 88.5 89.8 96.2 97.7 94.3 94.3
3.7 4.2 7.7 7.9
WorkKeys 570 65.6 (305) 66.0 (265) 55.2 62.5 74 60.8 81.8 85.2 86.7 84.2 26.6 22.7 7.8 24.4
Research and Accountability
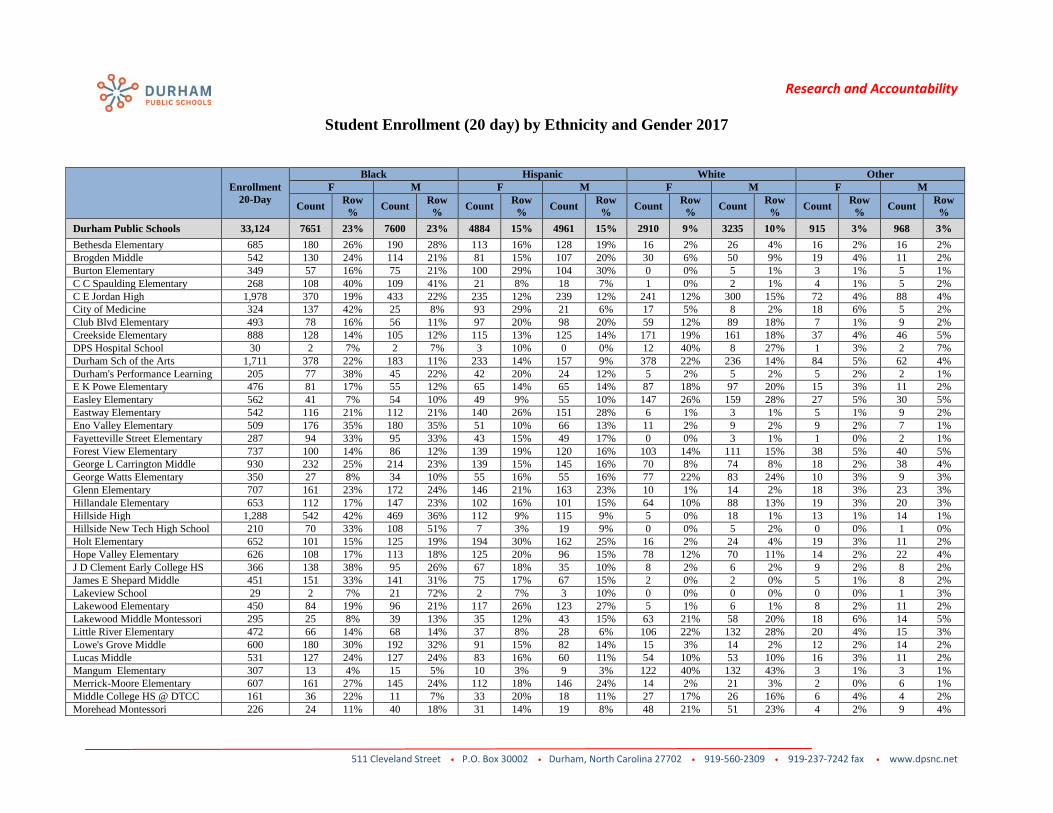
Student Enrollment (20 day) by Ethnicity and Gender 2017
Enrollment 20-Day
Black Hispanic White Other F M F M F M F M
Count Row % Count Row
% Count Row % Count Row
% Count Row % Count Row
% Count Row % Count Row
% Durham Public Schools 33,124 7651 23% 7600 23% 4884 15% 4961 15% 2910 9% 3235 10% 915 3% 968 3% Bethesda Elementary 685 180 26% 190 28% 113 16% 128 19% 16 2% 26 4% 16 2% 16 2% Brogden Middle 542 130 24% 114 21% 81 15% 107 20% 30 6% 50 9% 19 4% 11 2% Burton Elementary 349 57 16% 75 21% 100 29% 104 30% 0 0% 5 1% 3 1% 5 1% C C Spaulding Elementary 268 108 40% 109 41% 21 8% 18 7% 1 0% 2 1% 4 1% 5 2% C E Jordan High 1,978 370 19% 433 22% 235 12% 239 12% 241 12% 300 15% 72 4% 88 4% City of Medicine 324 137 42% 25 8% 93 29% 21 6% 17 5% 8 2% 18 6% 5 2% Club Blvd Elementary 493 78 16% 56 11% 97 20% 98 20% 59 12% 89 18% 7 1% 9 2% Creekside Elementary 888 128 14% 105 12% 115 13% 125 14% 171 19% 161 18% 37 4% 46 5% DPS Hospital School 30 2 7% 2 7% 3 10% 0 0% 12 40% 8 27% 1 3% 2 7% Durham Sch of the Arts 1,711 378 22% 183 11% 233 14% 157 9% 378 22% 236 14% 84 5% 62 4% Durham's Performance Learning 205 77 38% 45 22% 42 20% 24 12% 5 2% 5 2% 5 2% 2 1% E K Powe Elementary 476 81 17% 55 12% 65 14% 65 14% 87 18% 97 20% 15 3% 11 2% Easley Elementary 562 41 7% 54 10% 49 9% 55 10% 147 26% 159 28% 27 5% 30 5% Eastway Elementary 542 116 21% 112 21% 140 26% 151 28% 6 1% 3 1% 5 1% 9 2% Eno Valley Elementary 509 176 35% 180 35% 51 10% 66 13% 11 2% 9 2% 9 2% 7 1% Fayetteville Street Elementary 287 94 33% 95 33% 43 15% 49 17% 0 0% 3 1% 1 0% 2 1% Forest View Elementary 737 100 14% 86 12% 139 19% 120 16% 103 14% 111 15% 38 5% 40 5% George L Carrington Middle 930 232 25% 214 23% 139 15% 145 16% 70 8% 74 8% 18 2% 38 4% George Watts Elementary 350 27 8% 34 10% 55 16% 55 16% 77 22% 83 24% 10 3% 9 3% Glenn Elementary 707 161 23% 172 24% 146 21% 163 23% 10 1% 14 2% 18 3% 23 3% Hillandale Elementary 653 112 17% 147 23% 102 16% 101 15% 64 10% 88 13% 19 3% 20 3% Hillside High 1,288 542 42% 469 36% 112 9% 115 9% 5 0% 18 1% 13 1% 14 1% Hillside New Tech High School 210 70 33% 108 51% 7 3% 19 9% 0 0% 5 2% 0 0% 1 0% Holt Elementary 652 101 15% 125 19% 194 30% 162 25% 16 2% 24 4% 19 3% 11 2% Hope Valley Elementary 626 108 17% 113 18% 125 20% 96 15% 78 12% 70 11% 14 2% 22 4% J D Clement Early College HS 366 138 38% 95 26% 67 18% 35 10% 8 2% 6 2% 9 2% 8 2% James E Shepard Middle 451 151 33% 141 31% 75 17% 67 15% 2 0% 2 0% 5 1% 8 2% Lakeview School 29 2 7% 21 72% 2 7% 3 10% 0 0% 0 0% 0 0% 1 3% Lakewood Elementary 450 84 19% 96 21% 117 26% 123 27% 5 1% 6 1% 8 2% 11 2% Lakewood Middle Montessori 295 25 8% 39 13% 35 12% 43 15% 63 21% 58 20% 18 6% 14 5% Little River Elementary 472 66 14% 68 14% 37 8% 28 6% 106 22% 132 28% 20 4% 15 3% Lowe's Grove Middle 600 180 30% 192 32% 91 15% 82 14% 15 3% 14 2% 12 2% 14 2% Lucas Middle 531 127 24% 127 24% 83 16% 60 11% 54 10% 53 10% 16 3% 11 2% Mangum Elementary 307 13 4% 15 5% 10 3% 9 3% 122 40% 132 43% 3 1% 3 1% Merrick-Moore Elementary 607 161 27% 145 24% 112 18% 146 24% 14 2% 21 3% 2 0% 6 1% Middle College HS @ DTCC 161 36 22% 11 7% 33 20% 18 11% 27 17% 26 16% 6 4% 4 2% Morehead Montessori 226 24 11% 40 18% 31 14% 19 8% 48 21% 51 23% 4 2% 9 4%
511 Cleveland Street • P.O. Box 30002 • Durham, North Carolina 27702 • 919-560-2309 • 919-237-7242 fax • www.dpsnc.net
Research and Accountability
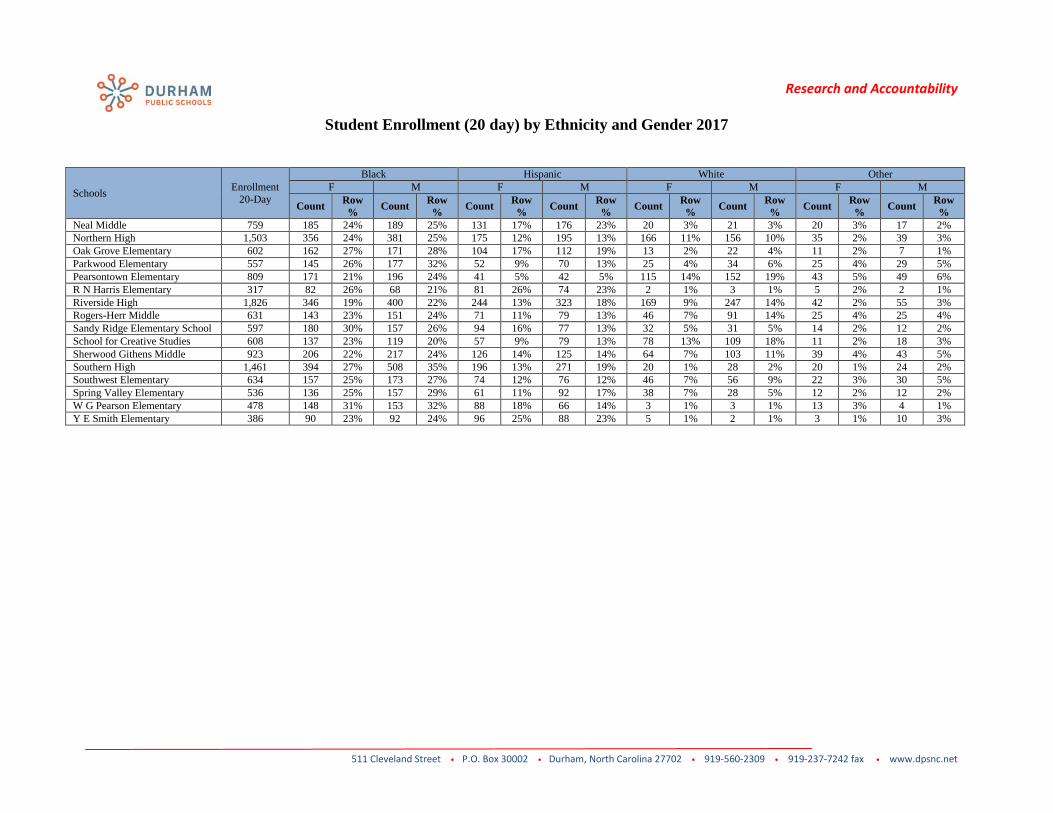
Student Enrollment (20 day) by Ethnicity and Gender 2017
Schools Enrollment 20-Day
Black Hispanic White Other F M F M F M F M
Count Row % Count Row
% Count Row % Count Row
% Count Row % Count Row
% Count Row % Count Row
% Neal Middle 759 185 24% 189 25% 131 17% 176 23% 20 3% 21 3% 20 3% 17 2% Northern High 1,503 356 24% 381 25% 175 12% 195 13% 166 11% 156 10% 35 2% 39 3% Oak Grove Elementary 602 162 27% 171 28% 104 17% 112 19% 13 2% 22 4% 11 2% 7 1% Parkwood Elementary 557 145 26% 177 32% 52 9% 70 13% 25 4% 34 6% 25 4% 29 5% Pearsontown Elementary 809 171 21% 196 24% 41 5% 42 5% 115 14% 152 19% 43 5% 49 6% R N Harris Elementary 317 82 26% 68 21% 81 26% 74 23% 2 1% 3 1% 5 2% 2 1% Riverside High 1,826 346 19% 400 22% 244 13% 323 18% 169 9% 247 14% 42 2% 55 3% Rogers-Herr Middle 631 143 23% 151 24% 71 11% 79 13% 46 7% 91 14% 25 4% 25 4% Sandy Ridge Elementary School 597 180 30% 157 26% 94 16% 77 13% 32 5% 31 5% 14 2% 12 2% School for Creative Studies 608 137 23% 119 20% 57 9% 79 13% 78 13% 109 18% 11 2% 18 3% Sherwood Githens Middle 923 206 22% 217 24% 126 14% 125 14% 64 7% 103 11% 39 4% 43 5% Southern High 1,461 394 27% 508 35% 196 13% 271 19% 20 1% 28 2% 20 1% 24 2% Southwest Elementary 634 157 25% 173 27% 74 12% 76 12% 46 7% 56 9% 22 3% 30 5% Spring Valley Elementary 536 136 25% 157 29% 61 11% 92 17% 38 7% 28 5% 12 2% 12 2% W G Pearson Elementary 478 148 31% 153 32% 88 18% 66 14% 3 1% 3 1% 13 3% 4 1% Y E Smith Elementary 386 90 23% 92 24% 96 25% 88 23% 5 1% 2 1% 3 1% 10 3%
511 Cleveland Street • P.O. Box 30002 • Durham, North Carolina 27702 • 919-560-2309 • 919-237-7242 fax • www.dpsnc.net
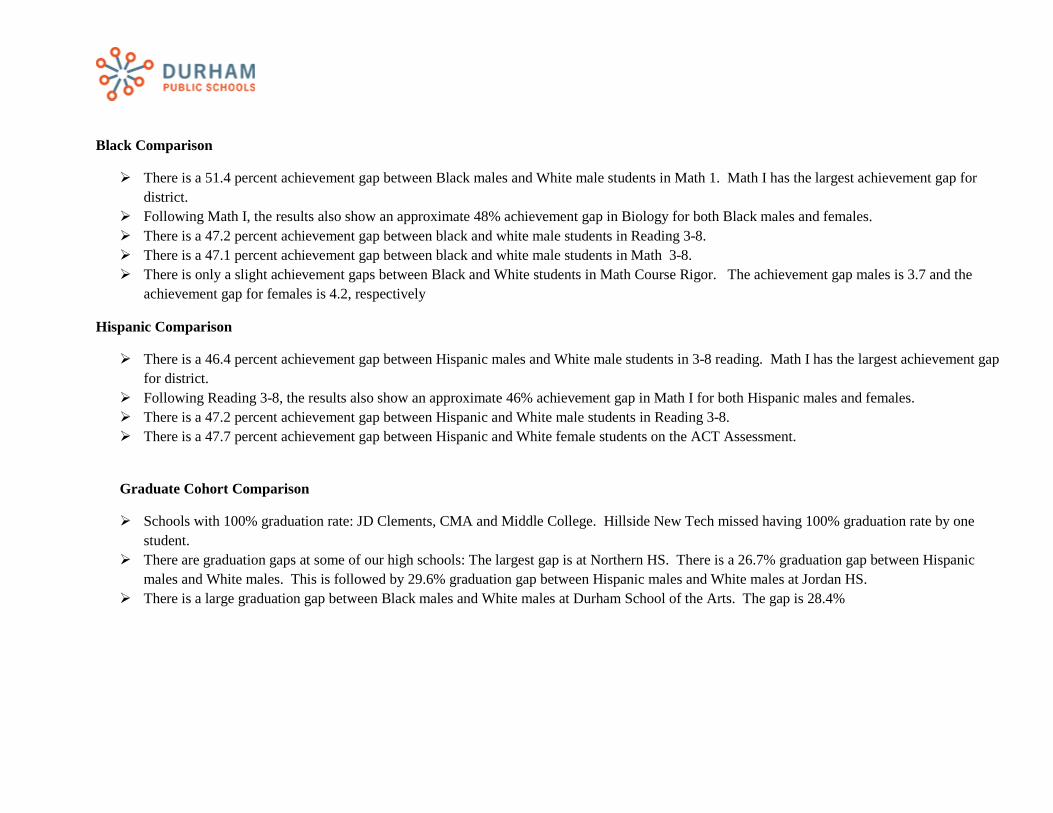
Black Comparison
There is a 51.4 percent achievement gap between Black males and White male students in Math 1. Math I has the largest achievement gap for district.
Following Math I, the results also show an approximate 48% achievement gap in Biology for both Black males and females. There is a 47.2 percent achievement gap between black and white male students in Reading 3-8. There is a 47.1 percent achievement gap between black and white male students in Math 3-8. There is only a slight achievement gaps between Black and White students in Math Course Rigor. The achievement gap males is 3.7 and the
achievement gap for females is 4.2, respectively
Hispanic Comparison
There is a 46.4 percent achievement gap between Hispanic males and White male students in 3-8 reading. Math I has the largest achievement gap for district.
Following Reading 3-8, the results also show an approximate 46% achievement gap in Math I for both Hispanic males and females. There is a 47.2 percent achievement gap between Hispanic and White male students in Reading 3-8. There is a 47.7 percent achievement gap between Hispanic and White female students on the ACT Assessment.
Graduate Cohort Comparison
Schools with 100% graduation rate: JD Clements, CMA and Middle College. Hillside New Tech missed having 100% graduation rate by one student.
There are graduation gaps at some of our high schools: The largest gap is at Northern HS. There is a 26.7% graduation gap between Hispanic males and White males. This is followed by 29.6% graduation gap between Hispanic males and White males at Jordan HS.
There is a large graduation gap between Black males and White males at Durham School of the Arts. The gap is 28.4%
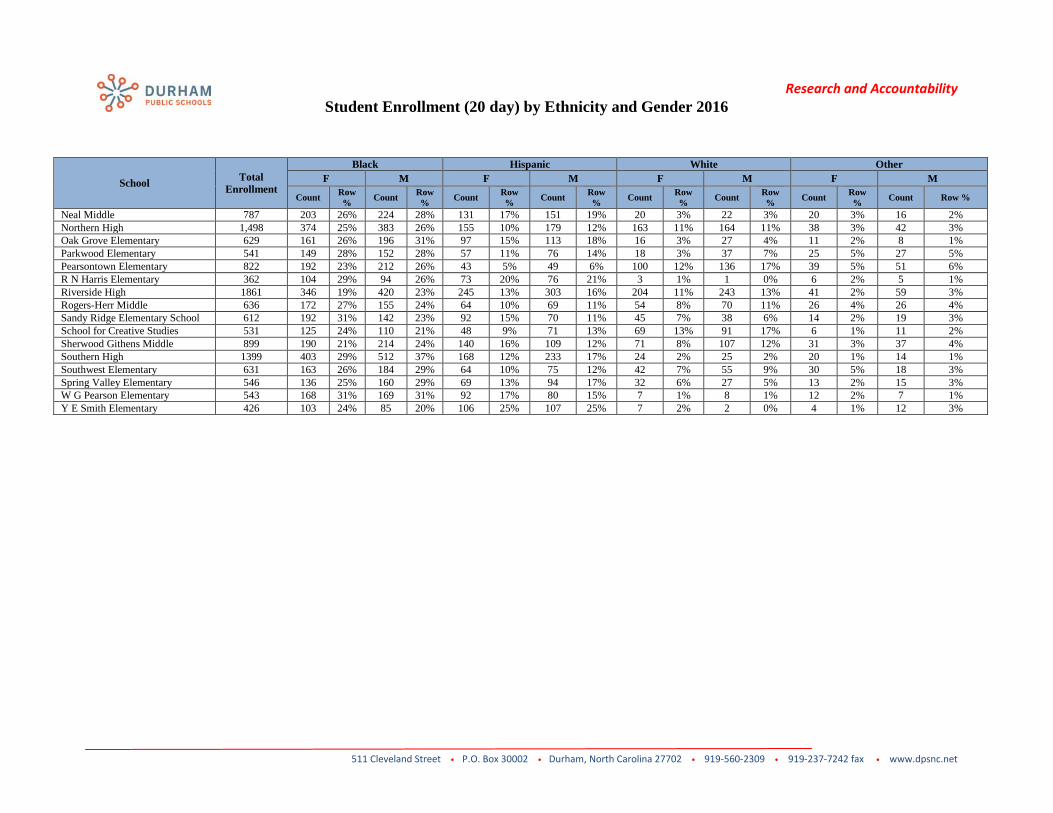
Research and Accountability Student Enrollment (20 day) by Ethnicity and Gender 2016
School Total Enrollment
Black Hispanic White Other F M F M F M F M
Count Row % Count Row
% Count Row % Count Row
% Count Row % Count Row
% Count Row % Count Row %
Neal Middle 787 203 26% 224 28% 131 17% 151 19% 20 3% 22 3% 20 3% 16 2% Northern High 1,498 374 25% 383 26% 155 10% 179 12% 163 11% 164 11% 38 3% 42 3% Oak Grove Elementary 629 161 26% 196 31% 97 15% 113 18% 16 3% 27 4% 11 2% 8 1% Parkwood Elementary 541 149 28% 152 28% 57 11% 76 14% 18 3% 37 7% 25 5% 27 5% Pearsontown Elementary 822 192 23% 212 26% 43 5% 49 6% 100 12% 136 17% 39 5% 51 6% R N Harris Elementary 362 104 29% 94 26% 73 20% 76 21% 3 1% 1 0% 6 2% 5 1% Riverside High 1861 346 19% 420 23% 245 13% 303 16% 204 11% 243 13% 41 2% 59 3% Rogers-Herr Middle 636 172 27% 155 24% 64 10% 69 11% 54 8% 70 11% 26 4% 26 4% Sandy Ridge Elementary School 612 192 31% 142 23% 92 15% 70 11% 45 7% 38 6% 14 2% 19 3% School for Creative Studies 531 125 24% 110 21% 48 9% 71 13% 69 13% 91 17% 6 1% 11 2% Sherwood Githens Middle 899 190 21% 214 24% 140 16% 109 12% 71 8% 107 12% 31 3% 37 4% Southern High 1399 403 29% 512 37% 168 12% 233 17% 24 2% 25 2% 20 1% 14 1% Southwest Elementary 631 163 26% 184 29% 64 10% 75 12% 42 7% 55 9% 30 5% 18 3% Spring Valley Elementary 546 136 25% 160 29% 69 13% 94 17% 32 6% 27 5% 13 2% 15 3% W G Pearson Elementary 543 168 31% 169 31% 92 17% 80 15% 7 1% 8 1% 12 2% 7 1% Y E Smith Elementary 426 103 24% 85 20% 106 25% 107 25% 7 2% 2 0% 4 1% 12 3%
511 Cleveland Street • P.O. Box 30002 • Durham, North Carolina 27702 • 919-560-2309 • 919-237-7242 fax • www.dpsnc.net


ALL GENDER BLACK HISP WHITE OTHER
District School Assessment Total
TestedTotal % Prof
%Prof (#Tested)
M
%Prof (#Tested)
F
%Prof (#Tested)
M
%Prof (#Tested)
F
%Prof (#Tested)
M
%Prof (#Tested)
F
%Prof (#Tested)
M
%Prof (#Tested)
F
%Prof (#Tested)
M
%Prof (#Tested)
F
DPS 3rd Grade Math 2678 52.2 52.5 (1361)
51.9 (1317)
39.8 (605) 43.1 (548) 47.6 (429) 42.7 (452) 83.9 (249) 82.7 (231) 78.2 (78) 73.3 (86)
4th Grade Math 2512 43.5 42.4 (1282)
44.6 (1230)
27.0 (574) 30.2 (560) 41.9 (415) 42.0 (383) 73.5 (223) 80.8 (229) 71.4 (70) 58.6 (58)
5th Grade Math 2330 47.0 46.1 (1180)
48.0 (1150)
33.9 (498) 37.9 (531) 40.8 (370) 44.8 (353) 76.3 (241) 77.1 (201) 56.3 (71) 58.5 (65)
6th Grade Math 2111 34.9 33.1 (1083)
36.9 (1028)
18.8 (485) 26.8 (515) 25.9 (324) 27.7 (278) 72.8 (202) 77.5 (178) 50.0 (72) 45.6 (57)
7th Grade Math 2328 31.8 30.5 (1117)
32.9 (1211)
17.8 (546) 24.7 (582) 24.3 (288) 20.9 (335) 65.3 (216) 69.2 (211) 49.3 (67) 47.0 (83)
8th Grade Math 2422 31.7 28.3 (1201)
35.1 (1221)
18.2 (633) 26.4 (633) 21.8 (298) 28.5 (319) 64.6 (212) 65.9 (205) 39.7 (58) 54.7 (64)
Grades 3-5 Math 7520 47.7 47.1 (3823)
48.3 (3697)
33.7 (1677) 37.0 (1639) 43.6 (1214)
43.1 (1188)
78.1 (713) 80.3 (661) 68.9 (219) 64.6 (209)
Grades 6-8 Math 6861 32.7 30.5 (3401)
34.9 (3460)
18.2 (1664) 26.0 (1730) 24.1 (910) 25.5 (932) 67.5 (630) 70.5 (594) 46.7 (197) 49.0 (204)
Math 3-8 14381 40.5 39.3 (7224)
41.8 (7157)
26.0 (3341) 31.3 (3369) 35.2 (2124)
35.4 (2120)
73.1 (1343) 75.7 (1255) 58.4 (416) 56.9 (413)
MClass KI MOY 2669 40.6 40.3 (1389)
40.9 (1280)
36.7 (570) 38.8 (515) 23.2 (422) 25.2 (440) 63.7 (306) 66.7 (243) 63.7 (91) 62.2 (82)
3rd Grade Reading 2672 45.7 42.2 (1359)
49.2 (1313)
30.6 (604) 45.1 (546) 34.3 (428) 33.0 (451) 77.1 (249) 83.5 (230) 64.1 (78) 68.6 (86)
4th Grade Reading 2510 44.9 41.9 (1281)
48.0 (1229)
32.8 (573) 37.3 (560) 30.4 (415) 39.7 (383) 79.4 (223) 85.1 (228) 65.7 (70) 60.3 (58)
5th Grade Reading 2332 44.0 42.3 (1181)
45.6 (1151)
31.3 (499) 38.2 (531) 30.5 (370) 34.3 (353) 79.7 (241) 78.7 (202) 54.9 (71) 64.6 (65)
6th Grade Reading 2116 43.2 40.2 (1087)
46.5 (1029)
29.3 (488) 38.8 (516) 29.5 (325) 36.3 (278) 79.2 (202) 80.3 (178) 52.8 (72) 59.6 (57)
7th Grade Reading 2323 42.6 38.6 (1116)
46.2 (1207)
27.7 (545) 37.9 (581) 26.4 (288) 38.9 (332) 74.1 (216) 77.3 (211) 65.7 (67) 55.4 (83)
8th Grade Reading 2424 39.7 32.6 (1204)
46.8 (1220)
23.2 (634) 40.3 (632) 25.0 (300) 37.3 (319) 67.0 (212) 77.1 (205) 48.3 (58) 60.9 (64)
Grades 3-5 Reading
7514 44.9 42.2 (3821)
47.7 (3693)
31.6 (1676) 40.2 (1637) 31.8 (1213)
35.6 (1187)
78.7 (713) 82.6 (660) 61.6 (219) 65.1 (209)
Grades 6-8 Reading
6863 41.8 37.0 (3407)
46.5 (3456)
26.5 (1667) 39.0 (1729) 27.1 (913) 37.6 (929) 73.3 (630) 78.1 (594) 55.8 (197) 58.3 (204)
Reading 3-8 14377 43.4 39.7 (7228)
47.1 (7149)
29.0 (3343) 39.6 (3366) 29.8 (2126)
36.4 (2116)
76.2 (1343) 80.5 (1254) 58.9 (416) 61.7 (413)
5 and 8 Science 4745 60.4 59.4 (2372)
61.4 (2373)
48.3 (1121) 54.2 (1166) 56.7 (667) 55.1 (672) 87.7 (454) 88.1 (405) 71.5 (130) 74.6 (130)
Math I 3244 45.6 41.7 (1631)
49.6 (1613)
29.3 (820) 40.5 (812) 34.6 (437) 37.3 (432) 80.7 (295) 84.9 (291) 64.6 (79) 80.8 (78)
English II 2783 46.4 41.2 (1445)
52.0 (1338)
33.7 (724) 44.6 (711) 29.6 (389) 41.4 (324) 73.3 (251) 82.7 (226) 65.4 (81) 75.3 (77)
Biology 2451 46.6 48.0 (1177)
45.2 (1274)
34.5 (608) 34.6 (664) 43.8 (276) 36.3 (320) 82.8 (227) 83.4 (211) 69.7 (66) 68.4 (79)
ACT Composite 2191 52.9 50.7 (1035)
54.9 (1156)
38.8 (518) 46.3 (628) 41.6 (221) 42.1 (252) 79.8 (228) 89.8 (216) 73.5 (68) 73.3 (60)
Math Course Rigor 2253 93.1 92.5 (1073)
93.6 (1180)
92.5 (577) 93.5 (646) 88.5 (217) 89.8 (245) 96.2 (209) 97.7 (219) 94.3 (70) 94.3 (70)
WorkKeys 570 65.8 65.6 (305) 66.0 (265) 55.2 (174) 62.5 (168) 74.0 (50) 60.8 (51) 81.8 (66) 85.2 (27) 86.7 (15) 84.2 (19)
Grad Cohort 4yr 2532 82.3 77.8 (1242)
86.7 (1290)
75.7 (683) 87.1 (713) 71.4 (255) 83.1 (260) 88.4 (232) 90.3 (238) 86.1 (72) 83.5 (79)
RG01 - Academic Achievement by Ethnicity and Gender 11/18/2016 1:12:53 PM Page 1
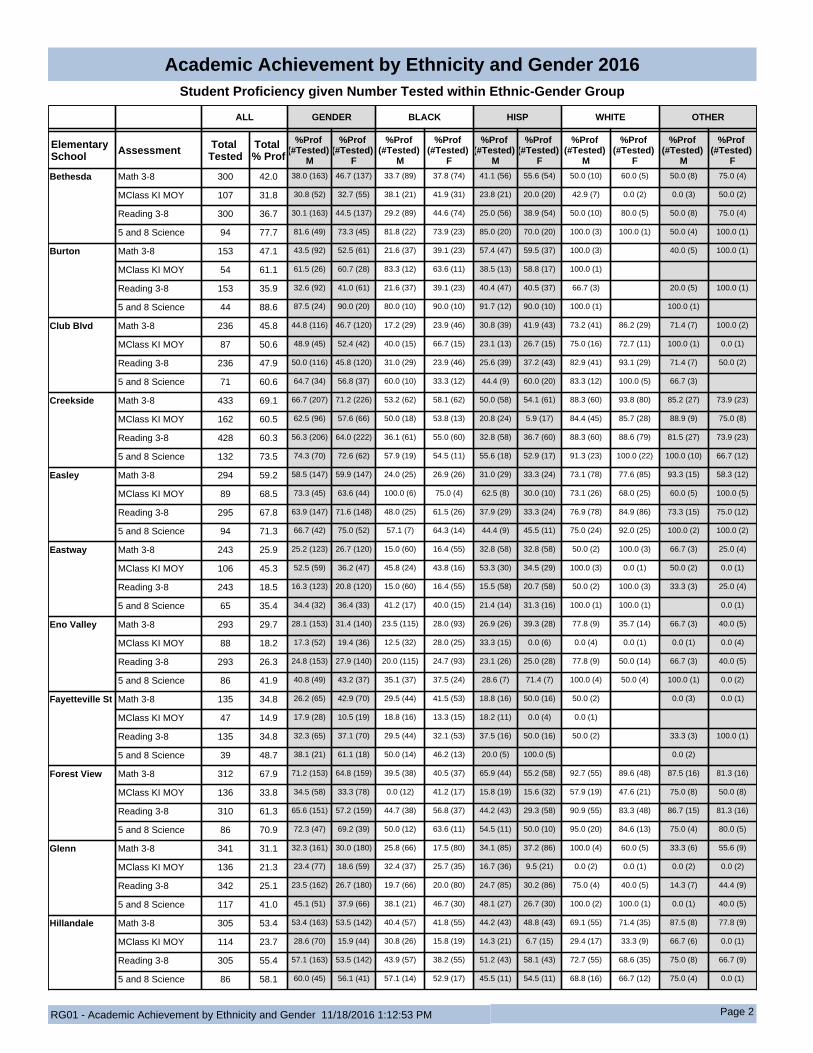
Academic Achievement by Ethnicity and Gender 2016Student Proficiency given Number Tested within Ethnic-Gender Group
ALL GENDER BLACK HISP WHITE OTHER
Elementary School Assessment Total
TestedTotal % Prof
%Prof (#Tested)
M
%Prof (#Tested)
F
%Prof (#Tested)
M
%Prof (#Tested)
F
%Prof (#Tested)
M
%Prof (#Tested)
F
%Prof (#Tested)
M
%Prof (#Tested)
F
%Prof (#Tested)
M
%Prof (#Tested)
F
Bethesda Math 3-8 300 42.0 38.0 (163) 46.7 (137) 33.7 (89) 37.8 (74) 41.1 (56) 55.6 (54) 50.0 (10) 60.0 (5) 50.0 (8) 75.0 (4)
MClass KI MOY 107 31.8 30.8 (52) 32.7 (55) 38.1 (21) 41.9 (31) 23.8 (21) 20.0 (20) 42.9 (7) 0.0 (2) 0.0 (3) 50.0 (2)
Reading 3-8 300 36.7 30.1 (163) 44.5 (137) 29.2 (89) 44.6 (74) 25.0 (56) 38.9 (54) 50.0 (10) 80.0 (5) 50.0 (8) 75.0 (4)
5 and 8 Science 94 77.7 81.6 (49) 73.3 (45) 81.8 (22) 73.9 (23) 85.0 (20) 70.0 (20) 100.0 (3) 100.0 (1) 50.0 (4) 100.0 (1)
Burton Math 3-8 153 47.1 43.5 (92) 52.5 (61) 21.6 (37) 39.1 (23) 57.4 (47) 59.5 (37) 100.0 (3) 40.0 (5) 100.0 (1)
MClass KI MOY 54 61.1 61.5 (26) 60.7 (28) 83.3 (12) 63.6 (11) 38.5 (13) 58.8 (17) 100.0 (1)
Reading 3-8 153 35.9 32.6 (92) 41.0 (61) 21.6 (37) 39.1 (23) 40.4 (47) 40.5 (37) 66.7 (3) 20.0 (5) 100.0 (1)
5 and 8 Science 44 88.6 87.5 (24) 90.0 (20) 80.0 (10) 90.0 (10) 91.7 (12) 90.0 (10) 100.0 (1) 100.0 (1)
Club Blvd Math 3-8 236 45.8 44.8 (116) 46.7 (120) 17.2 (29) 23.9 (46) 30.8 (39) 41.9 (43) 73.2 (41) 86.2 (29) 71.4 (7) 100.0 (2)
MClass KI MOY 87 50.6 48.9 (45) 52.4 (42) 40.0 (15) 66.7 (15) 23.1 (13) 26.7 (15) 75.0 (16) 72.7 (11) 100.0 (1) 0.0 (1)
Reading 3-8 236 47.9 50.0 (116) 45.8 (120) 31.0 (29) 23.9 (46) 25.6 (39) 37.2 (43) 82.9 (41) 93.1 (29) 71.4 (7) 50.0 (2)
5 and 8 Science 71 60.6 64.7 (34) 56.8 (37) 60.0 (10) 33.3 (12) 44.4 (9) 60.0 (20) 83.3 (12) 100.0 (5) 66.7 (3)
Creekside Math 3-8 433 69.1 66.7 (207) 71.2 (226) 53.2 (62) 58.1 (62) 50.0 (58) 54.1 (61) 88.3 (60) 93.8 (80) 85.2 (27) 73.9 (23)
MClass KI MOY 162 60.5 62.5 (96) 57.6 (66) 50.0 (18) 53.8 (13) 20.8 (24) 5.9 (17) 84.4 (45) 85.7 (28) 88.9 (9) 75.0 (8)
Reading 3-8 428 60.3 56.3 (206) 64.0 (222) 36.1 (61) 55.0 (60) 32.8 (58) 36.7 (60) 88.3 (60) 88.6 (79) 81.5 (27) 73.9 (23)
5 and 8 Science 132 73.5 74.3 (70) 72.6 (62) 57.9 (19) 54.5 (11) 55.6 (18) 52.9 (17) 91.3 (23) 100.0 (22) 100.0 (10) 66.7 (12)
Easley Math 3-8 294 59.2 58.5 (147) 59.9 (147) 24.0 (25) 26.9 (26) 31.0 (29) 33.3 (24) 73.1 (78) 77.6 (85) 93.3 (15) 58.3 (12)
MClass KI MOY 89 68.5 73.3 (45) 63.6 (44) 100.0 (6) 75.0 (4) 62.5 (8) 30.0 (10) 73.1 (26) 68.0 (25) 60.0 (5) 100.0 (5)
Reading 3-8 295 67.8 63.9 (147) 71.6 (148) 48.0 (25) 61.5 (26) 37.9 (29) 33.3 (24) 76.9 (78) 84.9 (86) 73.3 (15) 75.0 (12)
5 and 8 Science 94 71.3 66.7 (42) 75.0 (52) 57.1 (7) 64.3 (14) 44.4 (9) 45.5 (11) 75.0 (24) 92.0 (25) 100.0 (2) 100.0 (2)
Eastway Math 3-8 243 25.9 25.2 (123) 26.7 (120) 15.0 (60) 16.4 (55) 32.8 (58) 32.8 (58) 50.0 (2) 100.0 (3) 66.7 (3) 25.0 (4)
MClass KI MOY 106 45.3 52.5 (59) 36.2 (47) 45.8 (24) 43.8 (16) 53.3 (30) 34.5 (29) 100.0 (3) 0.0 (1) 50.0 (2) 0.0 (1)
Reading 3-8 243 18.5 16.3 (123) 20.8 (120) 15.0 (60) 16.4 (55) 15.5 (58) 20.7 (58) 50.0 (2) 100.0 (3) 33.3 (3) 25.0 (4)
5 and 8 Science 65 35.4 34.4 (32) 36.4 (33) 41.2 (17) 40.0 (15) 21.4 (14) 31.3 (16) 100.0 (1) 100.0 (1) 0.0 (1)
Eno Valley Math 3-8 293 29.7 28.1 (153) 31.4 (140) 23.5 (115) 28.0 (93) 26.9 (26) 39.3 (28) 77.8 (9) 35.7 (14) 66.7 (3) 40.0 (5)
MClass KI MOY 88 18.2 17.3 (52) 19.4 (36) 12.5 (32) 28.0 (25) 33.3 (15) 0.0 (6) 0.0 (4) 0.0 (1) 0.0 (1) 0.0 (4)
Reading 3-8 293 26.3 24.8 (153) 27.9 (140) 20.0 (115) 24.7 (93) 23.1 (26) 25.0 (28) 77.8 (9) 50.0 (14) 66.7 (3) 40.0 (5)
5 and 8 Science 86 41.9 40.8 (49) 43.2 (37) 35.1 (37) 37.5 (24) 28.6 (7) 71.4 (7) 100.0 (4) 50.0 (4) 100.0 (1) 0.0 (2)
Fayetteville St Math 3-8 135 34.8 26.2 (65) 42.9 (70) 29.5 (44) 41.5 (53) 18.8 (16) 50.0 (16) 50.0 (2) 0.0 (3) 0.0 (1)
MClass KI MOY 47 14.9 17.9 (28) 10.5 (19) 18.8 (16) 13.3 (15) 18.2 (11) 0.0 (4) 0.0 (1)
Reading 3-8 135 34.8 32.3 (65) 37.1 (70) 29.5 (44) 32.1 (53) 37.5 (16) 50.0 (16) 50.0 (2) 33.3 (3) 100.0 (1)
5 and 8 Science 39 48.7 38.1 (21) 61.1 (18) 50.0 (14) 46.2 (13) 20.0 (5) 100.0 (5) 0.0 (2)
Forest View Math 3-8 312 67.9 71.2 (153) 64.8 (159) 39.5 (38) 40.5 (37) 65.9 (44) 55.2 (58) 92.7 (55) 89.6 (48) 87.5 (16) 81.3 (16)
MClass KI MOY 136 33.8 34.5 (58) 33.3 (78) 0.0 (12) 41.2 (17) 15.8 (19) 15.6 (32) 57.9 (19) 47.6 (21) 75.0 (8) 50.0 (8)
Reading 3-8 310 61.3 65.6 (151) 57.2 (159) 44.7 (38) 56.8 (37) 44.2 (43) 29.3 (58) 90.9 (55) 83.3 (48) 86.7 (15) 81.3 (16)
5 and 8 Science 86 70.9 72.3 (47) 69.2 (39) 50.0 (12) 63.6 (11) 54.5 (11) 50.0 (10) 95.0 (20) 84.6 (13) 75.0 (4) 80.0 (5)
Glenn Math 3-8 341 31.1 32.3 (161) 30.0 (180) 25.8 (66) 17.5 (80) 34.1 (85) 37.2 (86) 100.0 (4) 60.0 (5) 33.3 (6) 55.6 (9)
MClass KI MOY 136 21.3 23.4 (77) 18.6 (59) 32.4 (37) 25.7 (35) 16.7 (36) 9.5 (21) 0.0 (2) 0.0 (1) 0.0 (2) 0.0 (2)
Reading 3-8 342 25.1 23.5 (162) 26.7 (180) 19.7 (66) 20.0 (80) 24.7 (85) 30.2 (86) 75.0 (4) 40.0 (5) 14.3 (7) 44.4 (9)
5 and 8 Science 117 41.0 45.1 (51) 37.9 (66) 38.1 (21) 46.7 (30) 48.1 (27) 26.7 (30) 100.0 (2) 100.0 (1) 0.0 (1) 40.0 (5)
Hillandale Math 3-8 305 53.4 53.4 (163) 53.5 (142) 40.4 (57) 41.8 (55) 44.2 (43) 48.8 (43) 69.1 (55) 71.4 (35) 87.5 (8) 77.8 (9)
MClass KI MOY 114 23.7 28.6 (70) 15.9 (44) 30.8 (26) 15.8 (19) 14.3 (21) 6.7 (15) 29.4 (17) 33.3 (9) 66.7 (6) 0.0 (1)
Reading 3-8 305 55.4 57.1 (163) 53.5 (142) 43.9 (57) 38.2 (55) 51.2 (43) 58.1 (43) 72.7 (55) 68.6 (35) 75.0 (8) 66.7 (9)
5 and 8 Science 86 58.1 60.0 (45) 56.1 (41) 57.1 (14) 52.9 (17) 45.5 (11) 54.5 (11) 68.8 (16) 66.7 (12) 75.0 (4) 0.0 (1)
RG01 - Academic Achievement by Ethnicity and Gender 11/18/2016 1:12:53 PM Page 2
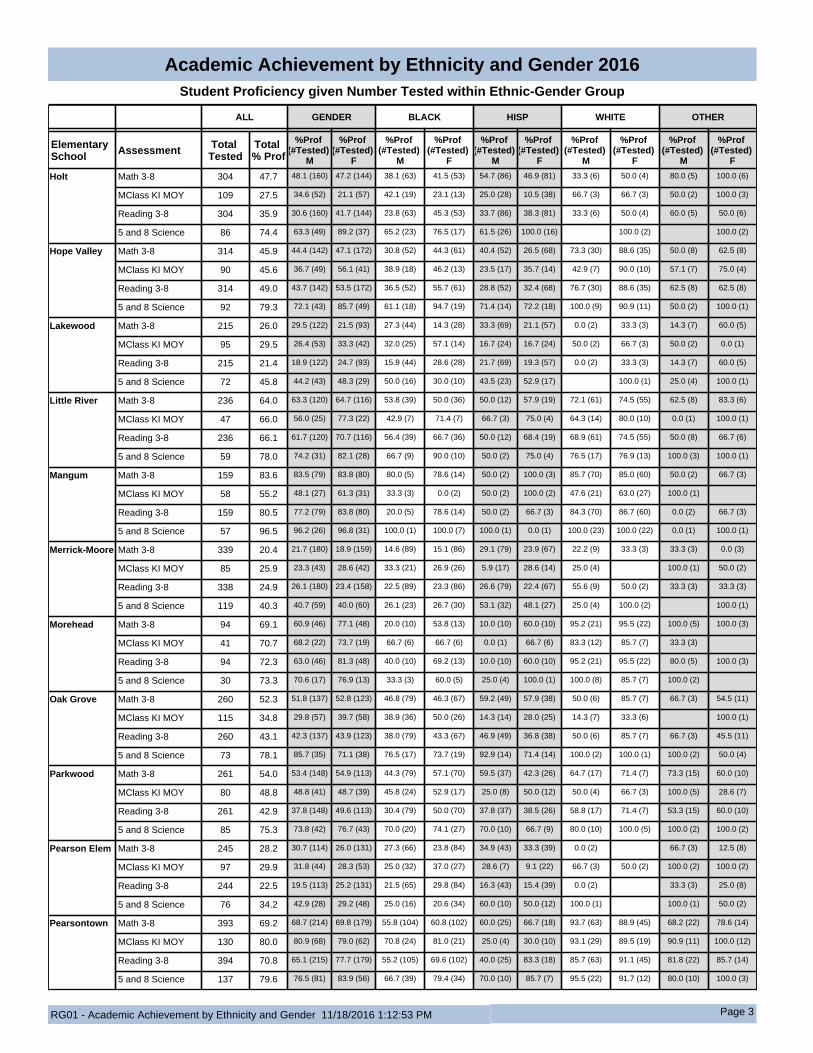
Academic Achievement by Ethnicity and Gender 2016Student Proficiency given Number Tested within Ethnic-Gender Group
ALL GENDER BLACK HISP WHITE OTHER
Elementary School Assessment Total
TestedTotal % Prof
%Prof (#Tested)
M
%Prof (#Tested)
F
%Prof (#Tested)
M
%Prof (#Tested)
F
%Prof (#Tested)
M
%Prof (#Tested)
F
%Prof (#Tested)
M
%Prof (#Tested)
F
%Prof (#Tested)
M
%Prof (#Tested)
F
Holt Math 3-8 304 47.7 48.1 (160) 47.2 (144) 38.1 (63) 41.5 (53) 54.7 (86) 46.9 (81) 33.3 (6) 50.0 (4) 80.0 (5) 100.0 (6)
MClass KI MOY 109 27.5 34.6 (52) 21.1 (57) 42.1 (19) 23.1 (13) 25.0 (28) 10.5 (38) 66.7 (3) 66.7 (3) 50.0 (2) 100.0 (3)
Reading 3-8 304 35.9 30.6 (160) 41.7 (144) 23.8 (63) 45.3 (53) 33.7 (86) 38.3 (81) 33.3 (6) 50.0 (4) 60.0 (5) 50.0 (6)
5 and 8 Science 86 74.4 63.3 (49) 89.2 (37) 65.2 (23) 76.5 (17) 61.5 (26) 100.0 (16) 100.0 (2) 100.0 (2)
Hope Valley Math 3-8 314 45.9 44.4 (142) 47.1 (172) 30.8 (52) 44.3 (61) 40.4 (52) 26.5 (68) 73.3 (30) 88.6 (35) 50.0 (8) 62.5 (8)
MClass KI MOY 90 45.6 36.7 (49) 56.1 (41) 38.9 (18) 46.2 (13) 23.5 (17) 35.7 (14) 42.9 (7) 90.0 (10) 57.1 (7) 75.0 (4)
Reading 3-8 314 49.0 43.7 (142) 53.5 (172) 36.5 (52) 55.7 (61) 28.8 (52) 32.4 (68) 76.7 (30) 88.6 (35) 62.5 (8) 62.5 (8)
5 and 8 Science 92 79.3 72.1 (43) 85.7 (49) 61.1 (18) 94.7 (19) 71.4 (14) 72.2 (18) 100.0 (9) 90.9 (11) 50.0 (2) 100.0 (1)
Lakewood Math 3-8 215 26.0 29.5 (122) 21.5 (93) 27.3 (44) 14.3 (28) 33.3 (69) 21.1 (57) 0.0 (2) 33.3 (3) 14.3 (7) 60.0 (5)
MClass KI MOY 95 29.5 26.4 (53) 33.3 (42) 32.0 (25) 57.1 (14) 16.7 (24) 16.7 (24) 50.0 (2) 66.7 (3) 50.0 (2) 0.0 (1)
Reading 3-8 215 21.4 18.9 (122) 24.7 (93) 15.9 (44) 28.6 (28) 21.7 (69) 19.3 (57) 0.0 (2) 33.3 (3) 14.3 (7) 60.0 (5)
5 and 8 Science 72 45.8 44.2 (43) 48.3 (29) 50.0 (16) 30.0 (10) 43.5 (23) 52.9 (17) 100.0 (1) 25.0 (4) 100.0 (1)
Little River Math 3-8 236 64.0 63.3 (120) 64.7 (116) 53.8 (39) 50.0 (36) 50.0 (12) 57.9 (19) 72.1 (61) 74.5 (55) 62.5 (8) 83.3 (6)
MClass KI MOY 47 66.0 56.0 (25) 77.3 (22) 42.9 (7) 71.4 (7) 66.7 (3) 75.0 (4) 64.3 (14) 80.0 (10) 0.0 (1) 100.0 (1)
Reading 3-8 236 66.1 61.7 (120) 70.7 (116) 56.4 (39) 66.7 (36) 50.0 (12) 68.4 (19) 68.9 (61) 74.5 (55) 50.0 (8) 66.7 (6)
5 and 8 Science 59 78.0 74.2 (31) 82.1 (28) 66.7 (9) 90.0 (10) 50.0 (2) 75.0 (4) 76.5 (17) 76.9 (13) 100.0 (3) 100.0 (1)
Mangum Math 3-8 159 83.6 83.5 (79) 83.8 (80) 80.0 (5) 78.6 (14) 50.0 (2) 100.0 (3) 85.7 (70) 85.0 (60) 50.0 (2) 66.7 (3)
MClass KI MOY 58 55.2 48.1 (27) 61.3 (31) 33.3 (3) 0.0 (2) 50.0 (2) 100.0 (2) 47.6 (21) 63.0 (27) 100.0 (1)
Reading 3-8 159 80.5 77.2 (79) 83.8 (80) 20.0 (5) 78.6 (14) 50.0 (2) 66.7 (3) 84.3 (70) 86.7 (60) 0.0 (2) 66.7 (3)
5 and 8 Science 57 96.5 96.2 (26) 96.8 (31) 100.0 (1) 100.0 (7) 100.0 (1) 0.0 (1) 100.0 (23) 100.0 (22) 0.0 (1) 100.0 (1)
Merrick-Moore Math 3-8 339 20.4 21.7 (180) 18.9 (159) 14.6 (89) 15.1 (86) 29.1 (79) 23.9 (67) 22.2 (9) 33.3 (3) 33.3 (3) 0.0 (3)
MClass KI MOY 85 25.9 23.3 (43) 28.6 (42) 33.3 (21) 26.9 (26) 5.9 (17) 28.6 (14) 25.0 (4) 100.0 (1) 50.0 (2)
Reading 3-8 338 24.9 26.1 (180) 23.4 (158) 22.5 (89) 23.3 (86) 26.6 (79) 22.4 (67) 55.6 (9) 50.0 (2) 33.3 (3) 33.3 (3)
5 and 8 Science 119 40.3 40.7 (59) 40.0 (60) 26.1 (23) 26.7 (30) 53.1 (32) 48.1 (27) 25.0 (4) 100.0 (2) 100.0 (1)
Morehead Math 3-8 94 69.1 60.9 (46) 77.1 (48) 20.0 (10) 53.8 (13) 10.0 (10) 60.0 (10) 95.2 (21) 95.5 (22) 100.0 (5) 100.0 (3)
MClass KI MOY 41 70.7 68.2 (22) 73.7 (19) 66.7 (6) 66.7 (6) 0.0 (1) 66.7 (6) 83.3 (12) 85.7 (7) 33.3 (3)
Reading 3-8 94 72.3 63.0 (46) 81.3 (48) 40.0 (10) 69.2 (13) 10.0 (10) 60.0 (10) 95.2 (21) 95.5 (22) 80.0 (5) 100.0 (3)
5 and 8 Science 30 73.3 70.6 (17) 76.9 (13) 33.3 (3) 60.0 (5) 25.0 (4) 100.0 (1) 100.0 (8) 85.7 (7) 100.0 (2)
Oak Grove Math 3-8 260 52.3 51.8 (137) 52.8 (123) 46.8 (79) 46.3 (67) 59.2 (49) 57.9 (38) 50.0 (6) 85.7 (7) 66.7 (3) 54.5 (11)
MClass KI MOY 115 34.8 29.8 (57) 39.7 (58) 38.9 (36) 50.0 (26) 14.3 (14) 28.0 (25) 14.3 (7) 33.3 (6) 100.0 (1)
Reading 3-8 260 43.1 42.3 (137) 43.9 (123) 38.0 (79) 43.3 (67) 46.9 (49) 36.8 (38) 50.0 (6) 85.7 (7) 66.7 (3) 45.5 (11)
5 and 8 Science 73 78.1 85.7 (35) 71.1 (38) 76.5 (17) 73.7 (19) 92.9 (14) 71.4 (14) 100.0 (2) 100.0 (1) 100.0 (2) 50.0 (4)
Parkwood Math 3-8 261 54.0 53.4 (148) 54.9 (113) 44.3 (79) 57.1 (70) 59.5 (37) 42.3 (26) 64.7 (17) 71.4 (7) 73.3 (15) 60.0 (10)
MClass KI MOY 80 48.8 48.8 (41) 48.7 (39) 45.8 (24) 52.9 (17) 25.0 (8) 50.0 (12) 50.0 (4) 66.7 (3) 100.0 (5) 28.6 (7)
Reading 3-8 261 42.9 37.8 (148) 49.6 (113) 30.4 (79) 50.0 (70) 37.8 (37) 38.5 (26) 58.8 (17) 71.4 (7) 53.3 (15) 60.0 (10)
5 and 8 Science 85 75.3 73.8 (42) 76.7 (43) 70.0 (20) 74.1 (27) 70.0 (10) 66.7 (9) 80.0 (10) 100.0 (5) 100.0 (2) 100.0 (2)
Pearson Elem Math 3-8 245 28.2 30.7 (114) 26.0 (131) 27.3 (66) 23.8 (84) 34.9 (43) 33.3 (39) 0.0 (2) 66.7 (3) 12.5 (8)
MClass KI MOY 97 29.9 31.8 (44) 28.3 (53) 25.0 (32) 37.0 (27) 28.6 (7) 9.1 (22) 66.7 (3) 50.0 (2) 100.0 (2) 100.0 (2)
Reading 3-8 244 22.5 19.5 (113) 25.2 (131) 21.5 (65) 29.8 (84) 16.3 (43) 15.4 (39) 0.0 (2) 33.3 (3) 25.0 (8)
5 and 8 Science 76 34.2 42.9 (28) 29.2 (48) 25.0 (16) 20.6 (34) 60.0 (10) 50.0 (12) 100.0 (1) 100.0 (1) 50.0 (2)
Pearsontown Math 3-8 393 69.2 68.7 (214) 69.8 (179) 55.8 (104) 60.8 (102) 60.0 (25) 66.7 (18) 93.7 (63) 88.9 (45) 68.2 (22) 78.6 (14)
MClass KI MOY 130 80.0 80.9 (68) 79.0 (62) 70.8 (24) 81.0 (21) 25.0 (4) 30.0 (10) 93.1 (29) 89.5 (19) 90.9 (11) 100.0 (12)
Reading 3-8 394 70.8 65.1 (215) 77.7 (179) 55.2 (105) 69.6 (102) 40.0 (25) 83.3 (18) 85.7 (63) 91.1 (45) 81.8 (22) 85.7 (14)
5 and 8 Science 137 79.6 76.5 (81) 83.9 (56) 66.7 (39) 79.4 (34) 70.0 (10) 85.7 (7) 95.5 (22) 91.7 (12) 80.0 (10) 100.0 (3)
RG01 - Academic Achievement by Ethnicity and Gender 11/18/2016 1:12:53 PM Page 3
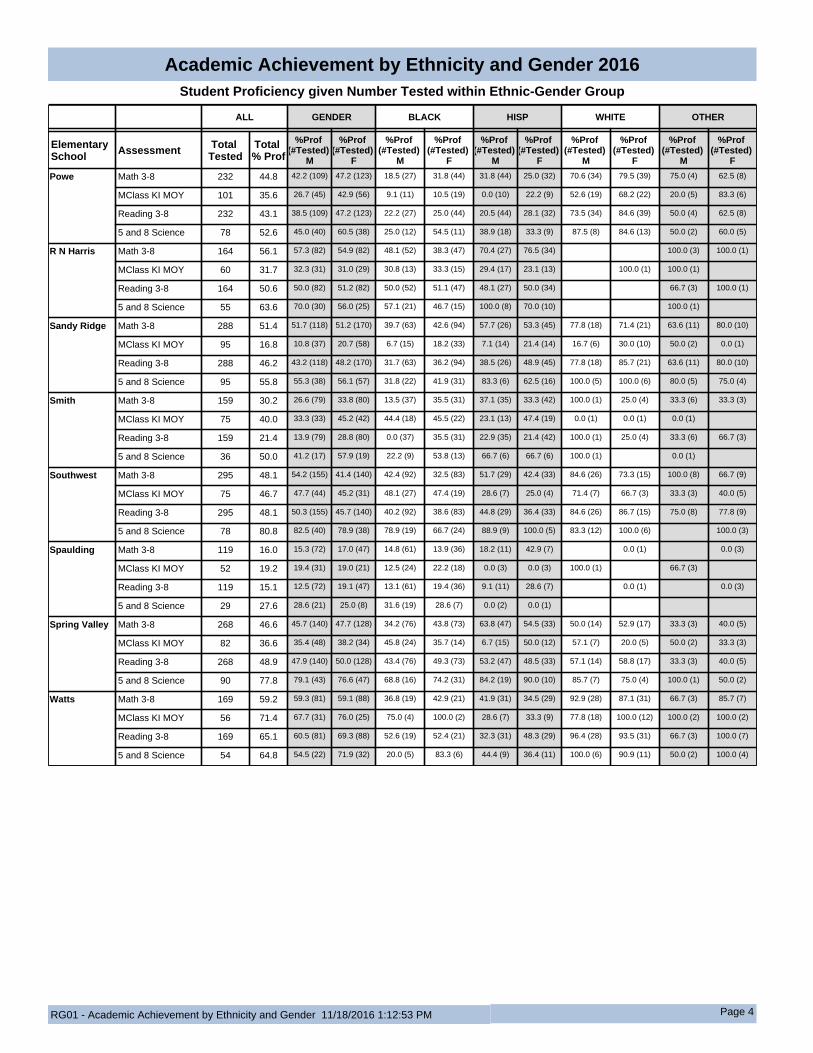
Academic Achievement by Ethnicity and Gender 2016Student Proficiency given Number Tested within Ethnic-Gender Group
ALL GENDER BLACK HISP WHITE OTHER
Elementary School Assessment Total
TestedTotal % Prof
%Prof (#Tested)
M
%Prof (#Tested)
F
%Prof (#Tested)
M
%Prof (#Tested)
F
%Prof (#Tested)
M
%Prof (#Tested)
F
%Prof (#Tested)
M
%Prof (#Tested)
F
%Prof (#Tested)
M
%Prof (#Tested)
F
Powe Math 3-8 232 44.8 42.2 (109) 47.2 (123) 18.5 (27) 31.8 (44) 31.8 (44) 25.0 (32) 70.6 (34) 79.5 (39) 75.0 (4) 62.5 (8)
MClass KI MOY 101 35.6 26.7 (45) 42.9 (56) 9.1 (11) 10.5 (19) 0.0 (10) 22.2 (9) 52.6 (19) 68.2 (22) 20.0 (5) 83.3 (6)
Reading 3-8 232 43.1 38.5 (109) 47.2 (123) 22.2 (27) 25.0 (44) 20.5 (44) 28.1 (32) 73.5 (34) 84.6 (39) 50.0 (4) 62.5 (8)
5 and 8 Science 78 52.6 45.0 (40) 60.5 (38) 25.0 (12) 54.5 (11) 38.9 (18) 33.3 (9) 87.5 (8) 84.6 (13) 50.0 (2) 60.0 (5)
R N Harris Math 3-8 164 56.1 57.3 (82) 54.9 (82) 48.1 (52) 38.3 (47) 70.4 (27) 76.5 (34) 100.0 (3) 100.0 (1)
MClass KI MOY 60 31.7 32.3 (31) 31.0 (29) 30.8 (13) 33.3 (15) 29.4 (17) 23.1 (13) 100.0 (1) 100.0 (1)
Reading 3-8 164 50.6 50.0 (82) 51.2 (82) 50.0 (52) 51.1 (47) 48.1 (27) 50.0 (34) 66.7 (3) 100.0 (1)
5 and 8 Science 55 63.6 70.0 (30) 56.0 (25) 57.1 (21) 46.7 (15) 100.0 (8) 70.0 (10) 100.0 (1)
Sandy Ridge Math 3-8 288 51.4 51.7 (118) 51.2 (170) 39.7 (63) 42.6 (94) 57.7 (26) 53.3 (45) 77.8 (18) 71.4 (21) 63.6 (11) 80.0 (10)
MClass KI MOY 95 16.8 10.8 (37) 20.7 (58) 6.7 (15) 18.2 (33) 7.1 (14) 21.4 (14) 16.7 (6) 30.0 (10) 50.0 (2) 0.0 (1)
Reading 3-8 288 46.2 43.2 (118) 48.2 (170) 31.7 (63) 36.2 (94) 38.5 (26) 48.9 (45) 77.8 (18) 85.7 (21) 63.6 (11) 80.0 (10)
5 and 8 Science 95 55.8 55.3 (38) 56.1 (57) 31.8 (22) 41.9 (31) 83.3 (6) 62.5 (16) 100.0 (5) 100.0 (6) 80.0 (5) 75.0 (4)
Smith Math 3-8 159 30.2 26.6 (79) 33.8 (80) 13.5 (37) 35.5 (31) 37.1 (35) 33.3 (42) 100.0 (1) 25.0 (4) 33.3 (6) 33.3 (3)
MClass KI MOY 75 40.0 33.3 (33) 45.2 (42) 44.4 (18) 45.5 (22) 23.1 (13) 47.4 (19) 0.0 (1) 0.0 (1) 0.0 (1)
Reading 3-8 159 21.4 13.9 (79) 28.8 (80) 0.0 (37) 35.5 (31) 22.9 (35) 21.4 (42) 100.0 (1) 25.0 (4) 33.3 (6) 66.7 (3)
5 and 8 Science 36 50.0 41.2 (17) 57.9 (19) 22.2 (9) 53.8 (13) 66.7 (6) 66.7 (6) 100.0 (1) 0.0 (1)
Southwest Math 3-8 295 48.1 54.2 (155) 41.4 (140) 42.4 (92) 32.5 (83) 51.7 (29) 42.4 (33) 84.6 (26) 73.3 (15) 100.0 (8) 66.7 (9)
MClass KI MOY 75 46.7 47.7 (44) 45.2 (31) 48.1 (27) 47.4 (19) 28.6 (7) 25.0 (4) 71.4 (7) 66.7 (3) 33.3 (3) 40.0 (5)
Reading 3-8 295 48.1 50.3 (155) 45.7 (140) 40.2 (92) 38.6 (83) 44.8 (29) 36.4 (33) 84.6 (26) 86.7 (15) 75.0 (8) 77.8 (9)
5 and 8 Science 78 80.8 82.5 (40) 78.9 (38) 78.9 (19) 66.7 (24) 88.9 (9) 100.0 (5) 83.3 (12) 100.0 (6) 100.0 (3)
Spaulding Math 3-8 119 16.0 15.3 (72) 17.0 (47) 14.8 (61) 13.9 (36) 18.2 (11) 42.9 (7) 0.0 (1) 0.0 (3)
MClass KI MOY 52 19.2 19.4 (31) 19.0 (21) 12.5 (24) 22.2 (18) 0.0 (3) 0.0 (3) 100.0 (1) 66.7 (3)
Reading 3-8 119 15.1 12.5 (72) 19.1 (47) 13.1 (61) 19.4 (36) 9.1 (11) 28.6 (7) 0.0 (1) 0.0 (3)
5 and 8 Science 29 27.6 28.6 (21) 25.0 (8) 31.6 (19) 28.6 (7) 0.0 (2) 0.0 (1)
Spring Valley Math 3-8 268 46.6 45.7 (140) 47.7 (128) 34.2 (76) 43.8 (73) 63.8 (47) 54.5 (33) 50.0 (14) 52.9 (17) 33.3 (3) 40.0 (5)
MClass KI MOY 82 36.6 35.4 (48) 38.2 (34) 45.8 (24) 35.7 (14) 6.7 (15) 50.0 (12) 57.1 (7) 20.0 (5) 50.0 (2) 33.3 (3)
Reading 3-8 268 48.9 47.9 (140) 50.0 (128) 43.4 (76) 49.3 (73) 53.2 (47) 48.5 (33) 57.1 (14) 58.8 (17) 33.3 (3) 40.0 (5)
5 and 8 Science 90 77.8 79.1 (43) 76.6 (47) 68.8 (16) 74.2 (31) 84.2 (19) 90.0 (10) 85.7 (7) 75.0 (4) 100.0 (1) 50.0 (2)
Watts Math 3-8 169 59.2 59.3 (81) 59.1 (88) 36.8 (19) 42.9 (21) 41.9 (31) 34.5 (29) 92.9 (28) 87.1 (31) 66.7 (3) 85.7 (7)
MClass KI MOY 56 71.4 67.7 (31) 76.0 (25) 75.0 (4) 100.0 (2) 28.6 (7) 33.3 (9) 77.8 (18) 100.0 (12) 100.0 (2) 100.0 (2)
Reading 3-8 169 65.1 60.5 (81) 69.3 (88) 52.6 (19) 52.4 (21) 32.3 (31) 48.3 (29) 96.4 (28) 93.5 (31) 66.7 (3) 100.0 (7)
5 and 8 Science 54 64.8 54.5 (22) 71.9 (32) 20.0 (5) 83.3 (6) 44.4 (9) 36.4 (11) 100.0 (6) 90.9 (11) 50.0 (2) 100.0 (4)
RG01 - Academic Achievement by Ethnicity and Gender 11/18/2016 1:12:53 PM Page 4
Academic Achievement by Ethnicity and Gender 2016Student Proficiency given Number Tested within Ethnic-Gender Group
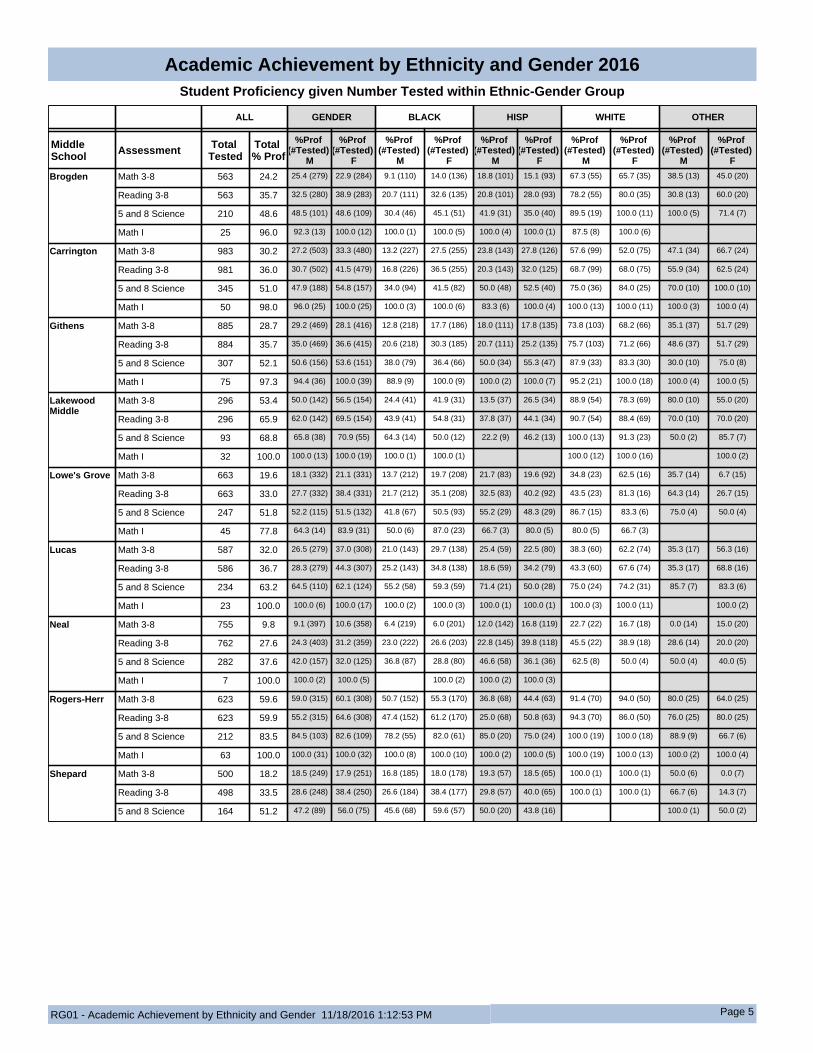
ALL GENDER BLACK HISP WHITE OTHER
Middle School Assessment Total
TestedTotal % Prof
%Prof (#Tested)
M
%Prof (#Tested)
F
%Prof (#Tested)
M
%Prof (#Tested)
F
%Prof (#Tested)
M
%Prof (#Tested)
F
%Prof (#Tested)
M
%Prof (#Tested)
F
%Prof (#Tested)
M
%Prof (#Tested)
F
Brogden Math 3-8 563 24.2 25.4 (279) 22.9 (284) 9.1 (110) 14.0 (136) 18.8 (101) 15.1 (93) 67.3 (55) 65.7 (35) 38.5 (13) 45.0 (20)
Reading 3-8 563 35.7 32.5 (280) 38.9 (283) 20.7 (111) 32.6 (135) 20.8 (101) 28.0 (93) 78.2 (55) 80.0 (35) 30.8 (13) 60.0 (20)
5 and 8 Science 210 48.6 48.5 (101) 48.6 (109) 30.4 (46) 45.1 (51) 41.9 (31) 35.0 (40) 89.5 (19) 100.0 (11) 100.0 (5) 71.4 (7)
Math I 25 96.0 92.3 (13) 100.0 (12) 100.0 (1) 100.0 (5) 100.0 (4) 100.0 (1) 87.5 (8) 100.0 (6)
Carrington Math 3-8 983 30.2 27.2 (503) 33.3 (480) 13.2 (227) 27.5 (255) 23.8 (143) 27.8 (126) 57.6 (99) 52.0 (75) 47.1 (34) 66.7 (24)
Reading 3-8 981 36.0 30.7 (502) 41.5 (479) 16.8 (226) 36.5 (255) 20.3 (143) 32.0 (125) 68.7 (99) 68.0 (75) 55.9 (34) 62.5 (24)
5 and 8 Science 345 51.0 47.9 (188) 54.8 (157) 34.0 (94) 41.5 (82) 50.0 (48) 52.5 (40) 75.0 (36) 84.0 (25) 70.0 (10) 100.0 (10)
Math I 50 98.0 96.0 (25) 100.0 (25) 100.0 (3) 100.0 (6) 83.3 (6) 100.0 (4) 100.0 (13) 100.0 (11) 100.0 (3) 100.0 (4)
Githens Math 3-8 885 28.7 29.2 (469) 28.1 (416) 12.8 (218) 17.7 (186) 18.0 (111) 17.8 (135) 73.8 (103) 68.2 (66) 35.1 (37) 51.7 (29)
Reading 3-8 884 35.7 35.0 (469) 36.6 (415) 20.6 (218) 30.3 (185) 20.7 (111) 25.2 (135) 75.7 (103) 71.2 (66) 48.6 (37) 51.7 (29)
5 and 8 Science 307 52.1 50.6 (156) 53.6 (151) 38.0 (79) 36.4 (66) 50.0 (34) 55.3 (47) 87.9 (33) 83.3 (30) 30.0 (10) 75.0 (8)
Math I 75 97.3 94.4 (36) 100.0 (39) 88.9 (9) 100.0 (9) 100.0 (2) 100.0 (7) 95.2 (21) 100.0 (18) 100.0 (4) 100.0 (5)
Lakewood Middle
Math 3-8 296 53.4 50.0 (142) 56.5 (154) 24.4 (41) 41.9 (31) 13.5 (37) 26.5 (34) 88.9 (54) 78.3 (69) 80.0 (10) 55.0 (20)
Reading 3-8 296 65.9 62.0 (142) 69.5 (154) 43.9 (41) 54.8 (31) 37.8 (37) 44.1 (34) 90.7 (54) 88.4 (69) 70.0 (10) 70.0 (20)
5 and 8 Science 93 68.8 65.8 (38) 70.9 (55) 64.3 (14) 50.0 (12) 22.2 (9) 46.2 (13) 100.0 (13) 91.3 (23) 50.0 (2) 85.7 (7)
Math I 32 100.0 100.0 (13) 100.0 (19) 100.0 (1) 100.0 (1) 100.0 (12) 100.0 (16) 100.0 (2)
Lowe's Grove Math 3-8 663 19.6 18.1 (332) 21.1 (331) 13.7 (212) 19.7 (208) 21.7 (83) 19.6 (92) 34.8 (23) 62.5 (16) 35.7 (14) 6.7 (15)
Reading 3-8 663 33.0 27.7 (332) 38.4 (331) 21.7 (212) 35.1 (208) 32.5 (83) 40.2 (92) 43.5 (23) 81.3 (16) 64.3 (14) 26.7 (15)
5 and 8 Science 247 51.8 52.2 (115) 51.5 (132) 41.8 (67) 50.5 (93) 55.2 (29) 48.3 (29) 86.7 (15) 83.3 (6) 75.0 (4) 50.0 (4)
Math I 45 77.8 64.3 (14) 83.9 (31) 50.0 (6) 87.0 (23) 66.7 (3) 80.0 (5) 80.0 (5) 66.7 (3)
Lucas Math 3-8 587 32.0 26.5 (279) 37.0 (308) 21.0 (143) 29.7 (138) 25.4 (59) 22.5 (80) 38.3 (60) 62.2 (74) 35.3 (17) 56.3 (16)
Reading 3-8 586 36.7 28.3 (279) 44.3 (307) 25.2 (143) 34.8 (138) 18.6 (59) 34.2 (79) 43.3 (60) 67.6 (74) 35.3 (17) 68.8 (16)
5 and 8 Science 234 63.2 64.5 (110) 62.1 (124) 55.2 (58) 59.3 (59) 71.4 (21) 50.0 (28) 75.0 (24) 74.2 (31) 85.7 (7) 83.3 (6)
Math I 23 100.0 100.0 (6) 100.0 (17) 100.0 (2) 100.0 (3) 100.0 (1) 100.0 (1) 100.0 (3) 100.0 (11) 100.0 (2)
Neal Math 3-8 755 9.8 9.1 (397) 10.6 (358) 6.4 (219) 6.0 (201) 12.0 (142) 16.8 (119) 22.7 (22) 16.7 (18) 0.0 (14) 15.0 (20)
Reading 3-8 762 27.6 24.3 (403) 31.2 (359) 23.0 (222) 26.6 (203) 22.8 (145) 39.8 (118) 45.5 (22) 38.9 (18) 28.6 (14) 20.0 (20)
5 and 8 Science 282 37.6 42.0 (157) 32.0 (125) 36.8 (87) 28.8 (80) 46.6 (58) 36.1 (36) 62.5 (8) 50.0 (4) 50.0 (4) 40.0 (5)
Math I 7 100.0 100.0 (2) 100.0 (5) 100.0 (2) 100.0 (2) 100.0 (3)
Rogers-Herr Math 3-8 623 59.6 59.0 (315) 60.1 (308) 50.7 (152) 55.3 (170) 36.8 (68) 44.4 (63) 91.4 (70) 94.0 (50) 80.0 (25) 64.0 (25)
Reading 3-8 623 59.9 55.2 (315) 64.6 (308) 47.4 (152) 61.2 (170) 25.0 (68) 50.8 (63) 94.3 (70) 86.0 (50) 76.0 (25) 80.0 (25)
5 and 8 Science 212 83.5 84.5 (103) 82.6 (109) 78.2 (55) 82.0 (61) 85.0 (20) 75.0 (24) 100.0 (19) 100.0 (18) 88.9 (9) 66.7 (6)
Math I 63 100.0 100.0 (31) 100.0 (32) 100.0 (8) 100.0 (10) 100.0 (2) 100.0 (5) 100.0 (19) 100.0 (13) 100.0 (2) 100.0 (4)
Shepard Math 3-8 500 18.2 18.5 (249) 17.9 (251) 16.8 (185) 18.0 (178) 19.3 (57) 18.5 (65) 100.0 (1) 100.0 (1) 50.0 (6) 0.0 (7)
Reading 3-8 498 33.5 28.6 (248) 38.4 (250) 26.6 (184) 38.4 (177) 29.8 (57) 40.0 (65) 100.0 (1) 100.0 (1) 66.7 (6) 14.3 (7)
5 and 8 Science 164 51.2 47.2 (89) 56.0 (75) 45.6 (68) 59.6 (57) 50.0 (20) 43.8 (16) 100.0 (1) 50.0 (2)
RG01 - Academic Achievement by Ethnicity and Gender 11/18/2016 1:12:53 PM Page 5
Academic Achievement by Ethnicity and Gender 2016Student Proficiency given Number Tested within Ethnic-Gender Group
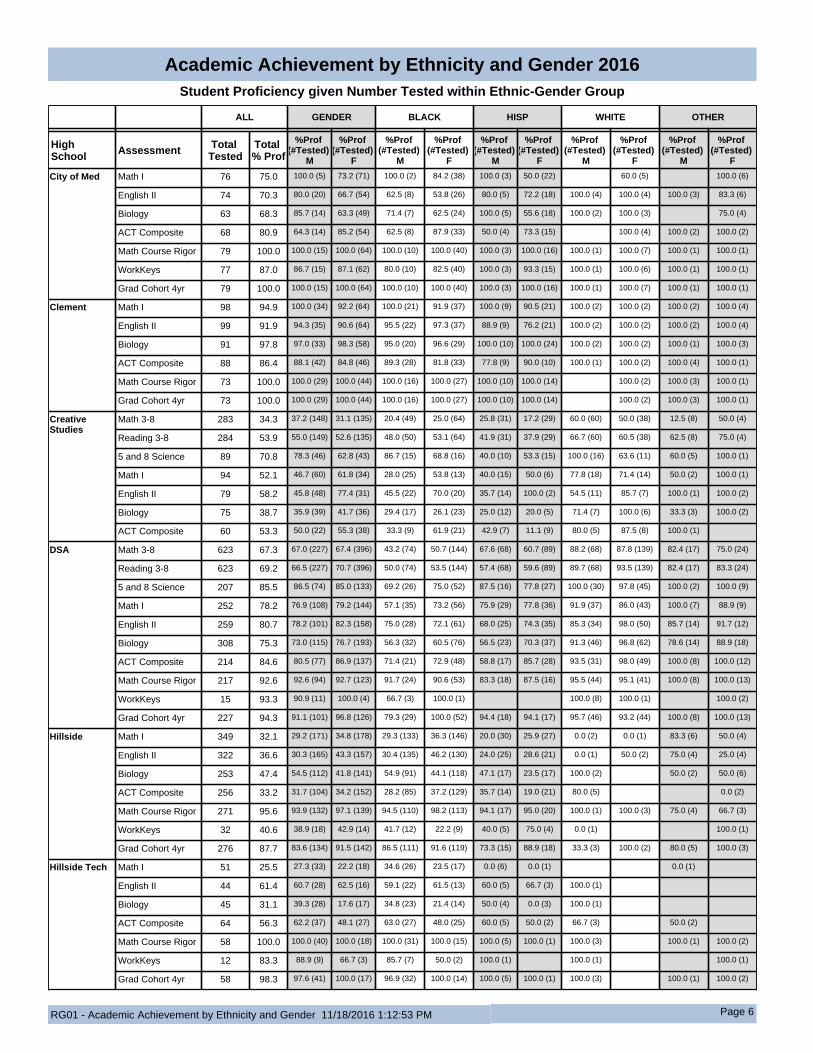
ALL GENDER BLACK HISP WHITE OTHER
High School Assessment Total
TestedTotal % Prof
%Prof (#Tested)
M
%Prof (#Tested)
F
%Prof (#Tested)
M
%Prof (#Tested)
F
%Prof (#Tested)
M
%Prof (#Tested)
F
%Prof (#Tested)
M
%Prof (#Tested)
F
%Prof (#Tested)
M
%Prof (#Tested)
F
City of Med Math I 76 75.0 100.0 (5) 73.2 (71) 100.0 (2) 84.2 (38) 100.0 (3) 50.0 (22) 60.0 (5) 100.0 (6)
English II 74 70.3 80.0 (20) 66.7 (54) 62.5 (8) 53.8 (26) 80.0 (5) 72.2 (18) 100.0 (4) 100.0 (4) 100.0 (3) 83.3 (6)
Biology 63 68.3 85.7 (14) 63.3 (49) 71.4 (7) 62.5 (24) 100.0 (5) 55.6 (18) 100.0 (2) 100.0 (3) 75.0 (4)
ACT Composite 68 80.9 64.3 (14) 85.2 (54) 62.5 (8) 87.9 (33) 50.0 (4) 73.3 (15) 100.0 (4) 100.0 (2) 100.0 (2)
Math Course Rigor 79 100.0 100.0 (15) 100.0 (64) 100.0 (10) 100.0 (40) 100.0 (3) 100.0 (16) 100.0 (1) 100.0 (7) 100.0 (1) 100.0 (1)
WorkKeys 77 87.0 86.7 (15) 87.1 (62) 80.0 (10) 82.5 (40) 100.0 (3) 93.3 (15) 100.0 (1) 100.0 (6) 100.0 (1) 100.0 (1)
Grad Cohort 4yr 79 100.0 100.0 (15) 100.0 (64) 100.0 (10) 100.0 (40) 100.0 (3) 100.0 (16) 100.0 (1) 100.0 (7) 100.0 (1) 100.0 (1)
Clement Math I 98 94.9 100.0 (34) 92.2 (64) 100.0 (21) 91.9 (37) 100.0 (9) 90.5 (21) 100.0 (2) 100.0 (2) 100.0 (2) 100.0 (4)
English II 99 91.9 94.3 (35) 90.6 (64) 95.5 (22) 97.3 (37) 88.9 (9) 76.2 (21) 100.0 (2) 100.0 (2) 100.0 (2) 100.0 (4)
Biology 91 97.8 97.0 (33) 98.3 (58) 95.0 (20) 96.6 (29) 100.0 (10) 100.0 (24) 100.0 (2) 100.0 (2) 100.0 (1) 100.0 (3)
ACT Composite 88 86.4 88.1 (42) 84.8 (46) 89.3 (28) 81.8 (33) 77.8 (9) 90.0 (10) 100.0 (1) 100.0 (2) 100.0 (4) 100.0 (1)
Math Course Rigor 73 100.0 100.0 (29) 100.0 (44) 100.0 (16) 100.0 (27) 100.0 (10) 100.0 (14) 100.0 (2) 100.0 (3) 100.0 (1)
Grad Cohort 4yr 73 100.0 100.0 (29) 100.0 (44) 100.0 (16) 100.0 (27) 100.0 (10) 100.0 (14) 100.0 (2) 100.0 (3) 100.0 (1)
Creative Studies
Math 3-8 283 34.3 37.2 (148) 31.1 (135) 20.4 (49) 25.0 (64) 25.8 (31) 17.2 (29) 60.0 (60) 50.0 (38) 12.5 (8) 50.0 (4)
Reading 3-8 284 53.9 55.0 (149) 52.6 (135) 48.0 (50) 53.1 (64) 41.9 (31) 37.9 (29) 66.7 (60) 60.5 (38) 62.5 (8) 75.0 (4)
5 and 8 Science 89 70.8 78.3 (46) 62.8 (43) 86.7 (15) 68.8 (16) 40.0 (10) 53.3 (15) 100.0 (16) 63.6 (11) 60.0 (5) 100.0 (1)
Math I 94 52.1 46.7 (60) 61.8 (34) 28.0 (25) 53.8 (13) 40.0 (15) 50.0 (6) 77.8 (18) 71.4 (14) 50.0 (2) 100.0 (1)
English II 79 58.2 45.8 (48) 77.4 (31) 45.5 (22) 70.0 (20) 35.7 (14) 100.0 (2) 54.5 (11) 85.7 (7) 100.0 (1) 100.0 (2)
Biology 75 38.7 35.9 (39) 41.7 (36) 29.4 (17) 26.1 (23) 25.0 (12) 20.0 (5) 71.4 (7) 100.0 (6) 33.3 (3) 100.0 (2)
ACT Composite 60 53.3 50.0 (22) 55.3 (38) 33.3 (9) 61.9 (21) 42.9 (7) 11.1 (9) 80.0 (5) 87.5 (8) 100.0 (1)
DSA Math 3-8 623 67.3 67.0 (227) 67.4 (396) 43.2 (74) 50.7 (144) 67.6 (68) 60.7 (89) 88.2 (68) 87.8 (139) 82.4 (17) 75.0 (24)
Reading 3-8 623 69.2 66.5 (227) 70.7 (396) 50.0 (74) 53.5 (144) 57.4 (68) 59.6 (89) 89.7 (68) 93.5 (139) 82.4 (17) 83.3 (24)
5 and 8 Science 207 85.5 86.5 (74) 85.0 (133) 69.2 (26) 75.0 (52) 87.5 (16) 77.8 (27) 100.0 (30) 97.8 (45) 100.0 (2) 100.0 (9)
Math I 252 78.2 76.9 (108) 79.2 (144) 57.1 (35) 73.2 (56) 75.9 (29) 77.8 (36) 91.9 (37) 86.0 (43) 100.0 (7) 88.9 (9)
English II 259 80.7 78.2 (101) 82.3 (158) 75.0 (28) 72.1 (61) 68.0 (25) 74.3 (35) 85.3 (34) 98.0 (50) 85.7 (14) 91.7 (12)
Biology 308 75.3 73.0 (115) 76.7 (193) 56.3 (32) 60.5 (76) 56.5 (23) 70.3 (37) 91.3 (46) 96.8 (62) 78.6 (14) 88.9 (18)
ACT Composite 214 84.6 80.5 (77) 86.9 (137) 71.4 (21) 72.9 (48) 58.8 (17) 85.7 (28) 93.5 (31) 98.0 (49) 100.0 (8) 100.0 (12)
Math Course Rigor 217 92.6 92.6 (94) 92.7 (123) 91.7 (24) 90.6 (53) 83.3 (18) 87.5 (16) 95.5 (44) 95.1 (41) 100.0 (8) 100.0 (13)
WorkKeys 15 93.3 90.9 (11) 100.0 (4) 66.7 (3) 100.0 (1) 100.0 (8) 100.0 (1) 100.0 (2)
Grad Cohort 4yr 227 94.3 91.1 (101) 96.8 (126) 79.3 (29) 100.0 (52) 94.4 (18) 94.1 (17) 95.7 (46) 93.2 (44) 100.0 (8) 100.0 (13)
Hillside Math I 349 32.1 29.2 (171) 34.8 (178) 29.3 (133) 36.3 (146) 20.0 (30) 25.9 (27) 0.0 (2) 0.0 (1) 83.3 (6) 50.0 (4)
English II 322 36.6 30.3 (165) 43.3 (157) 30.4 (135) 46.2 (130) 24.0 (25) 28.6 (21) 0.0 (1) 50.0 (2) 75.0 (4) 25.0 (4)
Biology 253 47.4 54.5 (112) 41.8 (141) 54.9 (91) 44.1 (118) 47.1 (17) 23.5 (17) 100.0 (2) 50.0 (2) 50.0 (6)
ACT Composite 256 33.2 31.7 (104) 34.2 (152) 28.2 (85) 37.2 (129) 35.7 (14) 19.0 (21) 80.0 (5) 0.0 (2)
Math Course Rigor 271 95.6 93.9 (132) 97.1 (139) 94.5 (110) 98.2 (113) 94.1 (17) 95.0 (20) 100.0 (1) 100.0 (3) 75.0 (4) 66.7 (3)
WorkKeys 32 40.6 38.9 (18) 42.9 (14) 41.7 (12) 22.2 (9) 40.0 (5) 75.0 (4) 0.0 (1) 100.0 (1)
Grad Cohort 4yr 276 87.7 83.6 (134) 91.5 (142) 86.5 (111) 91.6 (119) 73.3 (15) 88.9 (18) 33.3 (3) 100.0 (2) 80.0 (5) 100.0 (3)
Hillside Tech Math I 51 25.5 27.3 (33) 22.2 (18) 34.6 (26) 23.5 (17) 0.0 (6) 0.0 (1) 0.0 (1)
English II 44 61.4 60.7 (28) 62.5 (16) 59.1 (22) 61.5 (13) 60.0 (5) 66.7 (3) 100.0 (1)
Biology 45 31.1 39.3 (28) 17.6 (17) 34.8 (23) 21.4 (14) 50.0 (4) 0.0 (3) 100.0 (1)
ACT Composite 64 56.3 62.2 (37) 48.1 (27) 63.0 (27) 48.0 (25) 60.0 (5) 50.0 (2) 66.7 (3) 50.0 (2)
Math Course Rigor 58 100.0 100.0 (40) 100.0 (18) 100.0 (31) 100.0 (15) 100.0 (5) 100.0 (1) 100.0 (3) 100.0 (1) 100.0 (2)
WorkKeys 12 83.3 88.9 (9) 66.7 (3) 85.7 (7) 50.0 (2) 100.0 (1) 100.0 (1) 100.0 (1)
Grad Cohort 4yr 58 98.3 97.6 (41) 100.0 (17) 96.9 (32) 100.0 (14) 100.0 (5) 100.0 (1) 100.0 (3) 100.0 (1) 100.0 (2)
RG01 - Academic Achievement by Ethnicity and Gender 11/18/2016 1:12:53 PM Page 6
Academic Achievement by Ethnicity and Gender 2016Student Proficiency given Number Tested within Ethnic-Gender Group
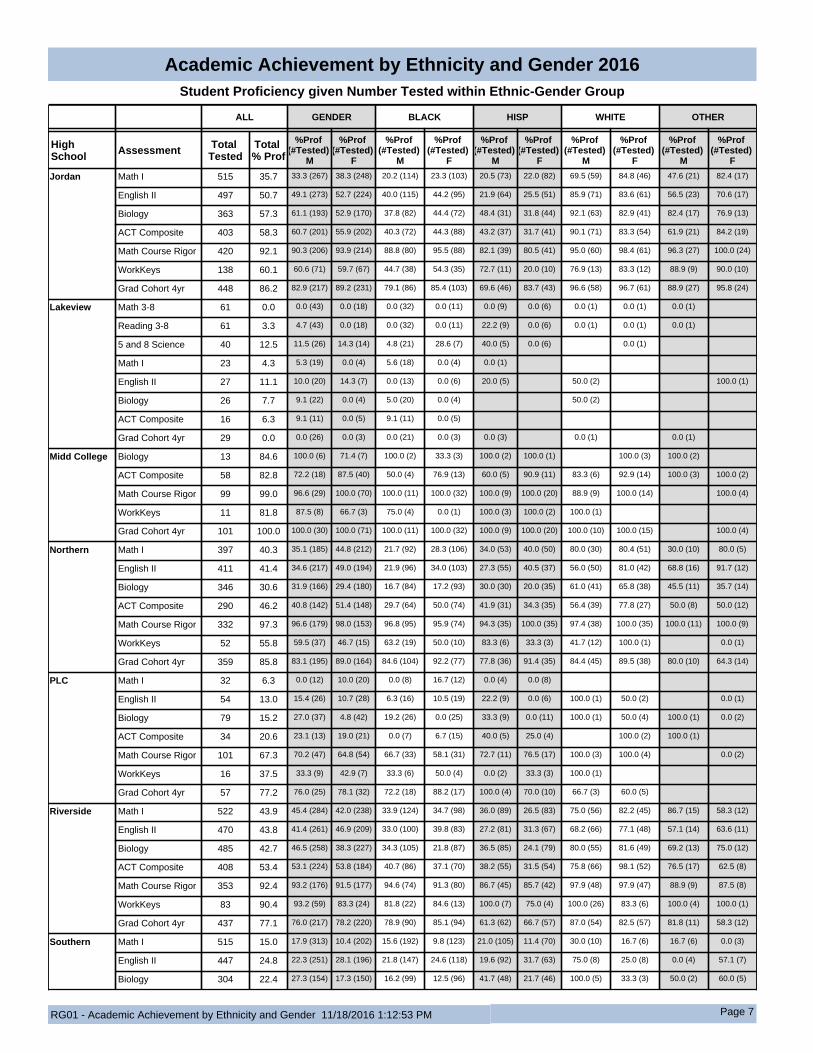
ALL GENDER BLACK HISP WHITE OTHER
High School Assessment Total
TestedTotal % Prof
%Prof (#Tested)
M
%Prof (#Tested)
F
%Prof (#Tested)
M
%Prof (#Tested)
F
%Prof (#Tested)
M
%Prof (#Tested)
F
%Prof (#Tested)
M
%Prof (#Tested)
F
%Prof (#Tested)
M
%Prof (#Tested)
F
Jordan Math I 515 35.7 33.3 (267) 38.3 (248) 20.2 (114) 23.3 (103) 20.5 (73) 22.0 (82) 69.5 (59) 84.8 (46) 47.6 (21) 82.4 (17)
English II 497 50.7 49.1 (273) 52.7 (224) 40.0 (115) 44.2 (95) 21.9 (64) 25.5 (51) 85.9 (71) 83.6 (61) 56.5 (23) 70.6 (17)
Biology 363 57.3 61.1 (193) 52.9 (170) 37.8 (82) 44.4 (72) 48.4 (31) 31.8 (44) 92.1 (63) 82.9 (41) 82.4 (17) 76.9 (13)
ACT Composite 403 58.3 60.7 (201) 55.9 (202) 40.3 (72) 44.3 (88) 43.2 (37) 31.7 (41) 90.1 (71) 83.3 (54) 61.9 (21) 84.2 (19)
Math Course Rigor 420 92.1 90.3 (206) 93.9 (214) 88.8 (80) 95.5 (88) 82.1 (39) 80.5 (41) 95.0 (60) 98.4 (61) 96.3 (27) 100.0 (24)
WorkKeys 138 60.1 60.6 (71) 59.7 (67) 44.7 (38) 54.3 (35) 72.7 (11) 20.0 (10) 76.9 (13) 83.3 (12) 88.9 (9) 90.0 (10)
Grad Cohort 4yr 448 86.2 82.9 (217) 89.2 (231) 79.1 (86) 85.4 (103) 69.6 (46) 83.7 (43) 96.6 (58) 96.7 (61) 88.9 (27) 95.8 (24)
Lakeview Math 3-8 61 0.0 0.0 (43) 0.0 (18) 0.0 (32) 0.0 (11) 0.0 (9) 0.0 (6) 0.0 (1) 0.0 (1) 0.0 (1)
Reading 3-8 61 3.3 4.7 (43) 0.0 (18) 0.0 (32) 0.0 (11) 22.2 (9) 0.0 (6) 0.0 (1) 0.0 (1) 0.0 (1)
5 and 8 Science 40 12.5 11.5 (26) 14.3 (14) 4.8 (21) 28.6 (7) 40.0 (5) 0.0 (6) 0.0 (1)
Math I 23 4.3 5.3 (19) 0.0 (4) 5.6 (18) 0.0 (4) 0.0 (1)
English II 27 11.1 10.0 (20) 14.3 (7) 0.0 (13) 0.0 (6) 20.0 (5) 50.0 (2) 100.0 (1)
Biology 26 7.7 9.1 (22) 0.0 (4) 5.0 (20) 0.0 (4) 50.0 (2)
ACT Composite 16 6.3 9.1 (11) 0.0 (5) 9.1 (11) 0.0 (5)
Grad Cohort 4yr 29 0.0 0.0 (26) 0.0 (3) 0.0 (21) 0.0 (3) 0.0 (3) 0.0 (1) 0.0 (1)
Midd College Biology 13 84.6 100.0 (6) 71.4 (7) 100.0 (2) 33.3 (3) 100.0 (2) 100.0 (1) 100.0 (3) 100.0 (2)
ACT Composite 58 82.8 72.2 (18) 87.5 (40) 50.0 (4) 76.9 (13) 60.0 (5) 90.9 (11) 83.3 (6) 92.9 (14) 100.0 (3) 100.0 (2)
Math Course Rigor 99 99.0 96.6 (29) 100.0 (70) 100.0 (11) 100.0 (32) 100.0 (9) 100.0 (20) 88.9 (9) 100.0 (14) 100.0 (4)
WorkKeys 11 81.8 87.5 (8) 66.7 (3) 75.0 (4) 0.0 (1) 100.0 (3) 100.0 (2) 100.0 (1)
Grad Cohort 4yr 101 100.0 100.0 (30) 100.0 (71) 100.0 (11) 100.0 (32) 100.0 (9) 100.0 (20) 100.0 (10) 100.0 (15) 100.0 (4)
Northern Math I 397 40.3 35.1 (185) 44.8 (212) 21.7 (92) 28.3 (106) 34.0 (53) 40.0 (50) 80.0 (30) 80.4 (51) 30.0 (10) 80.0 (5)
English II 411 41.4 34.6 (217) 49.0 (194) 21.9 (96) 34.0 (103) 27.3 (55) 40.5 (37) 56.0 (50) 81.0 (42) 68.8 (16) 91.7 (12)
Biology 346 30.6 31.9 (166) 29.4 (180) 16.7 (84) 17.2 (93) 30.0 (30) 20.0 (35) 61.0 (41) 65.8 (38) 45.5 (11) 35.7 (14)
ACT Composite 290 46.2 40.8 (142) 51.4 (148) 29.7 (64) 50.0 (74) 41.9 (31) 34.3 (35) 56.4 (39) 77.8 (27) 50.0 (8) 50.0 (12)
Math Course Rigor 332 97.3 96.6 (179) 98.0 (153) 96.8 (95) 95.9 (74) 94.3 (35) 100.0 (35) 97.4 (38) 100.0 (35) 100.0 (11) 100.0 (9)
WorkKeys 52 55.8 59.5 (37) 46.7 (15) 63.2 (19) 50.0 (10) 83.3 (6) 33.3 (3) 41.7 (12) 100.0 (1) 0.0 (1)
Grad Cohort 4yr 359 85.8 83.1 (195) 89.0 (164) 84.6 (104) 92.2 (77) 77.8 (36) 91.4 (35) 84.4 (45) 89.5 (38) 80.0 (10) 64.3 (14)
PLC Math I 32 6.3 0.0 (12) 10.0 (20) 0.0 (8) 16.7 (12) 0.0 (4) 0.0 (8)
English II 54 13.0 15.4 (26) 10.7 (28) 6.3 (16) 10.5 (19) 22.2 (9) 0.0 (6) 100.0 (1) 50.0 (2) 0.0 (1)
Biology 79 15.2 27.0 (37) 4.8 (42) 19.2 (26) 0.0 (25) 33.3 (9) 0.0 (11) 100.0 (1) 50.0 (4) 100.0 (1) 0.0 (2)
ACT Composite 34 20.6 23.1 (13) 19.0 (21) 0.0 (7) 6.7 (15) 40.0 (5) 25.0 (4) 100.0 (2) 100.0 (1)
Math Course Rigor 101 67.3 70.2 (47) 64.8 (54) 66.7 (33) 58.1 (31) 72.7 (11) 76.5 (17) 100.0 (3) 100.0 (4) 0.0 (2)
WorkKeys 16 37.5 33.3 (9) 42.9 (7) 33.3 (6) 50.0 (4) 0.0 (2) 33.3 (3) 100.0 (1)
Grad Cohort 4yr 57 77.2 76.0 (25) 78.1 (32) 72.2 (18) 88.2 (17) 100.0 (4) 70.0 (10) 66.7 (3) 60.0 (5)
Riverside Math I 522 43.9 45.4 (284) 42.0 (238) 33.9 (124) 34.7 (98) 36.0 (89) 26.5 (83) 75.0 (56) 82.2 (45) 86.7 (15) 58.3 (12)
English II 470 43.8 41.4 (261) 46.9 (209) 33.0 (100) 39.8 (83) 27.2 (81) 31.3 (67) 68.2 (66) 77.1 (48) 57.1 (14) 63.6 (11)
Biology 485 42.7 46.5 (258) 38.3 (227) 34.3 (105) 21.8 (87) 36.5 (85) 24.1 (79) 80.0 (55) 81.6 (49) 69.2 (13) 75.0 (12)
ACT Composite 408 53.4 53.1 (224) 53.8 (184) 40.7 (86) 37.1 (70) 38.2 (55) 31.5 (54) 75.8 (66) 98.1 (52) 76.5 (17) 62.5 (8)
Math Course Rigor 353 92.4 93.2 (176) 91.5 (177) 94.6 (74) 91.3 (80) 86.7 (45) 85.7 (42) 97.9 (48) 97.9 (47) 88.9 (9) 87.5 (8)
WorkKeys 83 90.4 93.2 (59) 83.3 (24) 81.8 (22) 84.6 (13) 100.0 (7) 75.0 (4) 100.0 (26) 83.3 (6) 100.0 (4) 100.0 (1)
Grad Cohort 4yr 437 77.1 76.0 (217) 78.2 (220) 78.9 (90) 85.1 (94) 61.3 (62) 66.7 (57) 87.0 (54) 82.5 (57) 81.8 (11) 58.3 (12)
Southern Math I 515 15.0 17.9 (313) 10.4 (202) 15.6 (192) 9.8 (123) 21.0 (105) 11.4 (70) 30.0 (10) 16.7 (6) 16.7 (6) 0.0 (3)
English II 447 24.8 22.3 (251) 28.1 (196) 21.8 (147) 24.6 (118) 19.6 (92) 31.7 (63) 75.0 (8) 25.0 (8) 0.0 (4) 57.1 (7)
Biology 304 22.4 27.3 (154) 17.3 (150) 16.2 (99) 12.5 (96) 41.7 (48) 21.7 (46) 100.0 (5) 33.3 (3) 50.0 (2) 60.0 (5)
RG01 - Academic Achievement by Ethnicity and Gender 11/18/2016 1:12:53 PM Page 7
Academic Achievement by Ethnicity and Gender 2016Student Proficiency given Number Tested within Ethnic-Gender Group
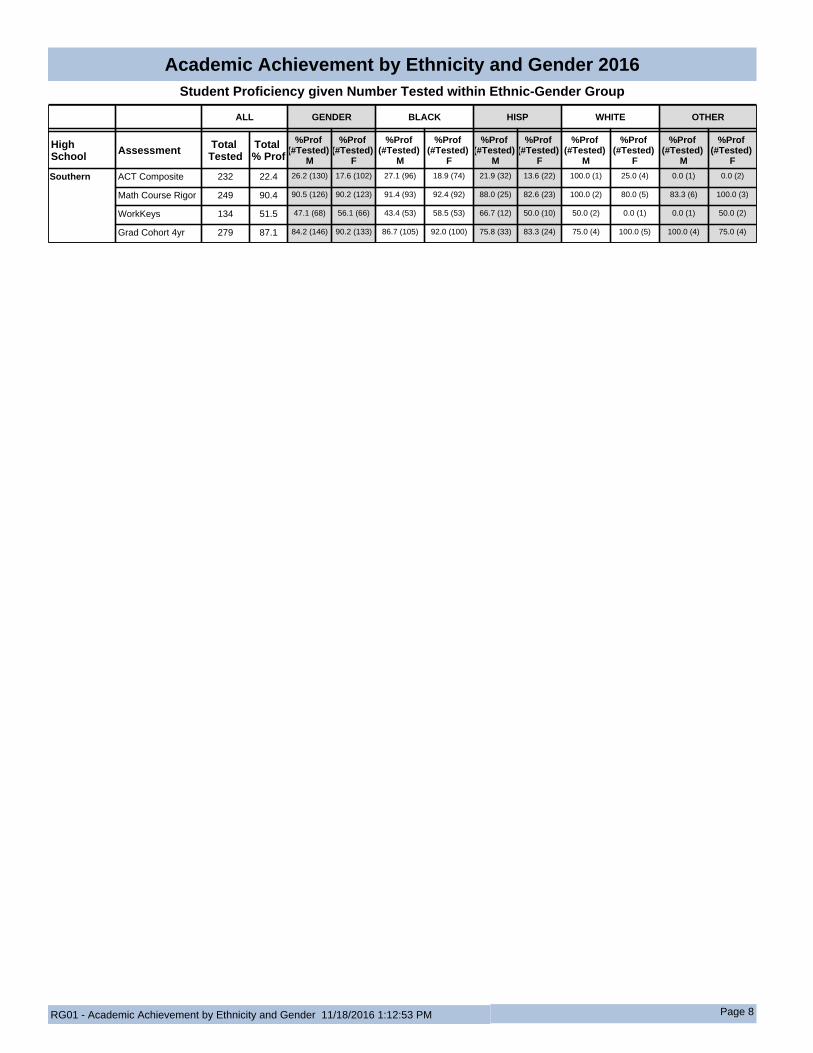
ALL GENDER BLACK HISP WHITE OTHER
High School Assessment Total
TestedTotal % Prof
%Prof (#Tested)
M
%Prof (#Tested)
F
%Prof (#Tested)
M
%Prof (#Tested)
F
%Prof (#Tested)
M
%Prof (#Tested)
F
%Prof (#Tested)
M
%Prof (#Tested)
F
%Prof (#Tested)
M
%Prof (#Tested)
F
Southern ACT Composite 232 22.4 26.2 (130) 17.6 (102) 27.1 (96) 18.9 (74) 21.9 (32) 13.6 (22) 100.0 (1) 25.0 (4) 0.0 (1) 0.0 (2)
Math Course Rigor 249 90.4 90.5 (126) 90.2 (123) 91.4 (93) 92.4 (92) 88.0 (25) 82.6 (23) 100.0 (2) 80.0 (5) 83.3 (6) 100.0 (3)
WorkKeys 134 51.5 47.1 (68) 56.1 (66) 43.4 (53) 58.5 (53) 66.7 (12) 50.0 (10) 50.0 (2) 0.0 (1) 0.0 (1) 50.0 (2)
Grad Cohort 4yr 279 87.1 84.2 (146) 90.2 (133) 86.7 (105) 92.0 (100) 75.8 (33) 83.3 (24) 75.0 (4) 100.0 (5) 100.0 (4) 75.0 (4)
RG01 - Academic Achievement by Ethnicity and Gender 11/18/2016 1:12:53 PM Page 8
Academic Achievement by Ethnicity and Gender 2016Student Proficiency given Number Tested within Ethnic-Gender Group

ALL GENDER BLACK HISP WHITE OTHER
District School Assessment Total
TestedTotal % Prof
%Prof (#Tested)
M
%Prof (#Tested)
F
%Prof (#Tested)
M
%Prof (#Tested)
F
%Prof (#Tested)
M
%Prof (#Tested)
F
%Prof (#Tested)
M
%Prof (#Tested)
F
%Prof (#Tested)
M
%Prof (#Tested)
F
DPS 3rd Grade Math 2572 46.3 45.5 (1308)
47.1 (1264)
33.6 (592) 33.4 (572) 42.2 (417) 43.6 (392) 74.7 (229) 81.6 (245) 70.0 (70) 60.0 (55)
4th Grade Math 2509 42.6 43.6 (1258)
41.7 (1251)
31.9 (539) 31.5 (591) 37.3 (402) 37.9 (380) 76.0 (246) 72.4 (210) 54.9 (71) 57.1 (70)
5th Grade Math 2183 44.6 43.9 (1115)
45.3 (1068)
29.3 (498) 34.1 (534) 40.3 (325) 40.8 (284) 74.5 (220) 78.4 (185) 66.7 (72) 63.1 (65)
6th Grade Math 2377 35.7 34.0 (1144)
37.3 (1233)
21.4 (561) 27.9 (595) 25.8 (291) 28.4 (335) 70.8 (216) 71.4 (220) 53.9 (76) 50.6 (83)
7th Grade Math 2431 30.1 26.7 (1206)
33.5 (1225)
16.5 (648) 25.4 (634) 21.7 (286) 22.9 (315) 62.3 (215) 67.6 (207) 33.3 (57) 53.6 (69)
8th Grade Math 2425 36.0 32.9 (1234)
39.3 (1191)
22.4 (661) 30.6 (633) 26.3 (300) 29.2 (315) 67.8 (205) 75.3 (190) 58.8 (68) 73.6 (53)
Grades 3-5 Math 7264 44.5 44.3 (3681)
44.7 (3583)
31.7 (1629) 32.9 (1697) 39.9 (1144)
40.8 (1056)
75.1 (695) 77.7 (640) 63.8 (213) 60.0 (190)
Grades 6-8 Math 7233 33.9 31.2 (3584)
36.7 (3649)
20.1 (1870) 28.0 (1862) 24.6 (877) 26.8 (965) 67.0 (636) 71.3 (617) 49.8 (201) 57.6 (205)
Math 3-8 14497 39.2 37.8 (7265)
40.6 (7232)
25.5 (3499) 30.3 (3559) 33.3 (2021)
34.1 (2021)
71.2 (1331) 74.5 (1257) 57.0 (414) 58.7 (395)
MClass KI MOY 2832 44.9 43.5 (1482)
46.4 (1350)
41.4 (626) 47.6 (628) 26.3 (475) 29.2 (421) 66.3 (306) 72.2 (241) 77.3 (75) 50.0 (60)
3rd Grade Reading 2571 45.4 41.3 (1307)
49.5 (1264)
33.7 (591) 39.0 (572) 28.3 (417) 41.3 (392) 79.0 (229) 83.7 (245) 60.0 (70) 65.5 (55)
4th Grade Reading 2512 44.0 41.1 (1260)
47.0 (1252)
32.0 (541) 39.2 (592) 29.6 (402) 36.1 (380) 75.2 (246) 81.4 (210) 57.7 (71) 68.6 (70)
5th Grade Reading 2183 41.0 38.9 (1115)
43.2 (1068)
27.5 (498) 35.0 (534) 24.9 (325) 29.2 (284) 80.0 (220) 80.5 (185) 55.6 (72) 64.6 (65)
6th Grade Reading 2375 43.7 39.0 (1143)
48.1 (1232)
29.6 (560) 41.2 (594) 24.7 (291) 37.9 (335) 75.5 (216) 79.1 (220) 59.2 (76) 55.4 (83)
7th Grade Reading 2433 41.6 37.5 (1208)
45.7 (1225)
27.1 (650) 38.8 (636) 33.8 (287) 34.0 (315) 72.9 (214) 77.7 (206) 42.1 (57) 67.6 (68)
8th Grade Reading 2431 42.5 34.8 (1240)
50.4 (1191)
25.0 (664) 41.9 (633) 32.2 (301) 41.0 (315) 65.2 (207) 84.2 (190) 50.0 (68) 86.8 (53)
Grades 3-5 Reading
7266 43.6 40.5 (3682)
46.7 (3584)
31.2 (1630) 37.8 (1698) 27.8 (1144)
36.2 (1056)
78.0 (695) 82.0 (640) 57.7 (213) 66.3 (190)
Grades 6-8 Reading
7239 42.6 37.1 (3591)
48.0 (3648)
27.1 (1874) 40.6 (1863) 30.3 (879) 37.6 (965) 71.3 (637) 80.2 (616) 51.2 (201) 67.6 (204)
Reading 3-8 14505 43.1 38.8 (7273)
47.4 (7232)
29.0 (3504) 39.3 (3561) 28.9 (2023)
36.9 (2021)
74.8 (1332) 81.1 (1256) 54.6 (414) 67.0 (394)
5 and 8 Science 4614 57.0 57.1 (2354)
56.9 (2260)
46.3 (1159) 49.0 (1167) 54.5 (629) 50.0 (600) 83.8 (427) 85.9 (375) 75.5 (139) 78.0 (118)
Math I 2777 44.9 41.1 (1422)
48.9 (1355)
30.8 (699) 37.6 (697) 30.3 (357) 43.6 (307) 73.7 (278) 75.8 (264) 64.8 (88) 75.9 (87)
English II 2641 51.6 46.1 (1312)
57.0 (1329)
34.7 (695) 49.9 (724) 37.1 (291) 45.4 (302) 81.4 (258) 90.0 (229) 67.6 (68) 71.6 (74)
Biology 2493 43.6 43.9 (1240)
43.3 (1253)
33.5 (656) 35.2 (684) 35.6 (270) 33.2 (271) 75.3 (231) 74.7 (229) 65.1 (83) 59.4 (69)
ACT Composite 2043 48.7 43.7 (969) 53.2 (1074)
31.6 (513) 43.3 (594) 28.5 (186) 40.7 (214) 83.1 (207) 84.4 (205) 57.1 (63) 88.5 (61)
Math Course Rigor 2108 94.3 93.3 (1019)
95.2 (1089)
91.9 (583) 95.1 (611) 89.2 (157) 93.1 (203) 98.7 (223) 98.1 (216) 98.2 (56) 93.2 (59)
WorkKeys 510 63.5 67.2 (268) 59.5 (242) 57.3 (157) 50.6 (156) 70.5 (44) 64.3 (42) 87.5 (56) 88.2 (34) 90.9 (11) 80.0 (10)
Grad Cohort 4yr 2461 80.7 75.4 (1234)
85.9 (1227)
73.6 (717) 85.6 (703) 65.2 (207) 78.6 (229) 87.6 (242) 93.0 (230) 82.4 (68) 89.2 (65)
RG01 - Academic Achievement by Ethnicity and Gender 11/18/2016 1:19:07 PM Page 1
Academic Achievement by Ethnicity and Gender 2015Student Proficiency given Number Tested within Ethnic-Gender Group

ALL GENDER BLACK HISP WHITE OTHER
Elementary School Assessment Total
TestedTotal % Prof
%Prof (#Tested)
M
%Prof (#Tested)
F
%Prof (#Tested)
M
%Prof (#Tested)
F
%Prof (#Tested)
M
%Prof (#Tested)
F
%Prof (#Tested)
M
%Prof (#Tested)
F
%Prof (#Tested)
M
%Prof (#Tested)
F
Bethesda Math 3-8 304 34.2 29.3 (150) 39.0 (154) 20.9 (86) 34.1 (85) 38.5 (52) 38.6 (57) 33.3 (6) 60.0 (5) 66.7 (6) 85.7 (7)
MClass KI MOY 134 34.3 32.0 (75) 37.3 (59) 38.5 (39) 37.8 (37) 15.4 (26) 38.5 (13) 28.6 (7) 33.3 (6) 100.0 (3) 33.3 (3)
Reading 3-8 304 34.9 28.0 (150) 41.6 (154) 26.7 (86) 38.8 (85) 25.0 (52) 40.4 (57) 50.0 (6) 60.0 (5) 50.0 (6) 71.4 (7)
5 and 8 Science 76 72.4 80.0 (30) 67.4 (46) 81.0 (21) 68.0 (25) 71.4 (7) 64.3 (14) 100.0 (1) 33.3 (3) 100.0 (1) 100.0 (4)
Burton Math 3-8 160 40.6 34.8 (89) 47.9 (71) 20.5 (39) 40.0 (30) 42.9 (42) 52.5 (40) 66.7 (3) 100.0 (1) 60.0 (5)
MClass KI MOY 69 20.3 18.4 (38) 22.6 (31) 21.1 (19) 26.7 (15) 11.1 (18) 18.8 (16) 100.0 (1)
Reading 3-8 160 34.4 30.3 (89) 39.4 (71) 28.2 (39) 40.0 (30) 28.6 (42) 37.5 (40) 66.7 (3) 100.0 (1) 40.0 (5)
5 and 8 Science 50 68.0 65.2 (23) 70.4 (27) 60.0 (10) 75.0 (12) 72.7 (11) 66.7 (15) 50.0 (2)
Club Blvd Math 3-8 232 42.2 47.0 (117) 37.4 (115) 25.0 (40) 16.3 (43) 33.3 (33) 42.2 (45) 78.9 (38) 62.5 (24) 66.7 (6) 66.7 (3)
MClass KI MOY 89 34.8 30.2 (53) 41.7 (36) 14.3 (7) 37.5 (8) 0.0 (21) 23.8 (21) 59.1 (22) 100.0 (6) 66.7 (3) 100.0 (1)
Reading 3-8 232 49.1 49.6 (117) 48.7 (115) 35.0 (40) 27.9 (43) 27.3 (33) 44.4 (45) 81.6 (38) 87.5 (24) 66.7 (6) 100.0 (3)
5 and 8 Science 69 46.4 50.0 (40) 41.4 (29) 30.8 (13) 25.0 (12) 30.8 (13) 46.2 (13) 83.3 (12) 66.7 (3) 100.0 (2) 100.0 (1)
Creekside Math 3-8 394 65.5 65.6 (189) 65.4 (205) 56.0 (50) 53.6 (56) 44.7 (47) 45.6 (57) 82.4 (68) 88.4 (69) 79.2 (24) 73.9 (23)
MClass KI MOY 159 58.5 56.8 (88) 60.6 (71) 57.9 (19) 88.2 (17) 16.0 (25) 26.9 (26) 74.3 (35) 73.9 (23) 100.0 (9) 80.0 (5)
Reading 3-8 394 59.4 55.6 (189) 62.9 (205) 44.0 (50) 53.6 (56) 23.4 (47) 40.4 (57) 80.9 (68) 88.4 (69) 70.8 (24) 65.2 (23)
5 and 8 Science 105 63.8 68.5 (54) 58.8 (51) 50.0 (16) 57.1 (14) 45.5 (11) 38.9 (18) 87.0 (23) 85.7 (14) 100.0 (4) 60.0 (5)
Easley Math 3-8 268 57.1 56.3 (144) 58.1 (124) 23.5 (34) 32.0 (25) 31.6 (19) 29.4 (17) 72.6 (84) 71.2 (73) 85.7 (7) 77.8 (9)
MClass KI MOY 87 50.6 47.9 (48) 53.8 (39) 30.0 (10) 40.0 (5) 0.0 (8) 14.3 (7) 63.0 (27) 72.0 (25) 100.0 (3) 0.0 (2)
Reading 3-8 268 66.8 61.8 (144) 72.6 (124) 38.2 (34) 56.0 (25) 26.3 (19) 35.3 (17) 77.4 (84) 84.9 (73) 85.7 (7) 88.9 (9)
5 and 8 Science 75 70.7 71.4 (49) 69.2 (26) 30.0 (10) 80.0 (5) 40.0 (5) 33.3 (3) 87.5 (32) 70.6 (17) 100.0 (2) 100.0 (1)
Eastway Math 3-8 225 18.2 20.9 (110) 15.7 (115) 13.0 (46) 6.6 (61) 26.7 (60) 24.0 (50) 100.0 (1) 0.0 (3) 50.0 (4)
MClass KI MOY 118 41.5 45.1 (71) 36.2 (47) 51.7 (29) 32.0 (25) 40.5 (42) 36.8 (19) 66.7 (3)
Reading 3-8 225 19.6 19.1 (110) 20.0 (115) 19.6 (46) 16.4 (61) 18.3 (60) 22.0 (50) 100.0 (1) 0.0 (3) 50.0 (4)
5 and 8 Science 64 40.6 47.2 (36) 32.1 (28) 42.9 (14) 14.3 (14) 52.6 (19) 46.2 (13) 100.0 (1) 0.0 (2) 100.0 (1)
Eno Valley Math 3-8 261 26.8 25.4 (130) 28.2 (131) 21.4 (103) 24.5 (102) 36.8 (19) 50.0 (18) 50.0 (4) 40.0 (5) 50.0 (4) 16.7 (6)
MClass KI MOY 83 36.1 34.3 (35) 37.5 (48) 31.8 (22) 36.8 (38) 25.0 (8) 20.0 (5) 66.7 (3) 50.0 (2) 50.0 (2) 66.7 (3)
Reading 3-8 261 26.4 20.8 (130) 32.1 (131) 19.4 (103) 32.4 (102) 10.5 (19) 33.3 (18) 50.0 (4) 40.0 (5) 75.0 (4) 16.7 (6)
5 and 8 Science 80 36.3 34.3 (35) 37.8 (45) 23.1 (26) 34.2 (38) 50.0 (4) 50.0 (4) 100.0 (1) 100.0 (2) 75.0 (4) 0.0 (1)
Fayetteville St Math 3-8 107 34.6 33.9 (56) 35.3 (51) 35.7 (42) 31.0 (42) 33.3 (12) 50.0 (8) 0.0 (2) 100.0 (1)
MClass KI MOY 48 14.6 20.8 (24) 8.3 (24) 31.3 (16) 13.3 (15) 0.0 (7) 0.0 (9) 0.0 (1)
Reading 3-8 107 30.8 26.8 (56) 35.3 (51) 31.0 (42) 31.0 (42) 8.3 (12) 50.0 (8) 50.0 (2) 100.0 (1)
5 and 8 Science 31 35.5 42.9 (21) 20.0 (10) 33.3 (15) 12.5 (8) 60.0 (5) 50.0 (2) 100.0 (1)
Forest View Math 3-8 288 63.9 66.4 (146) 61.3 (142) 38.2 (34) 27.8 (36) 57.1 (49) 50.0 (48) 88.5 (52) 91.5 (47) 90.9 (11) 90.9 (11)
MClass KI MOY 144 31.3 34.1 (82) 27.4 (62) 12.5 (16) 46.2 (13) 17.1 (35) 3.7 (27) 68.0 (25) 47.1 (17) 50.0 (6) 40.0 (5)
Reading 3-8 288 62.5 62.3 (146) 62.7 (142) 52.9 (34) 47.2 (36) 38.8 (49) 43.8 (48) 86.5 (52) 89.4 (47) 81.8 (11) 81.8 (11)
5 and 8 Science 92 64.1 67.3 (49) 60.5 (43) 60.0 (10) 41.7 (12) 43.8 (16) 35.7 (14) 89.5 (19) 91.7 (12) 75.0 (4) 100.0 (5)
Glenn Math 3-8 297 29.3 27.9 (154) 30.8 (143) 26.7 (60) 21.1 (71) 26.3 (80) 41.0 (61) 71.4 (7) 50.0 (2) 14.3 (7) 33.3 (9)
MClass KI MOY 119 40.3 37.9 (58) 42.6 (61) 37.5 (32) 51.3 (39) 33.3 (21) 26.3 (19) 50.0 (4) 50.0 (2) 100.0 (1) 0.0 (1)
Reading 3-8 296 26.0 25.5 (153) 26.6 (143) 30.0 (60) 21.1 (71) 20.3 (79) 31.1 (61) 71.4 (7) 50.0 (2) 0.0 (7) 33.3 (9)
5 and 8 Science 87 41.4 45.7 (46) 36.6 (41) 36.8 (19) 31.8 (22) 50.0 (22) 37.5 (16) 50.0 (2) 66.7 (3) 66.7 (3)
Hillandale Math 3-8 304 49.3 49.0 (155) 49.7 (149) 35.2 (54) 29.8 (57) 40.5 (42) 47.1 (34) 68.0 (50) 74.0 (50) 66.7 (9) 50.0 (8)
MClass KI MOY 105 47.6 45.6 (57) 50.0 (48) 45.2 (31) 38.1 (21) 50.0 (8) 40.0 (15) 30.8 (13) 85.7 (7) 80.0 (5) 80.0 (5)
Reading 3-8 304 56.9 58.1 (155) 55.7 (149) 38.9 (54) 42.1 (57) 50.0 (42) 41.2 (34) 84.0 (50) 78.0 (50) 66.7 (9) 75.0 (8)
5 and 8 Science 97 57.7 53.5 (43) 61.1 (54) 47.4 (19) 50.0 (14) 53.8 (13) 25.0 (12) 62.5 (8) 86.4 (22) 66.7 (3) 66.7 (6)
RG01 - Academic Achievement by Ethnicity and Gender 11/18/2016 1:19:07 PM Page 2
Academic Achievement by Ethnicity and Gender 2015Student Proficiency given Number Tested within Ethnic-Gender Group
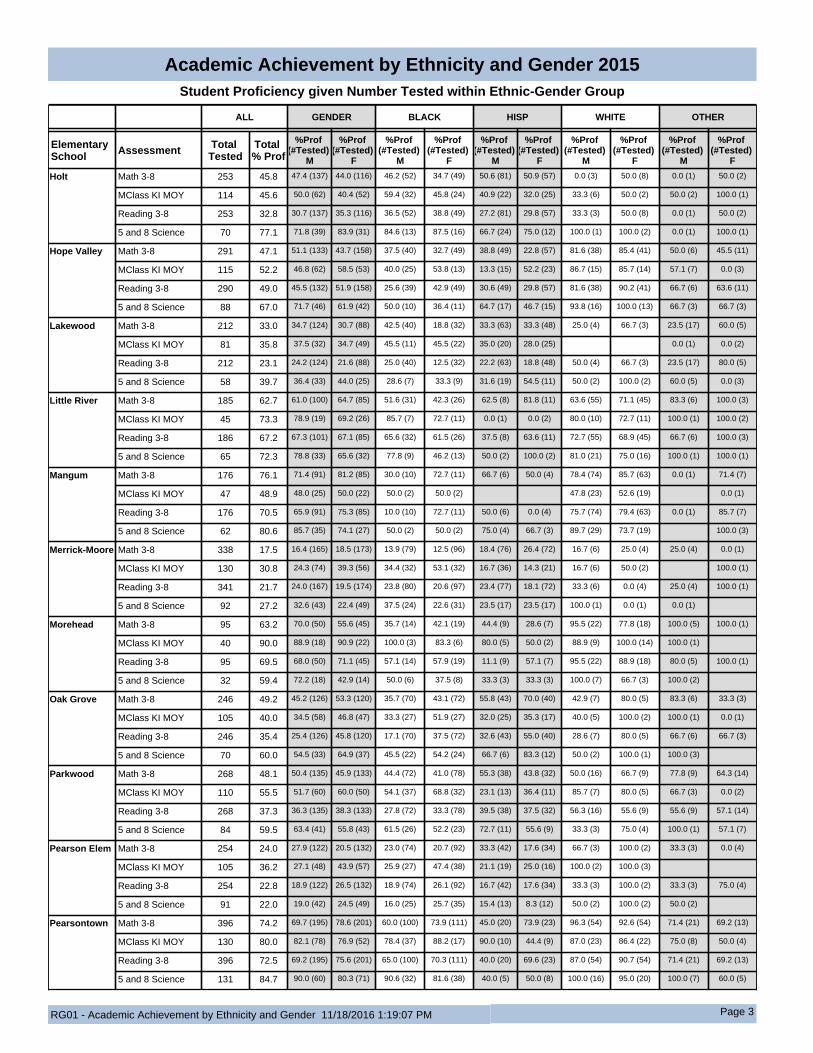
ALL GENDER BLACK HISP WHITE OTHER
Elementary School Assessment Total
TestedTotal % Prof
%Prof (#Tested)
M
%Prof (#Tested)
F
%Prof (#Tested)
M
%Prof (#Tested)
F
%Prof (#Tested)
M
%Prof (#Tested)
F
%Prof (#Tested)
M
%Prof (#Tested)
F
%Prof (#Tested)
M
%Prof (#Tested)
F
Holt Math 3-8 253 45.8 47.4 (137) 44.0 (116) 46.2 (52) 34.7 (49) 50.6 (81) 50.9 (57) 0.0 (3) 50.0 (8) 0.0 (1) 50.0 (2)
MClass KI MOY 114 45.6 50.0 (62) 40.4 (52) 59.4 (32) 45.8 (24) 40.9 (22) 32.0 (25) 33.3 (6) 50.0 (2) 50.0 (2) 100.0 (1)
Reading 3-8 253 32.8 30.7 (137) 35.3 (116) 36.5 (52) 38.8 (49) 27.2 (81) 29.8 (57) 33.3 (3) 50.0 (8) 0.0 (1) 50.0 (2)
5 and 8 Science 70 77.1 71.8 (39) 83.9 (31) 84.6 (13) 87.5 (16) 66.7 (24) 75.0 (12) 100.0 (1) 100.0 (2) 0.0 (1) 100.0 (1)
Hope Valley Math 3-8 291 47.1 51.1 (133) 43.7 (158) 37.5 (40) 32.7 (49) 38.8 (49) 22.8 (57) 81.6 (38) 85.4 (41) 50.0 (6) 45.5 (11)
MClass KI MOY 115 52.2 46.8 (62) 58.5 (53) 40.0 (25) 53.8 (13) 13.3 (15) 52.2 (23) 86.7 (15) 85.7 (14) 57.1 (7) 0.0 (3)
Reading 3-8 290 49.0 45.5 (132) 51.9 (158) 25.6 (39) 42.9 (49) 30.6 (49) 29.8 (57) 81.6 (38) 90.2 (41) 66.7 (6) 63.6 (11)
5 and 8 Science 88 67.0 71.7 (46) 61.9 (42) 50.0 (10) 36.4 (11) 64.7 (17) 46.7 (15) 93.8 (16) 100.0 (13) 66.7 (3) 66.7 (3)
Lakewood Math 3-8 212 33.0 34.7 (124) 30.7 (88) 42.5 (40) 18.8 (32) 33.3 (63) 33.3 (48) 25.0 (4) 66.7 (3) 23.5 (17) 60.0 (5)
MClass KI MOY 81 35.8 37.5 (32) 34.7 (49) 45.5 (11) 45.5 (22) 35.0 (20) 28.0 (25) 0.0 (1) 0.0 (2)
Reading 3-8 212 23.1 24.2 (124) 21.6 (88) 25.0 (40) 12.5 (32) 22.2 (63) 18.8 (48) 50.0 (4) 66.7 (3) 23.5 (17) 80.0 (5)
5 and 8 Science 58 39.7 36.4 (33) 44.0 (25) 28.6 (7) 33.3 (9) 31.6 (19) 54.5 (11) 50.0 (2) 100.0 (2) 60.0 (5) 0.0 (3)
Little River Math 3-8 185 62.7 61.0 (100) 64.7 (85) 51.6 (31) 42.3 (26) 62.5 (8) 81.8 (11) 63.6 (55) 71.1 (45) 83.3 (6) 100.0 (3)
MClass KI MOY 45 73.3 78.9 (19) 69.2 (26) 85.7 (7) 72.7 (11) 0.0 (1) 0.0 (2) 80.0 (10) 72.7 (11) 100.0 (1) 100.0 (2)
Reading 3-8 186 67.2 67.3 (101) 67.1 (85) 65.6 (32) 61.5 (26) 37.5 (8) 63.6 (11) 72.7 (55) 68.9 (45) 66.7 (6) 100.0 (3)
5 and 8 Science 65 72.3 78.8 (33) 65.6 (32) 77.8 (9) 46.2 (13) 50.0 (2) 100.0 (2) 81.0 (21) 75.0 (16) 100.0 (1) 100.0 (1)
Mangum Math 3-8 176 76.1 71.4 (91) 81.2 (85) 30.0 (10) 72.7 (11) 66.7 (6) 50.0 (4) 78.4 (74) 85.7 (63) 0.0 (1) 71.4 (7)
MClass KI MOY 47 48.9 48.0 (25) 50.0 (22) 50.0 (2) 50.0 (2) 47.8 (23) 52.6 (19) 0.0 (1)
Reading 3-8 176 70.5 65.9 (91) 75.3 (85) 10.0 (10) 72.7 (11) 50.0 (6) 0.0 (4) 75.7 (74) 79.4 (63) 0.0 (1) 85.7 (7)
5 and 8 Science 62 80.6 85.7 (35) 74.1 (27) 50.0 (2) 50.0 (2) 75.0 (4) 66.7 (3) 89.7 (29) 73.7 (19) 100.0 (3)
Merrick-Moore Math 3-8 338 17.5 16.4 (165) 18.5 (173) 13.9 (79) 12.5 (96) 18.4 (76) 26.4 (72) 16.7 (6) 25.0 (4) 25.0 (4) 0.0 (1)
MClass KI MOY 130 30.8 24.3 (74) 39.3 (56) 34.4 (32) 53.1 (32) 16.7 (36) 14.3 (21) 16.7 (6) 50.0 (2) 100.0 (1)
Reading 3-8 341 21.7 24.0 (167) 19.5 (174) 23.8 (80) 20.6 (97) 23.4 (77) 18.1 (72) 33.3 (6) 0.0 (4) 25.0 (4) 100.0 (1)
5 and 8 Science 92 27.2 32.6 (43) 22.4 (49) 37.5 (24) 22.6 (31) 23.5 (17) 23.5 (17) 100.0 (1) 0.0 (1) 0.0 (1)
Morehead Math 3-8 95 63.2 70.0 (50) 55.6 (45) 35.7 (14) 42.1 (19) 44.4 (9) 28.6 (7) 95.5 (22) 77.8 (18) 100.0 (5) 100.0 (1)
MClass KI MOY 40 90.0 88.9 (18) 90.9 (22) 100.0 (3) 83.3 (6) 80.0 (5) 50.0 (2) 88.9 (9) 100.0 (14) 100.0 (1)
Reading 3-8 95 69.5 68.0 (50) 71.1 (45) 57.1 (14) 57.9 (19) 11.1 (9) 57.1 (7) 95.5 (22) 88.9 (18) 80.0 (5) 100.0 (1)
5 and 8 Science 32 59.4 72.2 (18) 42.9 (14) 50.0 (6) 37.5 (8) 33.3 (3) 33.3 (3) 100.0 (7) 66.7 (3) 100.0 (2)
Oak Grove Math 3-8 246 49.2 45.2 (126) 53.3 (120) 35.7 (70) 43.1 (72) 55.8 (43) 70.0 (40) 42.9 (7) 80.0 (5) 83.3 (6) 33.3 (3)
MClass KI MOY 105 40.0 34.5 (58) 46.8 (47) 33.3 (27) 51.9 (27) 32.0 (25) 35.3 (17) 40.0 (5) 100.0 (2) 100.0 (1) 0.0 (1)
Reading 3-8 246 35.4 25.4 (126) 45.8 (120) 17.1 (70) 37.5 (72) 32.6 (43) 55.0 (40) 28.6 (7) 80.0 (5) 66.7 (6) 66.7 (3)
5 and 8 Science 70 60.0 54.5 (33) 64.9 (37) 45.5 (22) 54.2 (24) 66.7 (6) 83.3 (12) 50.0 (2) 100.0 (1) 100.0 (3)
Parkwood Math 3-8 268 48.1 50.4 (135) 45.9 (133) 44.4 (72) 41.0 (78) 55.3 (38) 43.8 (32) 50.0 (16) 66.7 (9) 77.8 (9) 64.3 (14)
MClass KI MOY 110 55.5 51.7 (60) 60.0 (50) 54.1 (37) 68.8 (32) 23.1 (13) 36.4 (11) 85.7 (7) 80.0 (5) 66.7 (3) 0.0 (2)
Reading 3-8 268 37.3 36.3 (135) 38.3 (133) 27.8 (72) 33.3 (78) 39.5 (38) 37.5 (32) 56.3 (16) 55.6 (9) 55.6 (9) 57.1 (14)
5 and 8 Science 84 59.5 63.4 (41) 55.8 (43) 61.5 (26) 52.2 (23) 72.7 (11) 55.6 (9) 33.3 (3) 75.0 (4) 100.0 (1) 57.1 (7)
Pearson Elem Math 3-8 254 24.0 27.9 (122) 20.5 (132) 23.0 (74) 20.7 (92) 33.3 (42) 17.6 (34) 66.7 (3) 100.0 (2) 33.3 (3) 0.0 (4)
MClass KI MOY 105 36.2 27.1 (48) 43.9 (57) 25.9 (27) 47.4 (38) 21.1 (19) 25.0 (16) 100.0 (2) 100.0 (3)
Reading 3-8 254 22.8 18.9 (122) 26.5 (132) 18.9 (74) 26.1 (92) 16.7 (42) 17.6 (34) 33.3 (3) 100.0 (2) 33.3 (3) 75.0 (4)
5 and 8 Science 91 22.0 19.0 (42) 24.5 (49) 16.0 (25) 25.7 (35) 15.4 (13) 8.3 (12) 50.0 (2) 100.0 (2) 50.0 (2)
Pearsontown Math 3-8 396 74.2 69.7 (195) 78.6 (201) 60.0 (100) 73.9 (111) 45.0 (20) 73.9 (23) 96.3 (54) 92.6 (54) 71.4 (21) 69.2 (13)
MClass KI MOY 130 80.0 82.1 (78) 76.9 (52) 78.4 (37) 88.2 (17) 90.0 (10) 44.4 (9) 87.0 (23) 86.4 (22) 75.0 (8) 50.0 (4)
Reading 3-8 396 72.5 69.2 (195) 75.6 (201) 65.0 (100) 70.3 (111) 40.0 (20) 69.6 (23) 87.0 (54) 90.7 (54) 71.4 (21) 69.2 (13)
5 and 8 Science 131 84.7 90.0 (60) 80.3 (71) 90.6 (32) 81.6 (38) 40.0 (5) 50.0 (8) 100.0 (16) 95.0 (20) 100.0 (7) 60.0 (5)
RG01 - Academic Achievement by Ethnicity and Gender 11/18/2016 1:19:07 PM Page 3
Academic Achievement by Ethnicity and Gender 2015Student Proficiency given Number Tested within Ethnic-Gender Group
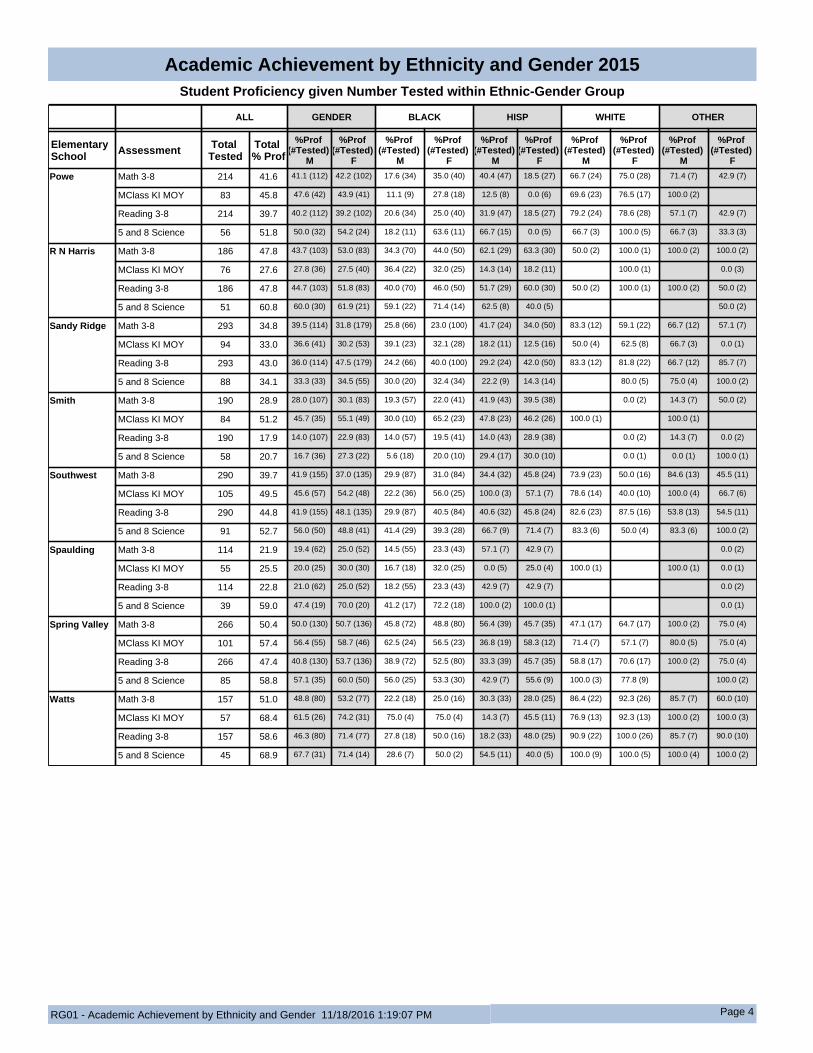
ALL GENDER BLACK HISP WHITE OTHER
Elementary School Assessment Total
TestedTotal % Prof
%Prof (#Tested)
M
%Prof (#Tested)
F
%Prof (#Tested)
M
%Prof (#Tested)
F
%Prof (#Tested)
M
%Prof (#Tested)
F
%Prof (#Tested)
M
%Prof (#Tested)
F
%Prof (#Tested)
M
%Prof (#Tested)
F
Powe Math 3-8 214 41.6 41.1 (112) 42.2 (102) 17.6 (34) 35.0 (40) 40.4 (47) 18.5 (27) 66.7 (24) 75.0 (28) 71.4 (7) 42.9 (7)
MClass KI MOY 83 45.8 47.6 (42) 43.9 (41) 11.1 (9) 27.8 (18) 12.5 (8) 0.0 (6) 69.6 (23) 76.5 (17) 100.0 (2)
Reading 3-8 214 39.7 40.2 (112) 39.2 (102) 20.6 (34) 25.0 (40) 31.9 (47) 18.5 (27) 79.2 (24) 78.6 (28) 57.1 (7) 42.9 (7)
5 and 8 Science 56 51.8 50.0 (32) 54.2 (24) 18.2 (11) 63.6 (11) 66.7 (15) 0.0 (5) 66.7 (3) 100.0 (5) 66.7 (3) 33.3 (3)
R N Harris Math 3-8 186 47.8 43.7 (103) 53.0 (83) 34.3 (70) 44.0 (50) 62.1 (29) 63.3 (30) 50.0 (2) 100.0 (1) 100.0 (2) 100.0 (2)
MClass KI MOY 76 27.6 27.8 (36) 27.5 (40) 36.4 (22) 32.0 (25) 14.3 (14) 18.2 (11) 100.0 (1) 0.0 (3)
Reading 3-8 186 47.8 44.7 (103) 51.8 (83) 40.0 (70) 46.0 (50) 51.7 (29) 60.0 (30) 50.0 (2) 100.0 (1) 100.0 (2) 50.0 (2)
5 and 8 Science 51 60.8 60.0 (30) 61.9 (21) 59.1 (22) 71.4 (14) 62.5 (8) 40.0 (5) 50.0 (2)
Sandy Ridge Math 3-8 293 34.8 39.5 (114) 31.8 (179) 25.8 (66) 23.0 (100) 41.7 (24) 34.0 (50) 83.3 (12) 59.1 (22) 66.7 (12) 57.1 (7)
MClass KI MOY 94 33.0 36.6 (41) 30.2 (53) 39.1 (23) 32.1 (28) 18.2 (11) 12.5 (16) 50.0 (4) 62.5 (8) 66.7 (3) 0.0 (1)
Reading 3-8 293 43.0 36.0 (114) 47.5 (179) 24.2 (66) 40.0 (100) 29.2 (24) 42.0 (50) 83.3 (12) 81.8 (22) 66.7 (12) 85.7 (7)
5 and 8 Science 88 34.1 33.3 (33) 34.5 (55) 30.0 (20) 32.4 (34) 22.2 (9) 14.3 (14) 80.0 (5) 75.0 (4) 100.0 (2)
Smith Math 3-8 190 28.9 28.0 (107) 30.1 (83) 19.3 (57) 22.0 (41) 41.9 (43) 39.5 (38) 0.0 (2) 14.3 (7) 50.0 (2)
MClass KI MOY 84 51.2 45.7 (35) 55.1 (49) 30.0 (10) 65.2 (23) 47.8 (23) 46.2 (26) 100.0 (1) 100.0 (1)
Reading 3-8 190 17.9 14.0 (107) 22.9 (83) 14.0 (57) 19.5 (41) 14.0 (43) 28.9 (38) 0.0 (2) 14.3 (7) 0.0 (2)
5 and 8 Science 58 20.7 16.7 (36) 27.3 (22) 5.6 (18) 20.0 (10) 29.4 (17) 30.0 (10) 0.0 (1) 0.0 (1) 100.0 (1)
Southwest Math 3-8 290 39.7 41.9 (155) 37.0 (135) 29.9 (87) 31.0 (84) 34.4 (32) 45.8 (24) 73.9 (23) 50.0 (16) 84.6 (13) 45.5 (11)
MClass KI MOY 105 49.5 45.6 (57) 54.2 (48) 22.2 (36) 56.0 (25) 100.0 (3) 57.1 (7) 78.6 (14) 40.0 (10) 100.0 (4) 66.7 (6)
Reading 3-8 290 44.8 41.9 (155) 48.1 (135) 29.9 (87) 40.5 (84) 40.6 (32) 45.8 (24) 82.6 (23) 87.5 (16) 53.8 (13) 54.5 (11)
5 and 8 Science 91 52.7 56.0 (50) 48.8 (41) 41.4 (29) 39.3 (28) 66.7 (9) 71.4 (7) 83.3 (6) 50.0 (4) 83.3 (6) 100.0 (2)
Spaulding Math 3-8 114 21.9 19.4 (62) 25.0 (52) 14.5 (55) 23.3 (43) 57.1 (7) 42.9 (7) 0.0 (2)
MClass KI MOY 55 25.5 20.0 (25) 30.0 (30) 16.7 (18) 32.0 (25) 0.0 (5) 25.0 (4) 100.0 (1) 100.0 (1) 0.0 (1)
Reading 3-8 114 22.8 21.0 (62) 25.0 (52) 18.2 (55) 23.3 (43) 42.9 (7) 42.9 (7) 0.0 (2)
5 and 8 Science 39 59.0 47.4 (19) 70.0 (20) 41.2 (17) 72.2 (18) 100.0 (2) 100.0 (1) 0.0 (1)
Spring Valley Math 3-8 266 50.4 50.0 (130) 50.7 (136) 45.8 (72) 48.8 (80) 56.4 (39) 45.7 (35) 47.1 (17) 64.7 (17) 100.0 (2) 75.0 (4)
MClass KI MOY 101 57.4 56.4 (55) 58.7 (46) 62.5 (24) 56.5 (23) 36.8 (19) 58.3 (12) 71.4 (7) 57.1 (7) 80.0 (5) 75.0 (4)
Reading 3-8 266 47.4 40.8 (130) 53.7 (136) 38.9 (72) 52.5 (80) 33.3 (39) 45.7 (35) 58.8 (17) 70.6 (17) 100.0 (2) 75.0 (4)
5 and 8 Science 85 58.8 57.1 (35) 60.0 (50) 56.0 (25) 53.3 (30) 42.9 (7) 55.6 (9) 100.0 (3) 77.8 (9) 100.0 (2)
Watts Math 3-8 157 51.0 48.8 (80) 53.2 (77) 22.2 (18) 25.0 (16) 30.3 (33) 28.0 (25) 86.4 (22) 92.3 (26) 85.7 (7) 60.0 (10)
MClass KI MOY 57 68.4 61.5 (26) 74.2 (31) 75.0 (4) 75.0 (4) 14.3 (7) 45.5 (11) 76.9 (13) 92.3 (13) 100.0 (2) 100.0 (3)
Reading 3-8 157 58.6 46.3 (80) 71.4 (77) 27.8 (18) 50.0 (16) 18.2 (33) 48.0 (25) 90.9 (22) 100.0 (26) 85.7 (7) 90.0 (10)
5 and 8 Science 45 68.9 67.7 (31) 71.4 (14) 28.6 (7) 50.0 (2) 54.5 (11) 40.0 (5) 100.0 (9) 100.0 (5) 100.0 (4) 100.0 (2)
RG01 - Academic Achievement by Ethnicity and Gender 11/18/2016 1:19:07 PM Page 4
Academic Achievement by Ethnicity and Gender 2015Student Proficiency given Number Tested within Ethnic-Gender Group

ALL GENDER BLACK HISP WHITE OTHER
Middle School Assessment Total
TestedTotal % Prof
%Prof (#Tested)
M
%Prof (#Tested)
F
%Prof (#Tested)
M
%Prof (#Tested)
F
%Prof (#Tested)
M
%Prof (#Tested)
F
%Prof (#Tested)
M
%Prof (#Tested)
F
%Prof (#Tested)
M
%Prof (#Tested)
F
Brogden Math 3-8 628 26.1 27.3 (326) 24.8 (302) 13.0 (138) 16.7 (162) 20.2 (114) 20.9 (91) 68.5 (54) 67.7 (31) 55.0 (20) 44.4 (18)
Reading 3-8 628 33.9 31.0 (326) 37.1 (302) 15.9 (138) 28.4 (162) 26.3 (114) 35.2 (91) 77.8 (54) 83.9 (31) 35.0 (20) 44.4 (18)
5 and 8 Science 196 51.0 47.6 (105) 54.9 (91) 32.7 (52) 46.2 (52) 55.9 (34) 61.5 (26) 64.3 (14) 88.9 (9) 100.0 (5) 50.0 (4)
Math I 8 100.0 100.0 (4) 100.0 (4) 100.0 (4) 100.0 (3) 100.0 (1)
Carrington Math 3-8 1060 37.6 33.3 (555) 42.4 (505) 19.8 (278) 31.3 (256) 35.6 (118) 34.4 (122) 58.6 (116) 71.6 (102) 46.5 (43) 76.0 (25)
Reading 3-8 1060 39.2 34.4 (555) 44.6 (505) 22.6 (279) 36.3 (256) 31.4 (118) 33.6 (122) 59.1 (115) 70.6 (102) 53.5 (43) 76.0 (25)
5 and 8 Science 361 61.5 61.3 (186) 61.7 (175) 53.6 (97) 51.7 (87) 55.9 (34) 50.0 (38) 79.5 (39) 86.7 (45) 75.0 (16) 100.0 (5)
Math I 24 100.0 100.0 (12) 100.0 (12) 100.0 (1) 100.0 (2) 100.0 (2) 100.0 (6) 100.0 (9) 100.0 (3) 100.0 (1)
Githens Math 3-8 954 27.7 27.7 (476) 27.6 (478) 14.0 (236) 16.3 (215) 16.2 (111) 21.8 (156) 71.7 (92) 61.6 (73) 40.5 (37) 52.9 (34)
Reading 3-8 955 38.1 36.0 (478) 40.3 (477) 22.4 (237) 32.1 (215) 26.1 (111) 32.1 (156) 77.4 (93) 72.6 (73) 48.6 (37) 60.6 (33)
5 and 8 Science 346 44.2 44.7 (170) 43.8 (176) 38.8 (85) 30.9 (94) 34.2 (38) 45.3 (53) 68.8 (32) 90.0 (20) 53.3 (15) 66.7 (9)
Math I 45 93.3 96.0 (25) 90.0 (20) 80.0 (5) 100.0 (2) 100.0 (2) 71.4 (7) 100.0 (18) 100.0 (7) 100.0 (4)
Lakewood Middle
Math 3-8 280 52.9 45.0 (129) 59.6 (151) 33.3 (42) 32.4 (34) 15.4 (39) 28.9 (38) 83.7 (43) 88.5 (61) 40.0 (5) 77.8 (18)
Reading 3-8 279 65.2 54.3 (129) 74.7 (150) 54.8 (42) 55.9 (34) 17.9 (39) 50.0 (38) 86.0 (43) 95.0 (60) 60.0 (5) 94.4 (18)
5 and 8 Science 89 75.3 76.9 (52) 73.0 (37) 68.4 (19) 66.7 (9) 64.7 (17) 58.8 (17) 100.0 (13) 100.0 (9) 100.0 (3) 100.0 (2)
Math I 19 100.0 100.0 (5) 100.0 (14) 100.0 (2) 100.0 (1) 100.0 (3) 100.0 (10) 100.0 (3)
Lowe's Grove Math 3-8 716 16.8 14.8 (371) 18.8 (345) 9.4 (244) 20.9 (234) 18.8 (85) 9.2 (87) 36.0 (25) 53.8 (13) 41.2 (17) 9.1 (11)
Reading 3-8 716 32.7 28.3 (371) 37.4 (345) 20.9 (244) 37.6 (234) 31.8 (85) 33.3 (87) 68.0 (25) 76.9 (13) 58.8 (17) 18.2 (11)
5 and 8 Science 230 39.1 36.8 (125) 41.9 (105) 30.1 (83) 44.0 (75) 43.3 (30) 32.0 (25) 66.7 (6) 60.0 (5) 66.7 (6)
Math I 46 69.6 60.0 (20) 76.9 (26) 55.6 (9) 80.0 (20) 50.0 (8) 50.0 (4) 100.0 (1) 100.0 (2) 100.0 (2)
Lucas Math 3-8 640 33.0 27.5 (291) 37.5 (349) 23.6 (148) 27.6 (152) 23.1 (65) 25.0 (80) 42.9 (63) 58.7 (104) 20.0 (15) 61.5 (13)
Reading 3-8 640 46.4 40.2 (291) 51.6 (349) 37.2 (148) 42.1 (152) 33.8 (65) 32.5 (80) 55.6 (63) 76.9 (104) 33.3 (15) 76.9 (13)
5 and 8 Science 195 63.1 56.7 (90) 68.6 (105) 47.8 (46) 54.5 (44) 52.2 (23) 57.1 (21) 78.9 (19) 89.2 (37) 100.0 (2) 100.0 (3)
Math I 21 90.5 100.0 (7) 85.7 (14) 100.0 (3) 100.0 (1) 100.0 (1) 100.0 (1) 100.0 (3) 83.3 (12)
Neal Math 3-8 848 16.6 15.0 (440) 18.4 (408) 10.1 (248) 15.6 (225) 18.5 (151) 21.6 (148) 30.8 (26) 27.8 (18) 33.3 (15) 17.6 (17)
Reading 3-8 852 26.9 23.9 (443) 30.1 (409) 18.4 (250) 28.3 (226) 31.6 (152) 31.1 (148) 34.6 (26) 44.4 (18) 20.0 (15) 29.4 (17)
5 and 8 Science 308 49.7 53.7 (164) 45.1 (144) 39.6 (91) 35.8 (81) 71.7 (60) 54.5 (55) 80.0 (10) 83.3 (6) 33.3 (3) 50.0 (2)
Math I 29 75.9 88.9 (9) 70.0 (20) 75.0 (4) 54.5 (11) 100.0 (3) 100.0 (6) 100.0 (2) 66.7 (3)
Rogers-Herr Math 3-8 633 54.7 53.7 (300) 55.6 (333) 43.8 (153) 56.0 (191) 32.3 (62) 29.7 (64) 87.5 (64) 79.6 (49) 85.7 (21) 69.0 (29)
Reading 3-8 633 60.7 54.7 (300) 66.1 (333) 45.8 (153) 66.0 (191) 32.3 (62) 42.2 (64) 89.1 (64) 87.8 (49) 81.0 (21) 82.8 (29)
5 and 8 Science 205 86.3 86.6 (97) 86.1 (108) 78.8 (52) 86.8 (68) 91.3 (23) 66.7 (15) 100.0 (18) 100.0 (15) 100.0 (4) 90.0 (10)
Math I 27 100.0 100.0 (14) 100.0 (13) 100.0 (4) 100.0 (6) 100.0 (8) 100.0 (4) 100.0 (2) 100.0 (3)
Shepard Math 3-8 508 26.6 26.6 (263) 26.5 (245) 26.8 (209) 24.3 (169) 20.8 (48) 28.4 (67) 100.0 (2) 100.0 (1) 50.0 (4) 50.0 (8)
Reading 3-8 507 36.1 30.4 (263) 42.2 (244) 30.1 (209) 40.5 (168) 29.2 (48) 44.8 (67) 50.0 (2) 100.0 (1) 50.0 (4) 50.0 (8)
5 and 8 Science 170 60.6 60.2 (83) 60.9 (87) 55.9 (68) 53.8 (52) 76.9 (13) 66.7 (30) 100.0 (1) 100.0 (1) 100.0 (1) 100.0 (4)
Math I 7 100.0 100.0 (2) 100.0 (5) 100.0 (2) 100.0 (2) 100.0 (1) 100.0 (2)
RG01 - Academic Achievement by Ethnicity and Gender 11/18/2016 1:19:07 PM Page 5
Academic Achievement by Ethnicity and Gender 2015Student Proficiency given Number Tested within Ethnic-Gender Group
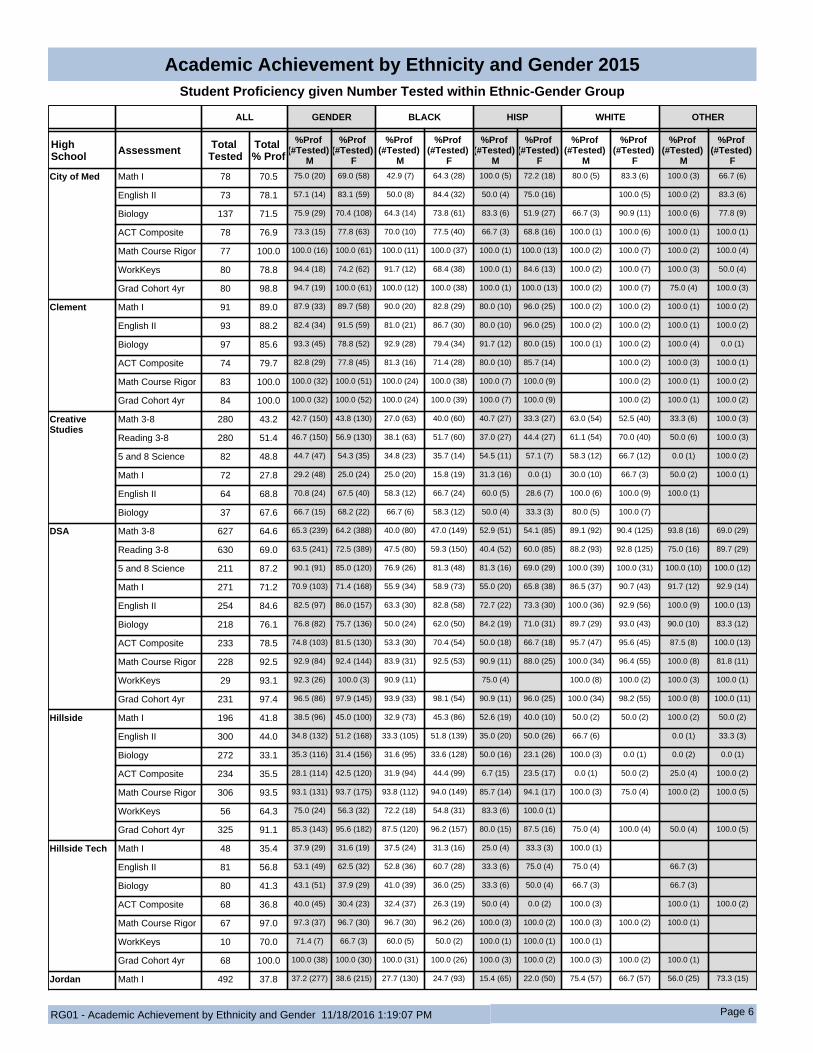
ALL GENDER BLACK HISP WHITE OTHER
High School Assessment Total
TestedTotal % Prof
%Prof (#Tested)
M
%Prof (#Tested)
F
%Prof (#Tested)
M
%Prof (#Tested)
F
%Prof (#Tested)
M
%Prof (#Tested)
F
%Prof (#Tested)
M
%Prof (#Tested)
F
%Prof (#Tested)
M
%Prof (#Tested)
F
City of Med Math I 78 70.5 75.0 (20) 69.0 (58) 42.9 (7) 64.3 (28) 100.0 (5) 72.2 (18) 80.0 (5) 83.3 (6) 100.0 (3) 66.7 (6)
English II 73 78.1 57.1 (14) 83.1 (59) 50.0 (8) 84.4 (32) 50.0 (4) 75.0 (16) 100.0 (5) 100.0 (2) 83.3 (6)
Biology 137 71.5 75.9 (29) 70.4 (108) 64.3 (14) 73.8 (61) 83.3 (6) 51.9 (27) 66.7 (3) 90.9 (11) 100.0 (6) 77.8 (9)
ACT Composite 78 76.9 73.3 (15) 77.8 (63) 70.0 (10) 77.5 (40) 66.7 (3) 68.8 (16) 100.0 (1) 100.0 (6) 100.0 (1) 100.0 (1)
Math Course Rigor 77 100.0 100.0 (16) 100.0 (61) 100.0 (11) 100.0 (37) 100.0 (1) 100.0 (13) 100.0 (2) 100.0 (7) 100.0 (2) 100.0 (4)
WorkKeys 80 78.8 94.4 (18) 74.2 (62) 91.7 (12) 68.4 (38) 100.0 (1) 84.6 (13) 100.0 (2) 100.0 (7) 100.0 (3) 50.0 (4)
Grad Cohort 4yr 80 98.8 94.7 (19) 100.0 (61) 100.0 (12) 100.0 (38) 100.0 (1) 100.0 (13) 100.0 (2) 100.0 (7) 75.0 (4) 100.0 (3)
Clement Math I 91 89.0 87.9 (33) 89.7 (58) 90.0 (20) 82.8 (29) 80.0 (10) 96.0 (25) 100.0 (2) 100.0 (2) 100.0 (1) 100.0 (2)
English II 93 88.2 82.4 (34) 91.5 (59) 81.0 (21) 86.7 (30) 80.0 (10) 96.0 (25) 100.0 (2) 100.0 (2) 100.0 (1) 100.0 (2)
Biology 97 85.6 93.3 (45) 78.8 (52) 92.9 (28) 79.4 (34) 91.7 (12) 80.0 (15) 100.0 (1) 100.0 (2) 100.0 (4) 0.0 (1)
ACT Composite 74 79.7 82.8 (29) 77.8 (45) 81.3 (16) 71.4 (28) 80.0 (10) 85.7 (14) 100.0 (2) 100.0 (3) 100.0 (1)
Math Course Rigor 83 100.0 100.0 (32) 100.0 (51) 100.0 (24) 100.0 (38) 100.0 (7) 100.0 (9) 100.0 (2) 100.0 (1) 100.0 (2)
Grad Cohort 4yr 84 100.0 100.0 (32) 100.0 (52) 100.0 (24) 100.0 (39) 100.0 (7) 100.0 (9) 100.0 (2) 100.0 (1) 100.0 (2)
Creative Studies
Math 3-8 280 43.2 42.7 (150) 43.8 (130) 27.0 (63) 40.0 (60) 40.7 (27) 33.3 (27) 63.0 (54) 52.5 (40) 33.3 (6) 100.0 (3)
Reading 3-8 280 51.4 46.7 (150) 56.9 (130) 38.1 (63) 51.7 (60) 37.0 (27) 44.4 (27) 61.1 (54) 70.0 (40) 50.0 (6) 100.0 (3)
5 and 8 Science 82 48.8 44.7 (47) 54.3 (35) 34.8 (23) 35.7 (14) 54.5 (11) 57.1 (7) 58.3 (12) 66.7 (12) 0.0 (1) 100.0 (2)
Math I 72 27.8 29.2 (48) 25.0 (24) 25.0 (20) 15.8 (19) 31.3 (16) 0.0 (1) 30.0 (10) 66.7 (3) 50.0 (2) 100.0 (1)
English II 64 68.8 70.8 (24) 67.5 (40) 58.3 (12) 66.7 (24) 60.0 (5) 28.6 (7) 100.0 (6) 100.0 (9) 100.0 (1)
Biology 37 67.6 66.7 (15) 68.2 (22) 66.7 (6) 58.3 (12) 50.0 (4) 33.3 (3) 80.0 (5) 100.0 (7)
DSA Math 3-8 627 64.6 65.3 (239) 64.2 (388) 40.0 (80) 47.0 (149) 52.9 (51) 54.1 (85) 89.1 (92) 90.4 (125) 93.8 (16) 69.0 (29)
Reading 3-8 630 69.0 63.5 (241) 72.5 (389) 47.5 (80) 59.3 (150) 40.4 (52) 60.0 (85) 88.2 (93) 92.8 (125) 75.0 (16) 89.7 (29)
5 and 8 Science 211 87.2 90.1 (91) 85.0 (120) 76.9 (26) 81.3 (48) 81.3 (16) 69.0 (29) 100.0 (39) 100.0 (31) 100.0 (10) 100.0 (12)
Math I 271 71.2 70.9 (103) 71.4 (168) 55.9 (34) 58.9 (73) 55.0 (20) 65.8 (38) 86.5 (37) 90.7 (43) 91.7 (12) 92.9 (14)
English II 254 84.6 82.5 (97) 86.0 (157) 63.3 (30) 82.8 (58) 72.7 (22) 73.3 (30) 100.0 (36) 92.9 (56) 100.0 (9) 100.0 (13)
Biology 218 76.1 76.8 (82) 75.7 (136) 50.0 (24) 62.0 (50) 84.2 (19) 71.0 (31) 89.7 (29) 93.0 (43) 90.0 (10) 83.3 (12)
ACT Composite 233 78.5 74.8 (103) 81.5 (130) 53.3 (30) 70.4 (54) 50.0 (18) 66.7 (18) 95.7 (47) 95.6 (45) 87.5 (8) 100.0 (13)
Math Course Rigor 228 92.5 92.9 (84) 92.4 (144) 83.9 (31) 92.5 (53) 90.9 (11) 88.0 (25) 100.0 (34) 96.4 (55) 100.0 (8) 81.8 (11)
WorkKeys 29 93.1 92.3 (26) 100.0 (3) 90.9 (11) 75.0 (4) 100.0 (8) 100.0 (2) 100.0 (3) 100.0 (1)
Grad Cohort 4yr 231 97.4 96.5 (86) 97.9 (145) 93.9 (33) 98.1 (54) 90.9 (11) 96.0 (25) 100.0 (34) 98.2 (55) 100.0 (8) 100.0 (11)
Hillside Math I 196 41.8 38.5 (96) 45.0 (100) 32.9 (73) 45.3 (86) 52.6 (19) 40.0 (10) 50.0 (2) 50.0 (2) 100.0 (2) 50.0 (2)
English II 300 44.0 34.8 (132) 51.2 (168) 33.3 (105) 51.8 (139) 35.0 (20) 50.0 (26) 66.7 (6) 0.0 (1) 33.3 (3)
Biology 272 33.1 35.3 (116) 31.4 (156) 31.6 (95) 33.6 (128) 50.0 (16) 23.1 (26) 100.0 (3) 0.0 (1) 0.0 (2) 0.0 (1)
ACT Composite 234 35.5 28.1 (114) 42.5 (120) 31.9 (94) 44.4 (99) 6.7 (15) 23.5 (17) 0.0 (1) 50.0 (2) 25.0 (4) 100.0 (2)
Math Course Rigor 306 93.5 93.1 (131) 93.7 (175) 93.8 (112) 94.0 (149) 85.7 (14) 94.1 (17) 100.0 (3) 75.0 (4) 100.0 (2) 100.0 (5)
WorkKeys 56 64.3 75.0 (24) 56.3 (32) 72.2 (18) 54.8 (31) 83.3 (6) 100.0 (1)
Grad Cohort 4yr 325 91.1 85.3 (143) 95.6 (182) 87.5 (120) 96.2 (157) 80.0 (15) 87.5 (16) 75.0 (4) 100.0 (4) 50.0 (4) 100.0 (5)
Hillside Tech Math I 48 35.4 37.9 (29) 31.6 (19) 37.5 (24) 31.3 (16) 25.0 (4) 33.3 (3) 100.0 (1)
English II 81 56.8 53.1 (49) 62.5 (32) 52.8 (36) 60.7 (28) 33.3 (6) 75.0 (4) 75.0 (4) 66.7 (3)
Biology 80 41.3 43.1 (51) 37.9 (29) 41.0 (39) 36.0 (25) 33.3 (6) 50.0 (4) 66.7 (3) 66.7 (3)
ACT Composite 68 36.8 40.0 (45) 30.4 (23) 32.4 (37) 26.3 (19) 50.0 (4) 0.0 (2) 100.0 (3) 100.0 (1) 100.0 (2)
Math Course Rigor 67 97.0 97.3 (37) 96.7 (30) 96.7 (30) 96.2 (26) 100.0 (3) 100.0 (2) 100.0 (3) 100.0 (2) 100.0 (1)
WorkKeys 10 70.0 71.4 (7) 66.7 (3) 60.0 (5) 50.0 (2) 100.0 (1) 100.0 (1) 100.0 (1)
Grad Cohort 4yr 68 100.0 100.0 (38) 100.0 (30) 100.0 (31) 100.0 (26) 100.0 (3) 100.0 (2) 100.0 (3) 100.0 (2) 100.0 (1)
Jordan Math I 492 37.8 37.2 (277) 38.6 (215) 27.7 (130) 24.7 (93) 15.4 (65) 22.0 (50) 75.4 (57) 66.7 (57) 56.0 (25) 73.3 (15)
RG01 - Academic Achievement by Ethnicity and Gender 11/18/2016 1:19:07 PM Page 6
Academic Achievement by Ethnicity and Gender 2015Student Proficiency given Number Tested within Ethnic-Gender Group
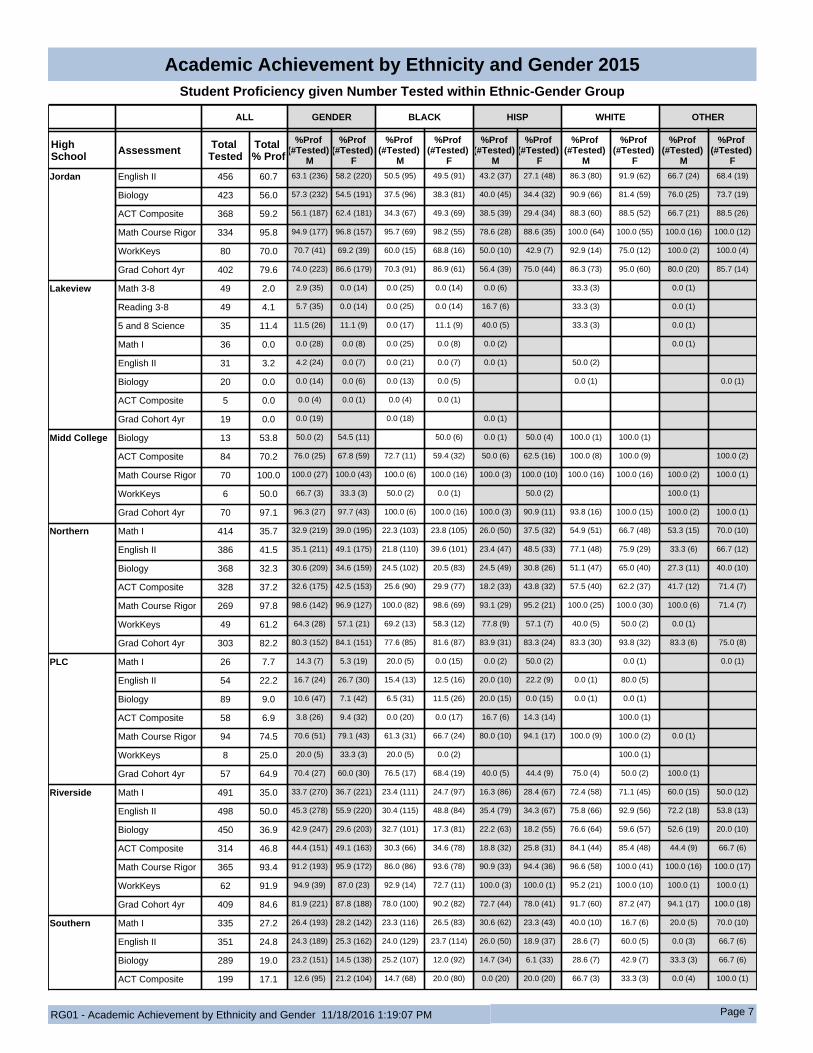
ALL GENDER BLACK HISP WHITE OTHER
High School Assessment Total
TestedTotal % Prof
%Prof (#Tested)
M
%Prof (#Tested)
F
%Prof (#Tested)
M
%Prof (#Tested)
F
%Prof (#Tested)
M
%Prof (#Tested)
F
%Prof (#Tested)
M
%Prof (#Tested)
F
%Prof (#Tested)
M
%Prof (#Tested)
F
Jordan English II 456 60.7 63.1 (236) 58.2 (220) 50.5 (95) 49.5 (91) 43.2 (37) 27.1 (48) 86.3 (80) 91.9 (62) 66.7 (24) 68.4 (19)
Biology 423 56.0 57.3 (232) 54.5 (191) 37.5 (96) 38.3 (81) 40.0 (45) 34.4 (32) 90.9 (66) 81.4 (59) 76.0 (25) 73.7 (19)
ACT Composite 368 59.2 56.1 (187) 62.4 (181) 34.3 (67) 49.3 (69) 38.5 (39) 29.4 (34) 88.3 (60) 88.5 (52) 66.7 (21) 88.5 (26)
Math Course Rigor 334 95.8 94.9 (177) 96.8 (157) 95.7 (69) 98.2 (55) 78.6 (28) 88.6 (35) 100.0 (64) 100.0 (55) 100.0 (16) 100.0 (12)
WorkKeys 80 70.0 70.7 (41) 69.2 (39) 60.0 (15) 68.8 (16) 50.0 (10) 42.9 (7) 92.9 (14) 75.0 (12) 100.0 (2) 100.0 (4)
Grad Cohort 4yr 402 79.6 74.0 (223) 86.6 (179) 70.3 (91) 86.9 (61) 56.4 (39) 75.0 (44) 86.3 (73) 95.0 (60) 80.0 (20) 85.7 (14)
Lakeview Math 3-8 49 2.0 2.9 (35) 0.0 (14) 0.0 (25) 0.0 (14) 0.0 (6) 33.3 (3) 0.0 (1)
Reading 3-8 49 4.1 5.7 (35) 0.0 (14) 0.0 (25) 0.0 (14) 16.7 (6) 33.3 (3) 0.0 (1)
5 and 8 Science 35 11.4 11.5 (26) 11.1 (9) 0.0 (17) 11.1 (9) 40.0 (5) 33.3 (3) 0.0 (1)
Math I 36 0.0 0.0 (28) 0.0 (8) 0.0 (25) 0.0 (8) 0.0 (2) 0.0 (1)
English II 31 3.2 4.2 (24) 0.0 (7) 0.0 (21) 0.0 (7) 0.0 (1) 50.0 (2)
Biology 20 0.0 0.0 (14) 0.0 (6) 0.0 (13) 0.0 (5) 0.0 (1) 0.0 (1)
ACT Composite 5 0.0 0.0 (4) 0.0 (1) 0.0 (4) 0.0 (1)
Grad Cohort 4yr 19 0.0 0.0 (19) 0.0 (18) 0.0 (1)
Midd College Biology 13 53.8 50.0 (2) 54.5 (11) 50.0 (6) 0.0 (1) 50.0 (4) 100.0 (1) 100.0 (1)
ACT Composite 84 70.2 76.0 (25) 67.8 (59) 72.7 (11) 59.4 (32) 50.0 (6) 62.5 (16) 100.0 (8) 100.0 (9) 100.0 (2)
Math Course Rigor 70 100.0 100.0 (27) 100.0 (43) 100.0 (6) 100.0 (16) 100.0 (3) 100.0 (10) 100.0 (16) 100.0 (16) 100.0 (2) 100.0 (1)
WorkKeys 6 50.0 66.7 (3) 33.3 (3) 50.0 (2) 0.0 (1) 50.0 (2) 100.0 (1)
Grad Cohort 4yr 70 97.1 96.3 (27) 97.7 (43) 100.0 (6) 100.0 (16) 100.0 (3) 90.9 (11) 93.8 (16) 100.0 (15) 100.0 (2) 100.0 (1)
Northern Math I 414 35.7 32.9 (219) 39.0 (195) 22.3 (103) 23.8 (105) 26.0 (50) 37.5 (32) 54.9 (51) 66.7 (48) 53.3 (15) 70.0 (10)
English II 386 41.5 35.1 (211) 49.1 (175) 21.8 (110) 39.6 (101) 23.4 (47) 48.5 (33) 77.1 (48) 75.9 (29) 33.3 (6) 66.7 (12)
Biology 368 32.3 30.6 (209) 34.6 (159) 24.5 (102) 20.5 (83) 24.5 (49) 30.8 (26) 51.1 (47) 65.0 (40) 27.3 (11) 40.0 (10)
ACT Composite 328 37.2 32.6 (175) 42.5 (153) 25.6 (90) 29.9 (77) 18.2 (33) 43.8 (32) 57.5 (40) 62.2 (37) 41.7 (12) 71.4 (7)
Math Course Rigor 269 97.8 98.6 (142) 96.9 (127) 100.0 (82) 98.6 (69) 93.1 (29) 95.2 (21) 100.0 (25) 100.0 (30) 100.0 (6) 71.4 (7)
WorkKeys 49 61.2 64.3 (28) 57.1 (21) 69.2 (13) 58.3 (12) 77.8 (9) 57.1 (7) 40.0 (5) 50.0 (2) 0.0 (1)
Grad Cohort 4yr 303 82.2 80.3 (152) 84.1 (151) 77.6 (85) 81.6 (87) 83.9 (31) 83.3 (24) 83.3 (30) 93.8 (32) 83.3 (6) 75.0 (8)
PLC Math I 26 7.7 14.3 (7) 5.3 (19) 20.0 (5) 0.0 (15) 0.0 (2) 50.0 (2) 0.0 (1) 0.0 (1)
English II 54 22.2 16.7 (24) 26.7 (30) 15.4 (13) 12.5 (16) 20.0 (10) 22.2 (9) 0.0 (1) 80.0 (5)
Biology 89 9.0 10.6 (47) 7.1 (42) 6.5 (31) 11.5 (26) 20.0 (15) 0.0 (15) 0.0 (1) 0.0 (1)
ACT Composite 58 6.9 3.8 (26) 9.4 (32) 0.0 (20) 0.0 (17) 16.7 (6) 14.3 (14) 100.0 (1)
Math Course Rigor 94 74.5 70.6 (51) 79.1 (43) 61.3 (31) 66.7 (24) 80.0 (10) 94.1 (17) 100.0 (9) 100.0 (2) 0.0 (1)
WorkKeys 8 25.0 20.0 (5) 33.3 (3) 20.0 (5) 0.0 (2) 100.0 (1)
Grad Cohort 4yr 57 64.9 70.4 (27) 60.0 (30) 76.5 (17) 68.4 (19) 40.0 (5) 44.4 (9) 75.0 (4) 50.0 (2) 100.0 (1)
Riverside Math I 491 35.0 33.7 (270) 36.7 (221) 23.4 (111) 24.7 (97) 16.3 (86) 28.4 (67) 72.4 (58) 71.1 (45) 60.0 (15) 50.0 (12)
English II 498 50.0 45.3 (278) 55.9 (220) 30.4 (115) 48.8 (84) 35.4 (79) 34.3 (67) 75.8 (66) 92.9 (56) 72.2 (18) 53.8 (13)
Biology 450 36.9 42.9 (247) 29.6 (203) 32.7 (101) 17.3 (81) 22.2 (63) 18.2 (55) 76.6 (64) 59.6 (57) 52.6 (19) 20.0 (10)
ACT Composite 314 46.8 44.4 (151) 49.1 (163) 30.3 (66) 34.6 (78) 18.8 (32) 25.8 (31) 84.1 (44) 85.4 (48) 44.4 (9) 66.7 (6)
Math Course Rigor 365 93.4 91.2 (193) 95.9 (172) 86.0 (86) 93.6 (78) 90.9 (33) 94.4 (36) 96.6 (58) 100.0 (41) 100.0 (16) 100.0 (17)
WorkKeys 62 91.9 94.9 (39) 87.0 (23) 92.9 (14) 72.7 (11) 100.0 (3) 100.0 (1) 95.2 (21) 100.0 (10) 100.0 (1) 100.0 (1)
Grad Cohort 4yr 409 84.6 81.9 (221) 87.8 (188) 78.0 (100) 90.2 (82) 72.7 (44) 78.0 (41) 91.7 (60) 87.2 (47) 94.1 (17) 100.0 (18)
Southern Math I 335 27.2 26.4 (193) 28.2 (142) 23.3 (116) 26.5 (83) 30.6 (62) 23.3 (43) 40.0 (10) 16.7 (6) 20.0 (5) 70.0 (10)
English II 351 24.8 24.3 (189) 25.3 (162) 24.0 (129) 23.7 (114) 26.0 (50) 18.9 (37) 28.6 (7) 60.0 (5) 0.0 (3) 66.7 (6)
Biology 289 19.0 23.2 (151) 14.5 (138) 25.2 (107) 12.0 (92) 14.7 (34) 6.1 (33) 28.6 (7) 42.9 (7) 33.3 (3) 66.7 (6)
ACT Composite 199 17.1 12.6 (95) 21.2 (104) 14.7 (68) 20.0 (80) 0.0 (20) 20.0 (20) 66.7 (3) 33.3 (3) 0.0 (4) 100.0 (1)
RG01 - Academic Achievement by Ethnicity and Gender 11/18/2016 1:19:07 PM Page 7
Academic Achievement by Ethnicity and Gender 2015Student Proficiency given Number Tested within Ethnic-Gender Group

ALL GENDER BLACK HISP WHITE OTHER
High School Assessment Total
TestedTotal % Prof
%Prof (#Tested)
M
%Prof (#Tested)
F
%Prof (#Tested)
M
%Prof (#Tested)
F
%Prof (#Tested)
M
%Prof (#Tested)
F
%Prof (#Tested)
M
%Prof (#Tested)
F
%Prof (#Tested)
M
%Prof (#Tested)
F
Southern Math Course Rigor 215 94.0 93.0 (129) 95.3 (86) 93.1 (101) 98.5 (66) 94.4 (18) 88.9 (18) 88.9 (9) 50.0 (2) 100.0 (1)
WorkKeys 130 33.1 37.7 (77) 26.4 (53) 32.3 (62) 20.9 (43) 60.0 (10) 50.0 (10) 60.0 (5)
Grad Cohort 4yr 254 83.5 82.2 (152) 85.3 (102) 86.7 (113) 90.5 (74) 60.7 (28) 76.0 (25) 90.0 (10) 33.3 (3) 100.0 (1)
RG01 - Academic Achievement by Ethnicity and Gender 11/18/2016 1:19:07 PM Page 8
Academic Achievement by Ethnicity and Gender 2015Student Proficiency given Number Tested within Ethnic-Gender Group
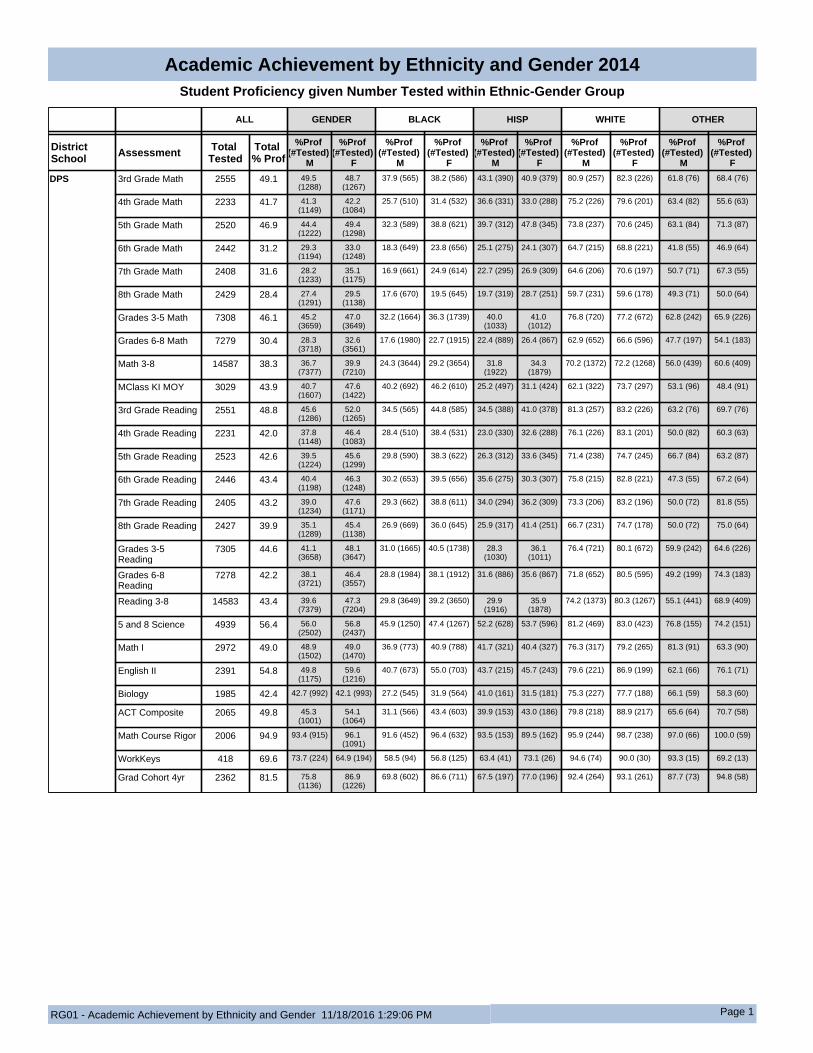
ALL GENDER BLACK HISP WHITE OTHER
District School Assessment Total
TestedTotal % Prof
%Prof (#Tested)
M
%Prof (#Tested)
F
%Prof (#Tested)
M
%Prof (#Tested)
F
%Prof (#Tested)
M
%Prof (#Tested)
F
%Prof (#Tested)
M
%Prof (#Tested)
F
%Prof (#Tested)
M
%Prof (#Tested)
F
DPS 3rd Grade Math 2555 49.1 49.5 (1288)
48.7 (1267)
37.9 (565) 38.2 (586) 43.1 (390) 40.9 (379) 80.9 (257) 82.3 (226) 61.8 (76) 68.4 (76)
4th Grade Math 2233 41.7 41.3 (1149)
42.2 (1084)
25.7 (510) 31.4 (532) 36.6 (331) 33.0 (288) 75.2 (226) 79.6 (201) 63.4 (82) 55.6 (63)
5th Grade Math 2520 46.9 44.4 (1222)
49.4 (1298)
32.3 (589) 38.8 (621) 39.7 (312) 47.8 (345) 73.8 (237) 70.6 (245) 63.1 (84) 71.3 (87)
6th Grade Math 2442 31.2 29.3 (1194)
33.0 (1248)
18.3 (649) 23.8 (656) 25.1 (275) 24.1 (307) 64.7 (215) 68.8 (221) 41.8 (55) 46.9 (64)
7th Grade Math 2408 31.6 28.2 (1233)
35.1 (1175)
16.9 (661) 24.9 (614) 22.7 (295) 26.9 (309) 64.6 (206) 70.6 (197) 50.7 (71) 67.3 (55)
8th Grade Math 2429 28.4 27.4 (1291)
29.5 (1138)
17.6 (670) 19.5 (645) 19.7 (319) 28.7 (251) 59.7 (231) 59.6 (178) 49.3 (71) 50.0 (64)
Grades 3-5 Math 7308 46.1 45.2 (3659)
47.0 (3649)
32.2 (1664) 36.3 (1739) 40.0 (1033)
41.0 (1012)
76.8 (720) 77.2 (672) 62.8 (242) 65.9 (226)
Grades 6-8 Math 7279 30.4 28.3 (3718)
32.6 (3561)
17.6 (1980) 22.7 (1915) 22.4 (889) 26.4 (867) 62.9 (652) 66.6 (596) 47.7 (197) 54.1 (183)
Math 3-8 14587 38.3 36.7 (7377)
39.9 (7210)
24.3 (3644) 29.2 (3654) 31.8 (1922)
34.3 (1879)
70.2 (1372) 72.2 (1268) 56.0 (439) 60.6 (409)
MClass KI MOY 3029 43.9 40.7 (1607)
47.6 (1422)
40.2 (692) 46.2 (610) 25.2 (497) 31.1 (424) 62.1 (322) 73.7 (297) 53.1 (96) 48.4 (91)
3rd Grade Reading 2551 48.8 45.6 (1286)
52.0 (1265)
34.5 (565) 44.8 (585) 34.5 (388) 41.0 (378) 81.3 (257) 83.2 (226) 63.2 (76) 69.7 (76)
4th Grade Reading 2231 42.0 37.8 (1148)
46.4 (1083)
28.4 (510) 38.4 (531) 23.0 (330) 32.6 (288) 76.1 (226) 83.1 (201) 50.0 (82) 60.3 (63)
5th Grade Reading 2523 42.6 39.5 (1224)
45.6 (1299)
29.8 (590) 38.3 (622) 26.3 (312) 33.6 (345) 71.4 (238) 74.7 (245) 66.7 (84) 63.2 (87)
6th Grade Reading 2446 43.4 40.4 (1198)
46.3 (1248)
30.2 (653) 39.5 (656) 35.6 (275) 30.3 (307) 75.8 (215) 82.8 (221) 47.3 (55) 67.2 (64)
7th Grade Reading 2405 43.2 39.0 (1234)
47.6 (1171)
29.3 (662) 38.8 (611) 34.0 (294) 36.2 (309) 73.3 (206) 83.2 (196) 50.0 (72) 81.8 (55)
8th Grade Reading 2427 39.9 35.1 (1289)
45.4 (1138)
26.9 (669) 36.0 (645) 25.9 (317) 41.4 (251) 66.7 (231) 74.7 (178) 50.0 (72) 75.0 (64)
Grades 3-5 Reading
7305 44.6 41.1 (3658)
48.1 (3647)
31.0 (1665) 40.5 (1738) 28.3 (1030)
36.1 (1011)
76.4 (721) 80.1 (672) 59.9 (242) 64.6 (226)
Grades 6-8 Reading
7278 42.2 38.1 (3721)
46.4 (3557)
28.8 (1984) 38.1 (1912) 31.6 (886) 35.6 (867) 71.8 (652) 80.5 (595) 49.2 (199) 74.3 (183)
Reading 3-8 14583 43.4 39.6 (7379)
47.3 (7204)
29.8 (3649) 39.2 (3650) 29.9 (1916)
35.9 (1878)
74.2 (1373) 80.3 (1267) 55.1 (441) 68.9 (409)
5 and 8 Science 4939 56.4 56.0 (2502)
56.8 (2437)
45.9 (1250) 47.4 (1267) 52.2 (628) 53.7 (596) 81.2 (469) 83.0 (423) 76.8 (155) 74.2 (151)
Math I 2972 49.0 48.9 (1502)
49.0 (1470)
36.9 (773) 40.9 (788) 41.7 (321) 40.4 (327) 76.3 (317) 79.2 (265) 81.3 (91) 63.3 (90)
English II 2391 54.8 49.8 (1175)
59.6 (1216)
40.7 (673) 55.0 (703) 43.7 (215) 45.7 (243) 79.6 (221) 86.9 (199) 62.1 (66) 76.1 (71)
Biology 1985 42.4 42.7 (992) 42.1 (993) 27.2 (545) 31.9 (564) 41.0 (161) 31.5 (181) 75.3 (227) 77.7 (188) 66.1 (59) 58.3 (60)
ACT Composite 2065 49.8 45.3 (1001)
54.1 (1064)
31.1 (566) 43.4 (603) 39.9 (153) 43.0 (186) 79.8 (218) 88.9 (217) 65.6 (64) 70.7 (58)
Math Course Rigor 2006 94.9 93.4 (915) 96.1 (1091)
91.6 (452) 96.4 (632) 93.5 (153) 89.5 (162) 95.9 (244) 98.7 (238) 97.0 (66) 100.0 (59)
WorkKeys 418 69.6 73.7 (224) 64.9 (194) 58.5 (94) 56.8 (125) 63.4 (41) 73.1 (26) 94.6 (74) 90.0 (30) 93.3 (15) 69.2 (13)
Grad Cohort 4yr 2362 81.5 75.8 (1136)
86.9 (1226)
69.8 (602) 86.6 (711) 67.5 (197) 77.0 (196) 92.4 (264) 93.1 (261) 87.7 (73) 94.8 (58)
RG01 - Academic Achievement by Ethnicity and Gender 11/18/2016 1:29:06 PM Page 1
Academic Achievement by Ethnicity and Gender 2014Student Proficiency given Number Tested within Ethnic-Gender Group
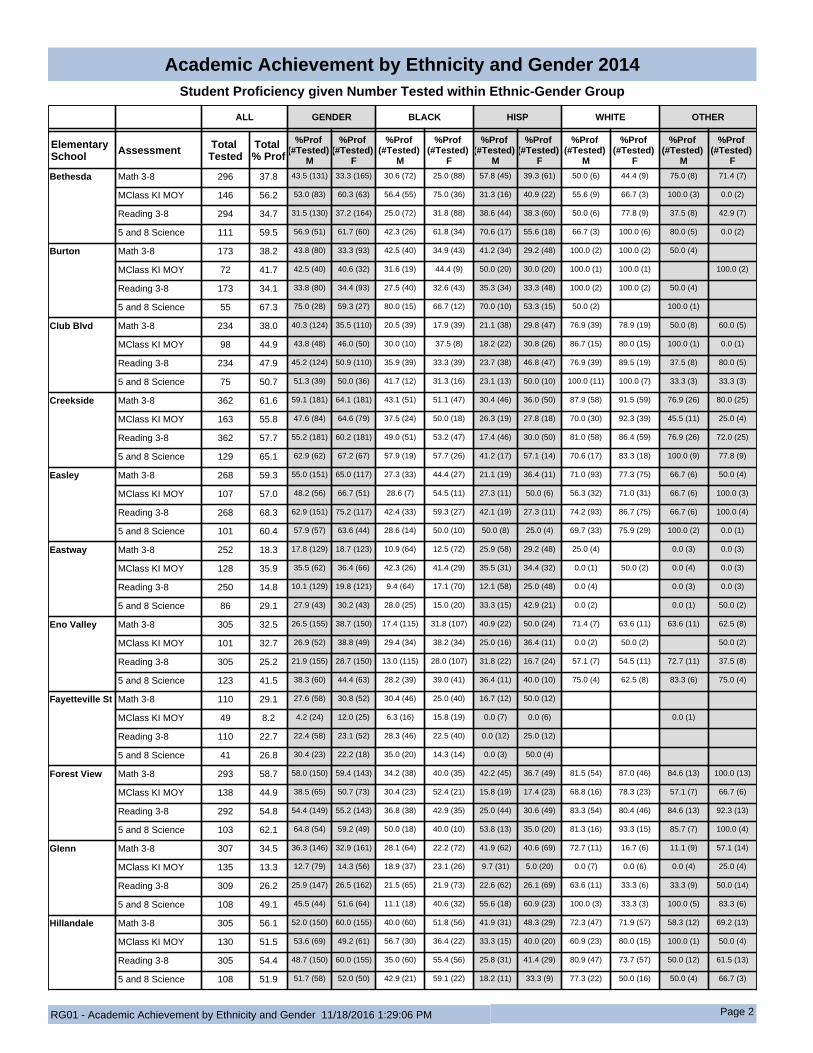
ALL GENDER BLACK HISP WHITE OTHER
Elementary School Assessment Total
TestedTotal % Prof
%Prof (#Tested)
M
%Prof (#Tested)
F
%Prof (#Tested)
M
%Prof (#Tested)
F
%Prof (#Tested)
M
%Prof (#Tested)
F
%Prof (#Tested)
M
%Prof (#Tested)
F
%Prof (#Tested)
M
%Prof (#Tested)
F
Bethesda Math 3-8 296 37.8 43.5 (131) 33.3 (165) 30.6 (72) 25.0 (88) 57.8 (45) 39.3 (61) 50.0 (6) 44.4 (9) 75.0 (8) 71.4 (7)
MClass KI MOY 146 56.2 53.0 (83) 60.3 (63) 56.4 (55) 75.0 (36) 31.3 (16) 40.9 (22) 55.6 (9) 66.7 (3) 100.0 (3) 0.0 (2)
Reading 3-8 294 34.7 31.5 (130) 37.2 (164) 25.0 (72) 31.8 (88) 38.6 (44) 38.3 (60) 50.0 (6) 77.8 (9) 37.5 (8) 42.9 (7)
5 and 8 Science 111 59.5 56.9 (51) 61.7 (60) 42.3 (26) 61.8 (34) 70.6 (17) 55.6 (18) 66.7 (3) 100.0 (6) 80.0 (5) 0.0 (2)
Burton Math 3-8 173 38.2 43.8 (80) 33.3 (93) 42.5 (40) 34.9 (43) 41.2 (34) 29.2 (48) 100.0 (2) 100.0 (2) 50.0 (4)
MClass KI MOY 72 41.7 42.5 (40) 40.6 (32) 31.6 (19) 44.4 (9) 50.0 (20) 30.0 (20) 100.0 (1) 100.0 (1) 100.0 (2)
Reading 3-8 173 34.1 33.8 (80) 34.4 (93) 27.5 (40) 32.6 (43) 35.3 (34) 33.3 (48) 100.0 (2) 100.0 (2) 50.0 (4)
5 and 8 Science 55 67.3 75.0 (28) 59.3 (27) 80.0 (15) 66.7 (12) 70.0 (10) 53.3 (15) 50.0 (2) 100.0 (1)
Club Blvd Math 3-8 234 38.0 40.3 (124) 35.5 (110) 20.5 (39) 17.9 (39) 21.1 (38) 29.8 (47) 76.9 (39) 78.9 (19) 50.0 (8) 60.0 (5)
MClass KI MOY 98 44.9 43.8 (48) 46.0 (50) 30.0 (10) 37.5 (8) 18.2 (22) 30.8 (26) 86.7 (15) 80.0 (15) 100.0 (1) 0.0 (1)
Reading 3-8 234 47.9 45.2 (124) 50.9 (110) 35.9 (39) 33.3 (39) 23.7 (38) 46.8 (47) 76.9 (39) 89.5 (19) 37.5 (8) 80.0 (5)
5 and 8 Science 75 50.7 51.3 (39) 50.0 (36) 41.7 (12) 31.3 (16) 23.1 (13) 50.0 (10) 100.0 (11) 100.0 (7) 33.3 (3) 33.3 (3)
Creekside Math 3-8 362 61.6 59.1 (181) 64.1 (181) 43.1 (51) 51.1 (47) 30.4 (46) 36.0 (50) 87.9 (58) 91.5 (59) 76.9 (26) 80.0 (25)
MClass KI MOY 163 55.8 47.6 (84) 64.6 (79) 37.5 (24) 50.0 (18) 26.3 (19) 27.8 (18) 70.0 (30) 92.3 (39) 45.5 (11) 25.0 (4)
Reading 3-8 362 57.7 55.2 (181) 60.2 (181) 49.0 (51) 53.2 (47) 17.4 (46) 30.0 (50) 81.0 (58) 86.4 (59) 76.9 (26) 72.0 (25)
5 and 8 Science 129 65.1 62.9 (62) 67.2 (67) 57.9 (19) 57.7 (26) 41.2 (17) 57.1 (14) 70.6 (17) 83.3 (18) 100.0 (9) 77.8 (9)
Easley Math 3-8 268 59.3 55.0 (151) 65.0 (117) 27.3 (33) 44.4 (27) 21.1 (19) 36.4 (11) 71.0 (93) 77.3 (75) 66.7 (6) 50.0 (4)
MClass KI MOY 107 57.0 48.2 (56) 66.7 (51) 28.6 (7) 54.5 (11) 27.3 (11) 50.0 (6) 56.3 (32) 71.0 (31) 66.7 (6) 100.0 (3)
Reading 3-8 268 68.3 62.9 (151) 75.2 (117) 42.4 (33) 59.3 (27) 42.1 (19) 27.3 (11) 74.2 (93) 86.7 (75) 66.7 (6) 100.0 (4)
5 and 8 Science 101 60.4 57.9 (57) 63.6 (44) 28.6 (14) 50.0 (10) 50.0 (8) 25.0 (4) 69.7 (33) 75.9 (29) 100.0 (2) 0.0 (1)
Eastway Math 3-8 252 18.3 17.8 (129) 18.7 (123) 10.9 (64) 12.5 (72) 25.9 (58) 29.2 (48) 25.0 (4) 0.0 (3) 0.0 (3)
MClass KI MOY 128 35.9 35.5 (62) 36.4 (66) 42.3 (26) 41.4 (29) 35.5 (31) 34.4 (32) 0.0 (1) 50.0 (2) 0.0 (4) 0.0 (3)
Reading 3-8 250 14.8 10.1 (129) 19.8 (121) 9.4 (64) 17.1 (70) 12.1 (58) 25.0 (48) 0.0 (4) 0.0 (3) 0.0 (3)
5 and 8 Science 86 29.1 27.9 (43) 30.2 (43) 28.0 (25) 15.0 (20) 33.3 (15) 42.9 (21) 0.0 (2) 0.0 (1) 50.0 (2)
Eno Valley Math 3-8 305 32.5 26.5 (155) 38.7 (150) 17.4 (115) 31.8 (107) 40.9 (22) 50.0 (24) 71.4 (7) 63.6 (11) 63.6 (11) 62.5 (8)
MClass KI MOY 101 32.7 26.9 (52) 38.8 (49) 29.4 (34) 38.2 (34) 25.0 (16) 36.4 (11) 0.0 (2) 50.0 (2) 50.0 (2)
Reading 3-8 305 25.2 21.9 (155) 28.7 (150) 13.0 (115) 28.0 (107) 31.8 (22) 16.7 (24) 57.1 (7) 54.5 (11) 72.7 (11) 37.5 (8)
5 and 8 Science 123 41.5 38.3 (60) 44.4 (63) 28.2 (39) 39.0 (41) 36.4 (11) 40.0 (10) 75.0 (4) 62.5 (8) 83.3 (6) 75.0 (4)
Fayetteville St Math 3-8 110 29.1 27.6 (58) 30.8 (52) 30.4 (46) 25.0 (40) 16.7 (12) 50.0 (12)
MClass KI MOY 49 8.2 4.2 (24) 12.0 (25) 6.3 (16) 15.8 (19) 0.0 (7) 0.0 (6) 0.0 (1)
Reading 3-8 110 22.7 22.4 (58) 23.1 (52) 28.3 (46) 22.5 (40) 0.0 (12) 25.0 (12)
5 and 8 Science 41 26.8 30.4 (23) 22.2 (18) 35.0 (20) 14.3 (14) 0.0 (3) 50.0 (4)
Forest View Math 3-8 293 58.7 58.0 (150) 59.4 (143) 34.2 (38) 40.0 (35) 42.2 (45) 36.7 (49) 81.5 (54) 87.0 (46) 84.6 (13) 100.0 (13)
MClass KI MOY 138 44.9 38.5 (65) 50.7 (73) 30.4 (23) 52.4 (21) 15.8 (19) 17.4 (23) 68.8 (16) 78.3 (23) 57.1 (7) 66.7 (6)
Reading 3-8 292 54.8 54.4 (149) 55.2 (143) 36.8 (38) 42.9 (35) 25.0 (44) 30.6 (49) 83.3 (54) 80.4 (46) 84.6 (13) 92.3 (13)
5 and 8 Science 103 62.1 64.8 (54) 59.2 (49) 50.0 (18) 40.0 (10) 53.8 (13) 35.0 (20) 81.3 (16) 93.3 (15) 85.7 (7) 100.0 (4)
Glenn Math 3-8 307 34.5 36.3 (146) 32.9 (161) 28.1 (64) 22.2 (72) 41.9 (62) 40.6 (69) 72.7 (11) 16.7 (6) 11.1 (9) 57.1 (14)
MClass KI MOY 135 13.3 12.7 (79) 14.3 (56) 18.9 (37) 23.1 (26) 9.7 (31) 5.0 (20) 0.0 (7) 0.0 (6) 0.0 (4) 25.0 (4)
Reading 3-8 309 26.2 25.9 (147) 26.5 (162) 21.5 (65) 21.9 (73) 22.6 (62) 26.1 (69) 63.6 (11) 33.3 (6) 33.3 (9) 50.0 (14)
5 and 8 Science 108 49.1 45.5 (44) 51.6 (64) 11.1 (18) 40.6 (32) 55.6 (18) 60.9 (23) 100.0 (3) 33.3 (3) 100.0 (5) 83.3 (6)
Hillandale Math 3-8 305 56.1 52.0 (150) 60.0 (155) 40.0 (60) 51.8 (56) 41.9 (31) 48.3 (29) 72.3 (47) 71.9 (57) 58.3 (12) 69.2 (13)
MClass KI MOY 130 51.5 53.6 (69) 49.2 (61) 56.7 (30) 36.4 (22) 33.3 (15) 40.0 (20) 60.9 (23) 80.0 (15) 100.0 (1) 50.0 (4)
Reading 3-8 305 54.4 48.7 (150) 60.0 (155) 35.0 (60) 55.4 (56) 25.8 (31) 41.4 (29) 80.9 (47) 73.7 (57) 50.0 (12) 61.5 (13)
5 and 8 Science 108 51.9 51.7 (58) 52.0 (50) 42.9 (21) 59.1 (22) 18.2 (11) 33.3 (9) 77.3 (22) 50.0 (16) 50.0 (4) 66.7 (3)
RG01 - Academic Achievement by Ethnicity and Gender 11/18/2016 1:29:06 PM Page 2
Academic Achievement by Ethnicity and Gender 2014Student Proficiency given Number Tested within Ethnic-Gender Group
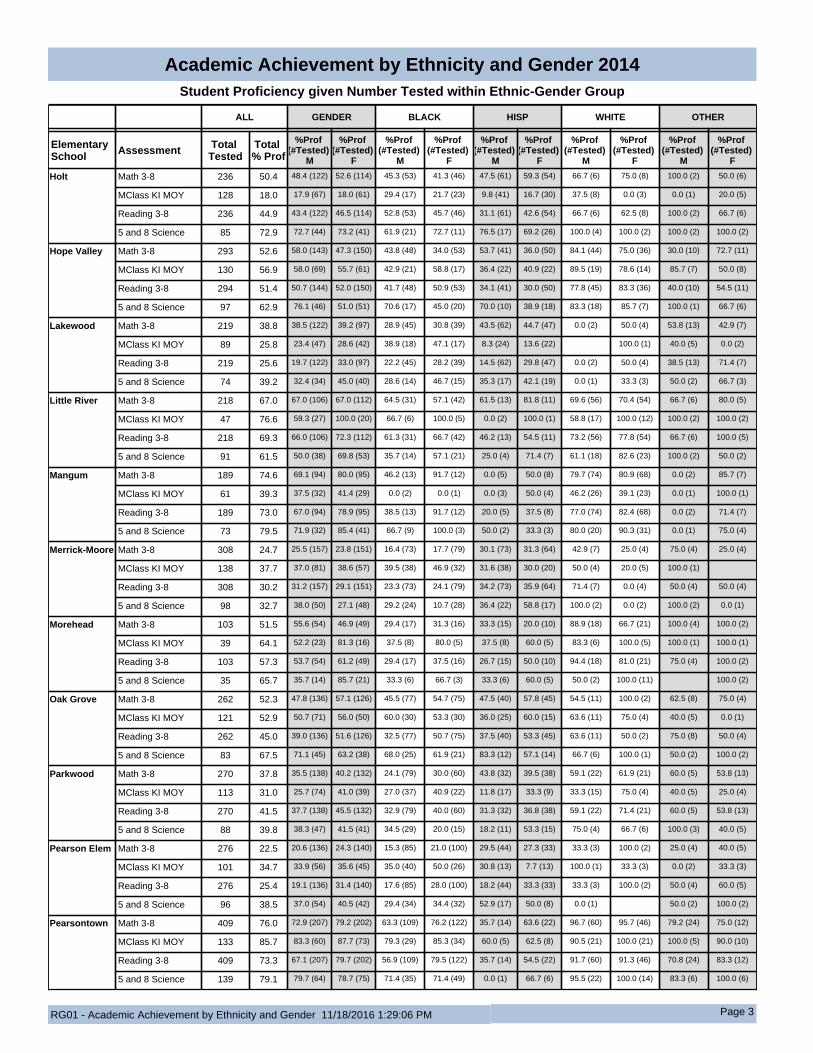
ALL GENDER BLACK HISP WHITE OTHER
Elementary School Assessment Total
TestedTotal % Prof
%Prof (#Tested)
M
%Prof (#Tested)
F
%Prof (#Tested)
M
%Prof (#Tested)
F
%Prof (#Tested)
M
%Prof (#Tested)
F
%Prof (#Tested)
M
%Prof (#Tested)
F
%Prof (#Tested)
M
%Prof (#Tested)
F
Holt Math 3-8 236 50.4 48.4 (122) 52.6 (114) 45.3 (53) 41.3 (46) 47.5 (61) 59.3 (54) 66.7 (6) 75.0 (8) 100.0 (2) 50.0 (6)
MClass KI MOY 128 18.0 17.9 (67) 18.0 (61) 29.4 (17) 21.7 (23) 9.8 (41) 16.7 (30) 37.5 (8) 0.0 (3) 0.0 (1) 20.0 (5)
Reading 3-8 236 44.9 43.4 (122) 46.5 (114) 52.8 (53) 45.7 (46) 31.1 (61) 42.6 (54) 66.7 (6) 62.5 (8) 100.0 (2) 66.7 (6)
5 and 8 Science 85 72.9 72.7 (44) 73.2 (41) 61.9 (21) 72.7 (11) 76.5 (17) 69.2 (26) 100.0 (4) 100.0 (2) 100.0 (2) 100.0 (2)
Hope Valley Math 3-8 293 52.6 58.0 (143) 47.3 (150) 43.8 (48) 34.0 (53) 53.7 (41) 36.0 (50) 84.1 (44) 75.0 (36) 30.0 (10) 72.7 (11)
MClass KI MOY 130 56.9 58.0 (69) 55.7 (61) 42.9 (21) 58.8 (17) 36.4 (22) 40.9 (22) 89.5 (19) 78.6 (14) 85.7 (7) 50.0 (8)
Reading 3-8 294 51.4 50.7 (144) 52.0 (150) 41.7 (48) 50.9 (53) 34.1 (41) 30.0 (50) 77.8 (45) 83.3 (36) 40.0 (10) 54.5 (11)
5 and 8 Science 97 62.9 76.1 (46) 51.0 (51) 70.6 (17) 45.0 (20) 70.0 (10) 38.9 (18) 83.3 (18) 85.7 (7) 100.0 (1) 66.7 (6)
Lakewood Math 3-8 219 38.8 38.5 (122) 39.2 (97) 28.9 (45) 30.8 (39) 43.5 (62) 44.7 (47) 0.0 (2) 50.0 (4) 53.8 (13) 42.9 (7)
MClass KI MOY 89 25.8 23.4 (47) 28.6 (42) 38.9 (18) 47.1 (17) 8.3 (24) 13.6 (22) 100.0 (1) 40.0 (5) 0.0 (2)
Reading 3-8 219 25.6 19.7 (122) 33.0 (97) 22.2 (45) 28.2 (39) 14.5 (62) 29.8 (47) 0.0 (2) 50.0 (4) 38.5 (13) 71.4 (7)
5 and 8 Science 74 39.2 32.4 (34) 45.0 (40) 28.6 (14) 46.7 (15) 35.3 (17) 42.1 (19) 0.0 (1) 33.3 (3) 50.0 (2) 66.7 (3)
Little River Math 3-8 218 67.0 67.0 (106) 67.0 (112) 64.5 (31) 57.1 (42) 61.5 (13) 81.8 (11) 69.6 (56) 70.4 (54) 66.7 (6) 80.0 (5)
MClass KI MOY 47 76.6 59.3 (27) 100.0 (20) 66.7 (6) 100.0 (5) 0.0 (2) 100.0 (1) 58.8 (17) 100.0 (12) 100.0 (2) 100.0 (2)
Reading 3-8 218 69.3 66.0 (106) 72.3 (112) 61.3 (31) 66.7 (42) 46.2 (13) 54.5 (11) 73.2 (56) 77.8 (54) 66.7 (6) 100.0 (5)
5 and 8 Science 91 61.5 50.0 (38) 69.8 (53) 35.7 (14) 57.1 (21) 25.0 (4) 71.4 (7) 61.1 (18) 82.6 (23) 100.0 (2) 50.0 (2)
Mangum Math 3-8 189 74.6 69.1 (94) 80.0 (95) 46.2 (13) 91.7 (12) 0.0 (5) 50.0 (8) 79.7 (74) 80.9 (68) 0.0 (2) 85.7 (7)
MClass KI MOY 61 39.3 37.5 (32) 41.4 (29) 0.0 (2) 0.0 (1) 0.0 (3) 50.0 (4) 46.2 (26) 39.1 (23) 0.0 (1) 100.0 (1)
Reading 3-8 189 73.0 67.0 (94) 78.9 (95) 38.5 (13) 91.7 (12) 20.0 (5) 37.5 (8) 77.0 (74) 82.4 (68) 0.0 (2) 71.4 (7)
5 and 8 Science 73 79.5 71.9 (32) 85.4 (41) 66.7 (9) 100.0 (3) 50.0 (2) 33.3 (3) 80.0 (20) 90.3 (31) 0.0 (1) 75.0 (4)
Merrick-Moore Math 3-8 308 24.7 25.5 (157) 23.8 (151) 16.4 (73) 17.7 (79) 30.1 (73) 31.3 (64) 42.9 (7) 25.0 (4) 75.0 (4) 25.0 (4)
MClass KI MOY 138 37.7 37.0 (81) 38.6 (57) 39.5 (38) 46.9 (32) 31.6 (38) 30.0 (20) 50.0 (4) 20.0 (5) 100.0 (1)
Reading 3-8 308 30.2 31.2 (157) 29.1 (151) 23.3 (73) 24.1 (79) 34.2 (73) 35.9 (64) 71.4 (7) 0.0 (4) 50.0 (4) 50.0 (4)
5 and 8 Science 98 32.7 38.0 (50) 27.1 (48) 29.2 (24) 10.7 (28) 36.4 (22) 58.8 (17) 100.0 (2) 0.0 (2) 100.0 (2) 0.0 (1)
Morehead Math 3-8 103 51.5 55.6 (54) 46.9 (49) 29.4 (17) 31.3 (16) 33.3 (15) 20.0 (10) 88.9 (18) 66.7 (21) 100.0 (4) 100.0 (2)
MClass KI MOY 39 64.1 52.2 (23) 81.3 (16) 37.5 (8) 80.0 (5) 37.5 (8) 60.0 (5) 83.3 (6) 100.0 (5) 100.0 (1) 100.0 (1)
Reading 3-8 103 57.3 53.7 (54) 61.2 (49) 29.4 (17) 37.5 (16) 26.7 (15) 50.0 (10) 94.4 (18) 81.0 (21) 75.0 (4) 100.0 (2)
5 and 8 Science 35 65.7 35.7 (14) 85.7 (21) 33.3 (6) 66.7 (3) 33.3 (6) 60.0 (5) 50.0 (2) 100.0 (11) 100.0 (2)
Oak Grove Math 3-8 262 52.3 47.8 (136) 57.1 (126) 45.5 (77) 54.7 (75) 47.5 (40) 57.8 (45) 54.5 (11) 100.0 (2) 62.5 (8) 75.0 (4)
MClass KI MOY 121 52.9 50.7 (71) 56.0 (50) 60.0 (30) 53.3 (30) 36.0 (25) 60.0 (15) 63.6 (11) 75.0 (4) 40.0 (5) 0.0 (1)
Reading 3-8 262 45.0 39.0 (136) 51.6 (126) 32.5 (77) 50.7 (75) 37.5 (40) 53.3 (45) 63.6 (11) 50.0 (2) 75.0 (8) 50.0 (4)
5 and 8 Science 83 67.5 71.1 (45) 63.2 (38) 68.0 (25) 61.9 (21) 83.3 (12) 57.1 (14) 66.7 (6) 100.0 (1) 50.0 (2) 100.0 (2)
Parkwood Math 3-8 270 37.8 35.5 (138) 40.2 (132) 24.1 (79) 30.0 (60) 43.8 (32) 39.5 (38) 59.1 (22) 61.9 (21) 60.0 (5) 53.8 (13)
MClass KI MOY 113 31.0 25.7 (74) 41.0 (39) 27.0 (37) 40.9 (22) 11.8 (17) 33.3 (9) 33.3 (15) 75.0 (4) 40.0 (5) 25.0 (4)
Reading 3-8 270 41.5 37.7 (138) 45.5 (132) 32.9 (79) 40.0 (60) 31.3 (32) 36.8 (38) 59.1 (22) 71.4 (21) 60.0 (5) 53.8 (13)
5 and 8 Science 88 39.8 38.3 (47) 41.5 (41) 34.5 (29) 20.0 (15) 18.2 (11) 53.3 (15) 75.0 (4) 66.7 (6) 100.0 (3) 40.0 (5)
Pearson Elem Math 3-8 276 22.5 20.6 (136) 24.3 (140) 15.3 (85) 21.0 (100) 29.5 (44) 27.3 (33) 33.3 (3) 100.0 (2) 25.0 (4) 40.0 (5)
MClass KI MOY 101 34.7 33.9 (56) 35.6 (45) 35.0 (40) 50.0 (26) 30.8 (13) 7.7 (13) 100.0 (1) 33.3 (3) 0.0 (2) 33.3 (3)
Reading 3-8 276 25.4 19.1 (136) 31.4 (140) 17.6 (85) 28.0 (100) 18.2 (44) 33.3 (33) 33.3 (3) 100.0 (2) 50.0 (4) 60.0 (5)
5 and 8 Science 96 38.5 37.0 (54) 40.5 (42) 29.4 (34) 34.4 (32) 52.9 (17) 50.0 (8) 0.0 (1) 50.0 (2) 100.0 (2)
Pearsontown Math 3-8 409 76.0 72.9 (207) 79.2 (202) 63.3 (109) 76.2 (122) 35.7 (14) 63.6 (22) 96.7 (60) 95.7 (46) 79.2 (24) 75.0 (12)
MClass KI MOY 133 85.7 83.3 (60) 87.7 (73) 79.3 (29) 85.3 (34) 60.0 (5) 62.5 (8) 90.5 (21) 100.0 (21) 100.0 (5) 90.0 (10)
Reading 3-8 409 73.3 67.1 (207) 79.7 (202) 56.9 (109) 79.5 (122) 35.7 (14) 54.5 (22) 91.7 (60) 91.3 (46) 70.8 (24) 83.3 (12)
5 and 8 Science 139 79.1 79.7 (64) 78.7 (75) 71.4 (35) 71.4 (49) 0.0 (1) 66.7 (6) 95.5 (22) 100.0 (14) 83.3 (6) 100.0 (6)
RG01 - Academic Achievement by Ethnicity and Gender 11/18/2016 1:29:06 PM Page 3
Academic Achievement by Ethnicity and Gender 2014Student Proficiency given Number Tested within Ethnic-Gender Group
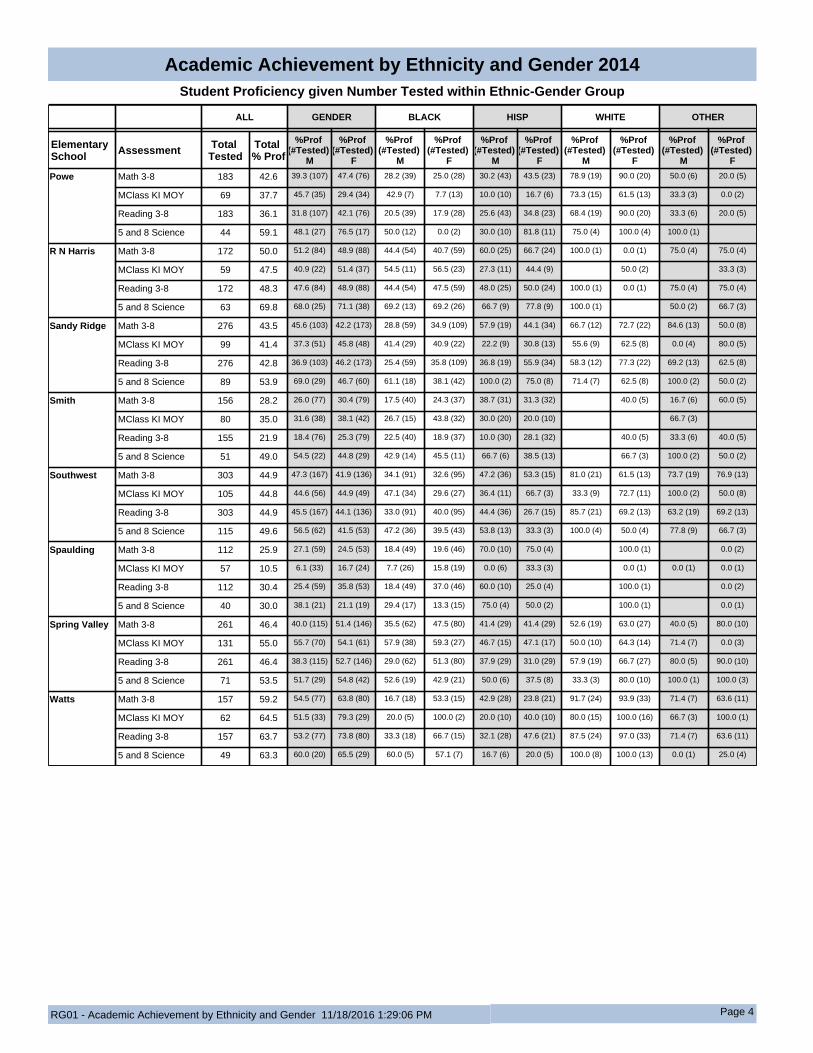
ALL GENDER BLACK HISP WHITE OTHER
Elementary School Assessment Total
TestedTotal % Prof
%Prof (#Tested)
M
%Prof (#Tested)
F
%Prof (#Tested)
M
%Prof (#Tested)
F
%Prof (#Tested)
M
%Prof (#Tested)
F
%Prof (#Tested)
M
%Prof (#Tested)
F
%Prof (#Tested)
M
%Prof (#Tested)
F
Powe Math 3-8 183 42.6 39.3 (107) 47.4 (76) 28.2 (39) 25.0 (28) 30.2 (43) 43.5 (23) 78.9 (19) 90.0 (20) 50.0 (6) 20.0 (5)
MClass KI MOY 69 37.7 45.7 (35) 29.4 (34) 42.9 (7) 7.7 (13) 10.0 (10) 16.7 (6) 73.3 (15) 61.5 (13) 33.3 (3) 0.0 (2)
Reading 3-8 183 36.1 31.8 (107) 42.1 (76) 20.5 (39) 17.9 (28) 25.6 (43) 34.8 (23) 68.4 (19) 90.0 (20) 33.3 (6) 20.0 (5)
5 and 8 Science 44 59.1 48.1 (27) 76.5 (17) 50.0 (12) 0.0 (2) 30.0 (10) 81.8 (11) 75.0 (4) 100.0 (4) 100.0 (1)
R N Harris Math 3-8 172 50.0 51.2 (84) 48.9 (88) 44.4 (54) 40.7 (59) 60.0 (25) 66.7 (24) 100.0 (1) 0.0 (1) 75.0 (4) 75.0 (4)
MClass KI MOY 59 47.5 40.9 (22) 51.4 (37) 54.5 (11) 56.5 (23) 27.3 (11) 44.4 (9) 50.0 (2) 33.3 (3)
Reading 3-8 172 48.3 47.6 (84) 48.9 (88) 44.4 (54) 47.5 (59) 48.0 (25) 50.0 (24) 100.0 (1) 0.0 (1) 75.0 (4) 75.0 (4)
5 and 8 Science 63 69.8 68.0 (25) 71.1 (38) 69.2 (13) 69.2 (26) 66.7 (9) 77.8 (9) 100.0 (1) 50.0 (2) 66.7 (3)
Sandy Ridge Math 3-8 276 43.5 45.6 (103) 42.2 (173) 28.8 (59) 34.9 (109) 57.9 (19) 44.1 (34) 66.7 (12) 72.7 (22) 84.6 (13) 50.0 (8)
MClass KI MOY 99 41.4 37.3 (51) 45.8 (48) 41.4 (29) 40.9 (22) 22.2 (9) 30.8 (13) 55.6 (9) 62.5 (8) 0.0 (4) 80.0 (5)
Reading 3-8 276 42.8 36.9 (103) 46.2 (173) 25.4 (59) 35.8 (109) 36.8 (19) 55.9 (34) 58.3 (12) 77.3 (22) 69.2 (13) 62.5 (8)
5 and 8 Science 89 53.9 69.0 (29) 46.7 (60) 61.1 (18) 38.1 (42) 100.0 (2) 75.0 (8) 71.4 (7) 62.5 (8) 100.0 (2) 50.0 (2)
Smith Math 3-8 156 28.2 26.0 (77) 30.4 (79) 17.5 (40) 24.3 (37) 38.7 (31) 31.3 (32) 40.0 (5) 16.7 (6) 60.0 (5)
MClass KI MOY 80 35.0 31.6 (38) 38.1 (42) 26.7 (15) 43.8 (32) 30.0 (20) 20.0 (10) 66.7 (3)
Reading 3-8 155 21.9 18.4 (76) 25.3 (79) 22.5 (40) 18.9 (37) 10.0 (30) 28.1 (32) 40.0 (5) 33.3 (6) 40.0 (5)
5 and 8 Science 51 49.0 54.5 (22) 44.8 (29) 42.9 (14) 45.5 (11) 66.7 (6) 38.5 (13) 66.7 (3) 100.0 (2) 50.0 (2)
Southwest Math 3-8 303 44.9 47.3 (167) 41.9 (136) 34.1 (91) 32.6 (95) 47.2 (36) 53.3 (15) 81.0 (21) 61.5 (13) 73.7 (19) 76.9 (13)
MClass KI MOY 105 44.8 44.6 (56) 44.9 (49) 47.1 (34) 29.6 (27) 36.4 (11) 66.7 (3) 33.3 (9) 72.7 (11) 100.0 (2) 50.0 (8)
Reading 3-8 303 44.9 45.5 (167) 44.1 (136) 33.0 (91) 40.0 (95) 44.4 (36) 26.7 (15) 85.7 (21) 69.2 (13) 63.2 (19) 69.2 (13)
5 and 8 Science 115 49.6 56.5 (62) 41.5 (53) 47.2 (36) 39.5 (43) 53.8 (13) 33.3 (3) 100.0 (4) 50.0 (4) 77.8 (9) 66.7 (3)
Spaulding Math 3-8 112 25.9 27.1 (59) 24.5 (53) 18.4 (49) 19.6 (46) 70.0 (10) 75.0 (4) 100.0 (1) 0.0 (2)
MClass KI MOY 57 10.5 6.1 (33) 16.7 (24) 7.7 (26) 15.8 (19) 0.0 (6) 33.3 (3) 0.0 (1) 0.0 (1) 0.0 (1)
Reading 3-8 112 30.4 25.4 (59) 35.8 (53) 18.4 (49) 37.0 (46) 60.0 (10) 25.0 (4) 100.0 (1) 0.0 (2)
5 and 8 Science 40 30.0 38.1 (21) 21.1 (19) 29.4 (17) 13.3 (15) 75.0 (4) 50.0 (2) 100.0 (1) 0.0 (1)
Spring Valley Math 3-8 261 46.4 40.0 (115) 51.4 (146) 35.5 (62) 47.5 (80) 41.4 (29) 41.4 (29) 52.6 (19) 63.0 (27) 40.0 (5) 80.0 (10)
MClass KI MOY 131 55.0 55.7 (70) 54.1 (61) 57.9 (38) 59.3 (27) 46.7 (15) 47.1 (17) 50.0 (10) 64.3 (14) 71.4 (7) 0.0 (3)
Reading 3-8 261 46.4 38.3 (115) 52.7 (146) 29.0 (62) 51.3 (80) 37.9 (29) 31.0 (29) 57.9 (19) 66.7 (27) 80.0 (5) 90.0 (10)
5 and 8 Science 71 53.5 51.7 (29) 54.8 (42) 52.6 (19) 42.9 (21) 50.0 (6) 37.5 (8) 33.3 (3) 80.0 (10) 100.0 (1) 100.0 (3)
Watts Math 3-8 157 59.2 54.5 (77) 63.8 (80) 16.7 (18) 53.3 (15) 42.9 (28) 23.8 (21) 91.7 (24) 93.9 (33) 71.4 (7) 63.6 (11)
MClass KI MOY 62 64.5 51.5 (33) 79.3 (29) 20.0 (5) 100.0 (2) 20.0 (10) 40.0 (10) 80.0 (15) 100.0 (16) 66.7 (3) 100.0 (1)
Reading 3-8 157 63.7 53.2 (77) 73.8 (80) 33.3 (18) 66.7 (15) 32.1 (28) 47.6 (21) 87.5 (24) 97.0 (33) 71.4 (7) 63.6 (11)
5 and 8 Science 49 63.3 60.0 (20) 65.5 (29) 60.0 (5) 57.1 (7) 16.7 (6) 20.0 (5) 100.0 (8) 100.0 (13) 0.0 (1) 25.0 (4)
RG01 - Academic Achievement by Ethnicity and Gender 11/18/2016 1:29:06 PM Page 4
Academic Achievement by Ethnicity and Gender 2014Student Proficiency given Number Tested within Ethnic-Gender Group

ALL GENDER BLACK HISP WHITE OTHER
Middle School Assessment Total
TestedTotal % Prof
%Prof (#Tested)
M
%Prof (#Tested)
F
%Prof (#Tested)
M
%Prof (#Tested)
F
%Prof (#Tested)
M
%Prof (#Tested)
F
%Prof (#Tested)
M
%Prof (#Tested)
F
%Prof (#Tested)
M
%Prof (#Tested)
F
Brogden Math 3-8 665 23.8 23.2 (328) 24.3 (337) 12.5 (152) 14.0 (178) 16.3 (98) 21.6 (97) 58.6 (58) 68.3 (41) 35.0 (20) 38.1 (21)
Reading 3-8 661 36.2 33.8 (325) 38.4 (336) 22.0 (150) 27.0 (178) 27.8 (97) 34.4 (96) 67.2 (58) 87.8 (41) 55.0 (20) 57.1 (21)
5 and 8 Science 246 53.7 53.5 (127) 53.8 (119) 37.1 (62) 44.4 (63) 60.6 (33) 43.3 (30) 76.9 (26) 88.2 (17) 83.3 (6) 88.9 (9)
Math I 29 93.1 93.8 (16) 92.3 (13) 100.0 (5) 66.7 (3) 100.0 (2) 100.0 (3) 85.7 (7) 100.0 (5) 100.0 (2) 100.0 (2)
Carrington Math 3-8 1115 33.2 32.2 (600) 34.4 (515) 19.2 (308) 19.5 (272) 30.3 (99) 32.0 (97) 56.9 (144) 63.9 (122) 44.9 (49) 62.5 (24)
Reading 3-8 1113 41.1 38.6 (598) 43.9 (515) 26.3 (308) 29.7 (273) 36.7 (98) 37.1 (97) 61.1 (144) 73.6 (121) 54.2 (48) 83.3 (24)
5 and 8 Science 405 67.7 69.7 (211) 65.5 (194) 55.2 (96) 51.0 (102) 82.8 (29) 65.5 (29) 83.3 (66) 90.2 (51) 75.0 (20) 83.3 (12)
Math I 109 91.7 93.2 (59) 90.0 (50) 94.4 (18) 91.7 (12) 87.5 (8) 90.0 (10) 92.0 (25) 95.2 (21) 100.0 (8) 71.4 (7)
Githens Math 3-8 959 24.1 24.5 (482) 23.7 (477) 11.0 (236) 7.2 (221) 11.3 (115) 18.8 (133) 70.8 (96) 65.9 (85) 31.4 (35) 42.1 (38)
Reading 3-8 960 38.2 34.5 (484) 42.0 (476) 21.0 (238) 30.1 (219) 24.8 (113) 27.6 (134) 81.3 (96) 82.4 (85) 29.7 (37) 71.1 (38)
5 and 8 Science 319 52.0 50.9 (165) 53.2 (154) 37.7 (77) 44.2 (77) 41.5 (41) 28.1 (32) 91.2 (34) 92.9 (28) 53.8 (13) 76.5 (17)
Math I 100 83.0 84.9 (53) 80.9 (47) 83.3 (12) 55.6 (9) 63.6 (11) 85.7 (7) 95.8 (24) 87.5 (24) 83.3 (6) 85.7 (7)
Lakewood Middle
Math 3-8 278 37.4 35.2 (142) 39.7 (136) 24.1 (54) 20.0 (40) 10.0 (40) 8.9 (45) 70.0 (40) 80.0 (40) 62.5 (8) 90.9 (11)
Reading 3-8 278 57.9 54.9 (142) 61.0 (136) 51.9 (54) 47.5 (40) 25.0 (40) 28.9 (45) 90.0 (40) 100.0 (40) 50.0 (8) 100.0 (11)
5 and 8 Science 87 67.8 70.8 (48) 64.1 (39) 68.2 (22) 60.0 (15) 46.2 (13) 42.9 (14) 100.0 (11) 100.0 (9) 100.0 (2) 100.0 (1)
Math I 34 91.2 91.7 (24) 90.0 (10) 100.0 (7) 100.0 (1) 100.0 (1) 50.0 (2) 84.6 (13) 100.0 (6) 100.0 (3) 100.0 (1)
Lowe's Grove Math 3-8 679 16.5 14.5 (380) 19.1 (299) 8.0 (251) 16.5 (218) 23.5 (85) 20.0 (55) 39.3 (28) 44.4 (18) 25.0 (16) 25.0 (8)
Reading 3-8 680 29.3 25.1 (382) 34.6 (298) 20.2 (253) 33.6 (217) 30.6 (85) 27.3 (55) 60.7 (28) 66.7 (18) 12.5 (16) 37.5 (8)
5 and 8 Science 197 43.1 43.1 (123) 43.2 (74) 34.6 (81) 36.2 (58) 59.3 (27) 70.0 (10) 70.0 (10) 66.7 (3) 40.0 (5) 66.7 (3)
Math I 27 66.7 58.8 (17) 80.0 (10) 50.0 (8) 75.0 (4) 100.0 (4) 100.0 (3) 50.0 (4) 50.0 (2) 0.0 (1) 100.0 (1)
Lucas Math 3-8 615 30.7 27.2 (298) 34.1 (317) 22.8 (145) 21.4 (140) 19.4 (67) 24.6 (65) 40.8 (71) 58.8 (97) 40.0 (15) 33.3 (15)
Reading 3-8 615 44.4 37.6 (298) 50.8 (317) 31.7 (145) 40.7 (140) 29.9 (67) 36.9 (65) 53.5 (71) 75.3 (97) 53.3 (15) 46.7 (15)
5 and 8 Science 156 57.7 50.0 (86) 67.1 (70) 43.6 (39) 61.8 (34) 26.3 (19) 75.0 (12) 77.3 (22) 66.7 (21) 66.7 (6) 100.0 (3)
Math I 25 92.0 88.9 (9) 93.8 (16) 80.0 (5) 100.0 (3) 100.0 (1) 100.0 (2) 90.0 (10) 100.0 (2) 100.0 (2)
Neal Math 3-8 866 17.7 18.3 (460) 17.0 (406) 12.2 (263) 17.1 (246) 22.5 (169) 15.9 (126) 57.1 (21) 19.2 (26) 28.6 (7) 25.0 (8)
Reading 3-8 867 28.4 27.3 (461) 29.6 (406) 23.9 (264) 26.4 (246) 29.6 (169) 31.7 (126) 52.4 (21) 42.3 (26) 28.6 (7) 50.0 (8)
5 and 8 Science 309 44.3 45.9 (157) 42.8 (152) 40.2 (87) 37.9 (95) 49.2 (63) 51.3 (39) 80.0 (5) 50.0 (14) 100.0 (2) 50.0 (4)
Math I 30 80.0 95.0 (20) 50.0 (10) 85.7 (7) 42.9 (7) 100.0 (9) 50.0 (2) 100.0 (3) 100.0 (1) 100.0 (1)
Rogers-Herr Math 3-8 627 50.1 46.9 (311) 53.2 (316) 39.4 (170) 50.8 (185) 30.9 (68) 33.9 (62) 77.6 (58) 80.0 (45) 86.7 (15) 70.8 (24)
Reading 3-8 627 61.7 57.2 (311) 66.1 (316) 53.5 (170) 67.6 (185) 32.4 (68) 37.1 (62) 91.4 (58) 88.9 (45) 80.0 (15) 87.5 (24)
5 and 8 Science 205 74.1 73.7 (114) 74.7 (91) 71.6 (67) 73.1 (52) 58.3 (24) 63.6 (22) 95.0 (20) 90.9 (11) 100.0 (3) 100.0 (6)
Math I 91 95.6 94.3 (53) 97.4 (38) 92.3 (26) 100.0 (21) 83.3 (6) 100.0 (5) 100.0 (18) 87.5 (8) 100.0 (3) 100.0 (4)
Shepard Math 3-8 519 22.5 19.3 (270) 26.1 (249) 17.1 (210) 19.2 (182) 20.0 (55) 42.4 (59) 100.0 (3) 50.0 (2) 100.0 (2) 66.7 (6)
Reading 3-8 519 36.0 31.1 (270) 41.4 (249) 29.0 (210) 35.7 (182) 34.5 (55) 52.5 (59) 66.7 (3) 100.0 (2) 100.0 (2) 83.3 (6)
5 and 8 Science 170 43.5 46.7 (92) 39.7 (78) 41.2 (68) 35.8 (67) 60.9 (23) 55.6 (9) 100.0 (1) 100.0 (1) 100.0 (1)
Math I 28 71.4 91.7 (12) 56.3 (16) 88.9 (9) 61.5 (13) 100.0 (2) 33.3 (3) 100.0 (1)
RG01 - Academic Achievement by Ethnicity and Gender 11/18/2016 1:29:06 PM Page 5
Academic Achievement by Ethnicity and Gender 2014Student Proficiency given Number Tested within Ethnic-Gender Group
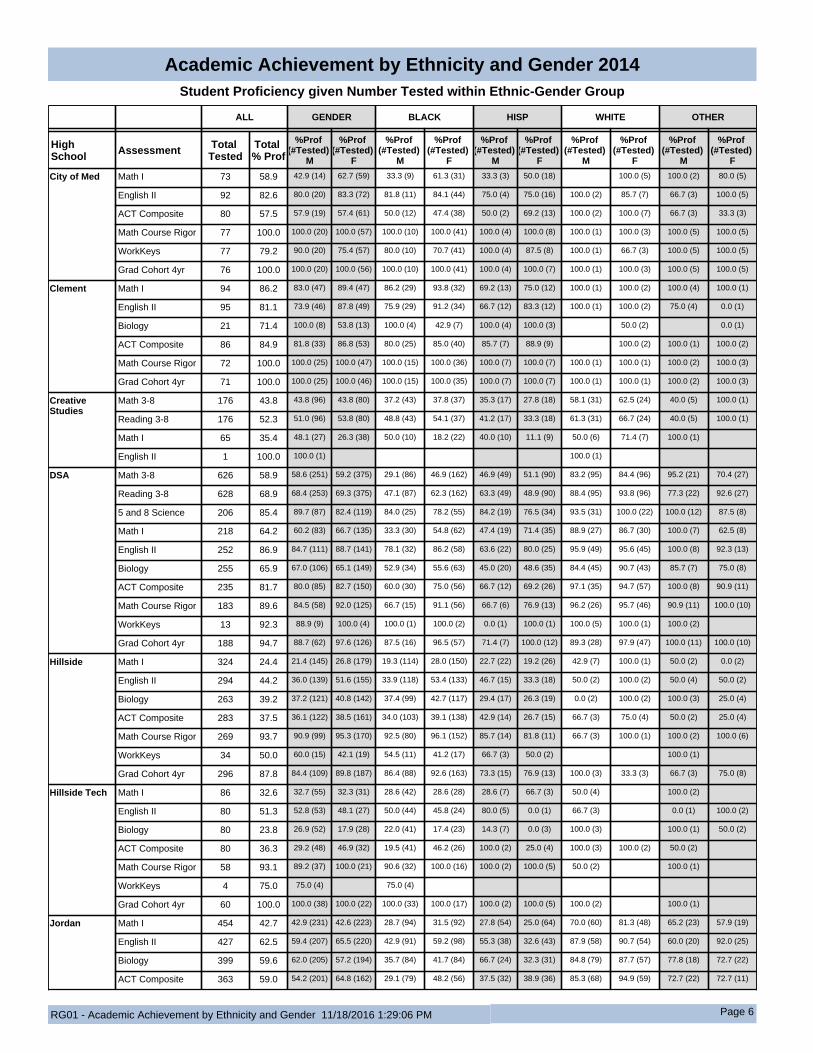
ALL GENDER BLACK HISP WHITE OTHER
High School Assessment Total
TestedTotal % Prof
%Prof (#Tested)
M
%Prof (#Tested)
F
%Prof (#Tested)
M
%Prof (#Tested)
F
%Prof (#Tested)
M
%Prof (#Tested)
F
%Prof (#Tested)
M
%Prof (#Tested)
F
%Prof (#Tested)
M
%Prof (#Tested)
F
City of Med Math I 73 58.9 42.9 (14) 62.7 (59) 33.3 (9) 61.3 (31) 33.3 (3) 50.0 (18) 100.0 (5) 100.0 (2) 80.0 (5)
English II 92 82.6 80.0 (20) 83.3 (72) 81.8 (11) 84.1 (44) 75.0 (4) 75.0 (16) 100.0 (2) 85.7 (7) 66.7 (3) 100.0 (5)
ACT Composite 80 57.5 57.9 (19) 57.4 (61) 50.0 (12) 47.4 (38) 50.0 (2) 69.2 (13) 100.0 (2) 100.0 (7) 66.7 (3) 33.3 (3)
Math Course Rigor 77 100.0 100.0 (20) 100.0 (57) 100.0 (10) 100.0 (41) 100.0 (4) 100.0 (8) 100.0 (1) 100.0 (3) 100.0 (5) 100.0 (5)
WorkKeys 77 79.2 90.0 (20) 75.4 (57) 80.0 (10) 70.7 (41) 100.0 (4) 87.5 (8) 100.0 (1) 66.7 (3) 100.0 (5) 100.0 (5)
Grad Cohort 4yr 76 100.0 100.0 (20) 100.0 (56) 100.0 (10) 100.0 (41) 100.0 (4) 100.0 (7) 100.0 (1) 100.0 (3) 100.0 (5) 100.0 (5)
Clement Math I 94 86.2 83.0 (47) 89.4 (47) 86.2 (29) 93.8 (32) 69.2 (13) 75.0 (12) 100.0 (1) 100.0 (2) 100.0 (4) 100.0 (1)
English II 95 81.1 73.9 (46) 87.8 (49) 75.9 (29) 91.2 (34) 66.7 (12) 83.3 (12) 100.0 (1) 100.0 (2) 75.0 (4) 0.0 (1)
Biology 21 71.4 100.0 (8) 53.8 (13) 100.0 (4) 42.9 (7) 100.0 (4) 100.0 (3) 50.0 (2) 0.0 (1)
ACT Composite 86 84.9 81.8 (33) 86.8 (53) 80.0 (25) 85.0 (40) 85.7 (7) 88.9 (9) 100.0 (2) 100.0 (1) 100.0 (2)
Math Course Rigor 72 100.0 100.0 (25) 100.0 (47) 100.0 (15) 100.0 (36) 100.0 (7) 100.0 (7) 100.0 (1) 100.0 (1) 100.0 (2) 100.0 (3)
Grad Cohort 4yr 71 100.0 100.0 (25) 100.0 (46) 100.0 (15) 100.0 (35) 100.0 (7) 100.0 (7) 100.0 (1) 100.0 (1) 100.0 (2) 100.0 (3)
Creative Studies
Math 3-8 176 43.8 43.8 (96) 43.8 (80) 37.2 (43) 37.8 (37) 35.3 (17) 27.8 (18) 58.1 (31) 62.5 (24) 40.0 (5) 100.0 (1)
Reading 3-8 176 52.3 51.0 (96) 53.8 (80) 48.8 (43) 54.1 (37) 41.2 (17) 33.3 (18) 61.3 (31) 66.7 (24) 40.0 (5) 100.0 (1)
Math I 65 35.4 48.1 (27) 26.3 (38) 50.0 (10) 18.2 (22) 40.0 (10) 11.1 (9) 50.0 (6) 71.4 (7) 100.0 (1)
English II 1 100.0 100.0 (1) 100.0 (1)
DSA Math 3-8 626 58.9 58.6 (251) 59.2 (375) 29.1 (86) 46.9 (162) 46.9 (49) 51.1 (90) 83.2 (95) 84.4 (96) 95.2 (21) 70.4 (27)
Reading 3-8 628 68.9 68.4 (253) 69.3 (375) 47.1 (87) 62.3 (162) 63.3 (49) 48.9 (90) 88.4 (95) 93.8 (96) 77.3 (22) 92.6 (27)
5 and 8 Science 206 85.4 89.7 (87) 82.4 (119) 84.0 (25) 78.2 (55) 84.2 (19) 76.5 (34) 93.5 (31) 100.0 (22) 100.0 (12) 87.5 (8)
Math I 218 64.2 60.2 (83) 66.7 (135) 33.3 (30) 54.8 (62) 47.4 (19) 71.4 (35) 88.9 (27) 86.7 (30) 100.0 (7) 62.5 (8)
English II 252 86.9 84.7 (111) 88.7 (141) 78.1 (32) 86.2 (58) 63.6 (22) 80.0 (25) 95.9 (49) 95.6 (45) 100.0 (8) 92.3 (13)
Biology 255 65.9 67.0 (106) 65.1 (149) 52.9 (34) 55.6 (63) 45.0 (20) 48.6 (35) 84.4 (45) 90.7 (43) 85.7 (7) 75.0 (8)
ACT Composite 235 81.7 80.0 (85) 82.7 (150) 60.0 (30) 75.0 (56) 66.7 (12) 69.2 (26) 97.1 (35) 94.7 (57) 100.0 (8) 90.9 (11)
Math Course Rigor 183 89.6 84.5 (58) 92.0 (125) 66.7 (15) 91.1 (56) 66.7 (6) 76.9 (13) 96.2 (26) 95.7 (46) 90.9 (11) 100.0 (10)
WorkKeys 13 92.3 88.9 (9) 100.0 (4) 100.0 (1) 100.0 (2) 0.0 (1) 100.0 (1) 100.0 (5) 100.0 (1) 100.0 (2)
Grad Cohort 4yr 188 94.7 88.7 (62) 97.6 (126) 87.5 (16) 96.5 (57) 71.4 (7) 100.0 (12) 89.3 (28) 97.9 (47) 100.0 (11) 100.0 (10)
Hillside Math I 324 24.4 21.4 (145) 26.8 (179) 19.3 (114) 28.0 (150) 22.7 (22) 19.2 (26) 42.9 (7) 100.0 (1) 50.0 (2) 0.0 (2)
English II 294 44.2 36.0 (139) 51.6 (155) 33.9 (118) 53.4 (133) 46.7 (15) 33.3 (18) 50.0 (2) 100.0 (2) 50.0 (4) 50.0 (2)
Biology 263 39.2 37.2 (121) 40.8 (142) 37.4 (99) 42.7 (117) 29.4 (17) 26.3 (19) 0.0 (2) 100.0 (2) 100.0 (3) 25.0 (4)
ACT Composite 283 37.5 36.1 (122) 38.5 (161) 34.0 (103) 39.1 (138) 42.9 (14) 26.7 (15) 66.7 (3) 75.0 (4) 50.0 (2) 25.0 (4)
Math Course Rigor 269 93.7 90.9 (99) 95.3 (170) 92.5 (80) 96.1 (152) 85.7 (14) 81.8 (11) 66.7 (3) 100.0 (1) 100.0 (2) 100.0 (6)
WorkKeys 34 50.0 60.0 (15) 42.1 (19) 54.5 (11) 41.2 (17) 66.7 (3) 50.0 (2) 100.0 (1)
Grad Cohort 4yr 296 87.8 84.4 (109) 89.8 (187) 86.4 (88) 92.6 (163) 73.3 (15) 76.9 (13) 100.0 (3) 33.3 (3) 66.7 (3) 75.0 (8)
Hillside Tech Math I 86 32.6 32.7 (55) 32.3 (31) 28.6 (42) 28.6 (28) 28.6 (7) 66.7 (3) 50.0 (4) 100.0 (2)
English II 80 51.3 52.8 (53) 48.1 (27) 50.0 (44) 45.8 (24) 80.0 (5) 0.0 (1) 66.7 (3) 0.0 (1) 100.0 (2)
Biology 80 23.8 26.9 (52) 17.9 (28) 22.0 (41) 17.4 (23) 14.3 (7) 0.0 (3) 100.0 (3) 100.0 (1) 50.0 (2)
ACT Composite 80 36.3 29.2 (48) 46.9 (32) 19.5 (41) 46.2 (26) 100.0 (2) 25.0 (4) 100.0 (3) 100.0 (2) 50.0 (2)
Math Course Rigor 58 93.1 89.2 (37) 100.0 (21) 90.6 (32) 100.0 (16) 100.0 (2) 100.0 (5) 50.0 (2) 100.0 (1)
WorkKeys 4 75.0 75.0 (4) 75.0 (4)
Grad Cohort 4yr 60 100.0 100.0 (38) 100.0 (22) 100.0 (33) 100.0 (17) 100.0 (2) 100.0 (5) 100.0 (2) 100.0 (1)
Jordan Math I 454 42.7 42.9 (231) 42.6 (223) 28.7 (94) 31.5 (92) 27.8 (54) 25.0 (64) 70.0 (60) 81.3 (48) 65.2 (23) 57.9 (19)
English II 427 62.5 59.4 (207) 65.5 (220) 42.9 (91) 59.2 (98) 55.3 (38) 32.6 (43) 87.9 (58) 90.7 (54) 60.0 (20) 92.0 (25)
Biology 399 59.6 62.0 (205) 57.2 (194) 35.7 (84) 41.7 (84) 66.7 (24) 32.3 (31) 84.8 (79) 87.7 (57) 77.8 (18) 72.7 (22)
ACT Composite 363 59.0 54.2 (201) 64.8 (162) 29.1 (79) 48.2 (56) 37.5 (32) 38.9 (36) 85.3 (68) 94.9 (59) 72.7 (22) 72.7 (11)
RG01 - Academic Achievement by Ethnicity and Gender 11/18/2016 1:29:06 PM Page 6
Academic Achievement by Ethnicity and Gender 2014Student Proficiency given Number Tested within Ethnic-Gender Group
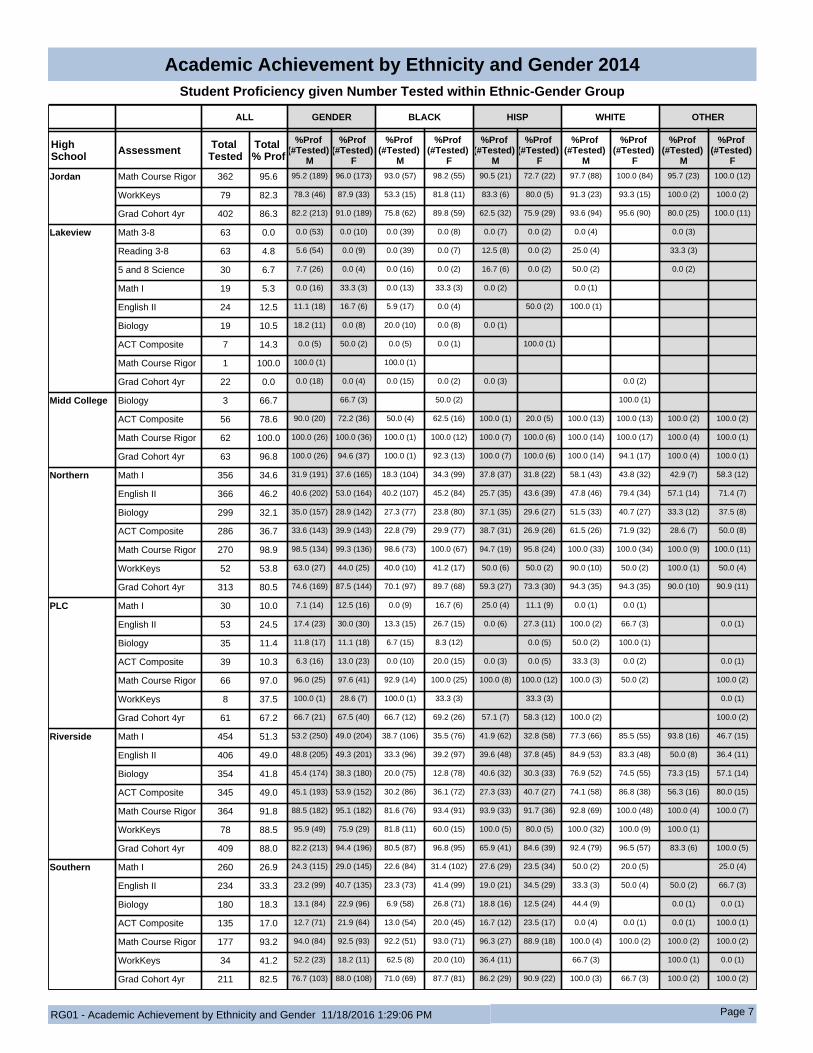
ALL GENDER BLACK HISP WHITE OTHER
High School Assessment Total
TestedTotal % Prof
%Prof (#Tested)
M
%Prof (#Tested)
F
%Prof (#Tested)
M
%Prof (#Tested)
F
%Prof (#Tested)
M
%Prof (#Tested)
F
%Prof (#Tested)
M
%Prof (#Tested)
F
%Prof (#Tested)
M
%Prof (#Tested)
F
Jordan Math Course Rigor 362 95.6 95.2 (189) 96.0 (173) 93.0 (57) 98.2 (55) 90.5 (21) 72.7 (22) 97.7 (88) 100.0 (84) 95.7 (23) 100.0 (12)
WorkKeys 79 82.3 78.3 (46) 87.9 (33) 53.3 (15) 81.8 (11) 83.3 (6) 80.0 (5) 91.3 (23) 93.3 (15) 100.0 (2) 100.0 (2)
Grad Cohort 4yr 402 86.3 82.2 (213) 91.0 (189) 75.8 (62) 89.8 (59) 62.5 (32) 75.9 (29) 93.6 (94) 95.6 (90) 80.0 (25) 100.0 (11)
Lakeview Math 3-8 63 0.0 0.0 (53) 0.0 (10) 0.0 (39) 0.0 (8) 0.0 (7) 0.0 (2) 0.0 (4) 0.0 (3)
Reading 3-8 63 4.8 5.6 (54) 0.0 (9) 0.0 (39) 0.0 (7) 12.5 (8) 0.0 (2) 25.0 (4) 33.3 (3)
5 and 8 Science 30 6.7 7.7 (26) 0.0 (4) 0.0 (16) 0.0 (2) 16.7 (6) 0.0 (2) 50.0 (2) 0.0 (2)
Math I 19 5.3 0.0 (16) 33.3 (3) 0.0 (13) 33.3 (3) 0.0 (2) 0.0 (1)
English II 24 12.5 11.1 (18) 16.7 (6) 5.9 (17) 0.0 (4) 50.0 (2) 100.0 (1)
Biology 19 10.5 18.2 (11) 0.0 (8) 20.0 (10) 0.0 (8) 0.0 (1)
ACT Composite 7 14.3 0.0 (5) 50.0 (2) 0.0 (5) 0.0 (1) 100.0 (1)
Math Course Rigor 1 100.0 100.0 (1) 100.0 (1)
Grad Cohort 4yr 22 0.0 0.0 (18) 0.0 (4) 0.0 (15) 0.0 (2) 0.0 (3) 0.0 (2)
Midd College Biology 3 66.7 66.7 (3) 50.0 (2) 100.0 (1)
ACT Composite 56 78.6 90.0 (20) 72.2 (36) 50.0 (4) 62.5 (16) 100.0 (1) 20.0 (5) 100.0 (13) 100.0 (13) 100.0 (2) 100.0 (2)
Math Course Rigor 62 100.0 100.0 (26) 100.0 (36) 100.0 (1) 100.0 (12) 100.0 (7) 100.0 (6) 100.0 (14) 100.0 (17) 100.0 (4) 100.0 (1)
Grad Cohort 4yr 63 96.8 100.0 (26) 94.6 (37) 100.0 (1) 92.3 (13) 100.0 (7) 100.0 (6) 100.0 (14) 94.1 (17) 100.0 (4) 100.0 (1)
Northern Math I 356 34.6 31.9 (191) 37.6 (165) 18.3 (104) 34.3 (99) 37.8 (37) 31.8 (22) 58.1 (43) 43.8 (32) 42.9 (7) 58.3 (12)
English II 366 46.2 40.6 (202) 53.0 (164) 40.2 (107) 45.2 (84) 25.7 (35) 43.6 (39) 47.8 (46) 79.4 (34) 57.1 (14) 71.4 (7)
Biology 299 32.1 35.0 (157) 28.9 (142) 27.3 (77) 23.8 (80) 37.1 (35) 29.6 (27) 51.5 (33) 40.7 (27) 33.3 (12) 37.5 (8)
ACT Composite 286 36.7 33.6 (143) 39.9 (143) 22.8 (79) 29.9 (77) 38.7 (31) 26.9 (26) 61.5 (26) 71.9 (32) 28.6 (7) 50.0 (8)
Math Course Rigor 270 98.9 98.5 (134) 99.3 (136) 98.6 (73) 100.0 (67) 94.7 (19) 95.8 (24) 100.0 (33) 100.0 (34) 100.0 (9) 100.0 (11)
WorkKeys 52 53.8 63.0 (27) 44.0 (25) 40.0 (10) 41.2 (17) 50.0 (6) 50.0 (2) 90.0 (10) 50.0 (2) 100.0 (1) 50.0 (4)
Grad Cohort 4yr 313 80.5 74.6 (169) 87.5 (144) 70.1 (97) 89.7 (68) 59.3 (27) 73.3 (30) 94.3 (35) 94.3 (35) 90.0 (10) 90.9 (11)
PLC Math I 30 10.0 7.1 (14) 12.5 (16) 0.0 (9) 16.7 (6) 25.0 (4) 11.1 (9) 0.0 (1) 0.0 (1)
English II 53 24.5 17.4 (23) 30.0 (30) 13.3 (15) 26.7 (15) 0.0 (6) 27.3 (11) 100.0 (2) 66.7 (3) 0.0 (1)
Biology 35 11.4 11.8 (17) 11.1 (18) 6.7 (15) 8.3 (12) 0.0 (5) 50.0 (2) 100.0 (1)
ACT Composite 39 10.3 6.3 (16) 13.0 (23) 0.0 (10) 20.0 (15) 0.0 (3) 0.0 (5) 33.3 (3) 0.0 (2) 0.0 (1)
Math Course Rigor 66 97.0 96.0 (25) 97.6 (41) 92.9 (14) 100.0 (25) 100.0 (8) 100.0 (12) 100.0 (3) 50.0 (2) 100.0 (2)
WorkKeys 8 37.5 100.0 (1) 28.6 (7) 100.0 (1) 33.3 (3) 33.3 (3) 0.0 (1)
Grad Cohort 4yr 61 67.2 66.7 (21) 67.5 (40) 66.7 (12) 69.2 (26) 57.1 (7) 58.3 (12) 100.0 (2) 100.0 (2)
Riverside Math I 454 51.3 53.2 (250) 49.0 (204) 38.7 (106) 35.5 (76) 41.9 (62) 32.8 (58) 77.3 (66) 85.5 (55) 93.8 (16) 46.7 (15)
English II 406 49.0 48.8 (205) 49.3 (201) 33.3 (96) 39.2 (97) 39.6 (48) 37.8 (45) 84.9 (53) 83.3 (48) 50.0 (8) 36.4 (11)
Biology 354 41.8 45.4 (174) 38.3 (180) 20.0 (75) 12.8 (78) 40.6 (32) 30.3 (33) 76.9 (52) 74.5 (55) 73.3 (15) 57.1 (14)
ACT Composite 345 49.0 45.1 (193) 53.9 (152) 30.2 (86) 36.1 (72) 27.3 (33) 40.7 (27) 74.1 (58) 86.8 (38) 56.3 (16) 80.0 (15)
Math Course Rigor 364 91.8 88.5 (182) 95.1 (182) 81.6 (76) 93.4 (91) 93.9 (33) 91.7 (36) 92.8 (69) 100.0 (48) 100.0 (4) 100.0 (7)
WorkKeys 78 88.5 95.9 (49) 75.9 (29) 81.8 (11) 60.0 (15) 100.0 (5) 80.0 (5) 100.0 (32) 100.0 (9) 100.0 (1)
Grad Cohort 4yr 409 88.0 82.2 (213) 94.4 (196) 80.5 (87) 96.8 (95) 65.9 (41) 84.6 (39) 92.4 (79) 96.5 (57) 83.3 (6) 100.0 (5)
Southern Math I 260 26.9 24.3 (115) 29.0 (145) 22.6 (84) 31.4 (102) 27.6 (29) 23.5 (34) 50.0 (2) 20.0 (5) 25.0 (4)
English II 234 33.3 23.2 (99) 40.7 (135) 23.3 (73) 41.4 (99) 19.0 (21) 34.5 (29) 33.3 (3) 50.0 (4) 50.0 (2) 66.7 (3)
Biology 180 18.3 13.1 (84) 22.9 (96) 6.9 (58) 26.8 (71) 18.8 (16) 12.5 (24) 44.4 (9) 0.0 (1) 0.0 (1)
ACT Composite 135 17.0 12.7 (71) 21.9 (64) 13.0 (54) 20.0 (45) 16.7 (12) 23.5 (17) 0.0 (4) 0.0 (1) 0.0 (1) 100.0 (1)
Math Course Rigor 177 93.2 94.0 (84) 92.5 (93) 92.2 (51) 93.0 (71) 96.3 (27) 88.9 (18) 100.0 (4) 100.0 (2) 100.0 (2) 100.0 (2)
WorkKeys 34 41.2 52.2 (23) 18.2 (11) 62.5 (8) 20.0 (10) 36.4 (11) 66.7 (3) 100.0 (1) 0.0 (1)
Grad Cohort 4yr 211 82.5 76.7 (103) 88.0 (108) 71.0 (69) 87.7 (81) 86.2 (29) 90.9 (22) 100.0 (3) 66.7 (3) 100.0 (2) 100.0 (2)
RG01 - Academic Achievement by Ethnicity and Gender 11/18/2016 1:29:06 PM Page 7
Academic Achievement by Ethnicity and Gender 2014Student Proficiency given Number Tested within Ethnic-Gender Group

Research and Accountability
Student Enrollment (20 day) by Ethnicity and Gender 2017
Enrollment 20-Day
Black Hispanic White Other F M F M F M F M
Count Row % Count Row
% Count Row % Count Row
% Count Row % Count Row
% Count Row % Count Row
% Durham Public Schools 33,124 7651 23% 7600 23% 4884 15% 4961 15% 2910 9% 3235 10% 915 3% 968 3% Bethesda Elementary 685 180 26% 190 28% 113 16% 128 19% 16 2% 26 4% 16 2% 16 2% Brogden Middle 542 130 24% 114 21% 81 15% 107 20% 30 6% 50 9% 19 4% 11 2% Burton Elementary 349 57 16% 75 21% 100 29% 104 30% 0 0% 5 1% 3 1% 5 1% C C Spaulding Elementary 268 108 40% 109 41% 21 8% 18 7% 1 0% 2 1% 4 1% 5 2% C E Jordan High 1,978 370 19% 433 22% 235 12% 239 12% 241 12% 300 15% 72 4% 88 4% City of Medicine 324 137 42% 25 8% 93 29% 21 6% 17 5% 8 2% 18 6% 5 2% Club Blvd Elementary 493 78 16% 56 11% 97 20% 98 20% 59 12% 89 18% 7 1% 9 2% Creekside Elementary 888 128 14% 105 12% 115 13% 125 14% 171 19% 161 18% 37 4% 46 5% DPS Hospital School 30 2 7% 2 7% 3 10% 0 0% 12 40% 8 27% 1 3% 2 7% Durham Sch of the Arts 1,711 378 22% 183 11% 233 14% 157 9% 378 22% 236 14% 84 5% 62 4% Durham's Performance Learning 205 77 38% 45 22% 42 20% 24 12% 5 2% 5 2% 5 2% 2 1% E K Powe Elementary 476 81 17% 55 12% 65 14% 65 14% 87 18% 97 20% 15 3% 11 2% Easley Elementary 562 41 7% 54 10% 49 9% 55 10% 147 26% 159 28% 27 5% 30 5% Eastway Elementary 542 116 21% 112 21% 140 26% 151 28% 6 1% 3 1% 5 1% 9 2% Eno Valley Elementary 509 176 35% 180 35% 51 10% 66 13% 11 2% 9 2% 9 2% 7 1% Fayetteville Street Elementary 287 94 33% 95 33% 43 15% 49 17% 0 0% 3 1% 1 0% 2 1% Forest View Elementary 737 100 14% 86 12% 139 19% 120 16% 103 14% 111 15% 38 5% 40 5% George L Carrington Middle 930 232 25% 214 23% 139 15% 145 16% 70 8% 74 8% 18 2% 38 4% George Watts Elementary 350 27 8% 34 10% 55 16% 55 16% 77 22% 83 24% 10 3% 9 3% Glenn Elementary 707 161 23% 172 24% 146 21% 163 23% 10 1% 14 2% 18 3% 23 3% Hillandale Elementary 653 112 17% 147 23% 102 16% 101 15% 64 10% 88 13% 19 3% 20 3% Hillside High 1,288 542 42% 469 36% 112 9% 115 9% 5 0% 18 1% 13 1% 14 1% Hillside New Tech High School 210 70 33% 108 51% 7 3% 19 9% 0 0% 5 2% 0 0% 1 0% Holt Elementary 652 101 15% 125 19% 194 30% 162 25% 16 2% 24 4% 19 3% 11 2% Hope Valley Elementary 626 108 17% 113 18% 125 20% 96 15% 78 12% 70 11% 14 2% 22 4% J D Clement Early College HS 366 138 38% 95 26% 67 18% 35 10% 8 2% 6 2% 9 2% 8 2% James E Shepard Middle 451 151 33% 141 31% 75 17% 67 15% 2 0% 2 0% 5 1% 8 2% Lakeview School 29 2 7% 21 72% 2 7% 3 10% 0 0% 0 0% 0 0% 1 3% Lakewood Elementary 450 84 19% 96 21% 117 26% 123 27% 5 1% 6 1% 8 2% 11 2% Lakewood Middle Montessori 295 25 8% 39 13% 35 12% 43 15% 63 21% 58 20% 18 6% 14 5% Little River Elementary 472 66 14% 68 14% 37 8% 28 6% 106 22% 132 28% 20 4% 15 3% Lowe's Grove Middle 600 180 30% 192 32% 91 15% 82 14% 15 3% 14 2% 12 2% 14 2% Lucas Middle 531 127 24% 127 24% 83 16% 60 11% 54 10% 53 10% 16 3% 11 2% Mangum Elementary 307 13 4% 15 5% 10 3% 9 3% 122 40% 132 43% 3 1% 3 1% Merrick-Moore Elementary 607 161 27% 145 24% 112 18% 146 24% 14 2% 21 3% 2 0% 6 1% Middle College HS @ DTCC 161 36 22% 11 7% 33 20% 18 11% 27 17% 26 16% 6 4% 4 2% Morehead Montessori 226 24 11% 40 18% 31 14% 19 8% 48 21% 51 23% 4 2% 9 4%
511 Cleveland Street • P.O. Box 30002 • Durham, North Carolina 27702 • 919-560-2309 • 919-237-7242 fax • www.dpsnc.net

Research and Accountability
Student Enrollment (20 day) by Ethnicity and Gender 2017
Schools Enrollment 20-Day
Black Hispanic White Other F M F M F M F M
Count Row % Count Row
% Count Row % Count Row
% Count Row % Count Row
% Count Row % Count Row
% Neal Middle 759 185 24% 189 25% 131 17% 176 23% 20 3% 21 3% 20 3% 17 2% Northern High 1,503 356 24% 381 25% 175 12% 195 13% 166 11% 156 10% 35 2% 39 3% Oak Grove Elementary 602 162 27% 171 28% 104 17% 112 19% 13 2% 22 4% 11 2% 7 1% Parkwood Elementary 557 145 26% 177 32% 52 9% 70 13% 25 4% 34 6% 25 4% 29 5% Pearsontown Elementary 809 171 21% 196 24% 41 5% 42 5% 115 14% 152 19% 43 5% 49 6% R N Harris Elementary 317 82 26% 68 21% 81 26% 74 23% 2 1% 3 1% 5 2% 2 1% Riverside High 1,826 346 19% 400 22% 244 13% 323 18% 169 9% 247 14% 42 2% 55 3% Rogers-Herr Middle 631 143 23% 151 24% 71 11% 79 13% 46 7% 91 14% 25 4% 25 4% Sandy Ridge Elementary School 597 180 30% 157 26% 94 16% 77 13% 32 5% 31 5% 14 2% 12 2% School for Creative Studies 608 137 23% 119 20% 57 9% 79 13% 78 13% 109 18% 11 2% 18 3% Sherwood Githens Middle 923 206 22% 217 24% 126 14% 125 14% 64 7% 103 11% 39 4% 43 5% Southern High 1,461 394 27% 508 35% 196 13% 271 19% 20 1% 28 2% 20 1% 24 2% Southwest Elementary 634 157 25% 173 27% 74 12% 76 12% 46 7% 56 9% 22 3% 30 5% Spring Valley Elementary 536 136 25% 157 29% 61 11% 92 17% 38 7% 28 5% 12 2% 12 2% W G Pearson Elementary 478 148 31% 153 32% 88 18% 66 14% 3 1% 3 1% 13 3% 4 1% Y E Smith Elementary 386 90 23% 92 24% 96 25% 88 23% 5 1% 2 1% 3 1% 10 3%
511 Cleveland Street • P.O. Box 30002 • Durham, North Carolina 27702 • 919-560-2309 • 919-237-7242 fax • www.dpsnc.net
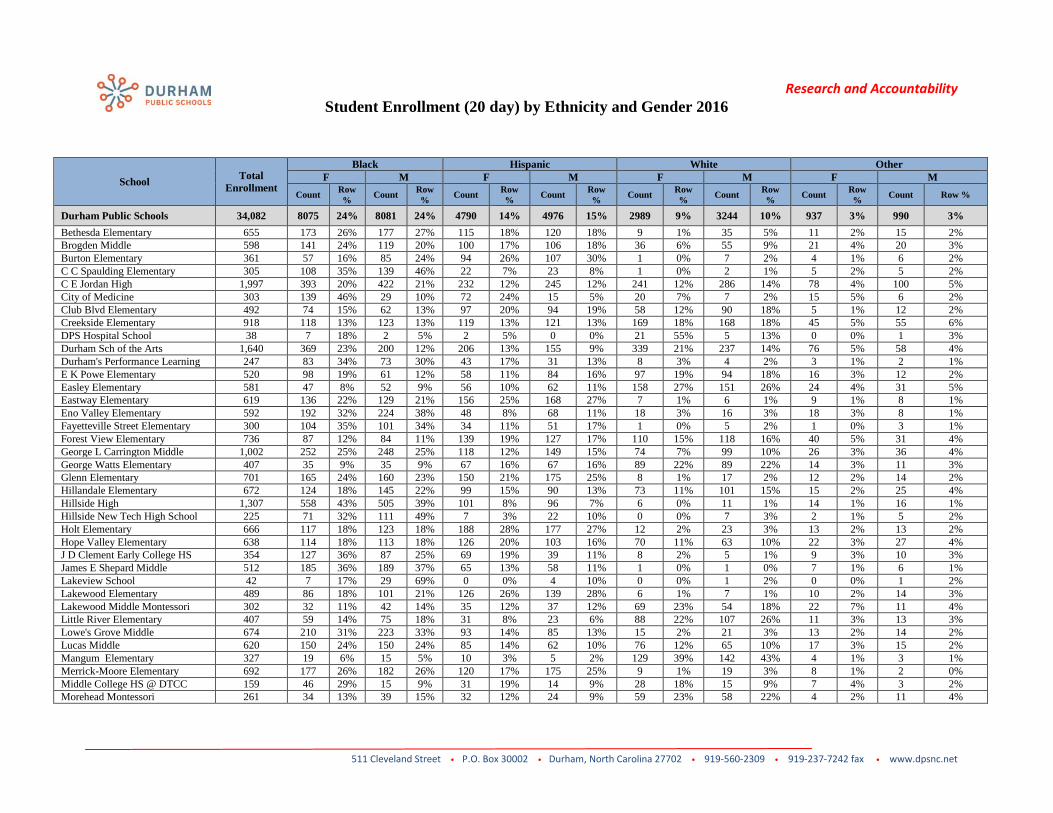
Research and Accountability Student Enrollment (20 day) by Ethnicity and Gender 2016
School Total Enrollment
Black Hispanic White Other F M F M F M F M
Count Row % Count Row
% Count Row % Count Row
% Count Row % Count Row
% Count Row % Count Row %
Durham Public Schools 34,082 8075 24% 8081 24% 4790 14% 4976 15% 2989 9% 3244 10% 937 3% 990 3% Bethesda Elementary 655 173 26% 177 27% 115 18% 120 18% 9 1% 35 5% 11 2% 15 2% Brogden Middle 598 141 24% 119 20% 100 17% 106 18% 36 6% 55 9% 21 4% 20 3% Burton Elementary 361 57 16% 85 24% 94 26% 107 30% 1 0% 7 2% 4 1% 6 2% C C Spaulding Elementary 305 108 35% 139 46% 22 7% 23 8% 1 0% 2 1% 5 2% 5 2% C E Jordan High 1,997 393 20% 422 21% 232 12% 245 12% 241 12% 286 14% 78 4% 100 5% City of Medicine 303 139 46% 29 10% 72 24% 15 5% 20 7% 7 2% 15 5% 6 2% Club Blvd Elementary 492 74 15% 62 13% 97 20% 94 19% 58 12% 90 18% 5 1% 12 2% Creekside Elementary 918 118 13% 123 13% 119 13% 121 13% 169 18% 168 18% 45 5% 55 6% DPS Hospital School 38 7 18% 2 5% 2 5% 0 0% 21 55% 5 13% 0 0% 1 3% Durham Sch of the Arts 1,640 369 23% 200 12% 206 13% 155 9% 339 21% 237 14% 76 5% 58 4% Durham's Performance Learning 247 83 34% 73 30% 43 17% 31 13% 8 3% 4 2% 3 1% 2 1% E K Powe Elementary 520 98 19% 61 12% 58 11% 84 16% 97 19% 94 18% 16 3% 12 2% Easley Elementary 581 47 8% 52 9% 56 10% 62 11% 158 27% 151 26% 24 4% 31 5% Eastway Elementary 619 136 22% 129 21% 156 25% 168 27% 7 1% 6 1% 9 1% 8 1% Eno Valley Elementary 592 192 32% 224 38% 48 8% 68 11% 18 3% 16 3% 18 3% 8 1% Fayetteville Street Elementary 300 104 35% 101 34% 34 11% 51 17% 1 0% 5 2% 1 0% 3 1% Forest View Elementary 736 87 12% 84 11% 139 19% 127 17% 110 15% 118 16% 40 5% 31 4% George L Carrington Middle 1,002 252 25% 248 25% 118 12% 149 15% 74 7% 99 10% 26 3% 36 4% George Watts Elementary 407 35 9% 35 9% 67 16% 67 16% 89 22% 89 22% 14 3% 11 3% Glenn Elementary 701 165 24% 160 23% 150 21% 175 25% 8 1% 17 2% 12 2% 14 2% Hillandale Elementary 672 124 18% 145 22% 99 15% 90 13% 73 11% 101 15% 15 2% 25 4% Hillside High 1,307 558 43% 505 39% 101 8% 96 7% 6 0% 11 1% 14 1% 16 1% Hillside New Tech High School 225 71 32% 111 49% 7 3% 22 10% 0 0% 7 3% 2 1% 5 2% Holt Elementary 666 117 18% 123 18% 188 28% 177 27% 12 2% 23 3% 13 2% 13 2% Hope Valley Elementary 638 114 18% 113 18% 126 20% 103 16% 70 11% 63 10% 22 3% 27 4% J D Clement Early College HS 354 127 36% 87 25% 69 19% 39 11% 8 2% 5 1% 9 3% 10 3% James E Shepard Middle 512 185 36% 189 37% 65 13% 58 11% 1 0% 1 0% 7 1% 6 1% Lakeview School 42 7 17% 29 69% 0 0% 4 10% 0 0% 1 2% 0 0% 1 2% Lakewood Elementary 489 86 18% 101 21% 126 26% 139 28% 6 1% 7 1% 10 2% 14 3% Lakewood Middle Montessori 302 32 11% 42 14% 35 12% 37 12% 69 23% 54 18% 22 7% 11 4% Little River Elementary 407 59 14% 75 18% 31 8% 23 6% 88 22% 107 26% 11 3% 13 3% Lowe's Grove Middle 674 210 31% 223 33% 93 14% 85 13% 15 2% 21 3% 13 2% 14 2% Lucas Middle 620 150 24% 150 24% 85 14% 62 10% 76 12% 65 10% 17 3% 15 2% Mangum Elementary 327 19 6% 15 5% 10 3% 5 2% 129 39% 142 43% 4 1% 3 1% Merrick-Moore Elementary 692 177 26% 182 26% 120 17% 175 25% 9 1% 19 3% 8 1% 2 0% Middle College HS @ DTCC 159 46 29% 15 9% 31 19% 14 9% 28 18% 15 9% 7 4% 3 2% Morehead Montessori 261 34 13% 39 15% 32 12% 24 9% 59 23% 58 22% 4 2% 11 4%
511 Cleveland Street • P.O. Box 30002 • Durham, North Carolina 27702 • 919-560-2309 • 919-237-7242 fax • www.dpsnc.net

Research and Accountability Student Enrollment (20 day) by Ethnicity and Gender 2016
School Total Enrollment
Black Hispanic White Other F M F M F M F M
Count Row % Count Row
% Count Row % Count Row
% Count Row % Count Row
% Count Row % Count Row %
Neal Middle 787 203 26% 224 28% 131 17% 151 19% 20 3% 22 3% 20 3% 16 2% Northern High 1,498 374 25% 383 26% 155 10% 179 12% 163 11% 164 11% 38 3% 42 3% Oak Grove Elementary 629 161 26% 196 31% 97 15% 113 18% 16 3% 27 4% 11 2% 8 1% Parkwood Elementary 541 149 28% 152 28% 57 11% 76 14% 18 3% 37 7% 25 5% 27 5% Pearsontown Elementary 822 192 23% 212 26% 43 5% 49 6% 100 12% 136 17% 39 5% 51 6% R N Harris Elementary 362 104 29% 94 26% 73 20% 76 21% 3 1% 1 0% 6 2% 5 1% Riverside High 1861 346 19% 420 23% 245 13% 303 16% 204 11% 243 13% 41 2% 59 3% Rogers-Herr Middle 636 172 27% 155 24% 64 10% 69 11% 54 8% 70 11% 26 4% 26 4% Sandy Ridge Elementary School 612 192 31% 142 23% 92 15% 70 11% 45 7% 38 6% 14 2% 19 3% School for Creative Studies 531 125 24% 110 21% 48 9% 71 13% 69 13% 91 17% 6 1% 11 2% Sherwood Githens Middle 899 190 21% 214 24% 140 16% 109 12% 71 8% 107 12% 31 3% 37 4% Southern High 1399 403 29% 512 37% 168 12% 233 17% 24 2% 25 2% 20 1% 14 1% Southwest Elementary 631 163 26% 184 29% 64 10% 75 12% 42 7% 55 9% 30 5% 18 3% Spring Valley Elementary 546 136 25% 160 29% 69 13% 94 17% 32 6% 27 5% 13 2% 15 3% W G Pearson Elementary 543 168 31% 169 31% 92 17% 80 15% 7 1% 8 1% 12 2% 7 1% Y E Smith Elementary 426 103 24% 85 20% 106 25% 107 25% 7 2% 2 0% 4 1% 12 3%
511 Cleveland Street • P.O. Box 30002 • Durham, North Carolina 27702 • 919-560-2309 • 919-237-7242 fax • www.dpsnc.net