Embed Size (px)
Citation preview
Employee EngagementDecember 4, 2018Board of Education

© 2018
Results and Analysis
Employee Engagement Survey
Rockford Public Schools
School Year: 2018-2019
© 2018
Project Overview
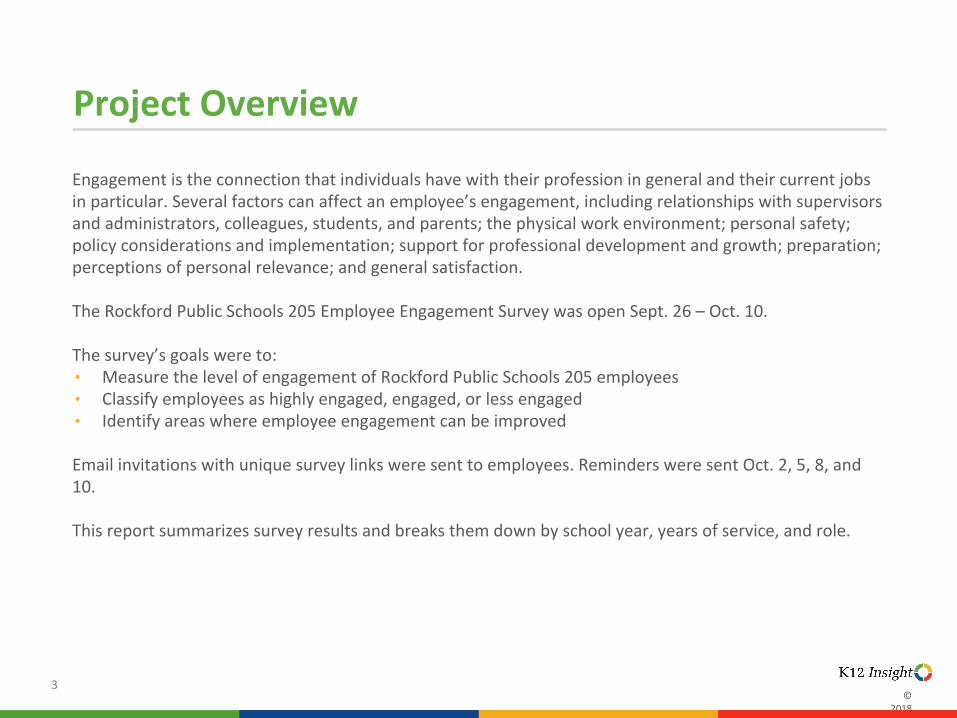
Engagement is the connection that individuals have with their profession in general and their current jobs in particular. Several factors can affect an employee’s engagement, including relationships with supervisors and administrators, colleagues, students, and parents; the physical work environment; personal safety; policy considerations and implementation; support for professional development and growth; preparation; perceptions of personal relevance; and general satisfaction.
The Rockford Public Schools 205 Employee Engagement Survey was open Sept. 26 – Oct. 10.
The survey’s goals were to:• Measure the level of engagement of Rockford Public Schools 205 employees• Classify employees as highly engaged, engaged, or less engaged• Identify areas where employee engagement can be improved
Email invitations with unique survey links were sent to employees. Reminders were sent Oct. 2, 5, 8, and 10.
This report summarizes survey results and breaks them down by school year, years of service, and role.
3
© 2018
Understanding the Results
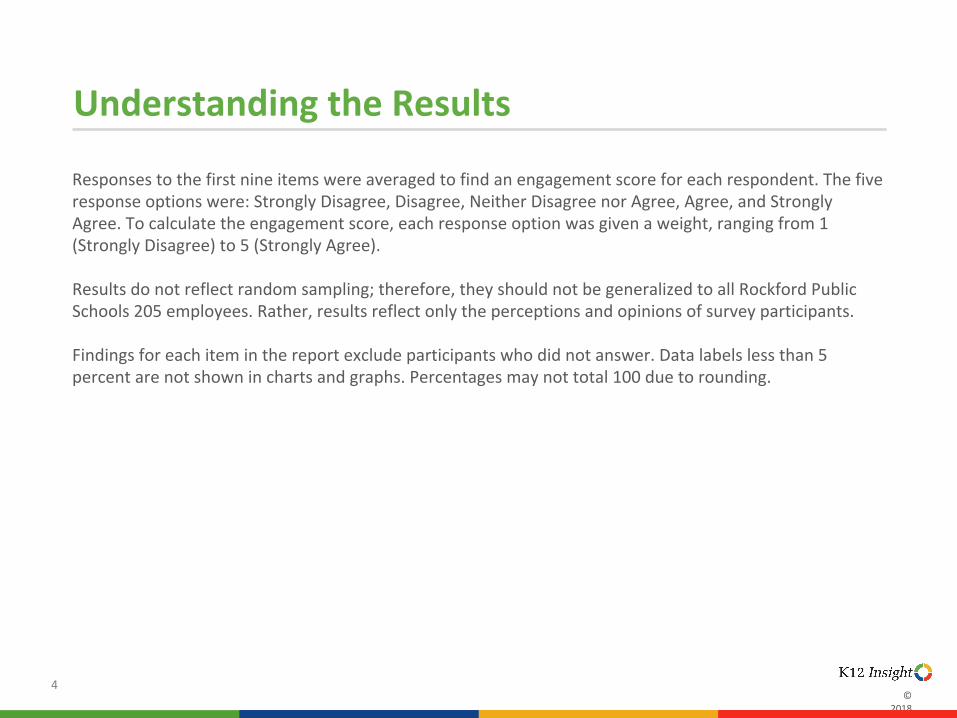
Responses to the first nine items were averaged to find an engagement score for each respondent. The five response options were: Strongly Disagree, Disagree, Neither Disagree nor Agree, Agree, and Strongly Agree. To calculate the engagement score, each response option was given a weight, ranging from 1 (Strongly Disagree) to 5 (Strongly Agree).
Results do not reflect random sampling; therefore, they should not be generalized to all Rockford Public Schools 205 employees. Rather, results reflect only the perceptions and opinions of survey participants.
Findings for each item in the report exclude participants who did not answer. Data labels less than 5 percent are not shown in charts and graphs. Percentages may not total 100 due to rounding.
4
© 2018
Study Design
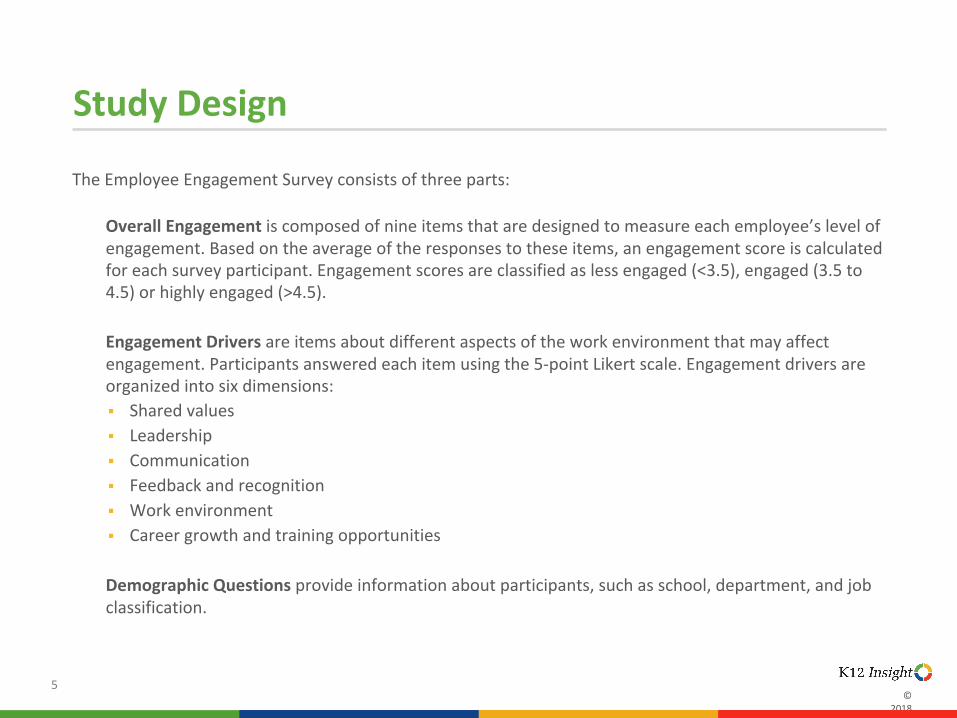
The Employee Engagement Survey consists of three parts:
Overall Engagement is composed of nine items that are designed to measure each employee’s level of engagement. Based on the average of the responses to these items, an engagement score is calculated for each survey participant. Engagement scores are classified as less engaged (<3.5), engaged (3.5 to 4.5) or highly engaged (>4.5).
Engagement Drivers are items about different aspects of the work environment that may affect engagement. Participants answered each item using the 5-point Likert scale. Engagement drivers are organized into six dimensions:
▪ Shared values
▪ Leadership
▪ Communication
▪ Feedback and recognition
▪ Work environment
▪ Career growth and training opportunities
Demographic Questions provide information about participants, such as school, department, and job classification.
5

© 2018
Participation

© 2018
Participation
School YearNumber of Invitations
Delivered (NMax)
Number of Responses (N)
Response Rate (%)Total
Responses
2018-2019 3,997 2,333 58% 2,333
2017-2018 3,959 2,260 57% 2,260
7 * Certified staff includes psychologist, social worker, speech and language pathologist, nurse, OT, PT, sign language interpreter, coach, and specialist positions.

© 2018
Overall Engagement
© 2018
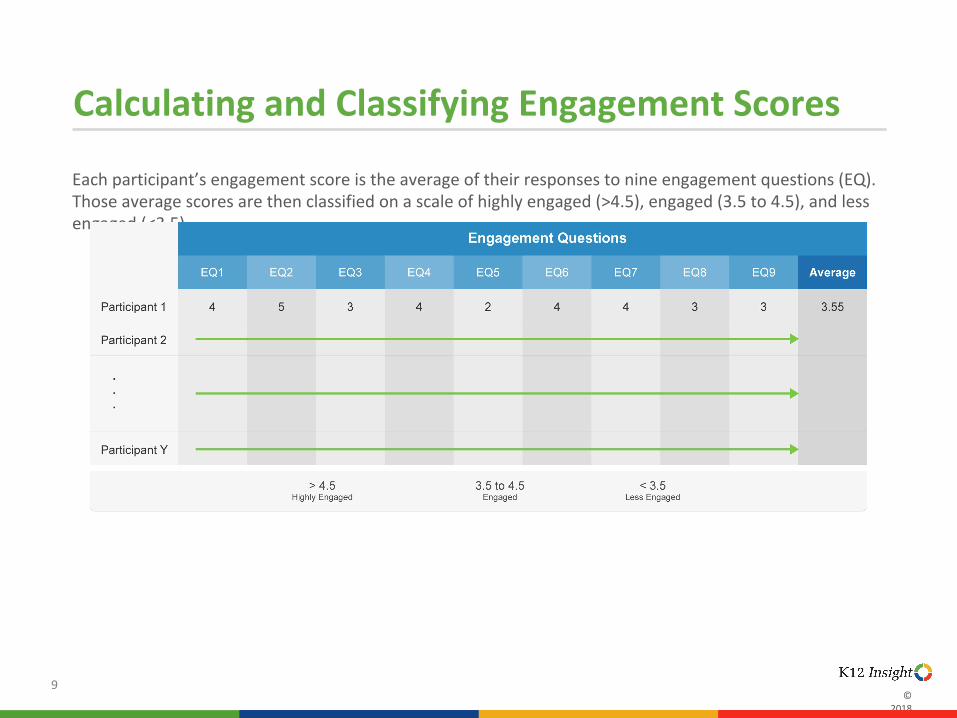
Calculating and Classifying Engagement Scores
Each participant’s engagement score is the average of their responses to nine engagement questions (EQ). Those average scores are then classified on a scale of highly engaged (>4.5), engaged (3.5 to 4.5), and less engaged (<3.5).
9

© 2018
Overall Engagement
Responses to the nine engagement items were averaged to calculate an engagement score for each participant. To calculate the engagement score, each response option was assigned a numerical value:• Strongly Disagree = 1• Disagree = 2• Neither Disagree or Agree = 3• Agree = 4• Strongly Agree = 5
Average scores were classified into three levels: Less Engaged (<3.5), Engaged (3.5 to 4.5), and Highly Engaged (>4.5).
10
© 2018
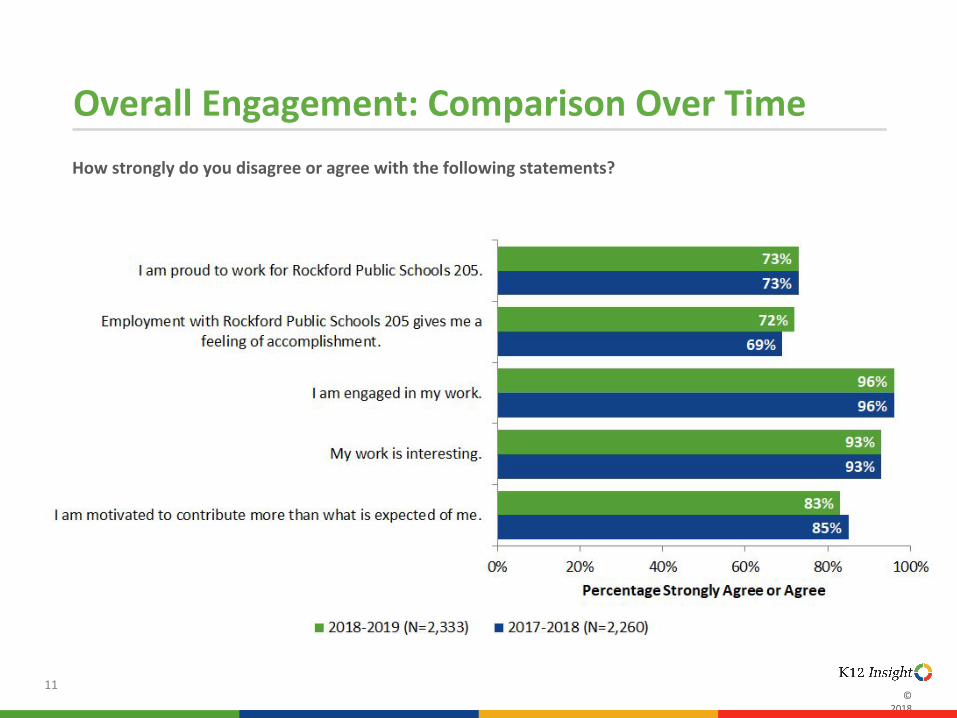
Overall Engagement: Comparison Over Time
How strongly do you disagree or agree with the following statements?
11

© 2018
Overall Engagement: Comparison Over Time (Continued)
How strongly do you disagree or agree with the following statements?
12

© 2018
Engagement Drivers
© 2018
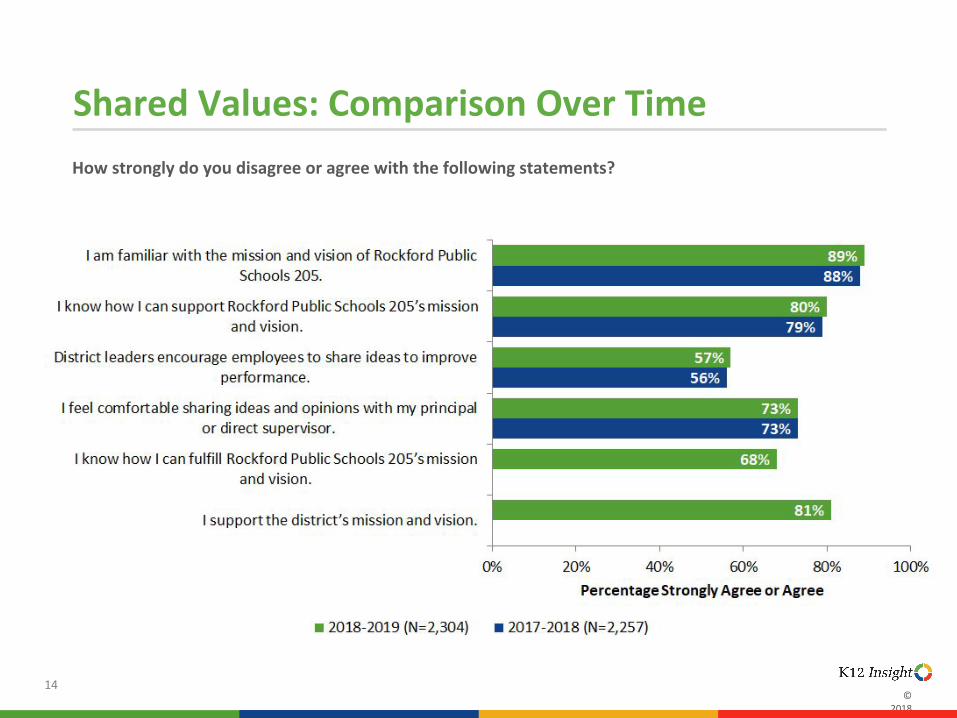
Shared Values: Comparison Over Time
How strongly do you disagree or agree with the following statements?
14

© 2018
Shared Values: Comparison Over Time (Continued)
How strongly do you disagree or agree with the following statements?
15

© 2018
Leadership: Comparison Over Time
How strongly do you disagree or agree with the following statements?
16

© 2018
Leadership: Comparison Over Time (Continued)
How strongly do you disagree or agree with the following statements?
17

© 2018
Communication: Comparison Over Time
How strongly do you disagree or agree with the following statements?
18

© 2018
Feedback and Recognition: Comparison Over Time
How strongly do you disagree or agree with the following statements?
19
© 2018
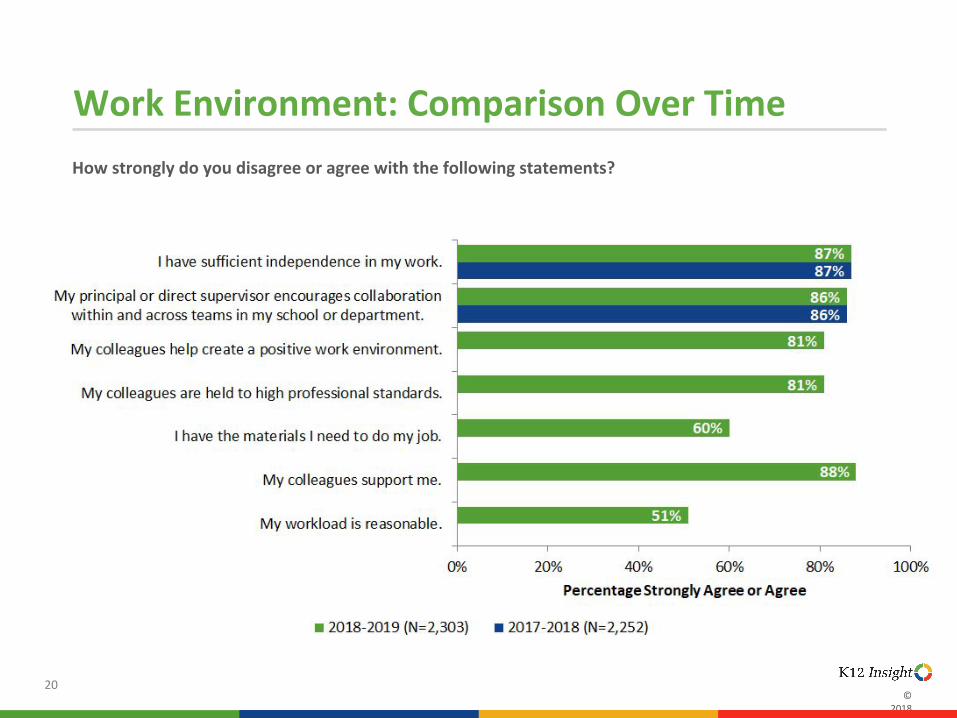
Work Environment: Comparison Over Time
How strongly do you disagree or agree with the following statements?
20

© 2018
Work Environment: Comparison Over Time (Continued)
How strongly do you disagree or agree with the following statements?
21

© 2018
Career Growth and Training Opportunities: Comparison Over Time
How strongly do you disagree or agree with the following statements?
22

© 2018
Focus Areas
© 2018
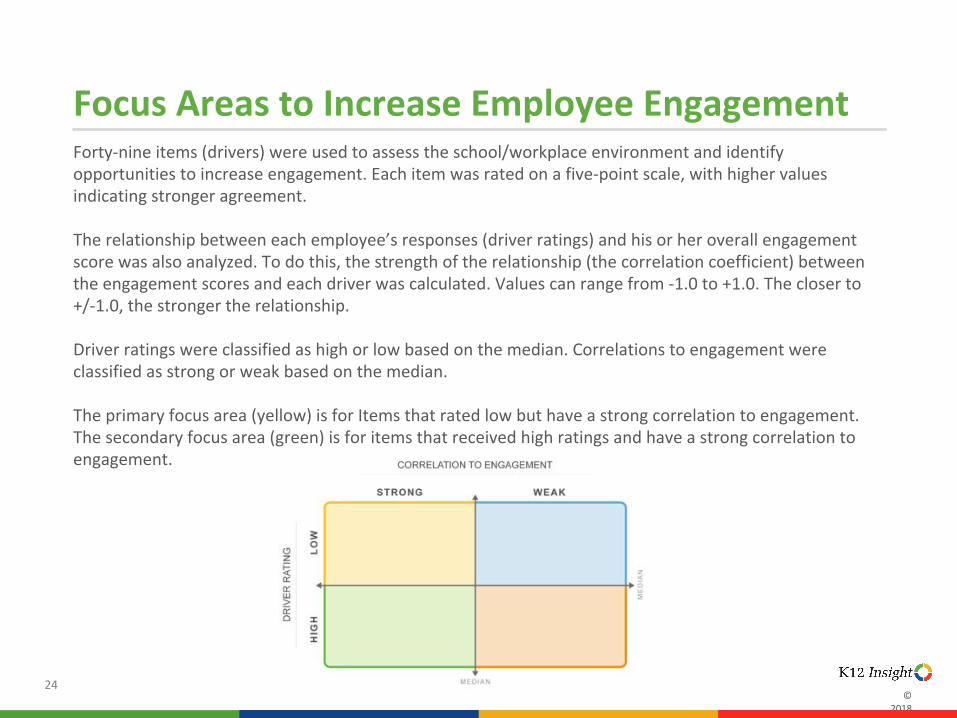
Focus Areas to Increase Employee EngagementForty-nine items (drivers) were used to assess the school/workplace environment and identify opportunities to increase engagement. Each item was rated on a five-point scale, with higher values indicating stronger agreement.
The relationship between each employee’s responses (driver ratings) and his or her overall engagement score was also analyzed. To do this, the strength of the relationship (the correlation coefficient) between the engagement scores and each driver was calculated. Values can range from -1.0 to +1.0. The closer to +/-1.0, the stronger the relationship.
Driver ratings were classified as high or low based on the median. Correlations to engagement were classified as strong or weak based on the median.
The primary focus area (yellow) is for Items that rated low but have a strong correlation to engagement. The secondary focus area (green) is for items that received high ratings and have a strong correlation to engagement.
24

© 2018
Engagement Driver Dimensions Calculations
25

© 2018
Areas of Strength
Celebrating these items will promote positive employee engagement. The average scores for these statements are high (at or above 3.66), and the items have strong relationships to engagement.
26 Note: Items in bold appeared on this slide last school year.

© 2018
Areas of Strength (Continued)
Celebrating these items will promote positive employee engagement. The average scores for these statements are high (at or above 3.66), and the items have strong relationships to engagement.
27 Note: Items in bold appeared on this slide last school year.

© 2018
Opportunities for Improvement
Improving scores for these items will likely increase employee engagement. The average scores for these statements are low (at or below 3.66), but the items have strong relationships to engagement.
28
Dimension Survey ItemDriverRating
Correlation to
Engagement
Work Environment
There is high staff morale in this district. 2.69 0.55
Leadership District leaders ensure staff morale is high. 2.84 0.60
Leadership District leaders understand my professional needs. 2.85 0.57
Feedback and Recognition
Rockford Public Schools 205 recognizes employees for their high-quality work and accomplishments.
2.90 0.52
Leadership District leaders’ actions are consistent with their words. 3.08 0.57
Feedback and Recognition
I receive recognition for my accomplishments. 3.32 0.52
Work Environment
There is high staff morale in my school or department. 3.33 0.59
Note: Items in bold appeared on this slide last school year.

© 2018
Opportunities for Improvement (Continued)
Improving scores for these items will likely increase employee engagement. The average scores for these statements are low (at or below 3.66), but the items have strong relationships to engagement.
29
Dimension Survey ItemDriverRating
Correlation to
Engagement
Shared Values I can provide input on how the district accomplishes its mission. 3.36 0.53
Shared Values I can help shape the district’s mission and vision. 3.43 0.53
Shared ValuesDistrict leaders encourage employees to share ideas to improve performance.
3.46 0.59
Feedback and Recognition
I feel appreciated for my work. 3.48 0.61
Shared Values The district is moving in a direction that reflects our mission and vision. 3.48 0.63
LeadershipMy principal or direct supervisor ensures staff morale is high in my school or department.
3.61 0.56
Communication I can influence decisions in my school or department. 3.66 0.52
Note: Items in bold appeared on this slide last school year.

© 2018
Secondary Areas of Strength
30
While these items do not have strong relationships to engagement, the average scores for these statements are high (at or above 3.66). The district should continue its good work in these areas.
© 2018
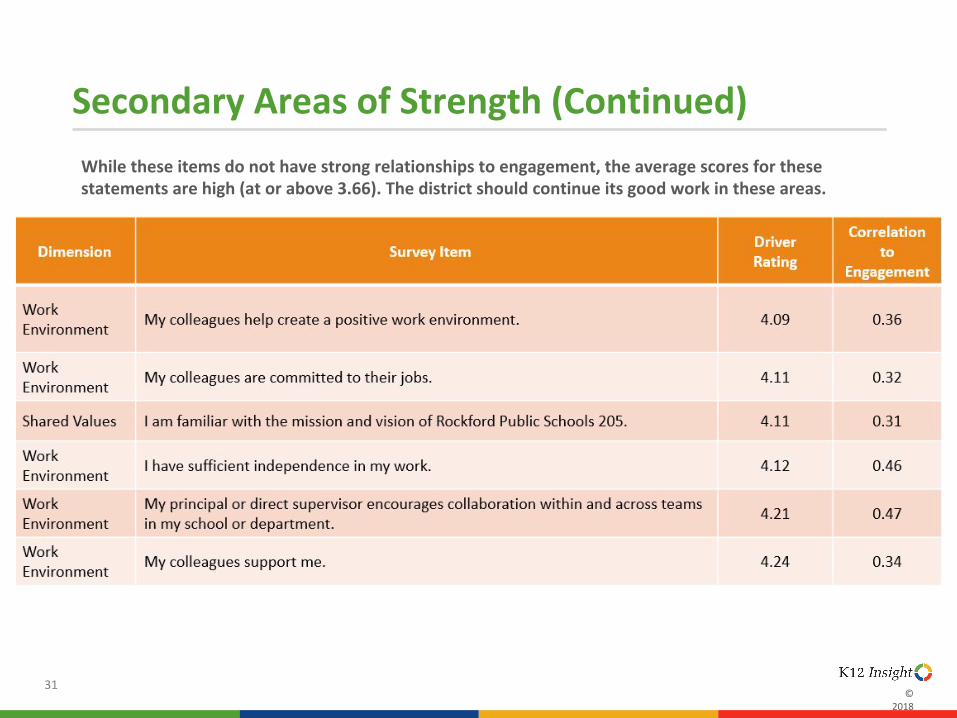
Secondary Areas of Strength (Continued)
31
While these items do not have strong relationships to engagement, the average scores for these statements are high (at or above 3.66). The district should continue its good work in these areas.

© 2018
Improving the Work Environment
32
While these items do not have strong relationships to engagement, the average scores for these statements are low (at or below 3.66). Improving these items will promote a positive work environment.

© 2018
Improving the Work Environment (Continued)
33
While these items do not have strong relationships to engagement, the average scores for these statements are low (at or below 3.66). Improving these items will promote a positive work environment.
© 2018
Engagement by Demographics

© 2018
Engagement by Years of Service
35
© 2018
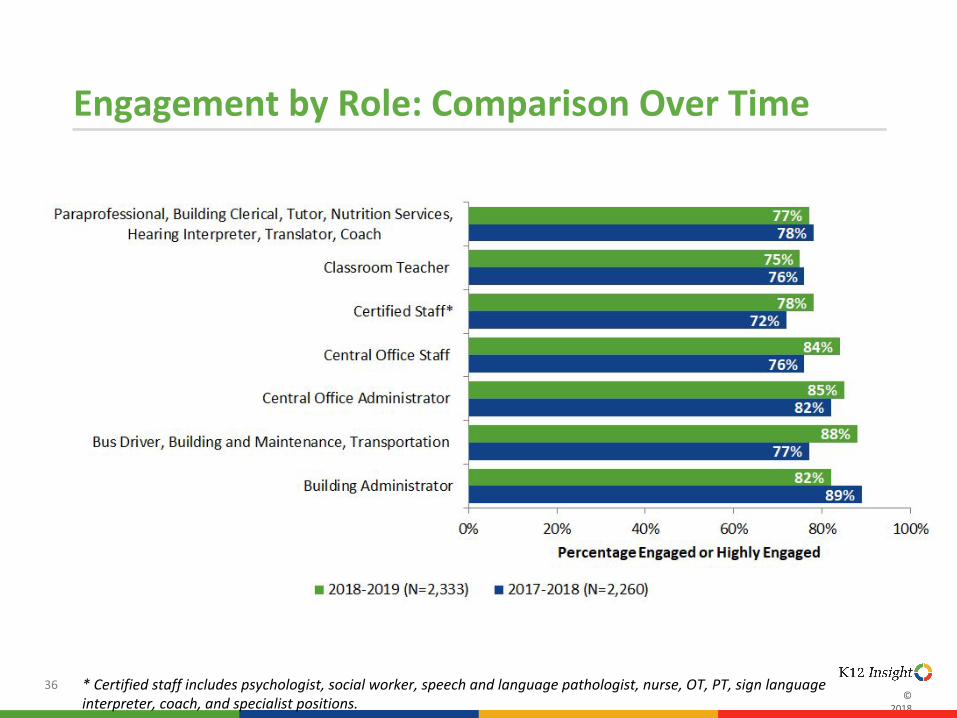
Engagement by Role: Comparison Over Time
36 * Certified staff includes psychologist, social worker, speech and language pathologist, nurse, OT, PT, sign language interpreter, coach, and specialist positions.
© 2018
Additional Questions

© 2018
Principal: Comparison Over Time
How strongly do you disagree or agree with the following statements?
38 Note: Only classroom teachers and certified staff members answered these questions.

© 2018
Collaboration and Input: Comparison Over Time
How strongly do you disagree or agree with the following statements?
39 Note: Only classroom teachers and certified staff members answered these questions.

© 2018
Additional Topics: Comparison Over Time
How strongly do you disagree or agree with the following statements?
40 Note: Only classroom teachers and certified staff members answered these questions.

© 2018
Cell Phone Usage
What type of impact does student cell phone usage have on student engagement? (N=1,600)
41 Note: Only classroom teachers and certified staff members answered these questions.

Positive Trends
42
I feel appreciated for
my work
The district encourages continued education
and professional growth
70% (2018)
66%(2017)
58% (2018)
54%(2017)
I work in an atmosphere where
there is mutual respect among staff
76% (2018)
72%(2017)

Positive Trends
43
37% (2018)
33%(2017)
52% (2018)
48%(2017)
District staff and school employees communicate well
with each other
My PLC is a valuable use of time
(response limited to teachers & certified staff)
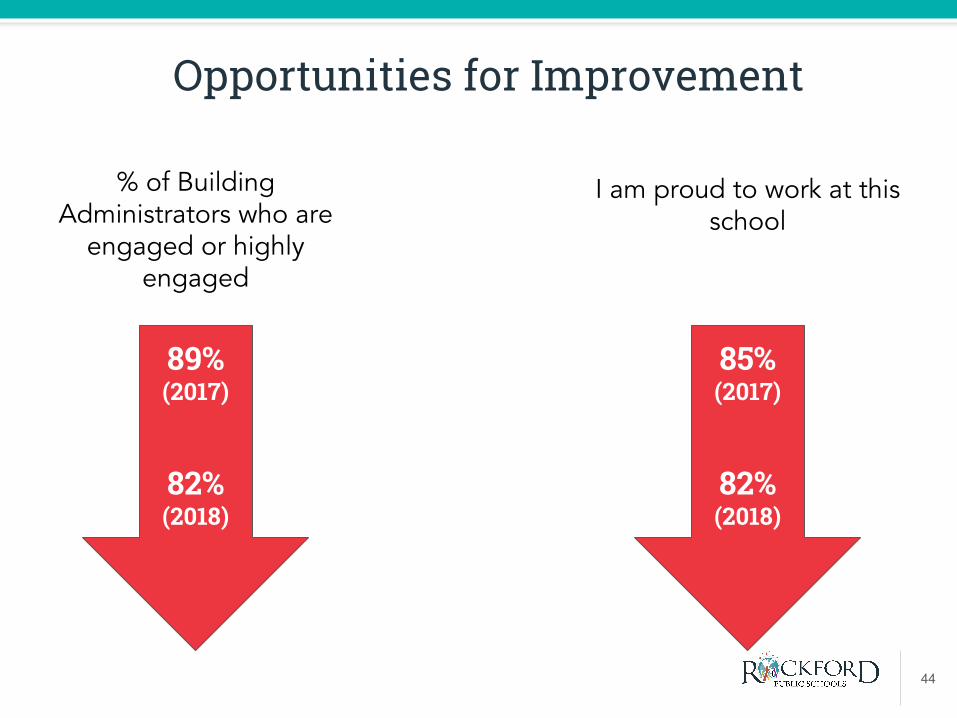
Opportunities for Improvement
44
% of Building Administrators who are
engaged or highly engaged
89%(2017)
82%(2018)
85%(2017)
82%(2018)
I am proud to work at this school

2017-2018-Engaged/Highly Engaged
45
77%(2017 & 2018)
73%(2017)
69%(2018)
All Staff 11-15 Years in District

46
Net Promoter Score (NPS)
The net promoter score serves as a proxy for public confidence in the school and can potentially be connected to district growth.
Questions from the Survey:
How likely are you to recommend Rockford Public Schools 205 to a friend or colleague?
How likely are you to recommend (school name) to a friend or colleague?
The scale:
0 (anchored as not at all likely) to 10 (anchored as extremely likely) 0-6 are considered detractors7-8 are considered passives9-10 are considered promoters
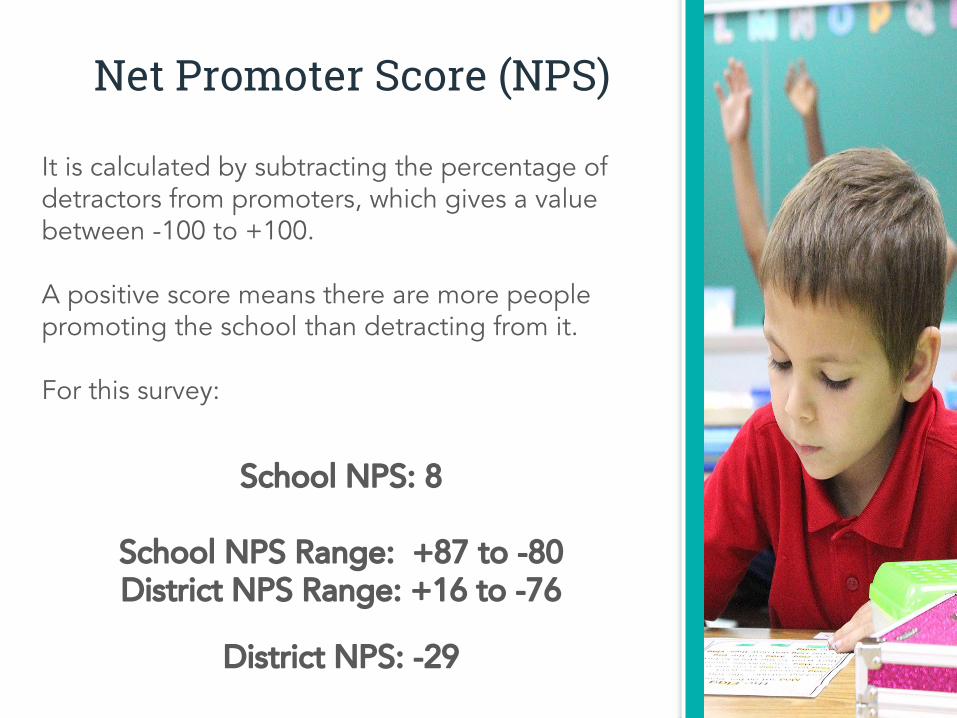
Net Promoter Score (NPS)
It is calculated by subtracting the percentage of detractors from promoters, which gives a value between -100 to +100.
A positive score means there are more people promoting the school than detracting from it.
For this survey:
School NPS: 8
School NPS Range: +87 to -80District NPS Range: +16 to -76
District NPS: -29

48
Net Promoter Score (NPS)


50
Engagement Survey Results-Percentage of staff that are engaged or highly engaged.
Strategic Goal: Match or exceed national standards for identified school level for similar sized districts
District Strategic Goals- Climate & CultureEngagement

51
Employee Engagement Continuous Improvement Cycle
Conduct SurveyOctober
Progress MonitorMarch-May
Analyze ResultsNovember
Action PlanNovember-February
Identify Opportunities for Growth (OFI)
November
Employee Engagement

52
Employee EngagementSurvey Timeline
November 5
Survey Results Distributed to
Schools
Nov 6 & Dec 4
BOE Results Presentations
Sept. 26- October 10
Survey Window
November 6, 14, & 20
Principal Training Making Feedback
Matter
November-January
District-Wide Action Planning
January 23
Action Plan Process Update
* K12 Insight Overall Engagement Scale (12 Question Survey)
Progress Update Follow Up School
Survey*
March 6-20
53
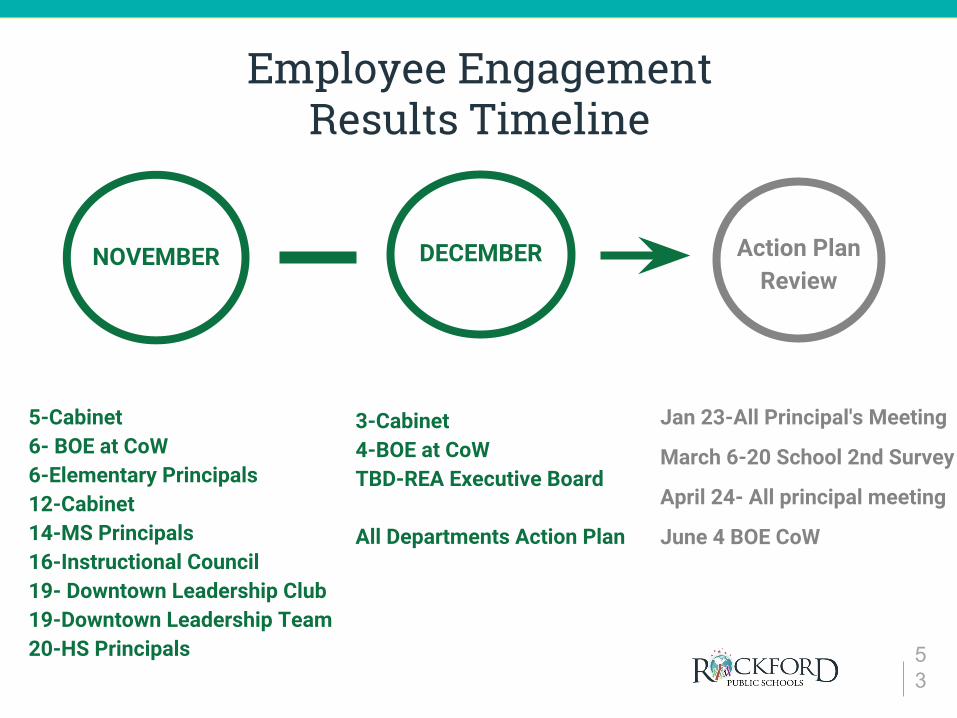
Employee EngagementResults Timeline
NOVEMBER
5-Cabinet6- BOE at CoW6-Elementary Principals12-Cabinet 14-MS Principals16-Instructional Council19- Downtown Leadership Club19-Downtown Leadership Team20-HS Principals
3-Cabinet4-BOE at CoWTBD-REA Executive Board
All Departments Action Plan
DECEMBER
Jan 23-All Principal's Meeting
March 6-20 School 2nd Survey
April 24- All principal meeting
June 4 BOE CoW
Action Plan Review

2017 Identified Opportunities for Improvement
54
33% (2018)
32%(2017)
District Leaders Understand my
Professional Needs
40% (2018)
37%(2017)
District Leaders Actions are
Consistent with Their Words
57% (2018)
56%(2017)
District Leaders Encourage
Employees to Share Ideas to Improve
Performance

2018-19 District Focus
55
33% (2018)
32%(2017)
District leaders understand my
professional needs
40% (2018)
37%(2017)
District leaders actions are
consistent with their words
School NPS: 8
District NPS: -29
Net Promoter Score:
What can we do to increase the internal
confidence of RPS205?

56
2018-19 District Action Plan
1Rou
nding
Focu
s on N
et Pro
moter,
stude
nt res
ults &
actio
ns
cons
isten
t with
wor
ds
2Acti
on P
lannin
g
Contin
uous
impr
ovem
ent
cycle
for s
choo
ls an
d
depa
rtmen
ts3
Profe
ssion
al
Develo
pmen
t
Increa
se te
ache
r voic
e in
plann
ing pr
ofes
siona
l
deve
lopmen
t opp
ortun
ities
4Prin
cipal
Suppo
rt
Collec
tively
plan
princ
ipal
deve
lopmen
t and
meetin
gs to
ensu
re a
unifie
d mes
sage

57
Employee EngagementSurvey Timeline
November 5
Survey Results Distributed to
Schools
Nov 6 & Dec 4
BOE Results Presentations
Sept. 26- October 10
Survey Window
November 6, 14, & 20
Principal Training Making Feedback
Matter
November-January
District-Wide Action Planning
January 23
Action Plan Process Update
* K12 Insight Overall Engagement Scale (12 Question Survey)
Progress Update Follow Up School
Survey*
March 6-20