Embed Size (px)
DESCRIPTION
Board of Directors Study - Australia and New Zealand 2009
Citation preview
Board of Directors StudyAustralia and New Zealand
2009

IV
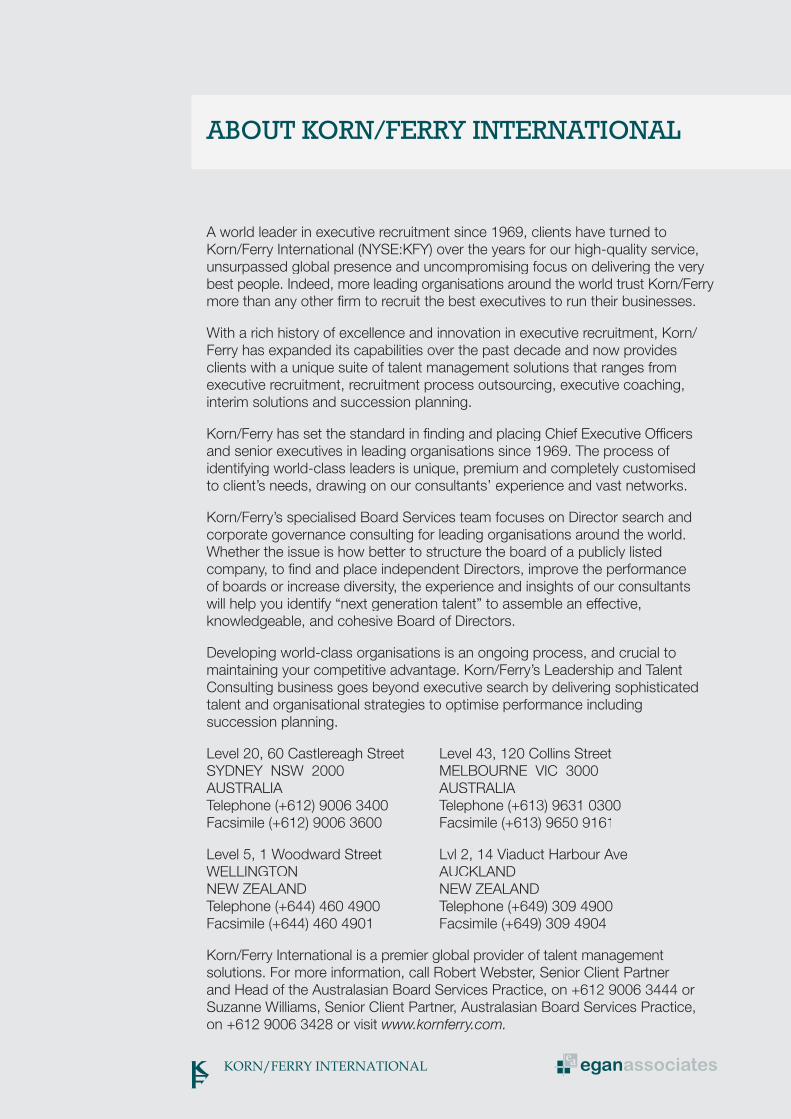
A world leader in executive recruitment since 1969, clients have turned to Korn/Ferry International (NYSE:KFY) over the years for our high-quality service,unsurpassed global presence and uncompromising focus on delivering the verybest people. Indeed, more leading organisations around the world trust Korn/Ferry more than any other firm to recruit the best executives to run their businesses.
With a rich history of excellence and innovation in executive recruitment, Korn/Ferry has expanded its capabilities over the past decade and now provides clients with a unique suite of talent management solutions that ranges from executive recruitment, recruitment process outsourcing, executive coaching, interim solutions and succession planning.
Korn/Ferry has set the standard in finding and placing Chief Executive Officersand senior executives in leading organisations since 1969. The process of identifying world-class leaders is unique, premium and completely customised to client’s needs, drawing on our consultants’ experience and vast networks.
Korn/Ferry’s specialised Board Services team focuses on Director search and corporate governance consulting for leading organisations around the world. Whether the issue is how better to structure the board of a publicly listed company, to find and place independent Directors, improve the performance of boards or increase diversity, the experience and insights of our consultants will help you identify “next generation talent” to assemble an effective, knowledgeable, and cohesive Board of Directors.
Developing world-class organisations is an ongoing process, and crucial to maintaining your competitive advantage. Korn/Ferry’s Leadership and TalentConsulting business goes beyond executive search by delivering sophisticated talent and organisational strategies to optimise performance including succession planning.
Level 20, 60 Castlereagh Street Level 43, 120 Collins Street SYDNEY NSW 2000 MELBOURNE VIC 3000AUSTRALIA AUSTRALIA Telephone (+612) 9006 3400 Telephone (+613) 9631 0300Facsimile (+612) 9006 3600 Facsimile (+613) 9650 9161
Level 5, 1 Woodward Street Lvl 2, 14 Viaduct Harbour AveWELLINGTON AUCKLANDNEW ZEALAND NEW ZEALANDTelephone (+644) 460 4900 Telephone (+649) 309 4900 Facsimile (+644) 460 4901 Facsimile (+649) 309 4904
Korn/Ferry International is a premier global provider of talent management solutions. For more information, call Robert Webster, Senior Client Partner and Head of the Australasian Board Services Practice, on +612 9006 3444 or Suzanne Williams, Senior Client Partner, Australasian Board Services Practice, on +612 9006 3428 or visit www.kornferry.com.
ABOUT KORN/FERRY INTERNATIONAL
Egan Associates provides information and advice to Boards and Chief Executives of leading organisations in both Australia and New Zealand across all industrysectors and government.
Established in 1989, Egan Associates has continuing relationships with some of the largest organisations in the region. John Egan and the firm’s Principals have well-developed long-term affiliations with leaders within both the public and private sectors.
Egan Associates maintains a comprehensive Director and senior executive remuneration database for Australia and New Zealand and draws on international resources where necessary. Our clients extend across the complete breadth of the market from leading public companies, those preparing for listing, private andinternational corporations, government and related corporatised entities, as wellas innovative enterprises.
Egan Associates act as independent advisers to Boards and additionally provideinformation and advisory services to an extensive range of companies on Non Executive Directors’ emoluments, CEO and executive reward, including both annual and long term incentive programs. Increasingly, Egan Associates are engaged in the provision of advice on strategic and corporate governance issues, preparation of explanatory notes for Annual General Meetings and company remuneration reports for shareholder review, as well as attesting to the reasonableness of CEO and Executive Director reward arrangements.
Details of our services can be reviewed on the company’s website.EGAN ASSOCIATES Level 16, 6 O’Connell Street GPO Box 4130Sydney NSW 2000 Sydney NSW 2001AUSTRALIA AUSTRALIA Telephone (+612) 9225 3225 Facsimile (+612) 9225 3235
For more information, visit Egan Associates’ website www.eganassociates.com.au or call John Egan, Practice Chairman on (+612) 9225 3225.
ABOUT EGAN ASSOCIATES
Preface . . . . . . . . . . . . . . . . . . . . . . . . . . . . . . . . . . . . . . . . . . . . . . . . . . . . . . 1
Introduction . . . . . . . . . . . . . . . . . . . . . . . . . . . . . . . . . . . . . . . . . . . . . . . . . . . 2
Editorial Comment . . . . . . . . . . . . . . . . . . . . . . . . . . . . . . . . . . . . . . . . . . . . . . 4
Information and Interpretation . . . . . . . . . . . . . . . . . . . . . . . . . . . . . . . . . . . . . 8
Australia: Non Executive Chairmen and Non Executive Directors Fees . . . . . . 10
Australia: Board Demographics . . . . . . . . . . . . . . . . . . . . . . . . . . . . . . . . . . . 14
Australia: Board Committees . . . . . . . . . . . . . . . . . . . . . . . . . . . . . . . . . . . . . 16
New Zealand: Non Executive Chairmen and Non Executive Directors Fees . . 21
New Zealand: Board Demographics . . . . . . . . . . . . . . . . . . . . . . . . . . . . . . . 24
New Zealand: Board Committees . . . . . . . . . . . . . . . . . . . . . . . . . . . . . . . . . 25
Appendix . . . . . . . . . . . . . . . . . . . . . . . . . . . . . . . . . . . . . . . . . . . . . . . . . . . . 26
CONTENTS
1
PREFACE
The 2009 Board of Directors Study, Australia and New Zealand is published by Korn/Ferry International in partnership with Egan Associates. This year wediscuss the various trends in Non Executive Director selection, many of which are a consequence of the Global Financial Crisis and recent court decisions involving Board Members.
Chief Executive Officer succession planning has also assumed greater focus for Boards as the “War for Talent” heats up.
Another “top of mind” issue is executive remuneration, which has received significant attention from the media, governments and regulators around theworld, with the governments of Australia and New Zealand yet to clearly state (or legislate) their positions. A consequence of the Global Financial Crisis andits impact on listed companies is that Boards and Non Executive Directors areworking harder and are facing greater liability and accountability than ever before.Thus, it stands to reason that, when the dust finally settles, remuneration of Non Executive Directors must receive long overdue attention as well.
Korn/Ferry International and Egan Associates are actively involved in responding to the issues that have been raised by shareholders, governments, regulatorsand clients.
Our 2009 Board of Directors Study has been published at a crucial point in this debate. We trust you find it informative and that it assists your Board in its consideration of these important issues.
Gary Reidy John EganManaging Director, Australasia ChairmanAusKorn/Ferry International Egan Associates atio
2
INTRODUCTION
Amidst the executive remuneration challenges and additional workload createdfor Non Executive Directors (NEDs) by the Global Financial Crisis (GFC), Boardshave still found the time to concentrate on several other important areas of governance during a tempestuous 2009.
CEO SuccessionThe well-used adage that “the most important task of a Board of Directors is to appoint the right CEO” has come into sharper focus during the GFC, particularlyas Boards have recognised the importance of valuing and nurturing their internal executive talent. The natural instincts of many Boards to look externally first, when replacing their CEO and C-suite executives, have been curbed in favour of identifying and developing their own talent as part of succession planning.Korn/Ferry International has been an industry leader in recognising and responding to this trend. The emergence of our global Leadership and Talent Consulting(LTC) practice has been well received by clients in Australia and New Zealandas an efficient and independent means of assessing and benchmarking internaltalent and then implementing plans to develop and foster that talent as part of a succession strategy. Many Boards have made the obligation to develop internal successors a part of their CEO’s Key Performance Indicators (KPIs) linked toCEO remuneration, a clear strategy to focus the minds of NEDs and the CEO on succession planning.
Statistically, US listed companies have had greater success with appointing internal executives to CEO than with those CEOs who have been appointed externally. The Australian picture is less clear, but there is no doubting the fact that Top 100 companies are taking internal succession to CEO much more seriously. It is worth noting that in the 2008 and 2009 financial years in Australia,there were 17 new CEO appointments in the ASX Top 50 and of these, 13 were internal and only four were external.
Risk Management The GFC has naturally placed risk management in its various manifestations (financial, business, market, and reputational) at the forefront of board discussions. Directors are less likely to delegate to management than in the past and thistrend has placed a greater responsibility and workload on Board Committees.Once it was only the Audit Committee of a Board that sought and received independent external advice, now the Human Resource and Remuneration Committee, the Risk Committee and even the Sustainability Committee commonly seek external advice on or verification of matters before them. The legal obligations on NEDs to be fully informed and to understand all matters before the Board, and the very public legal consequences of not understanding these obligations, has led to significant changes in boardroom behaviour.
3
NED SelectionThe Korn/Ferry International Board Practice is often asked to comment on trends in the selection of new NEDs to public company Boards. Whilst the old adage of choosing NEDs with senior executive experience, strong commerciality, integrity, wisdom and judgment still prevail, there are two quite strong trends emerging that place the generalist Director at a disadvantage. Specific industryexperience or domain knowledge has become a consistent requirement in many board searches.That is not to say that Boards ought to be entirely populated with specialist Directors, but recent history suggests that the nature of an organisation’s business will have an impact on the knowledge they seek. Having the right balance of industry and functional skills is essential, particularly when organisations face difficult times. A current example of this trend is therequirement by some Boards for NEDs with knowledge of the climate change,sustainability and carbon trading issues which are to the fore of current political debate.
There is also an increasing demand for NEDs who have significant commercial management experience offshore, particularly in the emerging markets of Asia, Eastern Europe and South America, as well as the USA and Europe. This trendhas been driven by the early failures of some Australian companies venturing intothe global marketplace. This demand is met either by appointing Australians whohave returned to reside here, or, less frequently, by appointing offshore NEDswho fly in for meetings or attend by video conference. The other option is to appoint regional Advisory Boards which meet in situ with representation from the principal Board in Australia. Each of these methods of tapping into the “global NED pool” can work well for Boards that are committed and flexible. Our view is that this “global NED” trend is here to stay.
Finally, as Boards renew themselves there is the emerging phenomenon of relatively younger NEDs who, nevertheless, have the requisite skills, knowledgeand experience to make a significant contribution. Typically, these individualshave been mentored by senior NEDs who are prepared to “sponsor” them. We believe that Boards that are willing to appoint new Directors who offer gender, age, ethnic or cultural diversity will benefit from the invigorated debate and thought leadership provided.

4
EDITORIAL COMMENT
Challenges of Boards and Board Remuneration CommitteesInvolvement by G20 governments in the establishment of remuneration principlesapplicable in the financial services sector has extended to many western countries. They are concerned with the level of engagement of Boards in the containment of executive remuneration and the alignment of executive remuneration, in particular with the embedded risk not adequately identified in annual incentive plans.
The Australian Government has embarked on an extensive program of consultation in this area. The interim report of the Productivity Commission references a number of the Korn Ferry/Egan Associates reports. Our submission (105) is on their website. The Commission’s recommendation that an entire Board should submit itself for re-election if more than 25% (a minority) of shareholders vote against the Remuneration Report two years running is one of its more controversial proposals.
In light of the global focus on remuneration and corporate governance, it is our judgment that the role and accountability of Boards and Board RemunerationCommittees in particular, will be enhanced in the period ahead. While not necessarily taking on obligations comparable to that of the Audit, Risk Management and Compliance Committee, this Committee will have a heightened focus and require the engagement of its Chairman.
We believe that Remuneration Committees will be required to not only approve the level of payment for Chief Executives and their direct reports, but also sign off on incentive plans in which all employees participate. They will also have to auditthe level of incentive payments made throughout the organisation and review theappropriateness of those payments as a proportion of their company’s overalllevel of profitability.
We believe remuneration will be directly linked to an increased focus on profitimprovement from year to year. Shareholders may also seek a comprehensiveexplanation of the basis for incentive payments which are not directly aligned tothe reported year’s profit achievements and profit improvement. In this context, while the balanced scorecard construct is widely used, it is not well understoodby retail shareholders.
In considering regulation of executive remuneration, it is not feasible for specific regulation to be applied too far into the process. This has been acknowledged by the development of governance guidelines. With the increased complexity of commerce, it would be useful to remind Boards of some of the basic tenetswhich assist in the management of remuneration. One of these aspects of governance is the role of the Remuneration Committee.
The role of the Remuneration Committee is not to do the work of management
5
but to work with management in ensuring that key issues are readily addressedand differing perspectives shared.
The role could be summarised as follows:
Assist the Board in establishing effective employment and remunerationpolicies :
assess the underlying risk associated with the generation of income or profits where they represent drivers or triggers of remuneration payments, particularly short term incentives or annual bonuses;
assess the P&L and balance sheet implications of remuneration programs under consideration;
ensure the company is able to attract, retain and motivate effective executives;
ensure that executives are rewarded fairly in the context of the financial environment, industry sector practice, competitive influences and corporate and personal performance;
conduct audits of all remuneration disclosures including the Remuneration Report;
ensure the equitable application of policies in numerous jurisdictions where the company has a significant presence;
audit service agreements, particularly termination agreements of senior staff ensuring their appropriateness;
monitor market trends and seek input from executive search firms or others in order to ensure that the company’s practices are contemporary;
review succession and talent issues in ensuring availability of senior management resources;
sign off on the framework of employment agreements of all senior executive hires;
ensure compliance with the regulations and governance standards applying from time to time.
g
6
Approve employment policies, including remuneration policies applicable to specified levels of executives in the Company, including:
quantum of fixed annual remuneration;
short-term incentive plan parameters;
long-term incentive plan participation, including vesting and performance conditions;
appointment conditions, including termination provisions and unlatching costs, if any;
oversee compliance with disclosure requirements in light of:
– government requirements;
– stakeholder interests;
– commercial and sectorial influences.
Review the structure, compliance and effectiveness of the company’s superannuation arrangements.
Engage appropriate remuneration consultants to provide analysis, information and advice from time to time. Settle their terms of reference and basis of independence.
Egan Associates have been engaged to assist both management and Boards to address remuneration issues, both jointly and independently, of one another. Given the increasing complexity of stakeholder management, Boards may wellbe more at ease with separate advisers.
Variations in the role of the CommitteeThe list above is a broad outline of potential accountabilities. It is not exhaustiveand does not include the broader obligation of some Committees with anintimate involvement in broader human resource and organisation issues.
Boards need to design the role of the Committee to suit the size, complexity,function and local or global footprint of the company. The clarity of the role and the general acceptance of that role across the organisation is vital to its effectivefunctioning.
DisclosureWe envisage that in both Australia and New Zealand there will be an increasedfocus on disclosure by Directors in relation to executive remuneration. We also envisage a recommendation, though not a regulatory requirement, that Boardsappoint a remuneration consultant as an independent advisor to them. That advisor, if not different to the advisor to management, should be separatelybriefed by the Board in respect of issues required to be addressed by the Board.
7
It is our judgment that the Remuneration Committee will need to commentspecifically and in considerable detail on the basis of cash incentive payments made to executives, the existence of performance gateways, the existence of any deferral component (whether in the form of cash or equity aligned) and clawback provisions if any. The competitive positioning adopted by the company andthe basis of that determination be it scale, industry specific, global in nature oroccupationally specific should also be taken into consideration.
Non Executive Directors’ Equity ParticipationIn Australia the practice, particularly among the leading companies, of Directors,on a mandatory basis, agreeing to defer a proportion of their fees for the purpose of acquiring shares in the company will be substantially curtailed by the foreshadowed legislation, which will limit tax deferral to an amount of $5,000. In New Zealand these provisions are not available.
In New Zealand executives and Directors, who on a mandatory basis are required to acquire a shareholding in the company, do so on an after tax basis. It is our expectation that if past practice is continued in Australia, a judgment will be entered into whereby a gross proportion of a Director’s fees are required to be set aside each year for the purpose of acquiring shares in the company,those shares being acquired by the Director on an after tax basis, whether organised through a Directors’ Share Plan or independently by the Director, who would be required to advise the company formally at the end of each financialyear that they have met their mandatory share acquisition requirements.
We believe in this context, should these practices continue, Boards will set a limitto the level of shareholding required to be held by Directors, and that limit is likelyto be between 50% and 100% of their gross annual fees.
Where these plans currently exist, given the performance of the global capitalmarkets, a significant number of Directors who may have previously met their mandatory shareholding requirements, will now be in deficit.
As Non Executive Directors in significant companies in both Australia and New Zealand do not receive any performance aligned payment, Boards may question the continuing mandatory requirement for the deferral of their compensationfor the acquisition of shares, or alternatively put to shareholders a performance alignment strategy in relation to their remuneration.
8
INFORMATION AND INTEPRETATION
The data for the 2009 Board of Directors Study, Australia and New Zealand has been compiled by Egan Associates from an analysis of published informationfrom annual reports (through to December 2008) of leading companies in Australia and New Zealand.
The number of Australian companies included in this Study is 300, while thenumber of New Zealand companies 50.
For this 2009 Study, the revenue ranges and market capitalisation ranks for Australian and New Zealand companies continue to reflect those adopted in prior years, though the constituents in these groups of companies will vary in accordance with individual corporate circumstances, as will the constituents in ranked companies.
2009 Revenue and Market Capitalisation Ranges (Australia and New Zealand)Greater than $10 billion$5 - $10 billion $2 - $5 billion $500 million - $2 billion$200 - $500 million Less than $200 million
2009 Revenue and Market Capitalisation Ranks (Australia)Top 50 CompaniesSecond 50 Companies Top 100 Companies Top 100 - 200 CompaniesTop 200 - 300 Companies
2009 Revenue and Market Capitalisation Ranks (New Zealand)Top 10 CompaniesTop 10 - 25 CompaniesTop 25 - 50 Companies
The fees analysis includes base or retainer fees, committee fees, disclosed contributions to Directors’ retirement, including mandatory contributions underthe Australian Superannuation Guarantee legislation. In the aggregate fees we also incorporate voluntary or mandatory setting aside of fees for the purpose of acquiring shares in a company, though exclude disclosed retirement benefit accruals.
While data is based on published information reported in respect of financial year ending 31 December 2008, the Market Capitalisation ranking adopted in thisStudy has been determined as at 30 June 2009 with a smoothing applied.
9
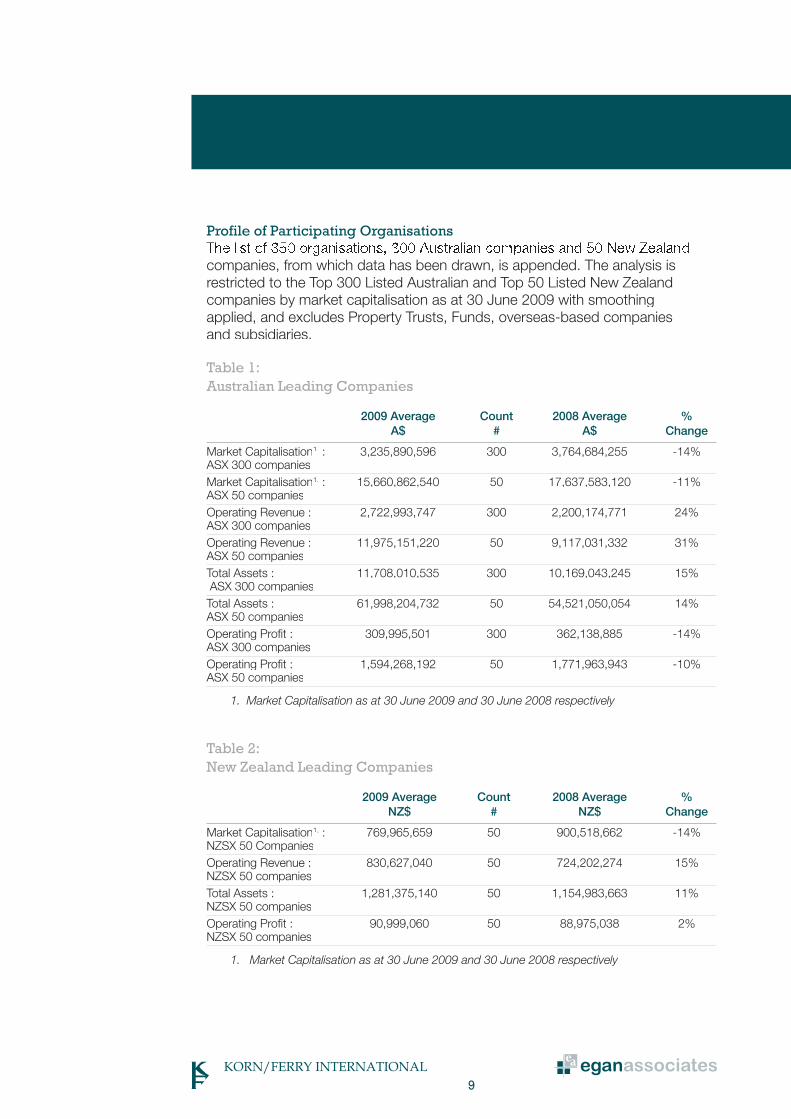
Profile of Participating Organisations
companies, from which data has been drawn, is appended. The analysis is restricted to the Top 300 Listed Australian and Top 50 Listed New Zealand companies by market capitalisation as at 30 June 2009 with smoothing applied, and excludes Property Trusts, Funds, overseas-based companies and subsidiaries.
Table 1: Australian Leading Companies
2009 Average Count 2008 Average % A$ # A$ Change
Market Capitalisation1. : 3,235,890,596 300 3,764,684,255 -14%ASX 300 companiesMarket Capitalisation1. : 15,660,862,540 50 17,637,583,120 -11%ASX 50 companiesOperating Revenue : 2,722,993,747 300 2,200,174,771 24% ASX 300 companiesOperating Revenue : 11,975,151,220 50 9,117,031,332 31% ASX 50 companiesTotal Assets : 11,708,010,535 300 10,169,043,245 15% ASX 300 companiesTotal Assets : 61,998,204,732 50 54,521,050,054 14% ASX 50 companiesOperating Profit : 309,995,501 300 362,138,885 -14% ASX 300 companiesOperating Profit : 1,594,268,192 50 1,771,963,943 -10% ASX 50 companies
1. Market Capitalisation as at 30 June 2009 and 30 June 2008 respectively
Table 2: New Zealand Leading Companies
2009 Average Count 2008 Average % NZ$ # NZ$ Change
Market Capitalisation1. : 769,965,659 50 900,518,662 -14%NZSX 50 CompaniesOperating Revenue : 830,627,040 50 724,202,274 15% NZSX 50 companiesTotal Assets : 1,281,375,140 50 1,154,983,663 11% NZSX 50 companiesOperating Profit : 90,999,060 50 88,975,038 2% NZSX 50 companies
1. Market Capitalisation as at 30 June 2009 and 30 June 2008 respectively
10
Australia: Non Executive Chairmen and Non Executive Directors’ Fees in Australian Leading Companies by Revenue Non Executive Chairmen fees have been analysed according to company size, that is by revenue and market capitalisation.
Of the ASX 300 Australian companies, we have been able to include 227 Non Executive Chairmen (we exclude overseas-based incumbents, Executive Chairmen and those incumbents who only served a part year).
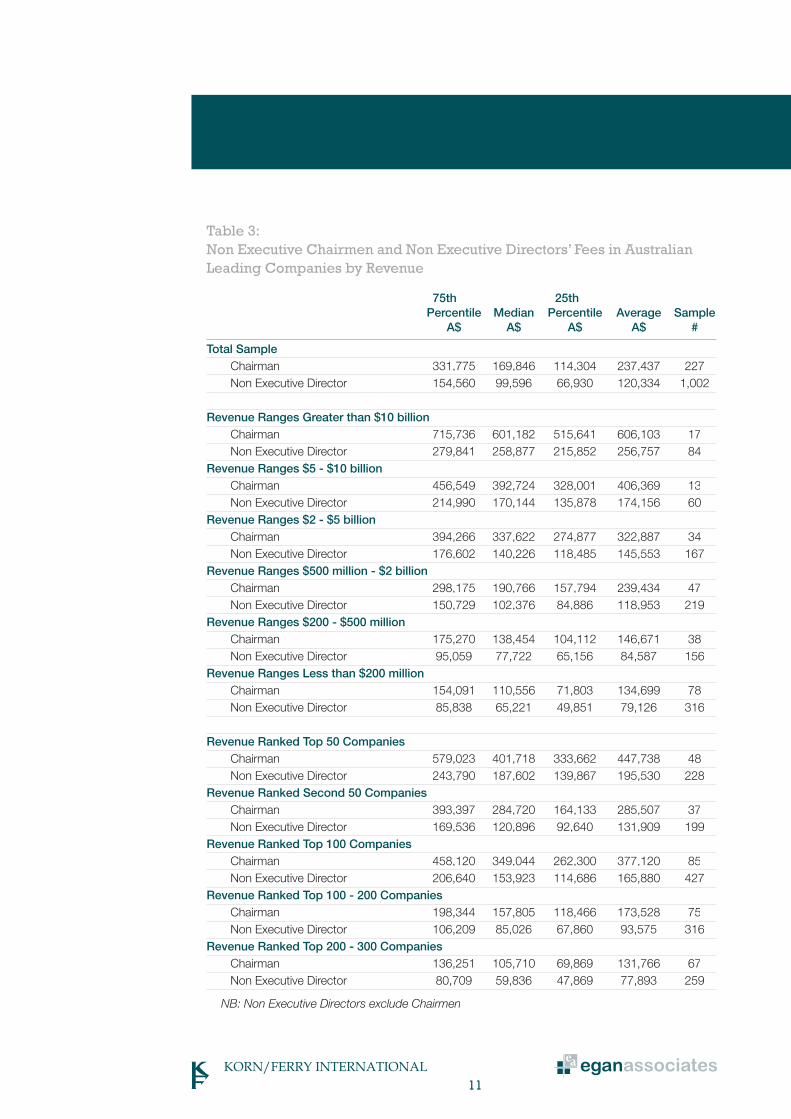
Table 3 reveals that the average fee payable to a Chairman in the ASX 300 Australian companies stood at $237,437, at the median $169,846 and at the75th percentile $331,775.
Non Executive Directors’ fees among the same organisations on average stood at $120,334, at the median $99,596 and at the 75th percentile $154,560.
The average fee payable to a Non Executive Chairman varied according to organisation scale. Among those companies with revenues of less than $200 million the Chairman’s fee on average stood at $134,699, whereas among companies with revenues greater than $10 billion the fee was $606,103. The median Chairman fees among the smallest companies stood at $110,556,whereas among the largest in revenue terms stood at $601,182. At the 75thpercentile the variance was from $154,091 to $715,736.
In grouping companies within revenue clusters, taking the Top 50, Second 50, Top 100, then those companies ranked in revenue terms between the Top 100and 200 and the Top 200 and 300, reveals similar dispersion in relation to feespayable to Chairmen and Non Executive Directors. The highest paid Non Executive Directors, including Chairmen, being in companies with the mostsubstantial revenues and the least well paid being in those organisations rankedbelow the ASX Top 200.
AUSTRALIA
11
Table 3: Non Executive Chairmen and Non Executive Directors’ Fees in Australian Leading Companies by Revenue
75th 25th Percentile Median Percentile Average Sample A$ A$ A$ A$ #
Total Sample Chairman 331,775 169,846 114,304 237,437 227
Non Executive Director 154,560 99,596 66,930 120,334 1,002
Revenue Ranges Greater than $10 billionChairman 715,736 601,182 515,641 606,103 17
Non Executive Director 279,841 258,877 215,852 256,757 84Revenue Ranges $5 - $10 billion Chairman 456,549 392,724 328,001 406,369 13 Non Executive Director 214,990 170,144 135,878 174,156 60Revenue Ranges $2 - $5 billion Chairman 394,266 337,622 274,877 322,887 34 Non Executive Director 176,602 140,226 118,485 145,553 167Revenue Ranges $500 million - $2 billion Chairman 298,175 190,766 157,794 239,434 47 Non Executive Director 150,729 102,376 84,886 118,953 219Revenue Ranges $200 - $500 million
Chairman 175,270 138,454 104,112 146,671 38 Non Executive Director 95,059 77,722 65,156 84,587 156Revenue Ranges Less than $200 million Chairman 154,091 110,556 71,803 134,699 78 Non Executive Director 85,838 65,221 49,851 79,126 316
Revenue Ranked Top 50 Companies Chairman 579,023 401,718 333,662 447,738 48 Non Executive Director 243,790 187,602 139,867 195,530 228Revenue Ranked Second 50 Companies Chairman 393,397 284,720 164,133 285,507 37 Non Executive Director 169,536 120,896 92,640 131,909 199Revenue Ranked Top 100 Companies Chairman 458,120 349,044 262,300 377,120 85 Non Executive Director 206,640 153,923 114,686 165,880 427Revenue Ranked Top 100 - 200 Companies Chairman 198,344 157,805 118,466 173,528 75 Non Executive Director 106,209 85,026 67,860 93,575 316Revenue Ranked Top 200 - 300 Companies Chairman 136,251 105,710 69,869 131,766 67 Non Executive Director 80,709 59,836 47,869 77,893 259
NB: Non Executive Directors exclude Chairmen
12
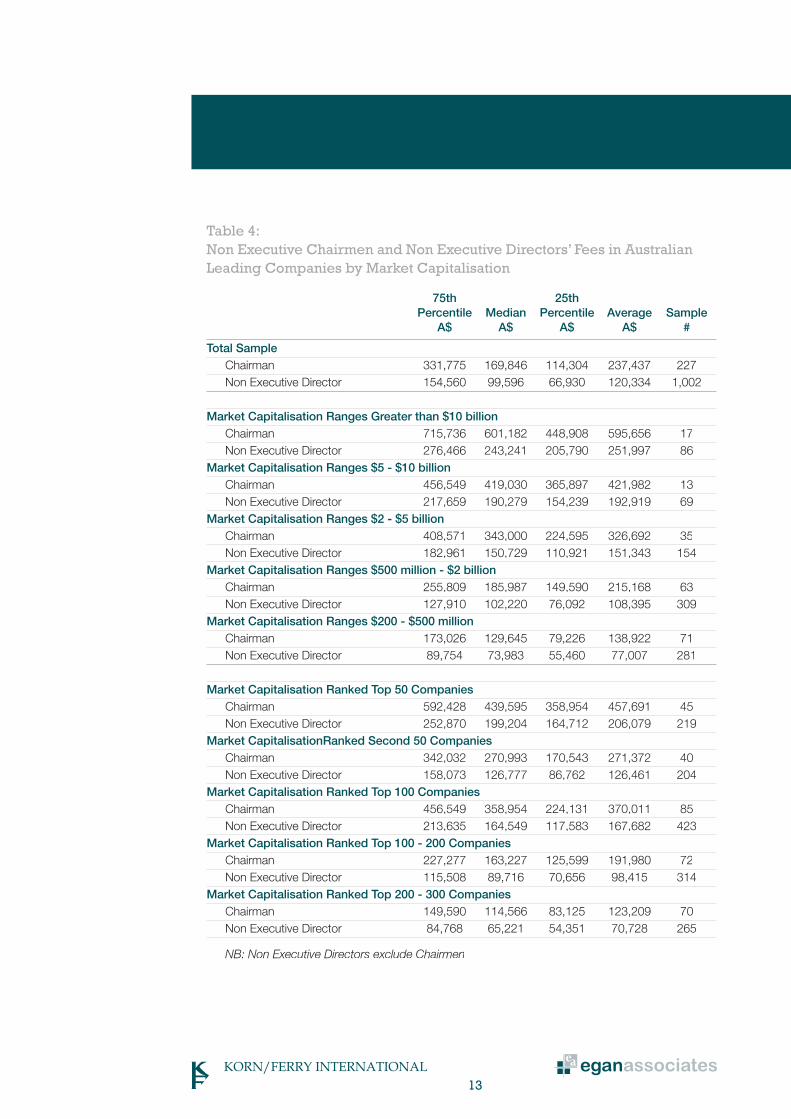
Non Executive Chairmen and Non Executive Directors’ Fees in Australian Leading Companies by Market Capitalisation Australia’s largest companies by market capitalisation (Table 4) reveal an averageChairman’s fee of $595,656, at the median $601,182 and at the 75th percentile $715,736. For those companies with a market capitalisation between $200 and $500 million, the average Chairman’s fee stood at $138,922, at the median $129,645 and at the 75th percentile $173,026.
Among the ASX Top 50, the average Chairman’s fee stood at $457,691, at the median $439,595 and at the 75th percentile $592,428. Among those companiesranked in the ASX 200 to 300, the average Chairman’s fee stood at $123,209, atthe median $114,566 and at the 75th percentile $149,590.
For Non Executive Directors, the average fee for a Director serving on a company with a market capitalisation in excess of $10 billion stood at $251,997, at themedian $243,241 and at the 75th percentile $276,466. For those Directorsserving on Boards with a market capitalisation between $200 and $500 million,the average fee was $77,007, at the median $73,983 and at the 75th percentile$89,754.
In the most populous group, that is those with a market capitalisation between $500 million and $2 billion, the average Director’s fee stood at $108,395, at themedian $102,220 and at the 75th percentile $127,910.
Among the ASX Top 50, the average Director’s fee stood at $206,079, at the median $199,204 and at the 75th percentile $252,870. Among those companies ranked between 200 and 300 on the ASX, the average Director’s fee was$70,728, at the median $65,221 and at the 75th percentile $84,768.
13
Table 4: Non Executive Chairmen and Non Executive Directors’ Fees in Australian Leading Companies by Market Capitalisation
75th 25th Percentile Median Percentile Average Sample A$ A$ A$ A$ #
Total Sample Chairman 331,775 169,846 114,304 237,437 227 Non Executive Director 154,560 99,596 66,930 120,334 1,002
Market Capitalisation Ranges Greater than $10 billion Chairman 715,736 601,182 448,908 595,656 17 Non Executive Director 276,466 243,241 205,790 251,997 86Market Capitalisation Ranges $5 - $10 billion Chairman 456,549 419,030 365,897 421,982 13 Non Executive Director 217,659 190,279 154,239 192,919 69Market Capitalisation Ranges $2 - $5 billion Chairman 408,571 343,000 224,595 326,692 35 Non Executive Director 182,961 150,729 110,921 151,343 154Market Capitalisation Ranges $500 million - $2 billion Chairman 255,809 185,987 149,590 215,168 63 Non Executive Director 127,910 102,220 76,092 108,395 309Market Capitalisation Ranges $200 - $500 million Chairman 173,026 129,645 79,226 138,922 71 Non Executive Director 89,754 73,983 55,460 77,007 281
Market Capitalisation Ranked Top 50 Companies Chairman 592,428 439,595 358,954 457,691 45 Non Executive Director 252,870 199,204 164,712 206,079 219Market CapitalisationRanked Second 50 Companies Chairman 342,032 270,993 170,543 271,372 40 Non Executive Director 158,073 126,777 86,762 126,461 204Market Capitalisation Ranked Top 100 Companies Chairman 456,549 358,954 224,131 370,011 85 Non Executive Director 213,635 164,549 117,583 167,682 423Market Capitalisation Ranked Top 100 - 200 Companies Chairman 227,277 163,227 125,599 191,980 72 Non Executive Director 115,508 89,716 70,656 98,415 314Market Capitalisation Ranked Top 200 - 300 Companies Chairman 149,590 114,566 83,125 123,209 70 Non Executive Director 84,768 65,221 54,351 70,728 265
NB: Non Executive Directors exclude Chairmen
14
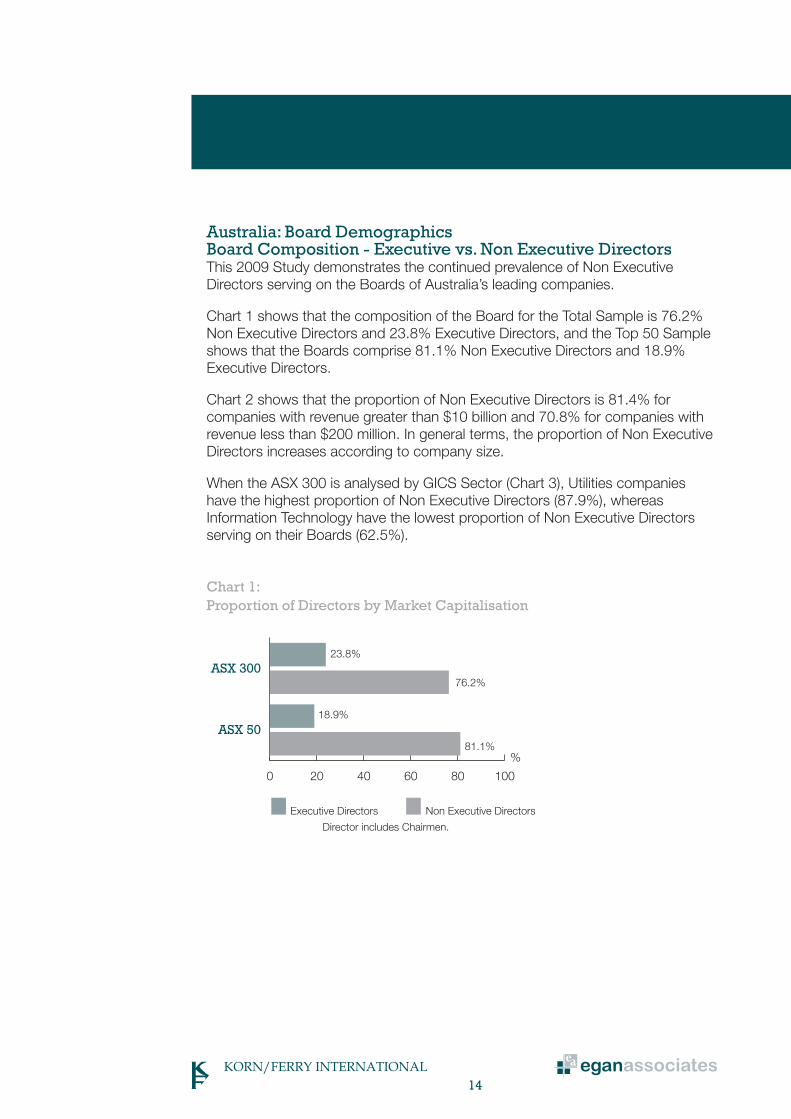
Australia: Board DemographicsBoard Composition - Executive vs. Non Executive DirectorsThis 2009 Study demonstrates the continued prevalence of Non Executive Directors serving on the Boards of Australia’s leading companies.
Chart 1 shows that the composition of the Board for the Total Sample is 76.2%Non Executive Directors and 23.8% Executive Directors, and the Top 50 Sampleshows that the Boards comprise 81.1% Non Executive Directors and 18.9% Executive Directors.
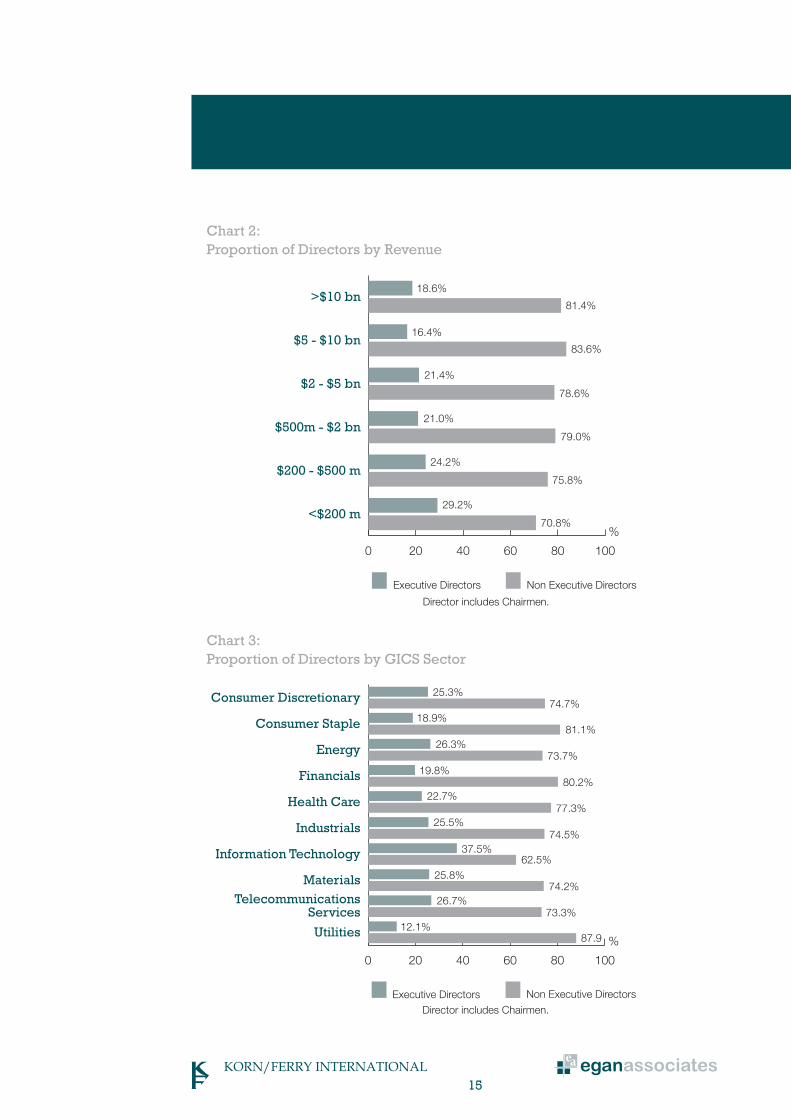
Chart 2 shows that the proportion of Non Executive Directors is 81.4% for companies with revenue greater than $10 billion and 70.8% for companies withrevenue less than $200 million. In general terms, the proportion of Non Executive Directors increases according to company size.
When the ASX 300 is analysed by GICS Sector (Chart 3), Utilities companies have the highest proportion of Non Executive Directors (87.9%), whereas Information Technology have the lowest proportion of Non Executive Directorsserving on their Boards (62.5%).
Chart 1: Proportion of Directors by Market Capitalisation
0 20 40 60 80 100
Non Executive DirectorsExecutive Directors
ASX 50
ASX 300
%
18.9%
23.8%
76.2%
81.1%
Director includes Chairmen.
15
Chart 2: Proportion of Directors by Revenue
Chart 3: Proportion of Directors by GICS Sector
0 20 40 60 80 100
Non Executive DirectorsExecutive Directors
<$200 m
$200 - $500 m
$500m - $2 bn
$2 - $5 bn
$5 - $10 bn
>$10 bn18.6%
81.4%
21.4%
83.6%
16.4%
78.6%
24.2%
21.0%
75.8%
29.2%
70.8%
79.0%
%
Director includes Chairmen.
0 20 40 60 80 100
Non Executive DirectorsExecutive Directors
Utilities
TelecommunicationsServices
Materials
Information Technology
Industrials
Health Care
Financials
Energy
Consumer Staple
Consumer Discretionary 25.3%74.7%
19.8%
26.3%81.1%
18.9%
80.2%
73.7%
25.5%
22.7%
37.5%
25.8%
26.7%
12.1%
74.5%
62.5%
74.2%
73.3%
87.9
77.3%
%
Director includes Chairmen.
16
Distribution of Board Size – All Directors (Executive and Non Executive)Board size is analysed according to Revenue and then by GICS sector, adopting the following seven categories:
less than 4 Directors;
4 to 5;
6 to 7;
8 to 9;
10 to 11;
12 to 13;
greater than 13.
As in previous years, the average Board size across the ASX300 stood at seven and for the ASX Top 50 companies the number was nine.
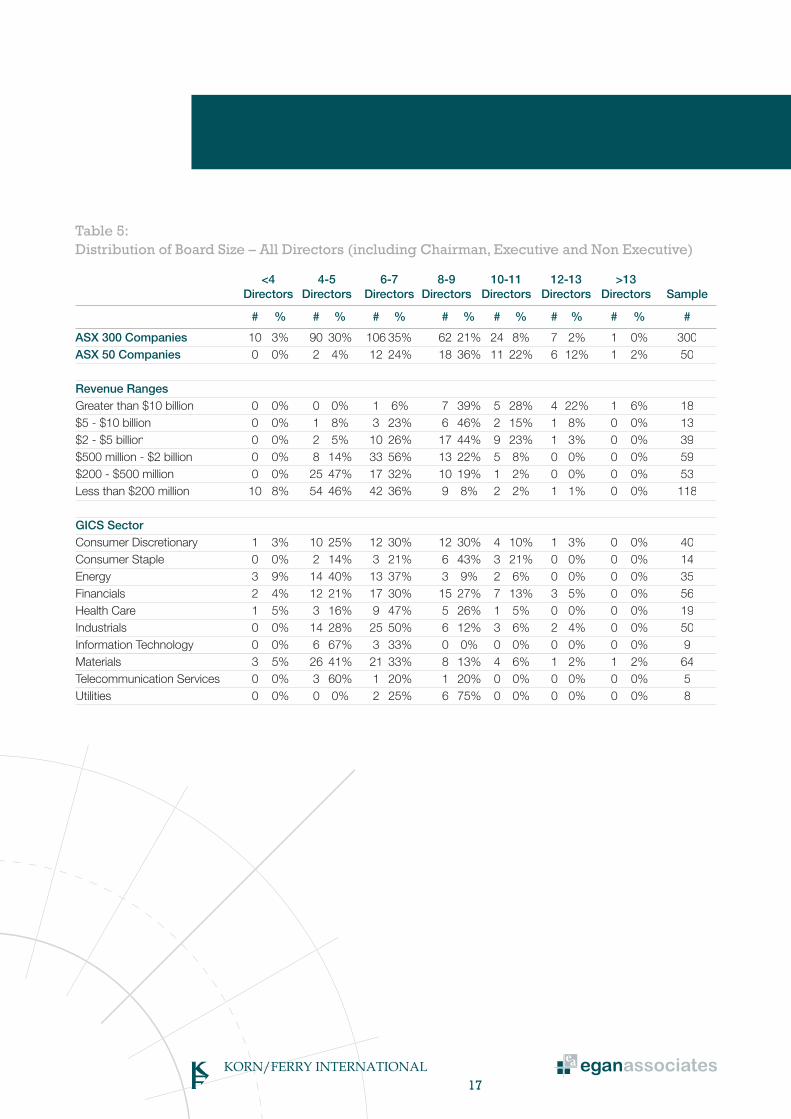
Table 5 shows the number of Directors serving on the Boards of the Total Sample (300 companies) and those for the Top 50 companies ranked by Revenue. Further analysis is provided on companies by industry sector.
Most (86%) of the Total Sample have between four and nine Directors and 10% have Boards with or more Directors. Only 3% of the Total Sample have fewer than four Directors, all of which are on Boards of companies with less than $200 million in annual revenue.
Among the Top 50 ASX listed companies only two Boards have less than six Directors and 82% have between six and 11 Directors, with 14% having more than 11 Directors.
Indicatively, if Revenue is a guide to company scale, larger companies have greater numbers of Directors than do smaller companies. As the data indicates,75% to 90% of companies with Revenues of less than $500 million have seven or fewer Directors, whereas among companies in the largest Revenue bands the majority of companies have eight or more Directors.
The industry sector data contains companies of varying size within each GICScategory. Variations in the data are partly impacted by sample size. For example,100% of Information Technology Boards have between four and seven Directors in a sample of nine while 100% of Utilities Boards have between six and nine Directors in a sample of eight.
17
Table 5: Distribution of Board Size – All Directors (including Chairman, Executive and Non Executive)
<4 4-5 6-7 8-9 10-11 12-13 >13 Directors Directors Directors Directors Directors Directors Directors Sample
# % # % # % # % # % # % # % #
ASX 300 Companies 10 3% 90 30% 106 35% 62 21% 24 8% 7 2% 1 0% 300ASX 50 Companies 0 0% 2 4% 12 24% 18 36% 11 22% 6 12% 1 2% 50
Revenue RangesGreater than $10 billion 0 0% 0 0% 1 6% 7 39% 5 28% 4 22% 1 6% 18$5 - $10 billion 0 0% 1 8% 3 23% 6 46% 2 15% 1 8% 0 0% 13$2 - $5 billion 0 0% 2 5% 10 26% 17 44% 9 23% 1 3% 0 0% 39$500 million - $2 billion 0 0% 8 14% 33 56% 13 22% 5 8% 0 0% 0 0% 59$200 - $500 million 0 0% 25 47% 17 32% 10 19% 1 2% 0 0% 0 0% 53Less than $200 million 10 8% 54 46% 42 36% 9 8% 2 2% 1 1% 0 0% 118
GICS SectorConsumer Discretionary 1 3% 10 25% 12 30% 12 30% 4 10% 1 3% 0 0% 40Consumer Staple 0 0% 2 14% 3 21% 6 43% 3 21% 0 0% 0 0% 14Energy 3 9% 14 40% 13 37% 3 9% 2 6% 0 0% 0 0% 35Financials 2 4% 12 21% 17 30% 15 27% 7 13% 3 5% 0 0% 56Health Care 1 5% 3 16% 9 47% 5 26% 1 5% 0 0% 0 0% 19Industrials 0 0% 14 28% 25 50% 6 12% 3 6% 2 4% 0 0% 50Information Technology 0 0% 6 67% 3 33% 0 0% 0 0% 0 0% 0 0% 9Materials 3 5% 26 41% 21 33% 8 13% 4 6% 1 2% 1 2% 64Telecommunication Services 0 0% 3 60% 1 20% 1 20% 0 0% 0 0% 0 0% 5Utilities 0 0% 0 0% 2 25% 6 75% 0 0% 0 0% 0 0% 8
18
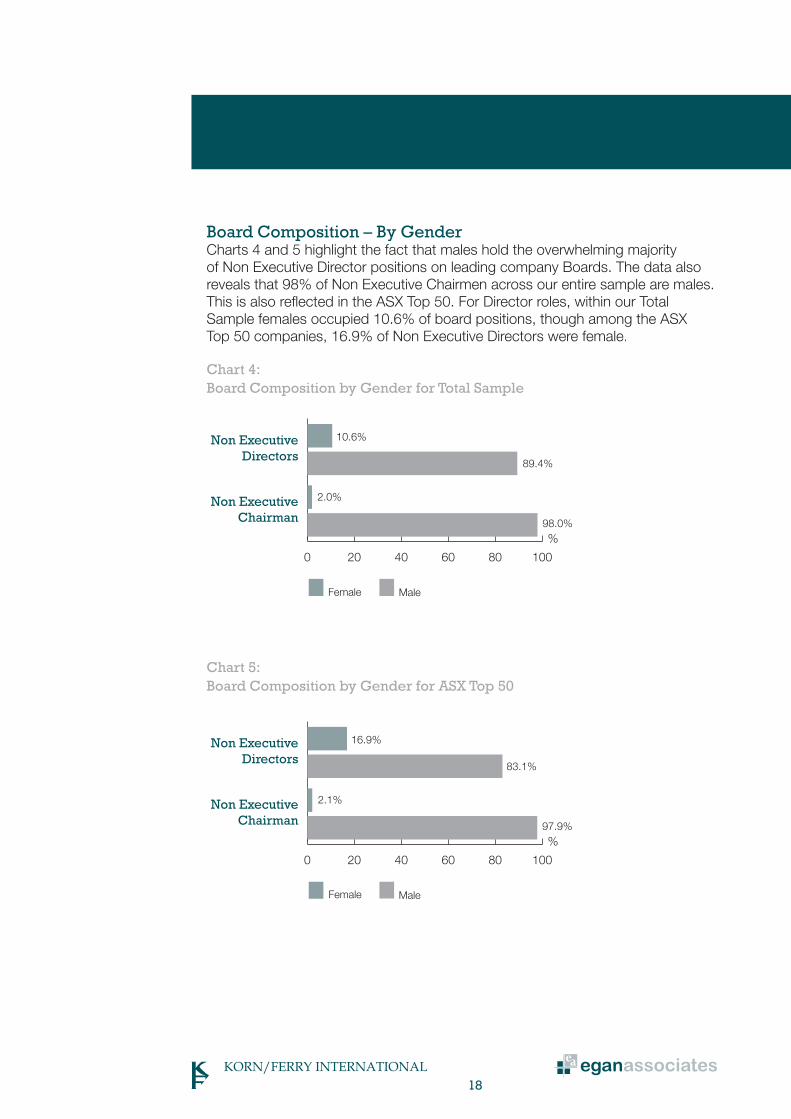
Board Composition – By Gender Charts 4 and 5 highlight the fact that males hold the overwhelming majority of Non Executive Director positions on leading company Boards. The data also reveals that 98% of Non Executive Chairmen across our entire sample are males. This is also reflected in the ASX Top 50. For Director roles, within our TotalSample females occupied 10.6% of board positions, though among the ASX Top 50 companies, 16.9% of Non Executive Directors were female.
Chart 4: Board Composition by Gender for Total Sample
Chart 5: Board Composition by Gender for ASX Top 50
0 20 40 60 80 100
MaleFemale
Non ExecutiveChairman
Non ExecutiveDirectors
%
2.0%
10.6%
89.4%
98.0%
0 20 40 60 80 100
MaleFemale
Non ExecutiveChairman
Non ExecutiveDirectors
%
2.1%
16.9%
83.1%
97.9%
19
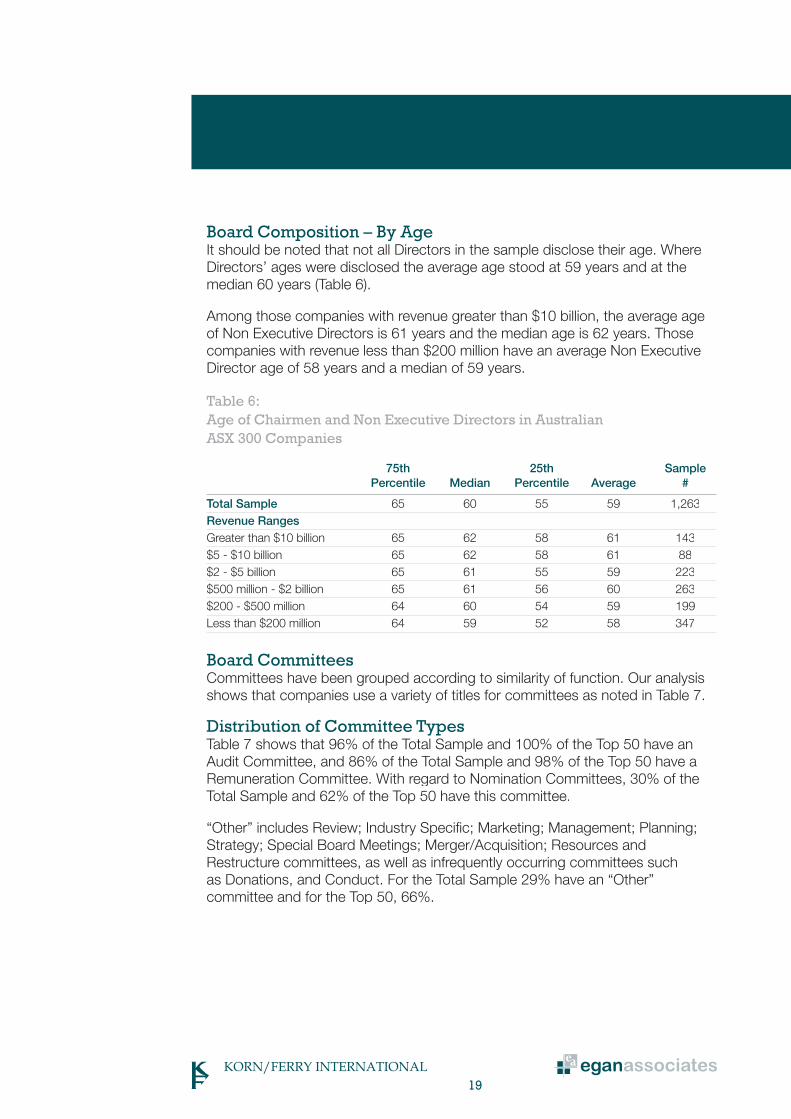
Board Composition – By AgeIt should be noted that not all Directors in the sample disclose their age. WhereDirectors’ ages were disclosed the average age stood at 59 years and at themedian 60 years (Table 6).
Among those companies with revenue greater than $10 billion, the average age of Non Executive Directors is 61 years and the median age is 62 years. Those companies with revenue less than $200 million have an average Non Executive Director age of 58 years and a median of 59 years.
Table 6: Age of Chairmen and Non Executive Directors in Australian ASX 300 Companies
75th 25th Sample Percentile Median Percentile Average #
Total Sample 65 60 55 59 1,263Revenue RangesGreater than $10 billion 65 62 58 61 143$5 - $10 billion 65 62 58 61 88$2 - $5 billion 65 61 55 59 223$500 million - $2 billion 65 61 56 60 263$200 - $500 million 64 60 54 59 199Less than $200 million 64 59 52 58 347
Board CommitteesCommittees have been grouped according to similarity of function. Our analysis shows that companies use a variety of titles for committees as noted in Table 7.
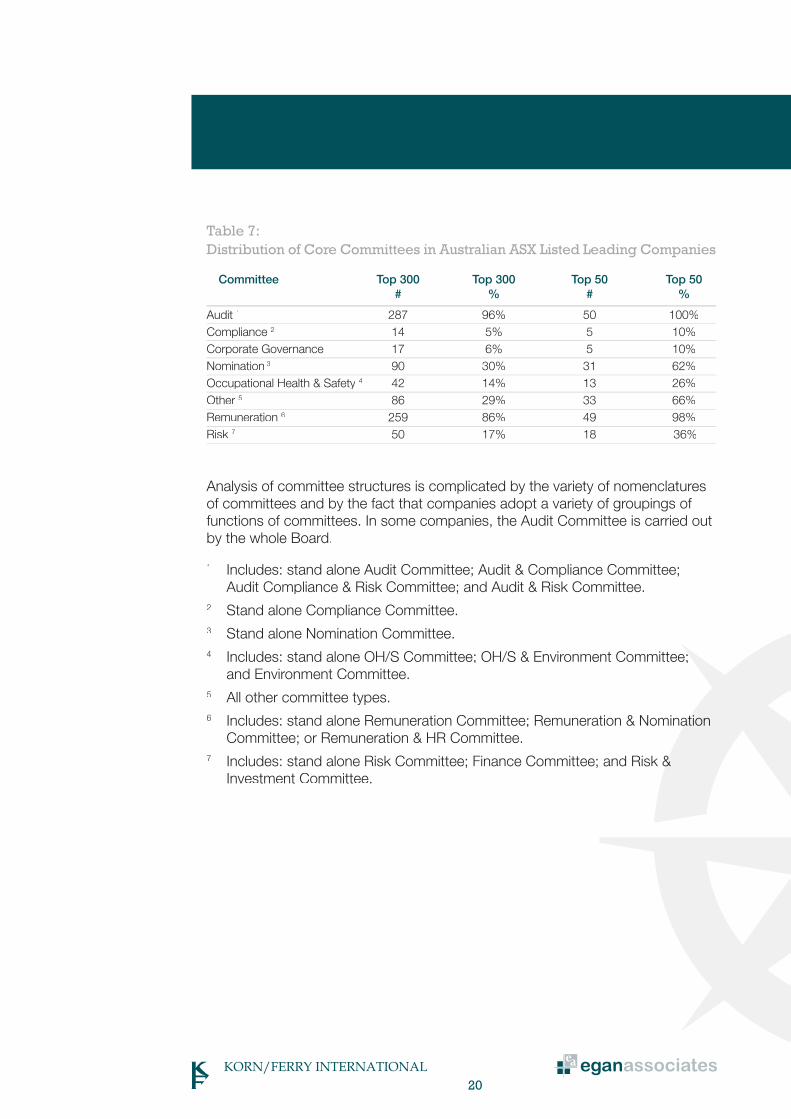
Distribution of Committee TypesTable 7 shows that 96% of the Total Sample and 100% of the Top 50 have an Audit Committee, and 86% of the Total Sample and 98% of the Top 50 have aRemuneration Committee. With regard to Nomination Committees, 30% of the Total Sample and 62% of the Top 50 have this committee.
“Other” includes Review; Industry Specific; Marketing; Management; Planning;Strategy; Special Board Meetings; Merger/Acquisition; Resources and Restructure committees, as well as infrequently occurring committees such as Donations, and Conduct. For the Total Sample 29% have an “Other” committee and for the Top 50, 66%.
20
Table 7: Distribution of Core Committees in Australian ASX Listed Leading Companies
Committee Top 300 Top 300 Top 50 Top 50 # % # %
Audit 1 287 96% 50 100%Compliance 2 14 5% 5 10%Corporate Governance 17 6% 5 10%Nomination 3 90 30% 31 62%Occupational Health & Safety 4 42 14% 13 26%Other 5 86 29% 33 66%Remuneration 6 259 86% 49 98%Risk 7 50 17% 18 36%
Analysis of committee structures is complicated by the variety of nomenclatures of committees and by the fact that companies adopt a variety of groupings of functions of committees. In some companies, the Audit Committee is carried outby the whole Board.
1 Includes: stand alone Audit Committee; Audit & Compliance Committee; Audit Compliance & Risk Committee; and Audit & Risk Committee.2 Stand alone Compliance Committee.3 Stand alone Nomination Committee.4 Includes: stand alone OH/S Committee; OH/S & Environment Committee;; and Environment Committee.5 All other committee types.6 Includes: stand alone Remuneration Committee; Remuneration & Nominatation Committee; or Remuneration & HR Committee.7 Includes: stand alone Risk Committee; Finance Committee; and Risk && Investment Committee.
21
New Zealand: Non Executive Chairmen and Non Executive Directors’ Fees in New Zealand Leading Companies by Revenue The analysis of New Zealand companies has been compiled in New Zealand dollars.
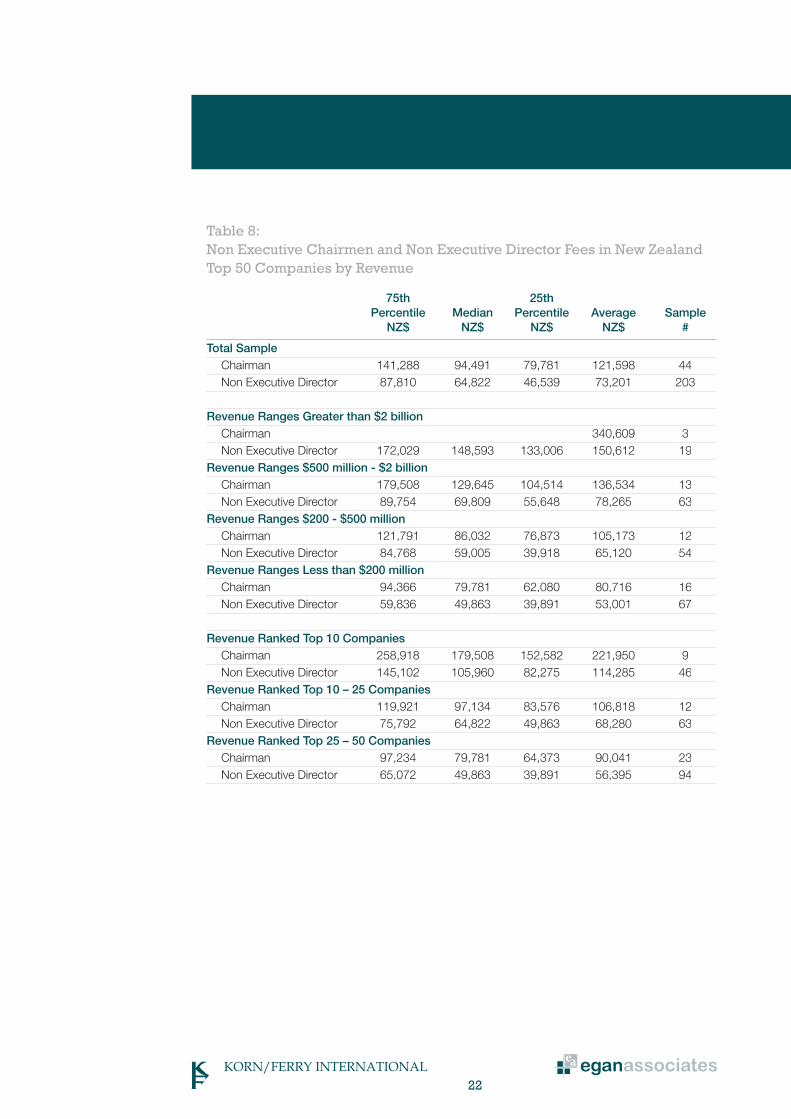
Table 8 sets out the fees paid to Non Executive Chairmen in New Zealand Top50 companies. It will be noted that the average fee stood at NZ$121,598, at themedian, NZ$94,491 and at the 75th percentile $141,288.
Fees paid to Non Executive Directors in New Zealand’s Top 50 companies on average stood at NZ$73,201, at the median NZ$64,822 and at the 75th percentile NZ$87,810.
Ranking the Top 50 New Zealand companies by revenue, the average fee paidto Chairmen in the top 10 organisations is NZ$221,950 and the median is NZ$179,508 compared with those companies ranked 25-50 where the average fee is NZ$90,041 and the median fee is NZ$79,781. Size of company in terms of revenue also has an impact on fees for Non Executive Directors with those in thetop 10 ranked companies receiving an average of NZ$114,285 and a median of NZ$105,960, while those companies ranked 25-50 have average Non ExecutiveDirector fees of NZ$56,395 and median fees of NZ$49,863.
NEW ZEALAND
22
Table 8:Non Executive Chairmen and Non Executive Director Fees in New Zealand Top 50 Companies by Revenue
75th 25th Percentile Median Percentile Average Sample NZ$ NZ$ NZ$ NZ$ #
Total Sample Chairman 141,288 94,491 79,781 121,598 44 Non Executive Director 87,810 64,822 46,539 73,201 203
Revenue Ranges Greater than $2 billion Chairman 340,609 3 Non Executive Director 172,029 148,593 133,006 150,612 19Revenue Ranges $500 million - $2 billion Chairman 179,508 129,645 104,514 136,534 13 Non Executive Director 89,754 69,809 55,648 78,265 63Revenue Ranges $200 - $500 million Chairman 121,791 86,032 76,873 105,173 12 Non Executive Director 84,768 59,005 39,918 65,120 54Revenue Ranges Less than $200 million Chairman 94,366 79,781 62,080 80,716 16 Non Executive Director 59,836 49,863 39,891 53,001 67
Revenue Ranked Top 10 Companies Chairman 258,918 179,508 152,582 221,950 9
Non Executive Director 145,102 105,960 82,275 114,285 46Revenue Ranked Top 10 – 25 Companies Chairman 119,921 97,134 83,576 106,818 12 Non Executive Director 75,792 64,822 49,863 68,280 63Revenue Ranked Top 25 – 50 Companies Chairman 97,234 79,781 64,373 90,041 23 Non Executive Director 65,072 49,863 39,891 56,395 94
23
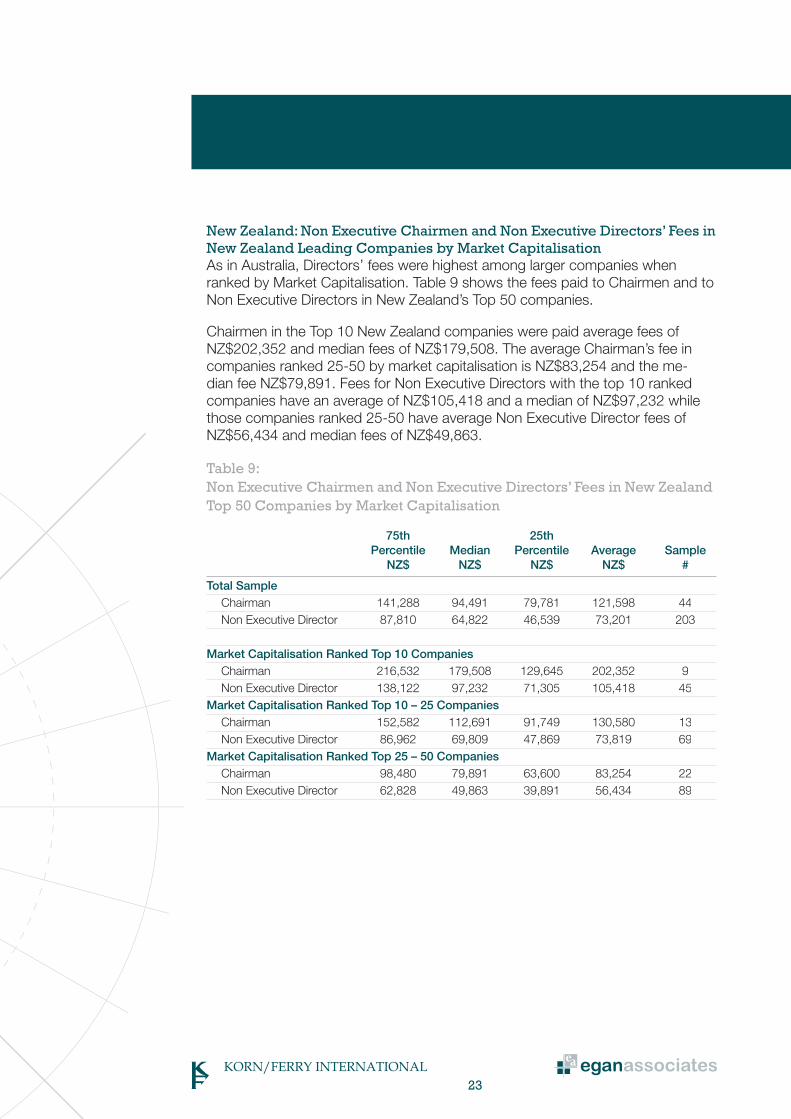
New Zealand: Non Executive Chairmen and Non Executive Directors’ Fees in New Zealand Leading Companies by Market CapitalisationAs in Australia, Directors’ fees were highest among larger companies whenranked by Market Capitalisation. Table 9 shows the fees paid to Chairmen and to Non Executive Directors in New Zealand’s Top 50 companies.
Chairmen in the Top 10 New Zealand companies were paid average fees of NZ$202,352 and median fees of NZ$179,508. The average Chairman’s fee in companies ranked 25-50 by market capitalisation is NZ$83,254 and the me-dian fee NZ$79,891. Fees for Non Executive Directors with the top 10 rankedcompanies have an average of NZ$105,418 and a median of NZ$97,232 whilethose companies ranked 25-50 have average Non Executive Director fees of NZ$56,434 and median fees of NZ$49,863.
Table 9:Non Executive Chairmen and Non Executive Directors’ Fees in New Zealand Top 50 Companies by Market Capitalisation
75th 25th Percentile Median Percentile Average Sample NZ$ NZ$ NZ$ NZ$ #
Total Sample Chairman 141,288 94,491 79,781 121,598 44
Non Executive Director 87,810 64,822 46,539 73,201 203
Market Capitalisation Ranked Top 10 Companies Chairman 216,532 179,508 129,645 202,352 9
Non Executive Director 138,122 97,232 71,305 105,418 45Market Capitalisation Ranked Top 10 – 25 Companies Chairman 152,582 112,691 91,749 130,580 13 Non Executive Director 86,962 69,809 47,869 73,819 69Market Capitalisation Ranked Top 25 – 50 Companies Chairman 98,480 79,891 63,600 83,254 22 Non Executive Director 62,828 49,863 39,891 56,434 89
24
New Zealand: Board Demographics
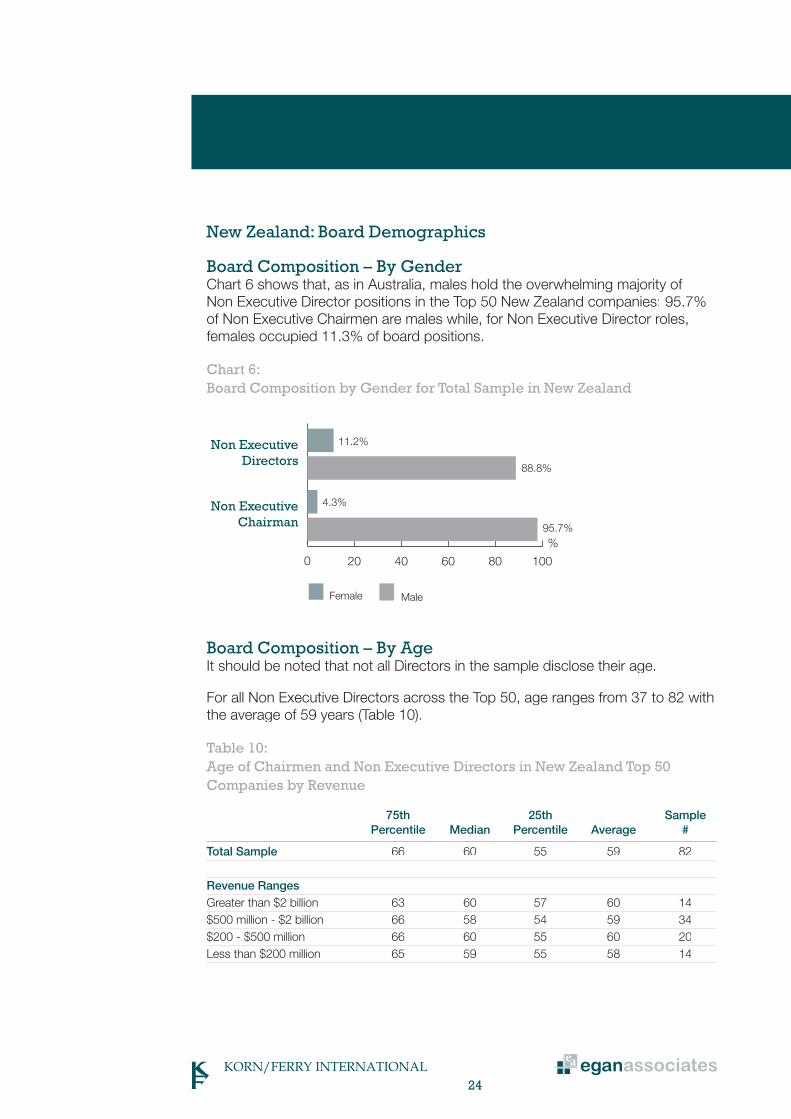
Board Composition – By Gender Chart 6 shows that, as in Australia, males hold the overwhelming majority of Non Executive Director positions in the Top 50 New Zealand companies 95.7% of Non Executive Chairmen are males while, for Non Executive Director roles, females occupied 11.3% of board positions.
Chart 6: Board Composition by Gender for Total Sample in New Zealand
Board Composition – By AgeIt should be noted that not all Directors in the sample disclose their age.
For all Non Executive Directors across the Top 50, age ranges from 37 to 82 withthe average of 59 years (Table 10).
Table 10: Age of Chairmen and Non Executive Directors in New Zealand Top 50 Companies by Revenue
75th 25th Sample Percentile Median Percentile Average #
Total Sample 66 60 55 59 82
Revenue RangesGreater than $2 billion 63 60 57 60 14$500 million - $2 billion 66 58 54 59 34$200 - $500 million 66 60 55 60 20Less than $200 million 65 59 55 58 14
0 20 40 60 80 100
MaleFemale
Non ExecutiveChairman
Non ExecutiveDirectors
%
4.3%
11.2%
88.8%
95.7%
25
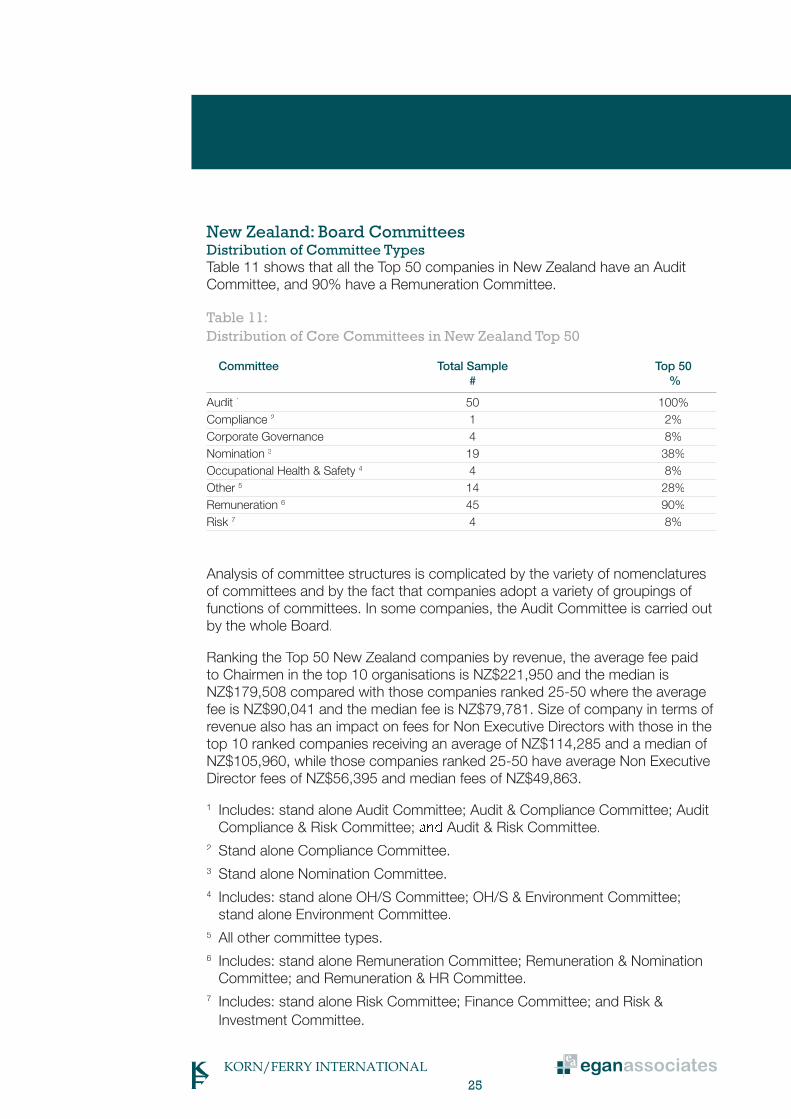
New Zealand: Board Committees Distribution of Committee TypesTable 11 shows that all the Top 50 companies in New Zealand have an AuditCommittee, and 90% have a Remuneration Committee.
Table 11: Distribution of Core Committees in New Zealand Top 50
Committee Total Sample Top 50 # %
Audit 1 50 100%Compliance 2 1 2%Corporate Governance 4 8%Nomination 3 19 38%Occupational Health & Safety 4 4 8%Other 5 14 28%Remuneration 6 45 90%Risk 7 4 8%
Analysis of committee structures is complicated by the variety of nomenclatures of committees and by the fact that companies adopt a variety of groupings of functions of committees. In some companies, the Audit Committee is carried outby the whole Board.
Ranking the Top 50 New Zealand companies by revenue, the average fee paidto Chairmen in the top 10 organisations is NZ$221,950 and the median is NZ$179,508 compared with those companies ranked 25-50 where the average fee is NZ$90,041 and the median fee is NZ$79,781. Size of company in terms of revenue also has an impact on fees for Non Executive Directors with those in thetop 10 ranked companies receiving an average of NZ$114,285 and a median of NZ$105,960, while those companies ranked 25-50 have average Non ExecutiveDirector fees of NZ$56,395 and median fees of NZ$49,863.
1 Includes: stand alone Audit Committee; Audit & Compliance Committee; Audit Compliance & Risk Committee; Audit & Risk Committee.2 Stand alone Compliance Committee.3 Stand alone Nomination Committee.4 Includes: stand alone OH/S Committee; OH/S & Environment Committee; stand alone Environment Committee.5 All other committee types.6 Includes: stand alone Remuneration Committee; Remuneration & Nomination Committee; and Remuneration & HR Committee.7 Includes: stand alone Risk Committee; Finance Committee; and Risk & Investment Committee.
2626
Abacus Property GroupABB Grain LimitedAcrux LimitedAdelaide Brighton LimitedAditya Birla Minerals LimitedAGL Energy LimitedAJ Lucas Group LimitedALE Property GroupAlesco Corporation LimitedAlliance Resources LimitedAllied Gold LimitedAlumina LimitedAmalgamated Holdings LimitedAmcor LimitedAMP LimitedAnsell LimitedAP Eagers LimitedAPA GroupAPN News & Media LimitedAquila Resources LimitedArana Therapeutics LimitedARB Corporation LimitedArgo Investments LimitedAristocrat Leisure LimitedArrow Energy LimitedAsciano GroupASX LimitedAtlas Iron LimitedAusdrill LimitedAusenco LimitedAustal LimitedAustar United Communications LimitedAustbrokers Holdings LimitedAustereo Group LimitedAustraland Property GroupAustralasian Resources LimitedAustralia and New Zealand Banking Group LimitedAustralian Agricultural Company LimitedAustralian Foundation Investment Co LtdAustralian Pharmaceutical Industries LtdAustralian United Investment Co LtdAustralian Worldwide Exploration LtdAutomotive Holdings Group LimitedAvoca Resources LimitedAWB LimitedAXA Asia Pacific Holdings LimitedBank of Queensland LimitedBannerman ResourcesBeach Petroleum LimitedBell Financial Group LimitedBendigo and Adelaide Bank LimitedBHP Billiton LimitedBillabong International LimitedBiota Holdings Limited
Blackmores LimitedBlueScope Steel LimitedBoart Longyear LimitedBoral LimitedBow Energy LimitedBradken LimitedBrambles LimitedBrickworks Investment Company LimitedBrickworks LimitedBrockman Resources LimitedBT Investment Management LimitedCabcharge Australia LimitedCaltex Australia LimitedCampbell Brothers LimitedCape Lambert Iron Ore LimitedCarbon Energy LimitedCardno LimitedCarlton Investments LimitedCarnarvon Petroleum LimitedCellestis LimitedCentamin Egypt LimitedCentennial Coal Company LimitedCeramic Fuel Cells LimitedCGA Mining LimitedChallenger Financial Services Group LimitedCharter Hall GroupChemGenex Pharmaceuticals LimitedChoiseul Investments LimitedCitadel Resource Group LimitedClough LimitedCoca-Cola Amatil LimitedCochlear LimitedCockatoo Coal LimitedCoffey International LimitedCommonwealth Bank of AustraliaComputershare LimitedConnectEast GroupConsolidated Media Holdings LimitedCorporate Express Australia LimitedCount Financial LimitedCountry Road LimitedCrane Group LimitedCromwell GroupCrown LimitedCSL LimitedCSR LimitedCuDeco LimitedCustomers LimitedDavid Jones LimitedDeep Yellow LimitedDexus Property GroupDiversified United Investment LimitedDominion Mining LimitedDominos Pizza Enterprises Limited
APPENDIX List of Organisations Surveyed – Australian Companies
2727
Downer EDI LimitedEastern Star Gas Limitedeircom Holdings LimitedElders LimitedEmeco Holdings LimitedEnergy Developments LimitedEnergy Resources of Australia LimitedEntertainment Media & Telecoms Corporation LimitedEnvestra LimitedExtract Resources LtdFairfax Media LimitedFantastic Holdings LimitedFelix Resources LimitedFKP Property GroupFleetwood Corporation LimitedFlexiGroup LimitedFlight Centre LimitedFortescue Metals Group LimitedFoster’s Group LimitedGeodynamics LimitedGindalbie Metals LimitedGlobal Mining Investments LimitedGloucester Coal LimitedGold One International LimitedGoodman Fielder LimitedGoodman GroupGPT GroupGrainCorp LimitedGrange Resources LimitedGUD Holdings LimitedGunns LimitedGWA International LimitedHarvey Norman Holdings LimitedHastie Group LimitedHealthscope LimitedHills Industries LimitedHorizon Oil LimitedHunter Hall Global Value LimitediiNet LimitedIluka Resources LimitedIMF (Australia) LimitedIncitec Pivot LimitedIndependence Group NLIndophil Resources NLIndustrea LimitedInfigen Energy LimitedInsurance Australia Group LimitedInvoCare LimitedIOOF Holdings LimitedIRESS Market Technology LimitediSOFT Group LimitedJB Hi-Fi LimitedK&S Corporation LimitedKagara Limited
Karoon Gas Australia LimitedKingsgate Consolidated LimitedLeighton Holdings LimitedLend Lease Corporation LimitedLinc Energy LimitedLion Nathan LimitedLynas Corporation LimitedMAC Services Group Limited (The)Macarthur Coal LimitedMacmahon Holdings LimitedMacquarie Communications Infrastructure GroupMacquarie Group LimitedMantra Resources LimitedMcMillan Shakespeare LimitedMedusa Mining LimitedMermaid Marine Australia LimitedMetcash LimitedMilton Corporation LimitedMinara Resources LimitedMincor Resources NLMineral Deposits LimitedMineral Resources LimitedMirabela Nickel LimitedMirrabooka Investments LimitedMirvac Group LimitedMitchell Communications Group LimitedMolopo Australia LimitedMonadelphous Group LimitedMount Gibson Iron LimitedMurchison Metals LtdNational Australia Bank LimitedNational Hire Group LimitedNavitas LimitedNeptune Marine Services LimitedNew Hope Corporation LimitedNewcrest Mining GroupNexus Energy LimitedNIB Holdings LimitedNido Petroleum LimitedNRW Holdings LimitedNufarm LimitedOakton LimitedOneSteel LimitedOrica LimitedOrigin Energy LimitedOZ Minerals LimitedPacific Brands LimitedPaladin Energy LimitedPan Pacific Petroleum NLPanAust LimitedPanoramic Resources LimitedPaperlinX LimitedPeet LimitedPerilya Limited
APPENDIX
2828
APPENDIX
Perpetual LimitedPerseus Mining LimitedPharmaxis LimitedPIPE Networks LimitedPlatinum Australia LimitedPlatinum Capital LimitedPremier Investments LimitedPrimary Health Care LimitedPrime Media Group LimitedProgrammed Maintenance Services LimitedQantas Airways LimitedQBE Insurance GroupQuantum Energy LimitedRamsay Health Care LimitedREA Group LimitedReckon LimitedRedflex Holdings LimitedReece Australia LimitedReject Shop Limited (The)Resolute Mining LimitedRidley Corporation LimitedRio Tinto LimitedRiversdale Mining LimitedRoc Oil Company LimitedSAI Global LimitedSalmat LimitedSantos LimitedSedgman LimitedSEEK LimitedServcorp LimitedSeven Network LimitedSigma Pharmaceutical LimitedSilex Systems LimitedSims Metal Management LimitedSino Gold Mining LimitedSirtex Medical LimitedSkilled Group LimitedSlater & Gordon LimitedSMS Management & Technology LimitedSonic Healthcare LimitedSP AusNetSP Telemedia LimitedSpark Infrastructure GroupSpotless Group LimitedSt Barbara LimitedStockland Corporation LimitedSTW Communications Group LimitedSummit Resources LimitedSuncorp-Metway LimitedSundance Resources LimitedSunland Group LimitedSuper Cheap Auto Group LimitedSylvania Resources LimitedTABCORP Holdings Limited
Tap Oil LimitedTassal Group LimitedTatts Group LimitedTechnology One LimitedTelstra Corporation LimitedTen Network Holdings LimitedTFS Corporation LimitedToll Holdings LimitedTOWER Australia Group LimitedTransfield Services LimitedTransurban Group LimitedTrust Company LimitedUnited Group LimitedUniversal Biosensors IncVirgin Blue Holdings LimitedWashington H Soul Pattinson and Co LtdWDS LimitedWesfarmers LimitedWest Australian Newspapers Holdings LimitedWestern Areas NLWestfield GroupWestpac Banking CorporationWhite Energy Company LimitedWhitehaven Coal LimitedWHK Group LimitedWide Bay Australia LtdWoodside Petroleum LimitedWoolworths LimitedWorleyParsons LimitedWotif.com Holdings Pty Ltd
29
APPENDIX List of Organisations Surveyed – New Zealand Companies
Abano Healthcare Group LimitedAFFCO Holdings LimitedAir New Zealand LimitedAuckland International Airport LimitedBriscoe Group LimitedCavalier Corporation LimitedContact Energy LimitedDelegat’s Group LimitedEBOS Group LimitedFisher & Paykel Appliances Holdings LimitedFisher & Paykel Healthcare LimitedFletcher Building LimitedFreightways LimitedHallenstein Glasson Holdings LtdInfratil Limited NZLyttelton Port Company LimitedMainfreight LimitedMethven LimitedMetlifecare LimitedMichael Hill International LimitedMillennium & Copthorne Hotels New Zealand LimitedNew Image Group LimitedNew Zealand Exchange LimitedNew Zealand Oil & Gas LimitedNew Zealand Refining Company Limited (The)Nuplex Industries LimitedNZ Farming Systems Uruguay LimitedOpus International Consultants LimitedPGG Wrightson LimitedPike River Coal LimitedPort of Tauranga LimitedProperty For Industry LimitedPumpkin Patch LimitedPyne Gould Corporation LimitedRakon LimitedRestaurant Brands New Zealand LtdRubicon LimitedRyman Healthcare LimitedSanford LimitedSky Network Television LimitedSKYCITY Entertainment Group Limited
Steel & Tube Holdings LimitedTelecom Corporation of New ZealandTOWER LimitedTrustPower LimitedTurners & Growers GroupVector LimitedWakefield Health LimitedWarehouse Group Limited (The)Xero Limited


I���������������