Embed Size (px)
Citation preview
01 Annual Report 2010-2011
BOARD OF DIRECTORS Kalanithi Maran Chairman & Managing Director
Kavery Kalanithi Joint Managing Director S. Selvam
S. SridharanM.K. Harinarayanan
J. Ravindran Nicholas Martin Paul
SECRETARY R.Ravi
BANKERSCity Union Bank Limited, Mandaveli, Chennai -28Royal Bank of Scotland, N.V., Chennai - 31Kotak Mahindra Bank Limited, Annasalai, Teynampet, Chennai -18Standard Chartered Bank, Haddows Road, Chennai - 6The Karur Vysya Bank Limited, Anna Salai, Teynampet, Chennai -18ICICI Bank Limited, Cenotaph Road, Teynampet, Chennai -18HDFC Bank Limited, ITC Centre, Chennai -2Axis Bank Limited, Mylapore, Chennai - 4Corporation Bank, Mylapore, Chennai - 4Indian Bank, Kodambakkam, Chennai -24
AUDITORSM/s S.R. Batliboi & AssociatesChartered Accountants,TPL House, Second Floor,3, Cenotaph Road, Teynampet, Chennai - 18
REGISTERED OFFICE
REGISTRAR AND SHARE TRANSFER AGENT
M/s Karvy Computer Share (P) Ltd,Plot Nos. 17 to 24, Vittal Rao Nagar, Madhapur,Hyderabad - 500 081
Murasoli Maran Towers,73, MRC Nagar Main Road,
MRC Nagar, Chennai - 28
CORPORATE INFORMATION
Sun TV Network Limited
02 Annual Report 2010-2011
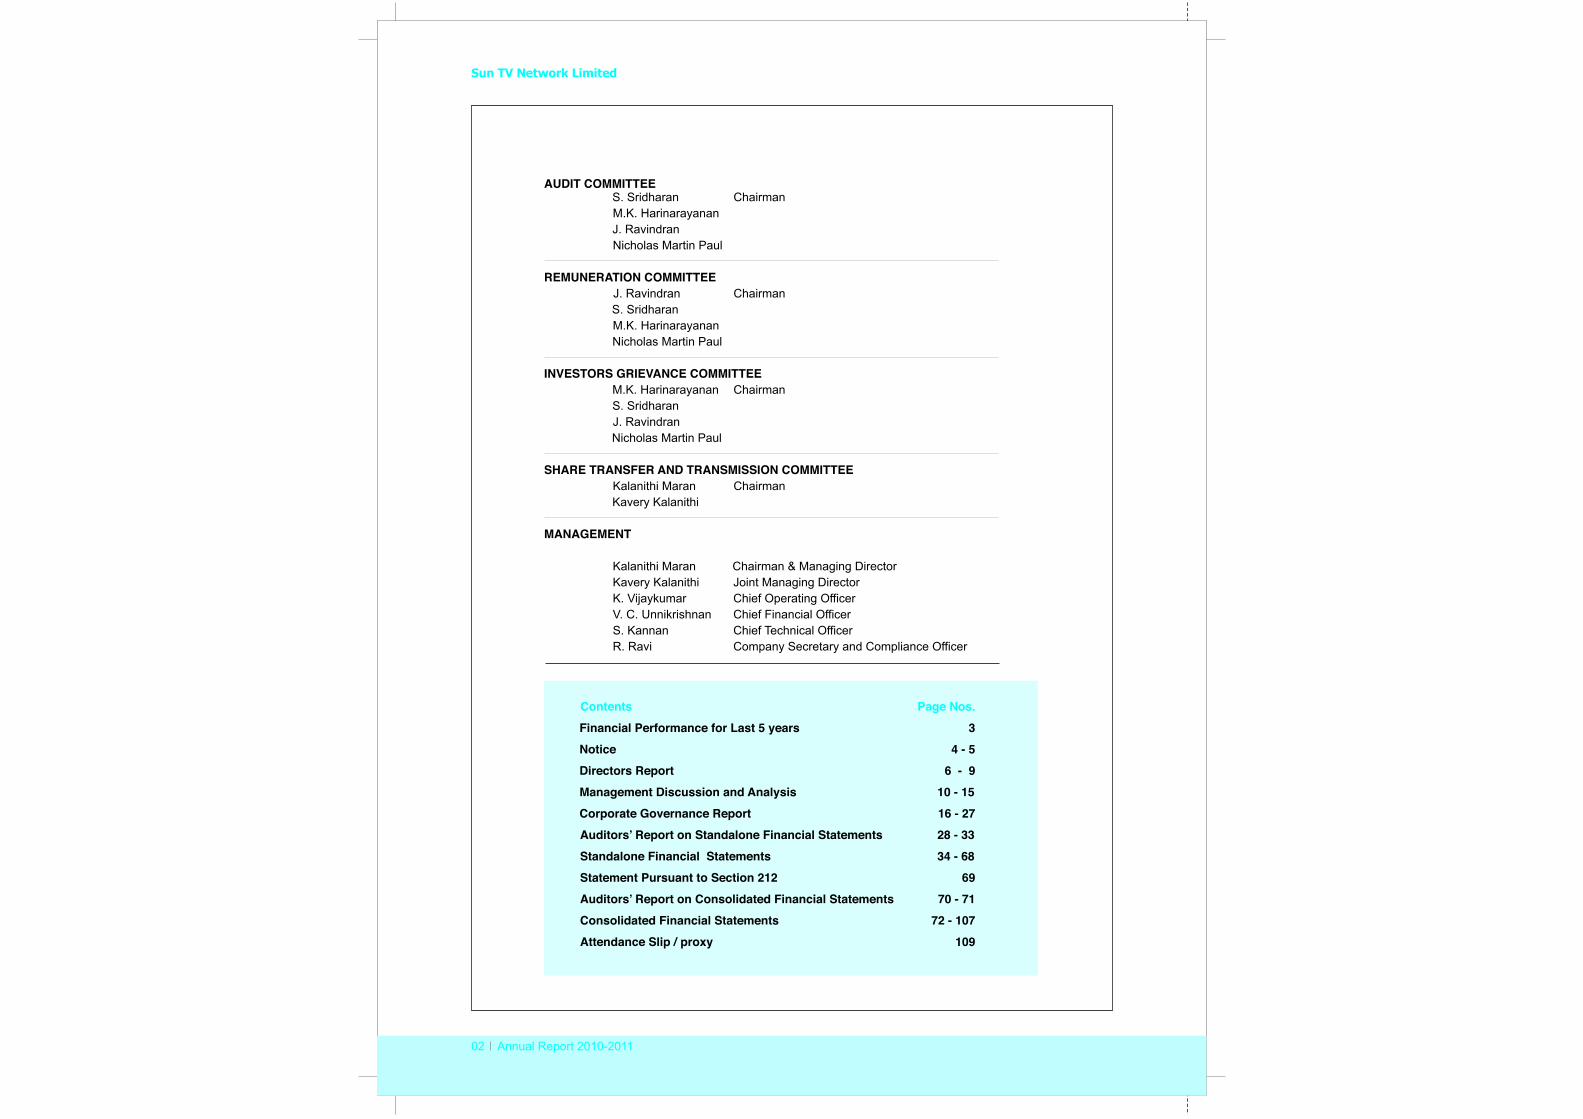
AUDIT COMMITTEE S. Sridharan Chairman M.K. HarinarayananJ. RavindranNicholas Martin Paul
REMUNERATION COMMITTEE J. Ravindran Chairman S. SridharanM.K. HarinarayananNicholas Martin Paul
INVESTORS GRIEVANCE COMMITTEE M.K. Harinarayanan Chairman S. SridharanJ. RavindranNicholas Martin Paul
SHARE TRANSFER AND TRANSMISSION COMMITTEEKalanithi Maran ChairmanKavery Kalanithi
MANAGEMENT
Kalanithi Maran Chairman & Managing DirectorKavery Kalanithi Joint Managing DirectorK. Vijaykumar Chief Operating OfficerV. C. Unnikrishnan Chief Financial Officer
S. Kannan Chief Technical OfficerR. Ravi Company Secretary and Compliance Officer
Contents Page Nos.
Notice 4 - 5Directors Report 6 - 9Management Discussion and Analysis 10 - 15Corporate Governance Report 16 - 27Auditors’ Report on Standalone Financial Statements 28 - 33Standalone Financial Statements 34 - 68Statement Pursuant to Section 212 69Auditors’ Report on Consolidated Financial Statements 70 - 71Consolidated Financial Statements 72 - 107Attendance Slip / proxy 109
Financial Performance for Last 5 years 3
03 Annual Report 2010-2011
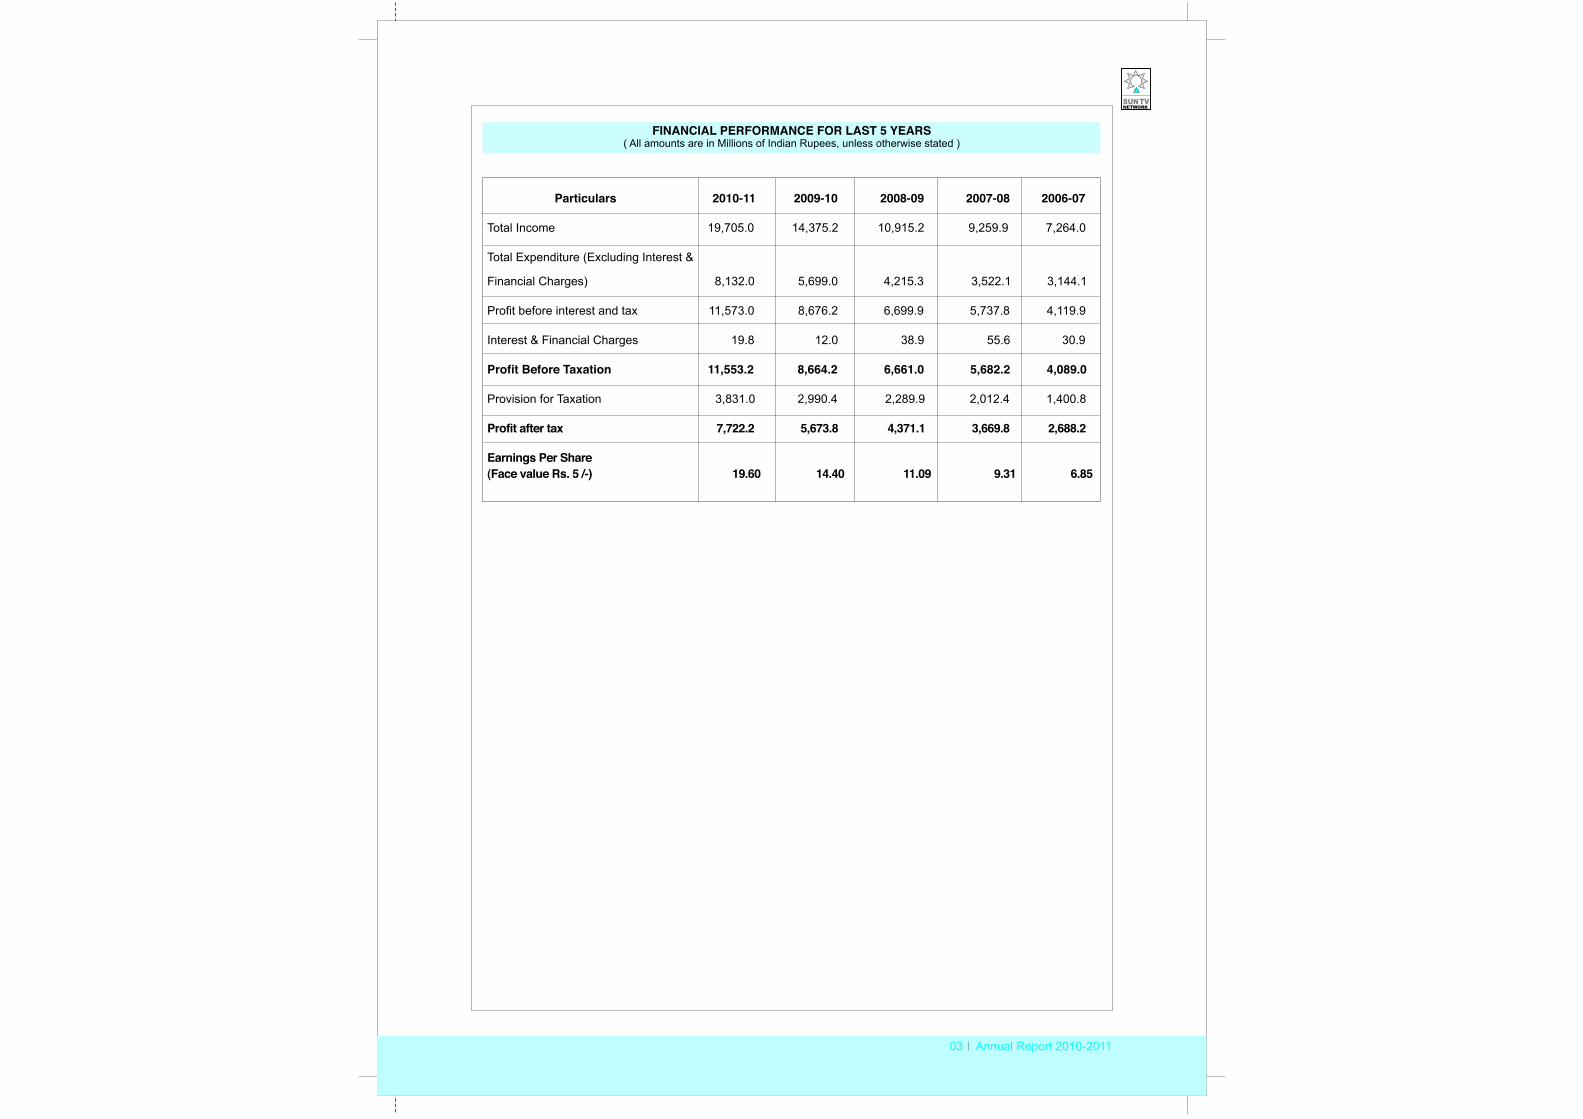
Particulars 2010-11 2009-10 2008-09 2007-08 2006-07
Profit after tax 7,722.2 5,673.8 4,371.1 3,669.8 2,688.2
Earnings Per Share(Face value Rs. 5 /-) 19.60 14.40 11.09 9.31 6.85
Total Income 19,705.0 14,375.2 10,915.2 9,259.9 7,264.0
Total Expenditure (Excluding Interest &
Financial Charges) 8,132.0 5,699.0 4,215.3 3,522.1 3,144.1
Profit before interest and tax 11,573.0 8,676.2 6,699.9 5,737.8 4,119.9
Interest & Financial Charges 19.8 12.0 38.9 55.6 30.9
Profit Before Taxation 11,553.2 8,664.2 6,661.0 5,682.2 4,089.0
Provision for Taxation 3,831.0 2,990.4 2,289.9 2,012.4 1,400.8
FINANCIAL PERFORMANCE FOR LAST 5 YEARS( All amounts are in Millions of Indian Rupees, unless otherwise stated )
Sun TV Network Limited
04 Annual Report 2010-2011
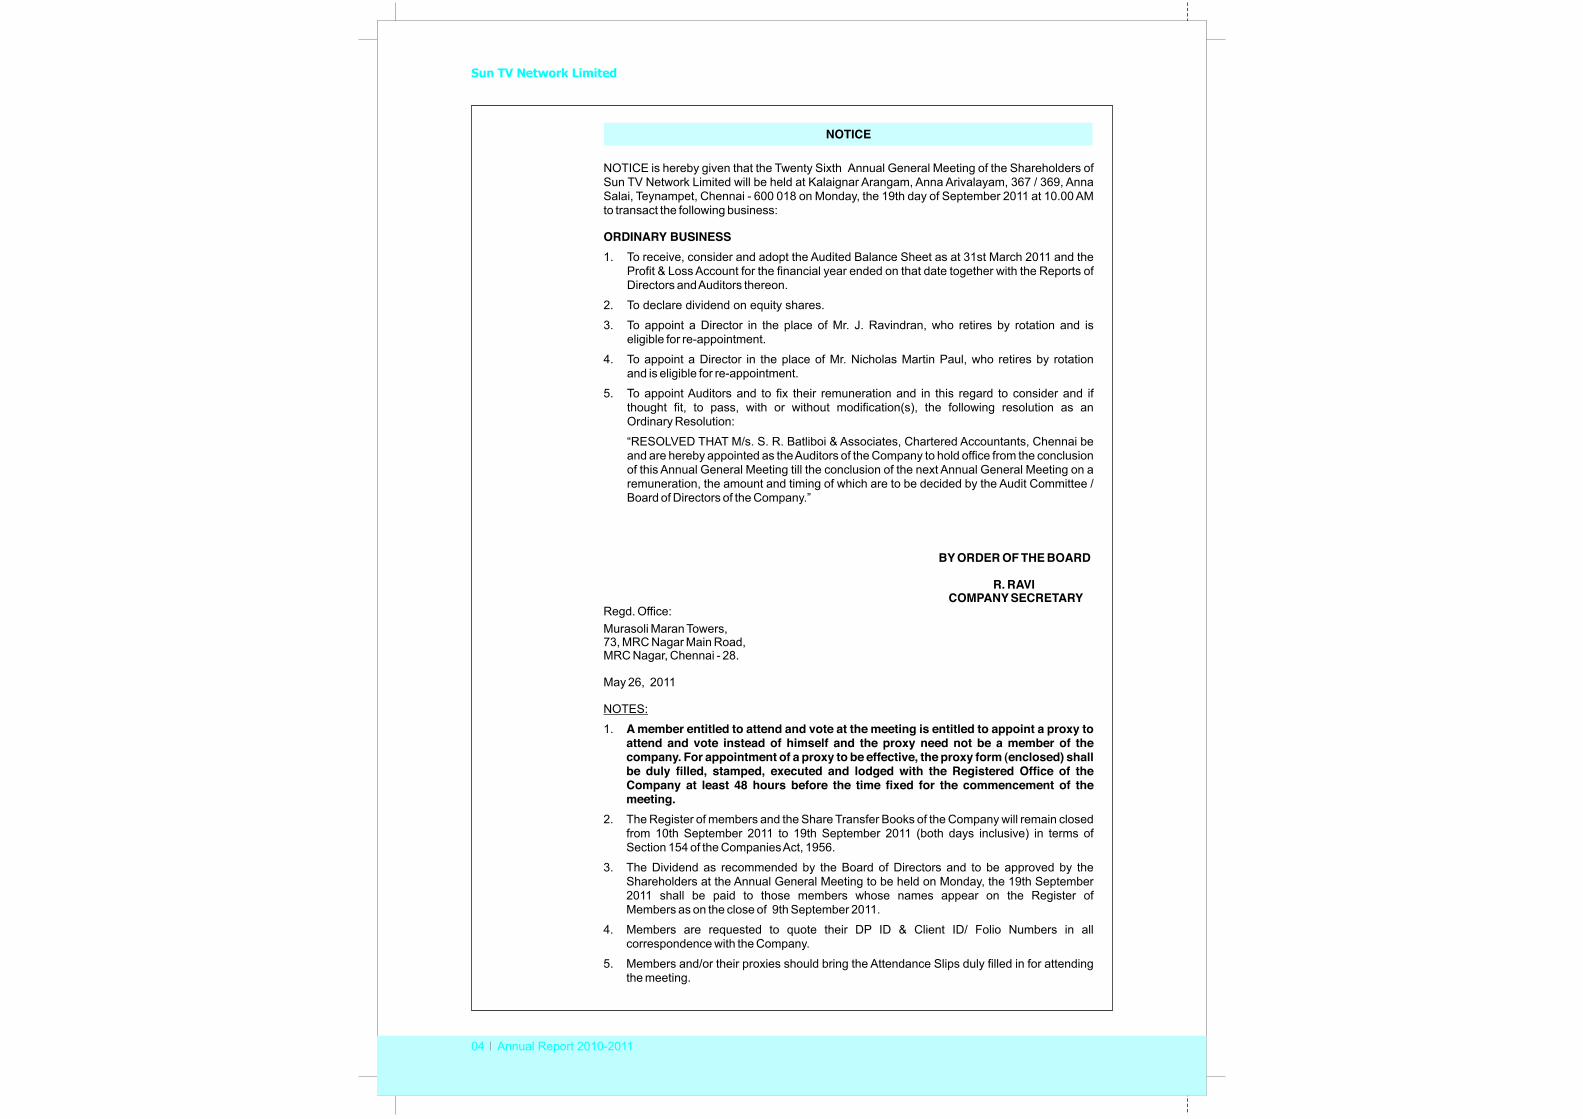
NOTICE
NOTICE is hereby given that the Twenty Sixth Annual General Meeting of the Shareholders of Sun TV Network Limited will be held at Kalaignar Arangam, Anna Arivalayam, 367 / 369, Anna Salai, Teynampet, Chennai - 600 018 on Monday, the 19th day of September 2011 at 10.00 AM to transact the following business:
ORDINARY BUSINESS1. To receive, consider and adopt the Audited Balance Sheet as at 31st March 2011 and the
Profit & Loss Account for the financial year ended on that date together with the Reports of Directors and Auditors thereon.
2. To declare dividend on equity shares.
3. To appoint a Director in the place of Mr. J. Ravindran, who retires by rotation and is eligible for re-appointment.
4. To appoint a Director in the place of Mr. Nicholas Martin Paul, who retires by rotation and is eligible for re-appointment.
5. To appoint Auditors and to fix their remuneration and in this regard to consider and if thought fit, to pass, with or without modification(s), the following resolution as an Ordinary Resolution:
“RESOLVED THAT M/s. S. R. Batliboi & Associates, Chartered Accountants, Chennai be and are hereby appointed as the Auditors of the Company to hold office from the conclusion of this Annual General Meeting till the conclusion of the next Annual General Meeting on a remuneration, the amount and timing of which are to be decided by the Audit Committee / Board of Directors of the Company.”
BY ORDER OF THE BOARD
R. RAVI COMPANY SECRETARY
Regd. Office:
May 26, 2011
NOTES:
1. A member entitled to attend and vote at the meeting is entitled to appoint a proxy to attend and vote instead of himself and the proxy need not be a member of the company. For appointment of a proxy to be effective, the proxy form (enclosed) shall be duly filled, stamped, executed and lodged with the Registered Office of the Company at least 48 hours before the time fixed for the commencement of the meeting.
2. The Register of members and the Share Transfer Books of the Company will remain closed from 10th September 2011 to 19th September 2011 (both days inclusive) in terms of Section 154 of the Companies Act, 1956.
3. The Dividend as recommended by the Board of Directors and to be approved by the Shareholders at the Annual General Meeting to be held on Monday, the 19th September 2011 shall be paid to those members whose names appear on the Register of Members as on the close of 9th September 2011.
4. Members are requested to quote their DP ID & Client ID/ Folio Numbers in all correspondence with the Company.
5. Members and/or their proxies should bring the Attendance Slips duly filled in for attending the meeting.
Murasoli Maran Towers,73, MRC Nagar Main Road,MRC Nagar, Chennai - 28.
05 Annual Report 2010-2011
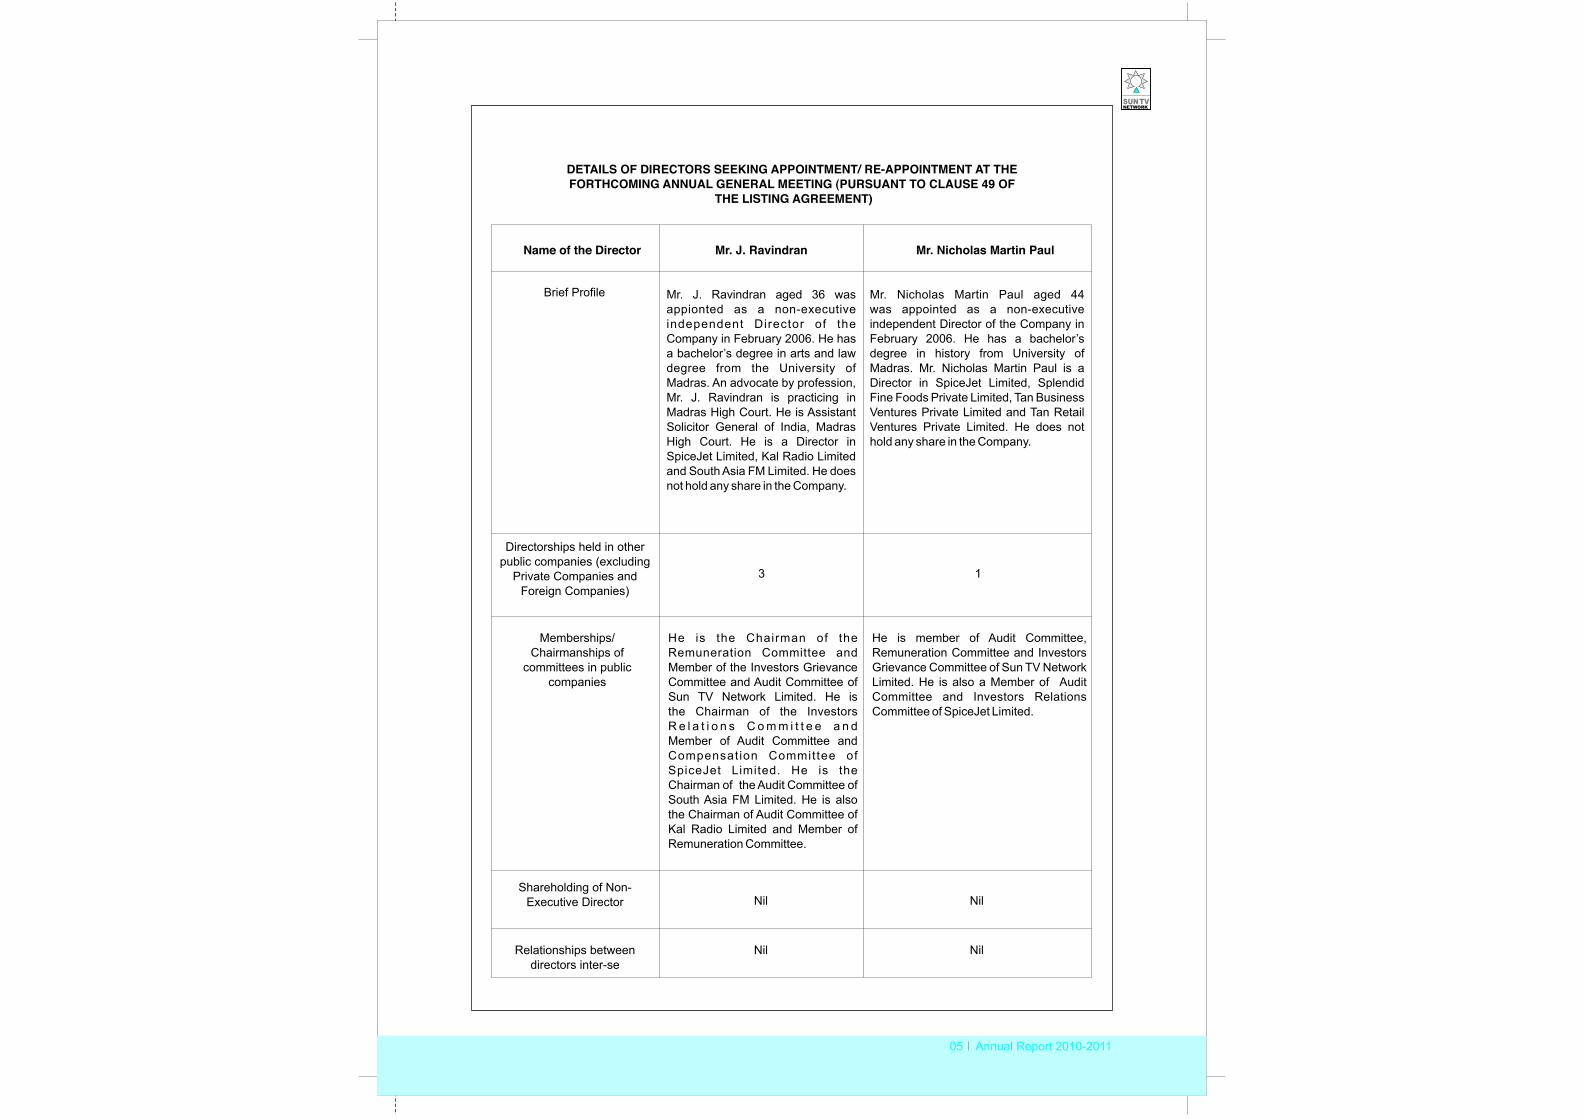
Name of the Director Mr. J. Ravindran Mr. Nicholas Martin Paul
Brief Profile Mr. J. Ravindran aged 36 was appionted as a non-executive independent Director of the Company in February 2006. He has a bachelor’s degree in arts and law degree from the University of Madras. An advocate by profession, Mr. J. Ravindran is practicing in Madras High Court. He is Assistant Solicitor General of India, Madras High Court. He is a Director in SpiceJet Limited, Kal Radio Limited and South Asia FM Limited. He does not hold any share in the Company.
Mr. Nicholas Martin Paul aged 44 was appointed as a non-executive independent Director of the Company in February 2006. He has a bachelor’s degree in history from University of Madras. Mr. Nicholas Martin Paul is a Director in SpiceJet Limited, Splendid Fine Foods Private Limited, Tan Business Ventures Private Limited and Tan Retail Ventures Private Limited. He does not hold any share in the Company.
Directorships held in other public companies (excluding
Private Companies and Foreign Companies)
3
Memberships/ Chairmanships of
committees in public companies
He is the Chairman of the Remuneration Committee and Member of the Investors Grievance Committee and Audit Committee of Sun TV Network Limited. He is the Chairman of the Investors R e l a t i o n s C o m m i t t e e a n d Member of Audit Committee and Compensation Committee of SpiceJet Limited. He is the Chairman of the Audit Committee of South Asia FM Limited. He is also the Chairman of Audit Committee of Kal Radio Limited and Member of Remuneration Committee.
He is member of Audit Committee, Remuneration Committee and Investors Grievance Committee of Sun TV Network Limited. He is also a Member of Audit Committee and Investors Relations Committee of SpiceJet Limited.
Shareholding of Non-Executive Director Nil Nil
1
DETAILS OF DIRECTORS SEEKING APPOINTMENT/ RE-APPOINTMENT AT THE FORTHCOMING ANNUAL GENERAL MEETING (PURSUANT TO CLAUSE 49 OF
THE LISTING AGREEMENT)
Relationships between directors inter-se
Nil Nil
Sun TV Network Limited
06 Annual Report 2010-2011
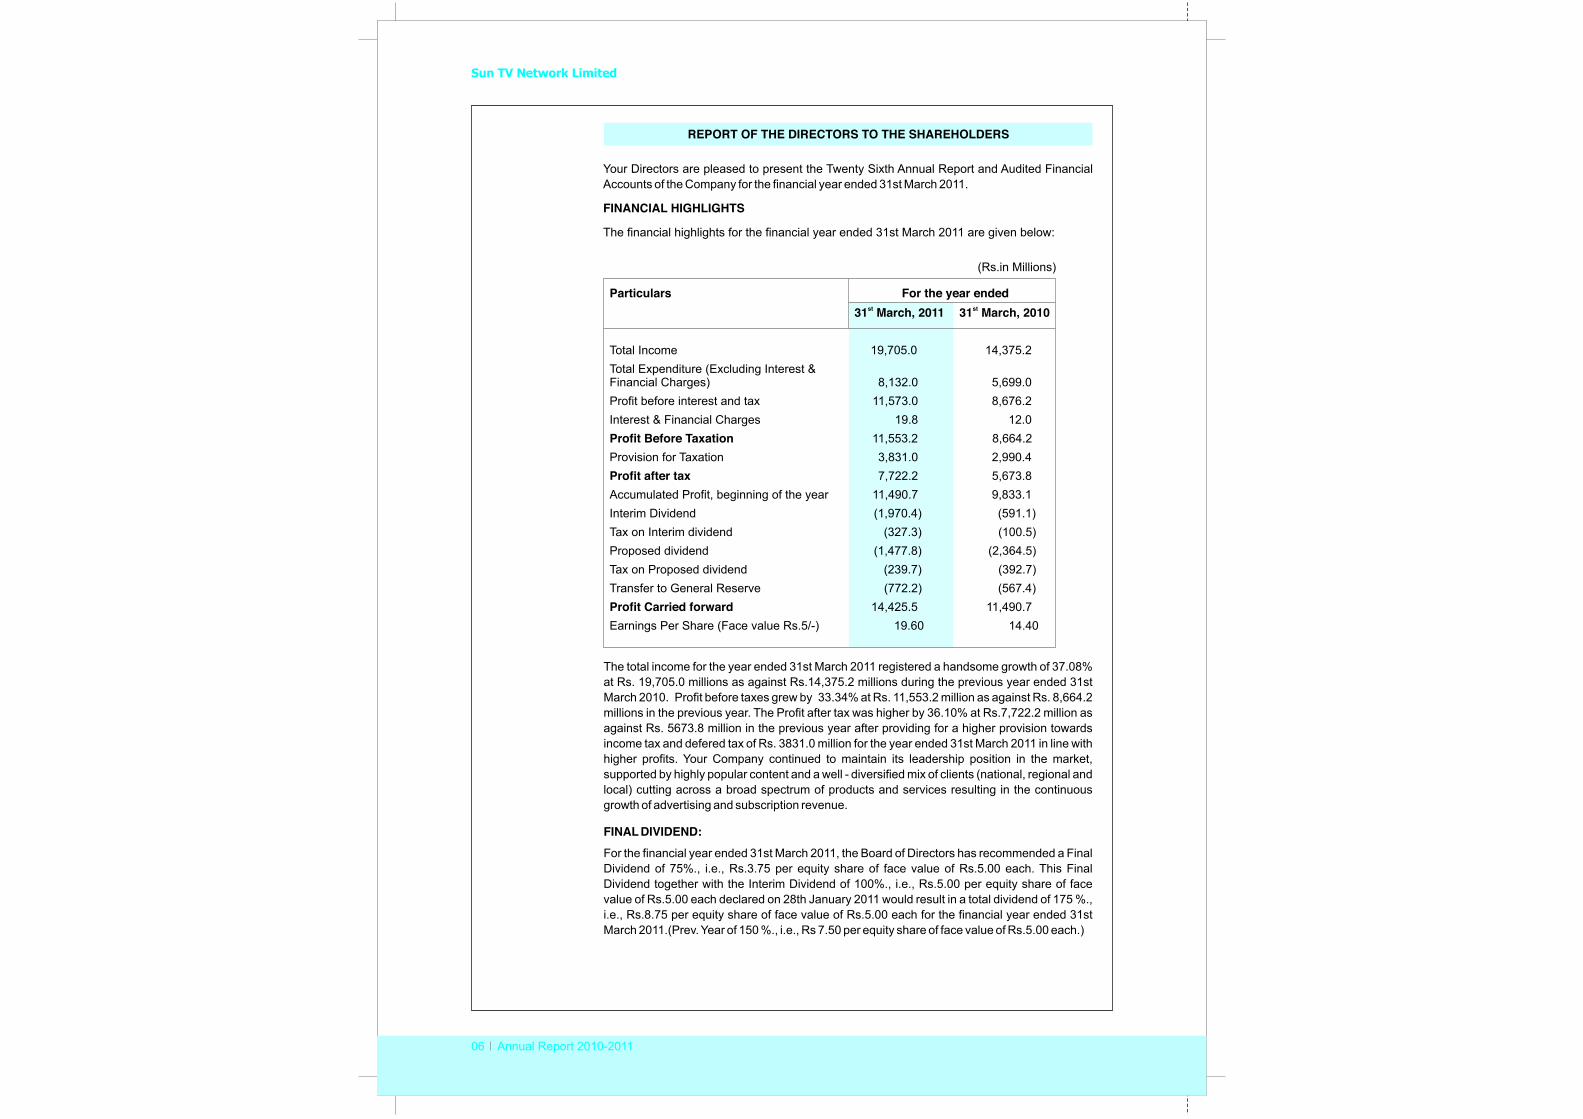
REPORT OF THE DIRECTORS TO THE SHAREHOLDERS
Your Directors are pleased to present the Twenty Sixth Annual Report and Audited Financial Accounts of the Company for the financial year ended 31st March 2011.
FINANCIAL HIGHLIGHTS
The financial highlights for the financial year ended 31st March 2011 are given below:
Particulars For the year endedst 31
Total Income 19,705.0 Total Expenditure (Excluding Interest & Financial Charges) 8,132.0 5,699.0 Profit before interest and tax 11,573.0 8,676.2 Interest & Financial Charges 19.8 12.0 Profit Before Taxation 11,553.2 8,664.2 Provision for Taxation 3,831.0 2,990.4 Profit after tax 7,722.2 5,673.8 Accumulated Profit, beginning of the year 11,490.7 9,833.1 Interim Dividend (1,970.4) (591.1) Tax on Interim dividend (327.3) (100.5)Proposed dividend (1,477.8) (2,364.5) Tax on Proposed dividend (239.7) (392.7) Transfer to General Reserve (772.2) (567.4) Profit Carried forward 14,425.5 11,490.7Earnings Per Share (Face value Rs.5/-) 19.60 14.40
stMarch, 2011 31 March, 2010
14,375.2
(Rs.in Millions)
The total income for the year ended 31st March 2011 registered a handsome growth of 37.08% at Rs. 19,705.0 millions as against Rs.14,375.2 millions during the previous year ended 31st March 2010. Profit before taxes grew by 33.34% at Rs. 11,553.2 million as against Rs. 8,664.2 millions in the previous year. The Profit after tax was higher by 36.10% at Rs.7,722.2 million as against Rs. 5673.8 million in the previous year after providing for a higher provision towards income tax and defered tax of Rs. 3831.0 million for the year ended 31st March 2011 in line with higher profits. Your Company continued to maintain its leadership position in the market, supported by highly popular content and a well - diversified mix of clients (national, regional and local) cutting across a broad spectrum of products and services resulting in the continuous growth of advertising and subscription revenue.
FINAL DIVIDEND: For the financial year ended 31st March 2011, the Board of Directors has recommended a Final Dividend of 75%., i.e., Rs.3.75 per equity share of face value of Rs.5.00 each. This Final Dividend together with the Interim Dividend of 100%., i.e., Rs.5.00 per equity share of face value of Rs.5.00 each declared on 28th January 2011 would result in a total dividend of 175 %., i.e., Rs.8.75 per equity share of face value of Rs.5.00 each for the financial year ended 31st March 2011.(Prev. Year of 150 %., i.e., Rs 7.50 per equity share of face value of Rs.5.00 each.)
07 Annual Report 2010-2011
BUSINESS OVERVIEW
Your Company, one of the largest Television Broadcasters in India operating 20 Satellite Television Channels across four languages of Tamil, Telugu, Kannada and Malayalam and presently airing 43 FM radio stations across India has been on a high growth trajectory in the recent years. Your Company continued its dominance of the Southern region, aided by increasing viewership of its popular channels, which in turn helped in growing advertising and subscription revenues.
As part of its strategy to increase global viewership of its channels, your Company appointed Global Media Management LLC and World Media Connect LLC during the financial year to manage and grow its distribution and advertising business, respectively, in the North American market. Your Company is looking to increase its penetration of the South Indian diaspora that lives in North America and consequently, increase both subscription and advertising revenue from the region. Sun TV Network’s footprint currently extends to the USA, Canada, Europe, the Middle East, Singapore, Malaysia, Sri Lanka, South Africa, Australia and New Zealand.
REGISTERED OFFICEThe construction of your Company’s own office building at MRC Nagar has been completed and consequent to this the Registered Office has been shifted to our own premises at Murasoli Maran Towers, 73, MRC Nagar Main Road, MRC Nagar, Chennai - 600028.
DIRECTORS’ RESPONSIBILITY STATEMENT
As required by Section 217 (2AA) of the Companies Act, 1956, your Directors confirm that:
a) in the preparation of the annual accounts, the applicable Accounting Standards have been followed along with proper explanation relating to material departures.
b) the Directors have selected such accounting policies and applied them consistently and made judgments and estimates that are reasonable and prudent so as to give a true and fair view of the state of affairs of the Company at the end of the financial year and of the profit of the Company for that period.
c) the Directors have taken proper and sufficient care for the maintenance of adequate accounting records in accordance with the provisions of the Act for safeguarding the assets of the Company and for preventing and detecting fraud and other irregularities.
d) the Directors have prepared the annual accounts on a going concern basis.
DIRECTORSIn accordance with the provisions of Articles of Association of the Company, Mr. J. Ravindran and Mr. Nicholas Martin Paul, independent directors of the Company retire at the ensuing Annual General Meeting and being eligible offer themselves for reappointment. Your Board recommends their reappointment as Directors of your Company.
During the year under review Mr. Kalanithi Maran and Mrs Kavery Kalanithi have been re-appointed as Chairman & Managing Director and Joint Managing Director respectively with effect from 15th December, 2010 vide ordinary resolution passed through Postal Ballot dated 29th October, 2010.
Sun TV Network Limited
08 Annual Report 2010-2011
CORPORATE GOVERNANCEA Report on Corporate Governance together with Auditors’ Certificate on compliance with the conditions of Corporate Governance as stipulated under Clause 49 of the Listing Agreement is provided elsewhere in the Annual Report.
PARTICULARS OF EMPLOYEESSun TV Network Limited had 2111 employees as of March 31, 2011 (previous year 1987). In accordance with the provisions of Section 217(2A) of the Companies Act 1956 and the rules framed there under, the required information is annexed and forms part of this Report. However, as per the provisions of Section 219(1) (b) (iv) of the Companies Act, 1956, the Directors Report is being sent to all the Shareholders of the Company excluding the said annexure. Any shareholder interested in obtaining a copy of the said annexure may write to the Company Secretary at the Registered Office of the Company.
AUDITORSM/s. S.R.Batliboi & Associates, Chartered Accountants, the Auditors of the Company retire at the conclusion of this Annual General Meeting of the Company. Your Board propose their re-appointment as the Statutory Auditors of the Company.
CORPORATE SOCIAL RESPONSIBILITYYour Company has donated a sum of Rs. 7.8 millions to Sun Foundation, a Charitable trust to support the various social welfare activities carried out by the trust.
SUBSIDIARY COMPANIESThe two subsidiaries Kal Radio Limited and South Asia FM Limited together own 41 licenses of which 40 Radio stations were fully operational for the year under review. The revenue of the two subsidiaries were at Rs. 86.99 crores for the year under review as against Rs. 56.24 Crores for the previous year ended 31st March, 2010. After accounting for minority interest in South Asia FM Limited the share of loss of the two subsidiaries (Kal Radio Limited and South Asia FM Limited) is Rs. 1.68 crores as against Rs. 39.43 crores in the previous year.
Ministry of Corporate Affairs, Government of India has vide its general circular No. 2/2011 granted general exemption from the requirement to attach various documents in respect of subsidiary companies, as specified in sub-section (1) of Section 212 of the Companies Act, 1956. Accordingly, the Balance Sheet, Profit and Loss Account and other documents of the subsidiary companies are not being attached with the Balance Sheet of the Company. Financial information of the subsidiary companies, as required by the said circular, is disclosed elsewhere in the Annual Report. The Company will make available the Annual Accounts of the subsidiary companies and the related detailed information to any member of the Company who may be interested in obtaining the same. The annual accounts of the subsidiary companies will also be kept open for inspection at the Registered Office of the Company and that of the respective subsidiary companies. The Consolidated Financial Statements presented by the Company include financial results of its subsidiary companies.
During the previous year your company had incorporated a wholly owned subsidiary “Sun TV Network Europe Limited” in United Kingdom to Broadcast and distribute its channels in U.K. and Europe and it has started earning revenues. The total revenue of Sun TV Network Europe Limited is Rs. 13.47 crores as against Rs. 3.32 Crores in the previous year and the Net Loss after taxes is Rs. 2.88 crores as against Rs. 8.05 Crores in the previous year.
09 Annual Report 2010-2011
CONSOLIDATED FINANCIAL STATEMENTSAs required by the listing agreement with the Stock Exchanges, the Audited Consolidated Financial Statements prepared in Accordance with Accounting Standard-AS 21 notified by the Companies Accounting Standard Rules, 2006 are attached. The Audited Consolidated Financial Statements also account for the minority interest of your Company’s subsidiary South Asia FM Limited pursuant to the strategic alliance with Red FM.
CEO/CFO CERTIFICATIONThe Chairman and Managing Director and the Chief Financial Officer have submitted a certificate to the Board regarding the financial statements and other matters as required under clause 49(v) of the listing agreement.
PUBLIC DEPOSITSYour Company has not accepted any Deposits from the public in terms of section 58A of the Companies Act, 1956 during the financial year ended 31st March 2011.
INFORMATION AS REQUIRED UNDER SECTION 217(1)(e) OF THE COMPANIES ACT, 1956 READ WITH COMPANIES (DISCLOSURE OF PARTICULARS IN THE REPORT OF BOARD OF DIRECTORS) RULE, 1988
(A) CONSERVATION OF ENERGYThe Company is engaged in Satellites Television Broadcasting operations and the information, as intended under Section 217(1) (e) does not arise.
(B) TECHNOLOGY ABSORPTION, ADAPTATION AND INNOVATIONThe Company uses the latest digital technology in broadcasting its programs. The outdated technologies are constantly identified and updated with latest innovations.
(C) FOREIGN EXCHANGE EARNINGS AND OUTGOForeign Exchange Earnings : Rs. 690 Millions
(Previous year Rs.560.3 Million)
Foreign Exchange Outgo : Rs. 1,190.5 Millions
(Previous year Rs.651.9 Million)
ACKNOWLEDGMENTYour Directors take this opportunity to place on record their appreciation of the dedication and commitment of employees at all levels in maintaining the sustained growth of your Company and remain in the forefront of media and entertainment business. Your Directors thank and express their gratitude for the support and co-operation received from the Central and State Governments – mainly the Ministry of Information and Broadcasting and the Department of Telecommunication – and other stakeholders including our viewers, content producers, vendors, financial institutions, banks, investors, service providers as well as regulatory and governmental authorities.
We look forward to the future with determination and confidence.
On behalf of the Board
Place : Chennai Kalanithi MaranDate : May 26, 2011 Chairman & Managing Director
Sun TV Network Limited
10 Annual Report 2010-2011
The figures have been stated in Rs. Millions for better readability.Investors are cautioned that this discussion contains forward looking statements that involve risks and uncertainties including, but not limited to, risks inherent in the Company’s growth strategy, acquisition plans, dependence on certain businesses, dependence on availability of qualified and trained manpower and other factors. The following discussion and analysis should be read in conjunction with the Company’s financial statements included herein and the notes thereto.
INDUSTRYThe media and entertainment industry is one of the fastest growing sectors in the world. The emergence of new technologies in recent years has radically redefined the way media impacts households and corporations alike.
The Indian Media and Entertainment Industry (M&E) has been no exception to the global trends. The key components of M&E industry in the country include film, television, radio, advertising, print media, and music. With the increase in TV penetration, the share of television in M&E has become significant in value terms. The Television Industry with increased hours of mass entertainment programming during prime time and better coverage of popular events like sports and elections has seen an explosive growth in consumer mindshare. Its status as the preferred mode of entertainment of the people is obvious from the fact that it now contributes more than 60 percent of the entertainment industry's revenues. Television, the major contributor to the overall industry revenue, is estimated to grow at a steady rate over the next five years with increased viewership thanks to a wider range of channels. The television industry is now ready to advance to the next stage of its evolution, leverage off a whole host of newer technologies and completely change the way home entertainment is delivered. Over the next few years, cable and satellite, along with emerging delivery platforms like DTH and IP-TV are expected to revolutionize the industry. With increasing numbers of TV households getting digitized, the revenue potential of large broadcasters, hitherto lost through rampant underreporting, gets fully realized through the devices installed at customer premises. Mobile TV is yet another exciting prospect, involving live video streaming directly on to a handset, which in turns unleashes a range of customer applications ranging from education to entertainment to life saving interventions through telemedicine.
Sun TV Network Limited (Sun Network) maintains its dominant position in the southern states of India as one of the largest television and radio entertainment Company in India with a portfolio of 20 channels spread across four languages and in six genres of GEC, news, music, movies, kids and comedy. Sun Network also has a large network pan India in the FM Radio broadcasting segment with 44 FM licenses along with its subsidiaries. Sun Network continues to consolidate its leadership position, built over the years, by fortifying its hold over key aspects of pricing and access to quality content. Sun Network has a distinct advantage in the southern regional markets on account of its insightful understanding of the regional preferences and with key competitive strengths including that of a large movie library of regional languages. Sun Network is the preferred choice for content providers as it is the only player with maximum reach in the areas it operates.
OPPORTUNITIES AND THREATSOpportunities: The rapid pace of innovation and the introduction of new TV broadcast technologies create opportunities to serve new customers in new markets. The presence of large and wealthy Indian diaspora abroad is another powerful enabler for market expansion abroad.
MANAGEMENT DISCUSSION AND ANALYSIS(Pursuant to clause 49 of the Listing Agreement with Stock Exchanges)
11 Annual Report 2010-2011
The M&E industry is on the threshold of prodigious growth, influenced by many factors such as the convergence of TV, mobile telephony and the internet. The fact that significant households of India are still without television connectivity highlights the scope of growth in the segment. The majority of the revenue generated in the television industry is through advertisements, followed by subscription. Strong growth projected in DTH segment would result in substantial increase in subscription revenue over the years to come. Increasing interest in regional content among Indian population across the borders, results in increased overseas viewership thereby attracting foreign investment. Radio broadcasting in India which is still in its infancy is evolving to be a revenue spinner in the coming years.
Threats:
It is difficult to predict our revenues and expenses as they fluctuate significantly given the nature of the markets in which we operate. This increases the likelihood that our results could fall below the expectation of market analysts. Certain threats are summarized below;
⇒ Advertising income continue to be the major source of Sun Network’s revenues, which could decline due to a variety of factors.
⇒ The commercial success of Sun Network depends on our ability to cater to viewer performance and maintain high audience shares which could be affected.
⇒ The competition and increasing prices may adversely affect our ability to acquire desired programming and artistic talent.
⇒ Sun Network operates in an intensely competitive industry
⇒ Sun Network is a regional broadcaster, which may limit our opportunities for growth as well as our attractiveness to advertising customers and others.
⇒ Technological failures could adversely affect our business.
⇒ Our inability to effectively deploy and manage funds could affect our profitability
SEGMENT
Sun Network operations predominantly relate to a single segment “Broadcasting”.
OUTLOOK
Sun Network with a dominant market share in the four southern states of India (Tamil Nadu, Kerala, Karnataka and Andhra Pradesh), has played a prominent role in the recent strong growth witnessed in the regional media markets in India. Its presence across genres like general entertainment, movies, music and news ensure continued and sustained viewership. A steady flow of highly popular programs and a dominant share of audience viewership have given the network tremendous pricing power vis-a-vis competitors.
As the largest regional television network, Sun Network would be one of the major beneficiaries of the recent growth in the DTH space. With the entry of new players like Reliance Big TV, Bharti and others into the DTH market, it is expected that this new stream of revenue for the Company arising from the increased DTH subscriber base in South India would maintain a positive momentum in the coming years.
MANAGEMENT DISCUSSION AND ANALYSIS (Pursuant to clause 49 of the Listing Agreement with Stock Exchanges)
Sun TV Network Limited
12 Annual Report 2010-2011
FINANCE AND HUMAN RESOURCE
Finance:
The total Income for the year ended 31st March 2011 amounted to Rs. 19,705 millions as against Rs. 14,375.2 millions during the previous year ended 31st March 2010. The Profit after tax was at Rs. 7,722.2 millions for the year ended 31st March 2011 as against Rs.5,673.8 millions in the previous year. The Board of Directors has recommended a Final Dividend of 75%., i.e., Rs. 3.75 per equity share of face value of Rs.5.00 each. This Final Dividend together with the Interim Dividend of 100%., i.e., Rs.5.00 per equity share of face value of Rs.5.00 each declared on 20th January 2010 would result in a total dividend of 175%., i.e., Rs. 8.75 per equity share of face value of Rs.5.00 each for the financial year ended 31st March 2011. (Prev. Year of 150%., i.e., Rs 7.50 per equity share of face value of Rs.5.00 each.). The Reserves and Surplus of the Company as on 31st March 2011 stood at Rs. 21,886.7 millions as against Rs. 18179.7 millions as on 31st March 2010.
Human Resources:
At Sun Network, with 2111 employees, human resource is a key asset capital and an important business driver for the Company’s sustained growth and profitability. Hence, we at Sun Network believe that training, like all organizational development processes cannot be a function of time, but rather an ongoing process with the developmental needs and business planning processes being formalized constantly. A continuous review of the monitoring process is underway and procedures and systems are being institutionalized across the organization.
FINANCIAL REVIEW & RISK MANAGEMENT (INCLUDING INTERNAL CONTROL)
Separate report on this is annexed On behalf of the Board
Place : Chennai Kalanithi MaranDate : May 26, 2011 Chairman & Managing Director
MANAGEMENT DISCUSSION AND ANALYSIS(Pursuant to clause 49 of the Listing Agreement with Stock Exchanges)
13 Annual Report 2010-2011
The Financial highlights during the year under review comprised:(All amounts are in millions unless otherwise stated)
⇒ A 37.08 per cent growth in Total Income⇒ Increase in Profit before taxes by 33.34 per cent⇒ Increase in Profit after taxes by 36.10 per cent
1. EARNINGS
Total Income
Total Income grew from Rs. 14,375.2 million to Rs. 19,705 million, a 37.08 per cent increase. The sustained growth and consistent higher margins are reflective of the Company’s continued dominance in broadcasting business in the Southern states.
Profit before tax (PBT) and Profit after tax (PAT)
PBT increased from Rs. 8,664.2 million to Rs. 11,553.2 million, with a 33.34 per cent increase and PAT increased from Rs. 5,673.8 million to Rs. 7,722.2 million, a 36.10 per cent increase.
Dividend
The outgo on account of interim and final dividend including dividend tax is Rs. 4,015.2 million (previous year Rs. 3,448.8 million). 2. FINANCIAL POSITION
Shareholder’s Funds
Shareholders’ Fund as on 31st March 2011 was Rs. 23,857.1 million. (previous year Rs. 20,150.1 million).
Loan funds
The Company is debt free and had no loan funds – secured or unsecured as on 31st March 2011 (previous year Rs. Nil).
Assets
Net block of fixed assets were at Rs. 7,940.1million. The addition to fixed assets for the year was Rs. 3,614.4 million. The capital expenditure was funded through internal accruals and deployment of IPO proceeds. Net block of intangible assets and capital work in progress (including capital advances and intangible assets under development) as on 31st March, 2011 were at Rs. 1,876.5 and Rs. 170.6 million respectively.
4. RATIOS
Earnings per share
The Earnings per share of face value of Rs. 5.00 for the year ended 31st March 2011 is Rs. 19.60 (previous year Rs 14.40).
RISK ANALYSIS AND MANAGEMENT
Risk is an inherent feature of any business activity, more so when the dependence is on the consistency on the deliverables of the Company and linked to the sustained support from the viewers and advertisers community at large. Like every organization, Sun TV Network Ltd’s (Sun Network) business is also impacted by a number of factors. Given below is an overview of some of the major risks affecting any business and Sun’s position vis-à-vis these risks.
FINANCIAL REVIEW 2010-11(Pursuant to clause 49(11) (E) (1) of the Listing Agreement)
Sun TV Network Limited
14 Annual Report 2010-2011
PRINCIPAL RISKS AND THEIR MITIGATION
STRATEGIC RISK
The performance and growth of media industry are dependent on the health of the Indian economy and in particular the economies of the regional markets it serves. These economies could be adversely affected by various factors, such as political and regulatory action including adverse changes in liberalization policies, social disturbances, terrorist attacks and other acts of violence or war, natural calamities, interest rates, commodity and energy prices and various other factors.
The media industry in India has been continuously fraught with regulatory issues including those of license, investment caps and ownership limits. Regulation such as ban on multi frequency ownership in the same city for Radio, FDI Cap of 26% in broadcasting, no dubbing of content (Kannada Market) are some of the regulations holding this industry back. Although Sun Network has performed well in spite of these adversities, further regulatory changes always remain a concern.
Sun Network has been able to capitalize on its leadership position built over the years, by fortifying its hold over quality content. It is able to practice its strategy of selling telecast slots under exclusive agreements and additionally ensuring a continued supply of quality content.A steady flow of highly popular programs and a dominant share of audience viewership have given the network tremendous pricing power vis-à-vis competitors. South India produces the largest number of films per year and with huge movie following target audience, Sun Network ensures access to popular content, by purchasing larger quantum of all South Indian movies on a perpetual rights basis.
Risk Mitigation
Sun Network believes that it would not be disadvantaged and would manage competition through content and a pan India spread. OPERATIONAL RISK
Possible decline in the popularity of channels of Sun Network, such a decline shall adversely impact its revenue, both from advertisement as well as subscription revenue. Risk Mitigation
Sun Network’s competitive advantages stems from its high popularity, exclusive access to high quality content and a large movie library, giving it significant pricing power to capitalize on the fast growing advertisement and subscription market. Sun Network will endeavor to keep track and abreast with high quality content and library.
FINANCIAL RISK
Treasury Investments Risk
The Company carries significant amounts of surplus cash on its balance sheet, which are invested in various securities; the value of these investments may be eroded if they are deployed in risky asset classes.
Risk Mitigation
The Company follows a conservative policy of investing, which disallows any exposure to volatile assets like equity shares or illiquid assets like real estate. The policy is defined to preserve capital by permitting investments only into AAA rated instruments, with reasonable rates of return and allows quick liquidation by avoiding long dated securities.
FINANCIAL REVIEW 2010-11(Pursuant to clause 49(11) (E) (1) of the Listing Agreement)
15 Annual Report 2010-2011
Leverage Risk
A high debt component could result in an excessive interest drain.
Risk Mitigation
The company is a zero debt company.
Receivable Risk
Delays in collection of accounts receivable could affect the Company’s cash flow, with poor follow up potentially leading to delinquency and write offs.
Risk Mitigation
The company constantly monitors its debt collection and ensures that the debtors are periodically reviewed and dues maintained at levels that do not affect its cash flow.
LEGAL AND STATUTORY RISKS
Risk on contractual liabilities
The risk arising out of contracts that impose onerous responsibilities.
Risk Mitigation
The Company constantly reviews all Agreements, documents and contracts review to ensure compliance with the accepted business procedures.
Compliance failure risk
The risk arising out of non-compliance with statutory requirements.
Risk mitigation
At Sun Network statutory compliance has been ensured through an internal process and legal compliance is given due importance in the Company’s management process. The Company is proposing an independent audit and review across all the operational areas to reassess the existing processes.
INTERNAL CONTROL
Weak internal control can jeopardize the Company’s financial position.
Risk mitigation
The Company has in place systems and processes, commensurate with its size and nature of business so as to ensure adequate internal control while ensuring smooth conduct of operations and compliance with statutory requirements under all applicable legislations. The Company has implemented SAP ERP system, which ensures significant automation of processes, with sufficient IT system controls in place. Independent internal audit is carried out to ensure adequacy of internal control system and adherence to policies and practices. The Audit Committee reviews the functioning of the internal audit function.
On behalf of the Board
Place : Chennai Kalanithi MaranDate : May 26, 2011 Chairman & Managing Director
FINANCIAL REVIEW 2010-11(Pursuant to clause 49(11) (E) (1) of the Listing Agreement)

Sun TV Network Limited
16 Annual Report 2010-2011
MANDATORY REQUIREMENTS
1. Company's Philosophy on Code of Governance
Corporate Governance is the set of processes, custom, policies, laws and institutions affecting the way a company is directed, administered or controlled. The corporate governance philosophy at Sun Network is about maximizing shareholder value legally, ethically and on a sustainable basis, while ensuring fairness to every stakeholder, customers, employees, investors, vendor-partners, the government of the land and the community. We believe good governance is an essential ingredient of good business that aligns all our actions with clearly defined ethical principles. Thus, corporate governance is a reflection of a Company’s culture, policies, its relationship with the stakeholders and its commitment to values.
We believe that it is our responsibility to adhere and enforce the principles of sound Corporate Governance with the objectives of transparency, professionalism and accountability, while facilitating effective management of the businesses and efficiency in operations.
2. Board of Directors�Composition
The Board of Directors of our Company composed of Five Non-executive and two Executive Directors. The Chairman of the Board is an Executive Director and Four Non-executive Directors are independent Directors as per the criteria of independence stated in the listing agreement. The optimum combination of Executive, Non-executive and independent Directors ensure independence of the Board and separation of Board function of governance and management.�Board Meetings
Eight Board Meetings were held during the year. The dates on which the said meetings held are as follows:
28th May 2010, 28th July 2010, 3rd September 2010, 28th October 2010, 12th November 2010, 9th December 2010, 28th January, 2011 and 11th March 2011.
Attendance of each Director at the Board Meetings and last AGM and the number of companies and committees where he/she is a Director/Member.
REPORT ON CORPORATE GOVERNANCE(PURSUANT TO CLAUSE 49 OF THE LISTING AGREEMENT)
Board AGM Chairman MemberKalanithi Maran Chairman and
Managing Director 8 Yes 4 2 NilKavery Kalanithi Joint Managing Director 8 Yes 4 Nil 4
S. Selvam Director 8 Yes 1 Nil Nil
S. Sridharan Independent Director 8 Yes 2 3 2
J. Ravindran Independent Director 8 Yes 4 5 4
M.K. Harinarayanan Independent Director 8 Yes 2 1 4
Nicholas Martin Paul Independent Director 8 Yes 2 Nil 5
Name of the Director
Category AttendanceNo. of Directorships
in public limited companies including
this company
Committee Memberships (including this
Company)
17 Annual Report 2010-2011
The Board has been provided with all material and substantial information that facilitates them for imparting significant decisions while discharging its duties as trustees of shareholders.
�Postal Ballot
During the year, the shareholders of the Company passed two ordinary resolutions through postal ballot. Detailed procedure followed by the Company is provided hereunder:
1. The Board of Directors of the Company (" Board") in its meeting held on 3rd September 2010 sought the approval of the shareholders through postal ballot for the following two items as Ordinary resolutions:
Item No. 1 Re-appointment of Mr. Kalanithi Maran as Chairman & Managing Director of the Company and payment of remuneration to him for a period of five years effective from December 15, 2010.
Item No. 2 Re-appointment of Mrs. Kavery Kalanithi as Whole Time Director designated as Joint Managing Director of the Company and payment of remuneration to her for a period of five years effective from December 15, 2010.
The Board appointed Mrs. Lakshmmi Subramanian, Practising Company Secretary as Scrutinizer for conducting the postal ballot process.
2. The Notice of the Postal Ballot dated September 3, 2010, Postal Ballot form and self-addressed pre-paid postage envelope were sent to the shareholders. The last date for receipt of the Postal Ballot form from the Shareholders was October 23, 2010.
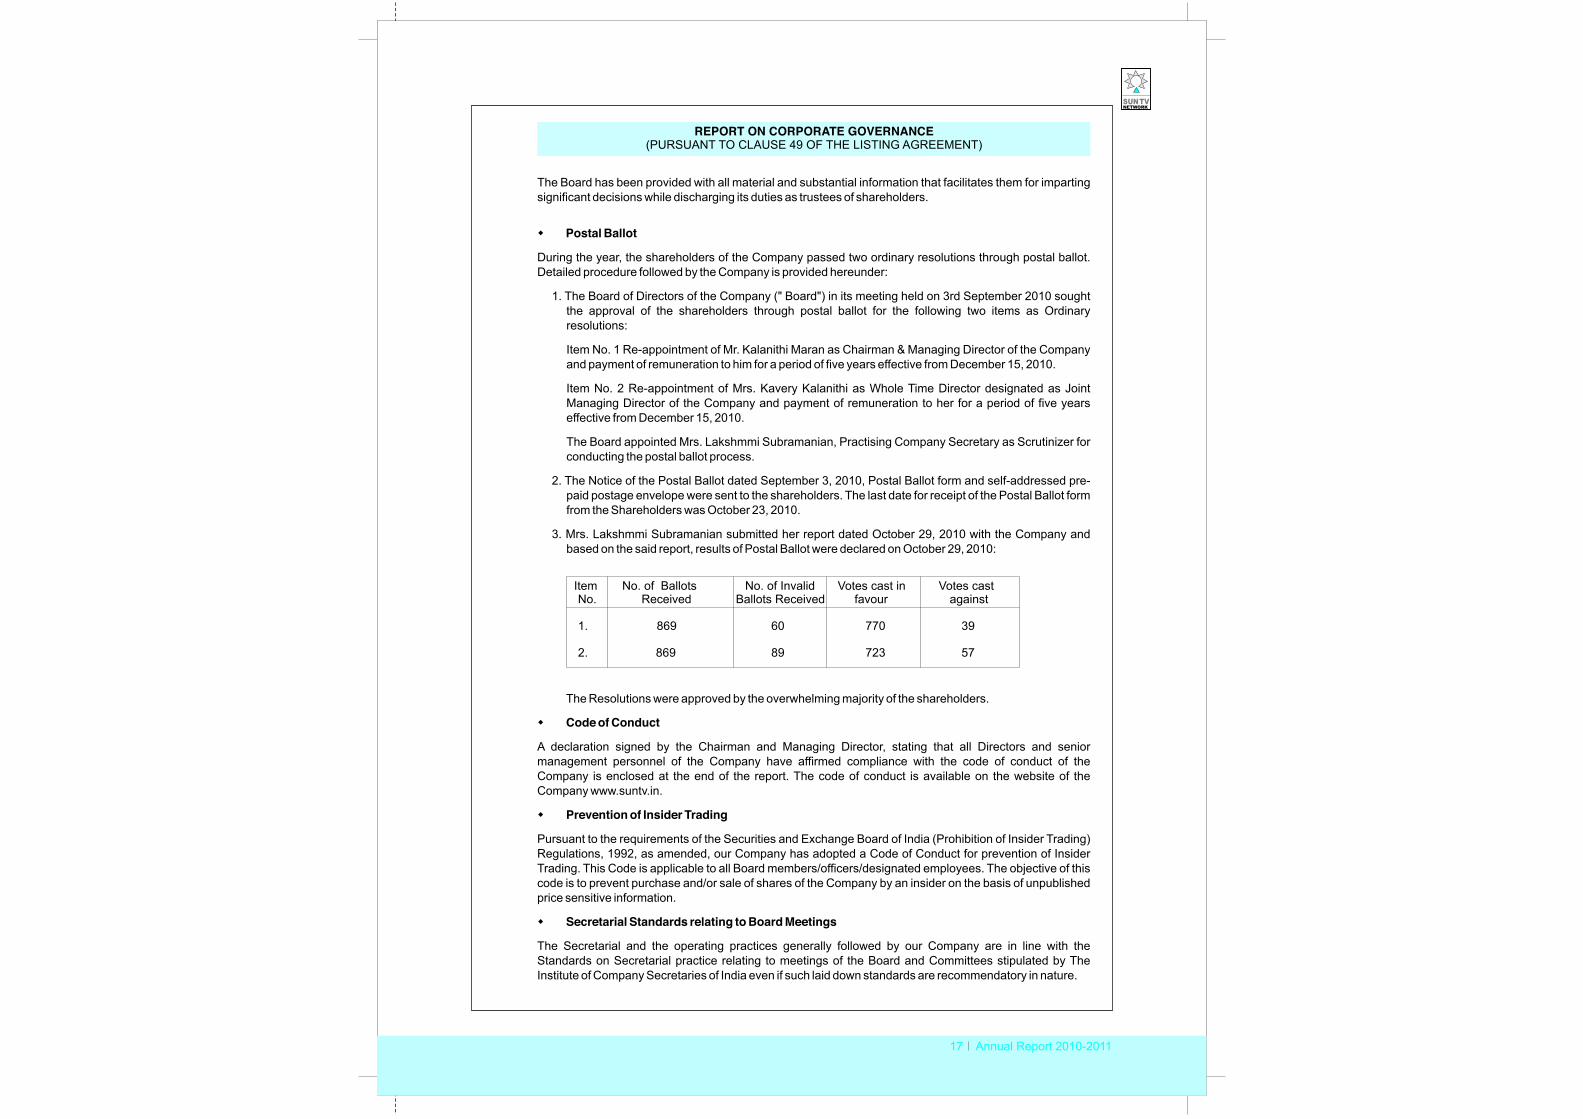
3. Mrs. Lakshmmi Subramanian submitted her report dated October 29, 2010 with the Company and based on the said report, results of Postal Ballot were declared on October 29, 2010:
The Resolutions were approved by the overwhelming majority of the shareholders.�Code of Conduct
A declaration signed by the Chairman and Managing Director, stating that all Directors and senior management personnel of the Company have affirmed compliance with the code of conduct of the Company is enclosed at the end of the report. The code of conduct is available on the website of the Company www.suntv.in. �Prevention of Insider Trading
Pursuant to the requirements of the Securities and Exchange Board of India (Prohibition of Insider Trading) Regulations, 1992, as amended, our Company has adopted a Code of Conduct for prevention of Insider Trading. This Code is applicable to all Board members/officers/designated employees. The objective of this code is to prevent purchase and/or sale of shares of the Company by an insider on the basis of unpublished price sensitive information.�Secretarial Standards relating to Board Meetings
The Secretarial and the operating practices generally followed by our Company are in line with the Standards on Secretarial practice relating to meetings of the Board and Committees stipulated by The Institute of Company Secretaries of India even if such laid down standards are recommendatory in nature.
REPORT ON CORPORATE GOVERNANCE(PURSUANT TO CLAUSE 49 OF THE LISTING AGREEMENT)
Item No. of Ballots No. of Invalid Votes cast in No. Received Ballots Received favour against
1. 869 60 770 39
2. 869 89 723 57
Votes cast
Sun TV Network Limited
18 Annual Report 2010-2011
3. Audit Committee�Composition, Names of Members and Chairman
The Audit Committee comprises of Mr. S. Sridharan, Mr. M.K. Harinarayanan, Mr. J. Ravindran and Mr. Nicholas Martin Paul, all are non-executive independent Directors of the Company with Mr. S. Sridharan as its Chairman.�Meetings and the attendance during the year
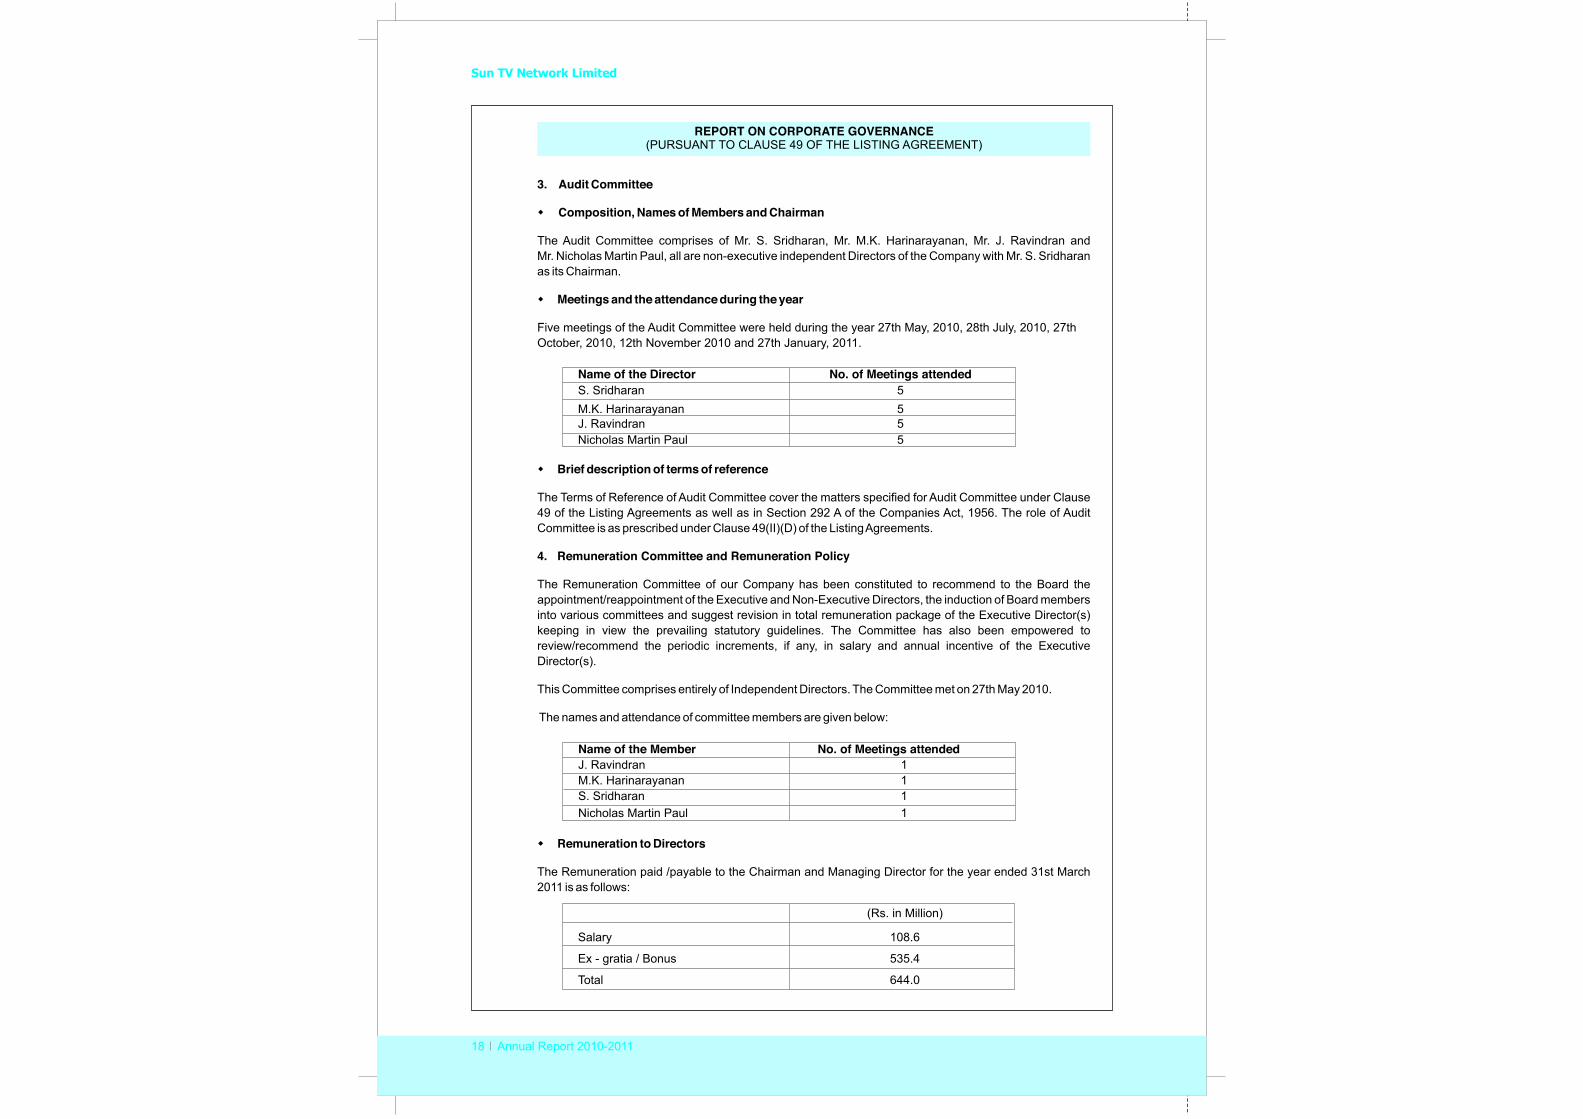
Five meetings of the Audit Committee were held during the year 27th May, 2010, 28th July, 2010, 27th October, 2010, 12th November 2010 and 27th January, 2011.
�Brief description of terms of reference
The Terms of Reference of Audit Committee cover the matters specified for Audit Committee under Clause 49 of the Listing Agreements as well as in Section 292 A of the Companies Act, 1956. The role of Audit Committee is as prescribed under Clause 49(II)(D) of the Listing Agreements.
4. Remuneration Committee and Remuneration Policy
The Remuneration Committee of our Company has been constituted to recommend to the Board the appointment/reappointment of the Executive and Non-Executive Directors, the induction of Board members into various committees and suggest revision in total remuneration package of the Executive Director(s) keeping in view the prevailing statutory guidelines. The Committee has also been empowered to review/recommend the periodic increments, if any, in salary and annual incentive of the Executive Director(s).
This Committee comprises entirely of Independent Directors. The Committee met on 27th May 2010.
The names and attendance of committee members are given below:
�Remuneration to Directors
The Remuneration paid /payable to the Chairman and Managing Director for the year ended 31st March 2011 is as follows:
REPORT ON CORPORATE GOVERNANCE(PURSUANT TO CLAUSE 49 OF THE LISTING AGREEMENT)
Name of the Director No. of Meetings attendedS. Sridharan 5M.K. Harinarayanan 5J. Ravindran 5Nicholas Martin Paul 5
Name of the Member No. of Meetings attendedJ. Ravindran 1M.K. Harinarayanan 1S. Sridharan 1Nicholas Martin Paul 1
(Rs. in Million)
Salary 108.6
Ex - gratia / Bonus 535.4
Total 644.0
19 Annual Report 2010-2011
REPORT ON CORPORATE GOVERNANCE(PURSUANT TO CLAUSE 49 OF THE LISTING AGREEMENT)
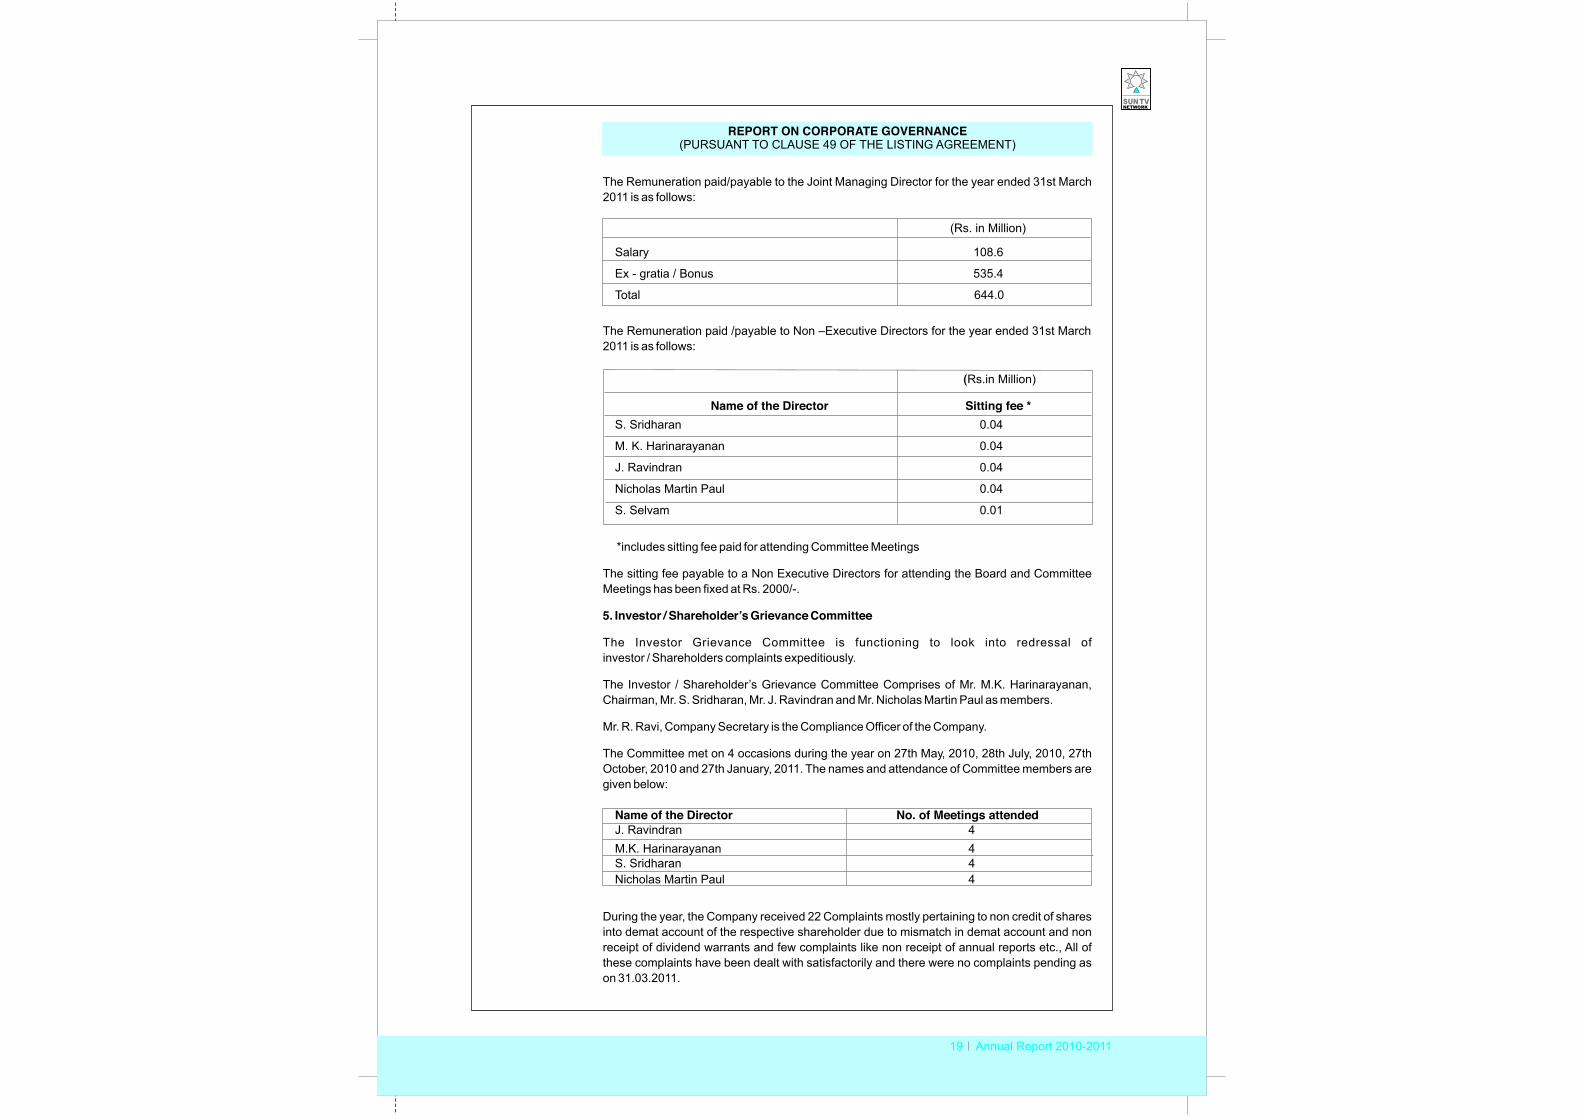
The Remuneration paid/payable to the Joint Managing Director for the year ended 31st March 2011 is as follows:
The Remuneration paid /payable to Non –Executive Directors for the year ended 31st March 2011 is as follows:
*includes sitting fee paid for attending Committee Meetings
The sitting fee payable to a Non Executive Directors for attending the Board and Committee Meetings has been fixed at Rs. 2000/-.
5. Investor / Shareholder’s Grievance Committee
The Investor Grievance Committee is functioning to look into redressal of investor / Shareholders complaints expeditiously.
The Investor / Shareholder’s Grievance Committee Comprises of Mr. M.K. Harinarayanan, Chairman, Mr. S. Sridharan, Mr. J. Ravindran and Mr. Nicholas Martin Paul as members.
Mr. R. Ravi, Company Secretary is the Compliance Officer of the Company.
The Committee met on 4 occasions during the year on 27th May, 2010, 28th July, 2010, 27th October, 2010 and 27th January, 2011. The names and attendance of Committee members are given below:
During the year, the Company received 22 Complaints mostly pertaining to non credit of shares into demat account of the respective shareholder due to mismatch in demat account and non receipt of dividend warrants and few complaints like non receipt of annual reports etc., All of these complaints have been dealt with satisfactorily and there were no complaints pending as on 31.03.2011.
Salary 108.6
Ex - gratia / Bonus 535.4
Total 644.0
(Rs. in Million)
(Rs.in Million)
Name of the Director Sitting fee * S. Sridharan 0.04
M. K. Harinarayanan 0.04
J. Ravindran 0.04
Nicholas Martin Paul 0.04
S. Selvam 0.01
Name of the Director No. of Meetings attendedJ. Ravindran 4M.K. Harinarayanan 4S. Sridharan 4Nicholas Martin Paul 4
Sun TV Network Limited
20 Annual Report 2010-2011
REPORT ON CORPORATE GOVERNANCE(PURSUANT TO CLAUSE 49 OF THE LISTING AGREEMENT)
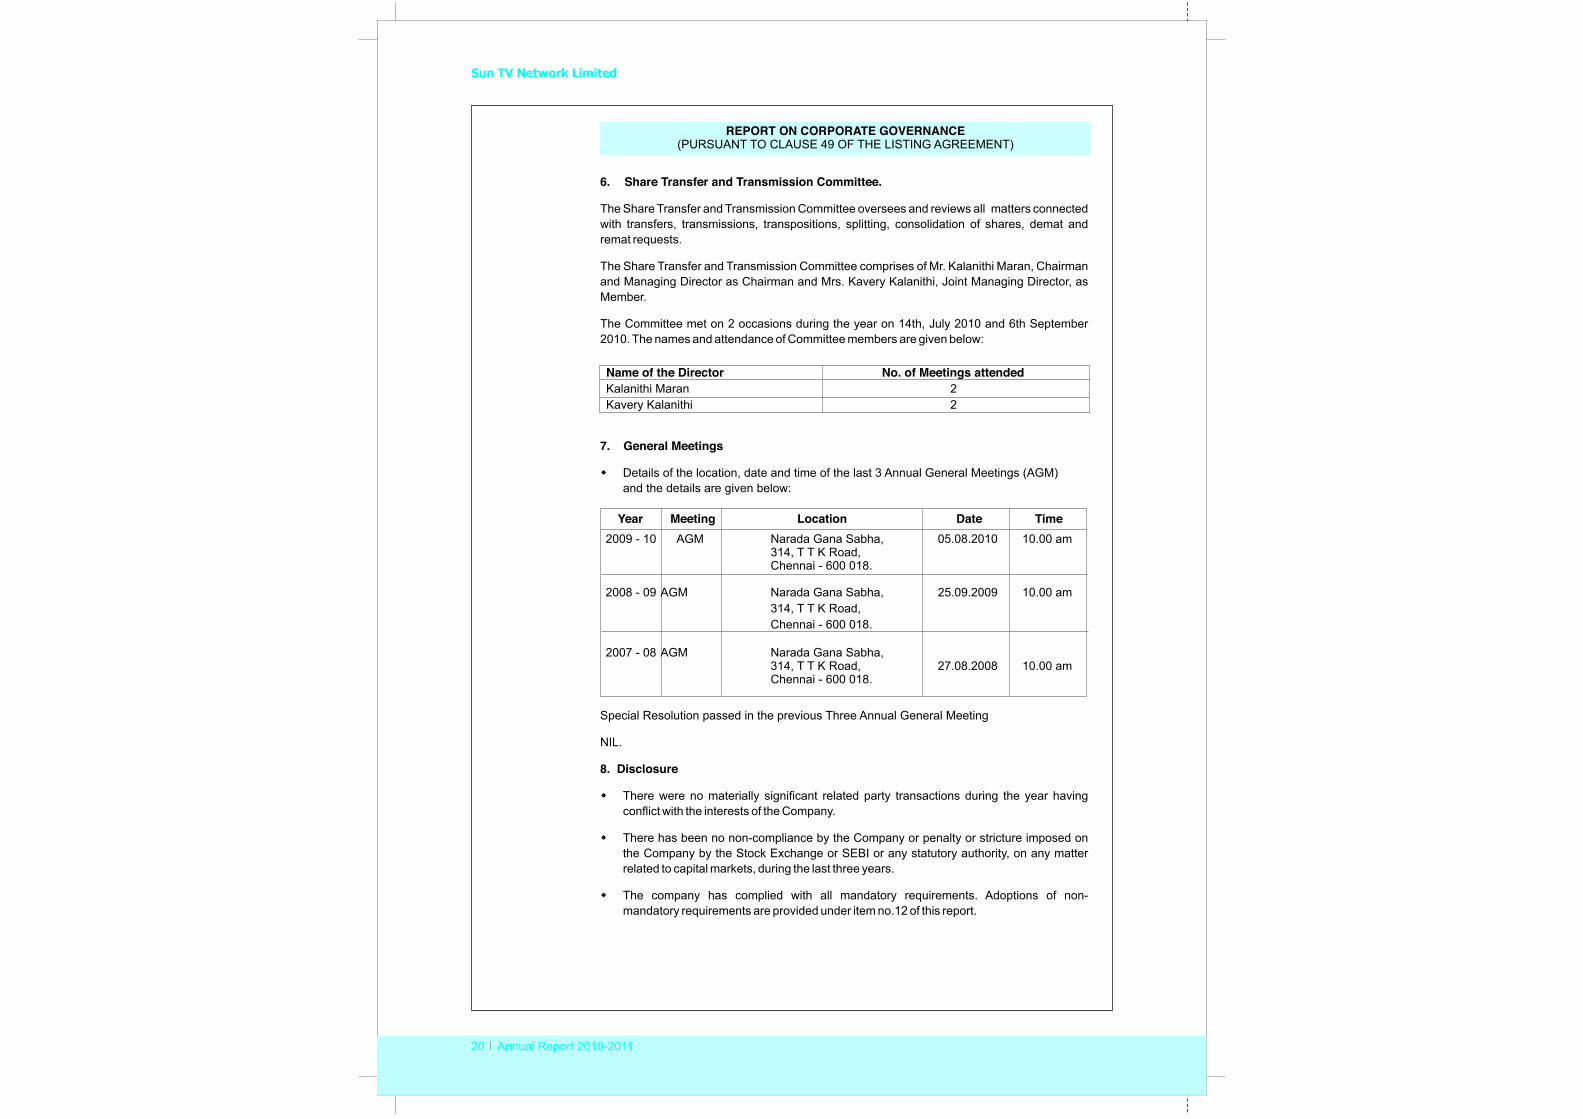
6. Share Transfer and Transmission Committee.
The Share Transfer and Transmission Committee oversees and reviews all matters connected with transfers, transmissions, transpositions, splitting, consolidation of shares, demat and remat requests.
The Share Transfer and Transmission Committee comprises of Mr. Kalanithi Maran, Chairman and Managing Director as Chairman and Mrs. Kavery Kalanithi, Joint Managing Director, as Member.
The Committee met on 2 occasions during the year on 14th, July 2010 and 6th September 2010. The names and attendance of Committee members are given below:
7. General Meetings�Details of the location, date and time of the last 3 Annual General Meetings (AGM) and the details are given below:
Special Resolution passed in the previous Three Annual General Meeting
NIL.
8. Disclosure�There were no materially significant related party transactions during the year havingconflict with the interests of the Company.�There has been no non-compliance by the Company or penalty or stricture imposed on the Company by the Stock Exchange or SEBI or any statutory authority, on any matter related to capital markets, during the last three years. �The company has complied with all mandatory requirements. Adoptions of non-mandatory requirements are provided under item no.12 of this report.
Name of the Director No. of Meetings attendedKalanithi Maran 2Kavery Kalanithi 2
Year Meeting Location Date Time 2009 - 10 AGM Narada Gana Sabha, 05.08.2010 10.00 am
314, T T K Road,Chennai - 600 018.
2008 - 09 AGM Narada Gana Sabha, 25.09.2009 10.00 am314, T T K Road,Chennai - 600 018.
2007 - 08 AGM Narada Gana Sabha,314, T T K Road, 27.08.2008 10.00 amChennai - 600 018.
21 Annual Report 2010-2011
REPORT ON CORPORATE GOVERNANCE(PURSUANT TO CLAUSE 49 OF THE LISTING AGREEMENT)
9. Means of CommunicationThe quarterly unaudited financial results and the annual audited financial results are normally published in Financial Express and Malai Sudar. Press releases are given to all important dailies. The official announcements are posted at BSE and NSE websites. The financial results, press releases and communications to investors are posted on the Company website www.suntv.in
10.Management Discussion and Analysis Report Management Discussion and Analysis report is annexed
11. Shareholders InformationThe details are enclosed elsewhere in the report
12.Non Mandatory Requirements1. The Board – Chairman’s Office The Chairman of Sun TV Network is an Executive Director and hence this provision is not
applicable.
2. Remuneration CommitteeThe Board has constituted a Remuneration Committee which is entirely composed of independent Directors. The Committee also discharges the duties and responsibilities as described under non-mandatory requirement of clause 49. The details of the Committee and its powers have been discussed in this section of the Annual Report.
3. Shareholders RightsThe quarterly/annual results, after the Board of Directors takes them on record, are forthwith sent to the Stock Exchanges with whom the company has listing arrangements. The results, in the prescribed format, are published in “Financial Express” (English) and “Maalai Chudar” (Tamil) newspapers.
4. Audit Qualification The Auditors have not qualified the financial statements of the Company
GENERAL SHAREHOLDERS INFORMATION
�Registered Office of the CompanyMurasoli Maran Towers,73, MRC Nagar Main Road,MRC Nagar,Chennai – 600 028Tel: 44676767 Fax: 40676161
�Forthcoming Annual General Meeting19th September, 2011
�Financial Year1st April 2010 to 31st March 2011
�Book Closure DatesFrom 10th September, 2011 to 19th September, 2011 (both days inclusive)
Kalaignar Arangam, Anna Arivalayam, 367 / 369, Anna Salai, Teynampet, Chennai - 600 018
Sun TV Network Limited
22 Annual Report 2010-2011
REPORT ON CORPORATE GOVERNANCE(PURSUANT TO CLAUSE 49 OF THE LISTING AGREEMENT)
�Dividend
The Final Dividend for the year ended 31st March 2010 as declared at the Annual General Meeting held on 5th August 2010 at Rs.6/- per equity share of Rs. 5/- each (at the rate of 120%) of the face value of the equity shares of the Company has been paid to the Shareholders on 6th August 2010.
For the year ended 31st March 2011, the Board of Directors at their Meeting held on 28th January 2011, declared an Interim Dividend at Rs.5.00/- per equity share of Rs. 5/- each (at the rate of 100 %) of the face value of the Company has been paid on 9th February 2011.
The Board of Directors have for the year under review also recommended a Final Dividend of Rs. 3.75 per equity share of Rs. 5/- each (at the rate of 75%) of the face value and the same will be paid after approval by the Members of the Company at the ensuing Annual General Meeting.
�Instruction to Shareholders�Shareholders holding shares in physical form
Please notify the change in your address to the Company’s registrar Karvy Computer share Private Limited, if any, immediately and not later than 25th August, 2011 to enable them to forward the dividend warrants to your present address. Members are also advised to intimate M/s Karvy Computer Share Private Limited the details of their bank account to enable the same to be incorporated in the dividend warrants. This would help to prevent any fraudulent encashment of dividend warrants.�Shareholders holding shares in demat form
The Company with respect to payment of dividend to shareholders, provides the facility of ECS at the following cities:
Ahmedabad, Bangalore, Bhubaneshwar, Chandigarh, Chennai, Hyderabad, Jaipur, Kanpur, Kolkata, Mumbai, Nagpur, New Delhi, Guwahati, Patna and Trivandram, the dividend would be remitted by ECS to your bank account. The Company would advice you after remittance of the dividend.
In respect of shareholders residing in other centers, the bank account details furnished by your Depository Participants (DPS) would be incorporated in the dividend warrants and these would be mailed to the registered addresses. If there is any change in the bank account details kindly advice your DPs immediately about change.
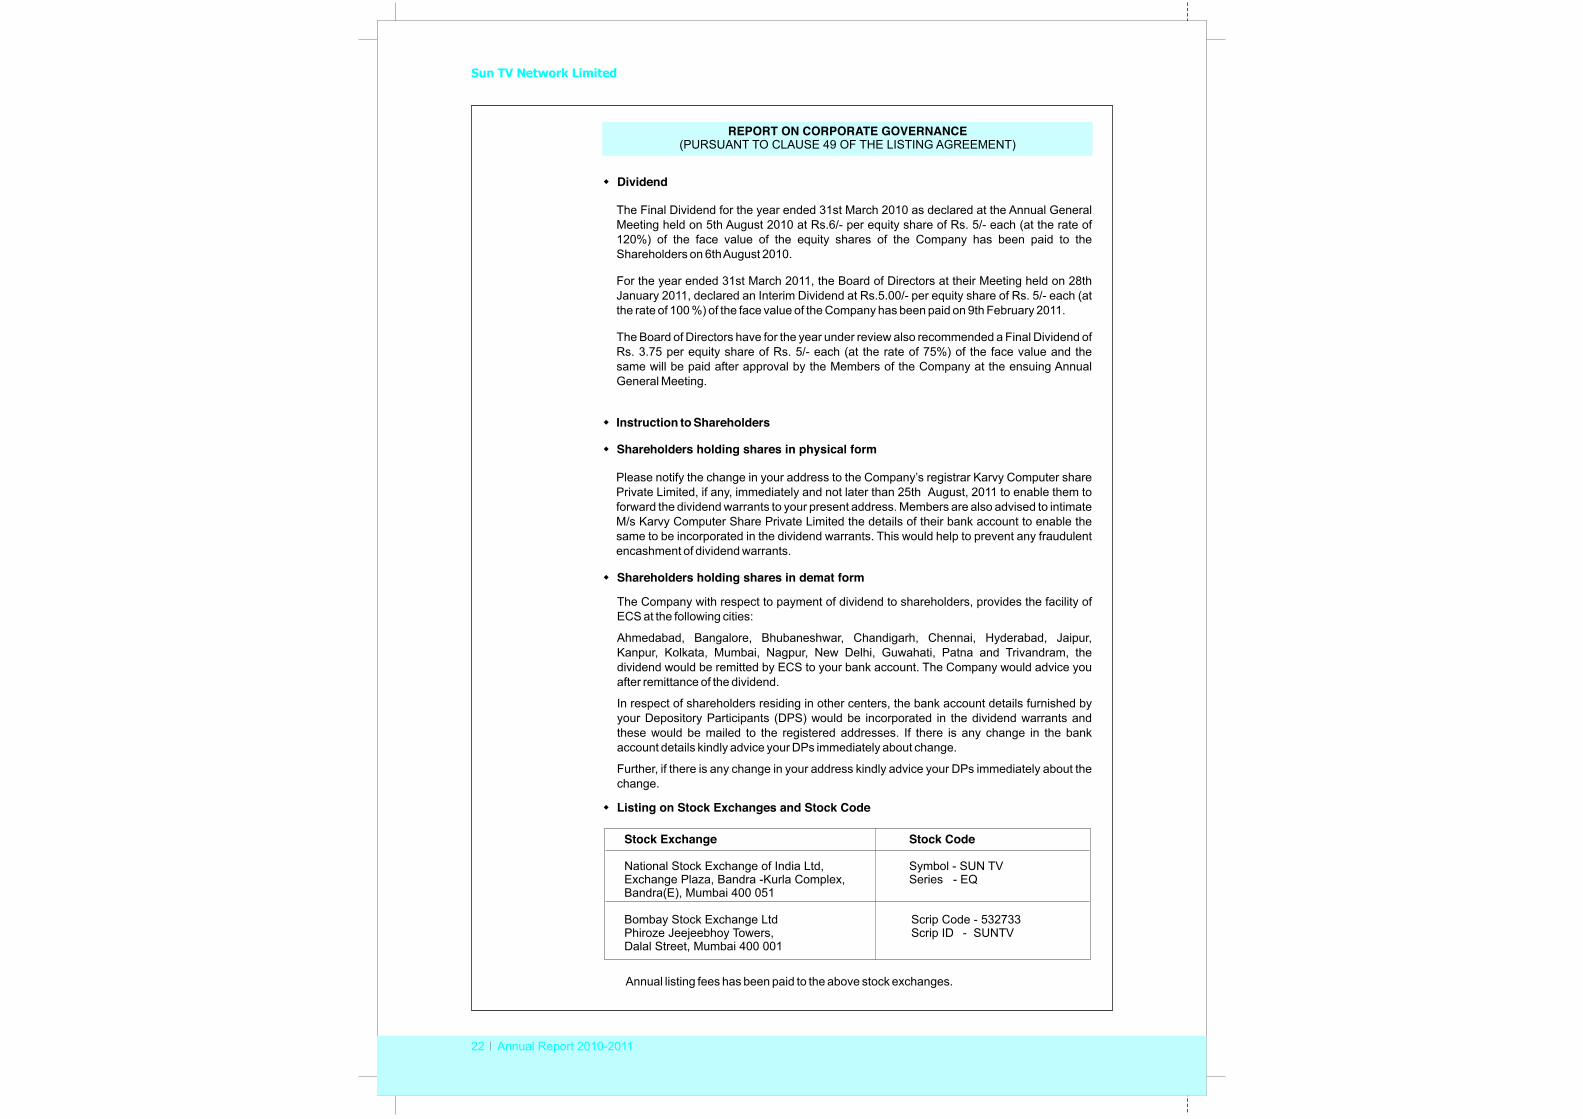
Further, if there is any change in your address kindly advice your DPs immediately about the change. �Listing on Stock Exchanges and Stock Code
Annual listing fees has been paid to the above stock exchanges.
Stock Exchange Stock Code
National Stock Exchange of India Ltd, Symbol - SUN TV Exchange Plaza, Bandra -Kurla Complex, Series - EQBandra(E), Mumbai 400 051
Bombay Stock Exchange Ltd Scrip Code - 532733Phiroze Jeejeebhoy Towers, Scrip ID - SUNTVDalal Street, Mumbai 400 001
23 Annual Report 2010-2011
REPORT ON CORPORATE GOVERNANCE(PURSUANT TO CLAUSE 49 OF THE LISTING AGREEMENT)
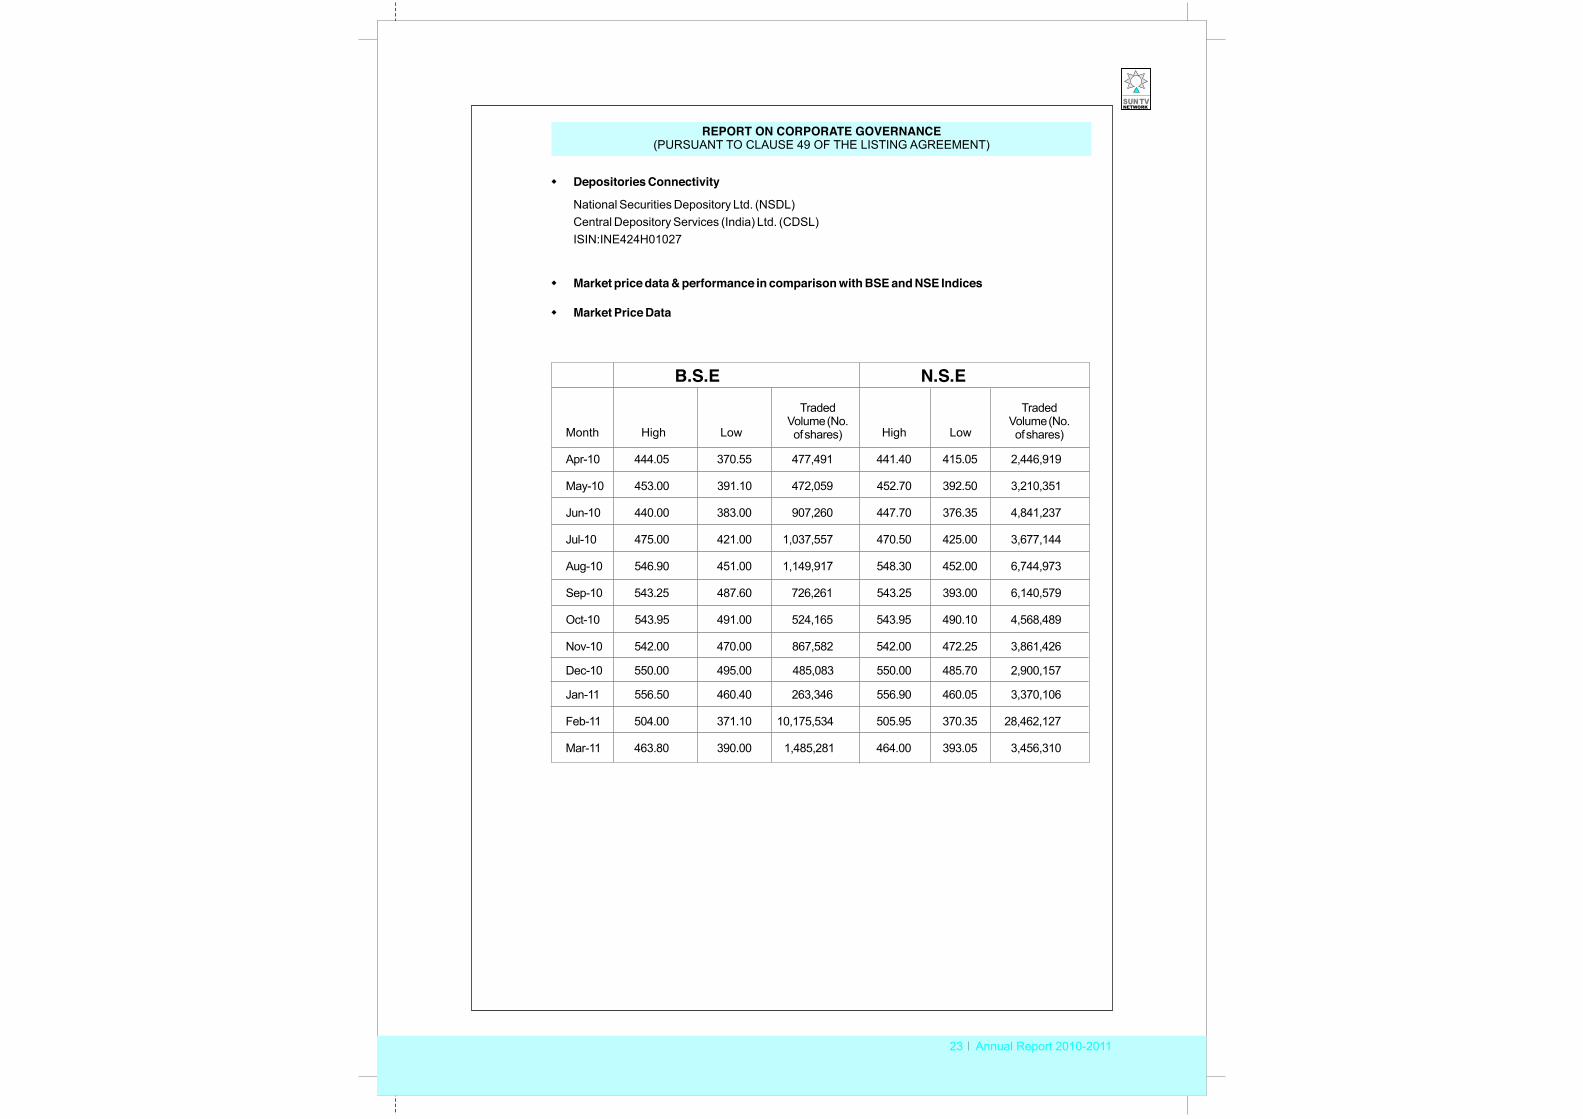
Month High Low High Low
Apr-10 444.05 370.55 477,491 441.40 415.05 2,446,919
May-10 453.00 391.10 472,059 452.70 392.50 3,210,351 Jun-10 440.00 383.00 907,260 447.70 376.35 4,841,237
Jul-10 475.00 421.00 1,037,557 470.50 425.00 3,677,144
Aug-10 546.90 451.00 1,149,917 548.30 452.00 6,744,973
Sep-10 543.25 487.60 726,261 543.25 393.00 6,140,579
Oct-10 543.95 491.00 524,165 543.95 490.10 4,568,489
Nov-10 542.00 470.00 867,582 542.00 472.25 3,861,426
Dec-10 550.00 495.00 485,083 550.00 485.70 2,900,157
Jan-11 556.50 460.40 263,346 556.90 460.05 3,370,106
Feb-11 504.00 371.10 10,175,534 505.95 370.35 28,462,127
Mar-11 463.80 390.00 1,485,281 464.00 393.05 3,456,310
B.S.E N.S.ETraded
Volume (No.of shares)
TradedVolume (No.of shares)
�Market price data & performance in comparison with BSE and NSE Indices�Market Price Data
�Depositories Connectivity
National Securities Depository Ltd. (NSDL)Central Depository Services (India) Ltd. (CDSL)ISIN:INE424H01027
Sun TV Network Limited
24 Annual Report 2010-2011
REPORT ON CORPORATE GOVERNANCE(PURSUANT TO CLAUSE 49 OF THE LISTING AGREEMENT)
�Share Transfer Process
�The physical transfers and other requests from the Shareholders are processed by Karvy Computer Share Private Ltd.�The Board delegated the power to approve the transfers to the Share Transfer Committee and the transfers are approved as and when necessary.�A Practicing Company Secretary carries out the Secretarial Audit, pertaining to the share transfers every six months and necessary certificate to that effect are issued and the same are filed with the Stock Exchanges.�As per SEBI’s instructions, the Company’s Shares can be sold through stock exchange only in dematerialized form.
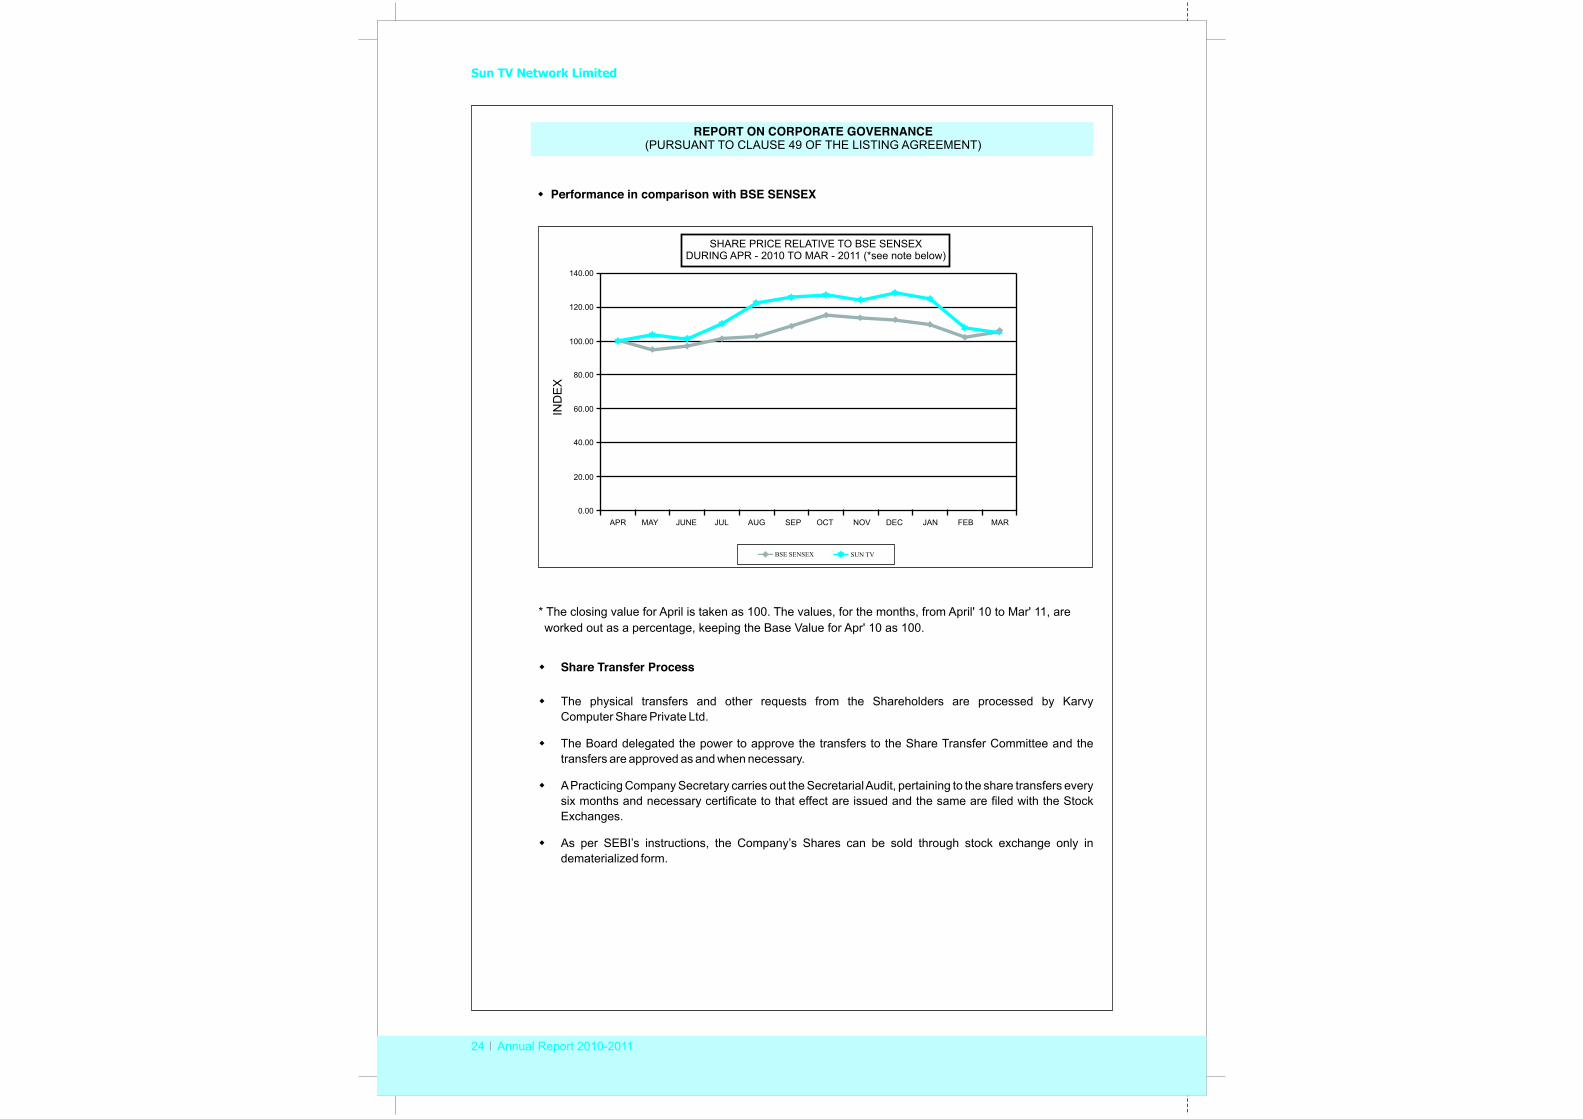
� Performance in comparison with BSE SENSEX
* The closing value for April is taken as 100. The values, for the months, from April' 10 to Mar' 11, are worked out as a percentage, keeping the Base Value for Apr' 10 as 100.
SHARE PRICE RELATIVE TO BSE SENSEXDURING APR - 2010 TO MAR - 2011 (*see note below)
IND
EX
140.00
120.00
100.00
80.00
60.00
40.00
20.00
0.00APR MAY JUNE JUL AUG SEP OCT NOV DEC JAN FEB MAR
BSE SENSEX SUN TV
25 Annual Report 2010-2011
REPORT ON CORPORATE GOVERNANCE(PURSUANT TO CLAUSE 49 OF THE LISTING AGREEMENT)
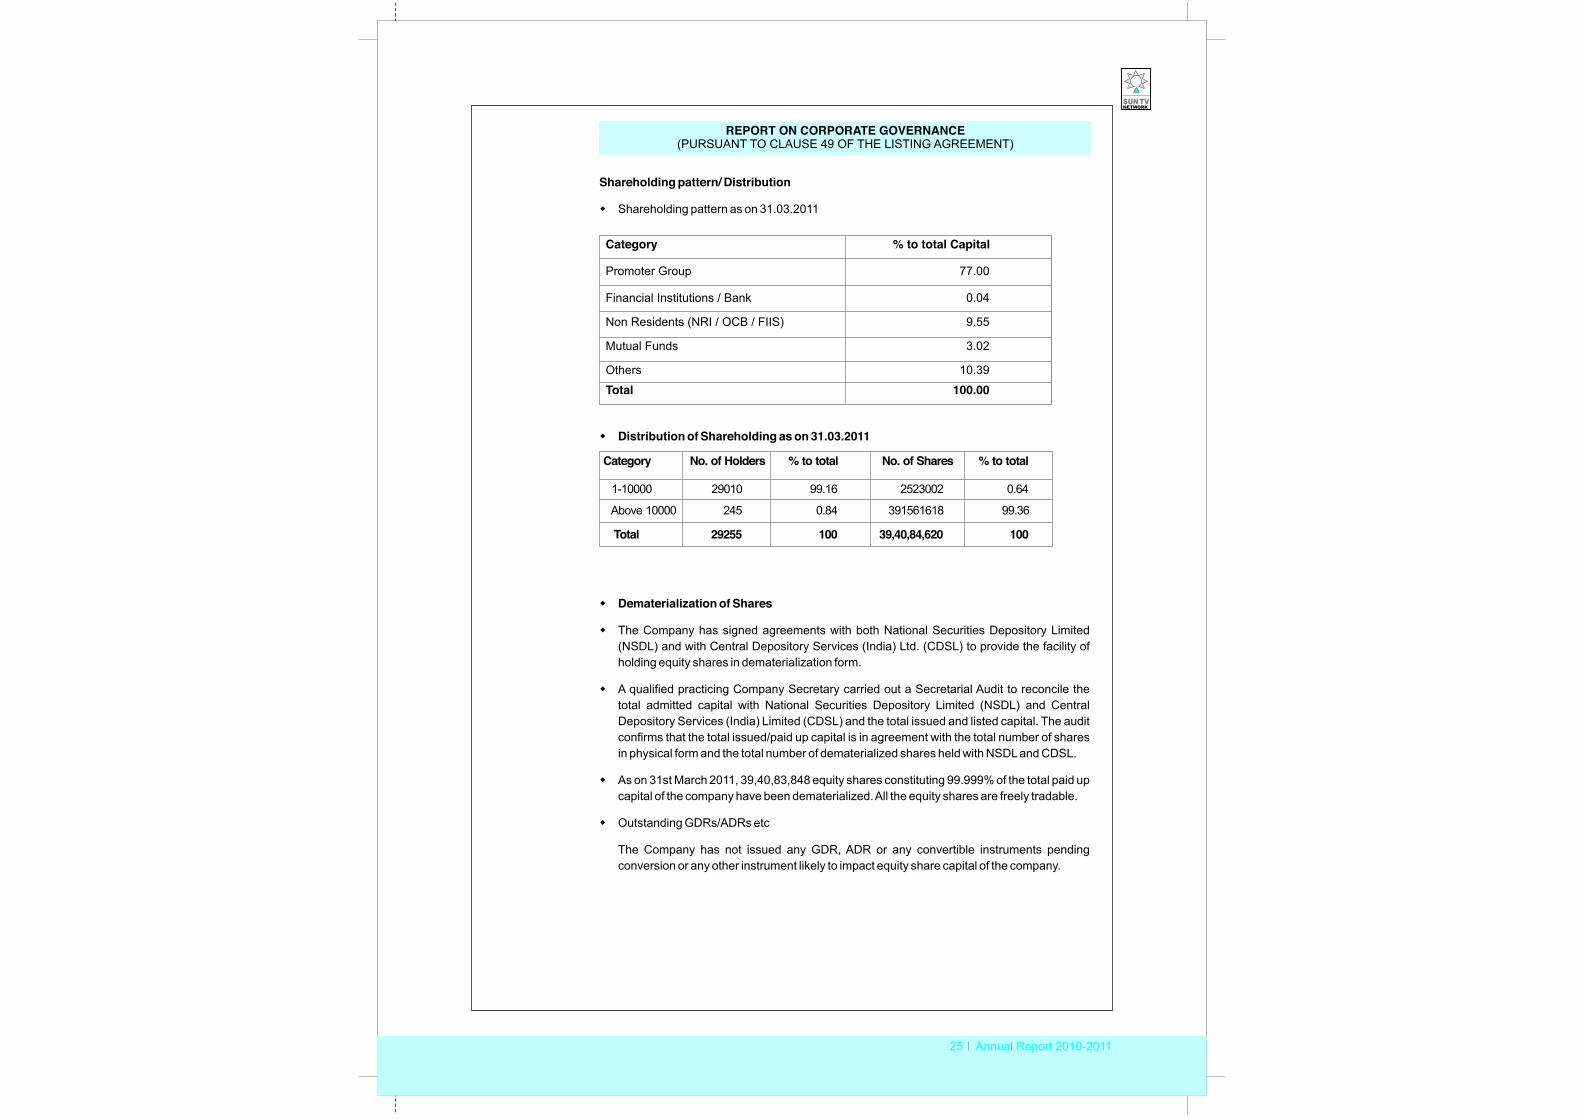
Shareholding pattern/ Distribution�Shareholding pattern as on 31.03.2011
�Distribution of Shareholding as on 31.03.2011
�Dematerialization of Shares�The Company has signed agreements with both National Securities Depository Limited (NSDL) and with Central Depository Services (India) Ltd. (CDSL) to provide the facility of holding equity shares in dematerialization form.�A qualified practicing Company Secretary carried out a Secretarial Audit to reconcile the total admitted capital with National Securities Depository Limited (NSDL) and Central Depository Services (India) Limited (CDSL) and the total issued and listed capital. The audit confirms that the total issued/paid up capital is in agreement with the total number of shares in physical form and the total number of dematerialized shares held with NSDL and CDSL.�As on 31st March 2011, 39,40,83,848 equity shares constituting 99.999% of the total paid up capital of the company have been dematerialized. All the equity shares are freely tradable.�Outstanding GDRs/ADRs etc
The Company has not issued any GDR, ADR or any convertible instruments pending conversion or any other instrument likely to impact equity share capital of the company.
Category % to total Capital
Promoter Group 77.00
Financial Institutions / Bank 0.04
Non Residents (NRI / OCB / FIIS) 9.55
Mutual Funds 3.02
Others 10.39
Total 100.00
Category No. of Holders % to total No. of Shares % to total
1-10000 29010 99.16 2523002 0.64
Above 10000 245 0.84 391561618 99.36
Total 29255 100 39,40,84,620 100
Sun TV Network Limited
26 Annual Report 2010-2011
REPORT ON CORPORATE GOVERNANCE(PURSUANT TO CLAUSE 49 OF THE LISTING AGREEMENT)�Address for correspondence�Compliance Officer
Mr. R. Ravi,Company Secretary,Sun TV Network Limited,Murasoli Maran Towers, 73, MRC Nagar Main Road,MRC Nagar,Chennai – 600 028.
Tel: 4467 6767 Fax: 4067 6161 Email: [email protected] www.suntv.in�Registrars and Share Transfer Agents
M/s Karvy Computer Share Private LimitedPlot Nos. 17 to 24,Vittal Rao Nagar, Madhapur,Hyderabad 500 081.Tel: (040) 44655000 Fax: (040) 23420814Email: [email protected]
www.karvycomputershare.com
On behalf of the Board
Place : Chennai Kalanithi MaranDate : May 26, 2011 Chairman & Managing Director
Confirmation on Code of Conduct
To
The Members of Sun TV Network Limited,
This is to inform that the Board has laid down a code of conduct for all Board members and senior management of the Company. It is further confirmed that all Directors and Senior Management Personnel of the Company have affirmed compliance with the Code of Conduct of the Company as at 31st March 2011, as envisaged in Clause 49 of the Listing Agreement with Stock Exchanges.
On behalf of the Board
Place : Chennai Kalanithi MaranDate : May 26, 2011 Chairman & Managing Director
27 Annual Report 2010-2011
REPORT ON CORPORATE GOVERNANCE(PURSUANT TO CLAUSE 49 OF THE LISTING AGREEMENT)
AUDITORS’ CERTIFICATE
To
The Members of Sun TV Network Limited
We have examined the compliance of conditions of Corporate Governance by Sun TV Network Limited, for the year ended on March 31, 2011, as stipulated in clause 49 of the Listing Agreement of the said Company with stock exchanges.
The compliance of conditions of corporate governance is the responsibility of the management. Our examination was limited to procedures and implementation thereof, adopted by the company for ensuring the compliance of the conditions of the Corporate Governance. It is neither an audit nor an expression of opinion on the financial statements of the Company.
In our opinion and to the best of our information and according to the explanations given to us, we certify that the Company has complied with the conditions of Corporate Governance as stipulated in the above mentioned Listing Agreement.
We further state that such compliance is neither an assurance as to the future viability of the Company nor the efficiency or effectiveness with which the management has conducted the affairs of the Company.
S.R. BATLIBOI & ASSOCIATESFirm registration number: 101049WChartered Accountants
per S BalasubrahmanyamPartner Membership No.:053315 ChennaiMay 26, 2011
Sun TV Network Limited
28 Annual Report 2010-2011
To The Members of Sun TV Network Limited
1. We have audited the attached Balance Sheet of Sun TV Network Limited (‘the Company’) as at March 31, 2011 and also the Profit and Loss Account and the Cash Flow Statement for the year ended on that date annexed thereto. These financial statements are the responsibility of the Company’s management. Our responsibility is to express an opinion on these financial statements based on our audit.
2. We conducted our audit in accordance with auditing standards generally accepted in India. Those Standards require that we plan and perform the audit to obtain reasonable assurance about whether the financial statements are free of material misstatement. An audit includes examining, on a test basis, evidence supporting the amounts and disclosures in the financial statements. An audit also includes assessing the accounting principles used and significant estimates made by Management, as well as evaluating the overall financial statement presentation. We believe that our audit provides a reasonable basis for our opinion.
3. As required by the Companies (Auditor’s Report) Order, 2003 (as amended) issued by the Central Government of India in terms of sub-section (4A) of Section 227 of the Companies Act, 1956, we enclose in the Annexure a statement on the matters specified in paragraphs 4 and 5 of the said Order.
4. Further to our comments in the Annexure referred to above, we report that:
i. We have obtained all the information and explanations, which to the best of our knowledge and belief were necessary for the purposes of our audit;
ii. In our opinion, proper books of account as required by law have been kept by the Company so far as appears from our examination of those books;
iii. The Balance Sheet, Profit and Loss Account and Cash Flow Statement dealt with by this report are in agreement with the books of account;
iv. In our opinion, the Balance Sheet, Profit and Loss Account and Cash Flow Statement dealt with by this report comply with the accounting standards referred to in sub-section (3C) of section 211 of the Companies Act, 1956;
v. On the basis of the written representations received from the directors, as on March 31, 2011, and taken on record by the Board of Directors, we report that none of the directors is disqualified as on March 31, 2011 from being appointed as a director in terms of clause (g) of sub-section (1) of section 274 of the Companies Act, 1956; and
AUDITORS’ REPORT
29 Annual Report 2010-2011
vi. In our opinion and to the best of our information and according to the explanations given to us, the said accounts give the information required by the Companies Act, 1956, in the manner so required and give a true and fair view in conformity with the accounting principles generally accepted in India;
a) in the case of the Balance Sheet, of the state of affairs of the Company as at March 31, 2011;
b) in the case of the Profit and Loss Account, of the profit for the year ended on that date; and
c) in the case of Cash Flow Statement, of the cash flows for the year ended on that date.
For S.R. BATLIBOI & ASSOCIATESFirm registration number: 101049WChartered Accountants
per S BalasubrahmanyamPartner Membership No.:053315
Chennai
May 26, 2011
AUDITORS’ REPORT (Continued)
Sun TV Network Limited
30 Annual Report 2010-2011
Annexure referred to in paragraph 3 of our report of even dateRe: Sun TV Network Limited
(i) (a) The Company has maintained proper records showing full particulars, including quantitative details and situation of fixed assets.
(b) All fixed assets have not been physically verified by the management during the year, but there is a regular programme of verification which, in our opinion, is reasonable having regard to the size of the Company and the nature of its assets. No material discrepancies were noticed on such verification.
(c) There was no disposal of substantial part of fixed assets during the year.
(ii) (a) The Management has conducted physical verification of inventory at reasonable intervals during the year.
(b) The procedures of physical verification of inventory followed by management are reasonable and adequate in relation to the size of the Company and the nature of its business.
(c) The Company is maintaining proper records of inventory and no material discrepancies were noticed on physical verification.
(iii)(a) The Company has granted unsecured loans to two Companies covered in the register maintained under section 301 of the Companies Act, 1956. The maximum amount involved during the year was Rs. 30.9 million and the year-end balance of loans granted to such Companies was Rs. 28.8 million.
(b) In our opinion and according to the information and explanations given to us, the rate of interest and other terms and conditions for such loan are not prima facie prejudicial to the interest of the Company.
(c) The loans granted are re-payable on demand. We are informed that the Company has not demanded repayment of any such loan during the year, and thus, there has been no default on the part of the parties to whom the money has been lent. The payment of interest has been regular.
(d) There is no overdue amount of loans granted to companies, firms or other parties listed in the register maintained under section 301 of the Companies Act, 1956.
(e) According to the information and explanations given to us, the Company has not taken any loans, secured or unsecured from companies, firms or other parties covered in the register maintained under section 301 of the Companies Act, 1956. Accordingly, the provisions of clause 4 (iii) (e) to (g) of Order are not applicable to the Company and hence not commented upon.
31 Annual Report 2010-2011
(iv) In our opinion and according to the information and explanations given to us, there is an adequate internal control system commensurate with the size of the Company and the nature of its business, for the purchase of inventory and fixed assets and for the sale of services. The activities of the Company did not involve sale of goods. During the course of our audit, we have not observed any major weakness or continuing failure to correct any major weakness in the internal control system of the company in respect of these areas.
(v) (a) According to the information and explanations provided by the management, we are of the opinion that the particulars of contracts or arrangements referred to in section 301 of the Companies Act, 1956 that need to be entered into the register maintained under section 301 have been so entered.
(b) In our opinion and according to information and explanations given to us, the transactions made in pursuance of such contracts or arrangements and exceeding Rupees five lakhs have been entered into during the financial year at prices which are reasonable having regard to the prevailing market prices at the relevant time.
(vi) The Company has not accepted any deposits from the public.
(vii) In our opinion, the Company has an internal audit system commensurate with the size and nature of its business.
(viii) To the best of our knowledge and as explained, the Central Government has not prescribed maintenance of cost records under clause (d) of sub-section (1) of section 209 of the Companies Act, 1956 for the products of the Company.
(ix) (a) The Company is regular in depositing with appropriate authorities undisputed statutory dues including provident fund, investor education and protection fund, employees’ state insurance, income-tax, wealth-tax, service tax, customs duty, excise duty, cess and other material statutory dues applicable to it. The provisions relating to sales tax are not applicable to the Company.
Further, since the Central Government has till date not prescribed the amount of cess payable under section 441 A of the Companies Act, 1956, we are not in a position to comment upon the regularity or otherwise of the Company in depositing the same.
(b) According to the information and explanations given to us, no undisputed amounts payable in respect of provident fund, investor education and protection fund, employees’ state insurance, income-tax, wealth-tax, service tax, customs duty, excise duty, cess and other material statutory dues were outstanding, at the year end, for a period of more than six months from the date they became payable. The provisions relating to sales tax are not applicable to the Company.
Annexure to Auditors Report (Continued)
Sun TV Network Limited
32 Annual Report 2010-2011
(x) The Company has no accumulated losses at the end of the financial year and it has not incurred cash losses in the current and immediately preceding financial year.
(xi) Based on our audit procedures and as per the information and explanations given by the management, we are of the opinion that the Company has not defaulted in repayment of dues to a financial institution or bank. The Company did not have any outstanding debentures during the year.
(xii) According to the information and explanations given to us and based on the documents and records produced before us, the Company has not granted loans and advances on the basis of security by way of pledge of shares, debentures and other securities.
(xiii) In our opinion, the Company is not a chit fund or a nidhi / mutual benefit fund / society. Therefore, the provisions of clause 4(xiii) of the Companies (Auditor’s Report) Order, 2003 (as amended) are not applicable to the Company.
Annexure to Auditors Report (Continued)
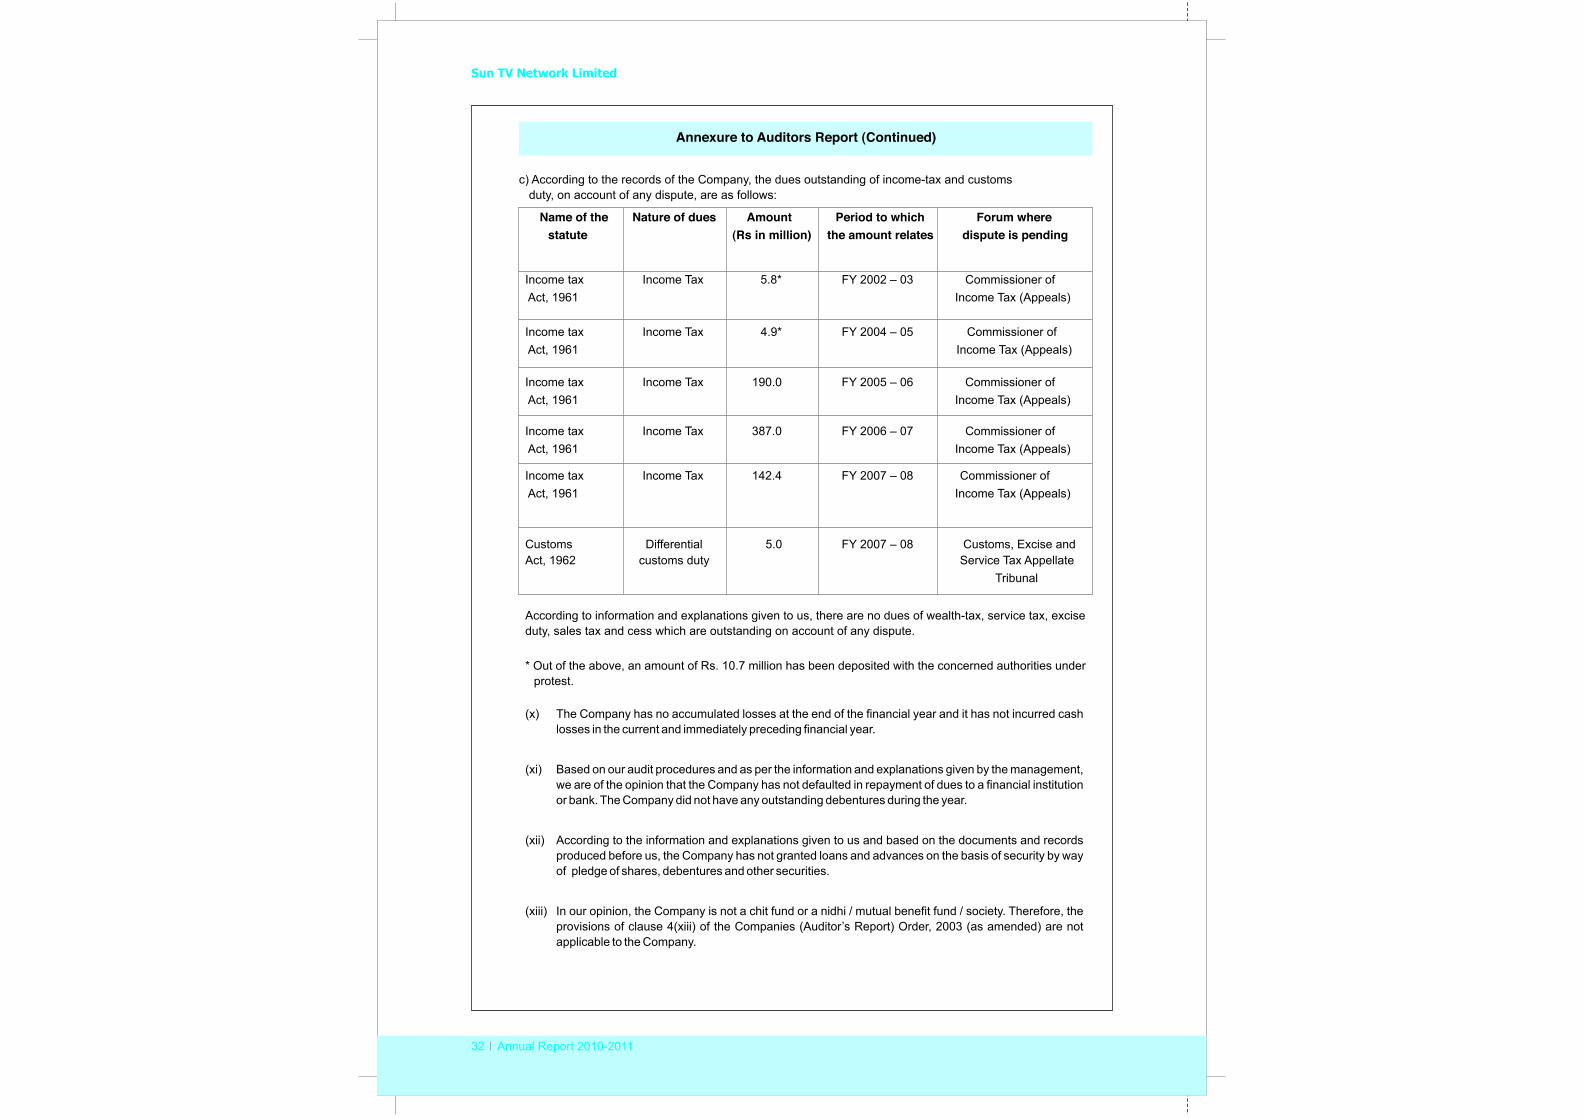
c) According to the records of the Company, the dues outstanding of income-tax and customs duty, on account of any dispute, are as follows:
Name of the Nature of dues Amount Period to which Forum wherestatute (Rs in million) the amount relates dispute is pending
Income tax Income Tax 5.8* FY 2002 – 03 Commissioner of Act, 1961 Income Tax (Appeals)
Income tax Income Tax 4.9* FY 2004 – 05 Commissioner of Act, 1961 Income Tax (Appeals)
Income tax Income Tax 190.0 FY 2005 – 06 Commissioner of Act, 1961 Income Tax (Appeals)
Income tax Income Tax 387.0 FY 2006 – 07 Commissioner of Act, 1961 Income Tax (Appeals)
Income tax Income Tax 142.4 FY 2007 – 08 Commissioner of Act, 1961 Income Tax (Appeals)
Customs Differential 5.0 FY 2007 – 08 Customs, Excise and Act, 1962 customs duty Service Tax Appellate
Tribunal
According to information and explanations given to us, there are no dues of wealth-tax, service tax, excise duty, sales tax and cess which are outstanding on account of any dispute.
* Out of the above, an amount of Rs. 10.7 million has been deposited with the concerned authorities under protest.
33 Annual Report 2010-2011
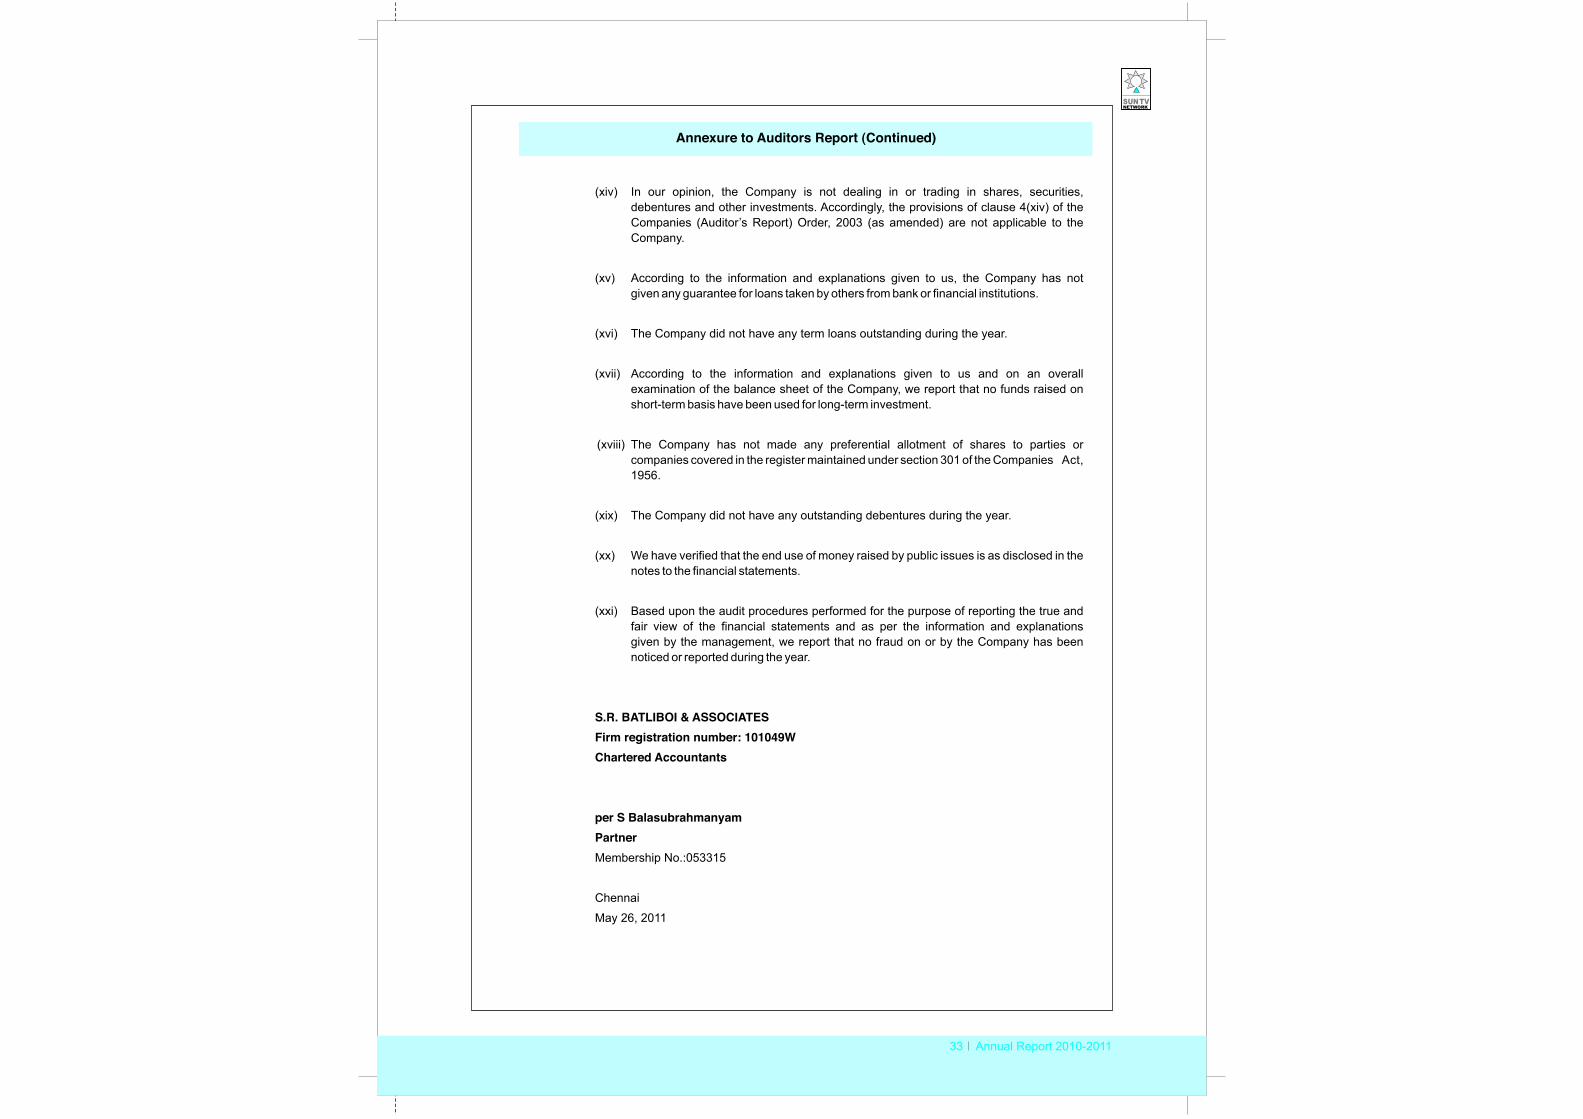
(xiv) In our opinion, the Company is not dealing in or trading in shares, securities, debentures and other investments. Accordingly, the provisions of clause 4(xiv) of the Companies (Auditor’s Report) Order, 2003 (as amended) are not applicable to the Company.
(xv) According to the information and explanations given to us, the Company has not given any guarantee for loans taken by others from bank or financial institutions.
(xvi) The Company did not have any term loans outstanding during the year.
(xvii) According to the information and explanations given to us and on an overall examination of the balance sheet of the Company, we report that no funds raised on short-term basis have been used for long-term investment.
(xviii) The Company has not made any preferential allotment of shares to parties or companies covered in the register maintained under section 301 of the Companies Act, 1956.
(xix) The Company did not have any outstanding debentures during the year.
(xx) We have verified that the end use of money raised by public issues is as disclosed in the notes to the financial statements.
(xxi) Based upon the audit procedures performed for the purpose of reporting the true and fair view of the financial statements and as per the information and explanations given by the management, we report that no fraud on or by the Company has been noticed or reported during the year.
S.R. BATLIBOI & ASSOCIATESFirm registration number: 101049WChartered Accountants
per S BalasubrahmanyamPartner Membership No.:053315
Chennai
May 26, 2011
Annexure to Auditors Report (Continued)
Sun TV Network Limited
34 Annual Report 2010-2011
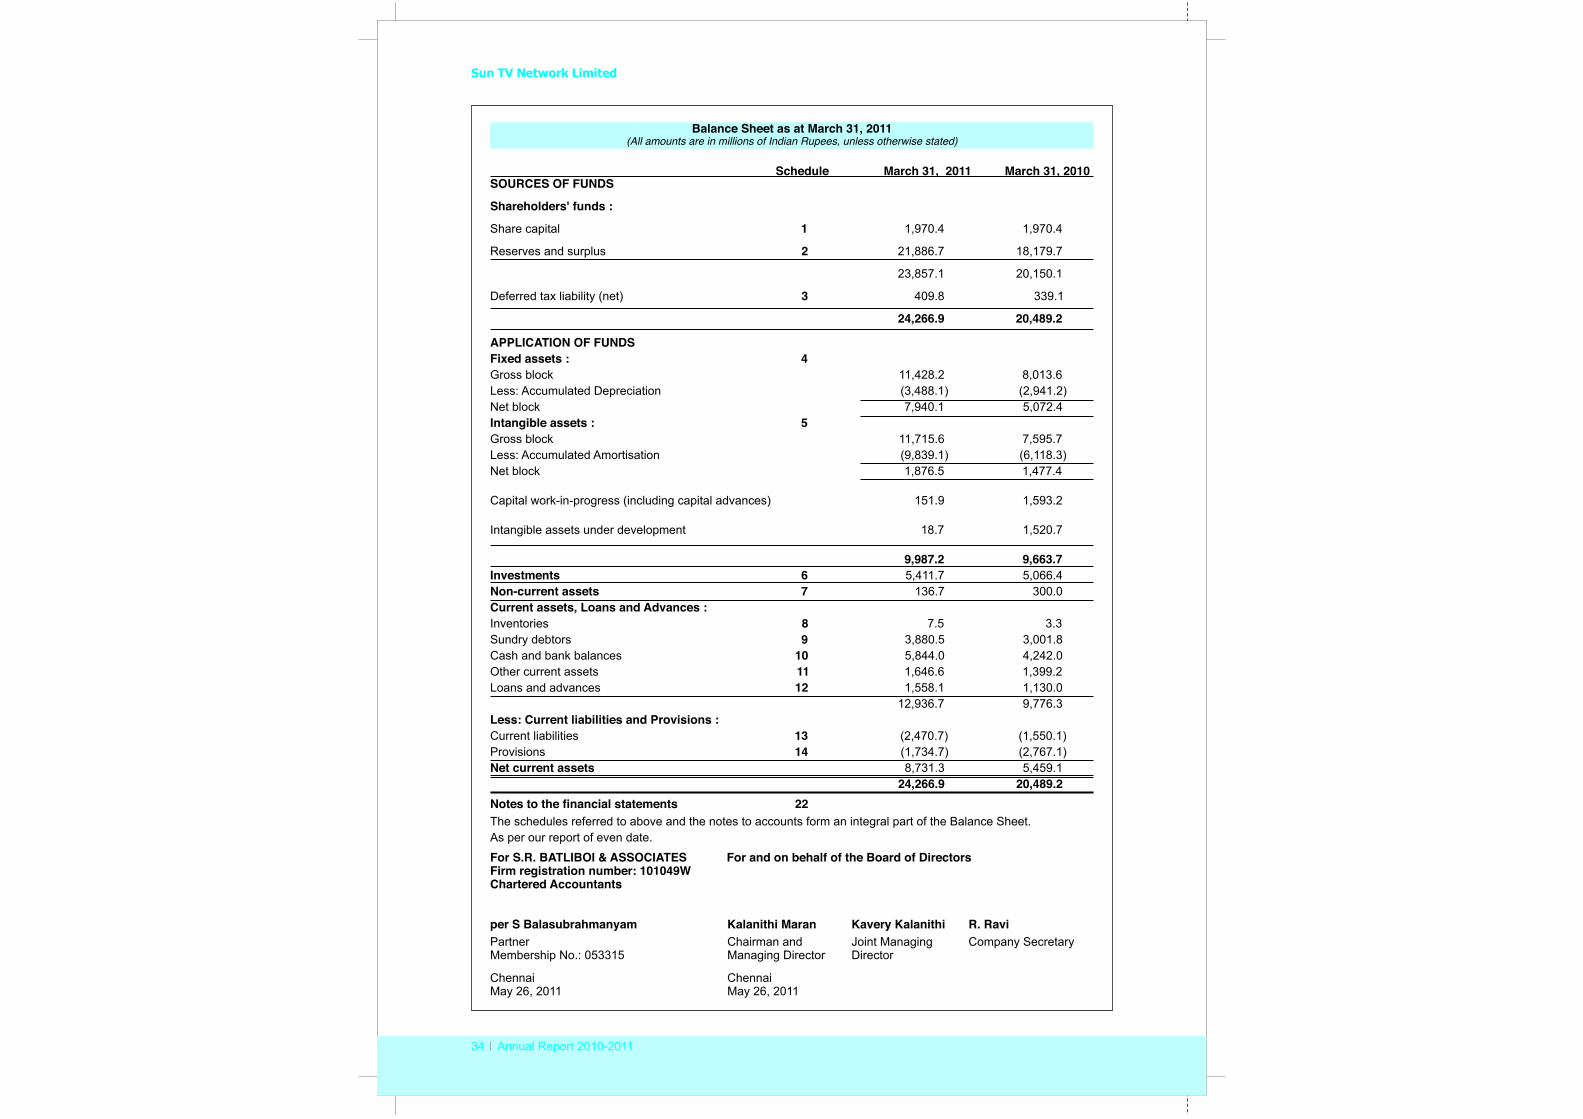
SOURCES OF FUNDS
Shareholders' funds :
Share capital
Reserves and surplus 2 21,886.7 18,179.7
23,857.1 20,150.1
Deferred tax liability (net) 3 409.8 339.1
24,266.9 20,489.2
APPLICATION OF FUNDSFixed assets : 4Gross block 11,428.2 8,013.6 Less: Accumulated Depreciation (3,488.1) (2,941.2)Net block 7,940.1 5,072.4 Intangible assets : 5Gross block 11,715.6 7,595.7 Less: Accumulated Amortisation (9,839.1) (6,118.3)Net block 1,876.5 1,477.4
Capital work-in-progress (including capital advances) 151.9 1,593.2
Intangible assets under development 18.7 1,520.7
9,987.2 9,663.7 Investments 6 5,411.7 5,066.4 Non-current assets 7 136.7 300.0Current assets, Loans and Advances :Inventories 8 7.5 3.3Sundry debtors 9 3,880.5 3,001.8Cash and bank balances 10 5,844.0 4,242.0Other current assets 11 1,646.6 1,399.2Loans and advances 12 1,558.1 1,130.0
12,936.7 9,776.3Less: Current liabilities and Provisions :Current liabilities 13 (2,470.7) (1,550.1)Provisions 14 (1,734.7) (2,767.1)Net current assets 8,731.3 5,459.1
24,266.9 20,489.2 Notes to the financial statements 22 The schedules referred to above and the notes to accounts form an integral part of the Balance Sheet.As per our report of even date.
For S.R. BATLIBOI & ASSOCIATES For and on behalf of the Board of DirectorsFirm registration number: 101049WChartered Accountants
per S Balasubrahmanyam Kalanithi Maran Kavery Kalanithi R. RaviPartner Chairman and Joint Managing Company SecretaryMembership No.: 053315 Managing Director Director
Chennai ChennaiMay 26, 2011 May 26, 2011
1 1,970.4 1,970.4
Balance Sheet as at March 31, 2011(All amounts are in millions of Indian Rupees, unless otherwise stated)
Schedule March 31, 2010March 31, 2011
35 Annual Report 2010-2011
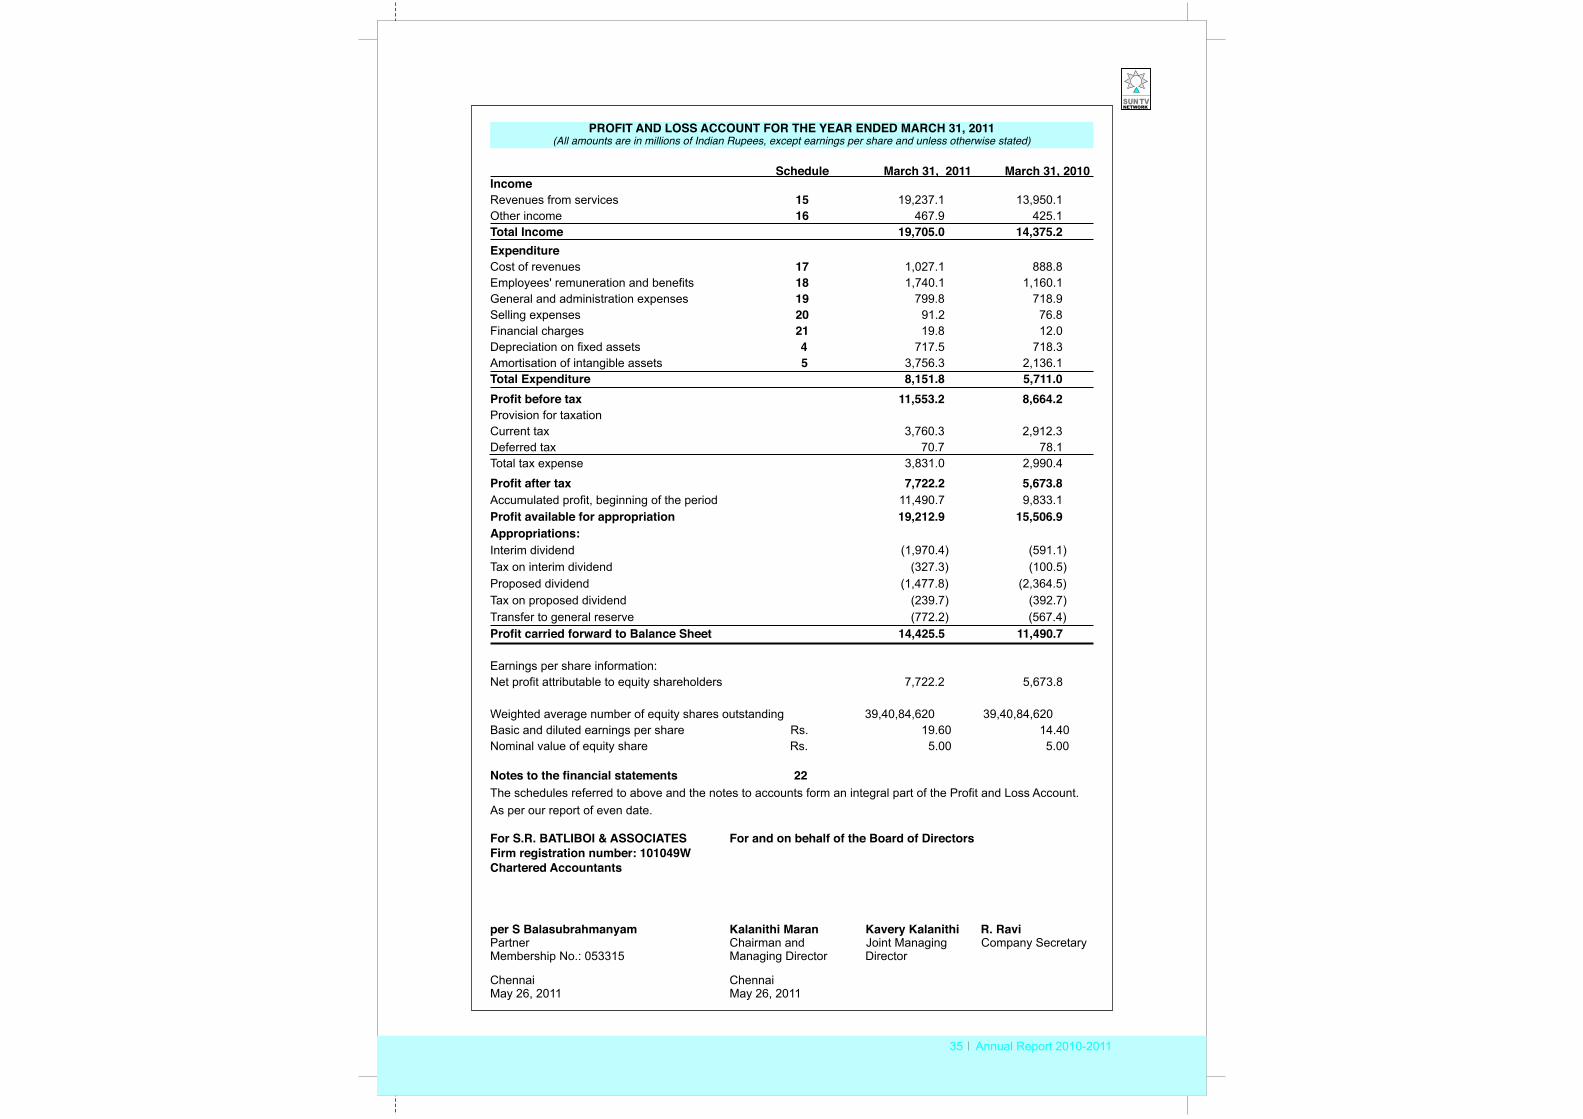
IncomeRevenues from services 15 19,237.1 13,950.1Other income 16 467.9 425.1Total Income 19,705.0 14,375.2 ExpenditureCost of revenues 17 1,027.1 888.8 Employees' remuneration and benefits 18 1,740.1 1,160.1 General and administration expenses 19 799.8 718.9 Selling expenses 20 91.2 76.8 Financial charges 21 19.8 12.0 Depreciation on fixed assets 4 717.5 718.3 Amortisation of intangible assets 5 3,756.3 2,136.1 Total Expenditure 8,151.8 5,711.0 Profit before tax 11,553.2 8,664.2 Provision for taxation Current tax 3,760.3 2,912.3 Deferred tax 70.7 78.1Total tax expense 3,831.0 2,990.4
Profit after tax 7,722.2 5,673.8 Accumulated profit, beginning of the period 11,490.7 9,833.1 Profit available for appropriation 19,212.9 15,506.9 Appropriations:Interim dividend (1,970.4) (591.1)Tax on interim dividend (327.3) (100.5)Proposed dividend (1,477.8) (2,364.5)Tax on proposed dividend (239.7) (392.7)Transfer to general reserve (772.2) (567.4)Profit carried forward to Balance Sheet 14,425.5 11,490.7
Earnings per share information:Net profit attributable to equity shareholders 7,722.2 5,673.8
Weighted average number of equity shares outstanding 39,40,84,620 39,40,84,620 Basic and diluted earnings per share Rs. 19.60 14.40 Nominal value of equity share Rs. 5.00 5.00
Notes to the financial statements 22 The schedules referred to above and the notes to accounts form an integral part of the Profit and Loss Account.As per our report of even date.
For S.R. BATLIBOI & ASSOCIATES For and on behalf of the Board of DirectorsFirm registration number: 101049WChartered Accountants
per S Balasubrahmanyam Kalanithi Maran Kavery Kalanithi R. RaviPartner Chairman and Joint Managing Company SecretaryMembership No.: 053315 Managing Director Director
Chennai ChennaiMay 26, 2011 May 26, 2011
PROFIT AND LOSS ACCOUNT FOR THE YEAR ENDED MARCH 31, 2011(All amounts are in millions of Indian Rupees, except earnings per share and unless otherwise stated)
Schedule March 31, 2010March 31, 2011

Sun TV Network Limited
36 Annual Report 2010-2011
Cash flows from operating activities
Net profit before taxation 11,553.2 8,664.2
Adjustments for:
Depreciation on fixed assets 717.5 718.3
Amortisation of intangible assets 3,756.3 2,136.1
(Profit) / loss on sale of fixed assets 27.5 (3.5)
Translation loss / (gain) on monetary assets and liabilities (6.0) 6.2
Provision for doubtful debts 8.8 37.3
Provision for doubtful advances and assets 49.2 52.0
Bad debts written off 113.6 155.3
Interest income (300.5) (392.4)
Dividend income (74.7) (17.2)
Interest expense 15.0 6.7
Operating profit before working capital changes 15,859.9 11,363.0
(Increase)/Decrease in sundry debtors (997.1) (853.5)
(Increase)/Decrease in inventories (4.2) (2.0)
(Increase)/Decrease in other current assets (298.1) 24.4
(Increase)/Decrease in loans and advances (269.9) (86.7)
Increase/(Decrease) in current liabilities and provisions (Refer note c below) 747.8 154.9
Cash generated from operations 15,038.4 10,600.1
Direct taxes paid (net of refunds) (3,624.7) (2,810.6)
Net cash from / (used in) operating activities 11,413.7 7,789.5
Cash flows (used in) / from investing activitiesPurchase of fixed assets, capital work in progress (including capital advances) (1991.1) (2,309.8)Purchase of intangible assets and expenditure on intangible assets under development (2,805.5) (3,487.4)Purchase of investments (345.3) (525.8)Proceeds from sale of assets (Net of expenses on sale) 1.7 5.2 Intercorporate deposits placed - (48.2)Refund of Intercorporate deposits 3.8 - Loans and advances to Subsidiaries - (27.1)Term deposits placed with banks during the year (4,504.0) (4,152.8)Term deposits refunded from banks during the year 3,419.0 3,533.0 Interest received 323.9 343.7 Dividends received 74.7 17.2 Net cash from / (used in) investing activities (5,822.8) (6,652.0)
March 31, 2010March 31, 2011
CASH FLOW STATEMENTS FOR THE YEAR ENDED MARCH 31, 2011(All amounts are in millions of Indian Rupees, unless otherwise stated)
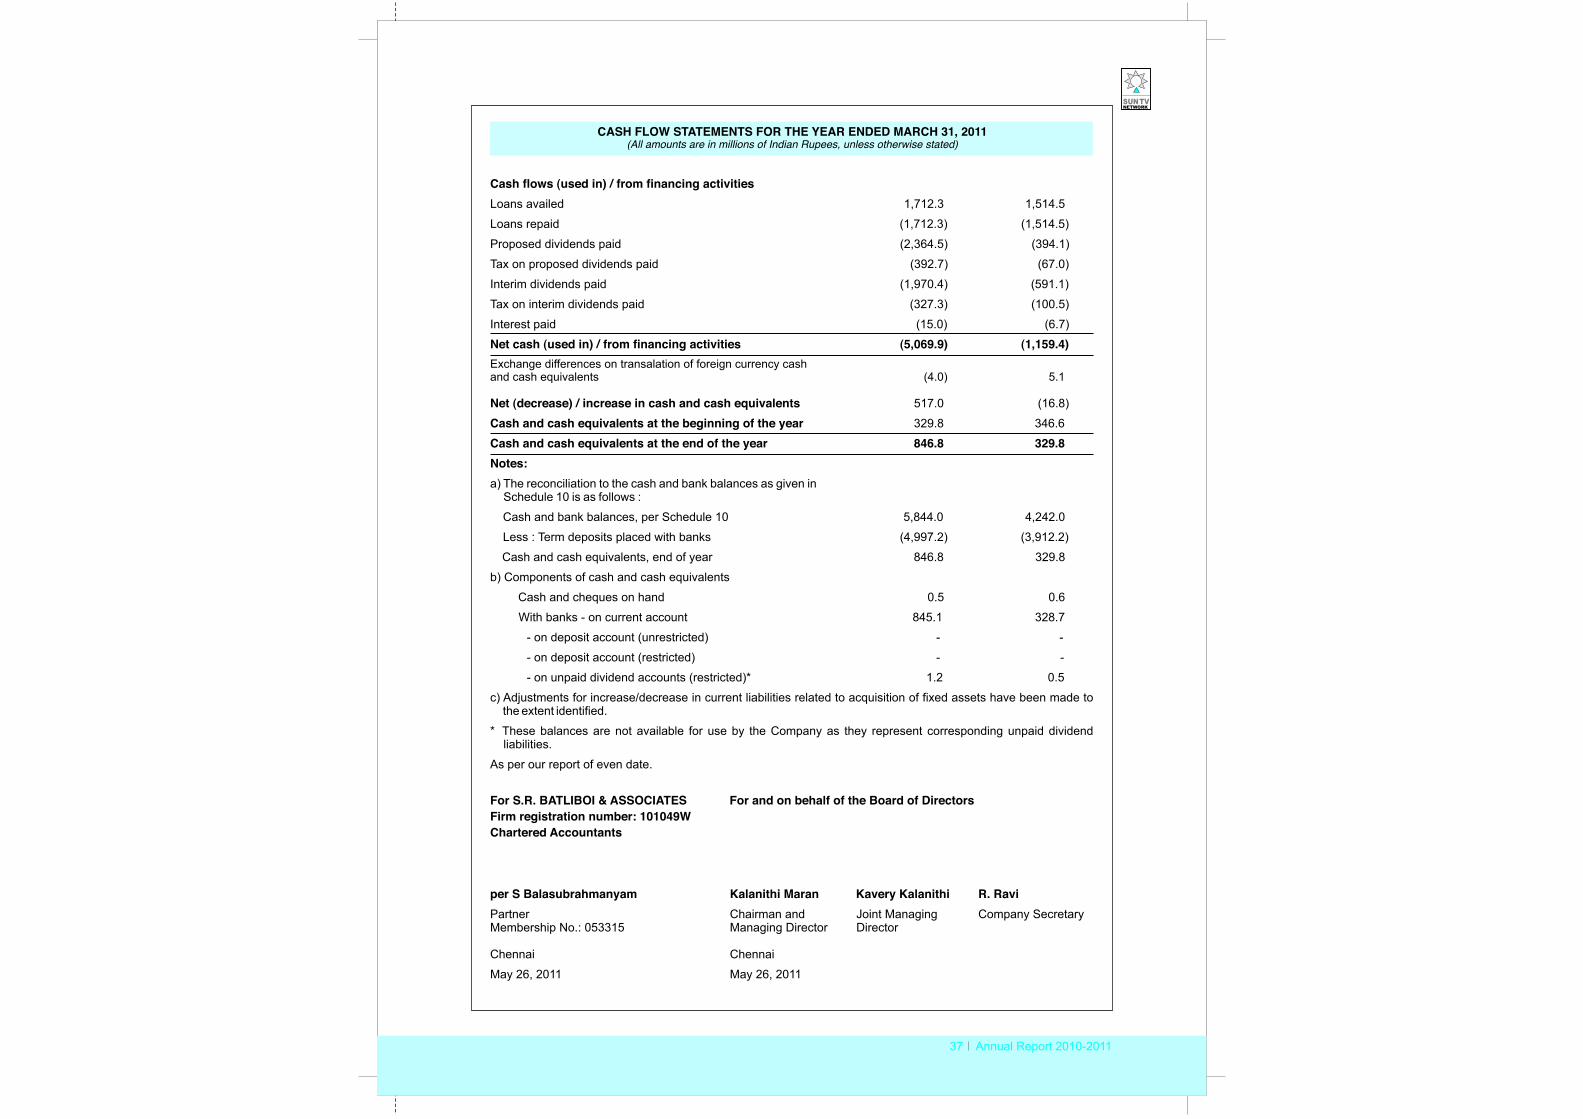
37 Annual Report 2010-2011
Cash flows (used in) / from financing activitiesLoans availed 1,712.3 1,514.5
Loans repaid (1,712.3) (1,514.5)
Proposed dividends paid (2,364.5) (394.1)
Tax on proposed dividends paid (392.7) (67.0)
Interim dividends paid (1,970.4) (591.1)
Tax on interim dividends paid (327.3) (100.5)
Interest paid (15.0) (6.7)
Net cash (used in) / from financing activities (5,069.9) (1,159.4)Exchange differences on transalation of foreign currency cash and cash equivalents (4.0) 5.1
Net (decrease) / increase in cash and cash equivalents 517.0 (16.8)
Cash and cash equivalents at the beginning of the year 329.8 346.6
Cash and cash equivalents at the end of the year 846.8 329.8 Notes:a) The reconciliation to the cash and bank balances as given in
Schedule 10 is as follows :
Cash and bank balances, per Schedule 10 5,844.0 4,242.0
Less : Term deposits placed with banks (4,997.2) (3,912.2)
Cash and cash equivalents, end of year 846.8 329.8
b) Components of cash and cash equivalents
Cash and cheques on hand 0.5 0.6
With banks - on current account 845.1 328.7
- on deposit account (unrestricted) - -
- on deposit account (restricted) - -
- on unpaid dividend accounts (restricted)* 1.2 0.5
c) Adjustments for increase/decrease in current liabilities related to acquisition of fixed assets have been made to the extent identified.
* These balances are not available for use by the Company as they represent corresponding unpaid dividend liabilities.
As per our report of even date.
For S.R. BATLIBOI & ASSOCIATES For and on behalf of the Board of DirectorsFirm registration number: 101049WChartered Accountants
per S Balasubrahmanyam Kalanithi Maran Kavery Kalanithi R. RaviPartner Chairman and Joint Managing Company SecretaryMembership No.: 053315 Managing Director Director
Chennai Chennai
May 26, 2011 May 26, 2011
CASH FLOW STATEMENTS FOR THE YEAR ENDED MARCH 31, 2011(All amounts are in millions of Indian Rupees, unless otherwise stated)
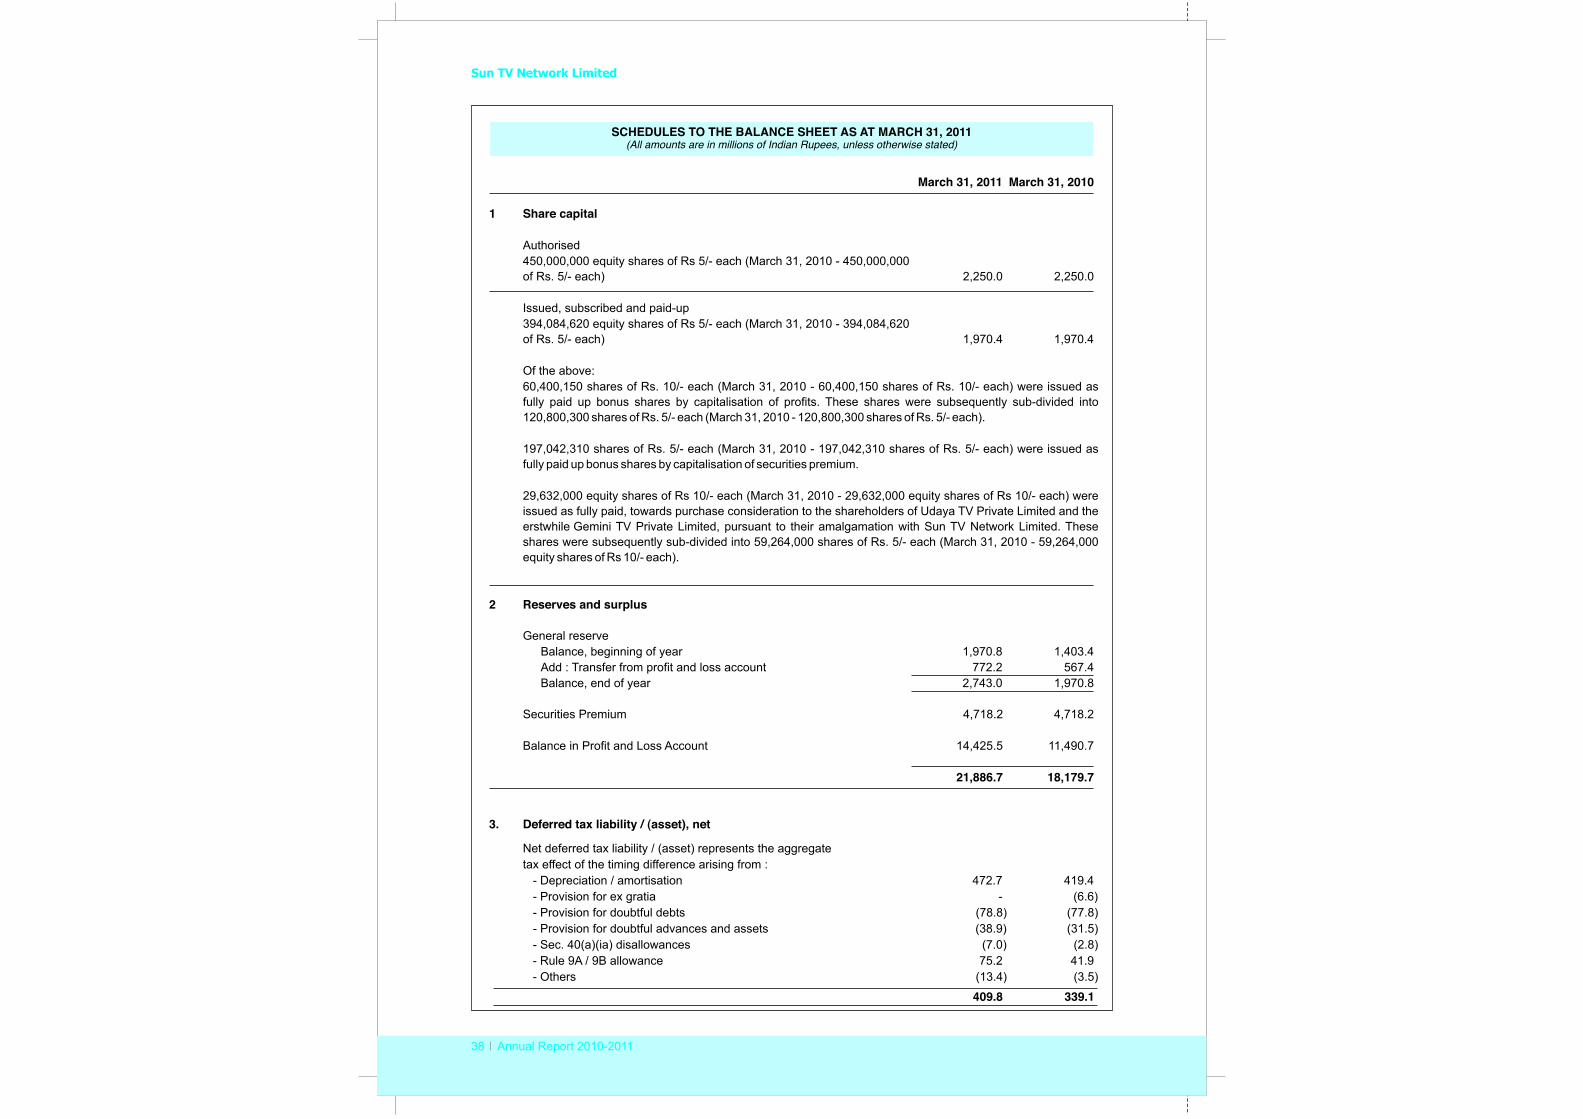
Sun TV Network Limited
38 Annual Report 2010-2011
March 31, 2011 March 31, 2010
1 Share capital
Authorised 450,000,000 equity shares of Rs 5/- each (March 31, 2010 - 450,000,000 of Rs. 5/- each) 2,250.0 2,250.0
Issued, subscribed and paid-up394,084,620 equity shares of Rs 5/- each (March 31, 2010 - 394,084,620 of Rs. 5/- each) 1,970.4 1,970.4
Of the above: 60,400,150 shares of Rs. 10/- each (March 31, 2010 - 60,400,150 shares of Rs. 10/- each) were issued as fully paid up bonus shares by capitalisation of profits. These shares were subsequently sub-divided into 120,800,300 shares of Rs. 5/- each (March 31, 2010 - 120,800,300 shares of Rs. 5/- each).
197,042,310 shares of Rs. 5/- each (March 31, 2010 - 197,042,310 shares of Rs. 5/- each) were issued as fully paid up bonus shares by capitalisation of securities premium.
29,632,000 equity shares of Rs 10/- each (March 31, 2010 - 29,632,000 equity shares of Rs 10/- each) were issued as fully paid, towards purchase consideration to the shareholders of Udaya TV Private Limited and the erstwhile Gemini TV Private Limited, pursuant to their amalgamation with Sun TV Network Limited. These shares were subsequently sub-divided into 59,264,000 shares of Rs. 5/- each (March 31, 2010 - 59,264,000 equity shares of Rs 10/- each).
2 Reserves and surplus
General reserveBalance, beginning of year 1,970.8 1,403.4 Add : Transfer from profit and loss account 772.2 567.4 Balance, end of year 2,743.0 1,970.8
Securities Premium 4,718.2 4,718.2
Balance in Profit and Loss Account 14,425.5 11,490.7
21,886.7 18,179.7
3. Deferred tax liability / (asset), net
Net deferred tax liability / (asset) represents the aggregate tax effect of the timing difference arising from : - Depreciation / amortisation 472.7 419.4 - Provision for ex gratia - (6.6) - Provision for doubtful debts (78.8) (77.8)
- Provision for doubtful advances and assets (38.9) (31.5) - Sec. 40(a)(ia) disallowances (7.0) (2.8)
- Rule 9A / 9B allowance 75.2 41.9 - Others (13.4) (3.5)
409.8 339.1
SCHEDULES TO THE BALANCE SHEET AS AT MARCH 31, 2011(All amounts are in millions of Indian Rupees, unless otherwise stated)
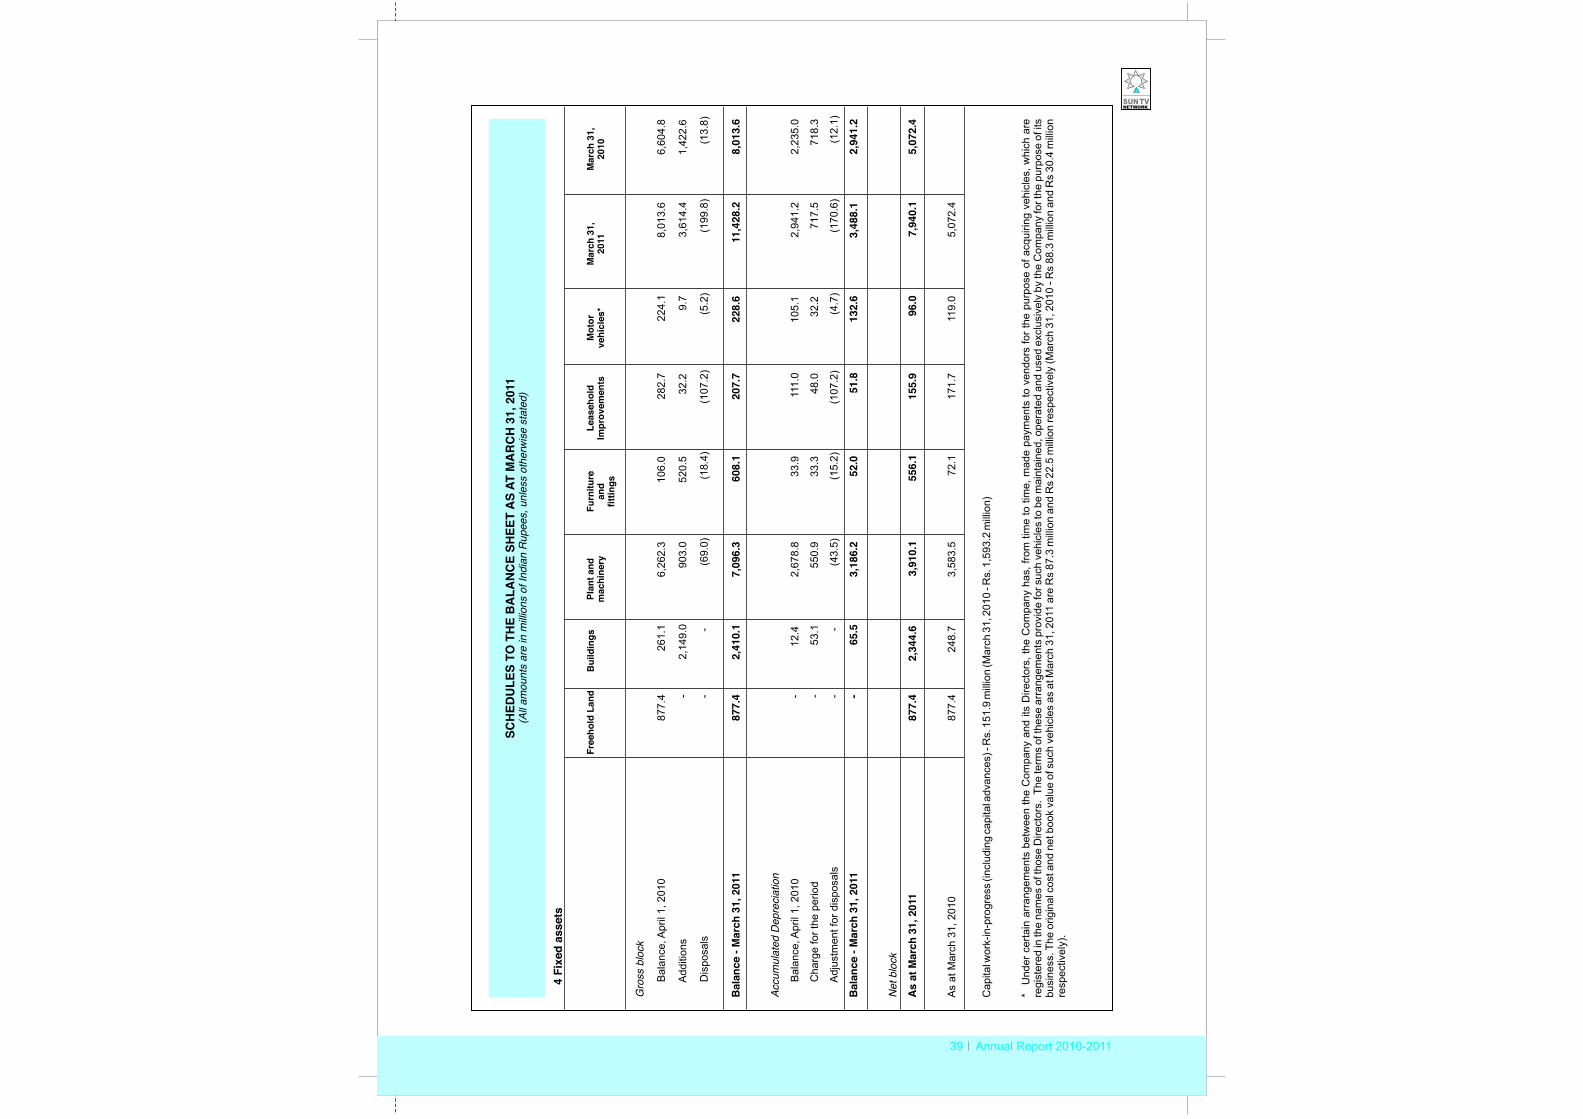
39 Annual Report 2010-2011
Gro
ss b
lock
Bal
ance
, Apr
il 1,
201
087
7.4
261.
16,
262.
310
6.0
282.
722
4.1
8,01
3.6
6,60
4.8
Add
ition
s -
2,14
9.0
903.
052
0.5
32.2
9.7
3,61
4.4
1,42
2.6
Dis
posa
ls
--
(69.
0)(1
8.4)
(107
.2)
(5.2
)(1
99.8
)(1
3.8)
Bal
ance
- M
arch
31,
201
187
7.4
2,41
0.1
7,09
6.3
608.
120
7.7
228.
611
,428
.28,
013.
6
Accu
mul
ated
Dep
reci
atio
n
Bal
ance
, Apr
il 1,
201
0-
12.4
2,67
8.8
33.9
111.
010
5.1
2,94
1.2
2,23
5.0
Cha
rge
for t
he p
erio
d -
53.1
550.
933
.348
.032
.271
7.5
718.
3
Adj
ustm
ent f
or d
ispo
sals
-
-(4
3.5)
(15.
2)(1
07.2
)(4
.7)
(170
.6)
(12.
1)
Bal
ance
- M
arch
31,
201
1-
65.5
3,18
6.2
52.0
51.8
132.
63,
488.
12,
941.
2
Net
blo
ck
As
at M
arch
31,
201
1
877.
42,
344.
63,
910.
155
6.1
155.
996
.07,
940.
15,
072.
4
As
at M
arch
31,
201
0
877.
424
8.7
3,58
3.5
72.1
171.
711
9.0
5,07
2.4
Cap
ital w
ork-
in-p
rogr
ess
(incl
udin
g ca
pita
l adv
ance
s) -
Rs.
151
.9 m
illio
n (M
arch
31,
201
0 - R
s. 1
,593
.2 m
illio
n)
*U
nder
cer
tain
arr
ange
men
ts b
etw
een
the
Com
pany
and
its
Dire
ctor
s, th
e C
ompa
ny h
as, f
rom
tim
e to
tim
e, m
ade
paym
ents
to v
endo
rs fo
r the
pur
pose
of a
cqui
ring
vehi
cles
, whi
ch a
re
regi
ster
ed in
the
nam
es o
f tho
se D
irect
ors.
The
term
s of
thes
e ar
rang
emen
ts p
rovi
de fo
r suc
h ve
hicl
es to
be
mai
ntai
ned,
ope
rate
d an
d us
ed e
xclu
sive
ly b
y th
e C
ompa
ny fo
r the
pur
pose
of i
ts
busi
ness
. The
orig
inal
cos
t and
net
boo
k va
lue
of s
uch
vehi
cles
as
at M
arch
31,
201
1 ar
e R
s 87
.3 m
illio
n an
d R
s 22
.5 m
illio
n re
spec
tivel
y (M
arch
31,
201
0 - R
s 88
.3 m
illio
n an
d R
s 30
.4 m
illio
n re
spec
tivel
y).
Free
hold
Lan
dB
uild
ings
Plan
t and
m
achi
nery
Furn
iture
and
fittin
gs
Leas
ehol
dIm
prov
emen
tsM
otor
vehi
cles
*M
arch
31,
2011
Mar
ch 3
1,20
10
4 Fi
xed
asse
ts
SCH
EDU
LES
TO T
HE
BA
LAN
CE
SHEE
T A
S AT
MA
RC
H 3
1, 2
011
(All
amou
nts
are
in m
illion
s of
Indi
an R
upee
s, u
nles
s ot
herw
ise
stat
ed)
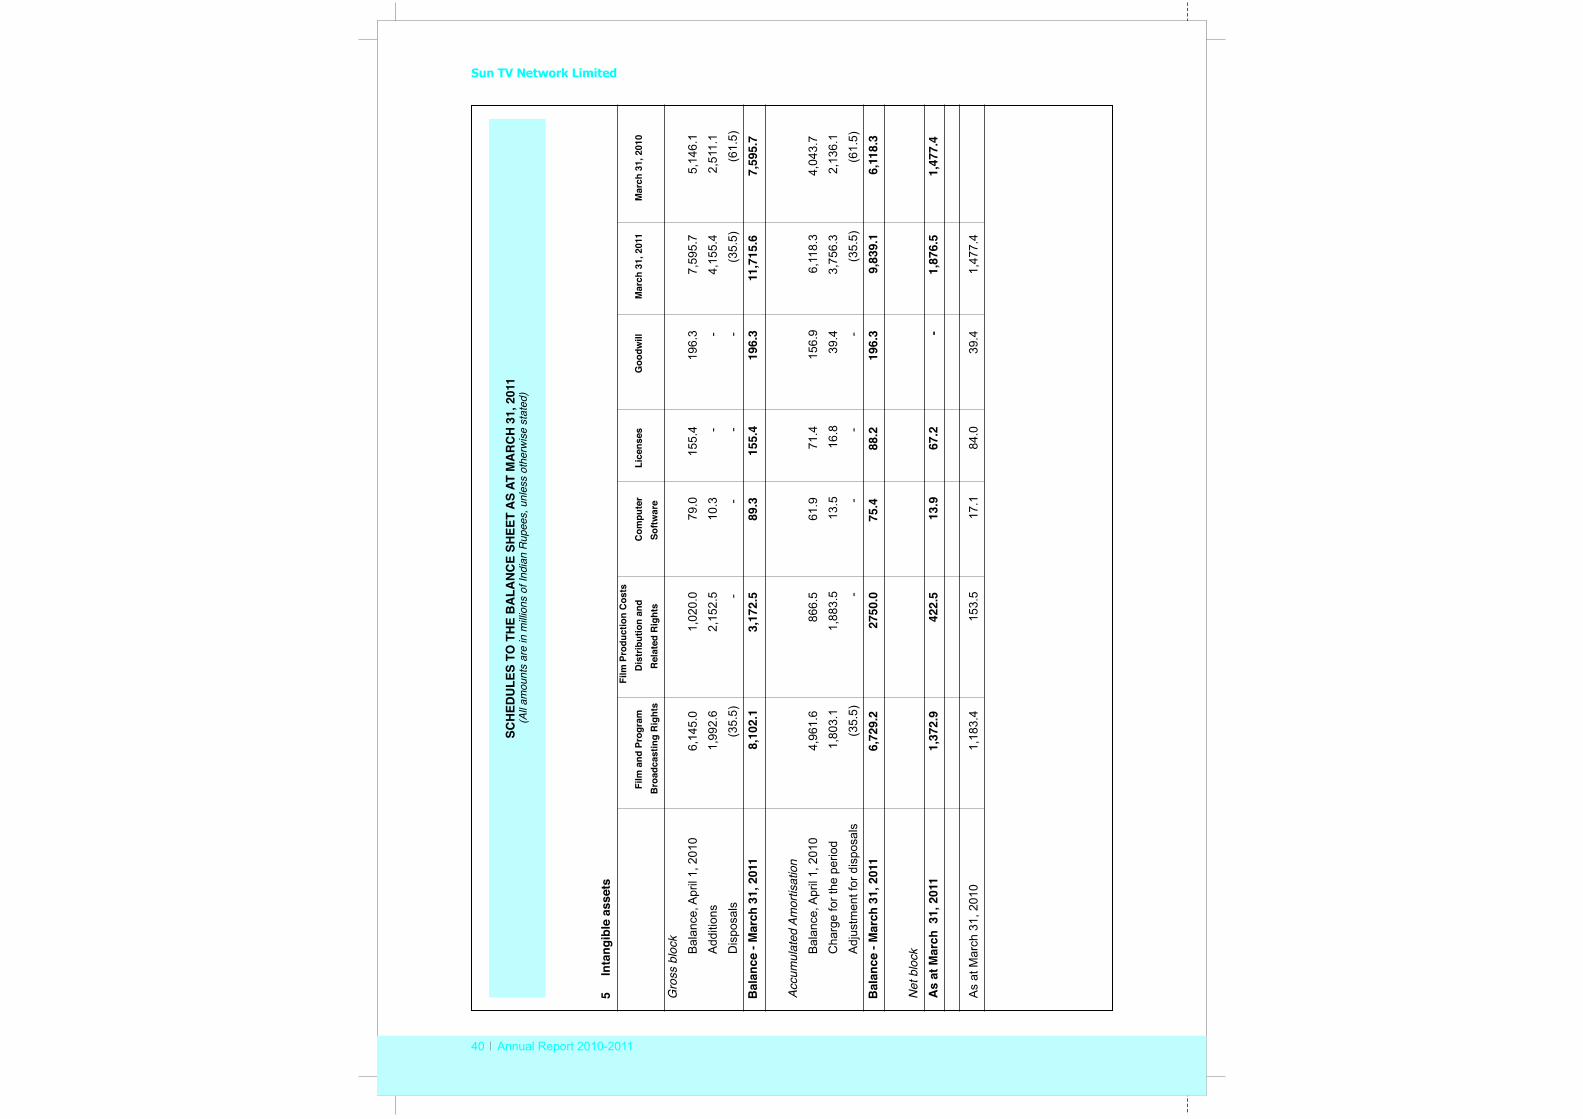
Sun TV Network Limited
40 Annual Report 2010-2011
5 In
tang
ible
ass
ets
Film
Pro
duct
ion
Cos
tsFi
lm a
nd P
rogr
amD
istr
ibut
ion
and
Com
pute
rLi
cens
esG
oodw
illM
arch
31,
201
1M
arch
31,
201
0B
road
cast
ing
Rig
hts
Rel
ated
Rig
hts
Sof
twar
e
Gro
ss b
lock Bal
ance
, Apr
il 1,
201
0 6
,145
.0
1,02
0.0
79.
0
155.
4
196.
37,
595.
75,
146.
1
Add
ition
s 1
,992
.6
2,1
52.5
10
.3-
-4,
155.
42,
511.
1
Dis
posa
ls(3
5.5)
-
-
-
-
(3
5.5)
(61.
5)
Bal
ance
- M
arch
31,
201
1 8
,102
.1
3,1
72.5
8
9.3
155.
4 1
96.3
1
1,71
5.6
7,59
5.7
Accu
mul
ated
Am
ortis
atio
nB
alan
ce, A
pril
1, 2
010
4,9
61.6
866.
5 6
1.9
71.4
156.
9 6
,118
.3
4,0
43.7
Cha
rge
for t
he p
erio
d 1
,803
.1 1
,883
.5 1
3.5
16.8
39
.4
3,75
6.3
2,13
6.1
Adj
ustm
ent f
or d
ispo
sals
(35.
5)
- -
-
-
(3
5.5)
(61.
5)
Bal
ance
- M
arch
31,
201
16,
729.
227
50.0
75.
4 8
8.2
196.
3 9,
839.
1 6
,118
.3
Net
blo
ckA
s at
Mar
ch 3
1, 2
011
1,37
2.9
422.
5 1
3.9
67.
2 -
1,87
6.5
1,47
7.4
As
at M
arch
31,
201
0
1,18
3.4
153.
5 1
7.1
84.0
39.
4 1
,477
.4
SCH
EDU
LES
TO T
HE
BA
LAN
CE
SHEE
T A
S AT
MA
RC
H 3
1, 2
011
(All
amou
nts
are
in m
illion
s of
Indi
an R
upee
s, u
nles
s ot
herw
ise
stat
ed)
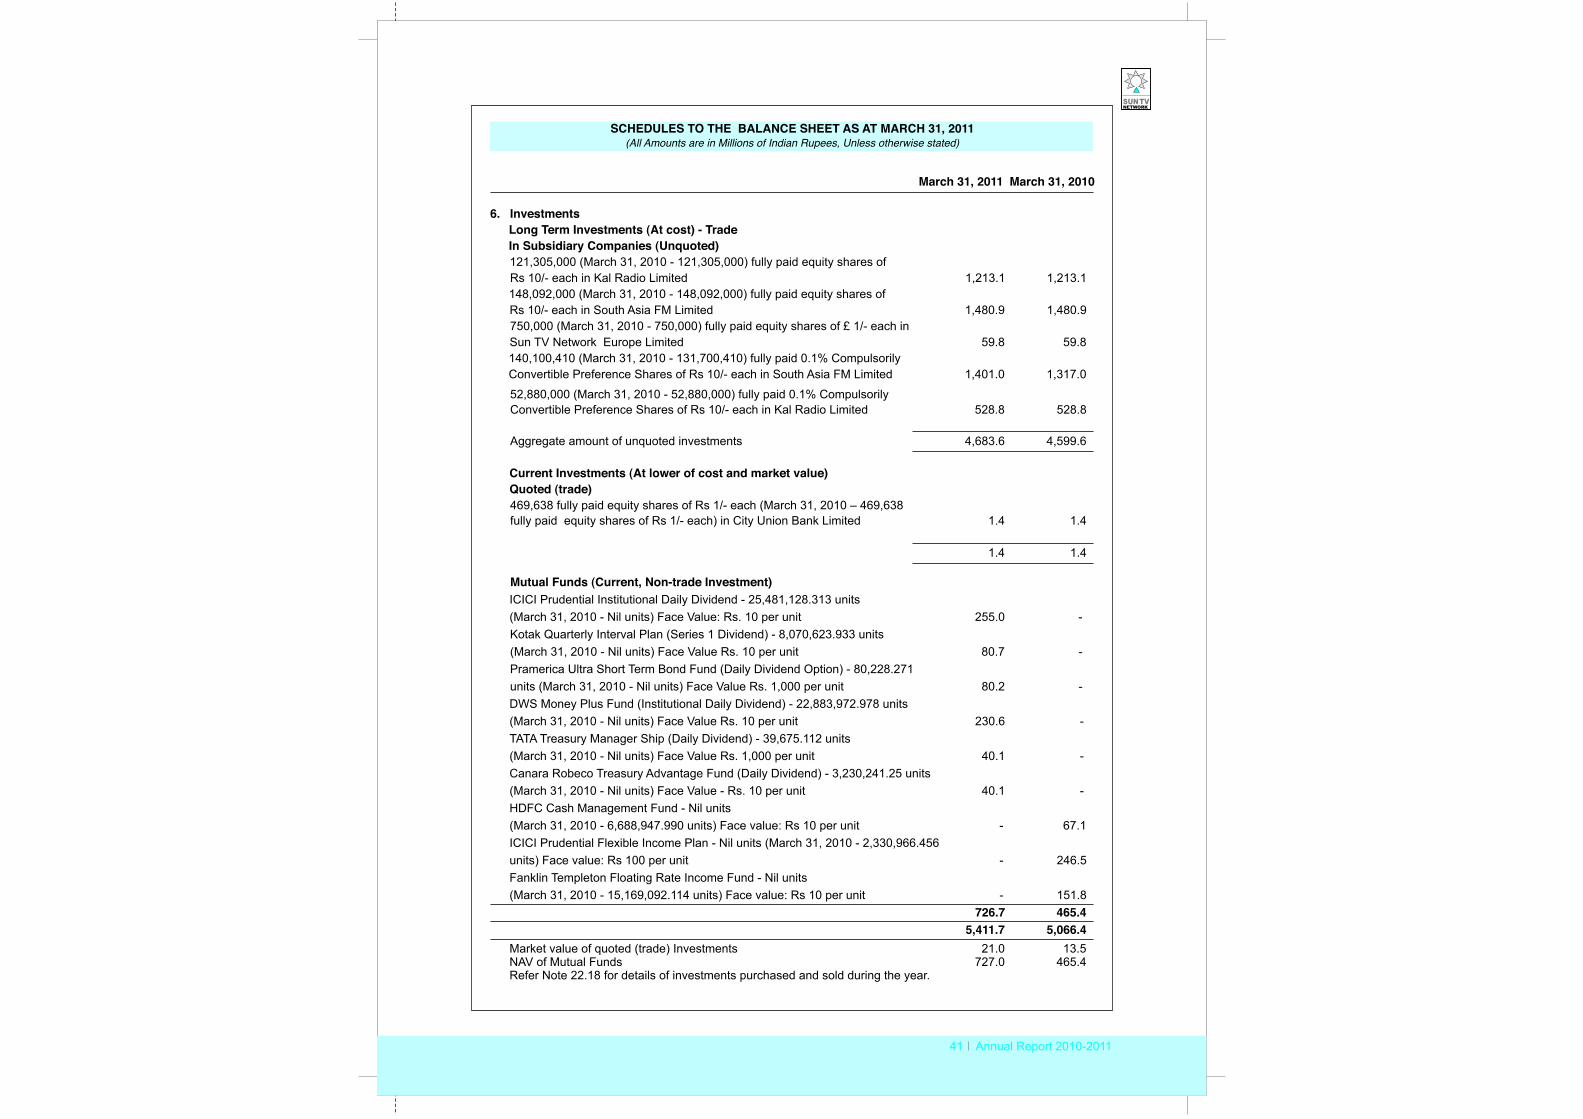
41 Annual Report 2010-2011
March 31, 2011 March 31, 2010
6. InvestmentsLong Term Investments (At cost) - TradeIn Subsidiary Companies (Unquoted)121,305,000 (March 31, 2010 - 121,305,000) fully paid equity shares of Rs 10/- each in Kal Radio Limited 1,213.1 1,213.1 148,092,000 (March 31, 2010 - 148,092,000) fully paid equity shares of Rs 10/- each in South Asia FM Limited 1,480.9 1,480.9 750,000 (March 31, 2010 - 750,000) fully paid equity shares of £ 1/- each in Sun TV Network Europe Limited 59.8 59.8140,100,410 (March 31, 2010 - 131,700,410) fully paid 0.1% Compulsorily Convertible Preference Shares of Rs 10/- each in South Asia FM Limited 1,401.0 1,317.0
52,880,000 (March 31, 2010 - 52,880,000) fully paid 0.1% Compulsorily Convertible Preference Shares of Rs 10/- each in Kal Radio Limited 528.8 528.8
Aggregate amount of unquoted investments 4,683.6 4,599.6
Current Investments (At lower of cost and market value)Quoted (trade)
469,638 fully paid equity shares of Rs 1/- each (March 31, 2010 – 469,638fully paid equity shares of Rs 1/- each) in City Union Bank Limited 1.4 1.4
1.4 1.4
Mutual Funds (Current, Non-trade Investment)ICICI Prudential Institutional Daily Dividend - 25,481,128.313 units(March 31, 2010 - Nil units) Face Value: Rs. 10 per unit 255.0 -Kotak Quarterly Interval Plan (Series 1 Dividend) - 8,070,623.933 units(March 31, 2010 - Nil units) Face Value Rs. 10 per unit 80.7 -Pramerica Ultra Short Term Bond Fund (Daily Dividend Option) - 80,228.271units (March 31, 2010 - Nil units) Face Value Rs. 1,000 per unit 80.2 -DWS Money Plus Fund (Institutional Daily Dividend) - 22,883,972.978 units(March 31, 2010 - Nil units) Face Value Rs. 10 per unit 230.6 -TATA Treasury Manager Ship (Daily Dividend) - 39,675.112 units (March 31, 2010 - Nil units) Face Value Rs. 1,000 per unit 40.1 -Canara Robeco Treasury Advantage Fund (Daily Dividend) - 3,230,241.25 units(March 31, 2010 - Nil units) Face Value - Rs. 10 per unit 40.1 -HDFC Cash Management Fund - Nil units(March 31, 2010 - 6,688,947.990 units) Face value: Rs 10 per unit - 67.1ICICI Prudential Flexible Income Plan - Nil units (March 31, 2010 - 2,330,966.456units) Face value: Rs 100 per unit - 246.5Fanklin Templeton Floating Rate Income Fund - Nil units (March 31, 2010 - 15,169,092.114 units) Face value: Rs 10 per unit - 151.8
726.7 465.4 5,411.7 5,066.4
Market value of quoted (trade) Investments 21.0 13.5NAV of Mutual Funds 727.0 465.4Refer Note 22.18 for details of investments purchased and sold during the year.
SCHEDULES TO THE BALANCE SHEET AS AT MARCH 31, 2011(All Amounts are in Millions of Indian Rupees, Unless otherwise stated)
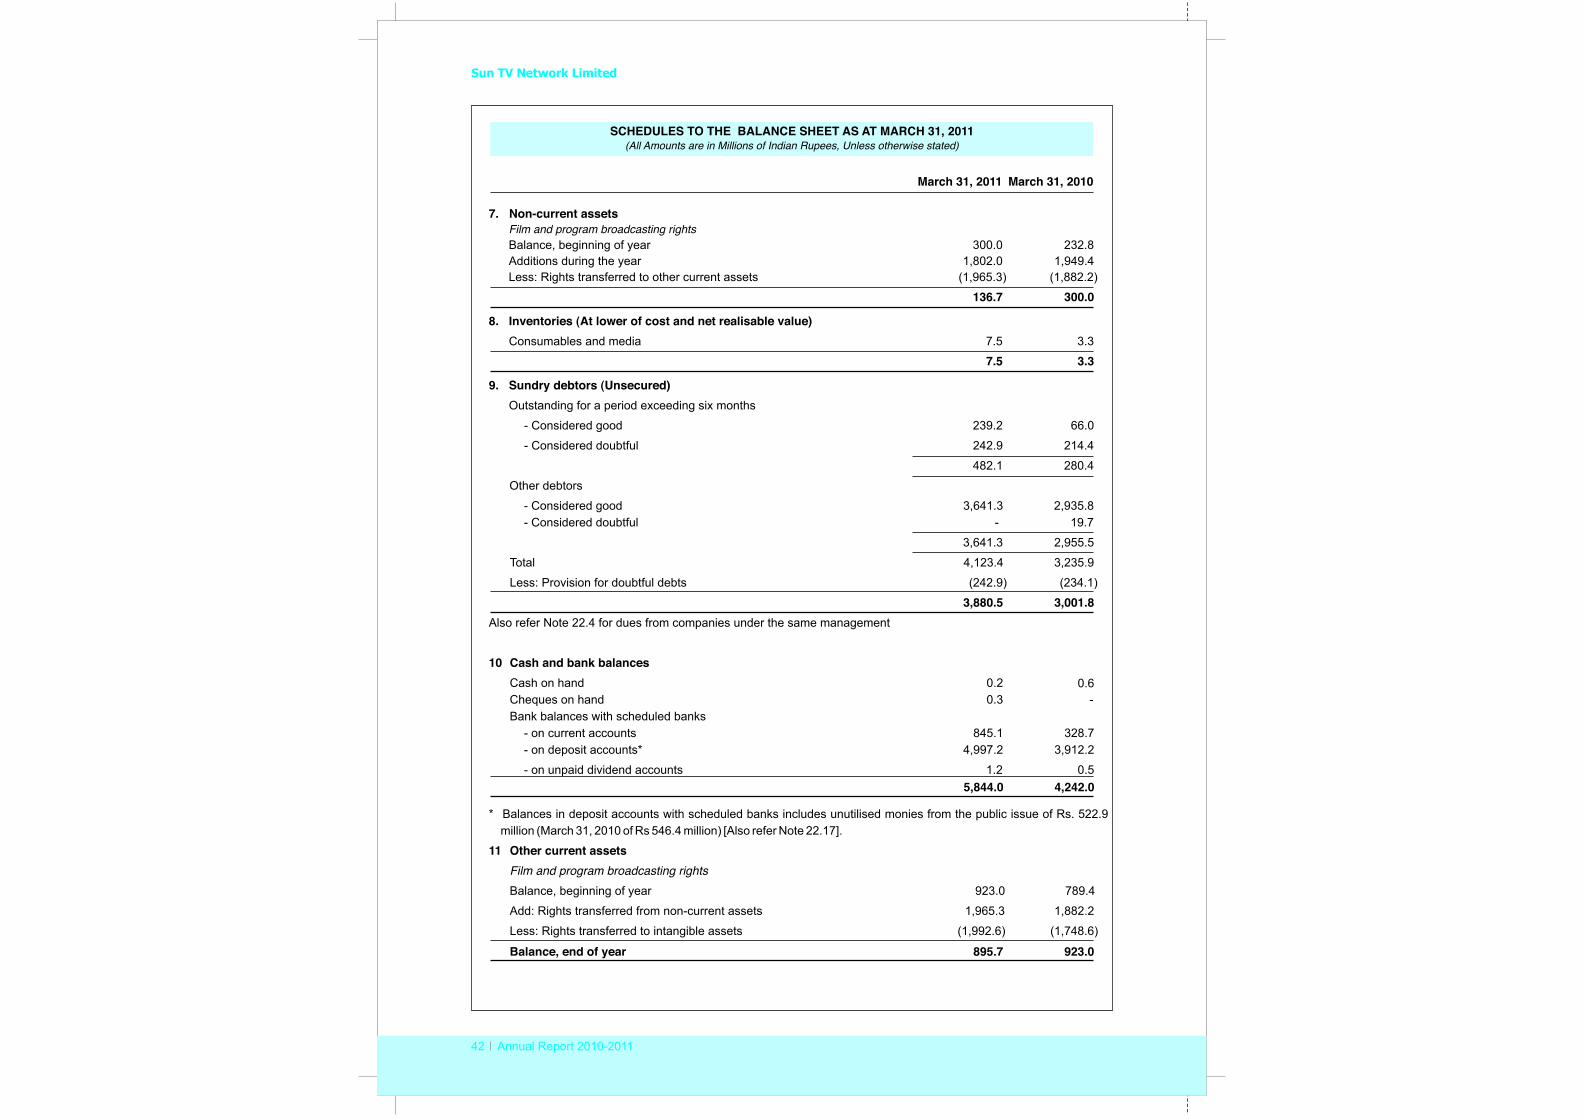
Sun TV Network Limited
42 Annual Report 2010-2011
March 31, 2011 March 31, 2010
7. Non-current assets Film and program broadcasting rights Balance, beginning of year 300.0 232.8 Additions during the year 1,802.0 1,949.4Less: Rights transferred to other current assets (1,965.3) (1,882.2)
136.7 300.0
8. Inventories (At lower of cost and net realisable value)Consumables and media 7.5 3.3
7.5 3.3
9. Sundry debtors (Unsecured)Outstanding for a period exceeding six months
- Considered good 239.2 66.0
- Considered doubtful 242.9 214.4
482.1 280.4
Other debtors
- Considered good 3,641.3 2,935.8- Considered doubtful - 19.7
3,641.3 2,955.5
Total 4,123.4 3,235.9
Less: Provision for doubtful debts (242.9) (234.1)
3,880.5 3,001.8Also refer Note 22.4 for dues from companies under the same management
10 Cash and bank balancesCash on hand 0.2 0.6 Cheques on hand 0.3 -Bank balances with scheduled banks
- on current accounts 845.1 328.7- on deposit accounts* 4,997.2 3,912.2
- on unpaid dividend accounts 1.2 0.5 5,844.0 4,242.0
* Balances in deposit accounts with scheduled banks includes unutilised monies from the public issue of Rs. 522.9 million (March 31, 2010 of Rs 546.4 million) [Also refer Note 22.17].
11 Other current assets
Film and program broadcasting rightsBalance, beginning of year 923.0 789.4
Add: Rights transferred from non-current assets 1,965.3 1,882.2
Less: Rights transferred to intangible assets (1,992.6) (1,748.6)
Balance, end of year 895.7 923.0
SCHEDULES TO THE BALANCE SHEET AS AT MARCH 31, 2011(All Amounts are in Millions of Indian Rupees, Unless otherwise stated)
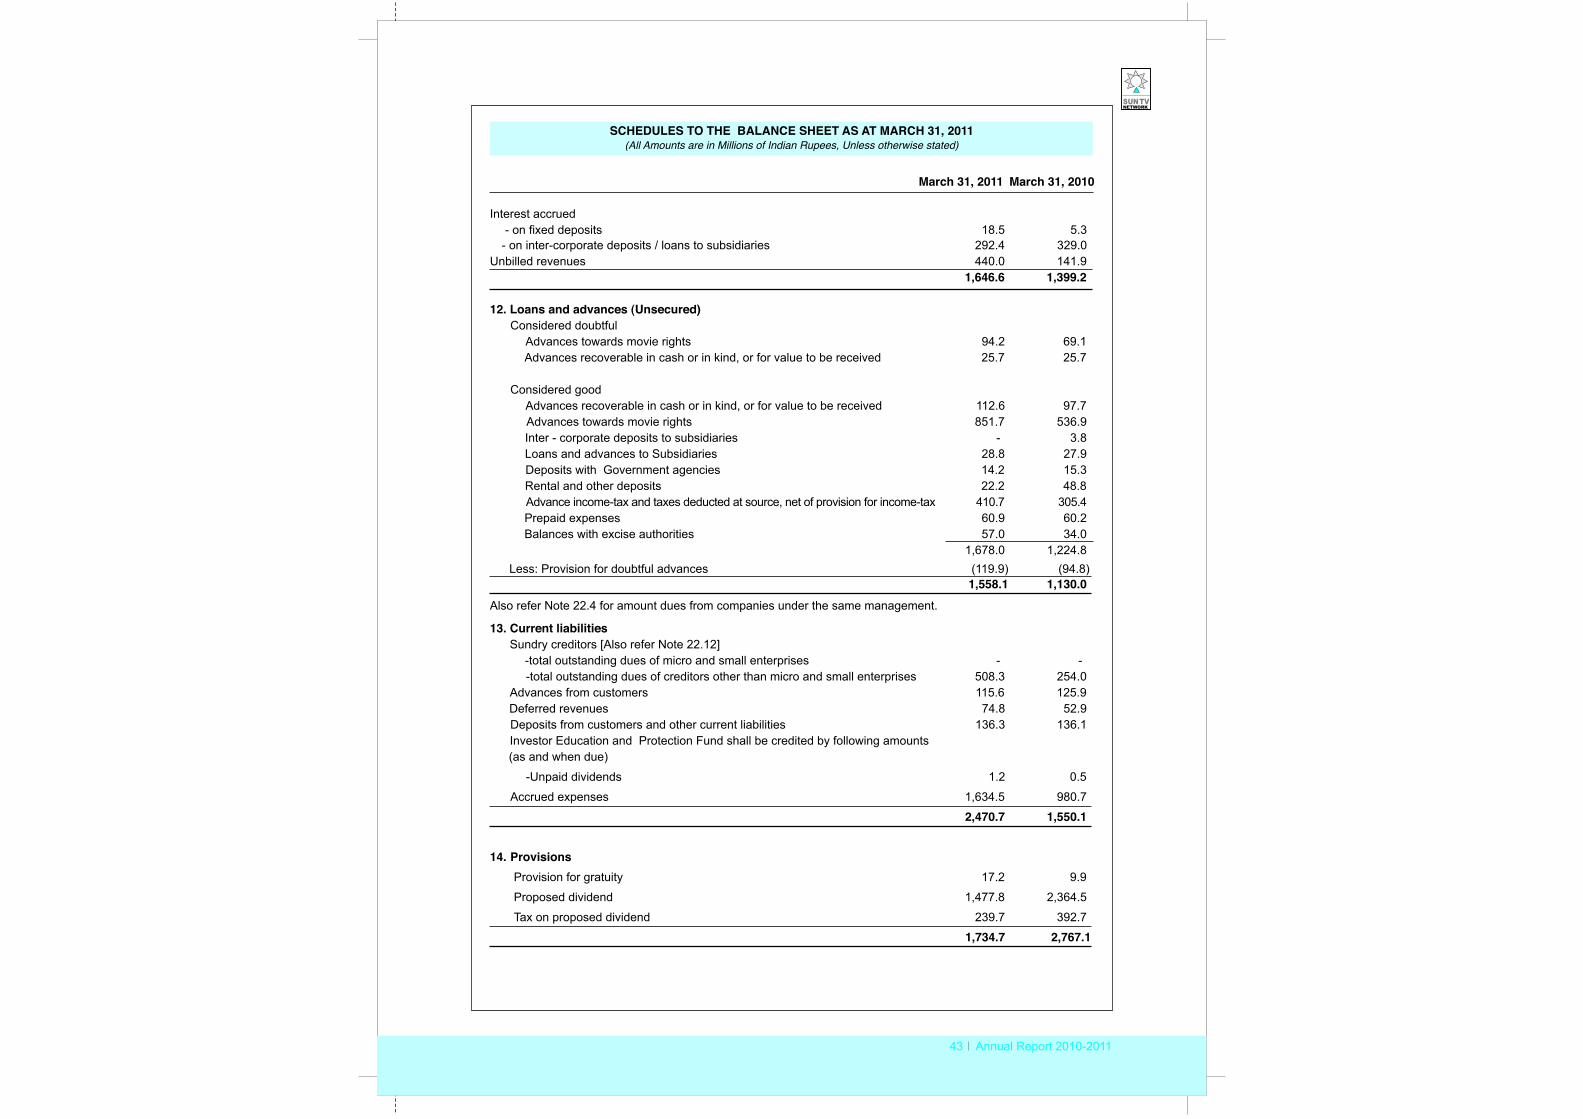
43 Annual Report 2010-2011
SCHEDULES TO THE BALANCE SHEET AS AT MARCH 31, 2011(All Amounts are in Millions of Indian Rupees, Unless otherwise stated)
March 31, 2011 March 31, 2010
Interest accrued - on fixed deposits 18.5 5.3 - on inter-corporate deposits / loans to subsidiaries 292.4 329.0
Unbilled revenues 440.0 141.91,646.6 1,399.2
12. Loans and advances (Unsecured)Considered doubtful
Advances towards movie rights 94.2 69.1Advances recoverable in cash or in kind, or for value to be received 25.7 25.7
Considered goodAdvances recoverable in cash or in kind, or for value to be received 112.6 97.7Advances towards movie rights 851.7 536.9Inter - corporate deposits to subsidiaries - 3.8Loans and advances to Subsidiaries 28.8 27.9Deposits with Government agencies 14.2 15.3 Rental and other deposits 22.2 48.8Advance income-tax and taxes deducted at source, net of provision for income-tax 410.7 305.4 Prepaid expenses 60.9 60.2Balances with excise authorities 57.0 34.0
1,678.0 1,224.8Less: Provision for doubtful advances (119.9) (94.8)
1,558.1 1,130.0 Also refer Note 22.4 for amount dues from companies under the same management.
13. Current liabilitiesSundry creditors [Also refer Note 22.12]
-total outstanding dues of micro and small enterprises - --total outstanding dues of creditors other than micro and small enterprises 508.3 254.0
Advances from customers 115.6 125.9 Deferred revenues 74.8 52.9 Deposits from customers and other current liabilities 136.3 136.1 Investor Education and Protection Fund shall be credited by following amounts (as and when due)
-Unpaid dividends 1.2 0.5
Accrued expenses 1,634.5 980.7
2,470.7 1,550.1
14. ProvisionsProvision for gratuity 17.2 9.9
Proposed dividend 1,477.8 2,364.5
Tax on proposed dividend 239.7 392.7
1,734.7 2,767.1
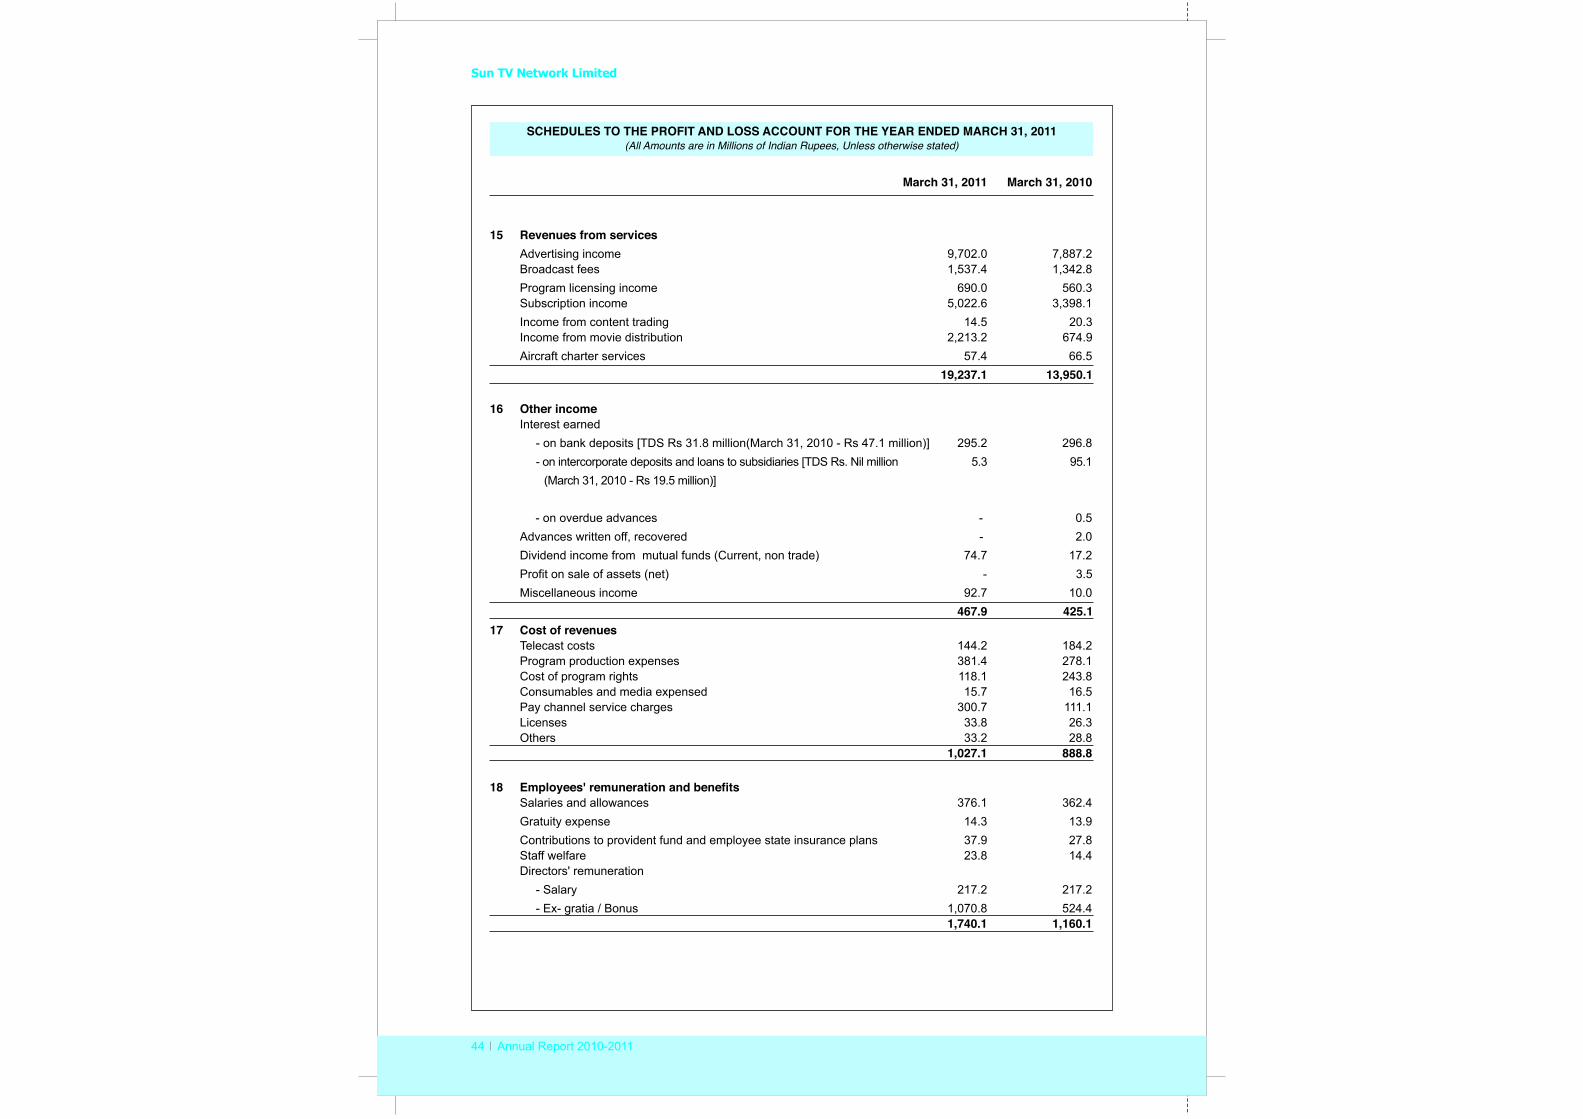
Sun TV Network Limited
44 Annual Report 2010-2011
SCHEDULES TO THE PROFIT AND LOSS ACCOUNT FOR THE YEAR ENDED MARCH 31, 2011(All Amounts are in Millions of Indian Rupees, Unless otherwise stated)
March 31, 2011 March 31, 2010
15 Revenues from servicesAdvertising income 9,702.0 7,887.2 Broadcast fees 1,537.4 1,342.8Program licensing income 690.0 560.3 Subscription income 5,022.6 3,398.1Income from content trading 14.5 20.3Income from movie distribution 2,213.2 674.9Aircraft charter services 57.4 66.5
19,237.1 13,950.1
16 Other incomeInterest earned - on bank deposits [TDS Rs 31.8 million(March 31, 2010 - Rs 47.1 million)] 295.2 296.8 - on intercorporate deposits and loans to subsidiaries [TDS Rs. Nil million 5.3 95.1
(March 31, 2010 - Rs 19.5 million)]
- on overdue advances - 0.5Advances written off, recovered - 2.0 Dividend income from mutual funds (Current, non trade) 74.7 17.2Profit on sale of assets (net) - 3.5Miscellaneous income 92.7 10.0
467.9 425.117 Cost of revenues
Telecast costs 144.2 184.2 Program production expenses 381.4 278.1 Cost of program rights 118.1 243.8 Consumables and media expensed 15.7 16.5 Pay channel service charges 300.7 111.1 Licenses 33.8 26.3 Others 33.2 28.8
1,027.1 888.8
18 Employees' remuneration and benefitsSalaries and allowances 376.1 362.4Gratuity expense 14.3 13.9Contributions to provident fund and employee state insurance plans 37.9 27.8 Staff welfare 23.8 14.4 Directors' remuneration
- Salary 217.2 217.2- Ex- gratia / Bonus 1,070.8 524.4
1,740.1 1,160.1
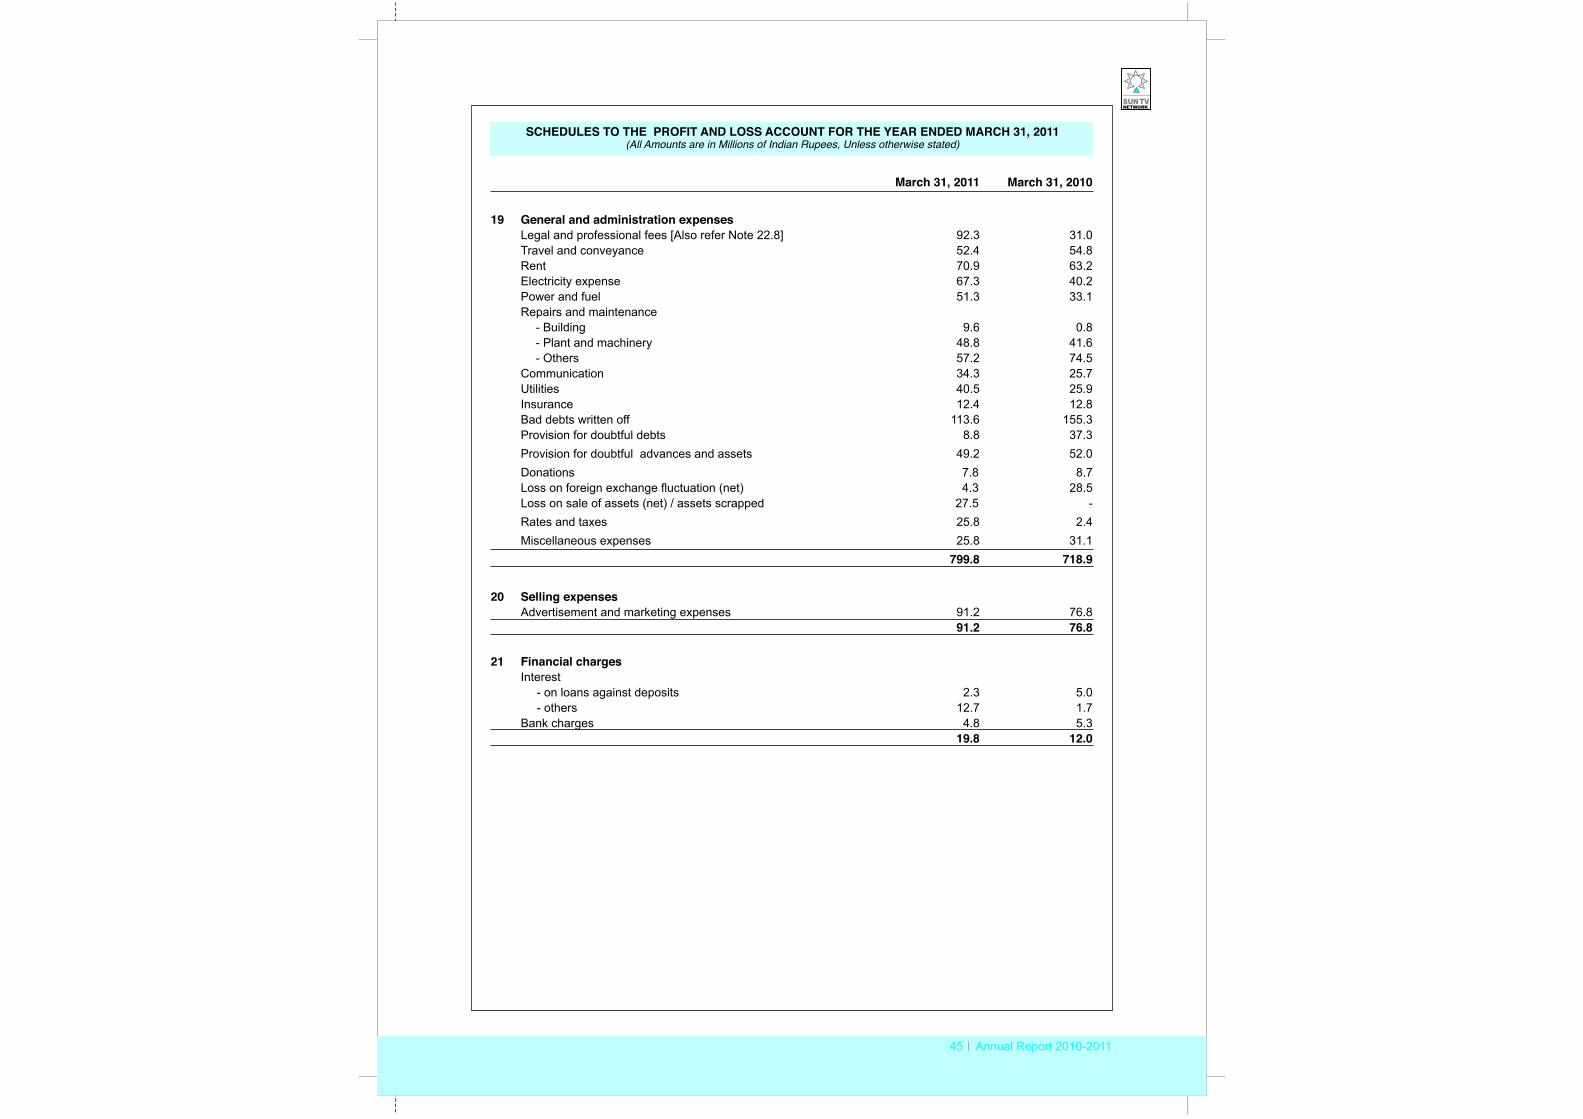
45 Annual Report 2010-2011
March 31, 2011 March 31, 2010
19 General and administration expensesLegal and professional fees [Also refer Note 22.8] 92.3 31.0 Travel and conveyance 52.4 54.8 Rent 70.9 63.2 Electricity expense 67.3 40.2 Power and fuel 51.3 33.1 Repairs and maintenance
- Building 9.6 0.8 - Plant and machinery 48.8 41.6 - Others 57.2 74.5
Communication 34.3 25.7 Utilities 40.5 25.9 Insurance 12.4 12.8 Bad debts written off 113.6 155.3 Provision for doubtful debts 8.8 37.3 Provision for doubtful advances and assets 49.2 52.0
Donations 7.8 8.7 Loss on foreign exchange fluctuation (net) 4.3 28.5 Loss on sale of assets (net) / assets scrapped 27.5 -Rates and taxes 25.8 2.4
Miscellaneous expenses 25.8 31.1 799.8 718.9 20 Selling expenses
Advertisement and marketing expenses 91.2 76.8 91.2 76.8
21 Financial chargesInterest
- on loans against deposits 2.3 5.0 - others 12.7 1.7
Bank charges 4.8 5.3 19.8 12.0
SCHEDULES TO THE PROFIT AND LOSS ACCOUNT FOR THE YEAR ENDED MARCH 31, 2011(All Amounts are in Millions of Indian Rupees, Unless otherwise stated)
Sun TV Network Limited
46 Annual Report 2010-2011
FINANCIAL STATEMENTS FOR THE YEAR ENDED MARCH 31, 2011(All Amounts are in Millions of Indian Rupees, Unless otherwise stated)
Schedules to the Financial Statements (Continued)22 Notes to the financial statements
22.1 Background
Sun TV Network Limited ('Sun TV' or 'the Company') was incorporated on December 18, 1985 as Sumangali Publications Limited. The Company is engaged in producing and broadcasting satellite television and radio software programming in the regional languages of South India.
The Company is listed on the Bombay Stock Exchange ('BSE’) and the National Stock Exchange ('NSE’) in India. The Company currently operates television channels in four South Indian languages predominantly to viewers in India, and also to viewers in Sri Lanka, Singapore, Malaysia, United Kingdom, Europe, Middle East, United States, Australia, South Africa and Canada. The Company's flagship channel is Sun TV. The other major satellite channels of the Company are Surya TV, Gemini TV and Udaya TV. The Company is also into the business of FM Radio broadcasting at Chennai, Coimbatore and Tirunelveli. The Company’s film production / distribution division ‘Sun Pictures’ undertakes production / distribution of movies in the Tamil language.
During current year, the Company released a blockbuster movie simultaneously in three languages titled ‘Enthiran’ in Tamil and ‘Robot’ in Telugu and Hindi’. The Company earned revenues of Rs.179 crores, including Rs. 8 crores expected towards satellite rights which has not been included in the revenues in current year. The Company has spent Rs.132 crores on the production of this blockbuster.
22.2 Statement of significant accounting policiesa) Basis of preparation of financial statements
The financial statements have been prepared to comply in all material respects with accounting standards notified by Companies (Accounting Standards) Rules, 2006 (as amended) and the relevant provisions of the Companies Act, 1956 (‘the Act’). The financial statements have been prepared under the historical cost convention on an accrual basis. The accounting policies have been consistently applied by the Company and are consistent with those used in the previous year.
The accompanying financial statements have been stated in millions of Indian rupees and, accordingly, transactions or balances less than Rs 0.1 million are not considered material and hence not disclosed.
b) Use of estimatesThe preparation of financial statements in conformity with generally accepted accounting principles requires management to make estimates and assumptions that affect the reported amounts of assets and liabilities and disclosure of contingent liabilities at the date of the financial statements and the results of operations during the reporting period end. Although these estimates are based upon management’s best knowledge of current events and actions, actual results could differ from these estimates.
c) Fixed assets and depreciationFixed assetsFixed assets are stated at cost less accumulated depreciation and impairment losses, if any. Cost comprises the purchase price and any attributable cost of bringing the asset to its working condition for its intended use. Borrowing costs, if any, relating to acquisition of qualifying fixed assets are also included to the extent they relate to the period till such assets are ready to be put to use. Amounts paid under contractual terms for purchasing fixed assets, fixed assets under construction and fixed assets acquired but not put to use at the Balance Sheet date are classified as capital work in progress.
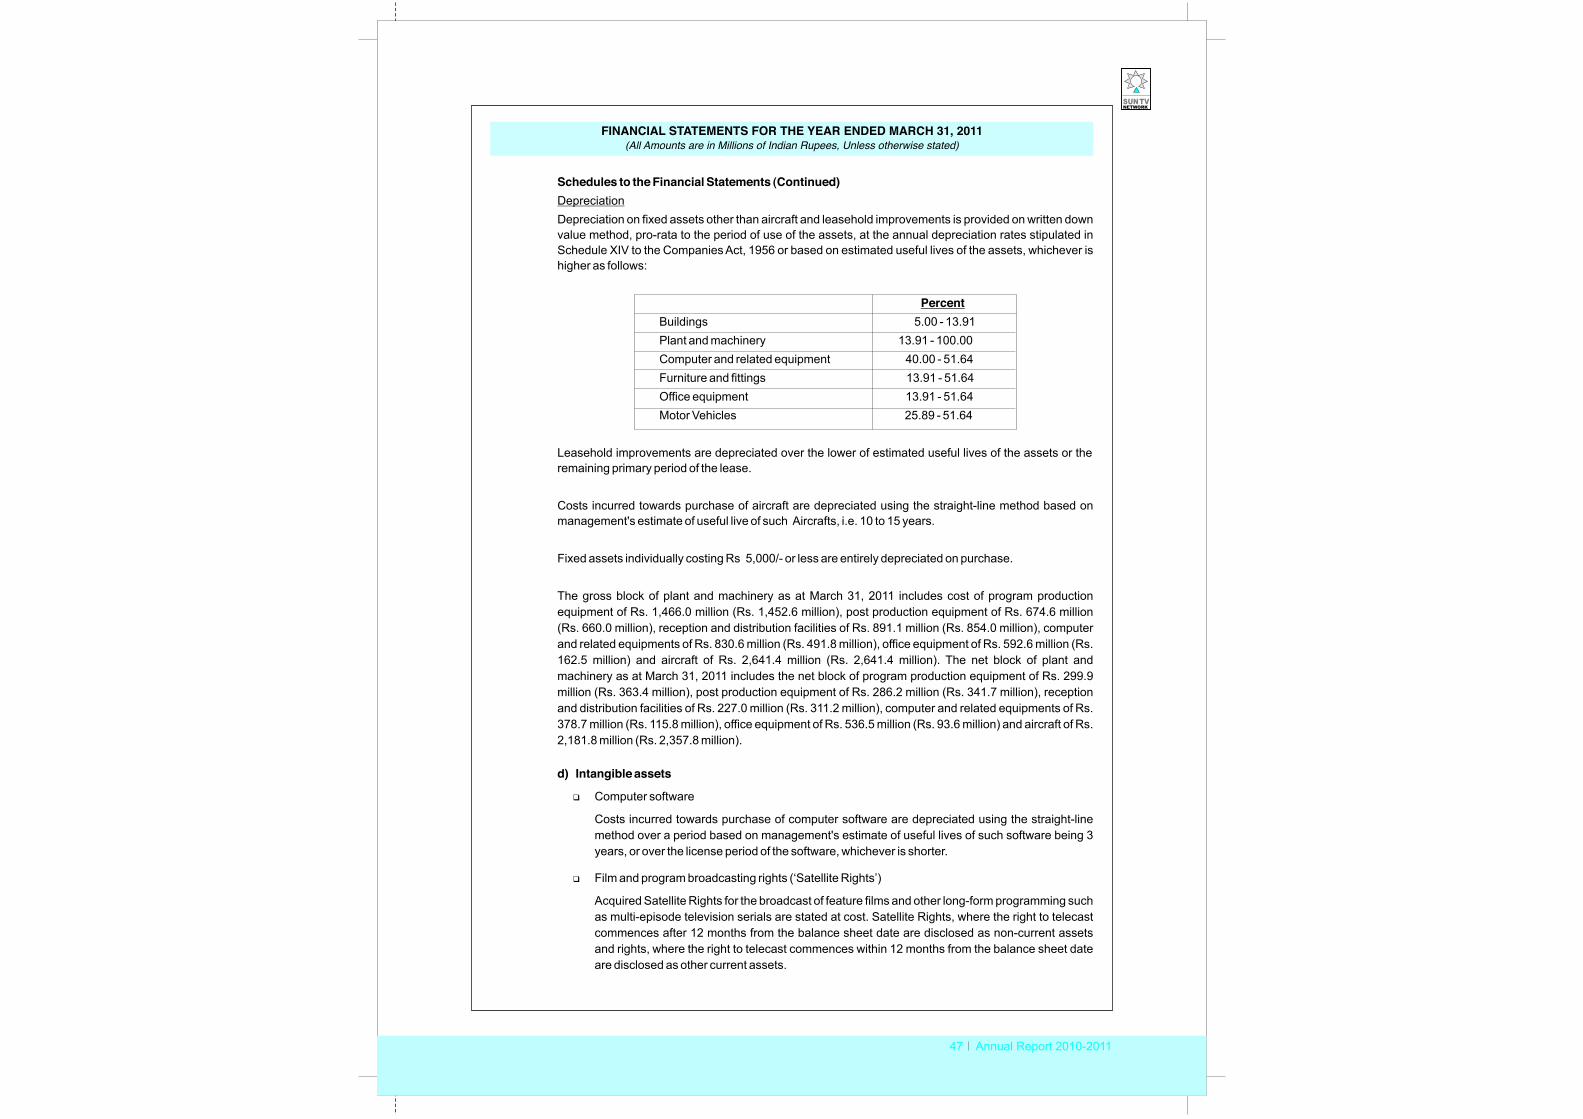
47 Annual Report 2010-2011
FINANCIAL STATEMENTS FOR THE YEAR ENDED MARCH 31, 2011 (All Amounts are in Millions of Indian Rupees, Unless otherwise stated)
Schedules to the Financial Statements (Continued)DepreciationDepreciation on fixed assets other than aircraft and leasehold improvements is provided on written down value method, pro-rata to the period of use of the assets, at the annual depreciation rates stipulated in Schedule XIV to the Companies Act, 1956 or based on estimated useful lives of the assets, whichever is higher as follows:
PercentBuildings 5.00 - 13.91Plant and machinery 13.91 - 100.00Computer and related equipment 40.00 - 51.64Furniture and fittings 13.91 - 51.64Office equipment 13.91 - 51.64Motor Vehicles 25.89 - 51.64
Leasehold improvements are depreciated over the lower of estimated useful lives of the assets or the remaining primary period of the lease.
Costs incurred towards purchase of aircraft are depreciated using the straight-line method based on management's estimate of useful live of such Aircrafts, i.e. 10 to 15 years.
Fixed assets individually costing Rs 5,000/- or less are entirely depreciated on purchase.
The gross block of plant and machinery as at March 31, 2011 includes cost of program production equipment of Rs. 1,466.0 million (Rs. 1,452.6 million), post production equipment of Rs. 674.6 million (Rs. 660.0 million), reception and distribution facilities of Rs. 891.1 million (Rs. 854.0 million), computer and related equipments of Rs. 830.6 million (Rs. 491.8 million), office equipment of Rs. 592.6 million (Rs. 162.5 million) and aircraft of Rs. 2,641.4 million (Rs. 2,641.4 million). The net block of plant and machinery as at March 31, 2011 includes the net block of program production equipment of Rs. 299.9 million (Rs. 363.4 million), post production equipment of Rs. 286.2 million (Rs. 341.7 million), reception and distribution facilities of Rs. 227.0 million (Rs. 311.2 million), computer and related equipments of Rs. 378.7 million (Rs. 115.8 million), office equipment of Rs. 536.5 million (Rs. 93.6 million) and aircraft of Rs. 2,181.8 million (Rs. 2,357.8 million).
d) Intangible assets
�Computer software
Costs incurred towards purchase of computer software are depreciated using the straight-line method over a period based on management's estimate of useful lives of such software being 3 years, or over the license period of the software, whichever is shorter.
�Film and program broadcasting rights (‘Satellite Rights’)
Acquired Satellite Rights for the broadcast of feature films and other long-form programming such as multi-episode television serials are stated at cost. Satellite Rights, where the right to telecast commences after 12 months from the balance sheet date are disclosed as non-current assets and rights, where the right to telecast commences within 12 months from the balance sheet date are disclosed as other current assets.
Sun TV Network Limited
48 Annual Report 2010-2011
Schedules to the Financial Statements (Continued)
Satellite Rights are transferred to intangible assets, as and when they become available for telecast on television. Satellite Rights disclosed under intangible assets represent rights, which are available for use as at the balance sheet date.
Future revenues cannot be estimated with any reasonable accuracy as these are susceptible to a variety of factors, such as the level of market acceptance of television products, programming viewership, advertising rates etc, and accordingly cost related to film and program broadcasting rights are fully expensed on the date of first telecast of the film / program episode, as the case may be.
�Film production costs, distribution and related rights
Upon the theatrical release of a movie, the cost of production / acquisition of all the rights related to each such movie is amortised in the ratio that current period revenue for the movie bears to the management’s estimate of the remaining unrecognised revenue for all rights arising from the movie, as per the individual-film-forecast method. The estimates for remaining unrecognised revenue for each movie is reviewed periodically and revised if necessary.Expenditure incurred towards production of movies not complete as at balance sheet date and amounts paid under contractual terms for acquiring distribution rights and related rights of movies not released in theatres as at the balance sheet date are classified as intangible assets under development.
�Licenses
Licenses represent one time entry fees paid to Ministry of Information and Broadcasting ('MIB’) under the applicable licensing policy for Frequency Modulation ('FM’) Radio broadcasting. Cost of licenses is amortised over the license period.
�Goodwill
Goodwill is amortised on a straight-line basis over a period of five years, based on management’s estimates.
e) ImpairmentThe carrying amounts of assets are reviewed at each balance sheet date if there is any indication of impairment based on internal/external factors. An impairment loss is recognised wherever the carrying amount of an asset exceeds its recoverable amount. The recoverable amount is the greater of the asset's net selling price and value in use. In assessing value in use, the estimated future cash flows are discounted to their present value using a pre-tax discount rate that reflects current market assessments of the time value of money and risks specific to the asset. After impairment, depreciation is provided on the revised carrying amount of the assets over its remaining useful life. A previously recognised impairment loss is increased or reversed depending on changes in circumstances. However the carrying value after reversal is not increased beyond the carrying value that would have prevailed by charging usual depreciation if there was no impairment.
f) InvestmentsInvestments that are readily realisable and intended to be held for not more than a year are classified as current investments. All other investments are classified as long-term investments. Current investments are carried at lower of cost and fair value determined on an individual
FINANCIAL STATEMENTS FOR THE YEAR ENDED MARCH 31, 2011 (All Amounts are in Millions of Indian Rupees, Unless otherwise stated)
49 Annual Report 2010-2011
Schedules to the Financial Statements (Continued)
investment basis. Long-term investments are carried at cost. However, provision for diminution in value is made to recognise a decline other than temporary in the value of the investments.
g) Retirement and other employee benefit
Retirement benefit in the form of provident fund is a defined contribution scheme and the contributions are charged to the profit and loss account of the year when the contributions to the respective funds are due. There are no other obligations other than the contribution payable to the respective funds.
Gratuity liability is a defined benefit obligation and is provided for on the basis of an actuarial valuation on projected unit credit method made at the end of each financial year. Actuarial gains / losses are immediately taken to profit and loss account and are not deferred.
h) Taxation
Tax expense comprises current and deferred tax. Current income tax is measured at the amount expected to be paid to the tax authorities in accordance with the Income-tax Act, 1961 enacted in India. Deferred income taxes reflects the impact of current year timing differences between taxable income and accounting income for the year and reversal of timing differences of earlier years.
Deferred tax is measured based on the tax rates and the tax laws enacted or substantively enacted at the balance sheet date. Deferred tax assets and deferred tax liabilities are offset, if a legally enforceable right exists to set off current tax assets against current tax liabilities and the deferred tax assets and deferred tax liabilities relate to the taxes on income levied by same governing taxation laws. Deferred tax assets are recognised only to the extent that there is reasonable certainty that sufficient future taxable income will be available against which such deferred tax assets can be realised.
The carrying amount of deferred tax assets are reviewed at each balance sheet date. The Company writes-down the carrying amount of a deferred tax asset to the extent that it is no longer reasonably certain or virtually certain, as the case may be, that sufficient future taxable income will be available against which deferred tax asset can be realised. Any such write-down is reversed to the extent that it becomes reasonably certain or virtually certain, as the case may be, that sufficient future taxable income will be available.
At each balance sheet date the Company re-assesses unrecognised deferred tax assets. It recognises unrecognised deferred tax assets to the extent that it has become reasonably certain or virtually certain, as the case may be that sufficient future taxable income will be available against which such deferred tax assets can be realised.
i) Earnings per share
Basic earnings per share are calculated by dividing the net profit or loss for the period attributable to equity shareholders by the weighted average number of equity shares outstanding during the period. The weighted average number of equity shares outstanding during the period is adjusted for events of bonus issue; bonus element in a rights issue to existing shareholders; share split; and reverse share split (consolidation of shares).
For the purpose of calculating diluted earnings per share, the net profit or loss for the period attributable to equity shareholders and the weighted average number of shares outstanding during the period are adjusted for the effects of all dilutive potential equity shares.
FINANCIAL STATEMENTS FOR THE YEAR ENDED MARCH 31, 2011 (All Amounts are in Millions of Indian Rupees, Unless otherwise stated)
Sun TV Network Limited
50 Annual Report 2010-2011
Schedules to the Financial Statements (Continued)j) Revenue recognition
Revenue is recognized to the extent that it is probable that the economic benefits will flow to the Company and the revenue can be reliably measured.
�Advertising income and broadcast fees are recognised when the related commercial or programme is telecast.
�Program licensing income represents income from the export of program software content, and is recognised in accordance with the terms of agreements with customers.
�Subscription income represents subscription fees billed to cable operators and Direct to Home (‘DTH’) service providers towards pay-channels operated by the Company, and are recognised in the period during which the service is provided. Subscription fees billed to cable operators are determined based on management's best estimates of the number of subscription points to which the service is provided, at contractually agreed rates. Subscription income from DTH customers is recognised in accordance with the terms of agreements entered into with the service providers.
�Revenues from sale of movie distribution / sub-distribution rights are recognised on the theatrical release of the related movie, in accordance with the terms of agreements with customers. Revenues from the theatrical distribution of movies are recognised as they are exhibited, based on box office collections reported by the exhibitors after deduction of taxes and exhibitor’s share of collections.
�Income from content trading represent revenue earned from mobile service providers and is recognised as per the terms of contract with mobile service providers.
�Revenues from aircraft charter services are recognised based on services provided and billed as per the terms of the contracts with the customers.
�Revenues from barter transactions, and the related costs, are recorded at fair values of the services rendered and services received, as estimated by management.
�Interest income is recognised on time proportion basis.
�Revenues recognised in excess of billings are disclosed as “Unbilled Revenue” under other current assets.
�Billings in excess of revenue recognised are disclosed as “Deferred Revenues” under current liabilities.
�Dividend Income is recognised when the right to receive payment is established by the balance sheet date.
k) Operating leases (where the Company is the lessee)
Leases where the lessor effectively retains substantially all the risks and benefits of ownership of the leased asset, are classified as operating leases. Operating lease payments are recognised as an expense in the Profit and Loss account on a straight-line basis over the lease term.
FINANCIAL STATEMENTS FOR THE YEAR ENDED MARCH 31, 2011 (All Amounts are in Millions of Indian Rupees, Unless otherwise stated)
51 Annual Report 2010-2011
Schedules to the Financial Statements (Continued)
l) Cash and Cash equivalents
Cash and cash equivalents for the purposes of cash flow statement comprise cash at bank and in hand and short-term investments with an original maturity of three months or less.
m) Foreign currency transactions
Transactions denominated in foreign currencies are recorded at the exchange rates prevailing on the date of transaction. At the year-end, monetary items are converted into rupee equivalents at the year-end exchange rates. Non-monetary items which are carried in terms of historical cost denominated in a foreign currency are reported using the exchange rate at the date of the transaction.
All exchange differences arising on settlement / conversion of foreign currency monetary items are included in the profit and loss account.
n) Provisions
A provision is recognised when an enterprise has a present obligation as a result of past event and it is probable that an outflow of resources will be required to settle the obligation, in respect of which a reliable estimate can be made. Provisions are not discounted to their present values and are determined based on management’s estimate of the amount required to settle the obligation at the balance sheet date. These are reviewed at each balance sheet date and adjusted to reflect the management’s current estimates.
o) Segment reporting
The Company considers business segments as its primary segment. The Company's operations predominantly relate to broadcasting and, accordingly, this is the only primary reportable segment.
The Company considers geographical segments as its secondary segment. The Company's operations are predominantly within India and, accordingly, this is the only secondary reportable segment.
FINANCIAL STATEMENTS FOR THE YEAR ENDED MARCH 31, 2011 (All Amounts are in Millions of Indian Rupees, Unless otherwise stated)
[ This space intentionally left blank ]
Sun TV Network Limited
52 Annual Report 2010-2011
FINANCIAL STATEMENTS FOR THE YEAR ENDED MARCH 31, 2011 (All Amounts are in Millions of Indian Rupees, Unless otherwise stated)
Schedules to the Financial Statements (Continued)
22.3 Quantitative information as per the Act
Due to the nature of its business, the requirements relating to the quantitative details of sales and the information under paragraph 3, 4C and 4D of Part II of Schedule VI to the Companies Act, 1956 are not applicable to the Company except to the extent disclosed in these financial statements.
22.4 Additional information required under the ActBalances due from companies under the same management as defined under section 370(1B) of the Companies Act, 1956 and Clause 32 of the listing agreement include the following:
outstanding as at outstanding at any time during the year ended
Sundry debtors 31.03.2011 31.03.2010 31.03.2011 31.03.2010Kal Comm Private Limited 78.5 338.5Sun Direct TV Private Limited 515.3 205.6 669.2 239.6Sun TV Network Europe Limited 45.9 - 45.9 -Kal Publications Private Limited 0.5 0.2 8.1 0.2Kal Radio Limited - 1.6 1.6 2.0Sun 18 Media Services South Private Limited 217.3 - 282.4 -
Loans and advancesSun Direct TV Private Limited 4.8 - 4.8 -Kal Publications Private Limited 7.1 - 7.1 1.2Kal Comm Private Limited 5.2 5.2 5.2 5.2Kal Radio Limited 9.6 11.7 11.7 19.1South Asia FM Limited 34.2 30.0 34.2 30.0
Inter - corporate deposits and LoansKal Radio Limited - 3.8 3.8 528.8South Asia FM Limited - - - 1,317.0Sun TV Network Europe Limited 28.8 27.1 28.8 33.1
Interest AccruedKal Radio Limited 116.8 116.8 116.8 84.4South Asia Fm Limited 170.4 210.4 210.4 169.0Sun TV Network Europe Limited 5.2 1.8 5.2 1.8
Advance towards equitySouth Asia FM Limited - - - 110.0
Balance Maximum amount
191.3 840.9
31.03.2011 31.03.2010Outstanding commitments on capital contracts 85.4Commitments for acquisition of film and program broadcasting rights 1,209.7 843.1
1,295.1 2,131.0
1,287.9
22.5 Capital commitments (net of advances)
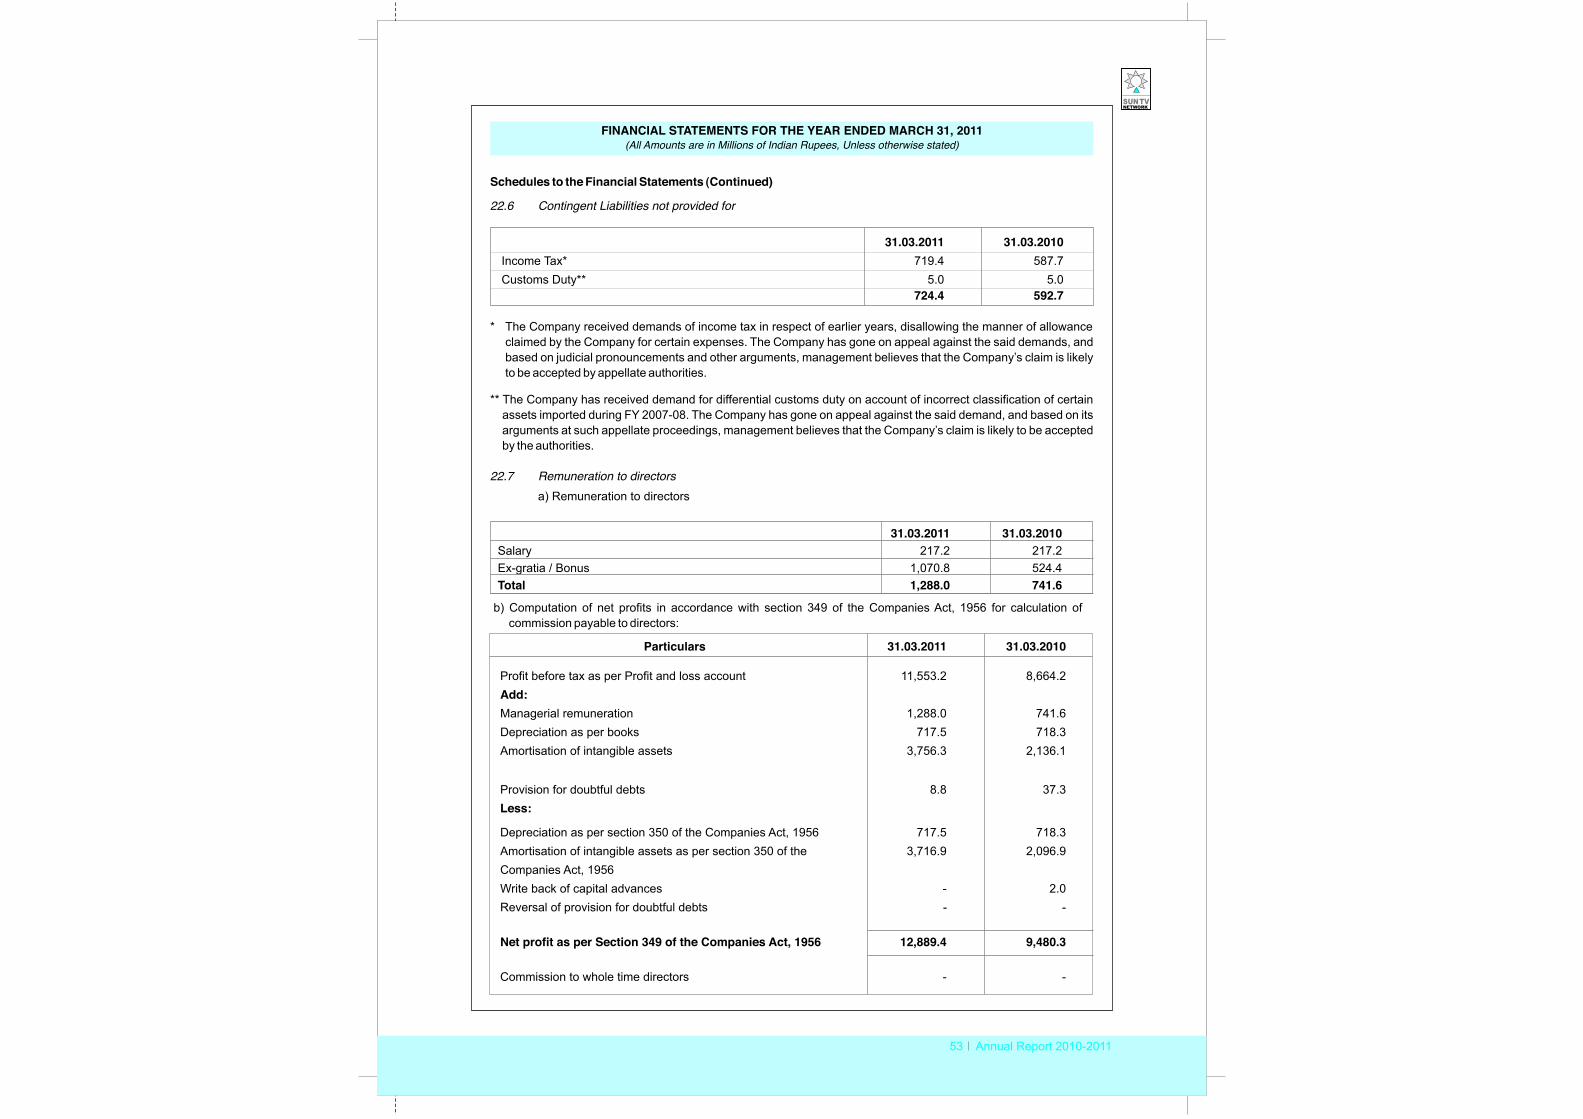
53 Annual Report 2010-2011
FINANCIAL STATEMENTS FOR THE YEAR ENDED MARCH 31, 2011 (All Amounts are in Millions of Indian Rupees, Unless otherwise stated)
22.7 Remuneration to directorsa) Remuneration to directors
b) Computation of net profits in accordance with section 349 of the Companies Act, 1956 for calculation of commission payable to directors:
Schedules to the Financial Statements (Continued)
22.6 Contingent Liabilities not provided for
31.03.2011 31.03.2010Income Tax* 719.4 587.7Customs Duty** 5.0 5.0
724.4 592.7
* The Company received demands of income tax in respect of earlier years, disallowing the manner of allowance claimed by the Company for certain expenses. The Company has gone on appeal against the said demands, and based on judicial pronouncements and other arguments, management believes that the Company’s claim is likely to be accepted by appellate authorities.
** The Company has received demand for differential customs duty on account of incorrect classification of certain assets imported during FY 2007-08. The Company has gone on appeal against the said demand, and based on its arguments at such appellate proceedings, management believes that the Company’s claim is likely to be accepted by the authorities.
31.03.2011 31.03.2010Salary 217.2 217.2Ex-gratia / Bonus 1,070.8 524.4Total 1,288.0 741.6
Particulars 31.03.2011 31.03.2010
Profit before tax as per Profit and loss account 11,553.2 8,664.2Add:Managerial remuneration 1,288.0 741.6Depreciation as per books 717.5 718.3Amortisation of intangible assets 3,756.3 2,136.1
Provision for doubtful debts 8.8 37.3Less:
Depreciation as per section 350 of the Companies Act, 1956 717.5 718.3Amortisation of intangible assets as per section 350 of the 3,716.9 2,096.9Companies Act, 1956Write back of capital advances - 2.0Reversal of provision for doubtful debts - -
Net profit as per Section 349 of the Companies Act, 1956 12,889.4 9,480.3
Commission to whole time directors - -
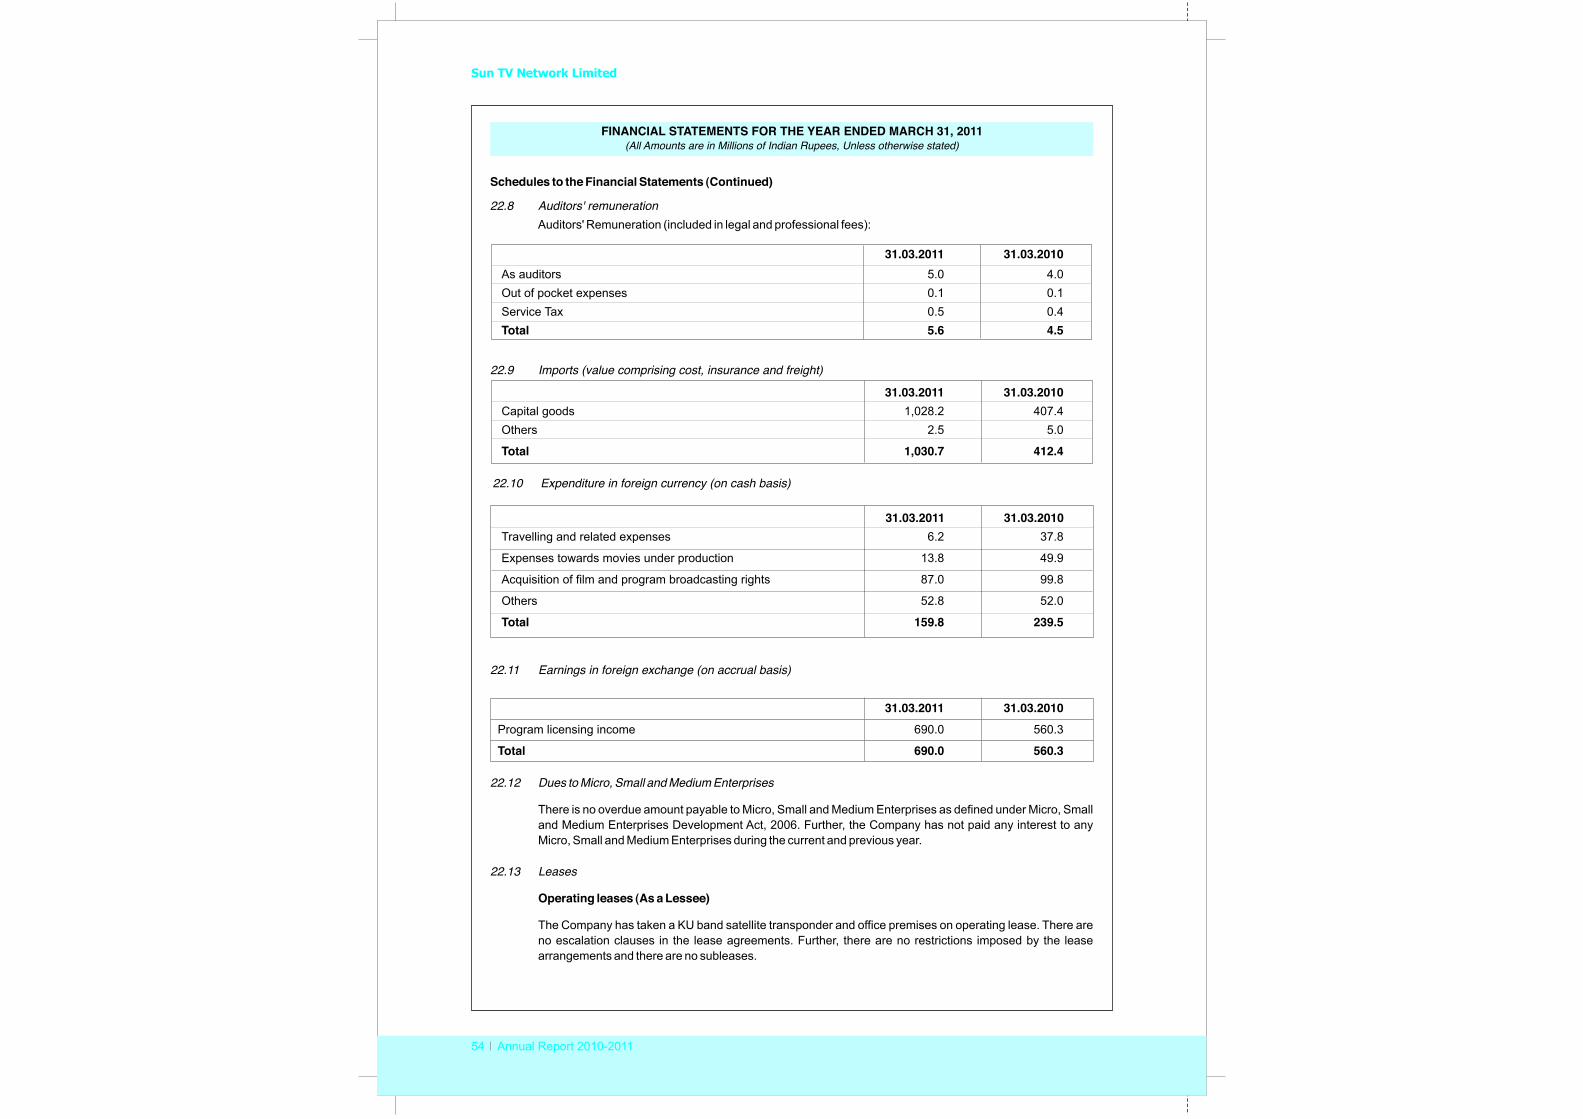
Sun TV Network Limited
54 Annual Report 2010-2011
22.12 Dues to Micro, Small and Medium Enterprises
There is no overdue amount payable to Micro, Small and Medium Enterprises as defined under Micro, Small and Medium Enterprises Development Act, 2006. Further, the Company has not paid any interest to any Micro, Small and Medium Enterprises during the current and previous year.
22.11 Earnings in foreign exchange (on accrual basis)
31.03.2011 31.03.2010Program licensing income 690.0
Total 690.0 560.3560.3
Schedules to the Financial Statements (Continued)
22.8 Auditors' remunerationAuditors' Remuneration (included in legal and professional fees):
31.03.2011 31.03.2010As auditors 5.0 4.0Out of pocket expenses 0.1 0.1Service Tax 0.5 0.4Total 5.6 4.5
22.10 Expenditure in foreign currency (on cash basis)
22.9 Imports (value comprising cost, insurance and freight)
31.03.2011 31.03.2010Capital goods 1,028.2 407.4Others 2.5 5.0
Total 1,030.7 412.4
31.03.2011 31.03.2010Travelling and related expenses 6.2 37.8
Expenses towards movies under production 13.8 49.9
Acquisition of film and program broadcasting rights 87.0 99.8
Others 52.8 52.0
Total 159.8 239.5
22.13 Leases
Operating leases (As a Lessee)
The Company has taken a KU band satellite transponder and office premises on operating lease. There are no escalation clauses in the lease agreements. Further, there are no restrictions imposed by the lease arrangements and there are no subleases.
FINANCIAL STATEMENTS FOR THE YEAR ENDED MARCH 31, 2011 (All Amounts are in Millions of Indian Rupees, Unless otherwise stated)
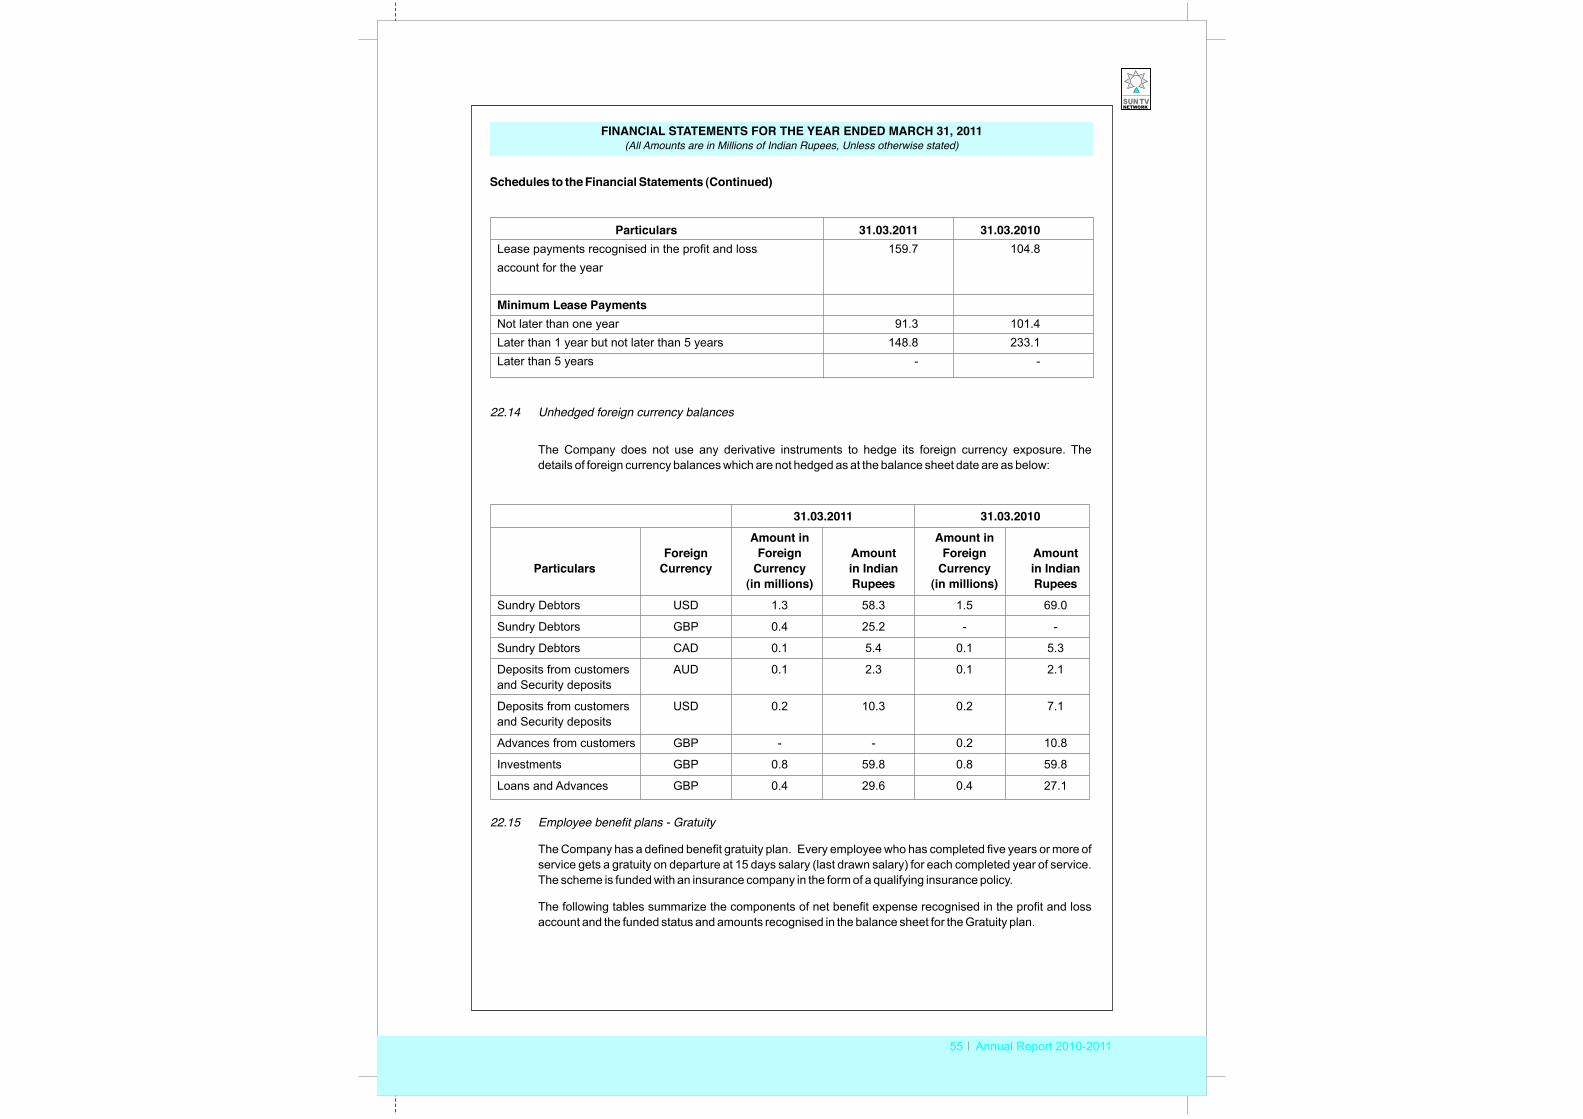
55 Annual Report 2010-2011
FINANCIAL STATEMENTS FOR THE YEAR ENDED MARCH 31, 2011 (All Amounts are in Millions of Indian Rupees, Unless otherwise stated)
22.14 Unhedged foreign currency balances
The Company does not use any derivative instruments to hedge its foreign currency exposure. The details of foreign currency balances which are not hedged as at the balance sheet date are as below:
Schedules to the Financial Statements (Continued)
Particulars 31.03.2011 31.03.2010Lease payments recognised in the profit and loss 159.7account for the year
Minimum Lease PaymentsNot later than one year 91.3 101.4Later than 1 year but not later than 5 years 148.8 233.1Later than 5 years - -
104.8
31.03.2011 31.03.2010Amount in Amount in
Foreign Foreign Amount Foreign AmountParticulars Currency Currency in Indian Currency in Indian
(in millions) Rupees (in millions) RupeesSundry Debtors USD 1.3 58.3 1.5 69.0
Sundry Debtors GBP 0.4 25.2 - -
Sundry Debtors CAD 0.1 5.4 0.1 5.3
Deposits from customers AUD 0.1 2.3 0.1 2.1and Security deposits
Deposits from customers USD 0.2 10.3 0.2 7.1and Security deposits
Advances from customers GBP - - 0.2 10.8
Investments GBP 0.8 59.8 0.8 59.8
Loans and Advances GBP 0.4 29.6 0.4 27.1
22.15 Employee benefit plans - Gratuity
The Company has a defined benefit gratuity plan. Every employee who has completed five years or more of service gets a gratuity on departure at 15 days salary (last drawn salary) for each completed year of service. The scheme is funded with an insurance company in the form of a qualifying insurance policy.
The following tables summarize the components of net benefit expense recognised in the profit and loss account and the funded status and amounts recognised in the balance sheet for the Gratuity plan.
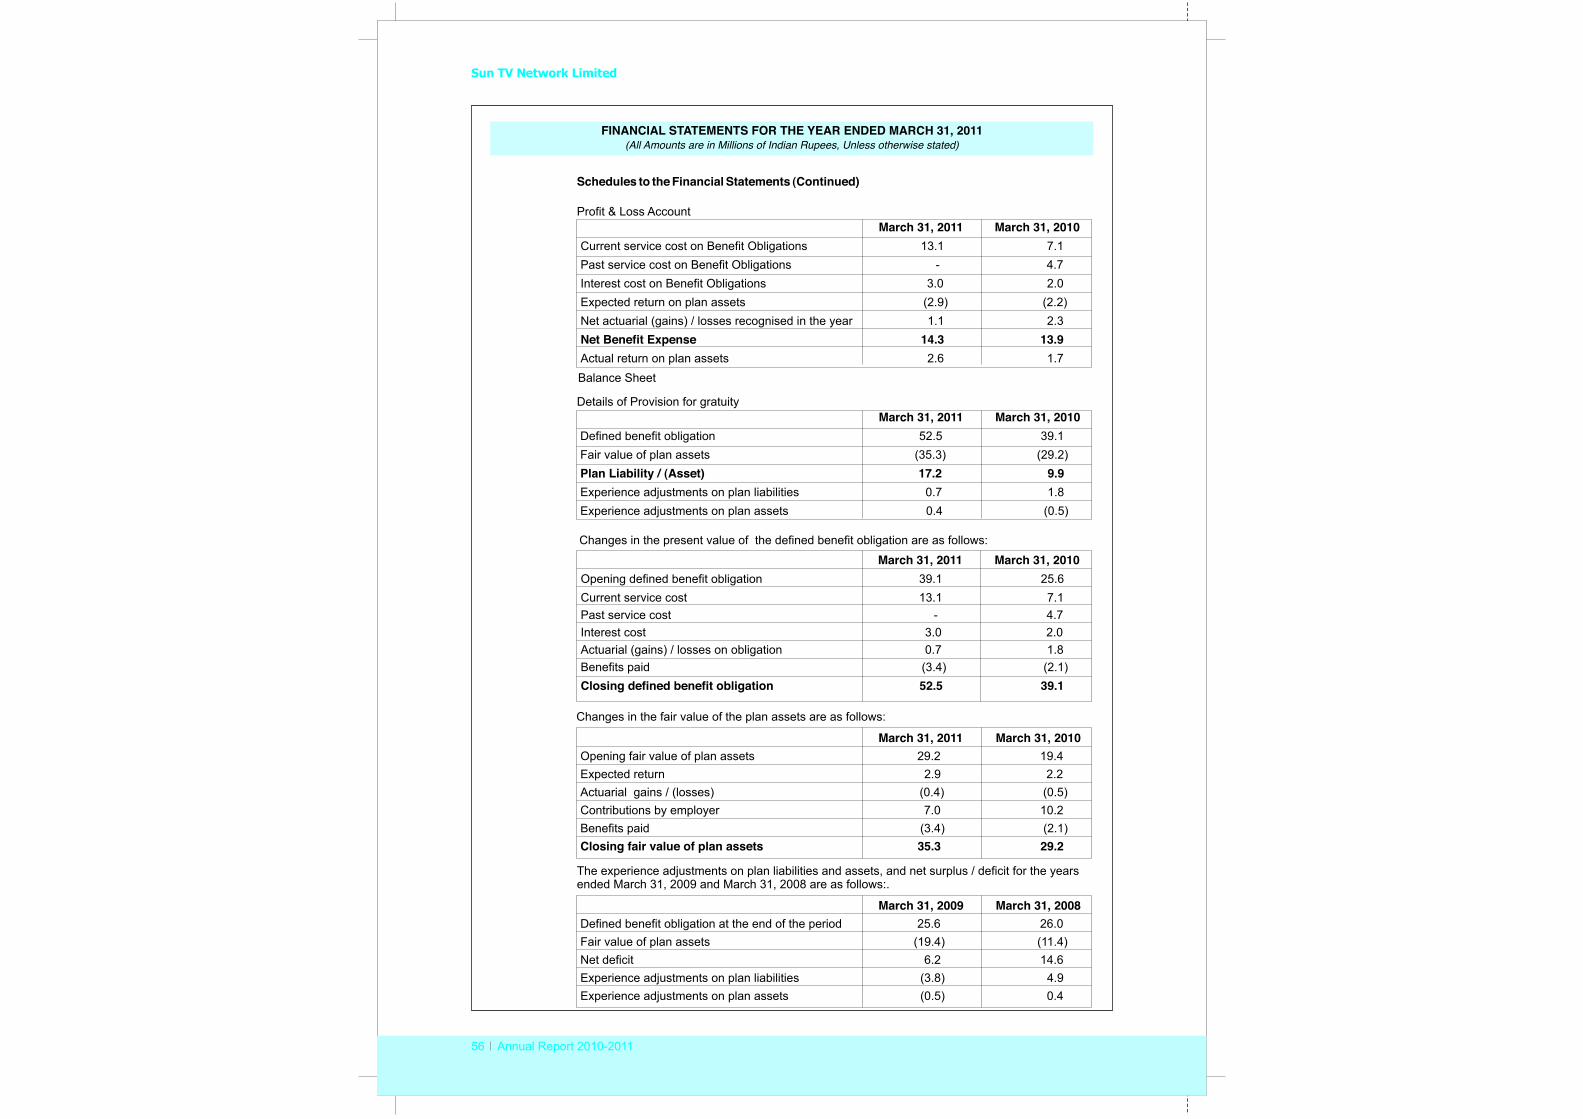
Sun TV Network Limited
56 Annual Report 2010-2011
FINANCIAL STATEMENTS FOR THE YEAR ENDED MARCH 31, 2011 (All Amounts are in Millions of Indian Rupees, Unless otherwise stated)
Schedules to the Financial Statements (Continued)
Profit & Loss AccountMarch 31, 2011
Current service cost on Benefit Obligations 13.1 7.1Past service cost on Benefit Obligations - 4.7Interest cost on Benefit Obligations 3.0 2.0Expected return on plan assets (2.9) (2.2)Net actuarial (gains) / losses recognised in the year 1.1 2.3Net Benefit Expense 14.3 13.9Actual return on plan assets 2.6 1.7
March 31, 2010
Balance Sheet
March 31, 2011Defined benefit obligation 52.5 39.1Fair value of plan assets (35.3) (29.2)Plan Liability / (Asset) 17.2 9.9Experience adjustments on plan liabilities 0.7 1.8Experience adjustments on plan assets 0.4 (0.5)
March 31, 2010Details of Provision for gratuity
March 31, 2011Opening defined benefit obligation 39.1 25.6Current service cost 13.1 7.1Past service cost - 4.7Interest cost 3.0 2.0Actuarial (gains) / losses on obligation 0.7 1.8Benefits paid (3.4) (2.1)Closing defined benefit obligation 52.5 39.1
March 31, 2010Changes in the present value of the defined benefit obligation are as follows:
March 31, 2010Opening fair value of plan assets 29.2 19.4Expected return 2.9 2.2Actuarial gains / (losses) (0.4) (0.5)Contributions by employer 7.0 10.2Benefits paid (3.4) (2.1)Closing fair value of plan assets 35.3 29.2
March 31, 2011Changes in the fair value of the plan assets are as follows:
March 31, 2008Defined benefit obligation at the end of the period 25.6 26.0Fair value of plan assets (19.4) (11.4)Net deficit 6.2 14.6Experience adjustments on plan liabilities (3.8) 4.9Experience adjustments on plan assets (0.5) 0.4
March 31, 2009
The experience adjustments on plan liabilities and assets, and net surplus / deficit for the years ended March 31, 2009 and March 31, 2008 are as follows:.
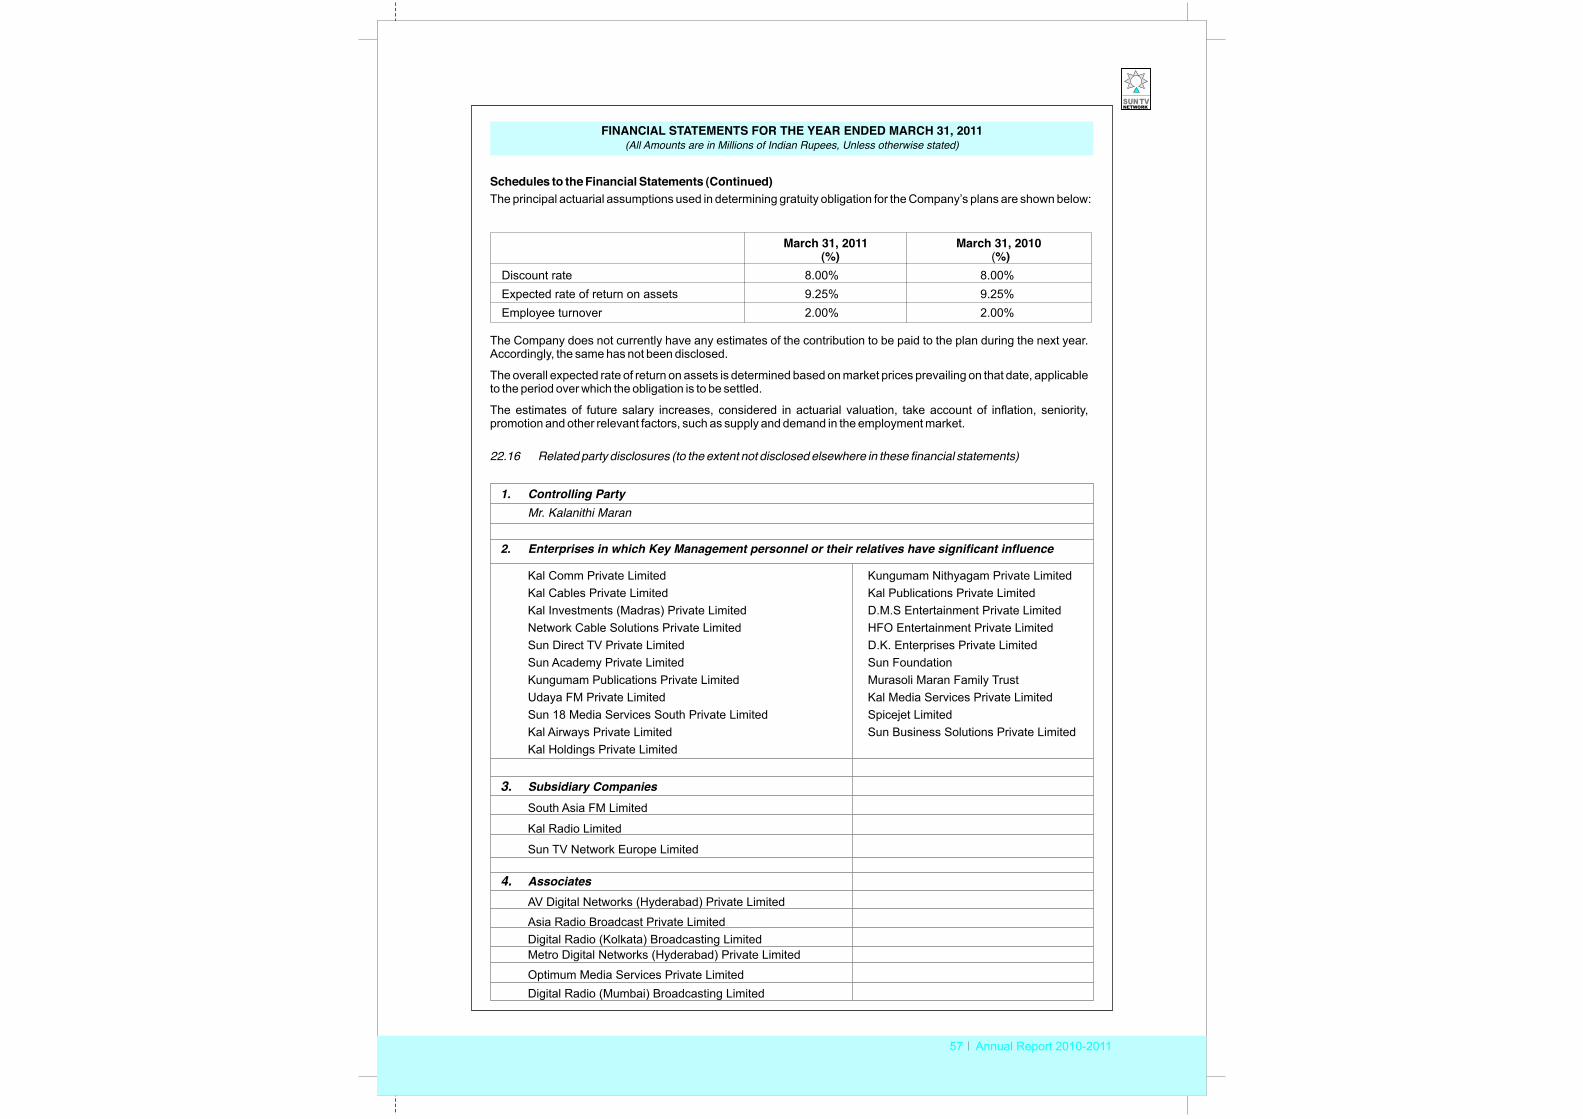
57 Annual Report 2010-2011
FINANCIAL STATEMENTS FOR THE YEAR ENDED MARCH 31, 2011(All Amounts are in Millions of Indian Rupees, Unless otherwise stated)
22.16 Related party disclosures (to the extent not disclosed elsewhere in these financial statements)
Schedules to the Financial Statements (Continued)The principal actuarial assumptions used in determining gratuity obligation for the Company’s plans are shown below:
The Company does not currently have any estimates of the contribution to be paid to the plan during the next year. Accordingly, the same has not been disclosed.
The overall expected rate of return on assets is determined based on market prices prevailing on that date, applicable to the period over which the obligation is to be settled.
The estimates of future salary increases, considered in actuarial valuation, take account of inflation, seniority, promotion and other relevant factors, such as supply and demand in the employment market.
March 31, 2010 (%) (%)
Discount rate 8.00% 8.00%Expected rate of return on assets 9.25% 9.25%Employee turnover 2.00% 2.00%
March 31, 2011
1. Controlling PartyMr. Kalanithi Maran
2. Enterprises in which Key Management personnel or their relatives have significant influence
Kal Cables Private Limited Kal Publications Private LimitedKal Investments (Madras) Private Limited D.M.S Entertainment Private LimitedNetwork Cable Solutions Private Limited HFO Entertainment Private LimitedSun Direct TV Private Limited D.K. Enterprises Private LimitedSun Academy Private Limited Sun FoundationKungumam Publications Private Limited Murasoli Maran Family TrustUdaya FM Private Limited Kal Media Services Private LimitedSun 18 Media Services South Private Limited Spicejet LimitedKal Airways Private Limited Sun Business Solutions Private LimitedKal Holdings Private Limited
3. Subsidiary CompaniesSouth Asia FM Limited
Kal Radio Limited
Sun TV Network Europe Limited
4. AssociatesAV Digital Networks (Hyderabad) Private Limited
Asia Radio Broadcast Private Limited Digital Radio (Kolkata) Broadcasting LimitedMetro Digital Networks (Hyderabad) Private Limited
Optimum Media Services Private LimitedDigital Radio (Mumbai) Broadcasting Limited
Kal Comm Private Limited Kungumam Nithyagam Private Limited
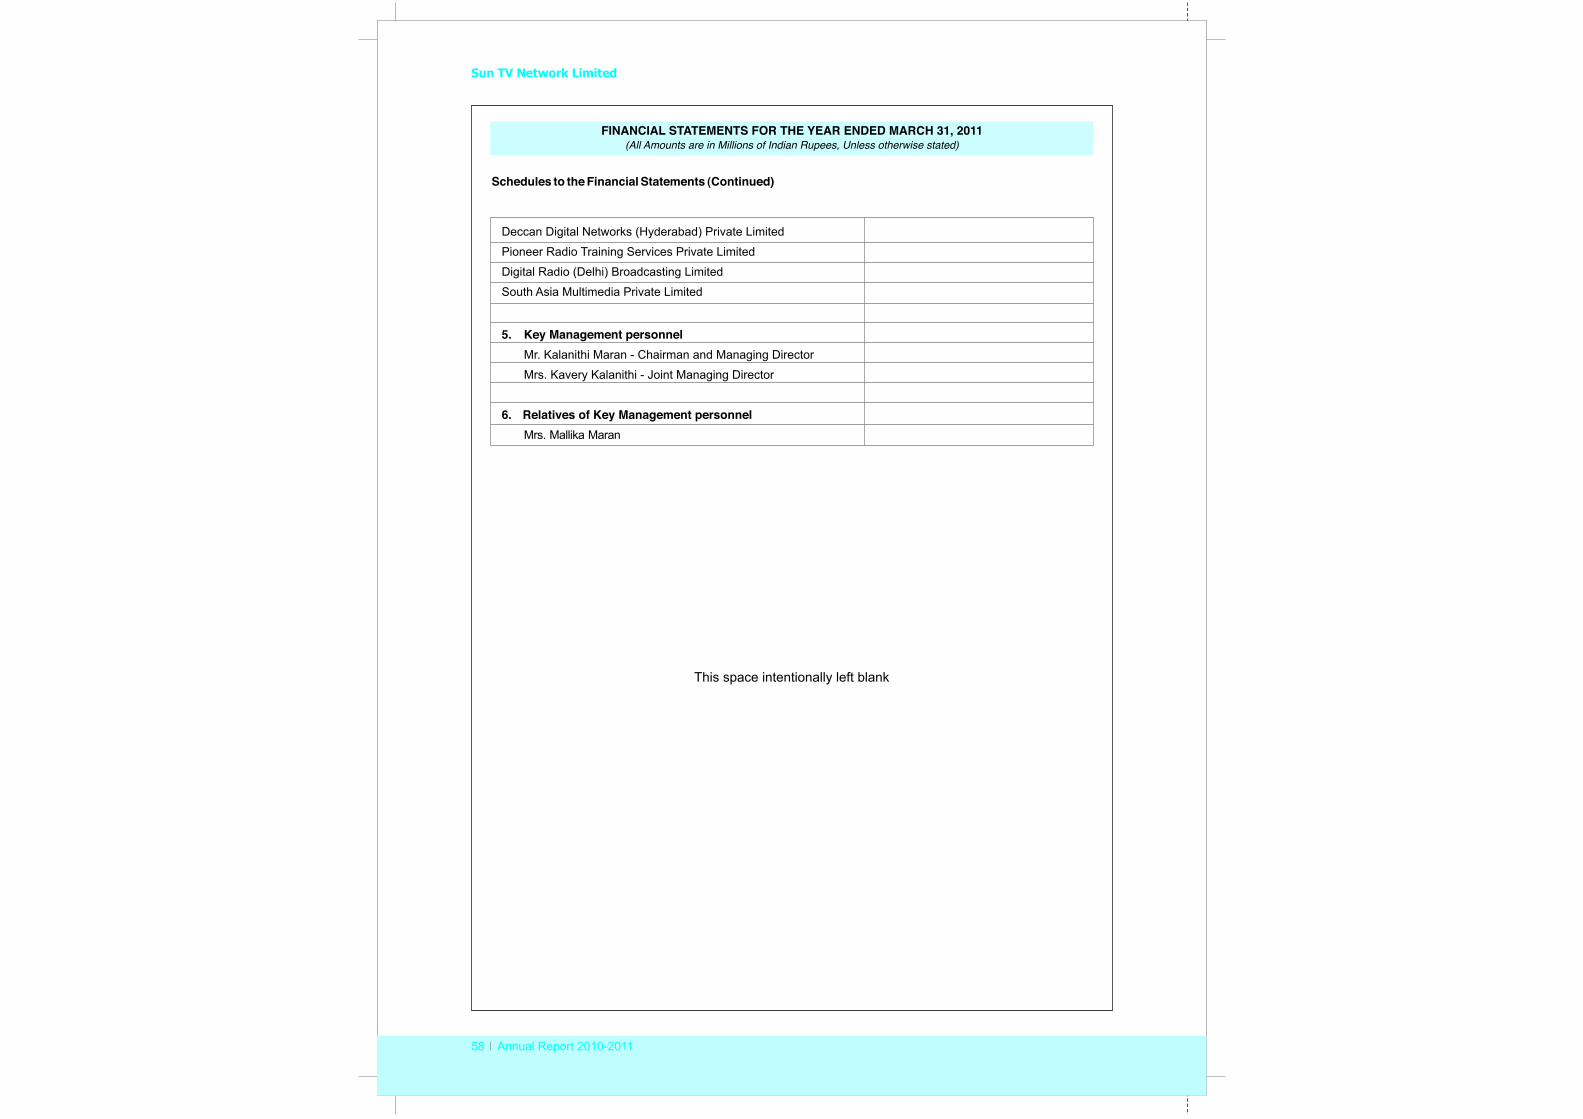
Sun TV Network Limited
58 Annual Report 2010-2011
FINANCIAL STATEMENTS FOR THE YEAR ENDED MARCH 31, 2011(All Amounts are in Millions of Indian Rupees, Unless otherwise stated)
Deccan Digital Networks (Hyderabad) Private Limited
Pioneer Radio Training Services Private Limited
Digital Radio (Delhi) Broadcasting Limited
South Asia Multimedia Private Limited
5. Key Management personnelMr. Kalanithi Maran - Chairman and Managing Director
Mrs. Kavery Kalanithi - Joint Managing Director
6. Relatives of Key Management personnelMrs. Mallika Maran
Schedules to the Financial Statements (Continued)
This space intentionally left blank
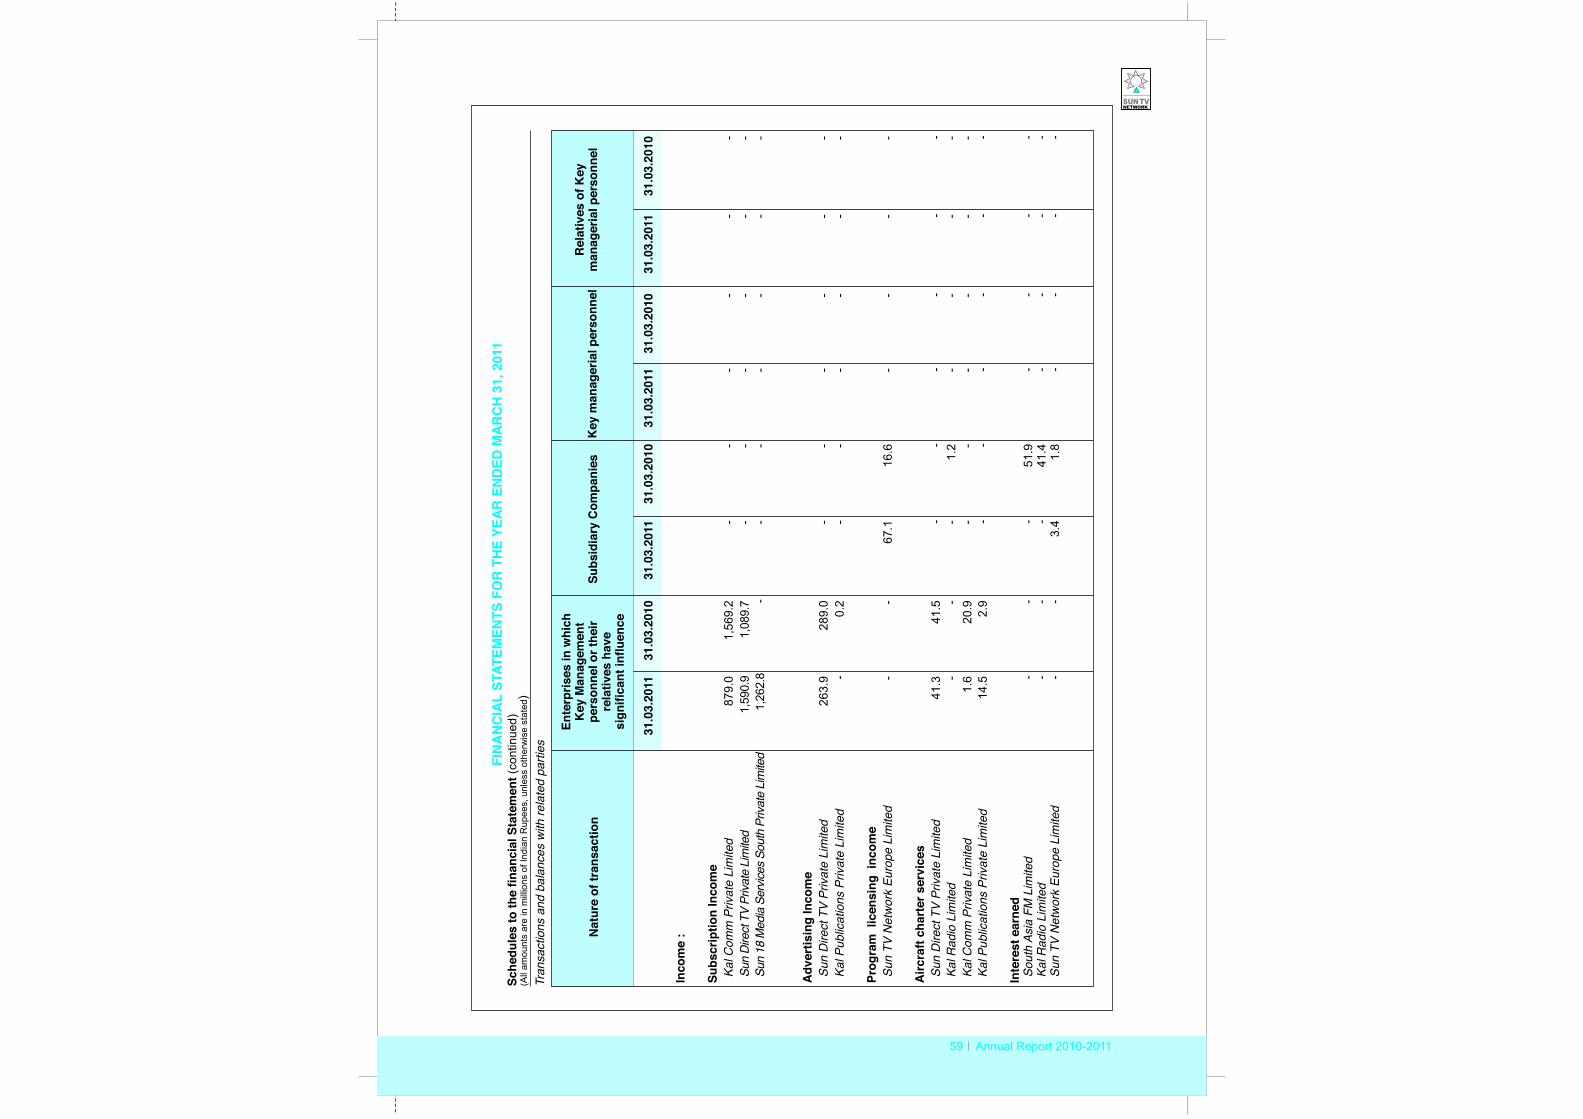
59 Annual Report 2010-2011
Sche
dule
s to
the
finan
cial
Sta
tem
ent (
cont
inue
d)(A
ll am
ount
s ar
e in
mill
ions
of I
ndia
n R
upee
s, u
nles
s ot
herw
ise
stat
ed)
Tran
sact
ions
and
bal
ance
s w
ith re
late
d pa
rties
Nat
ure
of tr
ansa
ctio
nR
elat
ives
of K
eym
anag
eria
l per
sonn
el
FIN
AN
CIA
L ST
ATEM
ENTS
FO
R T
HE
YEA
R E
ND
ED M
AR
CH
31,
201
1
Ente
rpris
es in
whi
ch
Key
Man
agem
ent
pers
onne
l or t
heir
rela
tives
hav
e si
gnifi
cant
influ
ence
Subs
idia
ry C
ompa
nies
Key
man
ager
ial p
erso
nnel
31.0
3.20
1131
.03.
2010
31.0
3.20
1131
.03.
2010
31.0
3.20
1131
.03.
2010
31.0
3.20
1131
.03.
2010
Inco
me
:
Subs
crip
tion
Inco
me
Kal C
omm
Priv
ate
Lim
ited
879.
0-
--
--
-Su
n Di
rect
TV
Priva
te L
imite
d1,
590.
91,
089.
7Su
n 18
Med
ia S
ervic
es S
outh
Priv
ate
Lim
ited
1,26
2.8
-
-
--
--
-
Adv
ertis
ing
Inco
me
Sun
Dire
ct T
V Pr
ivat
e Li
mite
d26
3.9
289.
0-
--
--
-Ka
l Pub
licat
ions
Priv
ate
Lim
ited
-0.
2-
--
--
-
Prog
ram
lic
ensi
ng i
ncom
eSu
n TV
Net
wor
k Eu
rope
Lim
ited
--
67.1
16.6
--
--
Airc
raft
char
ter s
ervi
ces
Sun
Dire
ct T
V Pr
ivat
e Li
mite
d41
.341
.5-
--
--
-Ka
l Rad
io L
imite
d-
--
1.2
--
--
Kal C
omm
Priv
ate
Lim
ited
1.6
20.9
--
--
--
Kal P
ublic
atio
ns P
rivat
e Li
mite
d14
.52.
9-
--
--
-
Inte
rest
ear
ned
Sout
h As
ia F
M L
imite
d-
--
51.9
--
--
Kal R
adio
Lim
ited
--
-41
.4-
--
-Su
n TV
Net
wor
k Eu
rope
Lim
ited
--
3.4
1.8
--
--
1,56
9.2
--
--
--
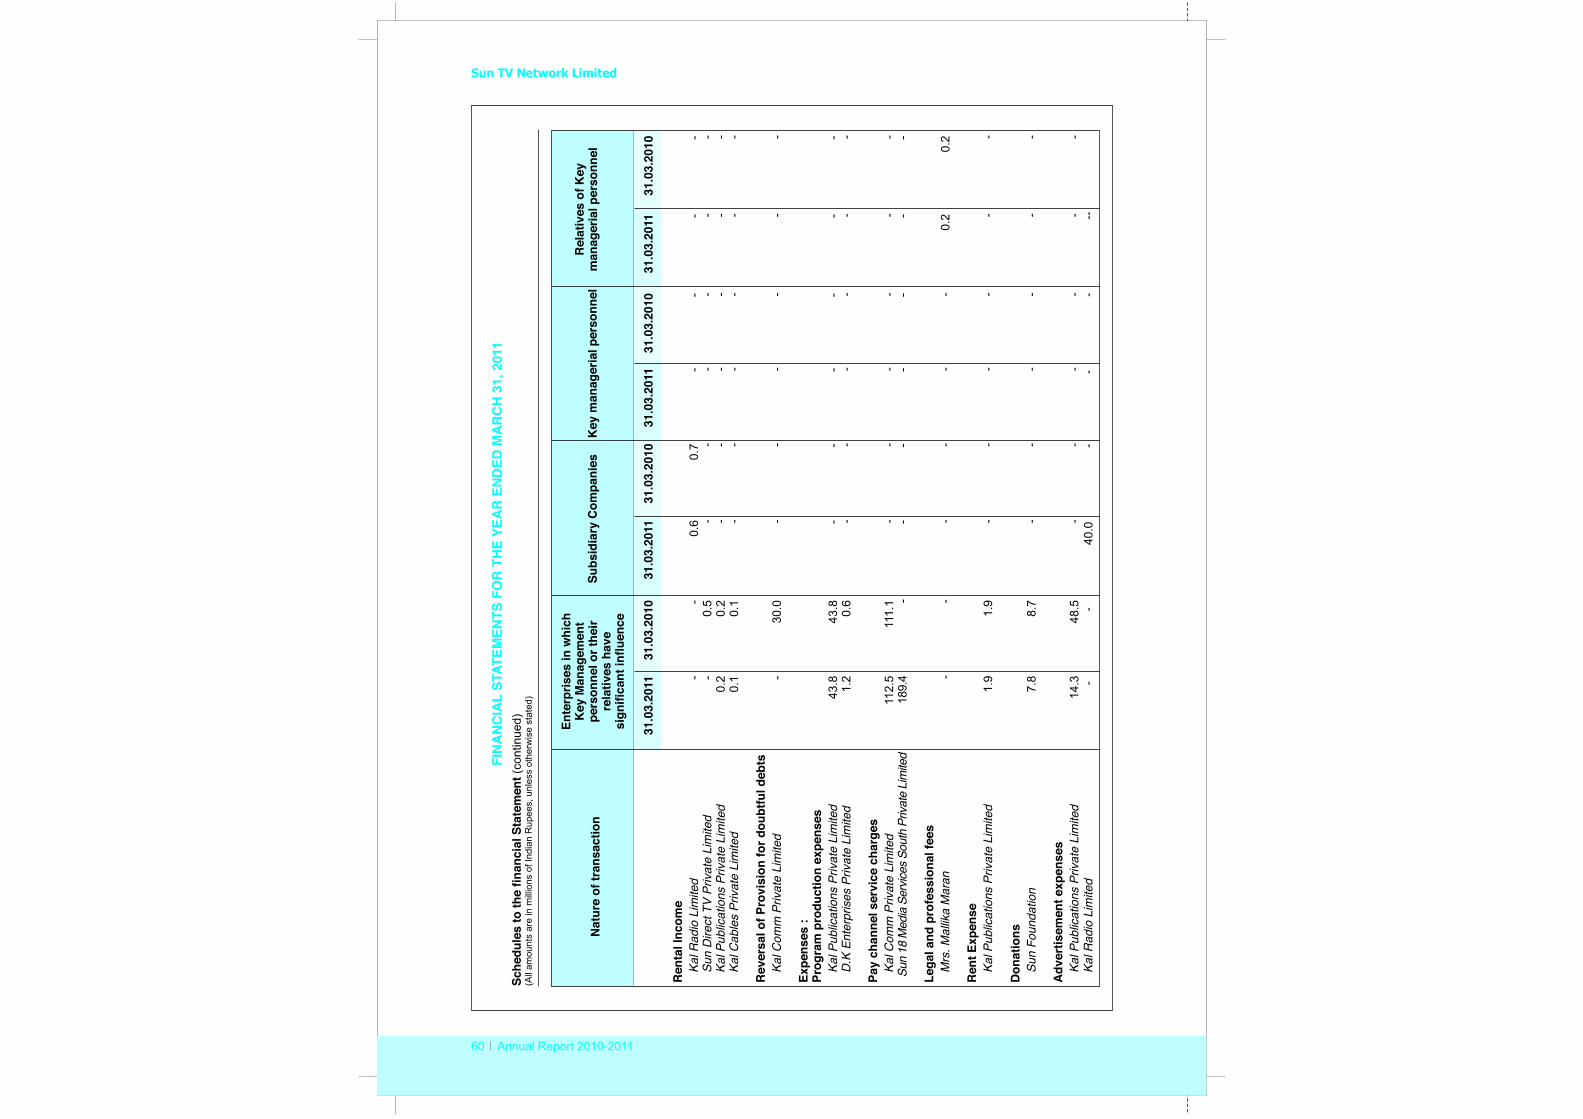
Sun TV Network Limited
60 Annual Report 2010-2011
Sche
dule
s to
the
finan
cial
Sta
tem
ent (
cont
inue
d)(A
ll am
ount
s ar
e in
mill
ions
of I
ndia
n R
upee
s, u
nles
s ot
herw
ise
stat
ed)
Nat
ure
of tr
ansa
ctio
nR
elat
ives
of K
eym
anag
eria
l per
sonn
el
FIN
AN
CIA
L ST
ATEM
ENTS
FO
R T
HE
YEA
R E
ND
ED M
AR
CH
31,
201
1
Ente
rpris
es in
whi
ch
Key
Man
agem
ent
pers
onne
l or t
heir
rela
tives
hav
e si
gnifi
cant
influ
ence
Subs
idia
ry C
ompa
nies
Key
man
ager
ial p
erso
nnel
31.0
3.20
1131
.03.
2010
31.0
3.20
1131
.03.
2010
31.0
3.20
1131
.03.
2010
31.0
3.20
1131
.03.
2010
Ren
tal I
ncom
eKa
l Rad
io L
imite
d-
-0.
60.
7-
--
-Su
n D
irect
TV
Priv
ate
Lim
ited
-0.
5-
--
--
-Ka
l Pub
licat
ions
Priv
ate
Lim
ited
0.2
0.2
--
--
--
Kal C
able
s Pr
ivat
e Li
mite
d0.
10.
1-
--
--
-
Rev
ersa
l of P
rovi
sion
for d
oubt
ful d
ebts
Kal C
omm
Priv
ate
Lim
ited
-30
.0-
--
--
-
Expe
nses
:Pr
ogra
m p
rodu
ctio
n ex
pens
esKa
l Pub
licat
ions
Priv
ate
Lim
ited
43.8
43.8
--
--
--
D.K
Ent
erpr
ises
Priv
ate
Lim
ited
1.2
0.6
--
--
--
Pay
chan
nel s
ervi
ce c
harg
esKa
l Com
m P
rivat
e Li
mite
d11
2.5
111.
1-
--
--
- S
un 1
8 M
edia
Ser
vices
Sou
th P
rivat
e Li
mite
d
1
89.4
-
--
--
--
Lega
l and
pro
fess
iona
l fee
sM
rs. M
allik
a M
aran
--
--
--
0.2
0.2
Ren
t Exp
ense
Kal P
ublic
atio
ns P
rivat
e Li
mite
d1.
91.
9-
--
--
-
Don
atio
nsSu
n Fo
unda
tion
7.8
8.7
--
--
--
Adv
ertis
emen
t exp
ense
sKa
l Pub
licat
ions
Priv
ate
Lim
ited
14.3
48.5
--
--
--
Ka
l Rad
io L
imite
d
-
-
40.0
-
-
-
--
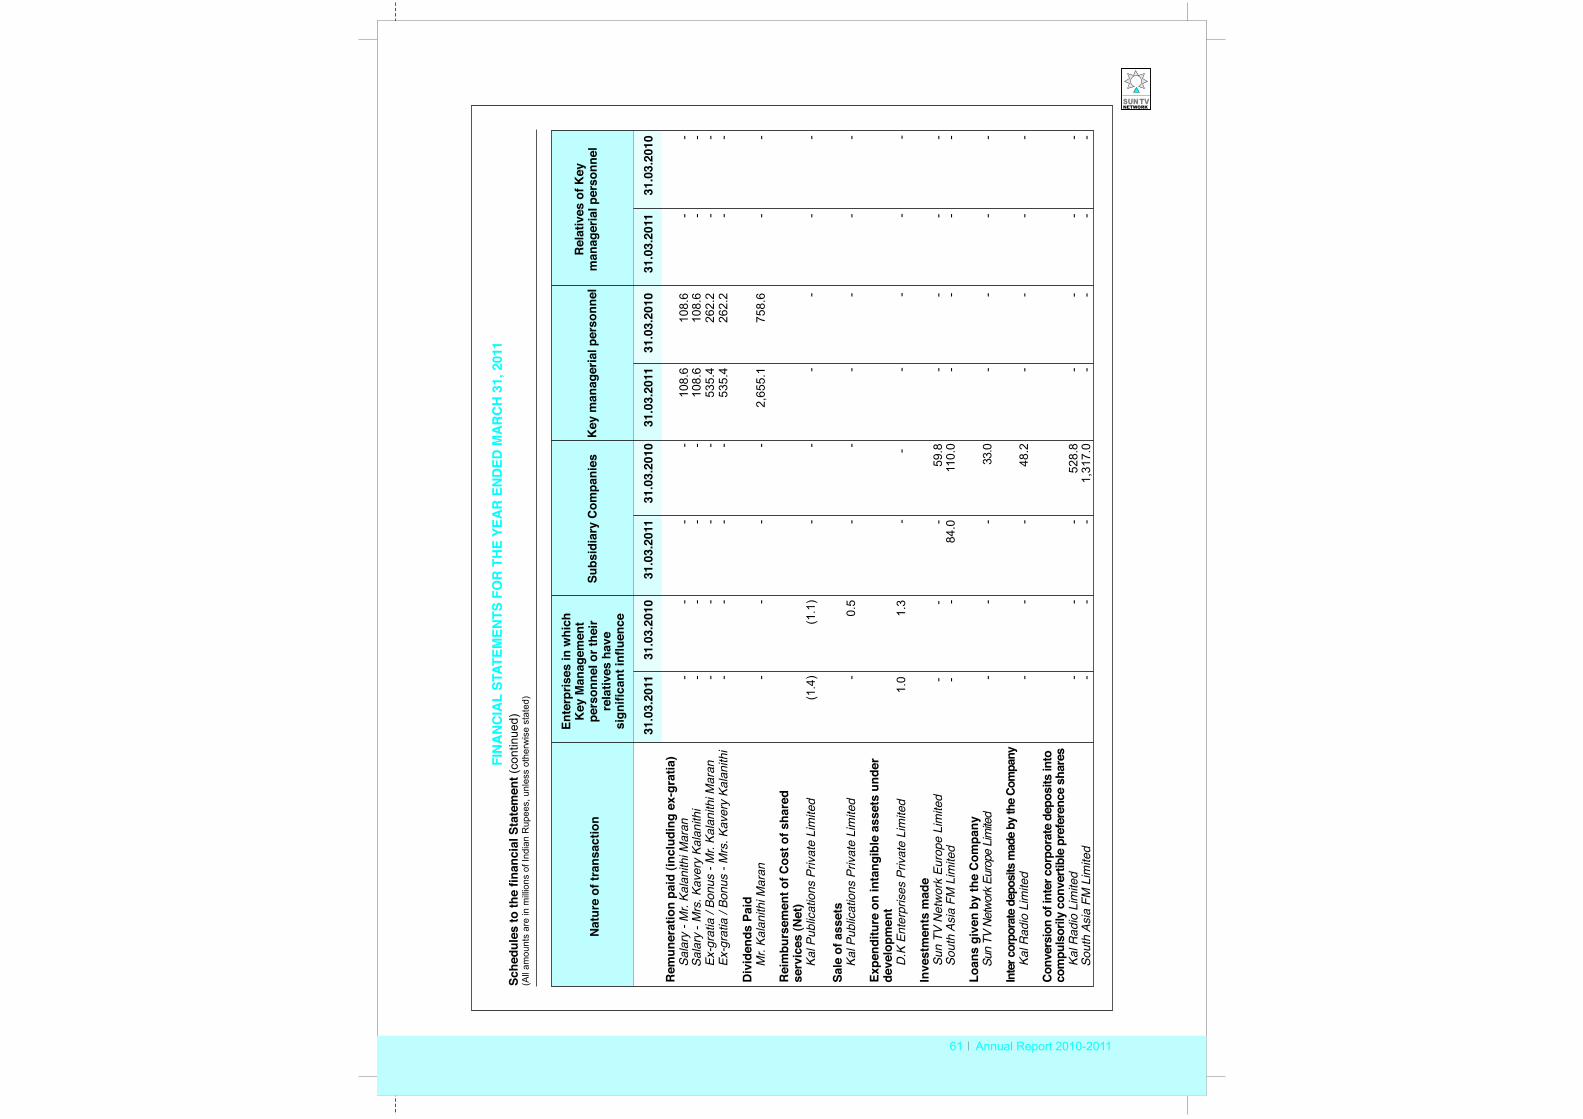
61 Annual Report 2010-2011
Sche
dule
s to
the
finan
cial
Sta
tem
ent (
cont
inue
d)(A
ll am
ount
s ar
e in
mill
ions
of I
ndia
n R
upee
s, u
nles
s ot
herw
ise
stat
ed)
Nat
ure
of tr
ansa
ctio
nR
elat
ives
of K
eym
anag
eria
l per
sonn
el
FIN
AN
CIA
L ST
ATEM
ENTS
FO
R T
HE
YEA
R E
ND
ED M
AR
CH
31,
201
1
Ente
rpris
es in
whi
ch
Key
Man
agem
ent
pers
onne
l or t
heir
rela
tives
hav
e si
gnifi
cant
influ
ence
Subs
idia
ry C
ompa
nies
Key
man
ager
ial p
erso
nnel
31.0
3.20
1131
.03.
2010
31.0
3.20
1131
.03.
2010
31.0
3.20
1131
.03.
2010
31.0
3.20
1131
.03.
2010
Rem
uner
atio
n pa
id (i
nclu
ding
ex-
grat
ia)
Sala
ry -
Mr.
Kala
nith
i Mar
an-
--
-10
8.6
--
Sala
ry -
Mrs
. Kav
ery
Kala
nith
i-
108.
610
8.6
Ex-g
ratia
/ Bo
nus
- Mr.
Kala
nith
i Mar
an-
--
-53
5.4
262.
2-
-Ex
-gra
tia /
Bonu
s - M
rs. K
aver
y Ka
lani
thi
--
--
535.
426
2.2
--
Div
iden
ds P
aid
Mr.
Kala
nith
i Mar
an-
--
-2,
655.
175
8.6
--
Rei
mbu
rsem
ent o
f Cos
t of s
hare
d se
rvic
es (N
et)
Kal P
ublic
atio
ns P
rivat
e Li
mite
d(1
.4)
(1.1
)-
--
--
-
Sale
of a
sset
sKa
l Pub
licat
ions
Priv
ate
Lim
ited
-
0.5
--
--
--
Expe
nditu
re o
n in
tang
ible
ass
ets
unde
r de
velo
pmen
t
D.K
Ent
erpr
ises
Priv
ate
Lim
ited
1.0
1.3
-
-
-
-
-
-
Inve
stm
ents
mad
e
Sun
TV
Net
wor
k Eu
rope
Lim
ited
-
-
-
59.
8
-
-
-
-
S
outh
Asi
a FM
Lim
ited
--
84.0
110.
0-
--
-
Loan
s gi
ven
by th
e C
ompa
ny
Sun
TV
Netw
ork E
urop
e Lim
ited
-
--
33.0
--
--
Inte
r cor
pora
te d
epos
its m
ade
by th
e Co
mpa
ny
Kal
Rad
io L
imite
d
--
-48
.2-
--
-
Conv
ersi
on o
f int
er c
orpo
rate
dep
osits
into
com
puls
orily
con
verti
ble
pref
eren
ce s
hare
s
Kal
Rad
io L
imite
d
-
--
528.
8-
--
-So
uth
Asia
FM
Lim
ited
-
--
1,31
7.0
--
--
108.
6-
--
--
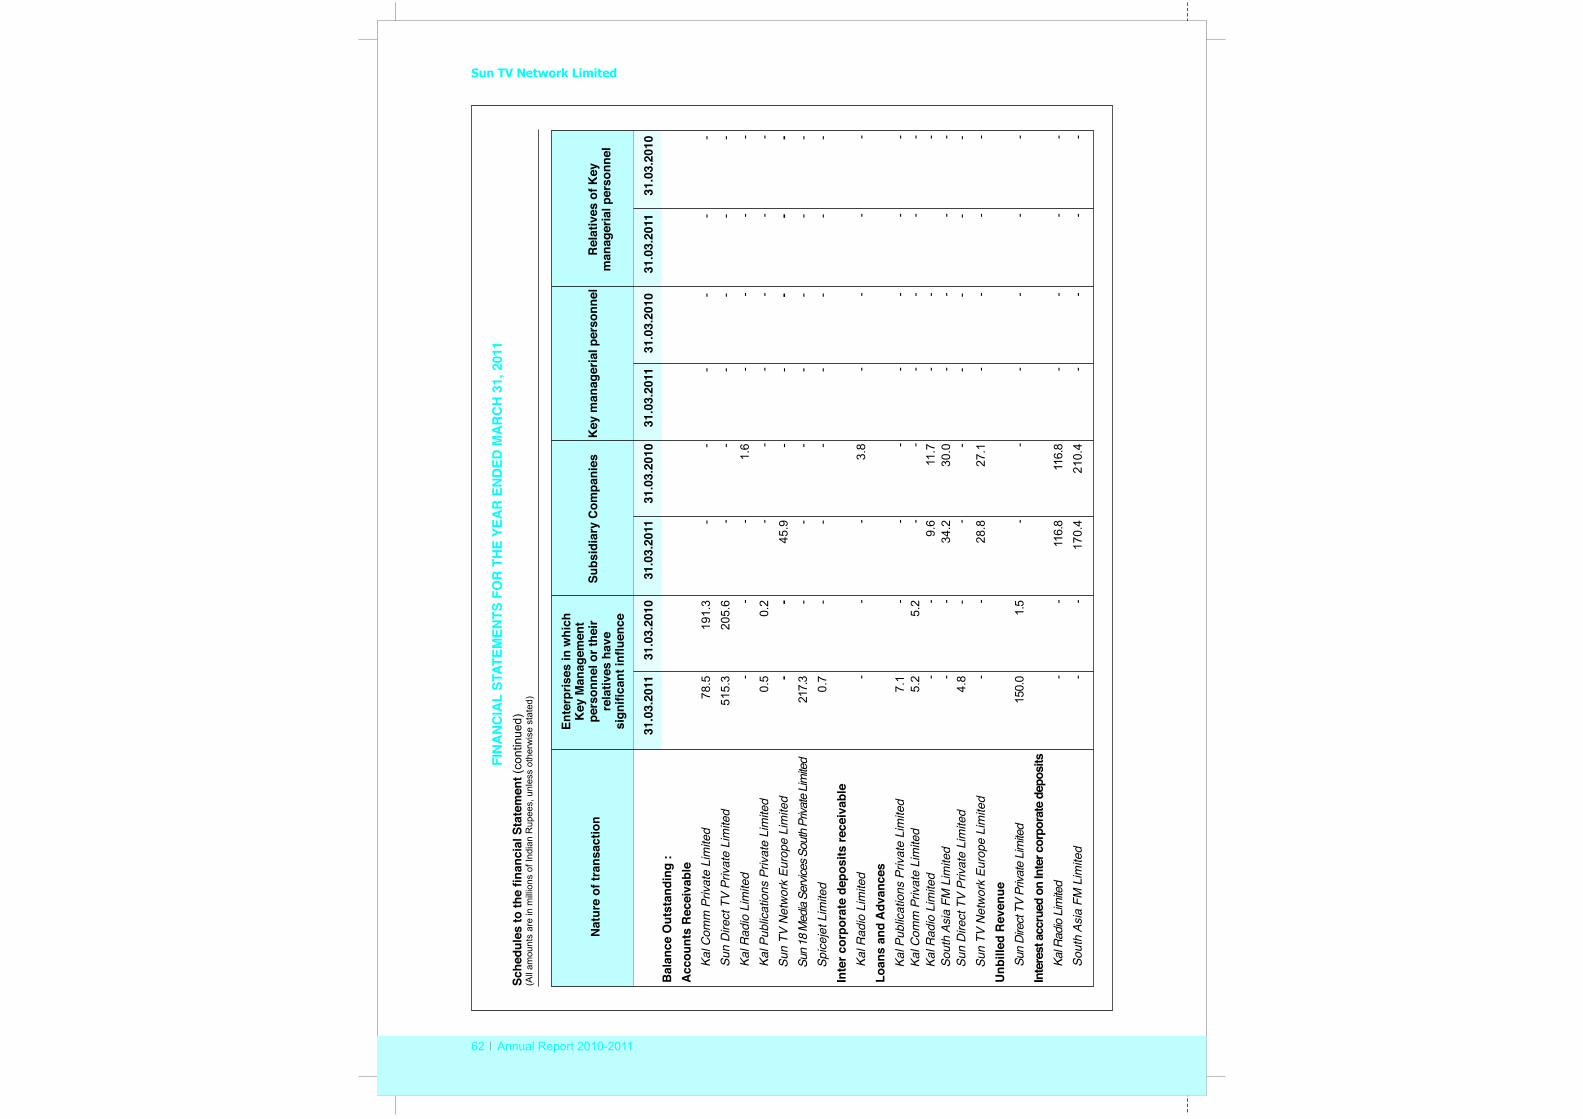
Sun TV Network Limited
62 Annual Report 2010-2011
Sche
dule
s to
the
finan
cial
Sta
tem
ent (
cont
inue
d)(A
ll am
ount
s ar
e in
mill
ions
of I
ndia
n R
upee
s, u
nles
s ot
herw
ise
stat
ed)
Nat
ure
of tr
ansa
ctio
nR
elat
ives
of K
eym
anag
eria
l per
sonn
el
FIN
AN
CIA
L ST
ATEM
ENTS
FO
R T
HE
YEA
R E
ND
ED M
AR
CH
31,
201
1
Ente
rpris
es in
whi
ch
Key
Man
agem
ent
pers
onne
l or t
heir
rela
tives
hav
e si
gnifi
cant
influ
ence
Subs
idia
ry C
ompa
nies
Key
man
ager
ial p
erso
nnel
31.0
3.20
1131
.03.
2010
31.0
3.20
1131
.03.
2010
31.0
3.20
1131
.03.
2010
31.0
3.20
1131
.03.
2010
Bal
ance
Out
stan
ding
:A
ccou
nts
Rec
eiva
ble
78.5
191.
3-
--
--
Sun
Dire
ct T
V Pr
ivat
e Li
mite
d51
5.3
205.
6-
--
--
-Ka
l Rad
io L
imite
d-
--
1.6
--
--
Kal P
ublic
atio
ns P
rivat
e Li
mite
d0.
50.
2-
--
--
-Su
n TV
Net
wor
k Eu
rope
Lim
ited
--
45.9
--
--
-
Sun
18 M
edia
Ser
vices
Sou
th P
rivat
e Lim
ited
217.
3-
--
--
--
Sp
icej
et L
imite
d0.
7-
--
--
--
Inte
r cor
pora
te d
epos
its re
ceiv
able
Kal R
adio
Lim
ited
--
-3.
8-
--
-Lo
ans
and
Adv
ance
sKa
l Pub
licat
ions
Priv
ate
Lim
ited
7.1
--
--
--
-Ka
l Com
m P
rivat
e Li
mite
d5.
25.
2-
--
--
-Ka
l Rad
io L
imite
d-
-9.
611
.7-
--
Sout
h As
ia F
M L
imite
d-
-34
.230
.0-
--
-Su
n D
irect
TV
Priv
ate
Lim
ited
4.8
--
--
--
-Su
n TV
Net
wor
k Eu
rope
Lim
ited
--
28.8
27.1
--
--
Unb
illed
Rev
enue
Sun
Dire
ct T
V Pr
ivate
Lim
ited
150.
01.
5-
--
--
-In
tere
st ac
crue
d on
Inte
r cor
pora
te d
epos
itsKa
l Rad
io Li
mite
d-
-11
6.8
116.
8-
--
-So
uth
Asia
FM
Lim
ited
--
170.
421
0.4
--
--
Kal C
omm
Priv
ate
Lim
ited
-
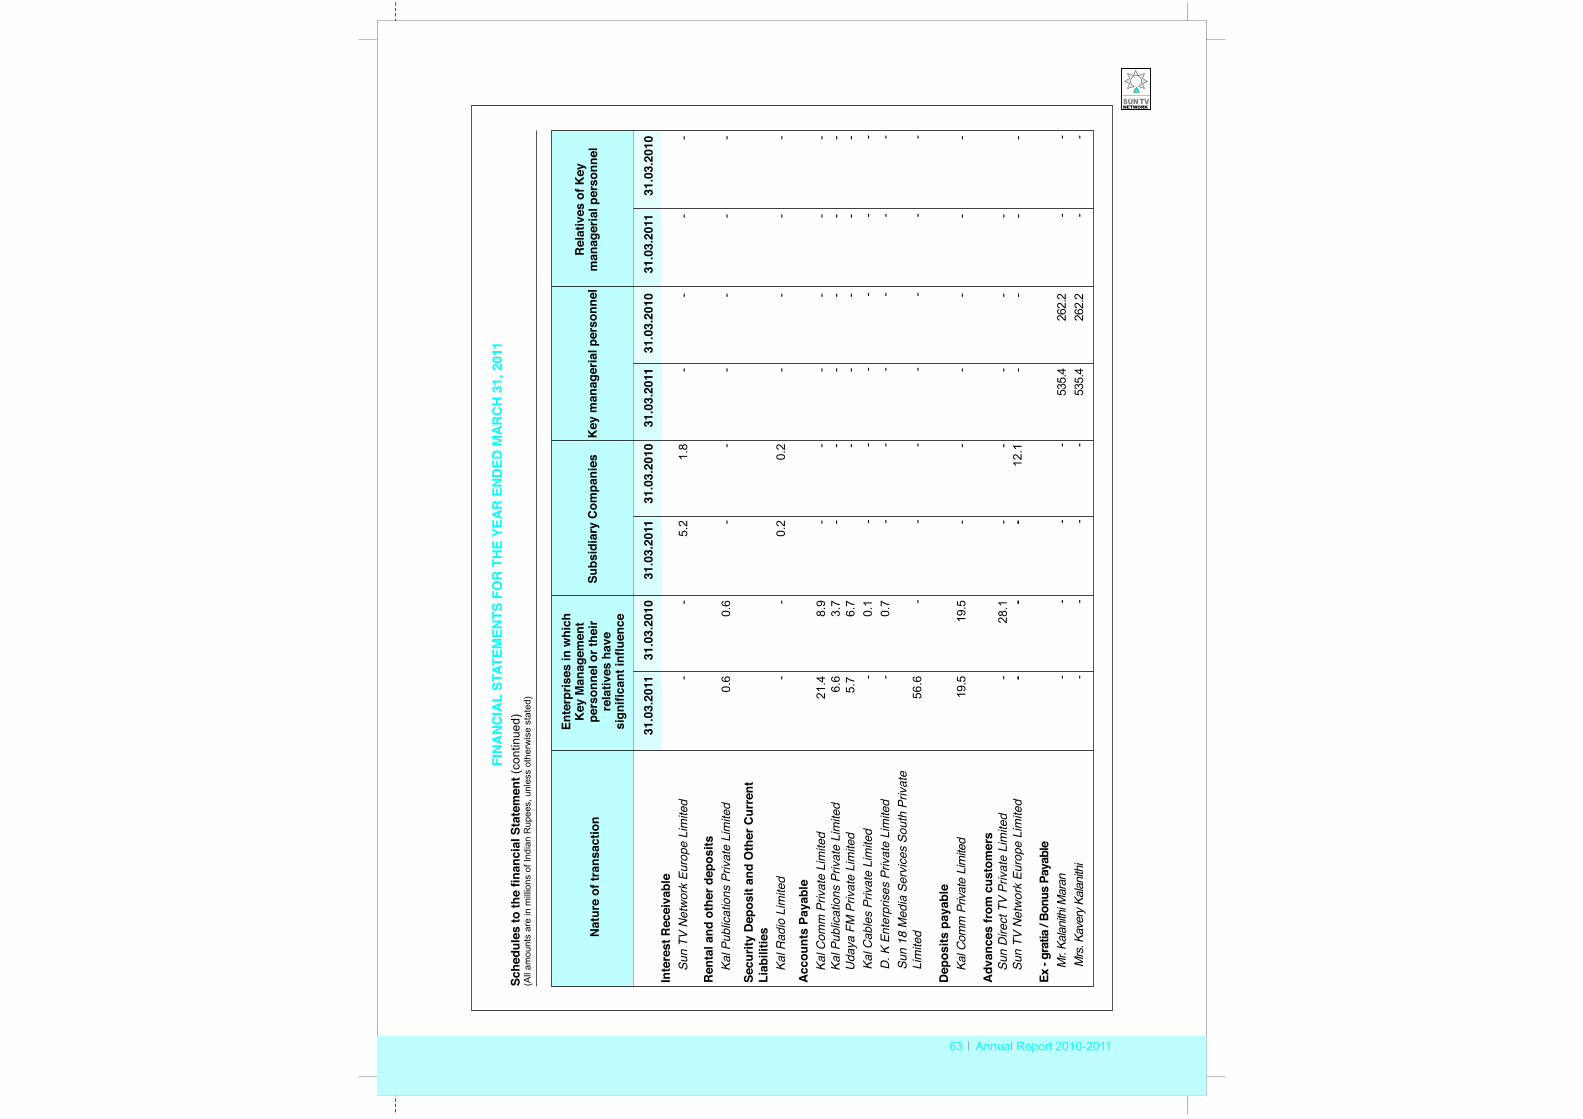
63 Annual Report 2010-2011
Sche
dule
s to
the
finan
cial
Sta
tem
ent (
cont
inue
d)(A
ll am
ount
s ar
e in
mill
ions
of I
ndia
n R
upee
s, u
nles
s ot
herw
ise
stat
ed)
Nat
ure
of tr
ansa
ctio
nR
elat
ives
of K
eym
anag
eria
l per
sonn
el
FIN
AN
CIA
L ST
ATEM
ENTS
FO
R T
HE
YEA
R E
ND
ED M
AR
CH
31,
201
1
Ente
rpris
es in
whi
ch
Key
Man
agem
ent
pers
onne
l or t
heir
rela
tives
hav
e si
gnifi
cant
influ
ence
Subs
idia
ry C
ompa
nies
Key
man
ager
ial p
erso
nnel
31.0
3.20
1131
.03.
2010
31.0
3.20
1131
.03.
2010
31.0
3.20
1131
.03.
2010
31.0
3.20
1131
.03.
2010
Inte
rest
Rec
eiva
ble
Sun
TV N
etw
ork
Euro
pe L
imite
d
Ren
tal a
nd o
ther
dep
osits
Kal P
ublic
atio
ns P
rivat
e Li
mite
d0.
60.
6-
--
--
-
Secu
rity
Dep
osit
and
Oth
er C
urre
nt
Liab
ilitie
sKa
l Rad
io L
imite
d-
-0.
20.
2-
--
-
Acc
ount
s Pa
yabl
eKa
l Com
m P
rivat
e Li
mite
d21
.48.
9-
--
--
-Ka
l Pub
licat
ions
Priv
ate
Lim
ited
6.6
3.7
--
--
--
Uda
ya F
M P
rivat
e Li
mite
d
5.7
6.7
--
--
-
Kal
Cab
les
Priv
ate
Lim
ited
-0.
1-
--
--
-
D. K
Ent
erpr
ises
Priv
ate
Lim
ited
-0.
7-
--
--
-
Sun
18
Med
ia S
ervi
ces
Sout
h Pr
ivat
e Li
mite
d
56.6
--
--
--
-
Dep
osits
pay
able
Ka
l Com
m P
rivat
e Li
mite
d19
.519
.5-
--
--
-
Adv
ance
s fr
om c
usto
mer
sSu
n D
irect
TV
Priv
ate
Lim
ited
-28
.1-
--
--
Sun
TV N
etw
ork
Euro
pe L
imite
d
--
-12
.1-
--
-
Ex -
grat
ia / B
onus
Pay
able
Mr.
Kalan
ithi M
aran
--
--
535.
426
2.2
--
M
rs. K
aver
y Kala
nithi
--
--
535.
426
2.2
--
--
5.2
1.8
--
--
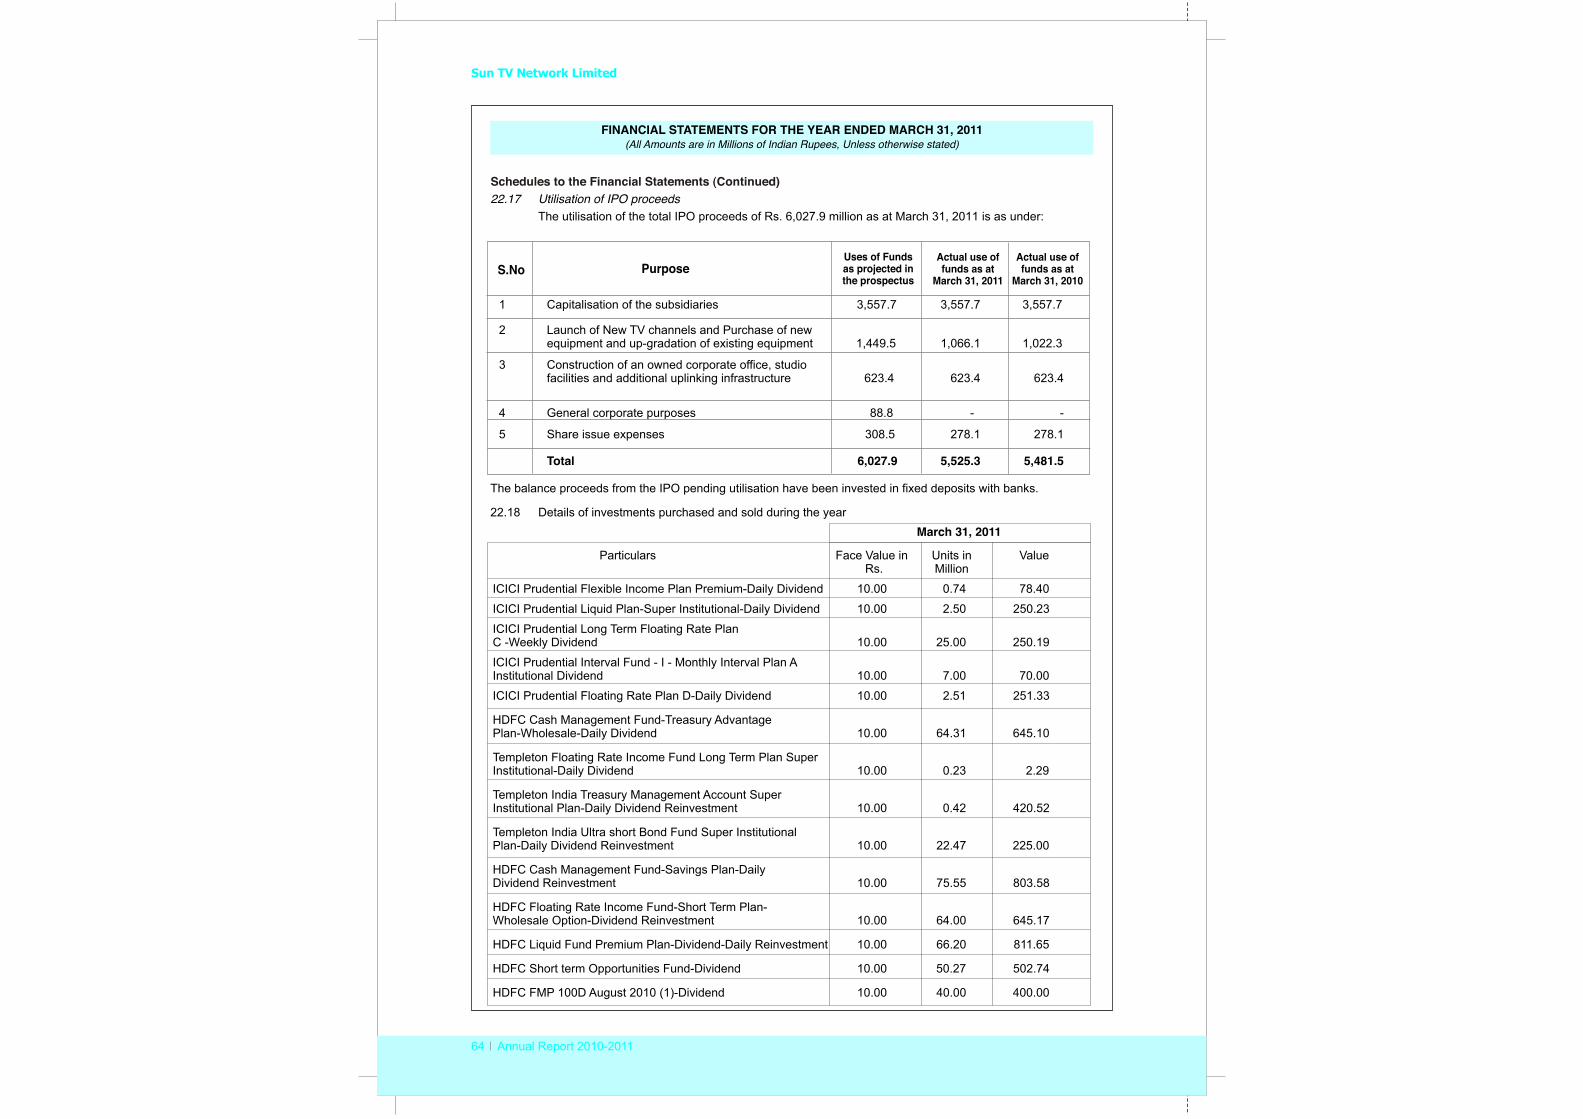
Sun TV Network Limited
64 Annual Report 2010-2011
FINANCIAL STATEMENTS FOR THE YEAR ENDED MARCH 31, 2011 (All Amounts are in Millions of Indian Rupees, Unless otherwise stated)
Schedules to the Financial Statements (Continued)22.17 Utilisation of IPO proceeds
The utilisation of the total IPO proceeds of Rs. 6,027.9 million as at March 31, 2011 is as under:
1 Capitalisation of the subsidiaries 3,557.7
2 Launch of New TV channels and Purchase of new equipment and up-gradation of existing equipment 1,449.5 1,022.3
3 Construction of an owned corporate office, studio facilities and additional uplinking infrastructure 623.4 623.4 623.4
4 General corporate purposes 88.8 - -
5 Share issue expenses 308.5 278.1 278.1
Total 6,027.9
3,557.7 3,557.7
5,481.5
1,066.1
5,525.3
Uses of Funds as projected in the prospectus
S.No PurposeActual use of funds as at
March 31, 2011
Actual use of funds as at
March 31, 2010
The balance proceeds from the IPO pending utilisation have been invested in fixed deposits with banks.
22.18 Details of investments purchased and sold during the year
Particulars Face Value in Units in ValueRs. Million
ICICI Prudential Flexible Income Plan Premium-Daily Dividend 10.00 0.74 78.40
ICICI Prudential Liquid Plan-Super Institutional-Daily Dividend 10.00 2.50 250.23
ICICI Prudential Long Term Floating Rate Plan C -Weekly Dividend 10.00 25.00 250.19
ICICI Prudential Interval Fund - I - Monthly Interval Plan AInstitutional Dividend 10.00 7.00 70.00
ICICI Prudential Floating Rate Plan D-Daily Dividend 10.00 2.51 251.33
HDFC Cash Management Fund-Treasury Advantage Plan-Wholesale-Daily Dividend 10.00 64.31 645.10
Templeton Floating Rate Income Fund Long Term Plan Super Institutional-Daily Dividend 10.00 0.23 2.29
Templeton India Treasury Management Account Super Institutional Plan-Daily Dividend Reinvestment 10.00 0.42 420.52
Templeton India Ultra short Bond Fund Super InstitutionalPlan-Daily Dividend Reinvestment 10.00 22.47 225.00
HDFC Cash Management Fund-Savings Plan-Daily Dividend Reinvestment 10.00 75.55 803.58
HDFC Floating Rate Income Fund-Short Term Plan-Wholesale Option-Dividend Reinvestment 10.00 64.00 645.17
HDFC Liquid Fund Premium Plan-Dividend-Daily Reinvestment 10.00 66.20 811.65
HDFC Short term Opportunities Fund-Dividend 10.00 50.27 502.74
HDFC FMP 100D August 2010 (1)-Dividend 10.00 40.00 400.00
March 31, 2011
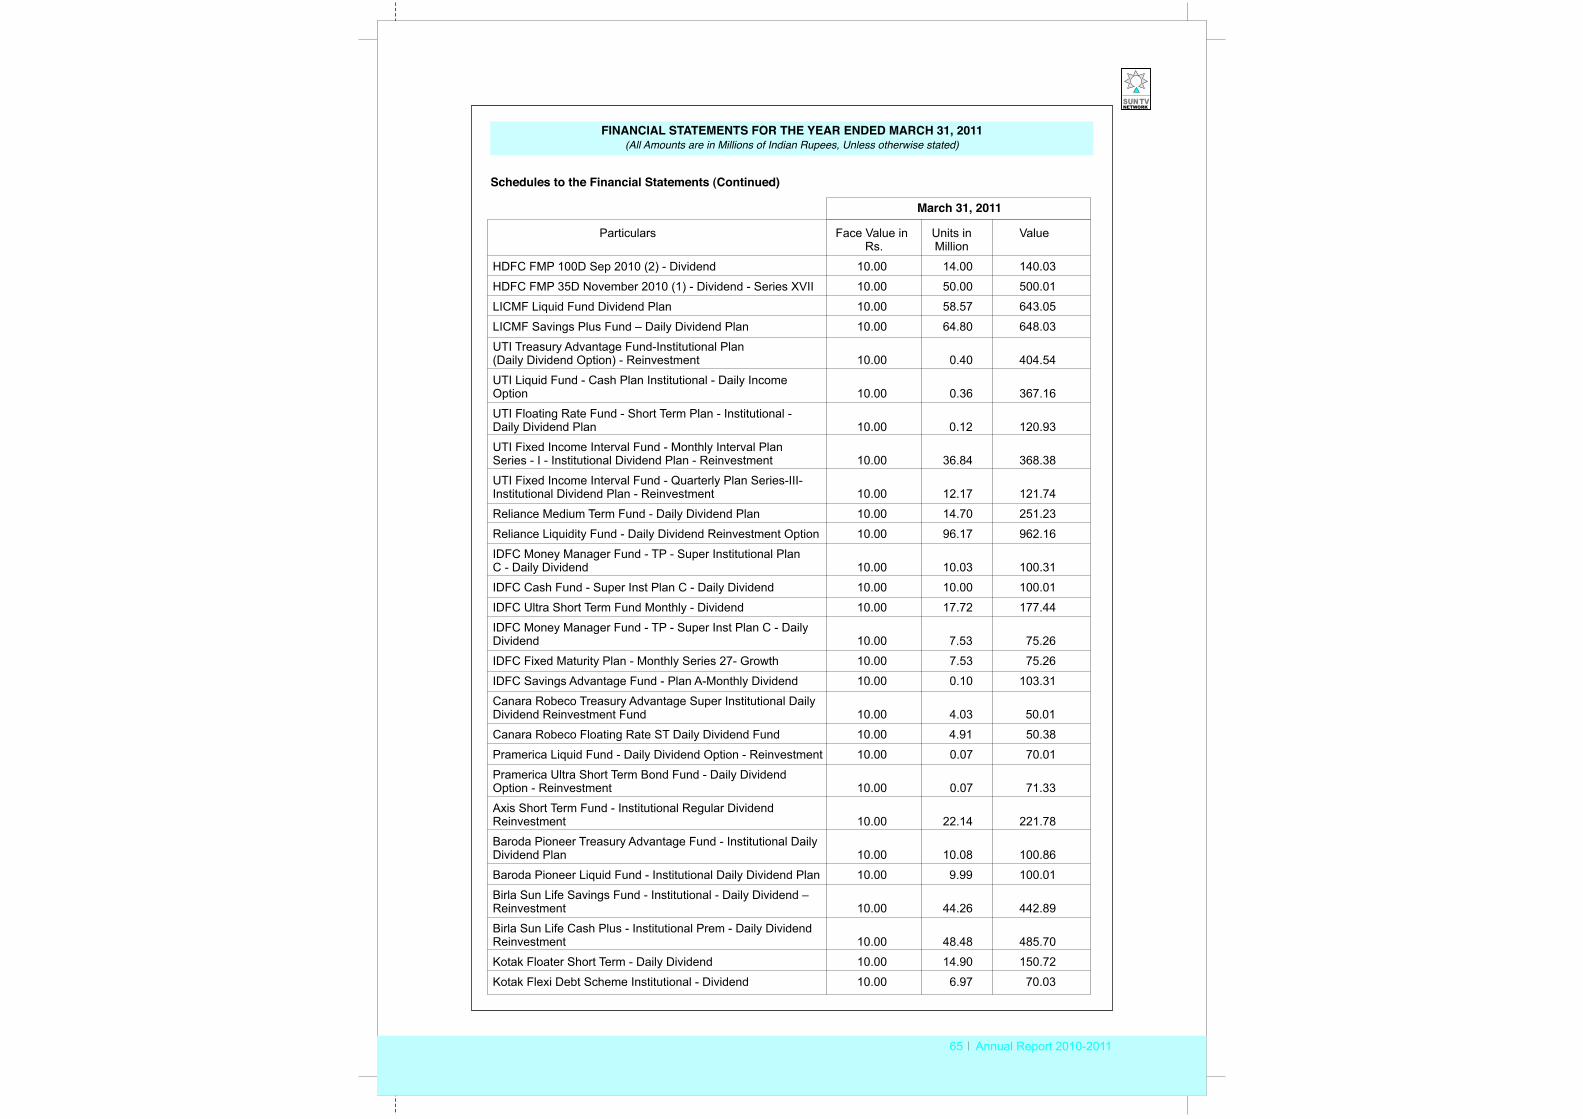
65 Annual Report 2010-2011
FINANCIAL STATEMENTS FOR THE YEAR ENDED MARCH 31, 2011 (All Amounts are in Millions of Indian Rupees, Unless otherwise stated)
Schedules to the Financial Statements (Continued)
Particulars Face Value in Units in ValueRs. Million
HDFC FMP 100D Sep 2010 (2) - Dividend 10.00 14.00 140.03
HDFC FMP 35D November 2010 (1) - Dividend - Series XVII 10.00 50.00 500.01
LICMF Liquid Fund Dividend Plan 10.00 58.57 643.05
LICMF Savings Plus Fund – Daily Dividend Plan 10.00 64.80 648.03
UTI Treasury Advantage Fund-Institutional Plan(Daily Dividend Option) - Reinvestment 10.00 0.40 404.54
UTI Liquid Fund - Cash Plan Institutional - Daily IncomeOption 10.00 0.36 367.16
UTI Floating Rate Fund - Short Term Plan - Institutional - Daily Dividend Plan 10.00 0.12 120.93
UTI Fixed Income Interval Fund - Monthly Interval Plan Series - I - Institutional Dividend Plan - Reinvestment 10.00 36.84 368.38
UTI Fixed Income Interval Fund - Quarterly Plan Series-III-Institutional Dividend Plan - Reinvestment 10.00 12.17 121.74
Reliance Medium Term Fund - Daily Dividend Plan 10.00 14.70 251.23
Reliance Liquidity Fund - Daily Dividend Reinvestment Option 10.00 96.17 962.16
IDFC Money Manager Fund - TP - Super Institutional Plan C - Daily Dividend 10.00 10.03 100.31
IDFC Cash Fund - Super Inst Plan C - Daily Dividend 10.00 10.00 100.01
IDFC Ultra Short Term Fund Monthly - Dividend 10.00 17.72 177.44
IDFC Money Manager Fund - TP - Super Inst Plan C - Daily Dividend 10.00 7.53 75.26
IDFC Fixed Maturity Plan - Monthly Series 27- Growth 10.00 7.53 75.26
IDFC Savings Advantage Fund - Plan A-Monthly Dividend 10.00 0.10 103.31
Canara Robeco Treasury Advantage Super Institutional DailyDividend Reinvestment Fund 10.00 4.03 50.01
Canara Robeco Floating Rate ST Daily Dividend Fund 10.00 4.91 50.38
Pramerica Liquid Fund - Daily Dividend Option - Reinvestment 10.00 0.07 70.01
Pramerica Ultra Short Term Bond Fund - Daily Dividend Option - Reinvestment 10.00 0.07 71.33
Axis Short Term Fund - Institutional Regular Dividend Reinvestment 10.00 22.14 221.78
Baroda Pioneer Treasury Advantage Fund - Institutional Daily Dividend Plan 10.00 10.08 100.86
Baroda Pioneer Liquid Fund - Institutional Daily Dividend Plan 10.00 9.99 100.01
Birla Sun Life Savings Fund - Institutional - Daily Dividend –Reinvestment 10.00 44.26 442.89
Birla Sun Life Cash Plus - Institutional Prem - Daily Dividend Reinvestment 10.00 48.48 485.70
Kotak Floater Short Term - Daily Dividend 10.00 14.90 150.72
Kotak Flexi Debt Scheme Institutional - Dividend 10.00 6.97 70.03
March 31, 2011
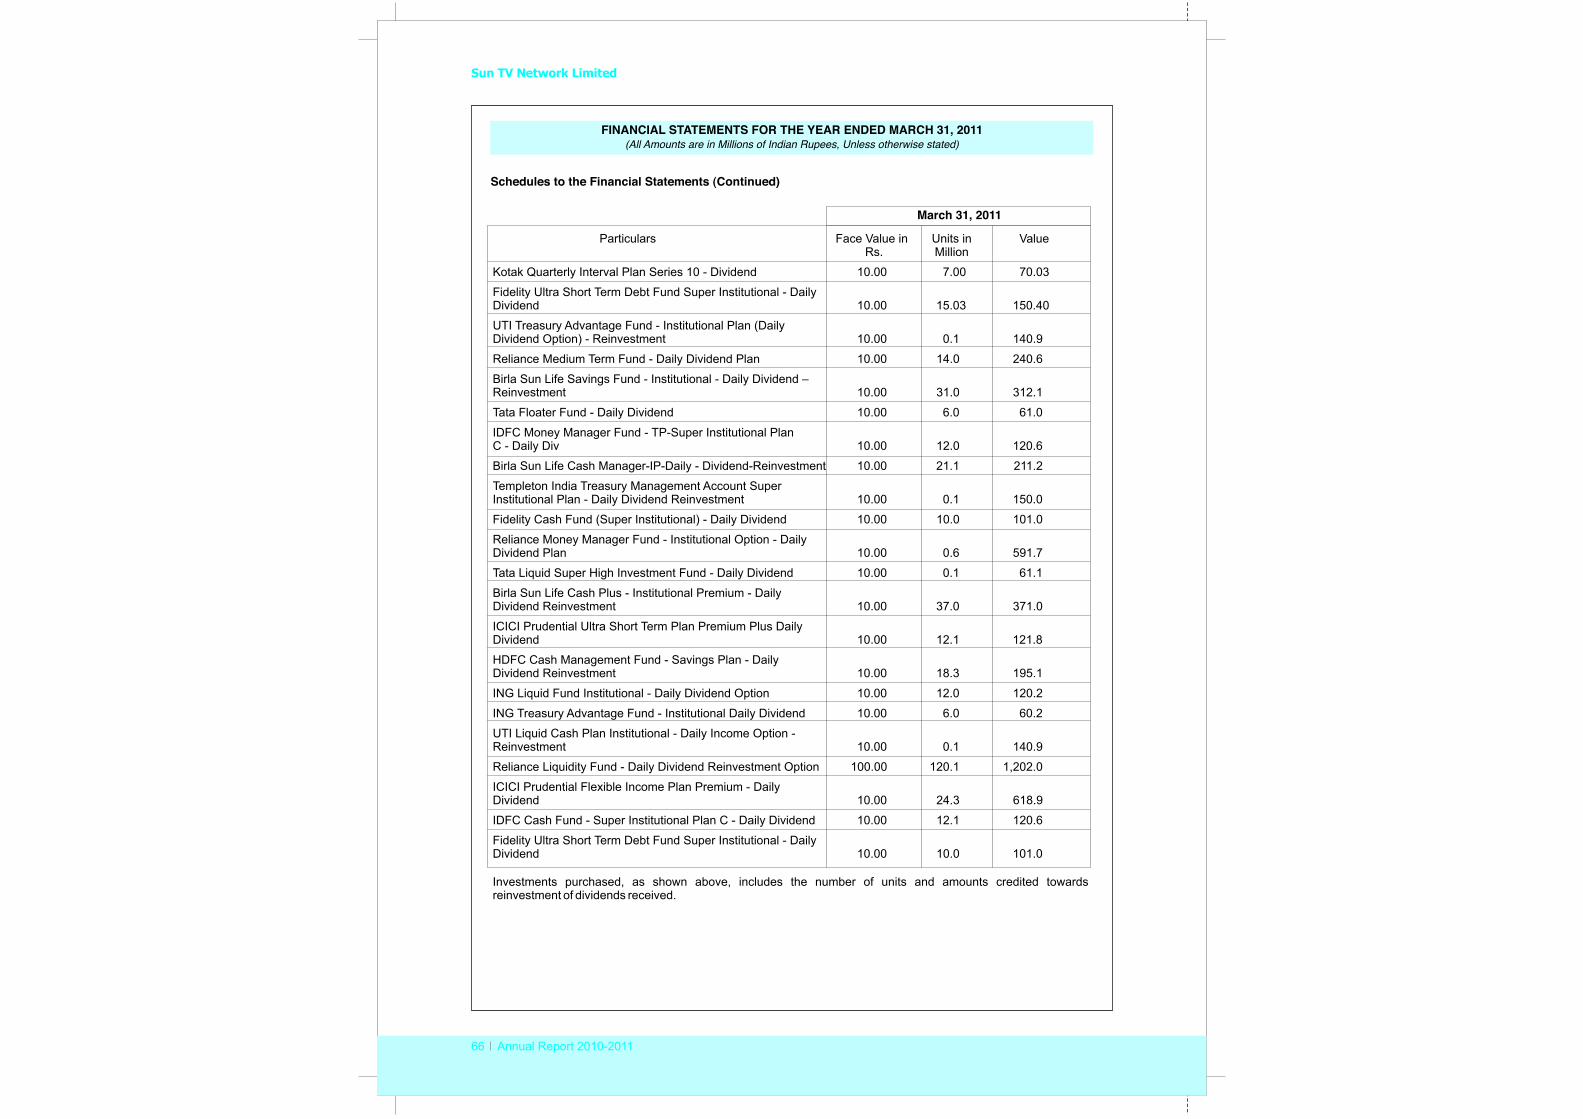
Sun TV Network Limited
66 Annual Report 2010-2011
FINANCIAL STATEMENTS FOR THE YEAR ENDED MARCH 31, 2011 (All Amounts are in Millions of Indian Rupees, Unless otherwise stated)
Schedules to the Financial Statements (Continued)
Particulars Face Value in Units in ValueRs. Million
Kotak Quarterly Interval Plan Series 10 - Dividend 10.00 7.00 70.03
Fidelity Ultra Short Term Debt Fund Super Institutional - Daily Dividend 10.00 15.03 150.40
UTI Treasury Advantage Fund - Institutional Plan (Daily Dividend Option) - Reinvestment 10.00 0.1 140.9
Reliance Medium Term Fund - Daily Dividend Plan 10.00 14.0 240.6
Birla Sun Life Savings Fund - Institutional - Daily Dividend –Reinvestment 10.00 31.0 312.1
Tata Floater Fund - Daily Dividend 10.00 6.0 61.0
IDFC Money Manager Fund - TP-Super Institutional Plan C - Daily Div 10.00 12.0 120.6
Birla Sun Life Cash Manager-IP-Daily - Dividend-Reinvestment 10.00 21.1 211.2
Templeton India Treasury Management Account Super Institutional Plan - Daily Dividend Reinvestment 10.00 0.1 150.0
Fidelity Cash Fund (Super Institutional) - Daily Dividend 10.00 10.0 101.0
Reliance Money Manager Fund - Institutional Option - Daily Dividend Plan 10.00 0.6 591.7
Tata Liquid Super High Investment Fund - Daily Dividend 10.00 0.1 61.1
Birla Sun Life Cash Plus - Institutional Premium - Daily Dividend Reinvestment 10.00 37.0 371.0
ICICI Prudential Ultra Short Term Plan Premium Plus Daily Dividend 10.00 12.1 121.8
HDFC Cash Management Fund - Savings Plan - Daily Dividend Reinvestment 10.00 18.3 195.1
ING Liquid Fund Institutional - Daily Dividend Option 10.00 12.0 120.2
ING Treasury Advantage Fund - Institutional Daily Dividend 10.00 6.0 60.2
UTI Liquid Cash Plan Institutional - Daily Income Option - Reinvestment 10.00 0.1 140.9
Reliance Liquidity Fund - Daily Dividend Reinvestment Option 100.00 120.1 1,202.0
ICICI Prudential Flexible Income Plan Premium - Daily Dividend 10.00 24.3 618.9
IDFC Cash Fund - Super Institutional Plan C - Daily Dividend 10.00 12.1 120.6
Fidelity Ultra Short Term Debt Fund Super Institutional - Daily Dividend 10.00 10.0 101.0
Investments purchased, as shown above, includes the number of units and amounts credited towards reinvestment of dividends received.
March 31, 2011
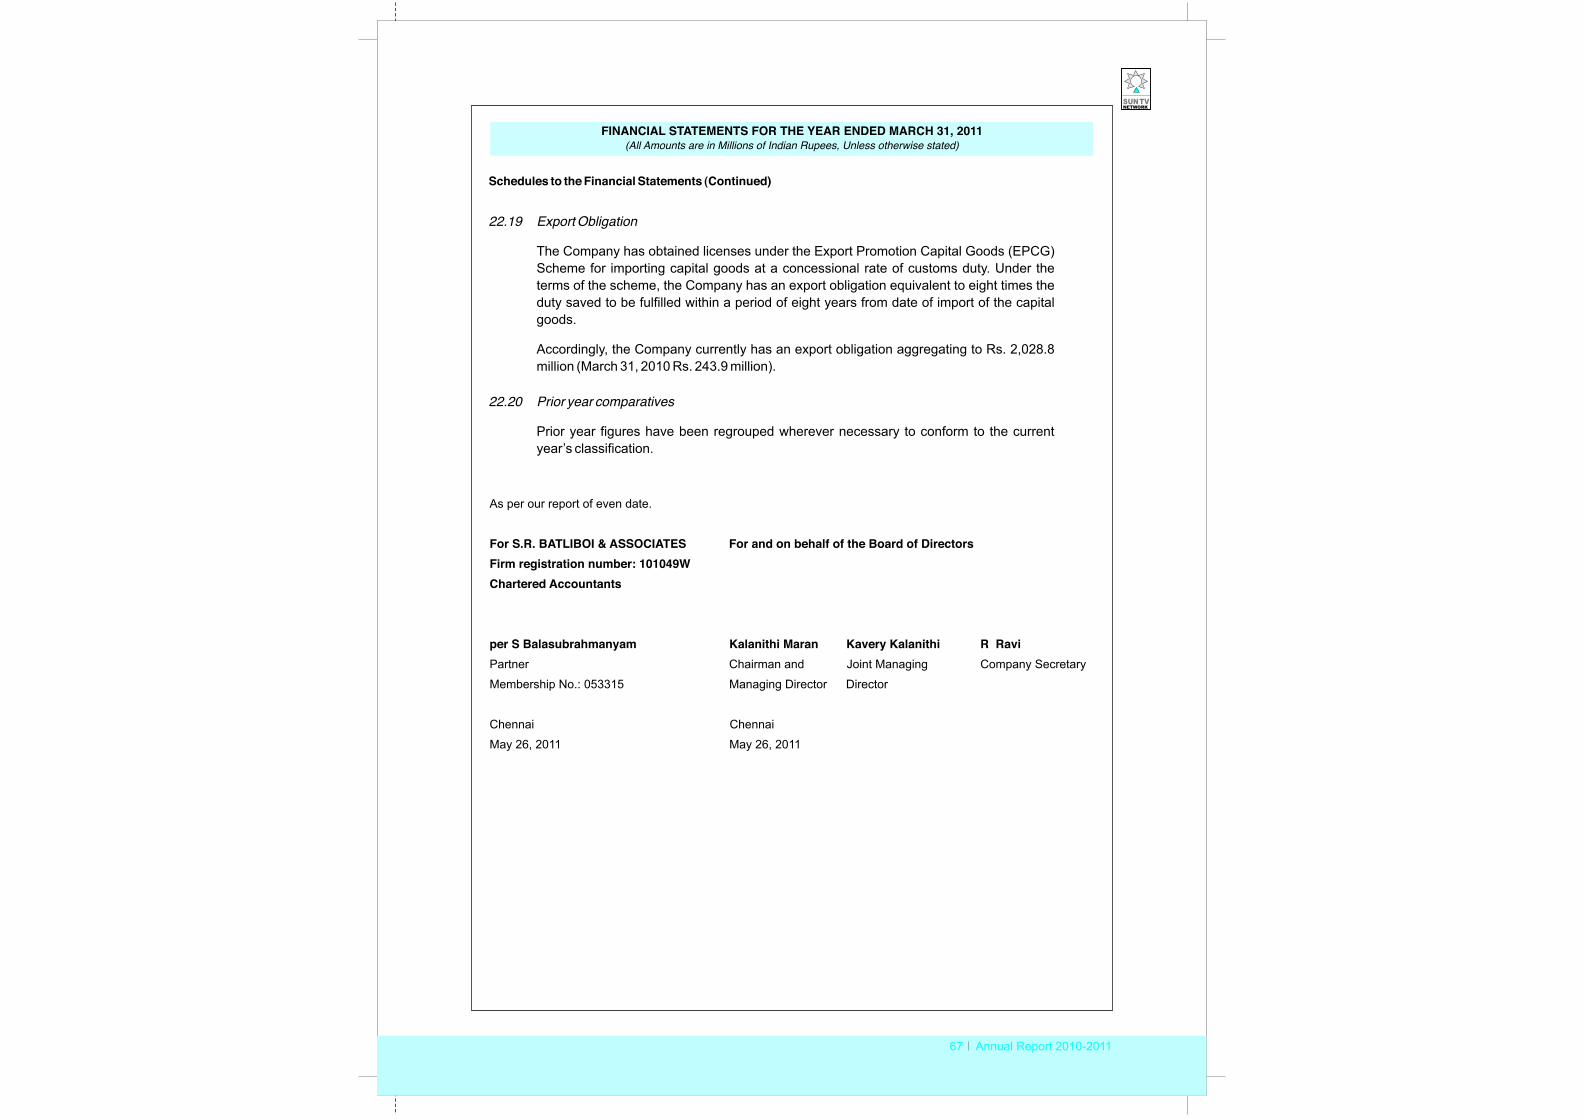
67 Annual Report 2010-2011
FINANCIAL STATEMENTS FOR THE YEAR ENDED MARCH 31, 2011 (All Amounts are in Millions of Indian Rupees, Unless otherwise stated)
22.20 Prior year comparatives
Prior year figures have been regrouped wherever necessary to conform to the current year’s classification.
As per our report of even date.
For S.R. BATLIBOI & ASSOCIATES For and on behalf of the Board of DirectorsFirm registration number: 101049WChartered Accountants
per S Balasubrahmanyam Kalanithi Maran Kavery Kalanithi R RaviPartner Chairman and Joint Managing Company Secretary
Membership No.: 053315 Managing Director Director
Chennai Chennai
May 26, 2011 May 26, 2011
22.19 Export Obligation
The Company has obtained licenses under the Export Promotion Capital Goods (EPCG) Scheme for importing capital goods at a concessional rate of customs duty. Under the terms of the scheme, the Company has an export obligation equivalent to eight times the duty saved to be fulfilled within a period of eight years from date of import of the capital goods.
Accordingly, the Company currently has an export obligation aggregating to Rs. 2,028.8 million (March 31, 2010 Rs. 243.9 million).
Schedules to the Financial Statements (Continued)
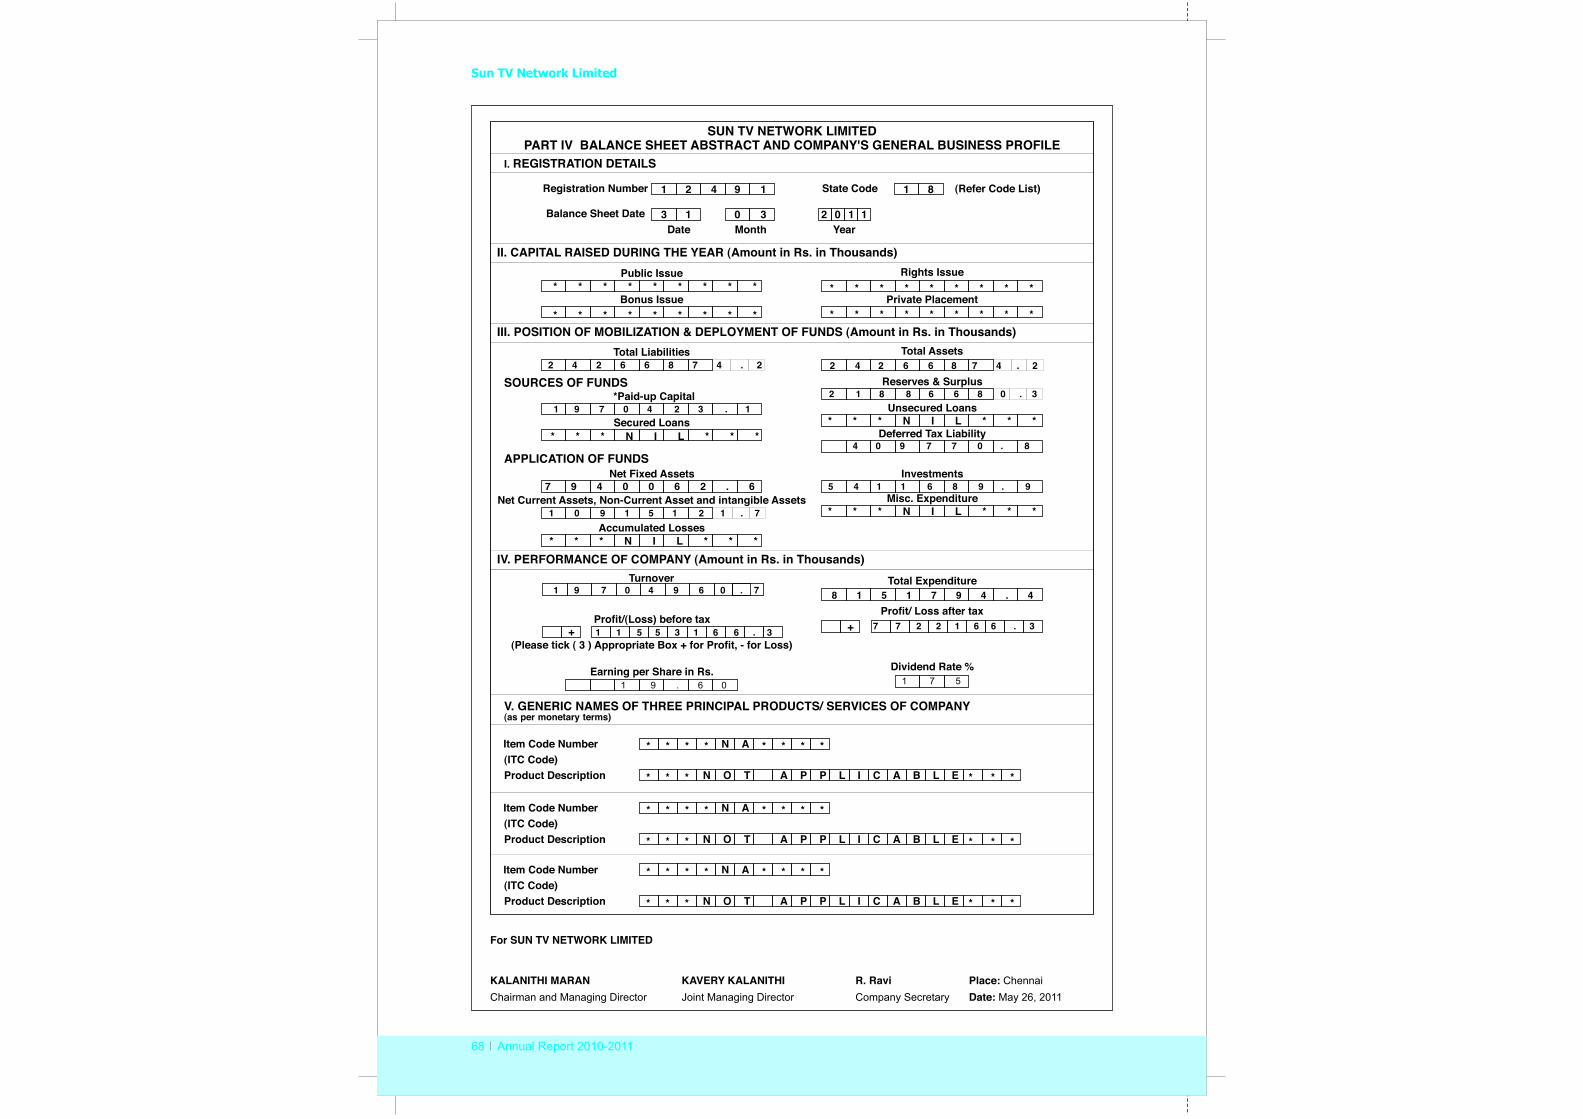
Sun TV Network Limited
68 Annual Report 2010-2011
SUN TV NETWORK LIMITEDPART IV BALANCE SHEET ABSTRACT AND COMPANY'S GENERAL BUSINESS PROFILE
I. REGISTRATION DETAILS
Registration Number 1 2 4 9 1 (Refer Code List) State Code 1 8
Balance Sheet Date 3 1 0 3 2 0 1 1Date Month Year
II. CAPITAL RAISED DURING THE YEAR (Amount in Rs. in Thousands)Public Issue
* * * * * * * * *Rights Issue
Bonus Issue* * * * * * * * *
Private Placement
Total Assets
*Paid-up CapitalSOURCES OF FUNDS
III. POSITION OF MOBILIZATION & DEPLOYMENT OF FUNDS (Amount in Rs. in Thousands)
Secured Loans
Net Fixed Assets
Misc. ExpenditureNet Current Assets, Non-Current Asset and intangible Assets
* * * N I L * * *Accumulated Losses
APPLICATION OF FUNDS
IV. PERFORMANCE OF COMPANY (Amount in Rs. in Thousands)Turnover Total Expenditure
+Profit/(Loss) before tax
+Profit/ Loss after tax
(Please tick ( 3 ) Appropriate Box + for Profit, - for Loss)
Earning per Share in Rs. Dividend Rate %
V. GENERIC NAMES OF THREE PRINCIPAL PRODUCTS/ SERVICES OF COMPANY (as per monetary terms)
* * * * * * * *Item Code Number(ITC Code)Product Description
N A
*** N O T A P P L I C A B L E
* * * * * * * *Item Code Number(ITC Code)Product Description
N A
*** N O T A P P L I C A B L E
* * * * * * * *
** *
Item Code Number(ITC Code)Product Description
N A
*** N O T A P P L I C A B L E
Investments
Reserves & Surplus
Unsecured Loans* * * N I L * * *
* * * N I L * * *
7 9 4 0 0 6 2 . 6
* * * N I L * * *
For SUN TV NETWORK LIMITED
KALANITHI MARAN KAVERY KALANITHI R. Ravi Place: ChennaiChairman and Managing Director Joint Managing Director Company Secretary Date: May 26, 2011
** *
** *
Deferred Tax Liability
* * * * * * * * *
* * * * * * * * *
8 1 5 1 7 9 4 . 4
2 4 2 6 6 8 7 4 . 2
1 9 7 0 4 2 3 . 12 1 8 8 6 6 8 0 . 3
4 0 9 7 7 0 . 8
1 0 9 1 5 1 2 1 . 7
5 4 1 1 6 8 9 . 9
1 1 5 5 3 1 6 6 . 3
1 9 . 6 0 1 7 5
1 9 7 0 4 9 6 0 . 7
7 7 2 2 1 6 6 . 3
Total Liabilities2 4 2 6 6 8 7 4 . 2
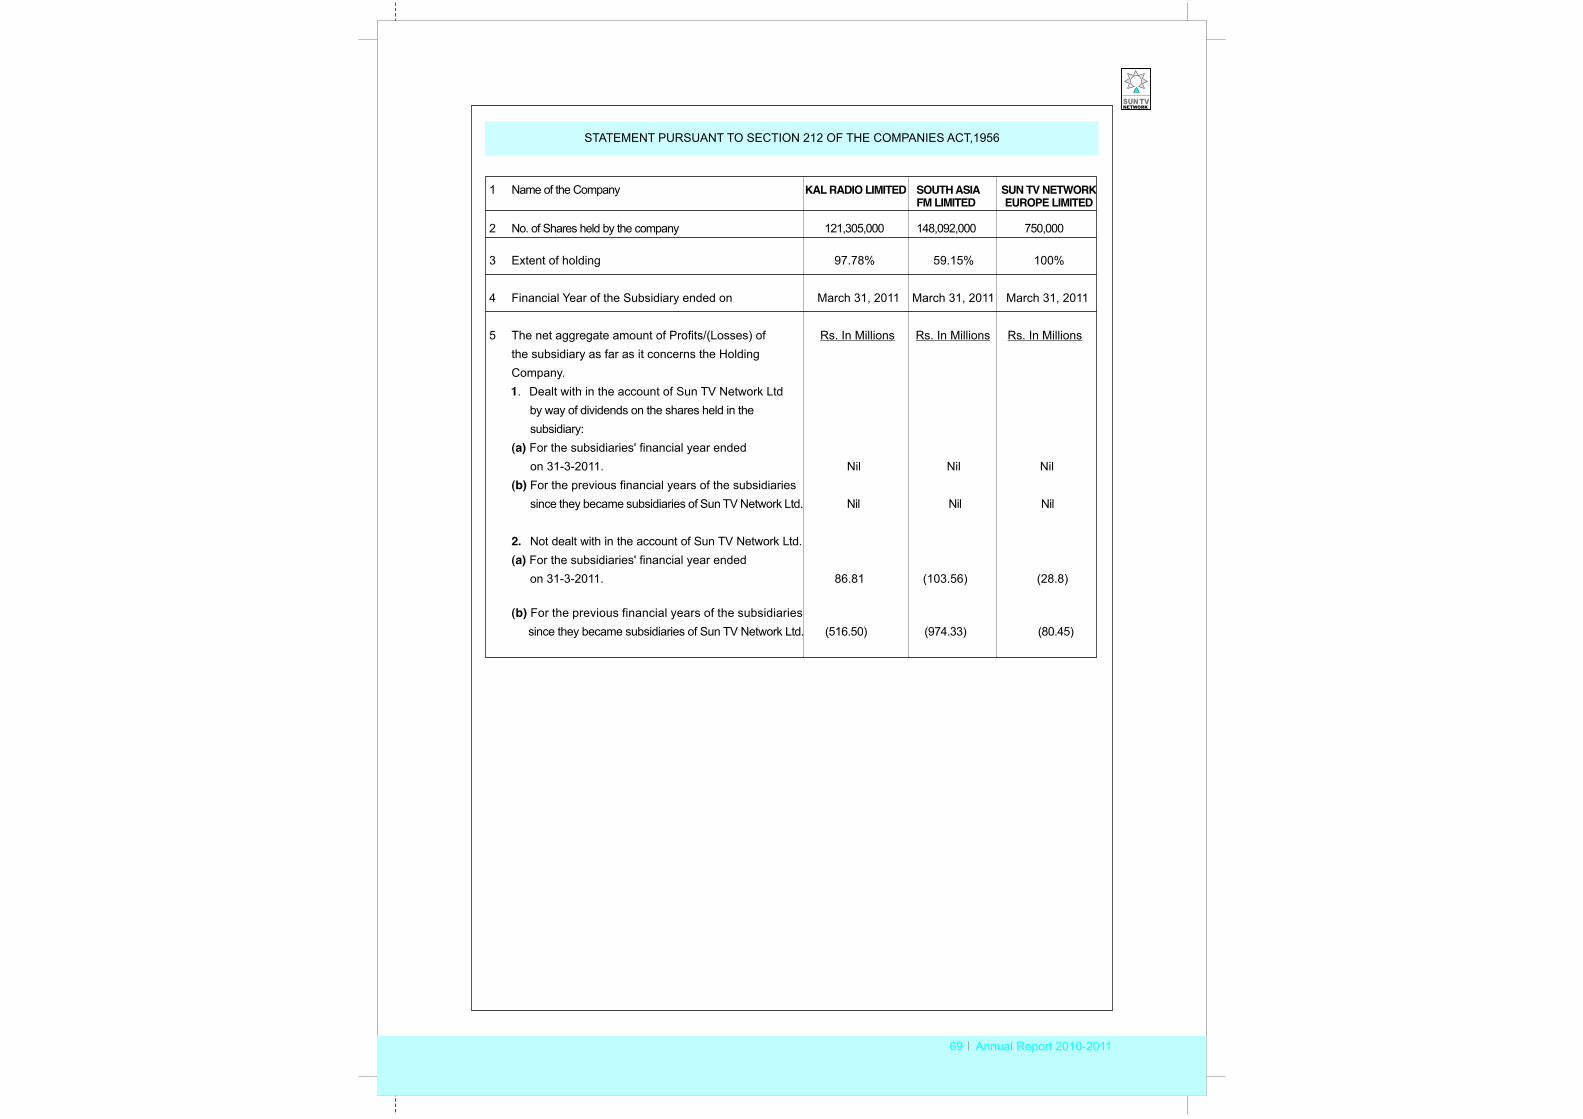
69 Annual Report 2010-2011
STATEMENT PURSUANT TO SECTION 212 OF THE COMPANIES ACT,1956
1 Name of the Company KAL RADIO LIMITED SOUTH ASIA SUN TV NETWORK FM LIMITED EUROPE LIMITED
2 No. of Shares held by the company 121,305,000 148,092,000 750,000
3 Extent of holding 97.78% 59.15% 100%
4 Financial Year of the Subsidiary ended on March 31, 2011 March 31, 2011 March 31, 2011
5 The net aggregate amount of Profits/(Losses) of Rs. In Millions Rs. In Millionsthe subsidiary as far as it concerns the HoldingCompany.1. Dealt with in the account of Sun TV Network Ltd
by way of dividends on the shares held in the subsidiary:
(a) For the subsidiaries' financial year ended on 31-3-2011. Nil Nil Nil
(b) For the previous financial years of the subsidiariessince they became subsidiaries of Sun TV Network Ltd. Nil Nil Nil
2. Not dealt with in the account of Sun TV Network Ltd.(a) For the subsidiaries' financial year ended
on 31-3-2011. 86.81 (103.56) (28.8)
(b) For the previous financial years of the subsidiariessince they became subsidiaries of Sun TV Network Ltd. (516.50) (974.33) (80.45)
Rs. In Millions
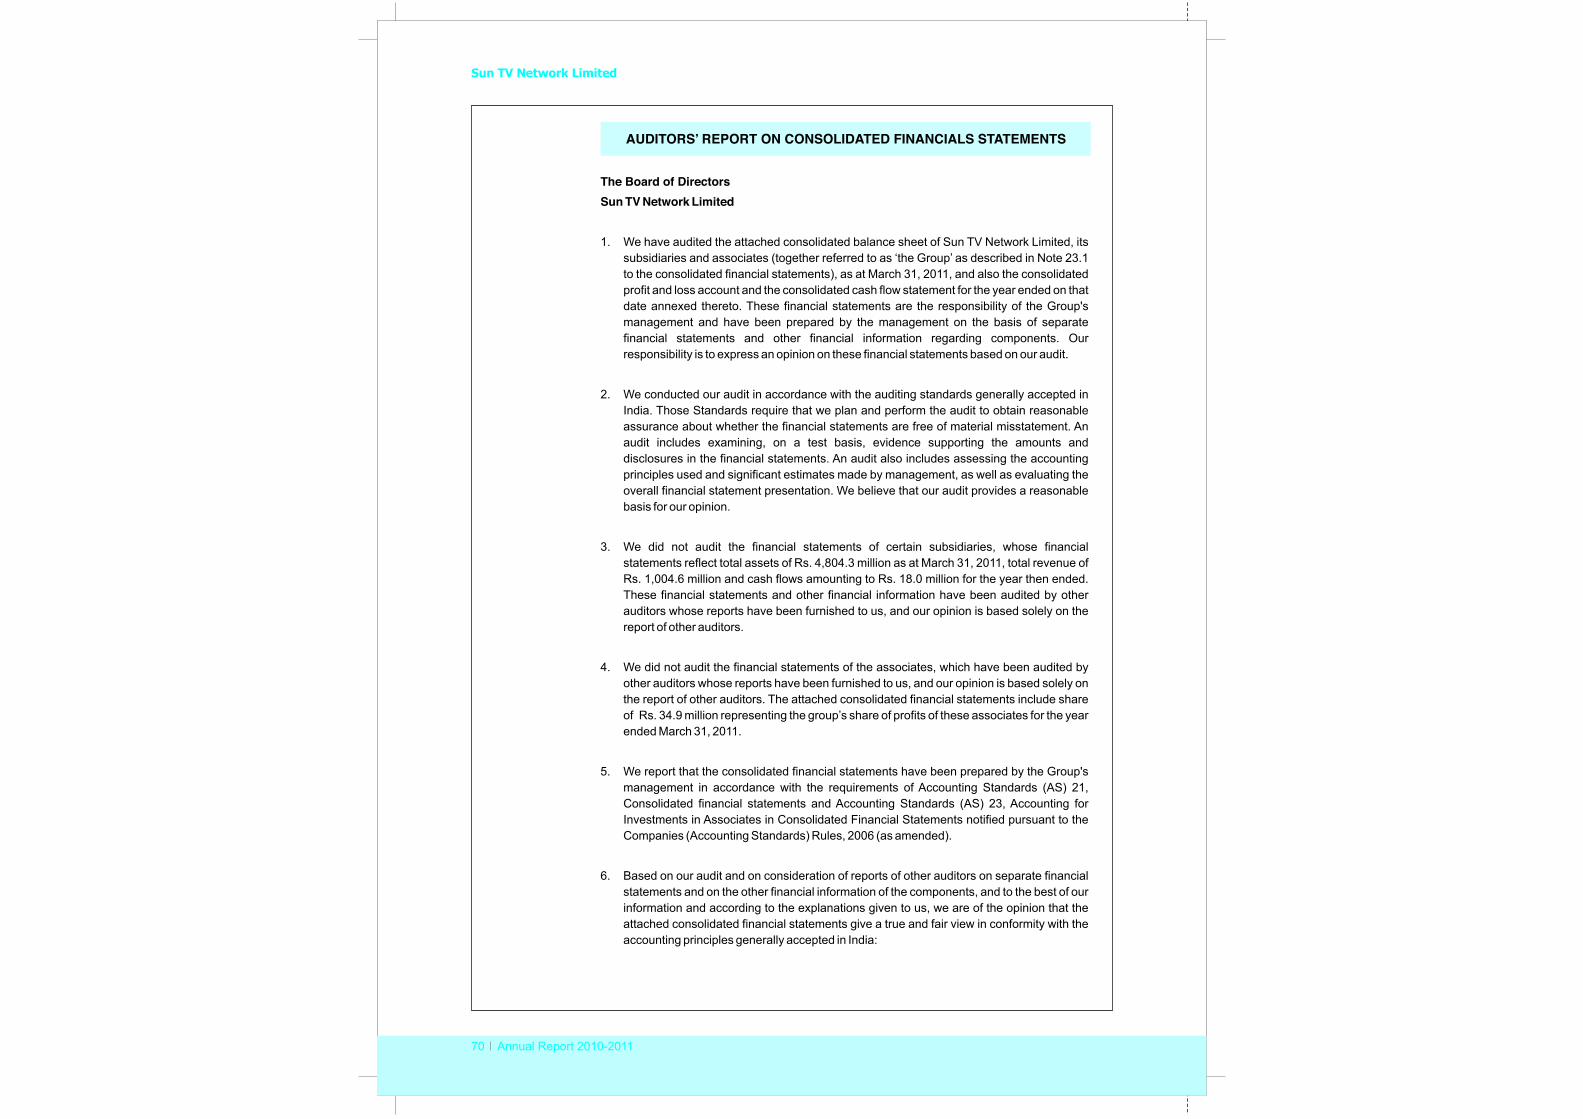
Sun TV Network Limited
70 Annual Report 2010-2011
The Board of DirectorsSun TV Network Limited
1. We have audited the attached consolidated balance sheet of Sun TV Network Limited, its subsidiaries and associates (together referred to as ‘the Group’ as described in Note 23.1 to the consolidated financial statements), as at March 31, 2011, and also the consolidated profit and loss account and the consolidated cash flow statement for the year ended on that date annexed thereto. These financial statements are the responsibility of the Group's management and have been prepared by the management on the basis of separate financial statements and other financial information regarding components. Our responsibility is to express an opinion on these financial statements based on our audit.
2. We conducted our audit in accordance with the auditing standards generally accepted in India. Those Standards require that we plan and perform the audit to obtain reasonable assurance about whether the financial statements are free of material misstatement. An audit includes examining, on a test basis, evidence supporting the amounts and disclosures in the financial statements. An audit also includes assessing the accounting principles used and significant estimates made by management, as well as evaluating the overall financial statement presentation. We believe that our audit provides a reasonable basis for our opinion.
3. We did not audit the financial statements of certain subsidiaries, whose financial statements reflect total assets of Rs. 4,804.3 million as at March 31, 2011, total revenue of Rs. 1,004.6 million and cash flows amounting to Rs. 18.0 million for the year then ended. These financial statements and other financial information have been audited by other auditors whose reports have been furnished to us, and our opinion is based solely on the report of other auditors.
4. We did not audit the financial statements of the associates, which have been audited by other auditors whose reports have been furnished to us, and our opinion is based solely on the report of other auditors. The attached consolidated financial statements include share of Rs. 34.9 million representing the group’s share of profits of these associates for the year ended March 31, 2011.
5. We report that the consolidated financial statements have been prepared by the Group's management in accordance with the requirements of Accounting Standards (AS) 21, Consolidated financial statements and Accounting Standards (AS) 23, Accounting for Investments in Associates in Consolidated Financial Statements notified pursuant to the Companies (Accounting Standards) Rules, 2006 (as amended).
6. Based on our audit and on consideration of reports of other auditors on separate financial statements and on the other financial information of the components, and to the best of our information and according to the explanations given to us, we are of the opinion that the attached consolidated financial statements give a true and fair view in conformity with the accounting principles generally accepted in India:
AUDITORS’ REPORT ON CONSOLIDATED FINANCIALS STATEMENTS
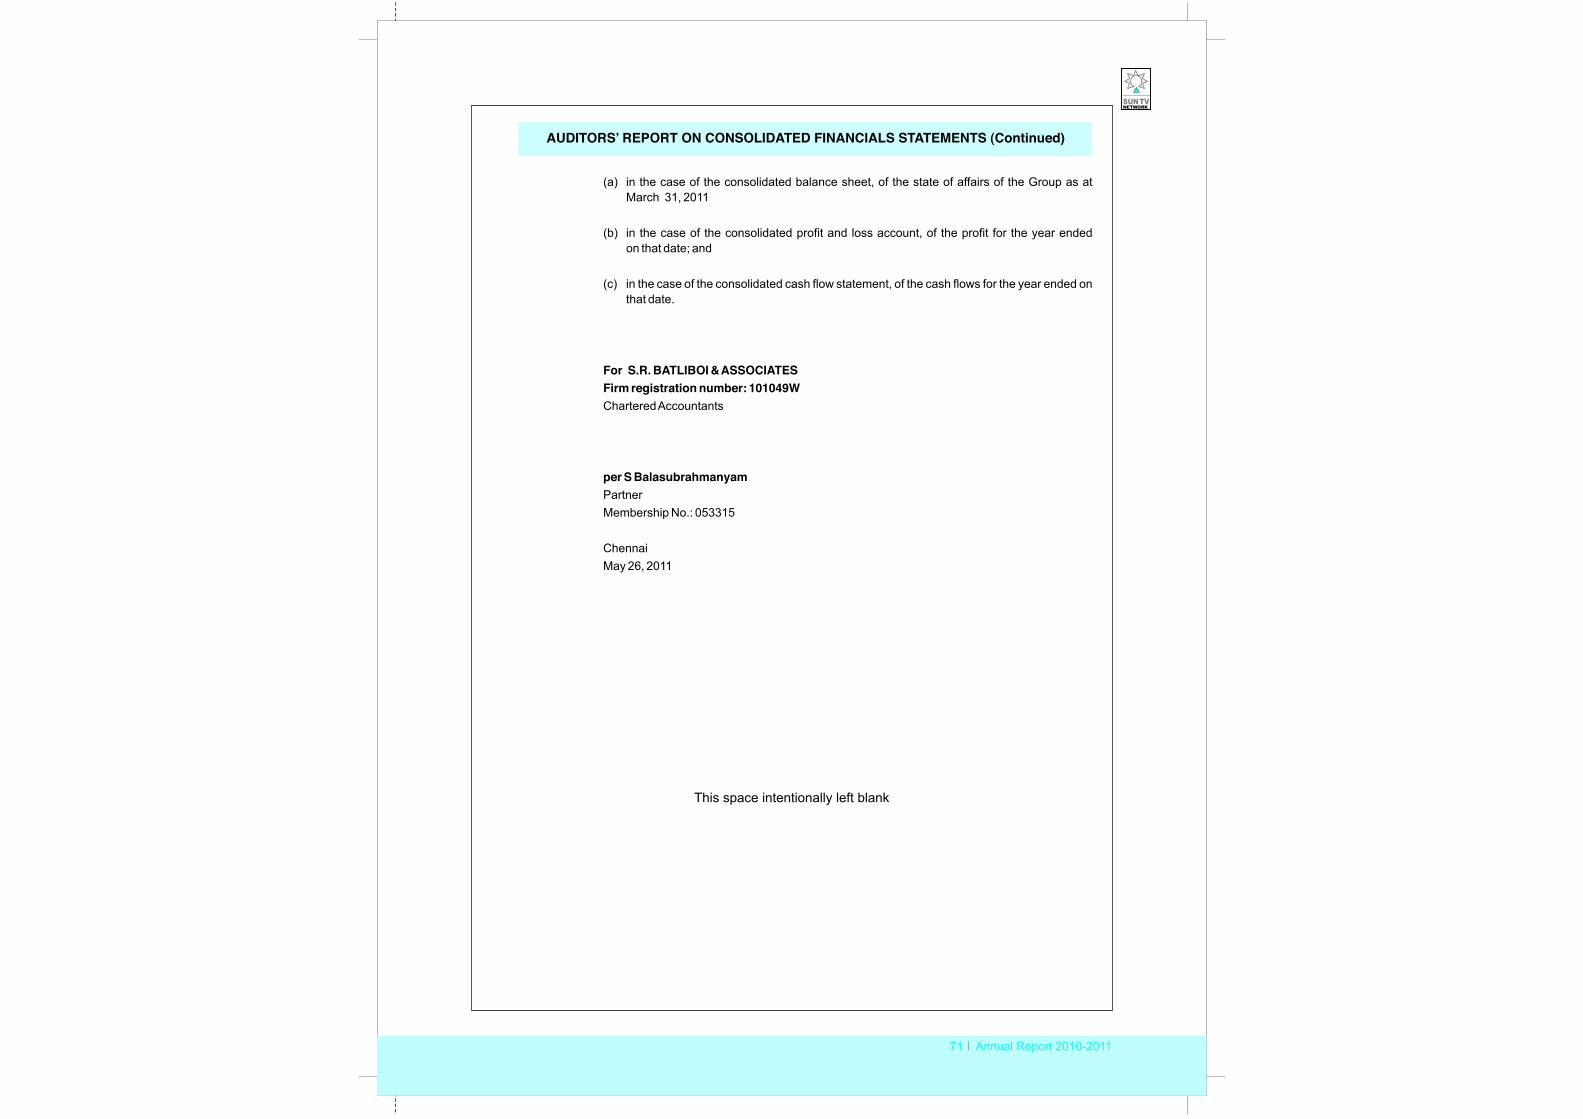
71 Annual Report 2010-2011
(a) in the case of the consolidated balance sheet, of the state of affairs of the Group as at March 31, 2011
(b) in the case of the consolidated profit and loss account, of the profit for the year ended on that date; and
(c) in the case of the consolidated cash flow statement, of the cash flows for the year ended on that date.
For S.R. BATLIBOI & ASSOCIATESFirm registration number: 101049WChartered Accountants
per S BalasubrahmanyamPartner Membership No.: 053315
ChennaiMay 26, 2011
AUDITORS’ REPORT ON CONSOLIDATED FINANCIALS STATEMENTS (Continued)
This space intentionally left blank
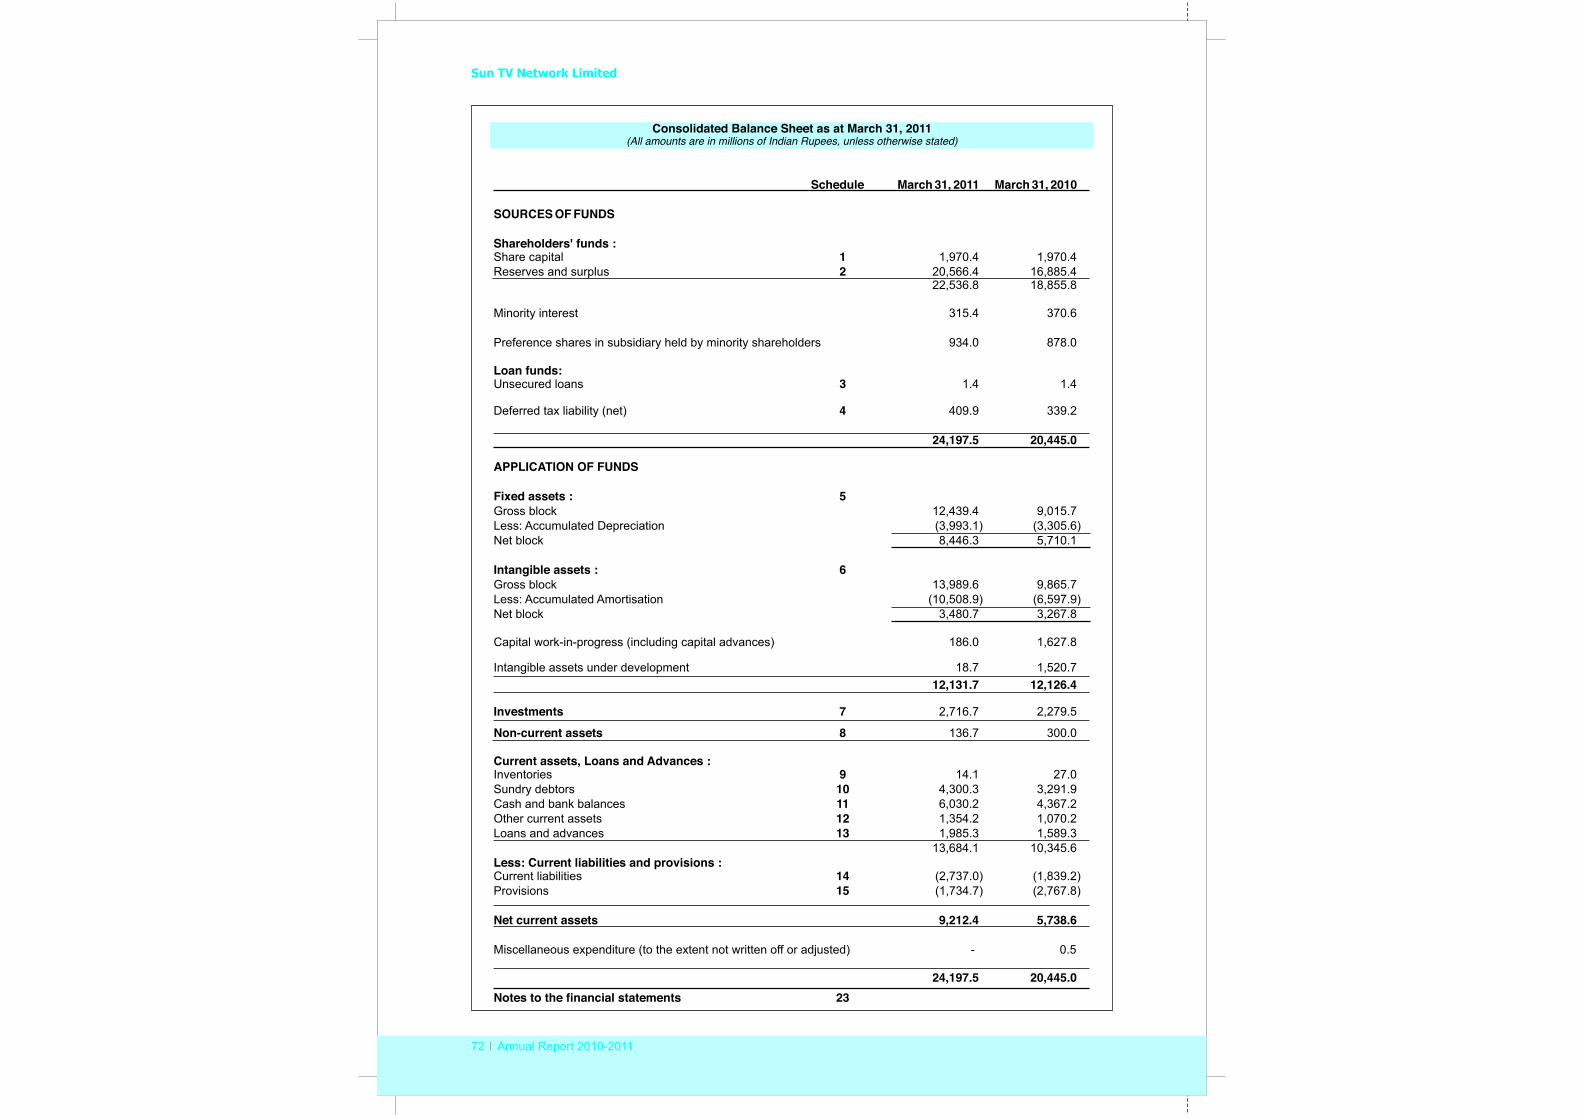
Sun TV Network Limited
72 Annual Report 2010-2011
Consolidated Balance Sheet as at March 31, 2011(All amounts are in millions of Indian Rupees, unless otherwise stated)
Schedule March 31, 2011 March 31, 2010
SOURCES OF FUNDS
Shareholders' funds :Share capital 1 1,970.4 1,970.4Reserves and surplus 2 20,566.4 16,885.4
22,536.8 18,855.8
Minority interest 315.4 370.6
Preference shares in subsidiary held by minority shareholders 934.0 878.0
Loan funds:Unsecured loans 3 1.4 1.4
Deferred tax liability (net) 4 409.9 339.2
24,197.5 20,445.0
APPLICATION OF FUNDS
Fixed assets : 5Gross block 12,439.4 9,015.7 Less: Accumulated Depreciation (3,993.1) (3,305.6)Net block 8,446.3 5,710.1
Intangible assets : 6 Gross block 13,989.6 9,865.7Less: Accumulated Amortisation (10,508.9) (6,597.9)Net block 3,480.7 3,267.8
Capital work-in-progress (including capital advances) 186.0 1,627.8
Intangible assets under development 18.7 1,520.712,131.7 12,126.4
Investments 7 2,716.7 2,279.5
Non-current assets 8 136.7 300.0
Current assets, Loans and Advances :Inventories 9 14.1 27.0Sundry debtors 10 4,300.3 3,291.9Cash and bank balances 11 6,030.2 4,367.2Other current assets 12 1,354.2 1,070.2Loans and advances 13 1,985.3 1,589.3
13,684.1 10,345.6Less: Current liabilities and provisions :Current liabilities 14 (2,737.0) (1,839.2)Provisions 15 (1,734.7) (2,767.8)
Net current assets 9,212.4 5,738.6
Miscellaneous expenditure (to the extent not written off or adjusted) - 0.5
24,197.5 20,445.0 Notes to the financial statements 23
73 Annual Report 2010-2011
The schedules referred to above and the notes to accounts form an integral part of the Consolidated Balance sheet.
As per our report of even date.
For S.R. BATLIBOI & ASSOCIATES For and on behalf of the Board of DirectorsFirm registration number: 101049WChartered Accountants
per S Balasubrahmanyam Kalanithi Maran Kavery Kalanithi R. RaviPartner Chairman and Joint Managing Company SecretaryMembership No.: 053315 Managing Director Director
Chennai Chennai
May 26, 2011 May 26, 2011
Consolidated Balance Sheet as at March 31, 2011(All amounts are in millions of Indian Rupees, unless otherwise stated)
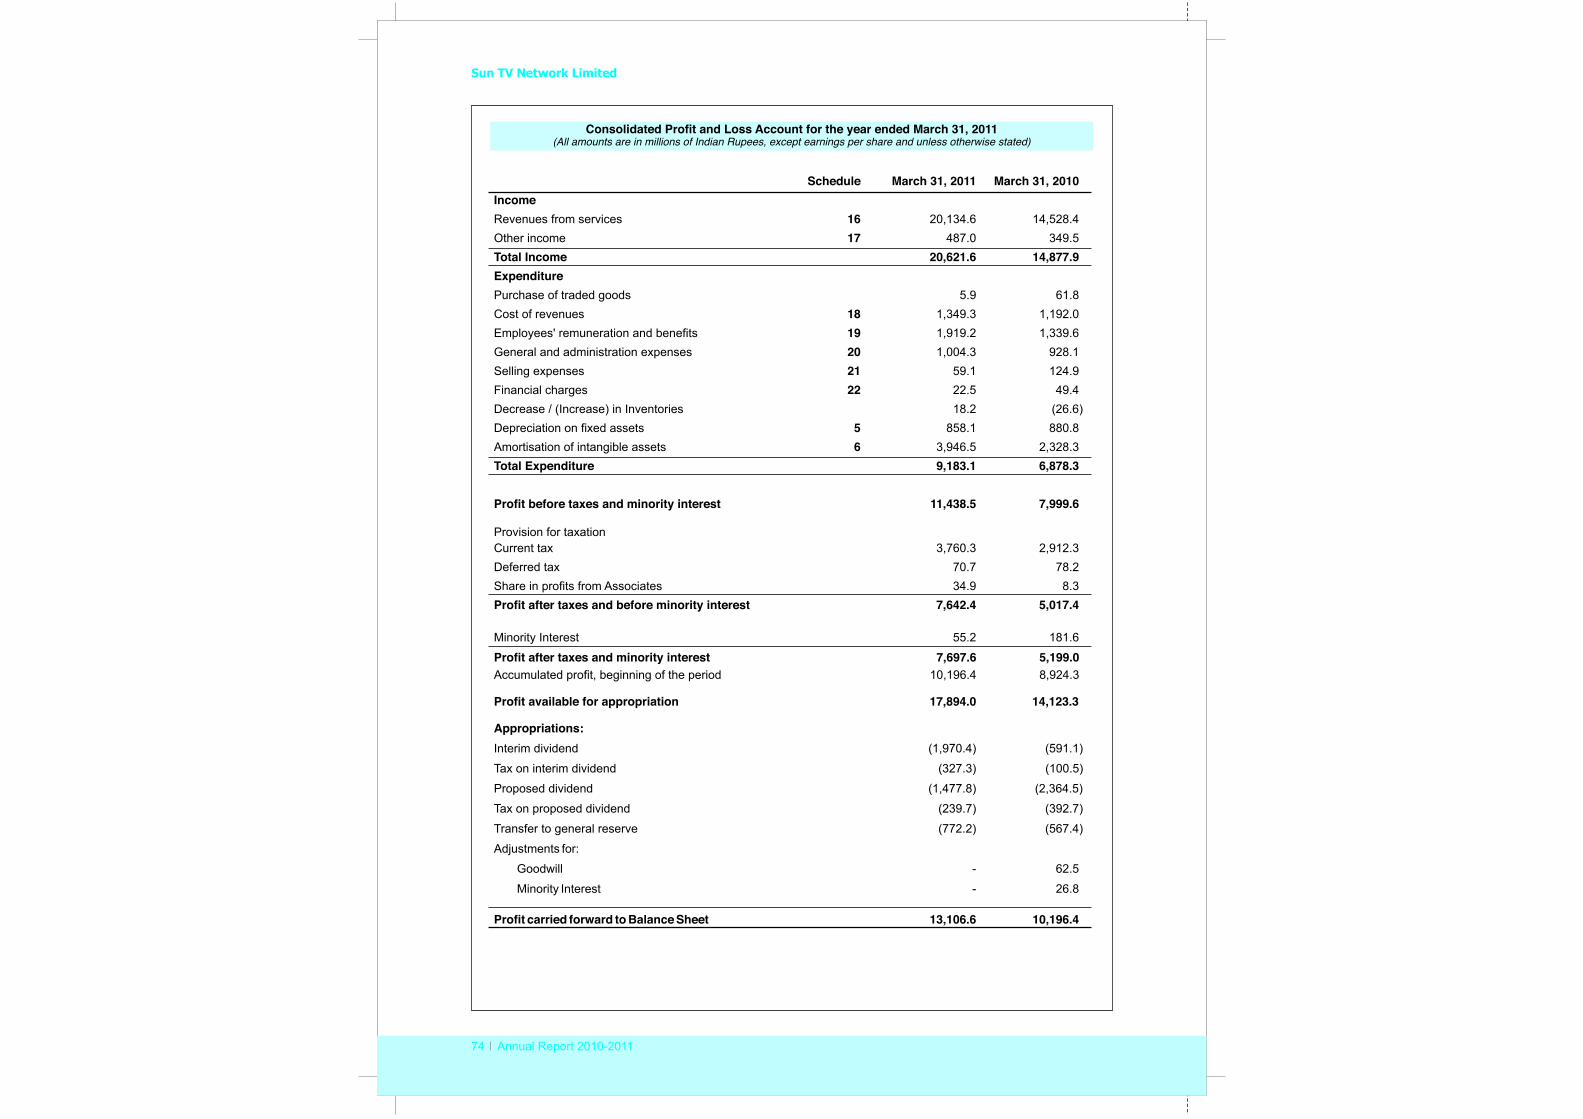
Sun TV Network Limited
74 Annual Report 2010-2011
Schedule March 31, 2011 March 31, 2010IncomeRevenues from services 16 20,134.6 14,528.4Other income 17 487.0 349.5 Total Income 20,621.6 14,877.9 ExpenditurePurchase of traded goods 5.9 61.8 Cost of revenues 18 1,349.3 1,192.0 Employees' remuneration and benefits 19 1,919.2 1,339.6General and administration expenses 20 1,004.3 928.1Selling expenses 21 59.1 124.9 Financial charges 22 22.5 49.4 Decrease / (Increase) in Inventories 18.2 (26.6)Depreciation on fixed assets 5 858.1 880.8 Amortisation of intangible assets 6 3,946.5 2,328.3 Total Expenditure 9,183.1 6,878.3
Profit before taxes and minority interest 11,438.5 7,999.6
Provision for taxation Current tax 3,760.3 2,912.3 Deferred tax 70.7 78.2 Share in profits from Associates 34.9 8.3 Profit after taxes and before minority interest 7,642.4 5,017.4
Minority Interest 55.2 181.6
Profit after taxes and minority interest 7,697.6 5,199.0 Accumulated profit, beginning of the period 10,196.4 8,924.3
Profit available for appropriation 17,894.0 14,123.3
Appropriations:Interim dividend (1,970.4) (591.1)
Tax on interim dividend (327.3) (100.5)
Proposed dividend (1,477.8) (2,364.5)
Tax on proposed dividend (239.7) (392.7)
Transfer to general reserve (772.2) (567.4)
Adjustments for:
Goodwill - 62.5
Minority Interest - 26.8
Profit carried forward to Balance Sheet 13,106.6 10,196.4
Consolidated Profit and Loss Account for the year ended March 31, 2011(All amounts are in millions of Indian Rupees, except earnings per share and unless otherwise stated)
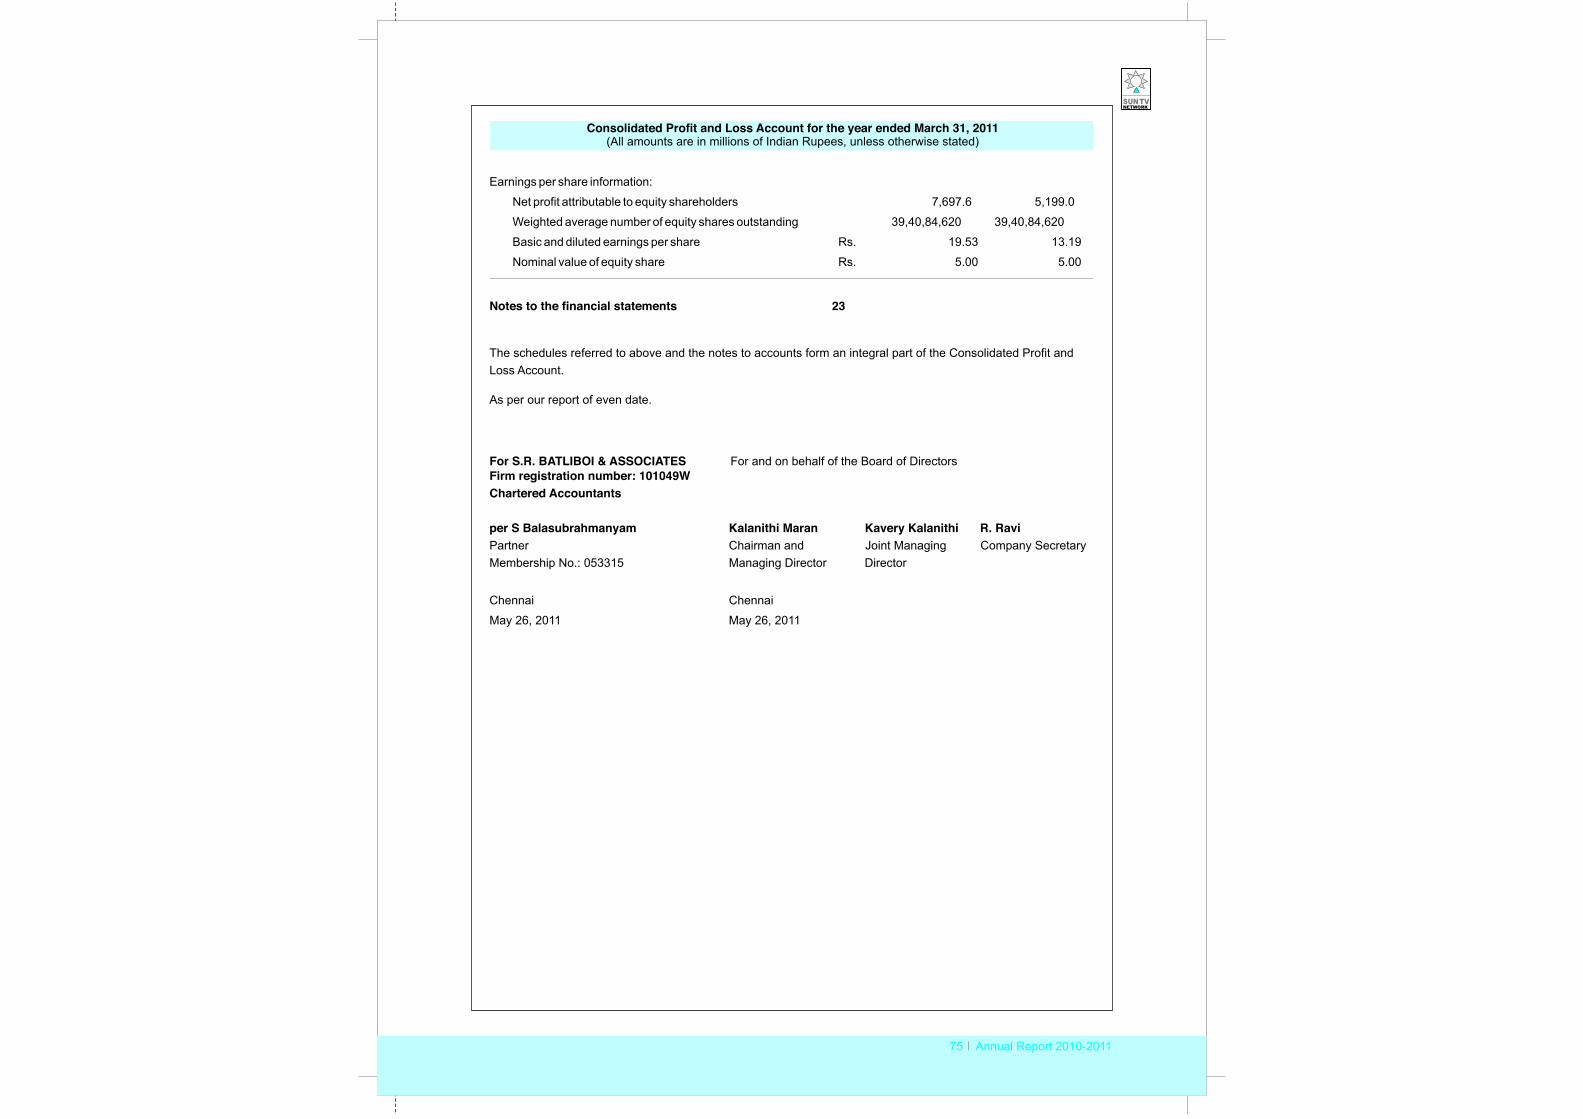
75 Annual Report 2010-2011
Consolidated Profit and Loss Account for the year ended March 31, 2011 (All amounts are in millions of Indian Rupees, unless otherwise stated)
Earnings per share information:
Net profit attributable to equity shareholders 7,697.6 5,199.0
Weighted average number of equity shares outstanding 39,40,84,620 39,40,84,620
Basic and diluted earnings per share Rs. 19.53 13.19
Nominal value of equity share Rs. 5.00 5.00
Notes to the financial statements 23
The schedules referred to above and the notes to accounts form an integral part of the Consolidated Profit and Loss Account.
As per our report of even date.
For S.R. BATLIBOI & ASSOCIATES For and on behalf of the Board of DirectorsFirm registration number: 101049WChartered Accountants
per S Balasubrahmanyam Kalanithi Maran Kavery Kalanithi R. RaviPartner Chairman and Joint Managing Company SecretaryMembership No.: 053315 Managing Director Director
Chennai Chennai
May 26, 2011 May 26, 2011
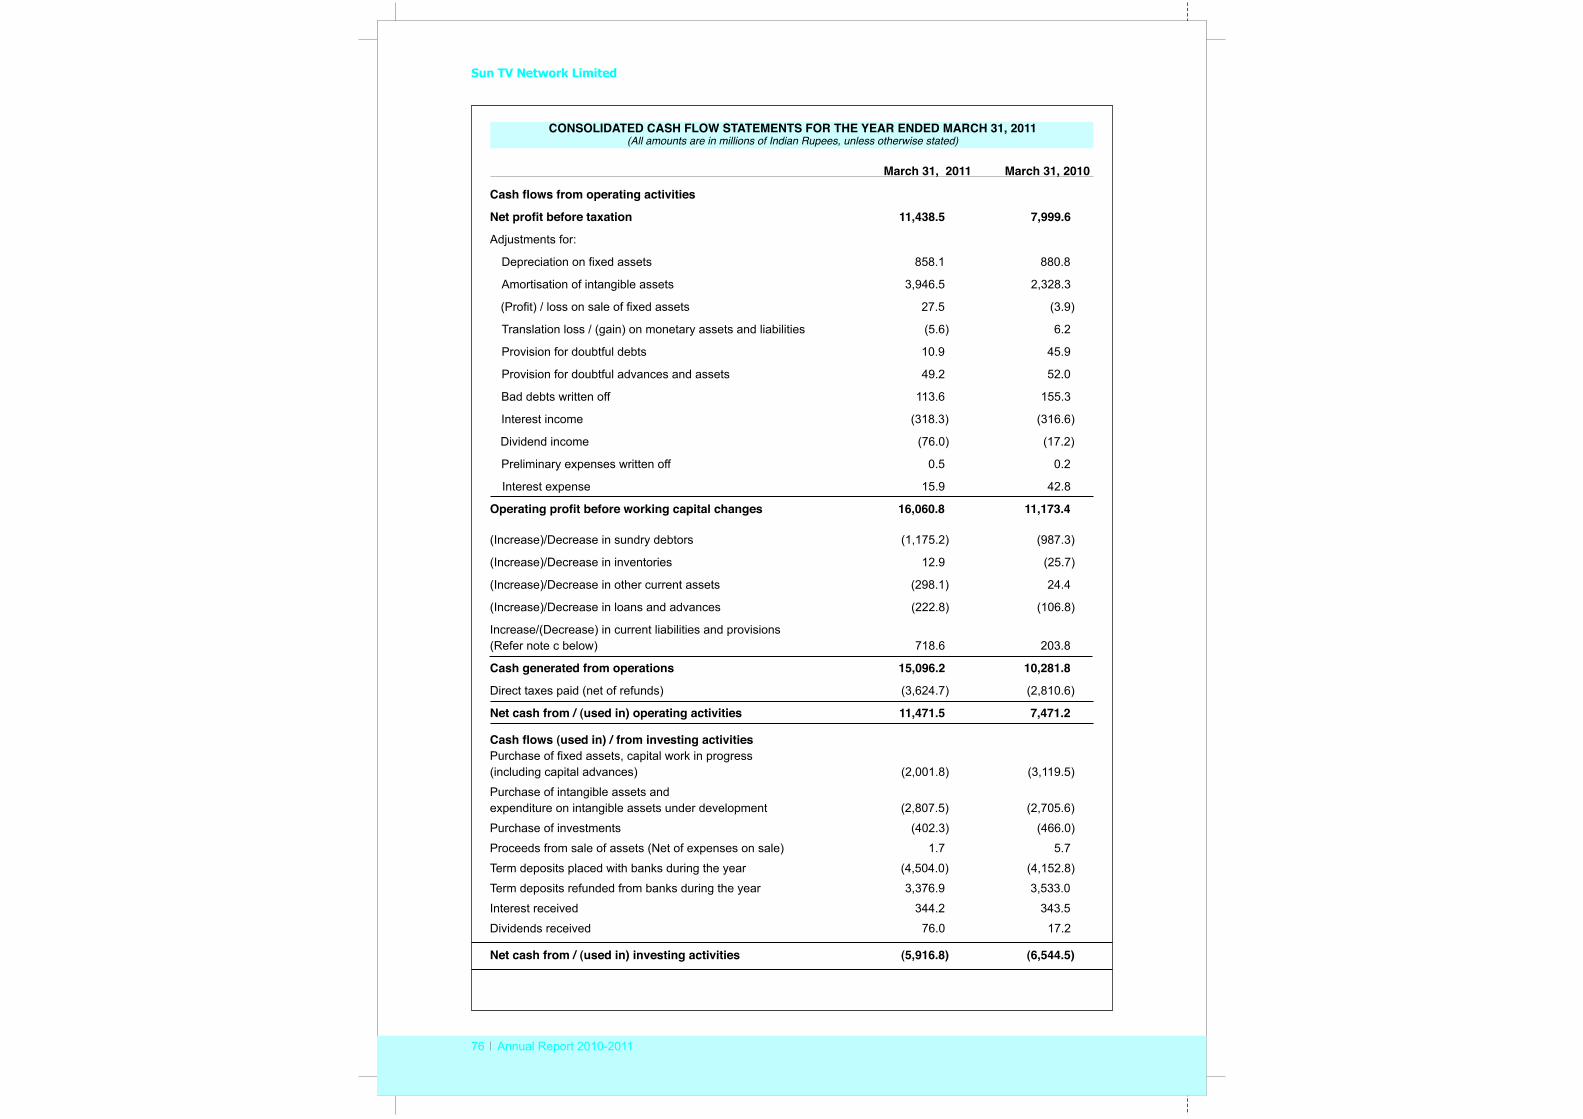
Sun TV Network Limited
76 Annual Report 2010-2011
Cash flows from operating activities
Net profit before taxation 11,438.5 7,999.6
Adjustments for:
Depreciation on fixed assets 858.1 880.8
Amortisation of intangible assets 3,946.5 2,328.3
(Profit) / loss on sale of fixed assets 27.5 (3.9)
Translation loss / (gain) on monetary assets and liabilities (5.6) 6.2
Provision for doubtful debts 10.9 45.9
Provision for doubtful advances and assets 49.2 52.0
Bad debts written off 113.6 155.3
Interest income (318.3) (316.6)
Dividend income (76.0) (17.2)
Preliminary expenses written off 0.5 0.2
Interest expense 15.9 42.8
Operating profit before working capital changes 16,060.8 11,173.4
(Increase)/Decrease in sundry debtors (1,175.2) (987.3)
(Increase)/Decrease in inventories 12.9 (25.7)
(Increase)/Decrease in other current assets (298.1) 24.4
(Increase)/Decrease in loans and advances (222.8) (106.8)
Increase/(Decrease) in current liabilities and provisions (Refer note c below) 718.6 203.8
Cash generated from operations 15,096.2 10,281.8
Direct taxes paid (net of refunds) (3,624.7) (2,810.6)
Net cash from / (used in) operating activities 11,471.5 7,471.2
Cash flows (used in) / from investing activitiesPurchase of fixed assets, capital work in progress (including capital advances) (2,001.8) (3,119.5)
Purchase of intangible assets and expenditure on intangible assets under development (2,807.5) (2,705.6)
Purchase of investments (402.3) (466.0)
Proceeds from sale of assets (Net of expenses on sale) 1.7 5.7
Term deposits placed with banks during the year (4,504.0) (4,152.8)
Term deposits refunded from banks during the year 3,376.9 3,533.0
Interest received 344.2 343.5
Dividends received 76.0 17.2
Net cash from / (used in) investing activities (5,916.8) (6,544.5)
CONSOLIDATED (All amounts are in millions of Indian Rupees, unless otherwise stated)
CASH FLOW STATEMENTS FOR THE YEAR ENDED MARCH 31, 2011
March 31, 2010March 31, 2011
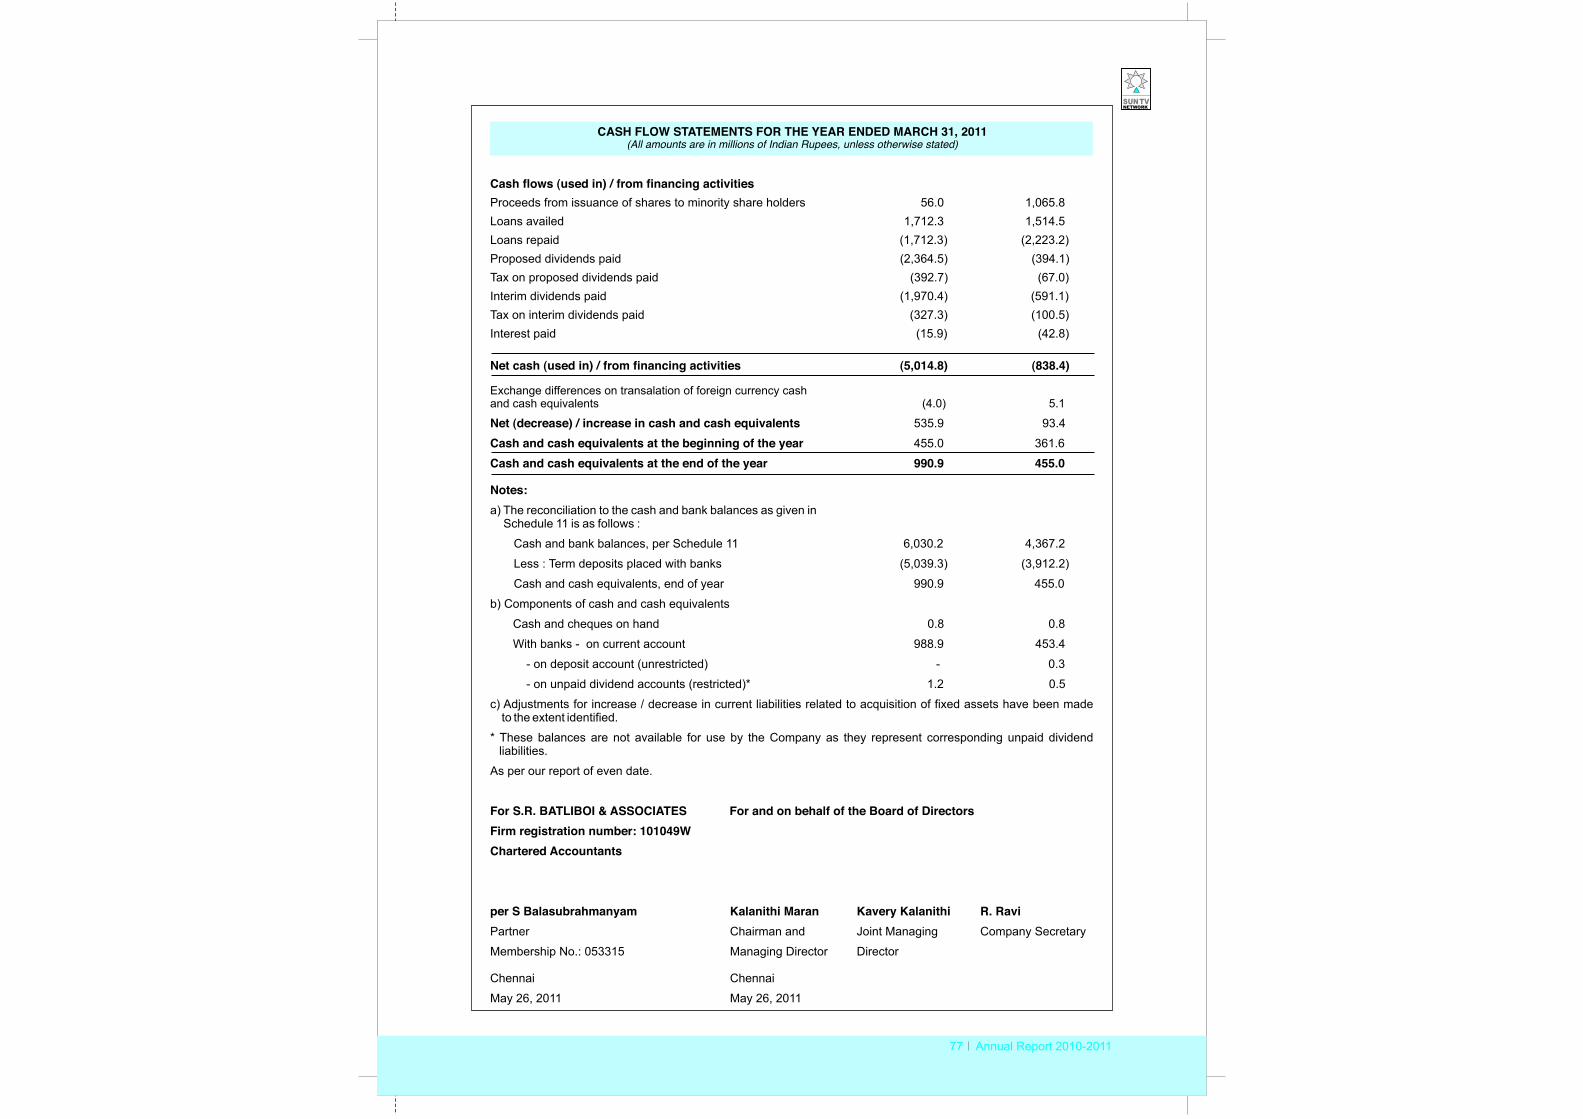
77 Annual Report 2010-2011
Cash flows (used in) / from financing activitiesProceeds from issuance of shares to minority share holders 56.0 1,065.8Loans availed 1,712.3 1,514.5 Loans repaid (1,712.3) (2,223.2)Proposed dividends paid (2,364.5) (394.1)Tax on proposed dividends paid (392.7) (67.0)Interim dividends paid (1,970.4) (591.1)Tax on interim dividends paid (327.3) (100.5)Interest paid (15.9) (42.8)
Net cash (used in) / from financing activities (5,014.8) (838.4)
Exchange differences on transalation of foreign currency cash and cash equivalents (4.0) 5.1
Net (decrease) / increase in cash and cash equivalents 535.9 93.4
Cash and cash equivalents at the beginning of the year 455.0 361.6
Cash and cash equivalents at the end of the year 990.9 455.0
Notes:a) The reconciliation to the cash and bank balances as given in
Schedule 11 is as follows :
Cash and bank balances, per Schedule 11 6,030.2 4,367.2
Less : Term deposits placed with banks (5,039.3) (3,912.2)
Cash and cash equivalents, end of year 990.9 455.0
b) Components of cash and cash equivalents
Cash and cheques on hand 0.8 0.8
With banks - on current account 988.9 453.4
- on deposit account (unrestricted) - 0.3
- on unpaid dividend accounts (restricted)* 1.2 0.5
c) Adjustments for increase / decrease in current liabilities related to acquisition of fixed assets have been made to the extent identified.
* These balances are not available for use by the Company as they represent corresponding unpaid dividend liabilities.
As per our report of even date.
For S.R. BATLIBOI & ASSOCIATES For and on behalf of the Board of DirectorsFirm registration number: 101049WChartered Accountants
per S Balasubrahmanyam Kalanithi Maran Kavery Kalanithi R. RaviPartner Chairman and Joint Managing Company Secretary
Membership No.: 053315 Managing Director Director
Chennai Chennai
May 26, 2011 May 26, 2011
CASH FLOW STATEMENTS FOR THE YEAR ENDED MARCH 31, 2011(All amounts are in millions of Indian Rupees, unless otherwise stated)
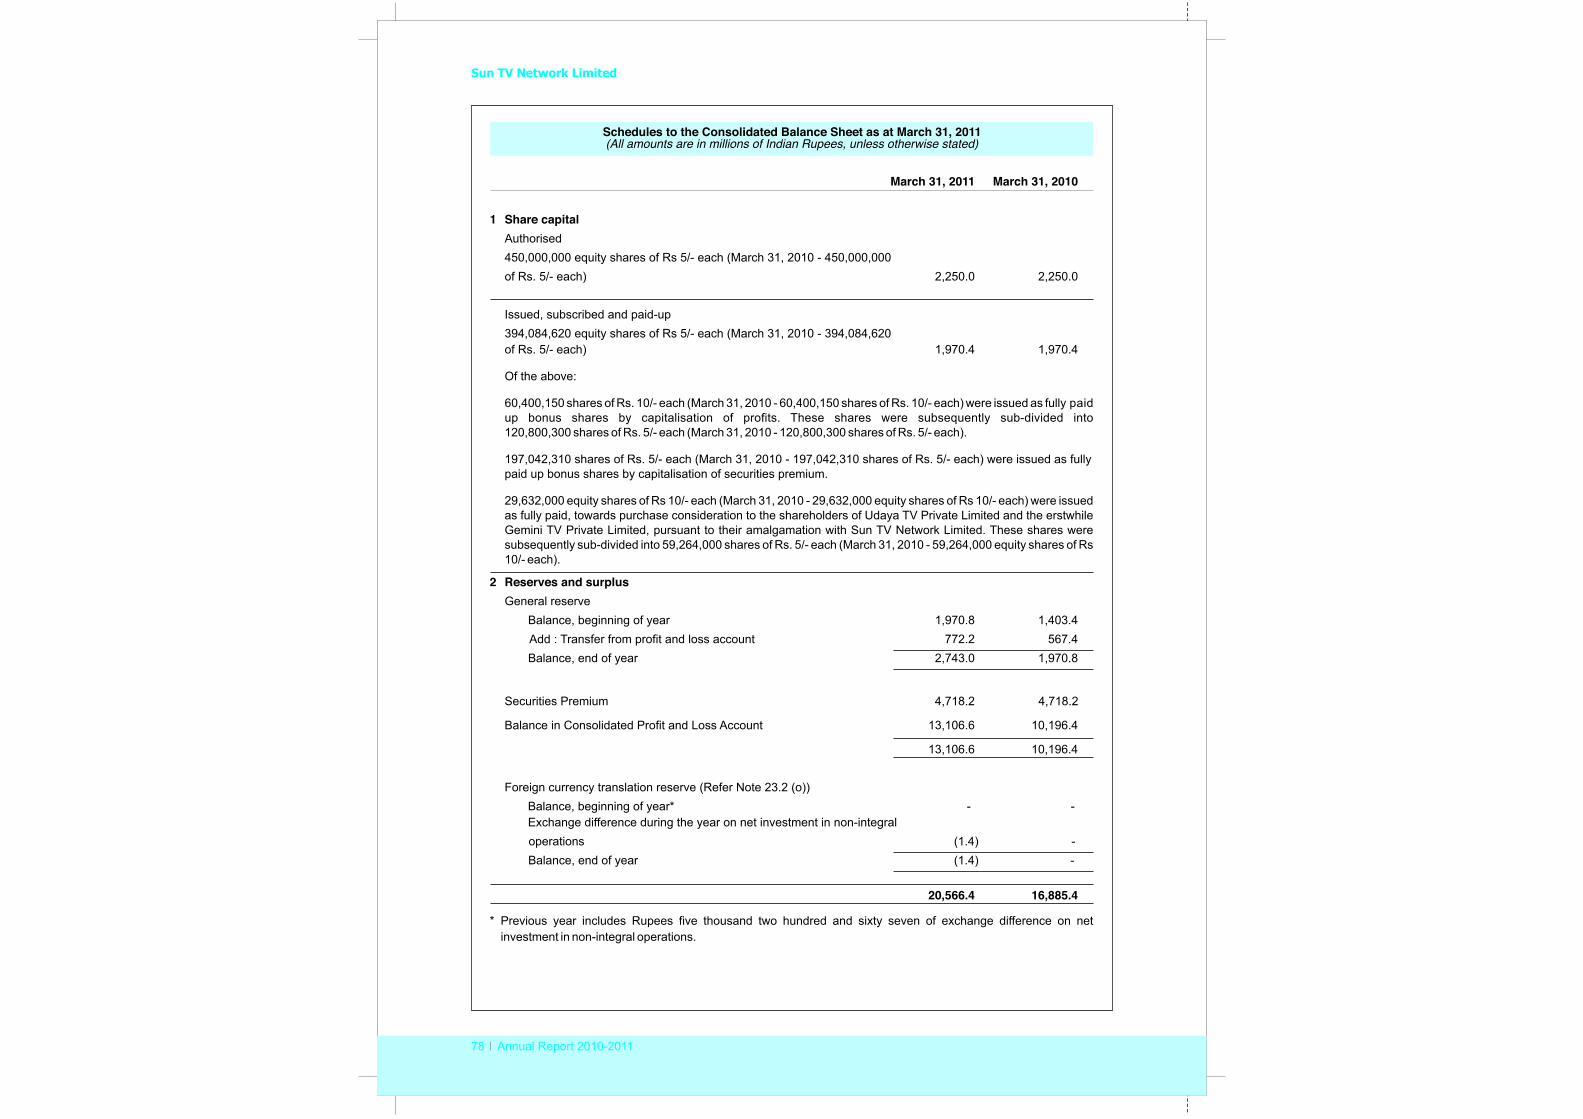
Sun TV Network Limited
78 Annual Report 2010-2011
Schedules to the Consolidated Balance Sheet as at March 31, 2011(All amounts are in millions of Indian Rupees, unless otherwise stated)
March 31, 2011 March 31, 2010
1 Share capitalAuthorised 450,000,000 equity shares of Rs 5/- each (March 31, 2010 - 450,000,000 of Rs. 5/- each) 2,250.0 2,250.0
Issued, subscribed and paid-up394,084,620 equity shares of Rs 5/- each (March 31, 2010 - 394,084,620 of Rs. 5/- each) 1,970.4 1,970.4
Of the above:
60,400,150 shares of Rs. 10/- each (March 31, 2010 - 60,400,150 shares of Rs. 10/- each) were issued as fully paid up bonus shares by capitalisation of profits. These shares were subsequently sub-divided into 120,800,300 shares of Rs. 5/- each (March 31, 2010 - 120,800,300 shares of Rs. 5/- each).
197,042,310 shares of Rs. 5/- each (March 31, 2010 - 197,042,310 shares of Rs. 5/- each) were issued as fully paid up bonus shares by capitalisation of securities premium.
29,632,000 equity shares of Rs 10/- each (March 31, 2010 - 29,632,000 equity shares of Rs 10/- each) were issued as fully paid, towards purchase consideration to the shareholders of Udaya TV Private Limited and the erstwhile Gemini TV Private Limited, pursuant to their amalgamation with Sun TV Network Limited. These shares were subsequently sub-divided into 59,264,000 shares of Rs. 5/- each (March 31, 2010 - 59,264,000 equity shares of Rs 10/- each).
2 Reserves and surplusGeneral reserve
Balance, beginning of year 1,970.8 1,403.4 Add : Transfer from profit and loss account 772.2 567.4 Balance, end of year 2,743.0 1,970.8
Securities Premium 4,718.2 4,718.2
Balance in Consolidated Profit and Loss Account 13,106.6 10,196.4
13,106.6 10,196.4
Foreign currency translation reserve (Refer Note 23.2 (o))Balance, beginning of year* - -Exchange difference during the year on net investment in non-integral operations (1.4) -Balance, end of year (1.4) -
20,566.4 16,885.4
* Previous year includes Rupees five thousand two hundred and sixty seven of exchange difference on net investment in non-integral operations.
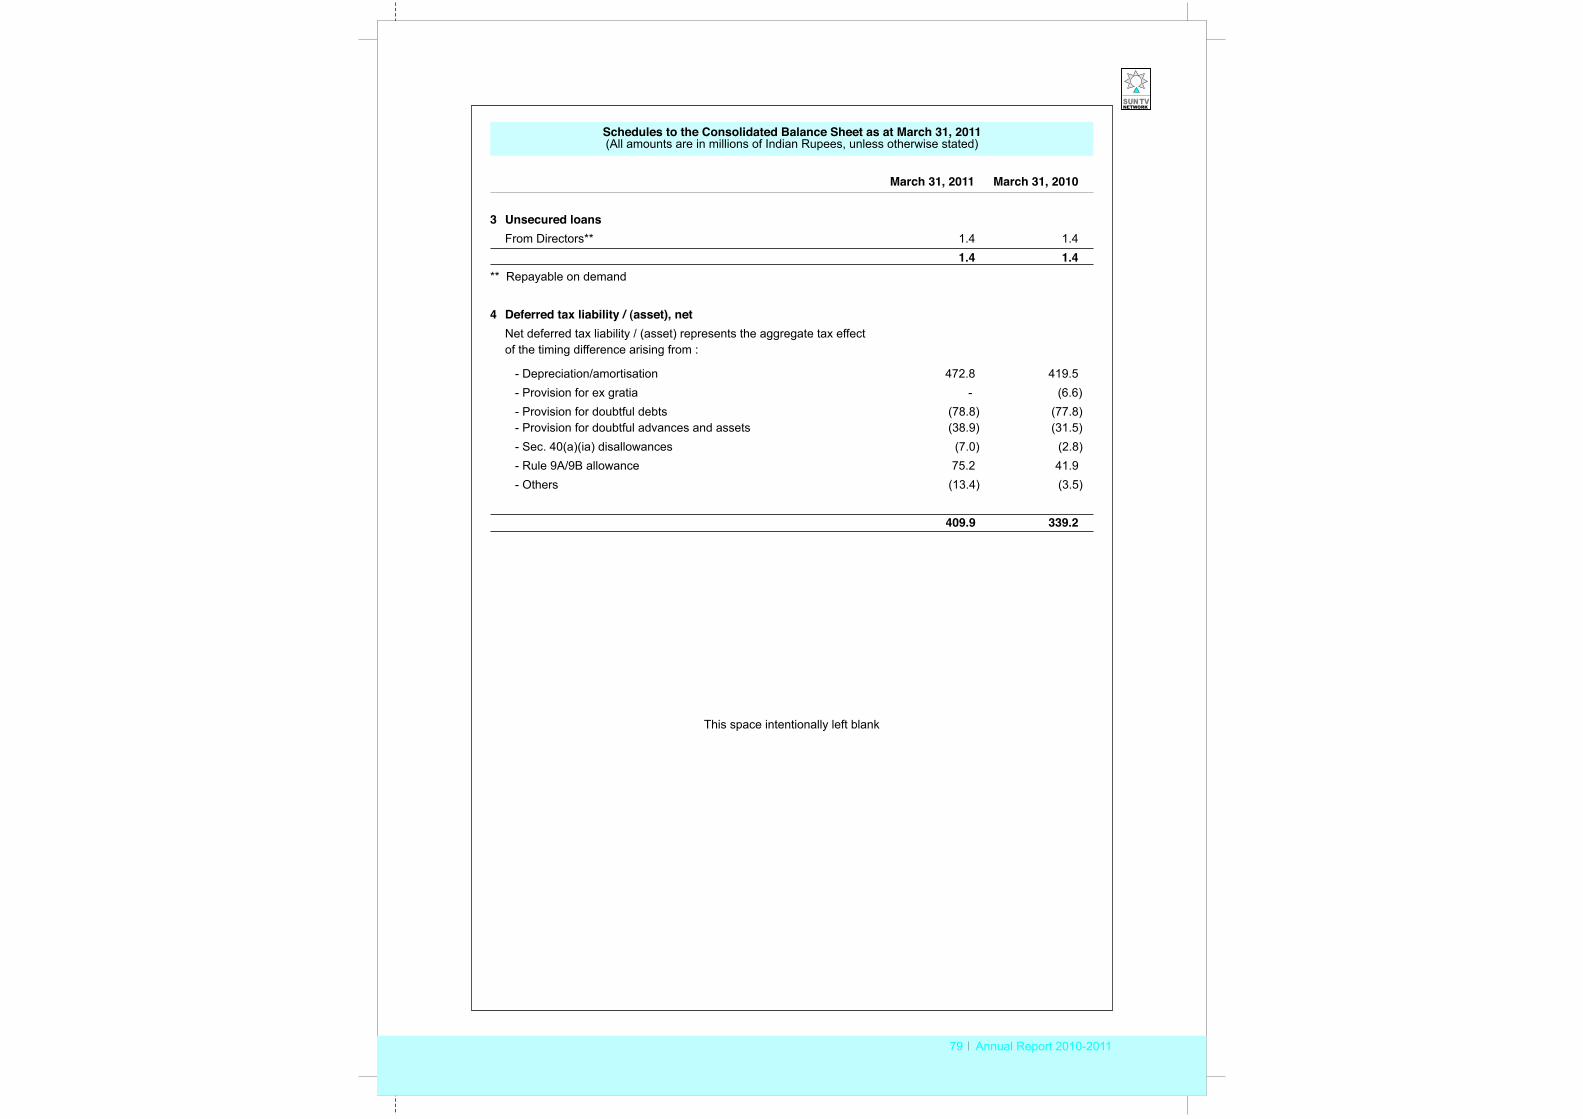
79 Annual Report 2010-2011
Schedules to the Consolidated Balance Sheet as at March 31, 2011(All amounts are in millions of Indian Rupees, unless otherwise stated)
3 Unsecured loansFrom Directors** 1.4 1.4
1.4 1.4** Repayable on demand
4 Deferred tax liability / (asset), netNet deferred tax liability / (asset) represents the aggregate tax effect of the timing difference arising from :
- Depreciation/amortisation 472.8 419.5 - Provision for ex gratia - (6.6) - Provision for doubtful debts (78.8) (77.8) - Provision for doubtful advances and assets (38.9) (31.5) - Sec. 40(a)(ia) disallowances (7.0) (2.8) - Rule 9A/9B allowance 75.2 41.9 - Others (13.4) (3.5)
409.9 339.2
March 31, 2011 March 31, 2010
This space intentionally left blank
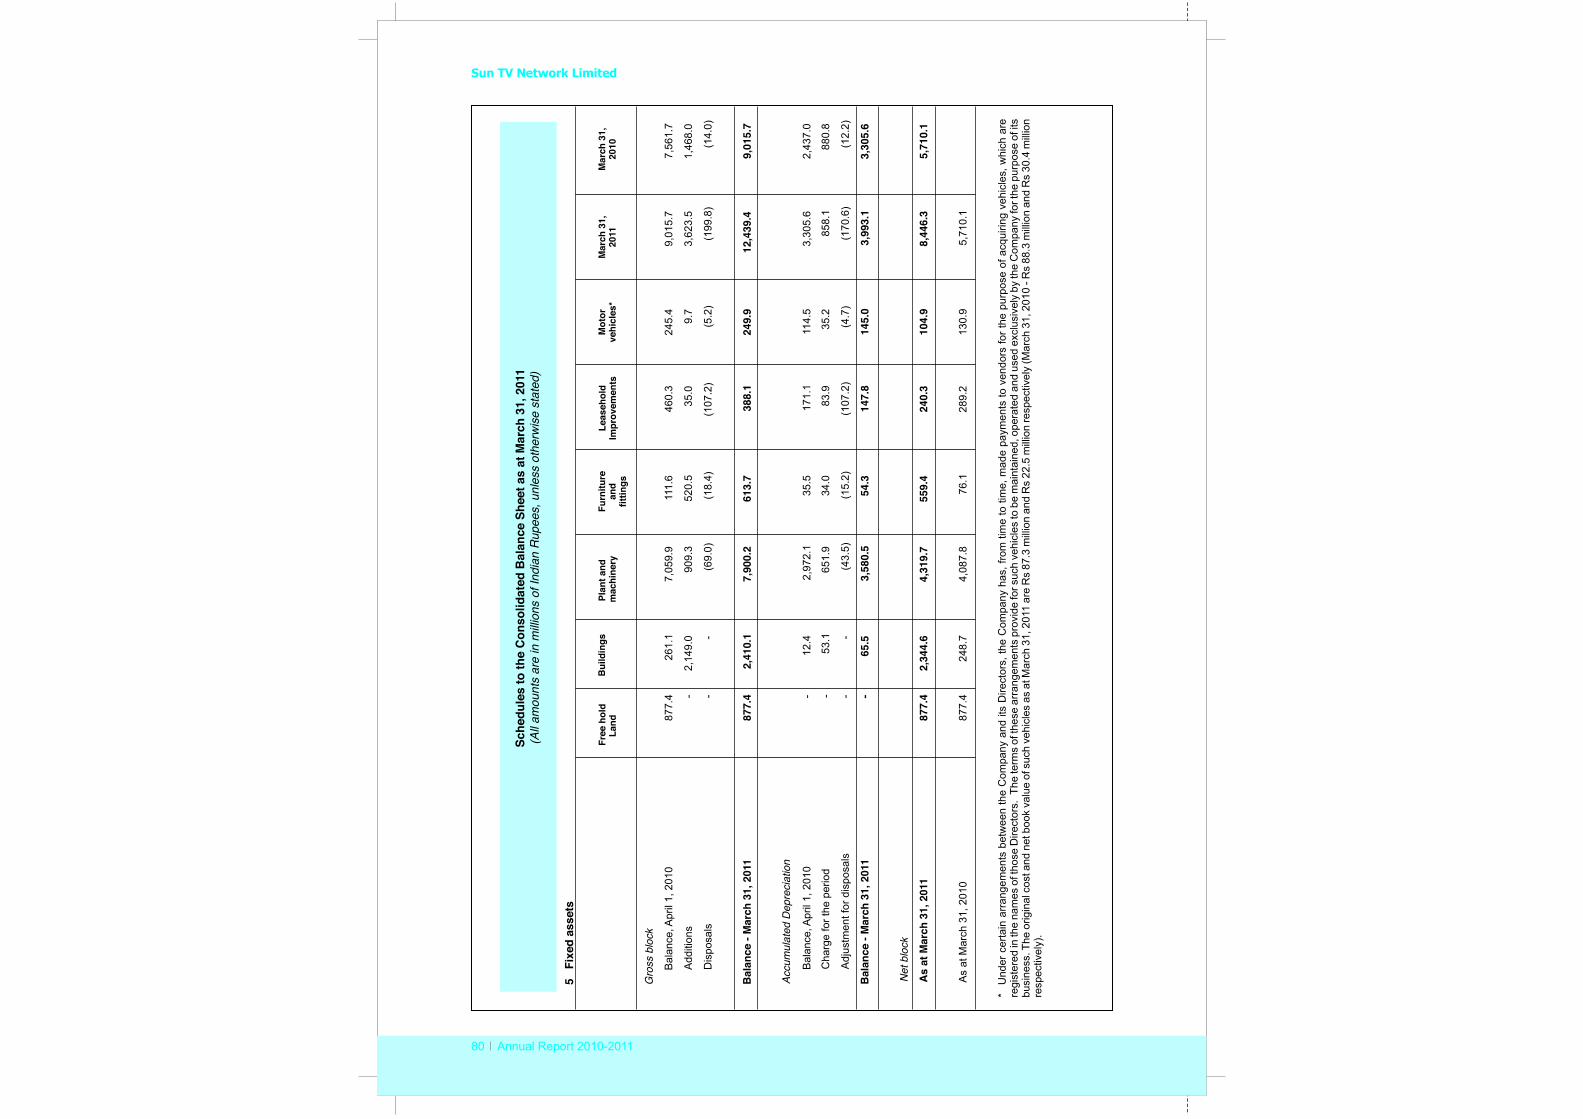
Sun TV Network Limited
80 Annual Report 2010-2011
Gro
ss b
lock
Bal
ance
, Apr
il 1,
201
087
7.4
261.
17,
059.
911
1.6
460.
324
5.4
9,01
5.7
7,56
1.7
Add
ition
s -
2,14
9.0
909.
352
0.5
35.0
9.7
3,62
3.5
1,46
8.0
Dis
posa
ls
--
(69.
0)(1
8.4)
(107
.2)
(5.2
)(1
99.8
)(1
4.0)
B
alan
ce -
Mar
ch 3
1, 2
011
877.
42,
410.
17,
900.
261
3.7
388.
124
9.9
12,4
39.4
9,01
5.7
Acc
umul
ated
Dep
reci
atio
n
Bal
ance
, Apr
il 1,
201
0-
12.4
2,97
2.1
35.5
171.
111
4.5
3,30
5.6
2,43
7.0
Cha
rge
for t
he p
erio
d -
53.1
651.
934
.083
.935
.285
8.1
880.
8
A
djus
tmen
t for
dis
posa
ls
--
(43.
5)(1
5.2)
(107
.2)
(4.7
)(1
70.6
)(1
2.2)
Bal
ance
- M
arch
31,
201
1-
65.5
3,58
0.5
54.3
147.
814
5.0
3,99
3.1
3,30
5.6
Net
blo
ck
As
at M
arch
31,
201
1
877.
42,
344.
64,
319.
755
9.4
240.
310
4.9
8,44
6.3
5,71
0.1
As
at M
arch
31,
201
0
877.
424
8.7
4,08
7.8
76.1
289.
213
0.9
5,71
0.1
*U
nder
cer
tain
arr
ange
men
ts b
etw
een
the
Com
pany
and
its
Dire
ctor
s, th
e C
ompa
ny h
as, f
rom
tim
e to
tim
e, m
ade
paym
ents
to v
endo
rs fo
r the
pur
pose
of a
cqui
ring
vehi
cles
, whi
ch a
re
regi
ster
ed in
the
nam
es o
f tho
se D
irect
ors.
The
term
s of
thes
e ar
rang
emen
ts p
rovi
de fo
r suc
h ve
hicl
es to
be
mai
ntai
ned,
ope
rate
d an
d us
ed e
xclu
sive
ly b
y th
e C
ompa
ny fo
r the
pur
pose
of i
ts
busi
ness
. The
orig
inal
cos
t and
net
boo
k va
lue
of s
uch
vehi
cles
as
at M
arch
31,
201
1 ar
e R
s 87
.3 m
illio
n an
d R
s 22
.5 m
illio
n re
spec
tivel
y (M
arch
31,
201
0 - R
s 88
.3 m
illio
n an
d R
s 30
.4 m
illio
n re
spec
tivel
y).
Fre
e ho
ld
Land
Bui
ldin
gsPl
ant a
nd m
achi
nery
Furn
iture
and
fittin
gs
Leas
ehol
dIm
prov
emen
tsM
otor
vehi
cles
*M
arch
31,
2011
Mar
ch 3
1,20
10
Sche
dule
s to
the
Con
solid
ated
Bal
ance
She
et a
s at
Mar
ch 3
1, 2
011
(All
amou
nts
are
in m
illion
s of
Indi
an R
upee
s, u
nles
s ot
herw
ise
stat
ed)
5 F
ixed
ass
ets
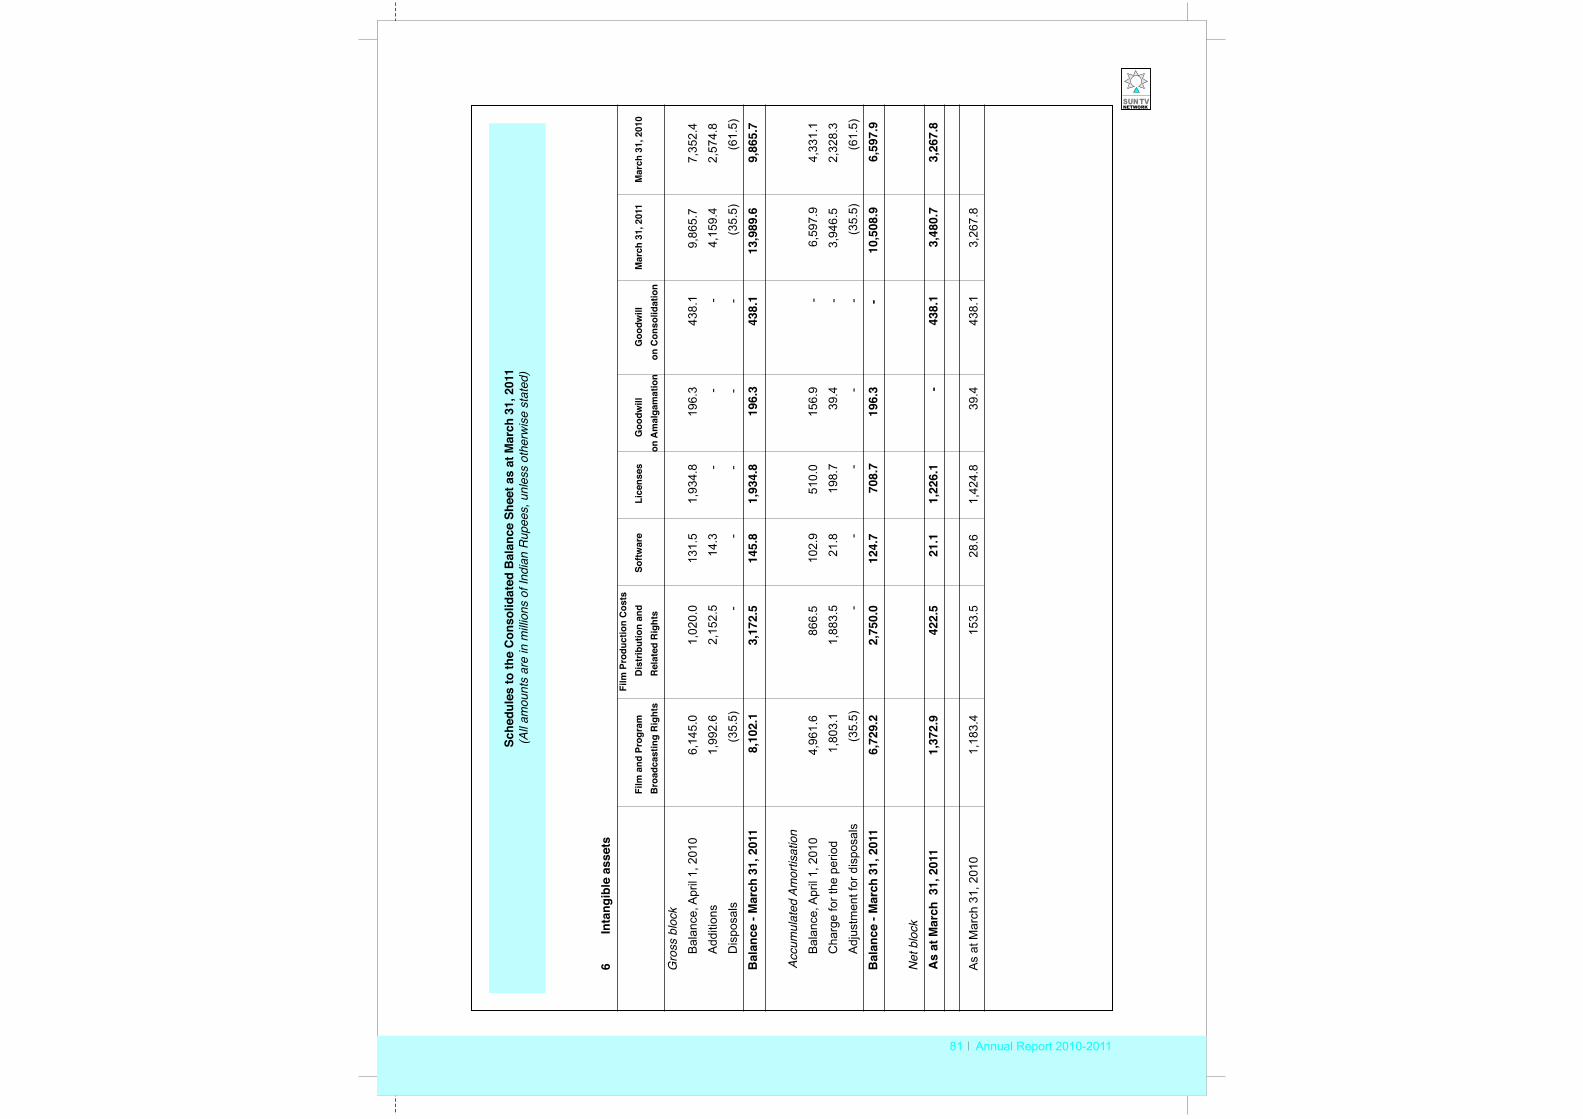
81 Annual Report 2010-2011
6 In
tang
ible
ass
ets
Film
Pro
duct
ion
Cos
tsFi
lm a
nd P
rogr
amD
istr
ibut
ion
and
Softw
are
Lice
nses
Goo
dwill
Goo
dwill
Mar
ch 3
1, 2
011
Mar
ch 3
1, 2
010
Bro
adca
stin
g R
ight
sR
elat
ed R
ight
son
Am
alga
mat
ion
on C
onso
lidat
ion
Gro
ss b
lock
Bal
ance
, Apr
il 1,
201
0 6
,145
.0
1,02
0.0
131.
5 1
,934
.8
196
.3
438.
1 9
,865
.7
7,3
52.4
Add
ition
s 1
,992
.6
2,1
52.5
14.3
- -
-
4,15
9.4
2,5
74.8
Dis
posa
ls(3
5.5)
-
-
-
-
-
(35.
5)(6
1.5)
Bal
ance
- M
arch
31,
201
1 8
,102
.1
3,17
2.5
145.
8 1
,934
.8
196
.3
438
.113
,989
.6 9
,865
.7
Accu
mul
ated
Am
ortis
atio
nB
alan
ce, A
pril
1, 2
010
4,9
61.6
866
.5
102
.9
510
.0
156.
9 -
6,
597.
9 4
,331
.1
Cha
rge
for t
he p
erio
d 1
,803
.11,
883.
5 2
1.8
198.
7 3
9.4
-
3,9
46.5
2
,328
.3
Adj
ustm
ent f
or d
ispo
sals
(35.
5)
-
-
-
-
-
(35.
5)
(61.
5)
Bal
ance
- M
arch
31,
201
16,
729.
2 2
,750
.0 1
24.7
708.
719
6.3
-
10,5
08.9
6,
597.
9
Net
blo
ckA
s at
Mar
ch 3
1, 2
011
1,3
72.9
422.
521
.1 1
,226
.1-
438.
13,
480.
7 3,
267.
8
As
at M
arch
31,
201
0 1
,183
.4
153
.5
28.
6 1
,424
.8 3
9.4
438
.1
3,26
7.8
Sche
dule
s to
the
Con
solid
ated
Bal
ance
She
et a
s at
Mar
ch 3
1, 2
011
(All
amou
nts
are
in m
illion
s of
Indi
an R
upee
s, u
nles
s ot
herw
ise
stat
ed)
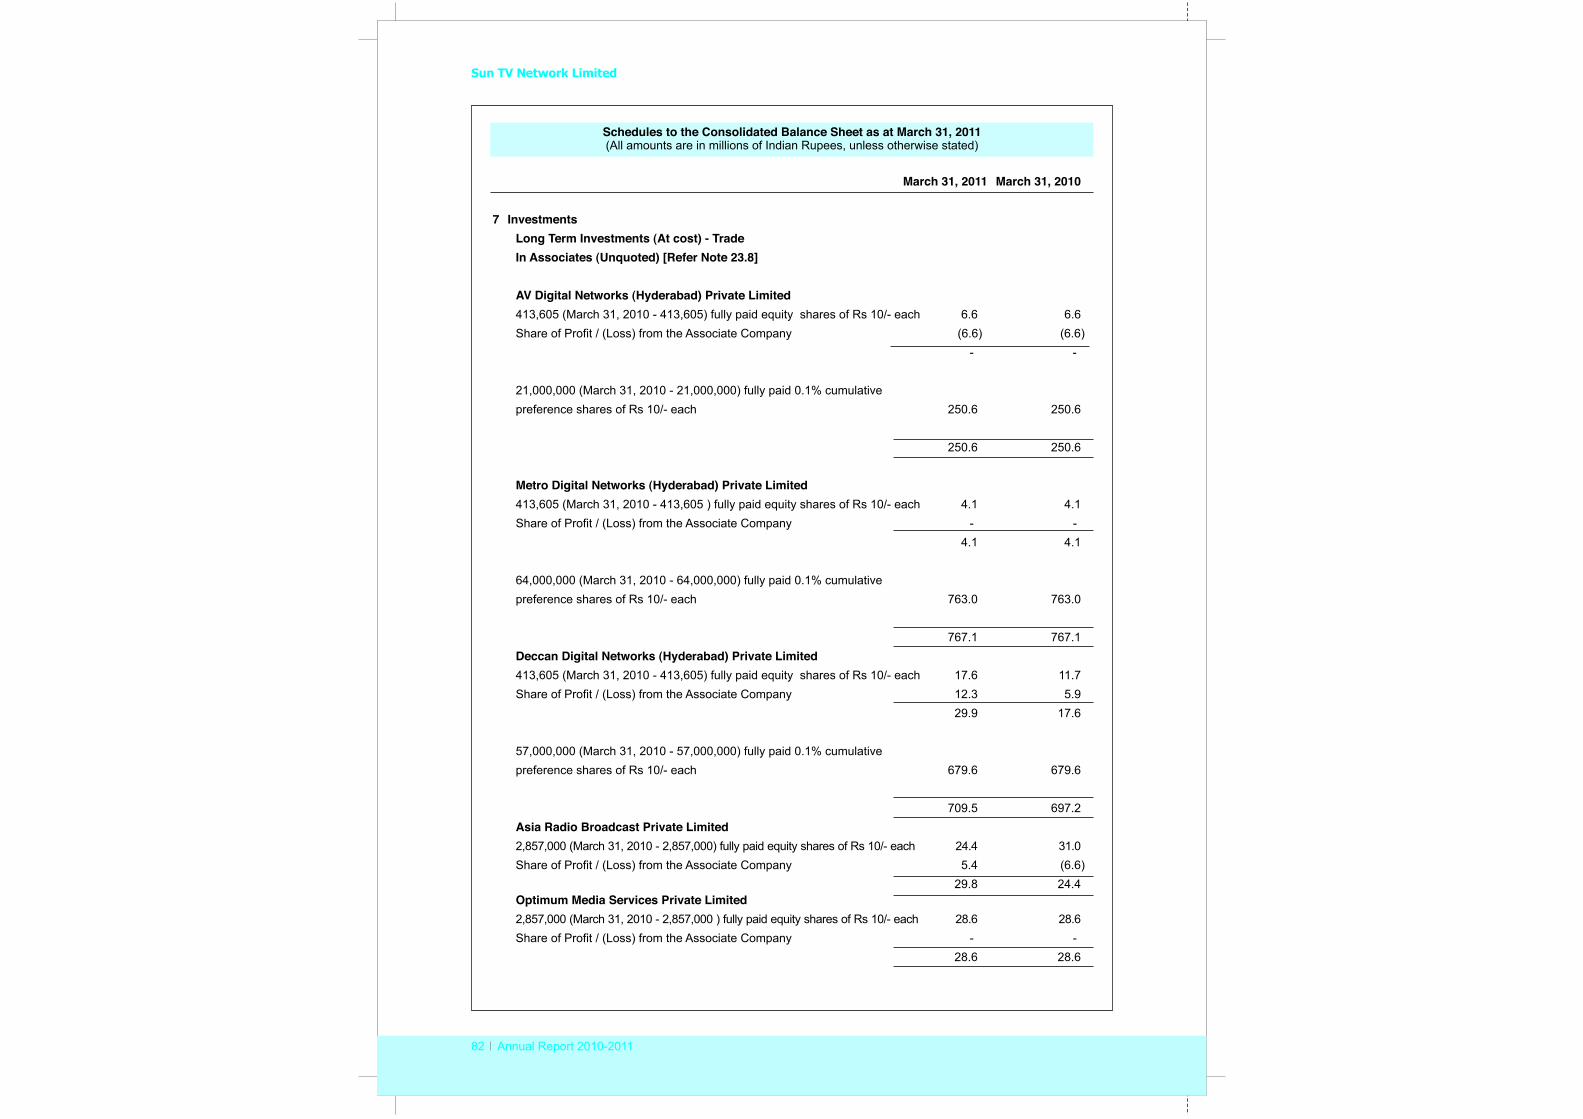
Sun TV Network Limited
82 Annual Report 2010-2011
Schedules to the Consolidated Balance Sheet as at March 31, 2011(All amounts are in millions of Indian Rupees, unless otherwise stated)
7 InvestmentsLong Term Investments (At cost) - TradeIn Associates (Unquoted) [Refer Note 23.8]
AV Digital Networks (Hyderabad) Private Limited413,605 (March 31, 2010 - 413,605) fully paid equity shares of Rs 10/- each 6.6 6.6Share of Profit / (Loss) from the Associate Company (6.6) (6.6)
- -
21,000,000 (March 31, 2010 - 21,000,000) fully paid 0.1% cumulative preference shares of Rs 10/- each 250.6 250.6
250.6 250.6
Metro Digital Networks (Hyderabad) Private Limited413,605 (March 31, 2010 - 413,605 ) fully paid equity shares of Rs 10/- each 4.1 4.1 Share of Profit / (Loss) from the Associate Company - -
4.1 4.1
64,000,000 (March 31, 2010 - 64,000,000) fully paid 0.1% cumulative preference shares of Rs 10/- each 763.0 763.0
767.1 767.1 Deccan Digital Networks (Hyderabad) Private Limited413,605 (March 31, 2010 - 413,605) fully paid equity shares of Rs 10/- each 17.6 11.7 Share of Profit / (Loss) from the Associate Company 12.3 5.9
29.9 17.6
57,000,000 (March 31, 2010 - 57,000,000) fully paid 0.1% cumulative preference shares of Rs 10/- each 679.6 679.6
709.5 697.2 Asia Radio Broadcast Private Limited2,857,000 (March 31, 2010 - 2,857,000) fully paid equity shares of Rs 10/- each 24.4 31.0Share of Profit / (Loss) from the Associate Company 5.4 (6.6)
29.8 24.4 Optimum Media Services Private Limited2,857,000 (March 31, 2010 - 2,857,000 ) fully paid equity shares of Rs 10/- each 28.6 28.6 Share of Profit / (Loss) from the Associate Company - -
28.6 28.6
March 31, 2011 March 31, 2010
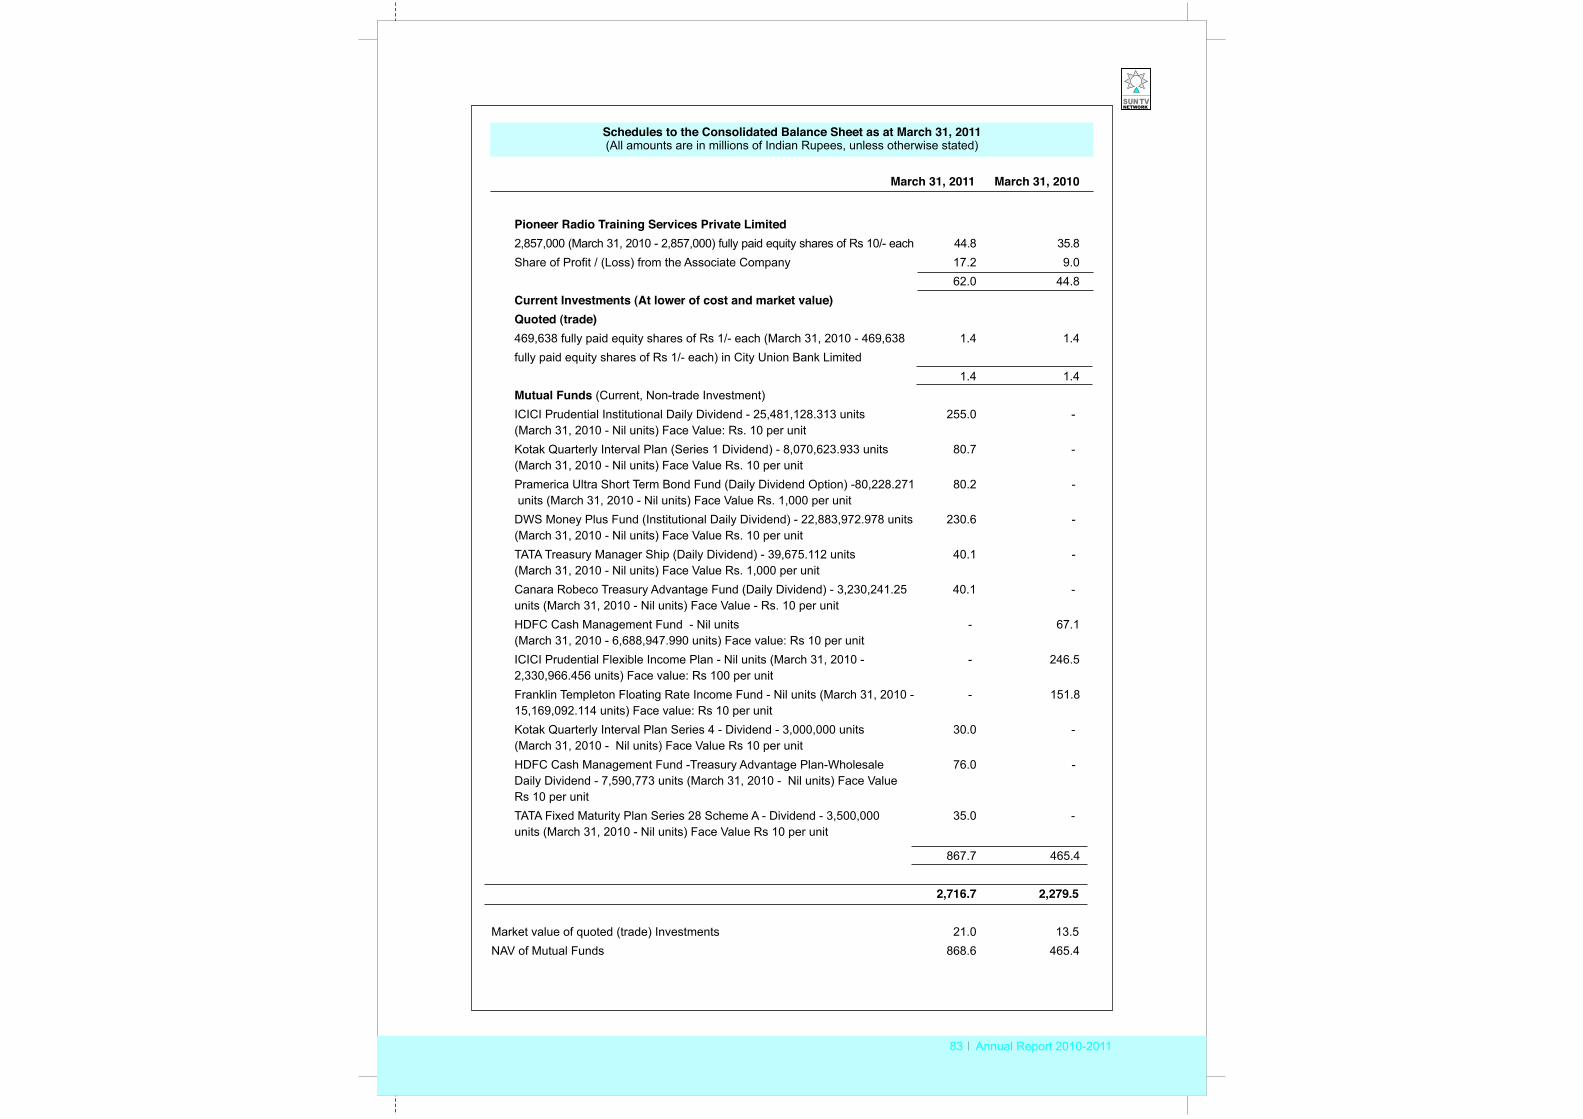
83 Annual Report 2010-2011
Schedules to the Consolidated Balance Sheet as at March 31, 2011(All amounts are in millions of Indian Rupees, unless otherwise stated)
Pioneer Radio Training Services Private Limited2,857,000 (March 31, 2010 - 2,857,000) fully paid equity shares of Rs 10/- each 44.8 35.8Share of Profit / (Loss) from the Associate Company 17.2 9.0
62.0 44.8 Current Investments (At lower of cost and market value)Quoted (trade)469,638 fully paid equity shares of Rs 1/- each (March 31, 2010 - 469,638 1.4 1.4fully paid equity shares of Rs 1/- each) in City Union Bank Limited
1.4 1.4 Mutual Funds (Current, Non-trade Investment)ICICI Prudential Institutional Daily Dividend - 25,481,128.313 units 255.0 - (March 31, 2010 - Nil units) Face Value: Rs. 10 per unitKotak Quarterly Interval Plan (Series 1 Dividend) - 8,070,623.933 units 80.7 -(March 31, 2010 - Nil units) Face Value Rs. 10 per unitPramerica Ultra Short Term Bond Fund (Daily Dividend Option) -80,228.271 80.2 - units (March 31, 2010 - Nil units) Face Value Rs. 1,000 per unitDWS Money Plus Fund (Institutional Daily Dividend) - 22,883,972.978 units 230.6 -(March 31, 2010 - Nil units) Face Value Rs. 10 per unitTATA Treasury Manager Ship (Daily Dividend) - 39,675.112 units 40.1 -(March 31, 2010 - Nil units) Face Value Rs. 1,000 per unitCanara Robeco Treasury Advantage Fund (Daily Dividend) - 3,230,241.25 40.1 -units (March 31, 2010 - Nil units) Face Value - Rs. 10 per unitHDFC Cash Management Fund - Nil units - 67.1 (March 31, 2010 - 6,688,947.990 units) Face value: Rs 10 per unitICICI Prudential Flexible Income Plan - Nil units (March 31, 2010 - - 246.52,330,966.456 units) Face value: Rs 100 per unitFranklin Templeton Floating Rate Income Fund - Nil units (March 31, 2010 - - 151.8 15,169,092.114 units) Face value: Rs 10 per unitKotak Quarterly Interval Plan Series 4 - Dividend - 3,000,000 units 30.0 -(March 31, 2010 - Nil units) Face Value Rs 10 per unitHDFC Cash Management Fund -Treasury Advantage Plan-Wholesale 76.0 -Daily Dividend - 7,590,773 units (March 31, 2010 - Nil units) Face Value Rs 10 per unitTATA Fixed Maturity Plan Series 28 Scheme A - Dividend - 3,500,000 35.0 -units (March 31, 2010 - Nil units) Face Value Rs 10 per unit
867.7 465.4
2,716.7 2,279.5
Market value of quoted (trade) Investments 21.0 13.5NAV of Mutual Funds 868.6 465.4
March 31, 2011 March 31, 2010
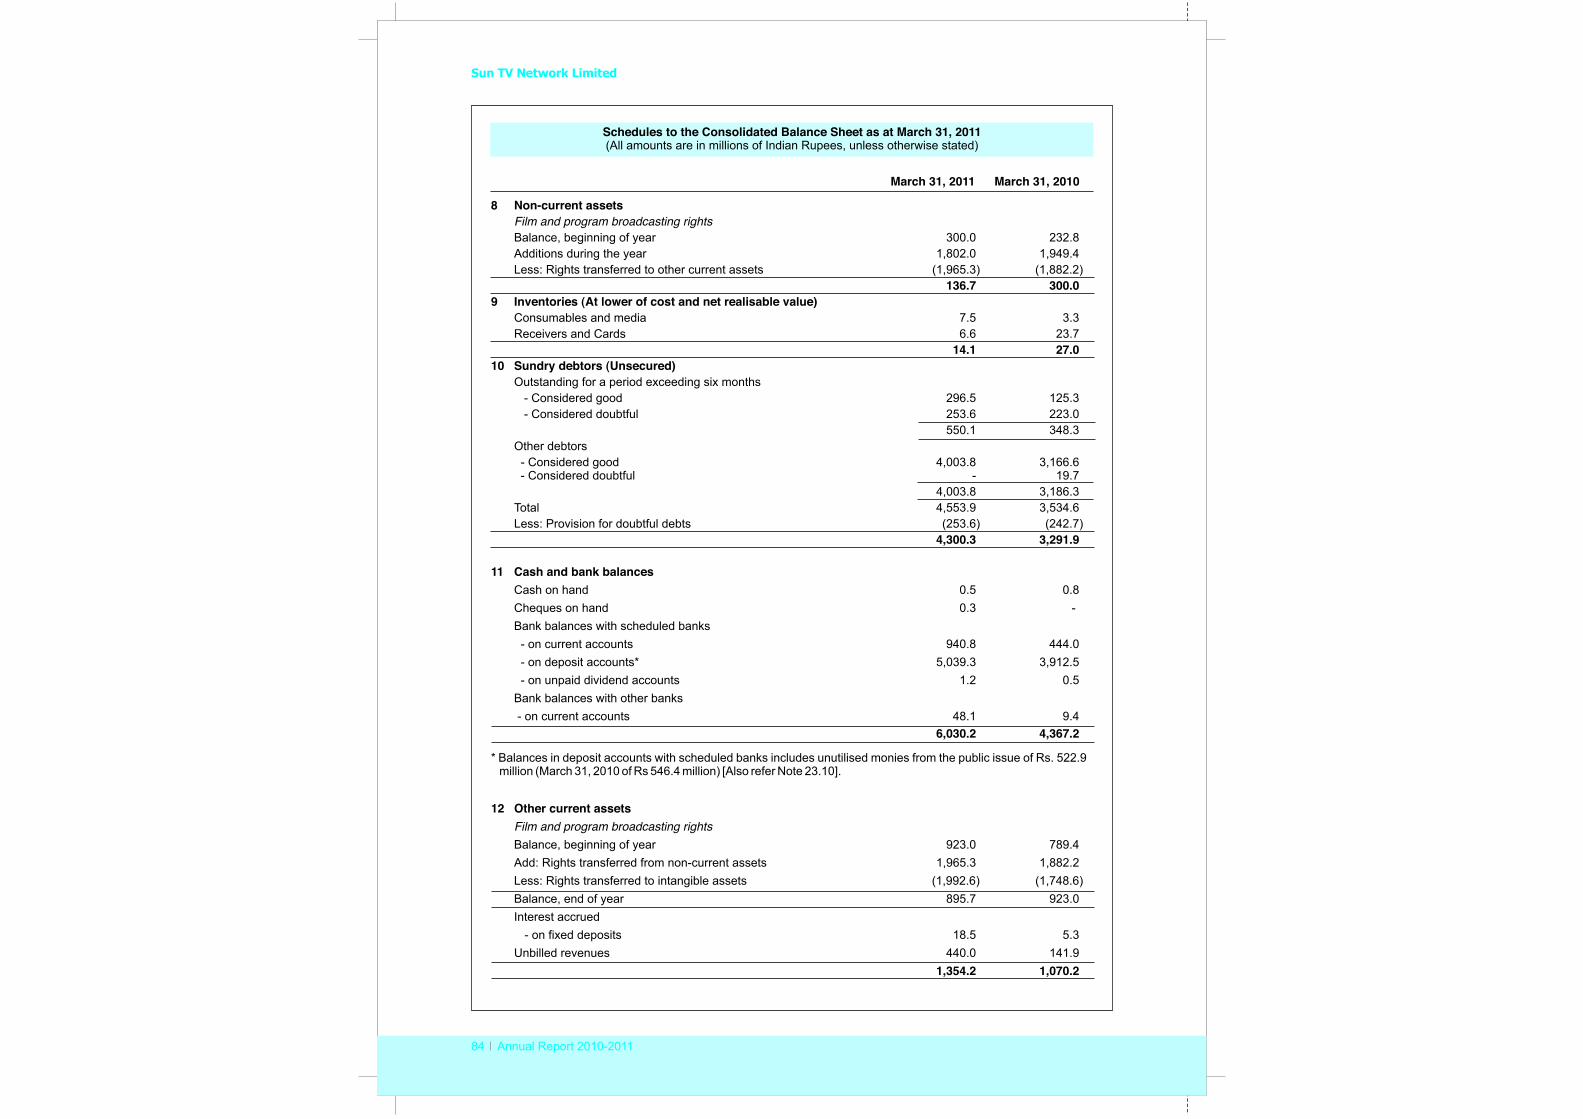
Sun TV Network Limited
84 Annual Report 2010-2011
Schedules to the Consolidated Balance Sheet as at March 31, 2011(All amounts are in millions of Indian Rupees, unless otherwise stated)
8 Non-current assets Film and program broadcasting rightsBalance, beginning of year 300.0 232.8 Additions during the year 1,802.0 1,949.4 Less: Rights transferred to other current assets (1,965.3) (1,882.2)
136.7 300.0 9 Inventories (At lower of cost and net realisable value)
Consumables and media 7.5 3.3 Receivers and Cards 6.6 23.7
14.1 27.010 Sundry debtors (Unsecured)
Outstanding for a period exceeding six months - Considered good 296.5 125.3 - Considered doubtful 253.6 223.0
550.1 348.3Other debtors - Considered good 4,003.8 3,166.6 - Considered doubtful - 19.7
4,003.8 3,186.3 Total 4,553.9 3,534.6Less: Provision for doubtful debts (253.6) (242.7)
4,300.3 3,291.9
11 Cash and bank balancesCash on hand 0.5 0.8 Cheques on hand 0.3 - Bank balances with scheduled banks - on current accounts 940.8 444.0 - on deposit accounts* 5,039.3 3,912.5 - on unpaid dividend accounts 1.2 0.5Bank balances with other banks - on current accounts 48.1 9.4
6,030.2 4,367.2
* Balances in deposit accounts with scheduled banks includes unutilised monies from the public issue of Rs. 522.9 million (March 31, 2010 of Rs 546.4 million) [Also refer Note 23.10].
12 Other current assets Film and program broadcasting rightsBalance, beginning of year 923.0 789.4 Add: Rights transferred from non-current assets 1,965.3 1,882.2 Less: Rights transferred to intangible assets (1,992.6) (1,748.6)Balance, end of year 895.7 923.0Interest accrued
- on fixed deposits 18.5 5.3 Unbilled revenues 440.0 141.9
1,354.2 1,070.2
March 31, 2011 March 31, 2010
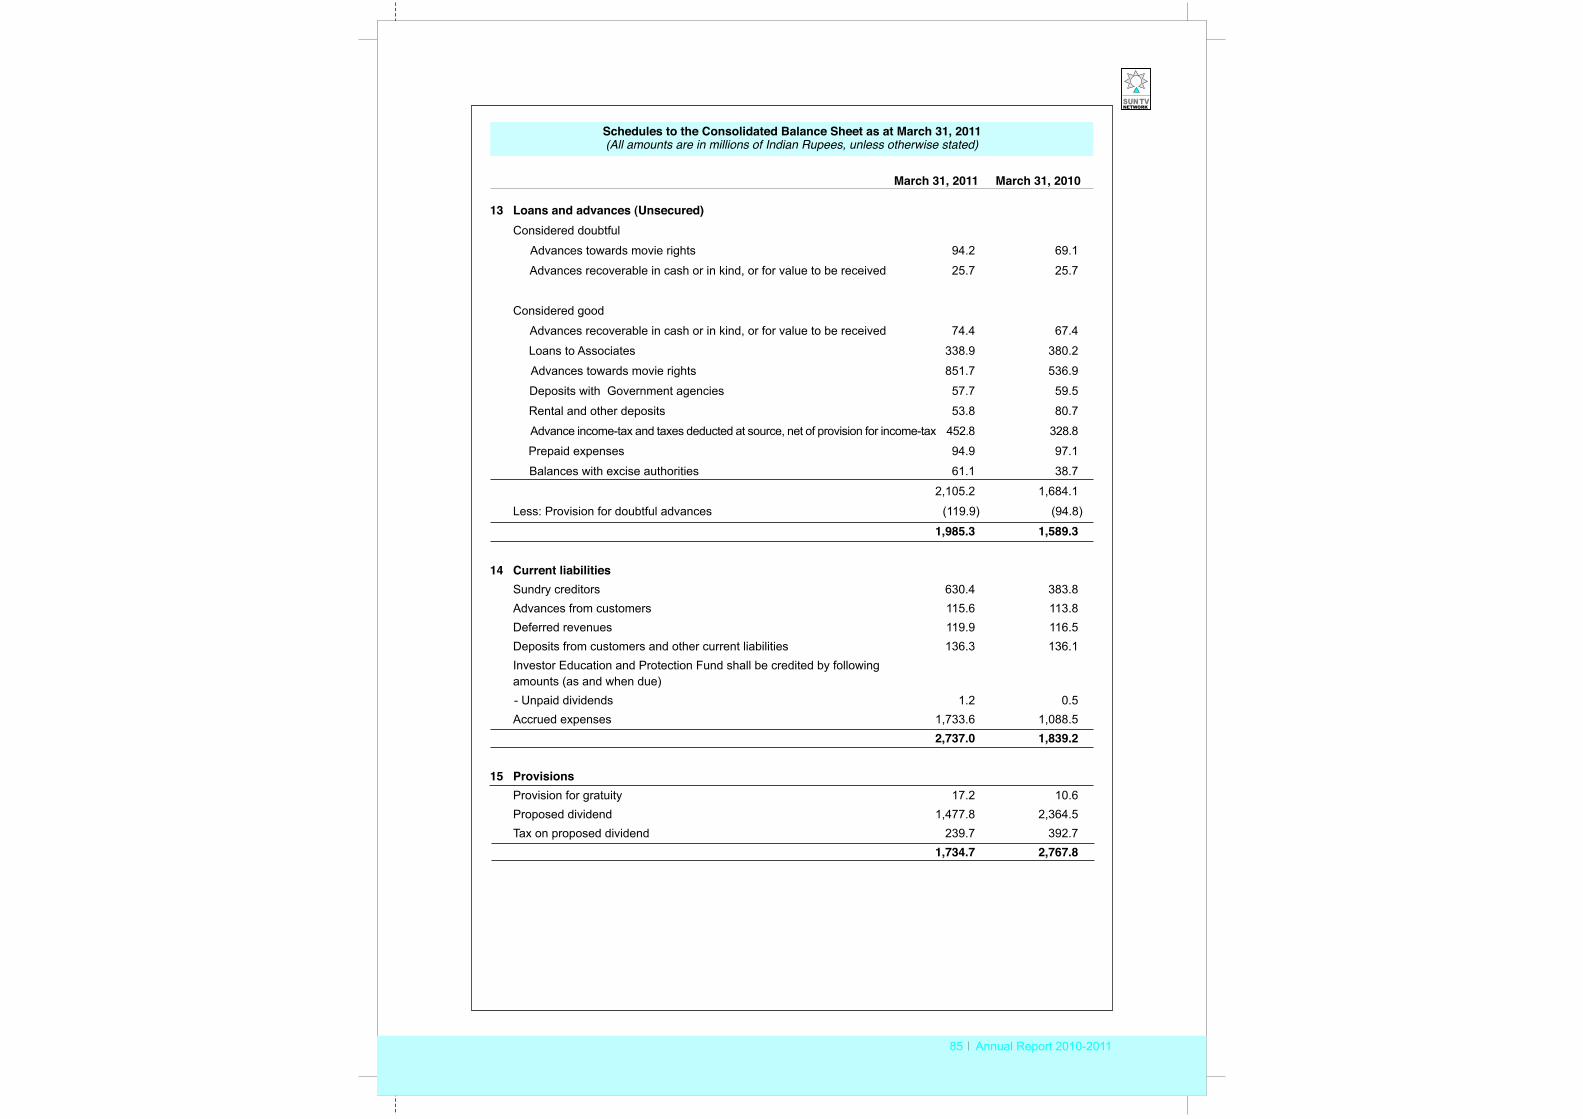
85 Annual Report 2010-2011
Schedules to the Consolidated Balance Sheet as at March 31, 2011(All amounts are in millions of Indian Rupees, unless otherwise stated)
13 Loans and advances (Unsecured)Considered doubtful
Advances towards movie rights 94.2 69.1
Advances recoverable in cash or in kind, or for value to be received 25.7 25.7
Considered good
Advances recoverable in cash or in kind, or for value to be received 74.4 67.4
Loans to Associates 338.9 380.2
Advances towards movie rights 851.7 536.9
Deposits with Government agencies 57.7 59.5
Rental and other deposits 53.8 80.7
Advance income-tax and taxes deducted at source, net of provision for income-tax 452.8 328.8
Prepaid expenses 94.9 97.1
Balances with excise authorities 61.1 38.7
2,105.2 1,684.1
Less: Provision for doubtful advances (119.9) (94.8)
1,985.3 1,589.3
14 Current liabilitiesSundry creditors 630.4 383.8Advances from customers 115.6 113.8Deferred revenues 119.9 116.5Deposits from customers and other current liabilities 136.3 136.1 Investor Education and Protection Fund shall be credited by following amounts (as and when due) - Unpaid dividends 1.2 0.5Accrued expenses 1,733.6 1,088.5
2,737.0 1,839.2
15 ProvisionsProvision for gratuity 17.2 10.6 Proposed dividend 1,477.8 2,364.5 Tax on proposed dividend 239.7 392.7
1,734.7 2,767.8
March 31, 2011 March 31, 2010
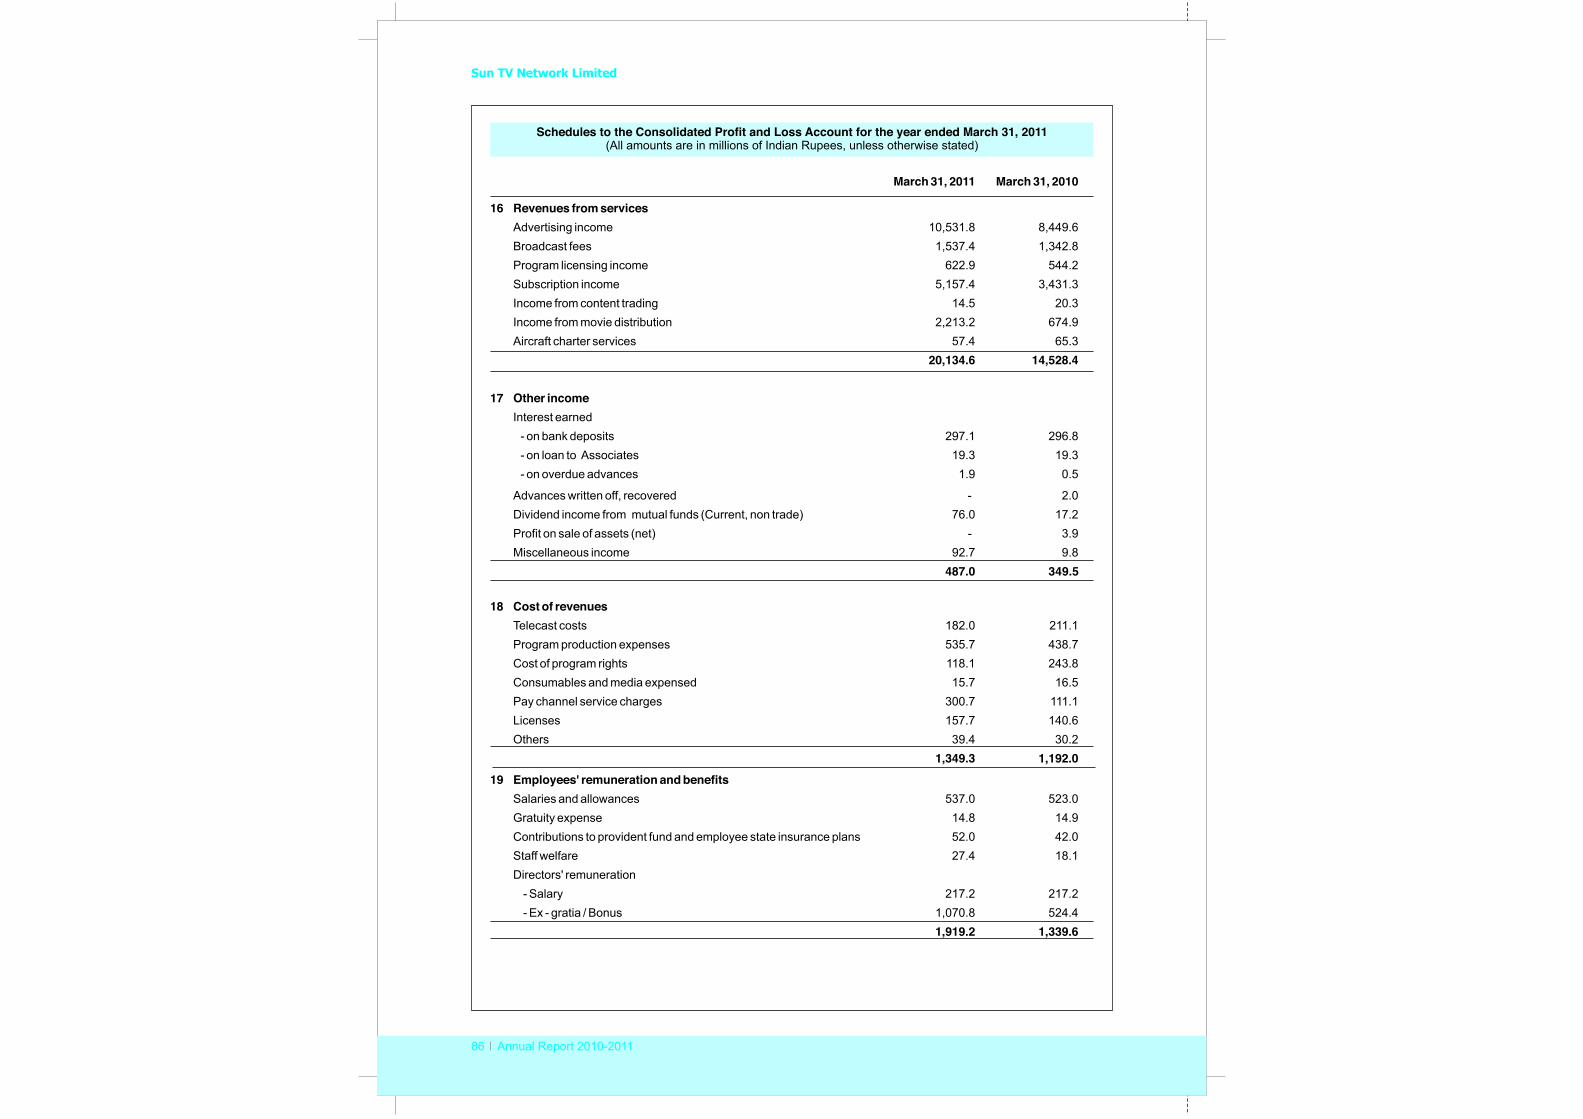
Sun TV Network Limited
86 Annual Report 2010-2011
March 31, 2011 March 31, 2010
16 Revenues from servicesAdvertising income 10,531.8 8,449.6 Broadcast fees 1,537.4 1,342.8 Program licensing income 622.9 544.2Subscription income 5,157.4 3,431.3 Income from content trading 14.5 20.3 Income from movie distribution 2,213.2 674.9 Aircraft charter services 57.4 65.3
20,134.6 14,528.4
17 Other incomeInterest earned - on bank deposits 297.1 296.8 - on loan to Associates 19.3 19.3 - on overdue advances 1.9 0.5
Advances written off, recovered - 2.0 Dividend income from mutual funds (Current, non trade) 76.0 17.2 Profit on sale of assets (net) - 3.9 Miscellaneous income 92.7 9.8
487.0 349.5
18 Cost of revenuesTelecast costs 182.0 211.1Program production expenses 535.7 438.7Cost of program rights 118.1 243.8 Consumables and media expensed 15.7 16.5 Pay channel service charges 300.7 111.1 Licenses 157.7 140.6 Others 39.4 30.2
1,349.3 1,192.0 19 Employees' remuneration and benefits
Salaries and allowances 537.0 523.0 Gratuity expense 14.8 14.9 Contributions to provident fund and employee state insurance plans 52.0 42.0 Staff welfare 27.4 18.1Directors' remuneration
- Salary 217.2 217.2- Ex - gratia / Bonus 1,070.8 524.4
1,919.2 1,339.6
Schedules to the Consolidated Profit and Loss Account for the year ended March 31, 2011(All amounts are in millions of Indian Rupees, unless otherwise stated)
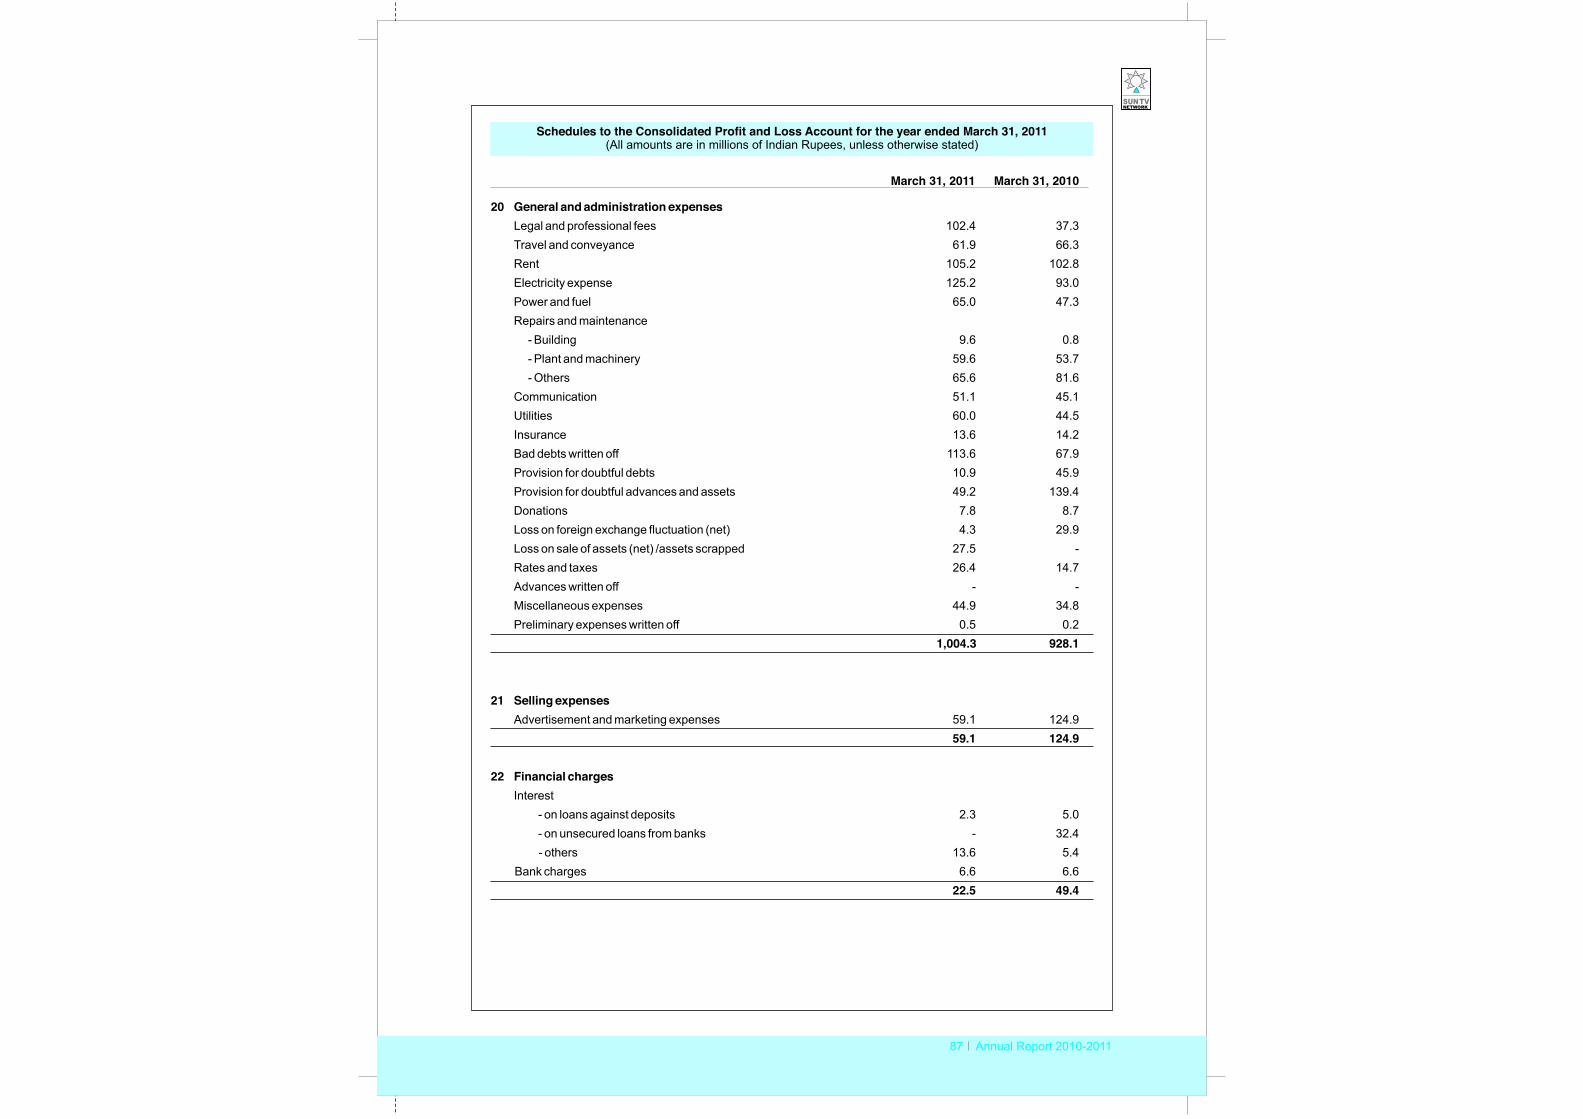
87 Annual Report 2010-2011
Schedules to the Consolidated Profit and Loss Account for the year ended March 31, 2011(All amounts are in millions of Indian Rupees, unless otherwise stated)
20 General and administration expensesLegal and professional fees 102.4 37.3Travel and conveyance 61.9 66.3 Rent 105.2 102.8 Electricity expense 125.2 93.0 Power and fuel 65.0 47.3 Repairs and maintenance
- Building 9.6 0.8 - Plant and machinery 59.6 53.7- Others 65.6 81.6
Communication 51.1 45.1 Utilities 60.0 44.5 Insurance 13.6 14.2 Bad debts written off 113.6 67.9Provision for doubtful debts 10.9 45.9 Provision for doubtful advances and assets 49.2 139.4 Donations 7.8 8.7Loss on foreign exchange fluctuation (net) 4.3 29.9Loss on sale of assets (net) /assets scrapped 27.5 -Rates and taxes 26.4 14.7 Advances written off - -Miscellaneous expenses 44.9 34.8Preliminary expenses written off 0.5 0.2
1,004.3 928.1
21 Selling expenses Advertisement and marketing expenses 59.1 124.9
59.1 124.9
22 Financial chargesInterest
- on loans against deposits 2.3 5.0 - on unsecured loans from banks - 32.4 - others 13.6 5.4
Bank charges 6.6 6.622.5 49.4
March 31, 2011 March 31, 2010
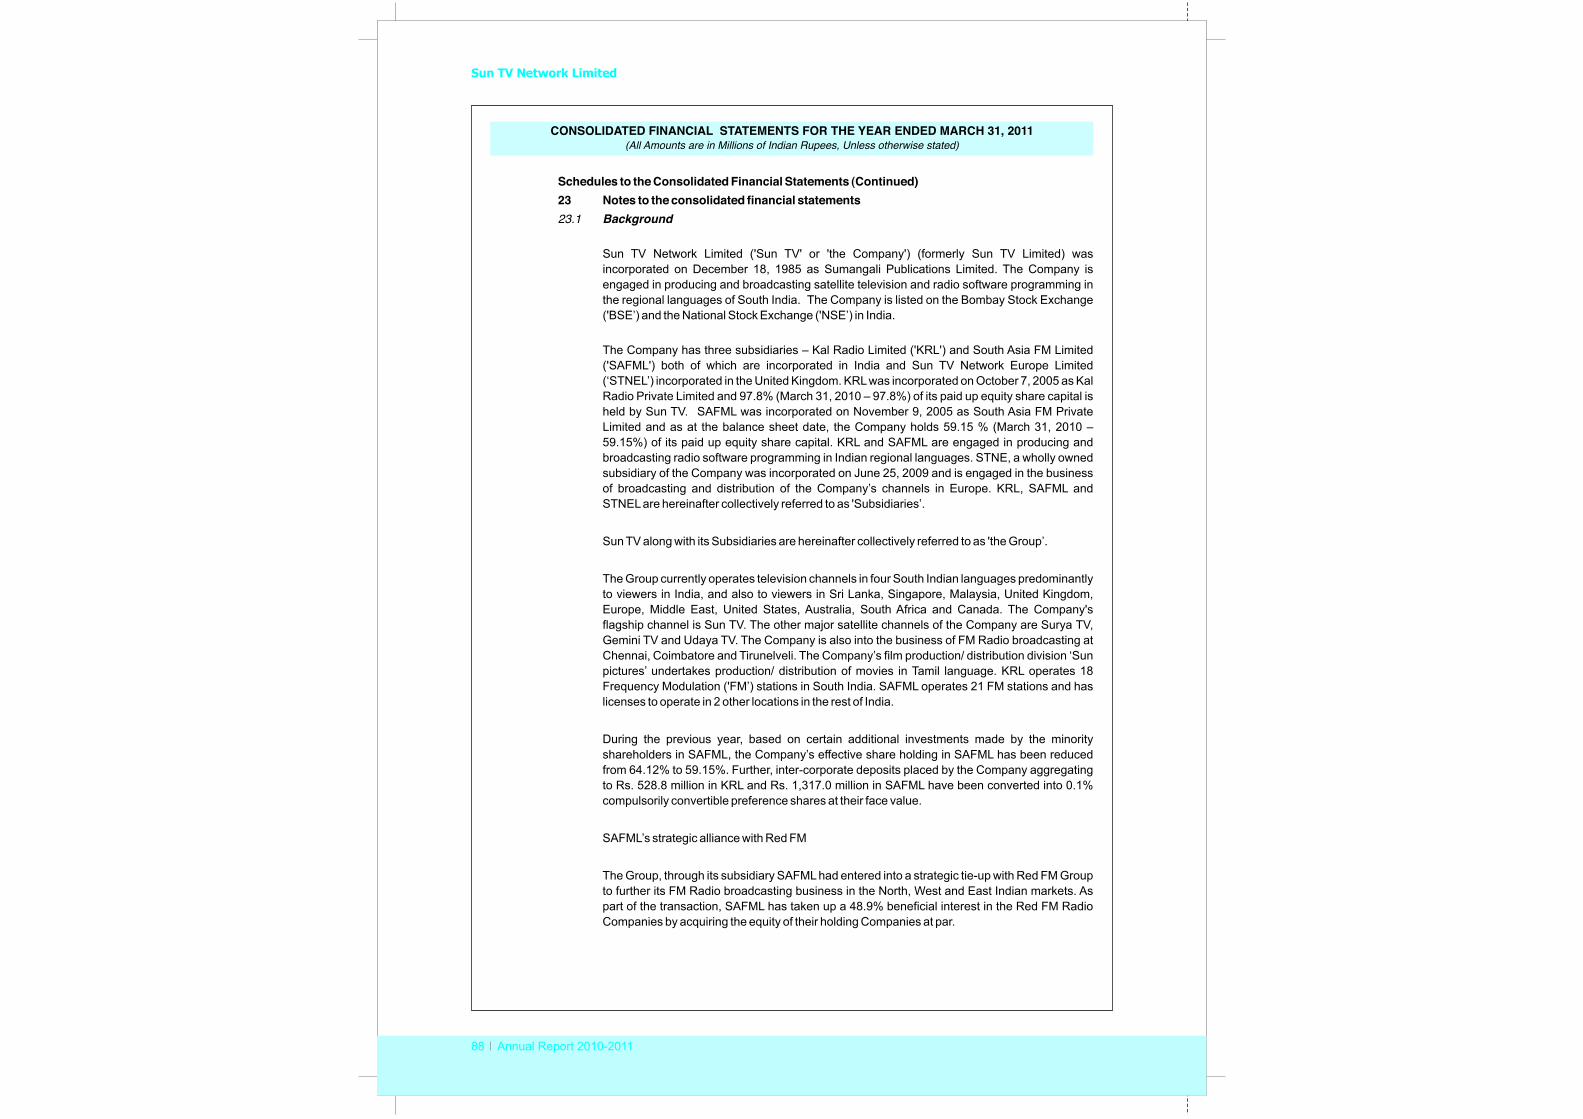
Sun TV Network Limited
88 Annual Report 2010-2011
CONSOLIDATED FINANCIAL STATEMENTS FOR THE YEAR ENDED MARCH 31, 2011(All Amounts are in Millions of Indian Rupees, Unless otherwise stated)
Schedules to the Consolidated Financial Statements (Continued)23 Notes to the consolidated financial statements23.1 Background
Sun TV Network Limited ('Sun TV' or 'the Company') (formerly Sun TV Limited) was incorporated on December 18, 1985 as Sumangali Publications Limited. The Company is engaged in producing and broadcasting satellite television and radio software programming in the regional languages of South India. The Company is listed on the Bombay Stock Exchange ('BSE’) and the National Stock Exchange ('NSE’) in India.
The Company has three subsidiaries – Kal Radio Limited ('KRL') and South Asia FM Limited ('SAFML') both of which are incorporated in India and Sun TV Network Europe Limited (‘STNEL’) incorporated in the United Kingdom. KRL was incorporated on October 7, 2005 as Kal Radio Private Limited and 97.8% (March 31, 2010 – 97.8%) of its paid up equity share capital is held by Sun TV. SAFML was incorporated on November 9, 2005 as South Asia FM Private Limited and as at the balance sheet date, the Company holds 59.15 % (March 31, 2010 – 59.15%) of its paid up equity share capital. KRL and SAFML are engaged in producing and broadcasting radio software programming in Indian regional languages. STNE, a wholly owned subsidiary of the Company was incorporated on June 25, 2009 and is engaged in the business of broadcasting and distribution of the Company’s channels in Europe. KRL, SAFML and STNEL are hereinafter collectively referred to as 'Subsidiaries’.
Sun TV along with its Subsidiaries are hereinafter collectively referred to as 'the Group’.
The Group currently operates television channels in four South Indian languages predominantly to viewers in India, and also to viewers in Sri Lanka, Singapore, Malaysia, United Kingdom, Europe, Middle East, United States, Australia, South Africa and Canada. The Company's flagship channel is Sun TV. The other major satellite channels of the Company are Surya TV, Gemini TV and Udaya TV. The Company is also into the business of FM Radio broadcasting at Chennai, Coimbatore and Tirunelveli. The Company’s film production/ distribution division ‘Sun pictures’ undertakes production/ distribution of movies in Tamil language. KRL operates 18 Frequency Modulation ('FM’) stations in South India. SAFML operates 21 FM stations and has licenses to operate in 2 other locations in the rest of India.
During the previous year, based on certain additional investments made by the minority shareholders in SAFML, the Company’s effective share holding in SAFML has been reduced from 64.12% to 59.15%. Further, inter-corporate deposits placed by the Company aggregating to Rs. 528.8 million in KRL and Rs. 1,317.0 million in SAFML have been converted into 0.1% compulsorily convertible preference shares at their face value.
SAFML’s strategic alliance with Red FM
The Group, through its subsidiary SAFML had entered into a strategic tie-up with Red FM Group to further its FM Radio broadcasting business in the North, West and East Indian markets. As part of the transaction, SAFML has taken up a 48.9% beneficial interest in the Red FM Radio Companies by acquiring the equity of their holding Companies at par.
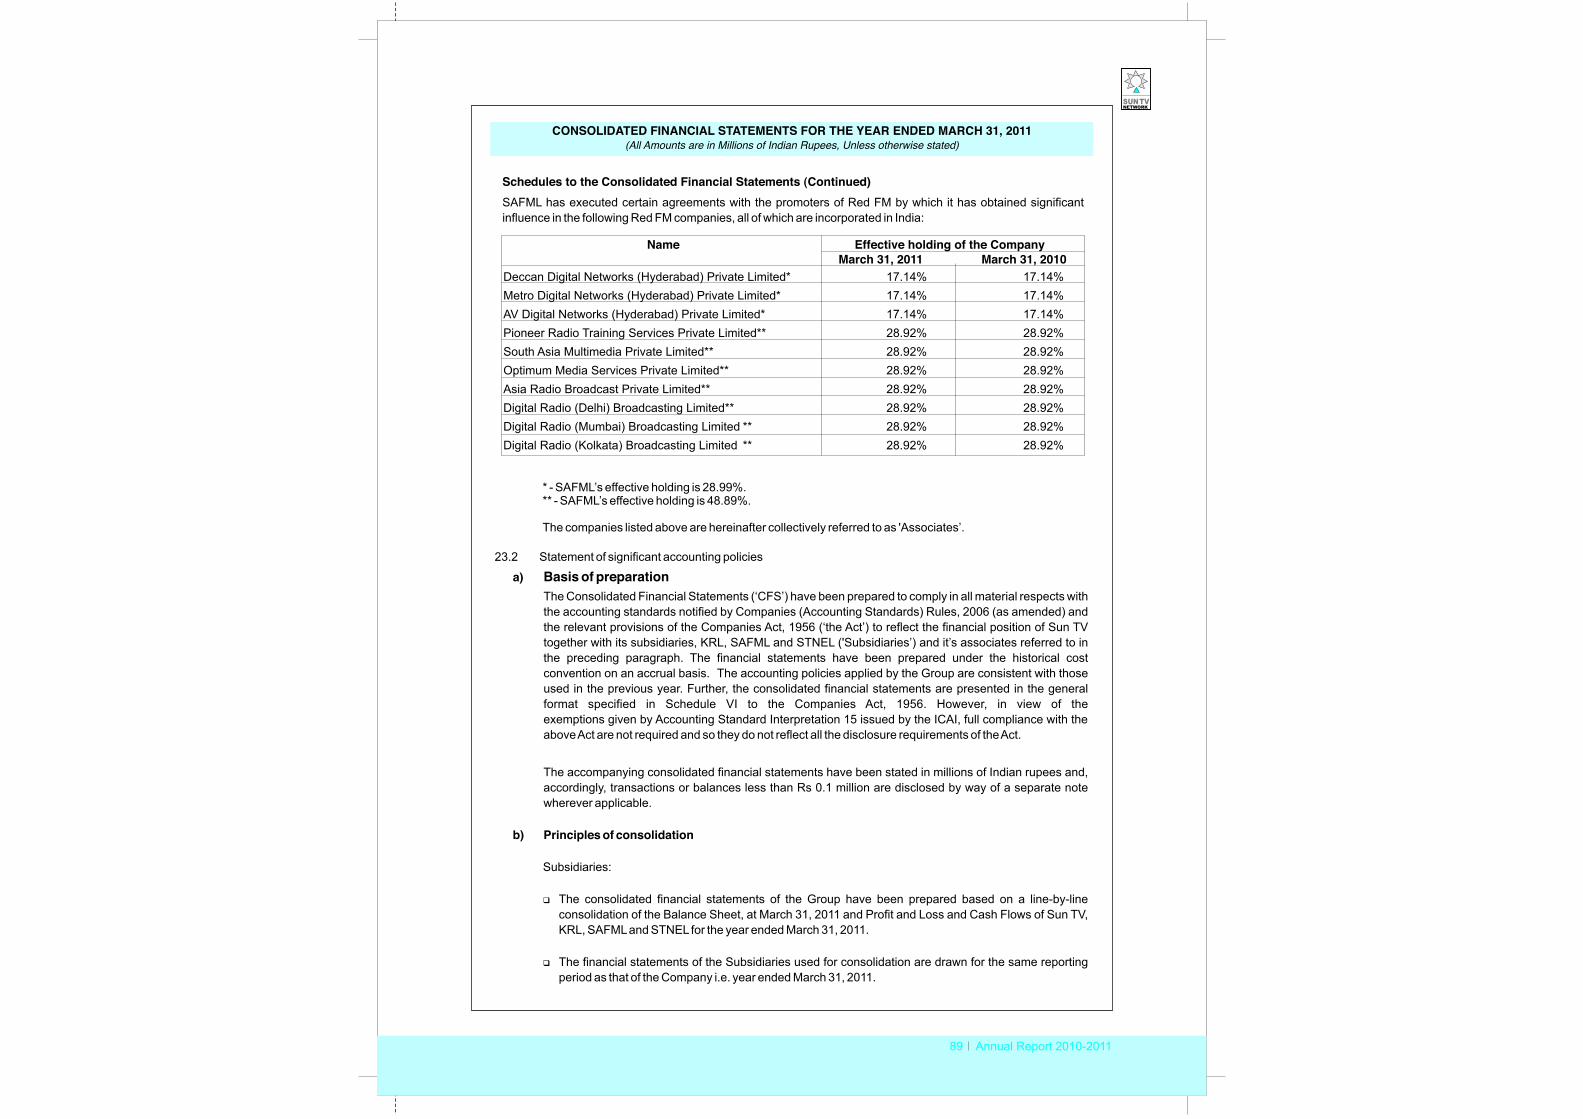
89 Annual Report 2010-2011
CONSOLIDATED STATEMENTS FOR THE YEAR ENDED MARCH 31, 2011(All Amounts are in Millions of Indian Rupees, Unless otherwise stated)
FINANCIAL
SAFML has executed certain agreements with the promoters of Red FM by which it has obtained significant influence in the following Red FM companies, all of which are incorporated in India:
Name Effective holding of the CompanyMarch 31, 2011 March 31, 2010
Deccan Digital Networks (Hyderabad) Private Limited* 17.14% 17.14%Metro Digital Networks (Hyderabad) Private Limited* 17.14% 17.14%AV Digital Networks (Hyderabad) Private Limited* 17.14% 17.14%Pioneer Radio Training Services Private Limited** 28.92% 28.92%South Asia Multimedia Private Limited** 28.92% 28.92%Optimum Media Services Private Limited** 28.92% 28.92%Asia Radio Broadcast Private Limited** 28.92% 28.92%Digital Radio (Delhi) Broadcasting Limited** 28.92% 28.92%Digital Radio (Mumbai) Broadcasting Limited ** 28.92% 28.92%Digital Radio (Kolkata) Broadcasting Limited ** 28.92% 28.92%
* - SAFML’s effective holding is 28.99%.** - SAFML’s effective holding is 48.89%.
The companies listed above are hereinafter collectively referred to as 'Associates’.
23.2 Statement of significant accounting policies
a) Basis of preparation The Consolidated Financial Statements (‘CFS’) have been prepared to comply in all material respects with the accounting standards notified by Companies (Accounting Standards) Rules, 2006 (as amended) and the relevant provisions of the Companies Act, 1956 (‘the Act’) to reflect the financial position of Sun TV together with its subsidiaries, KRL, SAFML and STNEL ('Subsidiaries’) and it’s associates referred to in the preceding paragraph. The financial statements have been prepared under the historical cost convention on an accrual basis. The accounting policies applied by the Group are consistent with those used in the previous year. Further, the consolidated financial statements are presented in the general format specified in Schedule VI to the Companies Act, 1956. However, in view of the exemptions given by Accounting Standard Interpretation 15 issued by the ICAI, full compliance with the above Act are not required and so they do not reflect all the disclosure requirements of the Act.
The accompanying consolidated financial statements have been stated in millions of Indian rupees and, accordingly, transactions or balances less than Rs 0.1 million are disclosed by way of a separate note wherever applicable.
b) Principles of consolidation
Subsidiaries:
The consolidated financial statements of the Group have been prepared based on a line-by-line consolidation of the Balance Sheet, at March 31, 2011 and Profit and Loss and Cash Flows of Sun TV, KRL, SAFML and STNEL for the year ended March 31, 2011.
The financial statements of the Subsidiaries used for consolidation are drawn for the same reporting period as that of the Company i.e. year ended March 31, 2011.
�
�
Schedules to the Consolidated Financial Statements (Continued)
Sun TV Network Limited
90 Annual Report 2010-2011
Schedules to the Consolidated Financial Statements (Continued)
�All material inter-company transactions and balances between the entities included in the consolidated financial statements have been eliminated.
�Consolidation is applied from the date of obtaining control by the Group, till the date when the Group loses control.
Associates:
�The investment in the associate companies has been accounted under the equity method as per Accounting Standard 23 – ‘Accounting for Investments in Associates in Consolidated Financial Statements’ notified by the Companies (Accounting Standards) Rules, 2006 (as amended). The Company’s share in profits / losses of an associate company is accounted for to the extent of the Company’s direct and indirect percentage holding in its share capital of the respective associates.
�Any excess / shortage of cost to the Company of its investment in the subsidiaries and associates over its proportionate share in the equity of such subsidiaries and associates as at the date of the investment are recognized as goodwill / capital reserve in the CFS.
�All material unrealised profits and losses resulting from transactions between the group and the associates are eliminated to the extent of the group’s interest in the associate.
�Equity accounting for associates is applied from the date of obtaining significant influence by the Group, till the date when the Group loses significant influence.
The CFS have been prepared using uniform accounting policies, except stated otherwise, for like transactions and are presented to the extent possible, in the same manner as the Company’s separate financial statements.
c) Use of estimates
The preparation of financial statements in conformity with generally accepted accounting principles requires management to make estimates and assumptions that affect the reported amounts of assets and liabilities and disclosure of contingent liabilities at the date of the financial statements and the results of operations during the reporting period end. Although these estimates are based upon management’s best knowledge of current events and actions, actual results could differ from these estimates.
d) Fixed assets and depreciationFixed assetsFixed assets are stated at cost less accumulated depreciation and impairment losses, if any. Cost comprises the purchase price and any attributable cost of bringing the asset to its working condition for its intended use. Borrowing costs, if any, relating to acquisition of qualifying fixed assets are also included to the extent they relate to the period till such assets are ready to be put to use.
Amounts paid under contractual terms for purchasing fixed assets and fixed assets acquired but not put to use at the Balance Sheet date are classified as capital work in progress.
CONSOLIDATED FINANCIAL STATEMENTS FOR THE YEAR ENDED MARCH 31, 2011(All Amounts are in Millions of Indian Rupees, Unless otherwise stated)
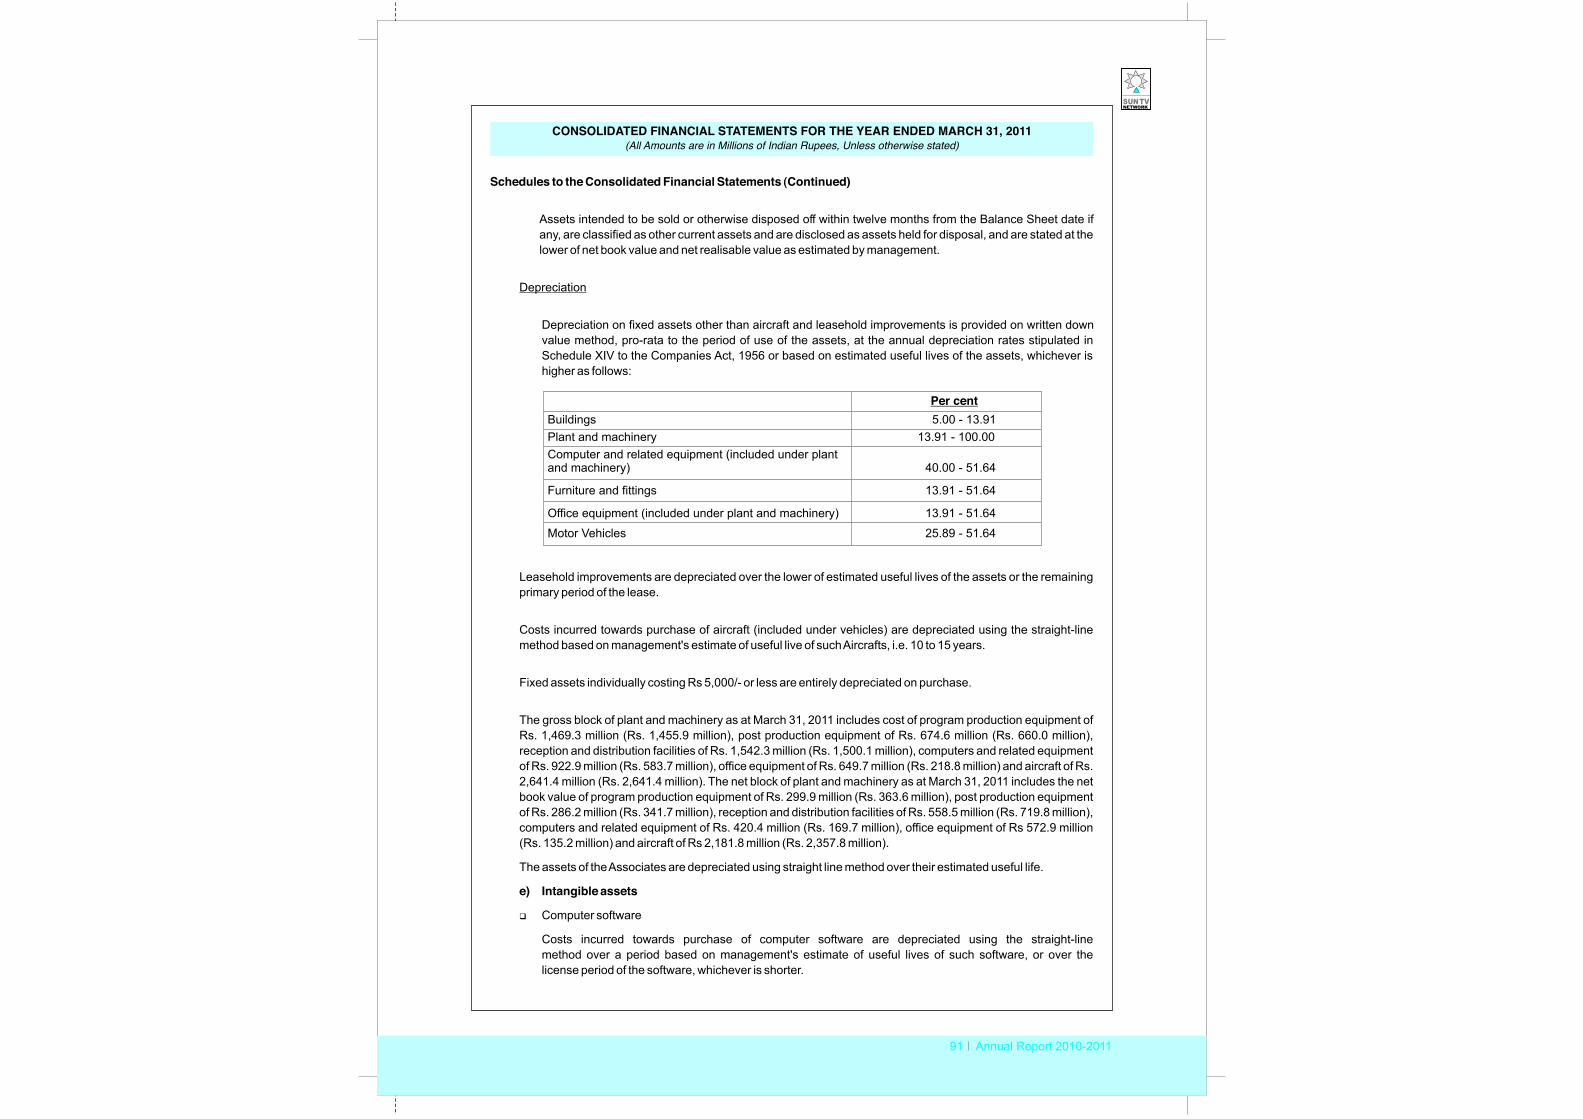
91 Annual Report 2010-2011
Schedules to the Consolidated Financial Statements (Continued)
Assets intended to be sold or otherwise disposed off within twelve months from the Balance Sheet date if any, are classified as other current assets and are disclosed as assets held for disposal, and are stated at the lower of net book value and net realisable value as estimated by management.
Depreciation
Depreciation on fixed assets other than aircraft and leasehold improvements is provided on written down value method, pro-rata to the period of use of the assets, at the annual depreciation rates stipulated in Schedule XIV to the Companies Act, 1956 or based on estimated useful lives of the assets, whichever is higher as follows:
Leasehold improvements are depreciated over the lower of estimated useful lives of the assets or the remaining primary period of the lease.
Costs incurred towards purchase of aircraft (included under vehicles) are depreciated using the straight-line method based on management's estimate of useful live of such Aircrafts, i.e. 10 to 15 years.
Fixed assets individually costing Rs 5,000/- or less are entirely depreciated on purchase.
The gross block of plant and machinery as at March 31, 2011 includes cost of program production equipment of Rs. 1,469.3 million (Rs. 1,455.9 million), post production equipment of Rs. 674.6 million (Rs. 660.0 million), reception and distribution facilities of Rs. 1,542.3 million (Rs. 1,500.1 million), computers and related equipment of Rs. 922.9 million (Rs. 583.7 million), office equipment of Rs. 649.7 million (Rs. 218.8 million) and aircraft of Rs. 2,641.4 million (Rs. 2,641.4 million). The net block of plant and machinery as at March 31, 2011 includes the net book value of program production equipment of Rs. 299.9 million (Rs. 363.6 million), post production equipment of Rs. 286.2 million (Rs. 341.7 million), reception and distribution facilities of Rs. 558.5 million (Rs. 719.8 million), computers and related equipment of Rs. 420.4 million (Rs. 169.7 million), office equipment of Rs 572.9 million (Rs. 135.2 million) and aircraft of Rs 2,181.8 million (Rs. 2,357.8 million).
The assets of the Associates are depreciated using straight line method over their estimated useful life.
e) Intangible assets
�Computer software
Costs incurred towards purchase of computer software are depreciated using the straight-line method over a period based on management's estimate of useful lives of such software, or over the license period of the software, whichever is shorter.
CONSOLIDATED FINANCIAL STATEMENTS FOR THE YEAR ENDED MARCH 31, 2011(All Amounts are in Millions of Indian Rupees, Unless otherwise stated)
Per centBuildings 5.00 - 13.91Plant and machinery 13.91 - 100.00Computer and related equipment (included under plant and machinery) 40.00 - 51.64
Furniture and fittings 13.91 - 51.64
Office equipment (included under plant and machinery) 13.91 - 51.64
Motor Vehicles 25.89 - 51.64
Sun TV Network Limited
92 Annual Report 2010-2011
CONSOLIDATED STATEMENTS FOR THE YEAR ENDED MARCH 31, 2011(All Amounts are in Millions of Indian Rupees, Unless otherwise stated)
FINANCIAL
Schedules to the Consolidated Financial Statements (Continued)
�
�
Film and program broadcasting rights (‘Satellite Rights’)
Acquired Satellite Rights for the broadcast of feature films and other long-form programming such as multi-episode television serials are stated at cost. Satellite Rights, where the right to telecast commences after 12 months from the balance sheet date are disclosed as non-current assets and rights, where the right to telecast commences within 12 months from the balance sheet date are disclosed as other current assets.
Satellite Rights are transferred to intangible assets, as and when they become available for telecast on television. Satellite Rights disclosed under intangible assets represent rights, which are available for use as at the balance sheet date.
Future revenues cannot be estimated with any reasonable accuracy as these are susceptible to a variety of factors, such as the level of market acceptance of television products, programming viewership, advertising rates etc, and accordingly cost related to film and program broadcasting rights are fully expensed on the date of first telecast of the film / program episode, as the case may be.
Film production costs, distribution and related rights
Upon the theatrical release of a movie, the cost of production / acquisition of all the rights related to each such movie is amortised in the ratio that current period revenue for the movie bears to the management’s estimate of the remaining unrecognised revenue for all rights arising from the movie, as per the individual-film-forecast method. The estimates for remaining unrecognised revenue for each movie is reviewed periodically and revised if necessary.
Expenditure incurred towards production of movies not complete as at balance sheet date and amounts paid under contractual terms for acquiring distribution rights and related rights of movies not released in theatres as at the balance sheet date are classified as intangible assets under development.
�Licenses
Licenses represent one time entry fees paid to Ministry of Information and Broadcasting ('MIB’) under the applicable licensing policy for Frequency Modulation ('FM’) Radio broadcasting. Cost of licenses is amortised over the license period.
�Goodwill arising on Amalgamation
Goodwill arising on amalgamation is amortised on a straight line basis over a period of five years, based on management’s estimates.
�Goodwill arising on Consolidation
The carrying amount of goodwill arising on consolidation including those arising on investments made by the group in its associates is reviewed for impairment in accordance with the requirements of Accounting Standard 28 “Impairment of Assets” and impairment losses are recognised wherever the carrying amount of an asset exceeds its recoverable amount.
93 Annual Report 2010-2011
CONSOLIDATED STATEMENTS FOR THE YEAR ENDED MARCH 31, 2011(All Amounts are in Millions of Indian Rupees, Unless otherwise stated)
FINANCIAL
Schedules to the Consolidated Financial Statements (Continued)
f) Impairment
The carrying amounts of assets are reviewed at each balance sheet date if there is any indication of impairment based on internal/external factors. An impairment loss is recognised wherever the carrying amount of an asset exceeds its recoverable amount. The recoverable amount is the greater of the asset's net selling price and value in use. In assessing value in use, the estimated future cash flows are discounted to their present value at the weighted average cost of capital. After impairment, depreciation is provided on the revised carrying amount of the assets over its remaining useful life. A previously recognised impairment loss is increased or reversed depending on changes in circumstances. However the carrying value after reversal is not increased beyond the carrying value that would have prevailed by charging usual depreciation if there was no impairment.
g) InventoryInventories are valued at the lower of cost and net realizable value. Cost is determined on a weighted average basis. Net realizable value is the estimated selling price in the ordinary course of business, less estimated costs of completion and estimated costs necessary to make the sale.
h) InvestmentsInvestments that are readily realisable and intended to be held for not more than a year are classified as current investments. All other investments are classified as long-term investments. Current investments are carried at lower of cost and fair value determined on an individual investment basis. Long-term investments are carried at cost. However, provision for diminution in value is made to recognise a decline other than temporary in the value of the investments.
Investment in associates
Investments in associates are initially stated at cost. The carrying values of such investments are adjusted by the Company’s (direct and indirect) share in profits / losses of the respective associate company.
Goodwill arising on acquisition of an associate by the Group has been included in the carrying amount of investments in the associates and has been disclosed separately.
i) Retirement and other employee benefit
Retirement benefit in the form of provident fund is a defined contribution scheme and the contributions are charged to the profit and loss account of the year when the contributions to the respective funds are due. There are no other obligations other than the contribution payable to the respective trusts.
Gratuity liability is a defined benefit obligation and is provided for on the basis of an actuarial valuation on projected unit credit method made at the end of each financial year. Actuarial gains / losses are immediately taken to profit and loss account and are not deferred.
j) TaxationTax expense comprises current and deferred tax. Current income tax is measured at the amount expected to be paid to the tax authorities in accordance with the Income-tax Act, 1961 enacted in India. Deferred income taxes reflects the impact of current year timing differences between taxable income and accounting income for the year and reversal of timing differences of earlier years.
Sun TV Network Limited
94 Annual Report 2010-2011
CONSOLIDATED STATEMENTS FOR THE YEAR ENDED MARCH 31, 2011(All Amounts are in Millions of Indian Rupees, Unless otherwise stated)
FINANCIAL
Schedules to the Consolidated Financial Statements (Continued)
Deferred tax is measured based on the tax rates and the tax laws enacted or substantively enacted at the balance sheet date. Deferred tax assets and deferred tax liabilities are offset, if a legally enforceable right exists to set off current tax assets against current tax liabilities and the deferred tax assets and deferred tax liabilities relate to the taxes on income levied by same governing taxation laws. Deferred tax assets are recognised only to the extent that there is reasonable certainty that sufficient future taxable income will be available against which such deferred tax assets can be realised.
The carrying amount of deferred tax assets are reviewed at each balance sheet date. The group writes-down the carrying amount of a deferred tax asset to the extent that it is no longer reasonably certain or virtually certain, as the case may be, that sufficient future taxable income will be available against which deferred tax asset can be realised. Any such write-down is reversed to the extent that it becomes reasonably certain or virtually certain, as the case may be, that sufficient future taxable income will be available.
At each balance sheet date the group re-assesses unrecognised deferred tax assets. It recognises unrecognised deferred tax assets to the extent that it has become reasonably certain or virtually certain, as the case may be that sufficient future taxable income will be available against which such deferred tax assets can be realised.
k) Earnings per share
Basic earnings per share are calculated by dividing the net profit or loss for the period attributable to equity shareholders by the weighted average number of equity shares outstanding during the period. Partly paid equity shares are treated as a fraction of an equity share to the extent that they were entitled to participate in dividends relative to a fully paid equity share during the reporting period. The weighted average number of equity shares outstanding during the period is adjusted for events of bonus issue; bonus element in a rights issue to existing shareholders; share split; and reverse share split (consolidation of shares).
For the purpose of calculating diluted earnings per share, the net profit or loss for the period attributable to equity shareholders and the weighted average number of shares outstanding during the period are adjusted for the effects of all dilutive potential equity shares.
l) Revenue recognition
Revenue is recognized to the extent that it is probable that the economic benefits will flow to the group and the revenue can be reliably measured.
�Advertising income and broadcast fees are recognised when the related commercial or programme is telecast.�Program licensing income represents income from the export of program software content, and is recognised in accordance with the terms of agreements with customers.�Subscription income represents subscription fees billed to cable operators and Direct to Home (‘DTH’) service providers towards pay-channels operated by the Company, and are recognised in the period during which the service is provided. Subscription fees billed to cable operators are determined based on management's best estimates of the number of subscription points to which the service is provided, at contractually agreed rates. Subscription income from DTH customers is recognised in accordance with the terms of agreements entered into with the service providers.
95 Annual Report 2010-2011
Schedules to the Consolidated Financial Statements (Continued)
�
�������
n) Cash and Cash equivalents
Cash and cash equivalents for the purposes of cash flow statement comprise cash at bank and in hand and short-term investments with an original maturity of three months or less.
o) Foreign currency transactions
Foreign currency transactions are recorded in the reporting currency, by applying to the foreign currency amount the exchange rate between the reporting currency and the foreign currency at the date of the transaction.
Foreign currency monetary items are reported using the closing rate. Non-monetary items which are carried in terms of historical cost denominated in a foreign currency are reported using the exchange rate at the date of the transaction; and non-monetary items which are carried at fair value or other similar valuation denominated in a foreign currency are reported using the exchange rates that existed when the values were determined.
Exchange differences arising on a monetary item that, in substance, form part of the company's net investment in a non-integral foreign operation is accumulated in a foreign currency translation reserve in the financial statements until the disposal of the net investment, at which time they are recognised as income or as expenses.
All exchange differences arising on settlement / conversion of foreign currency transactions are included in the profit and loss account.
Revenues from sale of movie distribution / sub-distribution rights are recognised on the theatrical release of the related movie, in accordance with the terms of agreements with customers. Revenues from the theatrical distribution of movies are recognised as they are exhibited, based on box office collections reported by the exhibitors after deduction of taxes and exhibitor’s share of collections.
Income from content trading represent revenue earned from mobile service providers and is recognised as per the terms of contract with mobile service providers.
Revenues from aircraft charter services are recognised based on services provided and billed as per the terms of the contracts with the customers.
Revenues from barter transactions, and the related costs, are recorded at fair values of the services rendered and services received, as estimated by management.
Interest income is recognised on time proportion basis.
Revenues recognised in excess of billings are disclosed as “Unbilled Revenue” under other current assets.
Billings in excess of revenue recognised are disclosed as “Deferred Revenues” under current liabilities.
Dividend Income is recognised when the right to receive payment is established by the balance sheet date.
m) Operating leases (where the Group is the lessee)
Leases where the lessor effectively retains substantially all the risks and benefits of ownership of the leased asset, are classified as operating leases. Operating lease payments are recognised as an expense in the Profit and Loss account on a straight-line basis over the lease term.
CONSOLIDATED FINANCIAL STATEMENTS FOR THE YEAR ENDED MARCH 31, 2011 (All Amounts are in Millions of Indian Rupees, Unless otherwise stated)
Sun TV Network Limited
96 Annual Report 2010-2011
CONSOLIDATED STATEMENTS FOR THE YEAR ENDED MARCH 31, 2011(All Amounts are in Millions of Indian Rupees, Unless otherwise stated)
FINANCIAL
Schedules to the Consolidated Financial Statements (Continued)TranslationsIn translating the financial statements of a non-integral foreign operation for incorporation in financial statements, the assets and liabilities, both monetary and non-monetary, of the non-integral foreign operation are translated at the closing rate; income and expense items of the non-integral foreign operation are translated at exchange rates at the dates of the transactions; and all resulting exchange differences are accumulated in a foreign currency translation reserve until the disposal of the net investment.
On the disposal of a non-integral foreign operation, the cumulative amount of the exchange differences which have been deferred and which relate to that operation are recognised as income or as expenses in the same period in which the gain or loss on disposal is recognised.
p) Provisions
A provision is recognised when an enterprise has a present obligation as a result of past event and it is probable that an outflow of resources will be required to settle the obligation, in respect of which a reliable estimate can be made. Provisions are not discounted to their present values and are determined based on management’s estimate of the amount required to settle the obligation at the balance sheet date. These are reviewed at each balance sheet date and adjusted to reflect the management’s current estimates.
q) Segment reporting
The Group considers business segments as its primary segment. The Group's operations predominantly relate to broadcasting and, accordingly, this is the only primary reportable segment.
The Group considers geographical segments as its secondary segment. The Group's operations are predominantly within India and, accordingly, this is the only secondary reportable segment.
23.3 Leases
Operating leases (As a Lessee)
The Group has taken a KU band satellite transponder and office premises on operating lease. There are no escalation clauses in the lease agreements. Further, there are no restrictions imposed by the lease arrangements and there are no subleases.
Particulars 31.03.2011 31.03.2010193.3 138.8
126.8 130.0
Lease payments recognised in the profit and loss account for the year
Minimum Lease PaymentsNot later than one yearLater than 1 year but not later than 5 years 238.9 331.1Later than 5 years 41.9 62.3
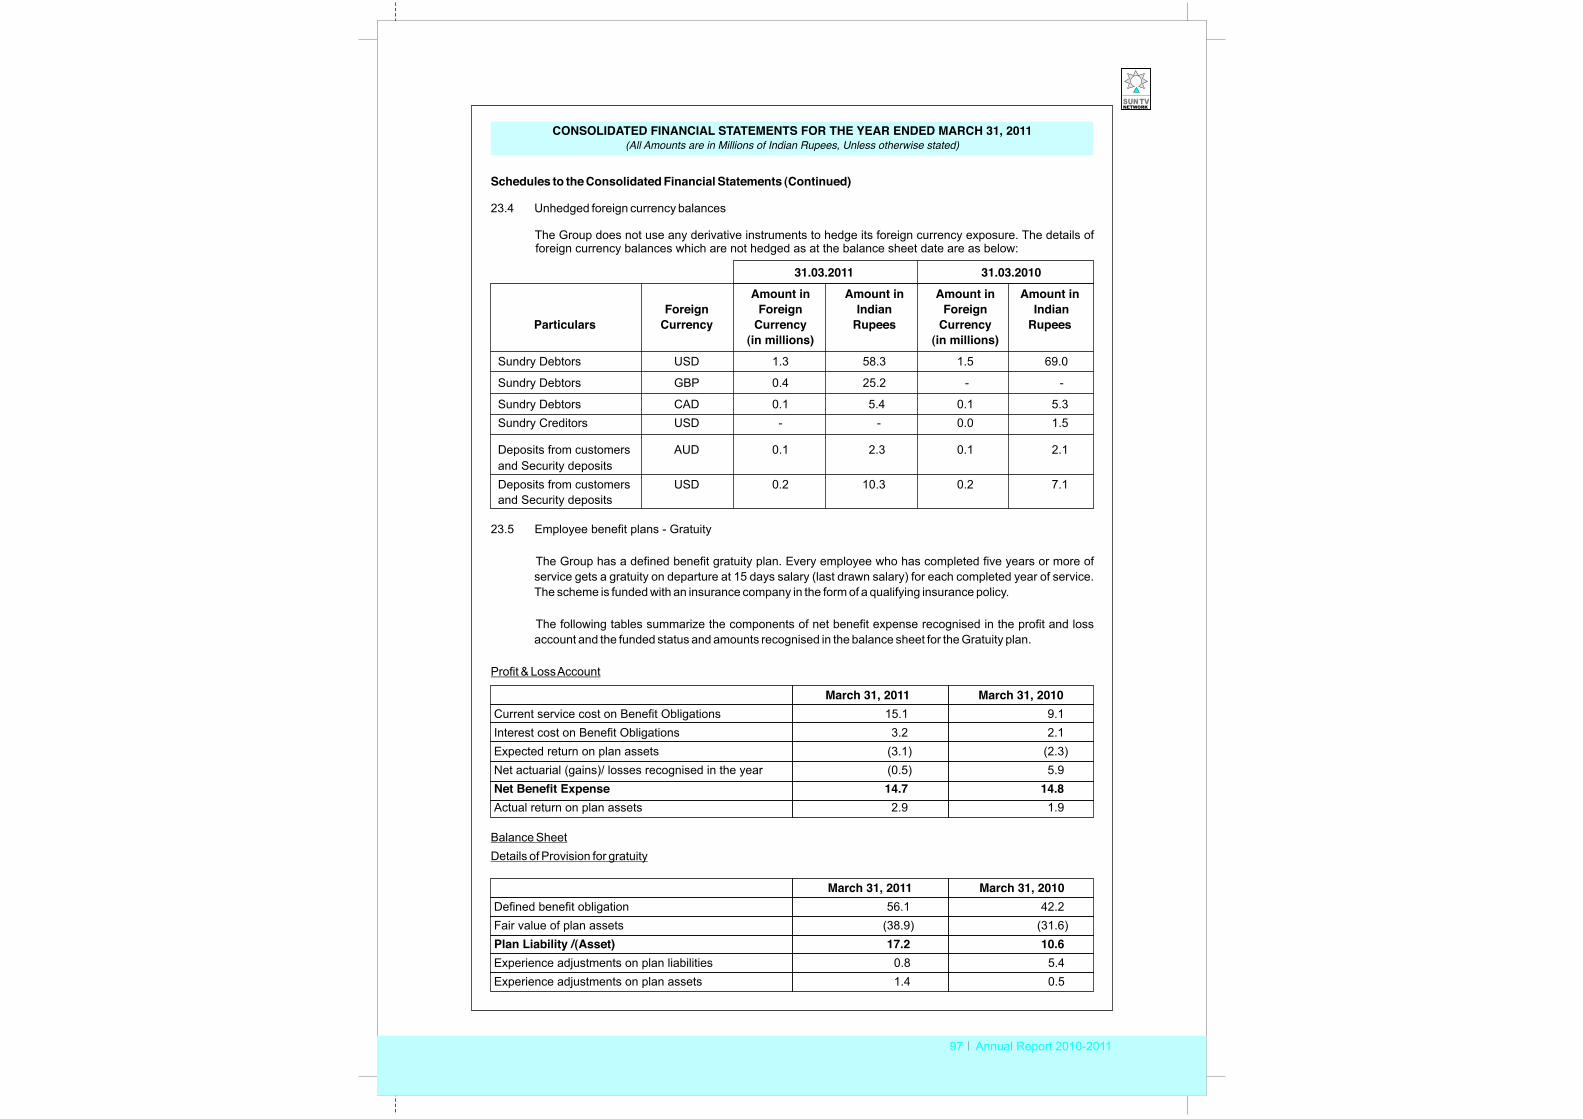
97 Annual Report 2010-2011
CONSOLIDATED FINANCIAL STATEMENTS FOR THE YEAR ENDED MARCH 31, 2011 (All Amounts are in Millions of Indian Rupees, Unless otherwise stated)
Schedules to the Consolidated Financial Statements (Continued)
23.4 Unhedged foreign currency balances
The Group does not use any derivative instruments to hedge its foreign currency exposure. The details of foreign currency balances which are not hedged as at the balance sheet date are as below:
23.5 Employee benefit plans - Gratuity
The Group has a defined benefit gratuity plan. Every employee who has completed five years or more of service gets a gratuity on departure at 15 days salary (last drawn salary) for each completed year of service. The scheme is funded with an insurance company in the form of a qualifying insurance policy.
The following tables summarize the components of net benefit expense recognised in the profit and loss account and the funded status and amounts recognised in the balance sheet for the Gratuity plan.
Profit & Loss Account
Balance SheetDetails of Provision for gratuity
March 31, 2011Current service cost on Benefit Obligations 15.1 9.1Interest cost on Benefit Obligations 3.2 2.1Expected return on plan assets (3.1) (2.3)Net actuarial (gains)/ losses recognised in the year (0.5) 5.9Net Benefit Expense 14.7 14.8Actual return on plan assets 2.9 1.9
March 31, 2010
March 31, 2010Defined benefit obligation 56.1 42.2Fair value of plan assets (38.9) (31.6)Plan Liability /(Asset) 17.2 10.6Experience adjustments on plan liabilities 0.8Experience adjustments on plan assets 1.4 0.5
March 31, 2011
5.4
31.03.2011 31.03.2010Amount in Amount in Amount in Amount in
Foreign Foreign Indian Foreign IndianParticulars Currency Currency Rupees Currency Rupees
(in millions) (in millions)Sundry Debtors USD 1.3 58.3 1.5 69.0
Sundry Debtors GBP 0.4 25.2 - -
Sundry Debtors CAD 0.1 5.4 0.1 5.3Sundry Creditors USD - - 0.0 1.5
Deposits from customers AUD 0.1 2.3 0.1 2.1and Security depositsDeposits from customers USD 0.2 10.3 0.2 7.1and Security deposits
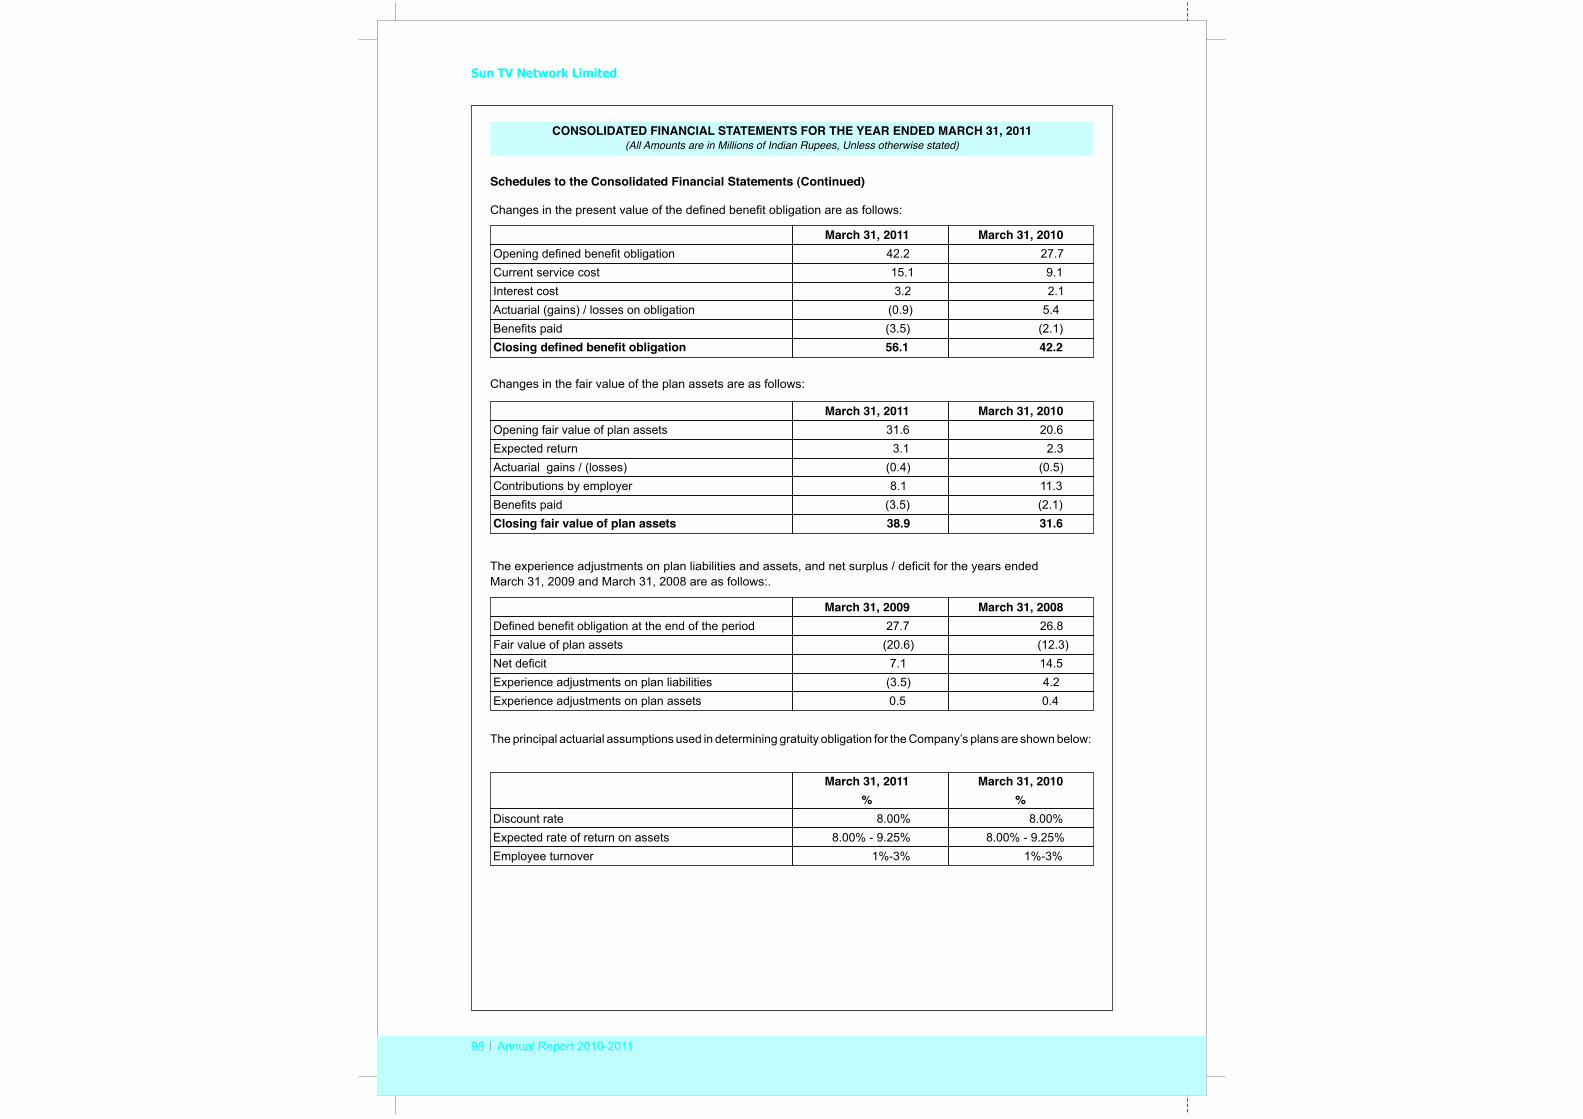
Sun TV Network Limited
98 Annual Report 2010-2011
CONSOLIDATED STATEMENTS FOR THE YEAR ENDED MARCH 31, 2011(All Amounts are in Millions of Indian Rupees, Unless otherwise stated)
FINANCIAL
Changes in the present value of the defined benefit obligation are as follows:
March 31, 2011 March 31, 2010Opening defined benefit obligation 42.2 27.7Current service cost 15.1 9.1Interest cost 3.2 2.1Actuarial (gains) / losses on obligation (0.9) 5.4Benefits paid (3.5) (2.1)Closing defined benefit obligation 56.1 42.2
March 31, 2011 March 31, 2010Opening fair value of plan assets 31.6 20.6Expected return 3.1 2.3Actuarial gains / (losses) (0.4) (0.5)Contributions by employer 8.1 11.3Benefits paid (3.5) (2.1)Closing fair value of plan assets 38.9 31.6
Changes in the fair value of the plan assets are as follows:
The principal actuarial assumptions used in determining gratuity obligation for the Company’s plans are shown below:
March 31, 2010% %
Discount rate 8.00% 8.00%Expected rate of return on assets 8.00% - 9.25% 8.00% - 9.25%Employee turnover 1%-3% 1%-3%
March 31, 2011
Schedules to the Consolidated Financial Statements (Continued)
March 31, 2009 March 31, 2008Defined benefit obligation at the end of the period 27.7 26.8Fair value of plan assets (20.6) (12.3)Net deficit 7.1 14.5Experience adjustments on plan liabilities (3.5) 4.2Experience adjustments on plan assets 0.5 0.4
The experience adjustments on plan liabilities and assets, and net surplus / deficit for the years ended March 31, 2009 and March 31, 2008 are as follows:.
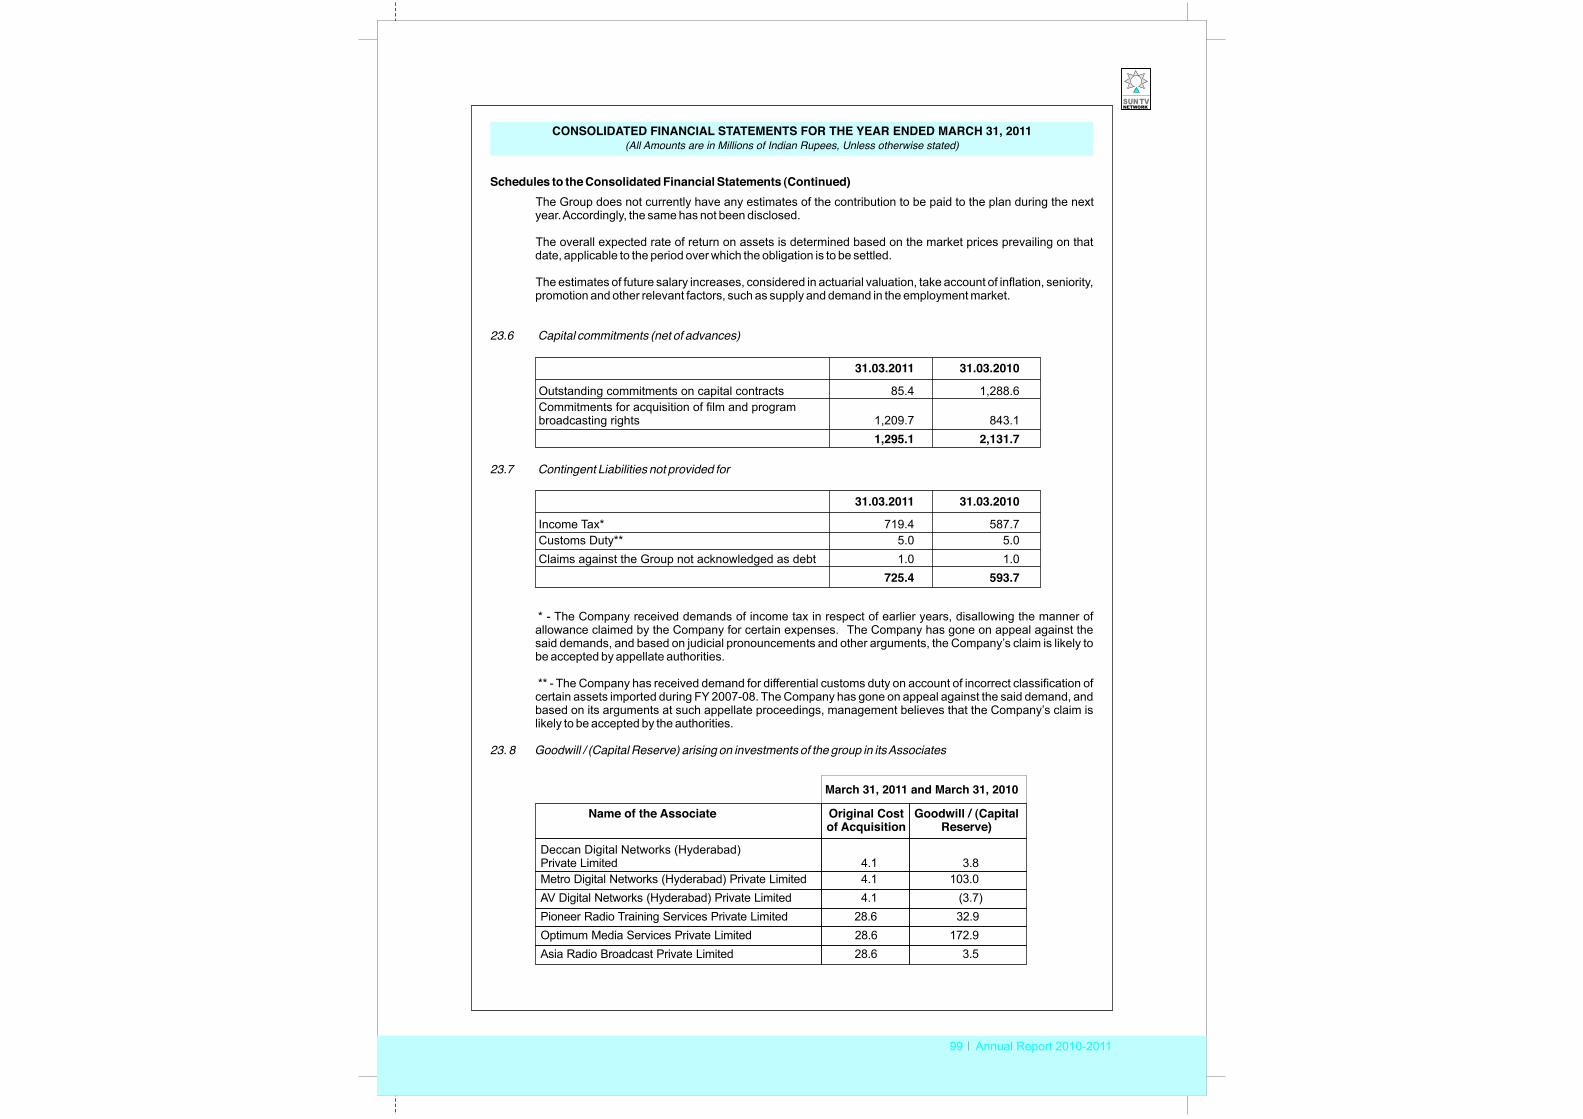
99 Annual Report 2010-2011
CONSOLIDATED STATEMENTS FOR THE YEAR ENDED MARCH 31, 2011(All Amounts are in Millions of Indian Rupees, Unless otherwise stated)
FINANCIAL
Schedules to the Consolidated Financial Statements (Continued)The Group does not currently have any estimates of the contribution to be paid to the plan during the next year. Accordingly, the same has not been disclosed.
The overall expected rate of return on assets is determined based on the market prices prevailing on that date, applicable to the period over which the obligation is to be settled.
The estimates of future salary increases, considered in actuarial valuation, take account of inflation, seniority, promotion and other relevant factors, such as supply and demand in the employment market.
23.6 Capital commitments (net of advances)
23.7 Contingent Liabilities not provided for
* - The Company received demands of income tax in respect of earlier years, disallowing the manner of allowance claimed by the Company for certain expenses. The Company has gone on appeal against the said demands, and based on judicial pronouncements and other arguments, the Company’s claim is likely to be accepted by appellate authorities.
** - The Company has received demand for differential customs duty on account of incorrect classification of certain assets imported during FY 2007-08. The Company has gone on appeal against the said demand, and based on its arguments at such appellate proceedings, management believes that the Company’s claim is likely to be accepted by the authorities.
23. 8 Goodwill / (Capital Reserve) arising on investments of the group in its Associates
31.03.2011 31.03.2010
Outstanding commitments on capital contracts 85.4 1,288.6Commitments for acquisition of film and program broadcasting rights 1,209.7 843.1
1,295.1 2,131.7
31.03.2011 31.03.2010
Income Tax* 719.4 587.7Customs Duty** 5.0 5.0
1.0725.4 593.7
Claims against the Group not acknowledged as debt 1.0
March 31, 2011 and March 31, 2010
Name of the Associate Original Cost Goodwill / (Capitalof Acquisition Reserve)
Deccan Digital Networks (Hyderabad) Private Limited 4.1 3.8Metro Digital Networks (Hyderabad) Private Limited 4.1 103.0AV Digital Networks (Hyderabad) Private Limited 4.1 (3.7)Pioneer Radio Training Services Private Limited 28.6 32.9Optimum Media Services Private Limited 28.6 172.9Asia Radio Broadcast Private Limited 28.6 3.5
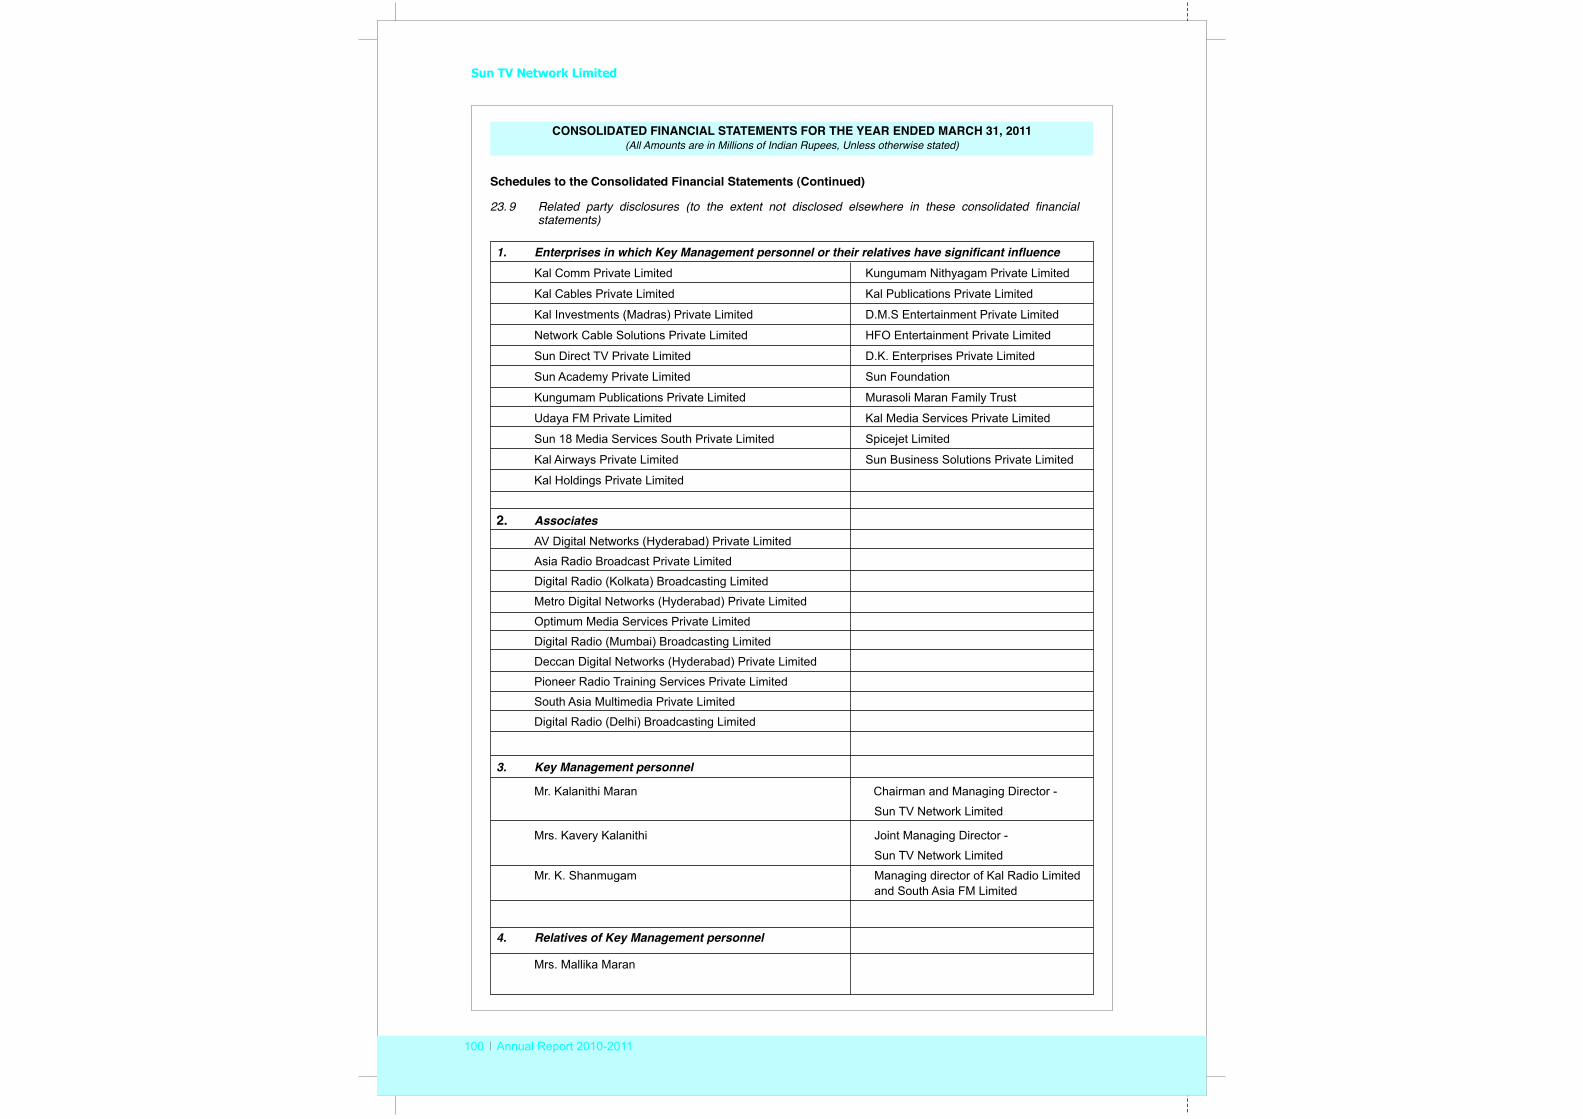
Sun TV Network Limited
100 Annual Report 2010-2011
CONSOLIDATED STATEMENTS FOR THE YEAR ENDED MARCH 31, 2011(All Amounts are in Millions of Indian Rupees, Unless otherwise stated)
FINANCIAL
23. 9 Related party disclosures (to the extent not disclosed elsewhere in these consolidated financial statements)
1. Enterprises in which Key Management personnel or their relatives have significant influence
Kal Cables Private Limited Kal Publications Private Limited
Kal Investments (Madras) Private Limited D.M.S Entertainment Private Limited
Network Cable Solutions Private Limited HFO Entertainment Private Limited
Sun Direct TV Private Limited D.K. Enterprises Private Limited
Sun Academy Private Limited Sun Foundation
Kungumam Publications Private Limited Murasoli Maran Family Trust
Udaya FM Private Limited Kal Media Services Private Limited
Sun 18 Media Services South Private Limited Spicejet Limited
Kal Airways Private Limited Sun Business Solutions Private Limited
Kal Holdings Private Limited
2. AssociatesAV Digital Networks (Hyderabad) Private Limited
Asia Radio Broadcast Private Limited
Digital Radio (Kolkata) Broadcasting Limited
Metro Digital Networks (Hyderabad) Private Limited
Optimum Media Services Private Limited
Digital Radio (Mumbai) Broadcasting Limited
Deccan Digital Networks (Hyderabad) Private Limited
Pioneer Radio Training Services Private Limited
South Asia Multimedia Private Limited
Digital Radio (Delhi) Broadcasting Limited
4. Relatives of Key Management personnel
Mrs. Mallika Maran
Kal Comm Private Limited Kungumam Nithyagam Private Limited
3. Key Management personnel
Mr. Kalanithi Maran Chairman and Managing Director -
Sun TV Network Limited
Mrs. Kavery Kalanithi Joint Managing Director -
Sun TV Network Limited
Mr. K. Shanmugam Managing director of Kal Radio Limitedand South Asia FM Limited
Schedules to the Consolidated Financial Statements (Continued)
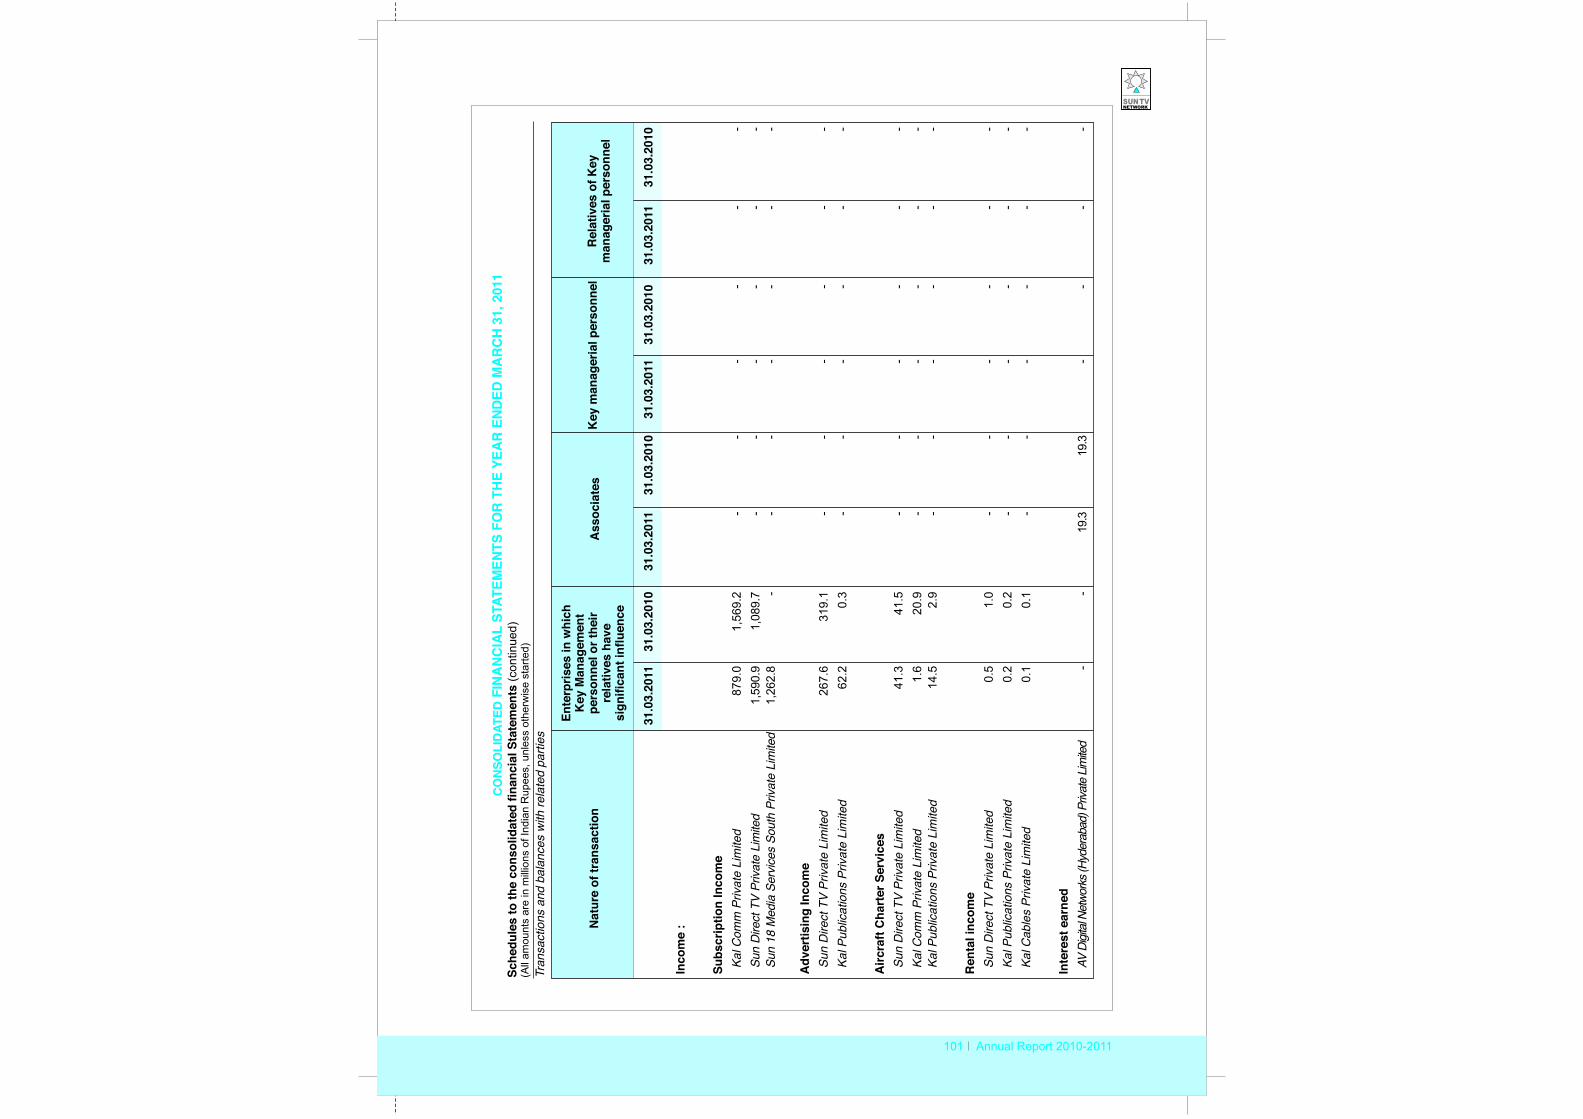
101 Annual Report 2010-2011
Sche
dule
s to
the
finan
cial
Sta
tem
ents
(con
tinue
d)(A
ll am
ount
s ar
e in
mill
ions
of I
ndia
n R
upee
s, u
nles
s ot
herw
ise
star
ted)
cons
olid
ated
CO
NSO
LID
ATED
FIN
AN
CIA
L ST
ATEM
ENTS
FO
R T
HE
YEA
R E
ND
ED M
AR
CH
31,
201
1
Tran
sact
ions
and
bal
ance
s w
ith re
late
d pa
rties
Nat
ure
of tr
ansa
ctio
nR
elat
ives
of K
eym
anag
eria
l per
sonn
el
Ente
rpris
es in
whi
ch
Key
Man
agem
ent
pers
onne
l or t
heir
rela
tives
hav
e si
gnifi
cant
influ
ence
Ass
ocia
tes
Key
man
ager
ial p
erso
nnel
31.0
3.20
1131
.03.
2010
31.0
3.20
1131
.03.
2010
31.0
3.20
1131
.03.
2010
31.0
3.20
1131
.03.
2010
Inco
me
:
Subs
crip
tion
Inco
me
Kal C
omm
Priv
ate
Lim
ited
879.
0-
--
--
-Su
n Di
rect
TV
Priva
te L
imite
d1,
590.
91,
089.
7
Adv
ertis
ing
Inco
me
Sun
Dire
ct T
V Pr
ivat
e Li
mite
d26
7.6
319.
1-
--
--
-Ka
l Pub
licat
ions
Priv
ate
Lim
ited
62.2
0.3
--
--
--
Airc
raft
Cha
rter
Ser
vice
sSu
n D
irect
TV
Priv
ate
Lim
ited
41.3
41.5
--
--
--
Kal C
omm
Priv
ate
Lim
ited
1.6
20.9
--
--
--
Kal P
ublic
atio
ns P
rivat
e Li
mite
d14
.52.
9-
--
--
-
Ren
tal i
ncom
eSu
n D
irect
TV
Priv
ate
Lim
ited
0.5
1.0
--
--
--
Kal P
ublic
atio
ns P
rivat
e Li
mite
d0.
20.
2-
--
--
-Ka
l Cab
les
Priv
ate
Lim
ited
0.1
0.1
--
--
--
Inte
rest
ear
ned
AV D
igita
l Net
work
s (Hy
dera
bad)
Priv
ate
Limite
d-
-19
.319
.3-
--
-
1,56
9.2
--
--
--
Sun
18 M
edia
Ser
vices
Sou
th P
rivat
e Li
mite
d1,
262.
8-
--
--
--
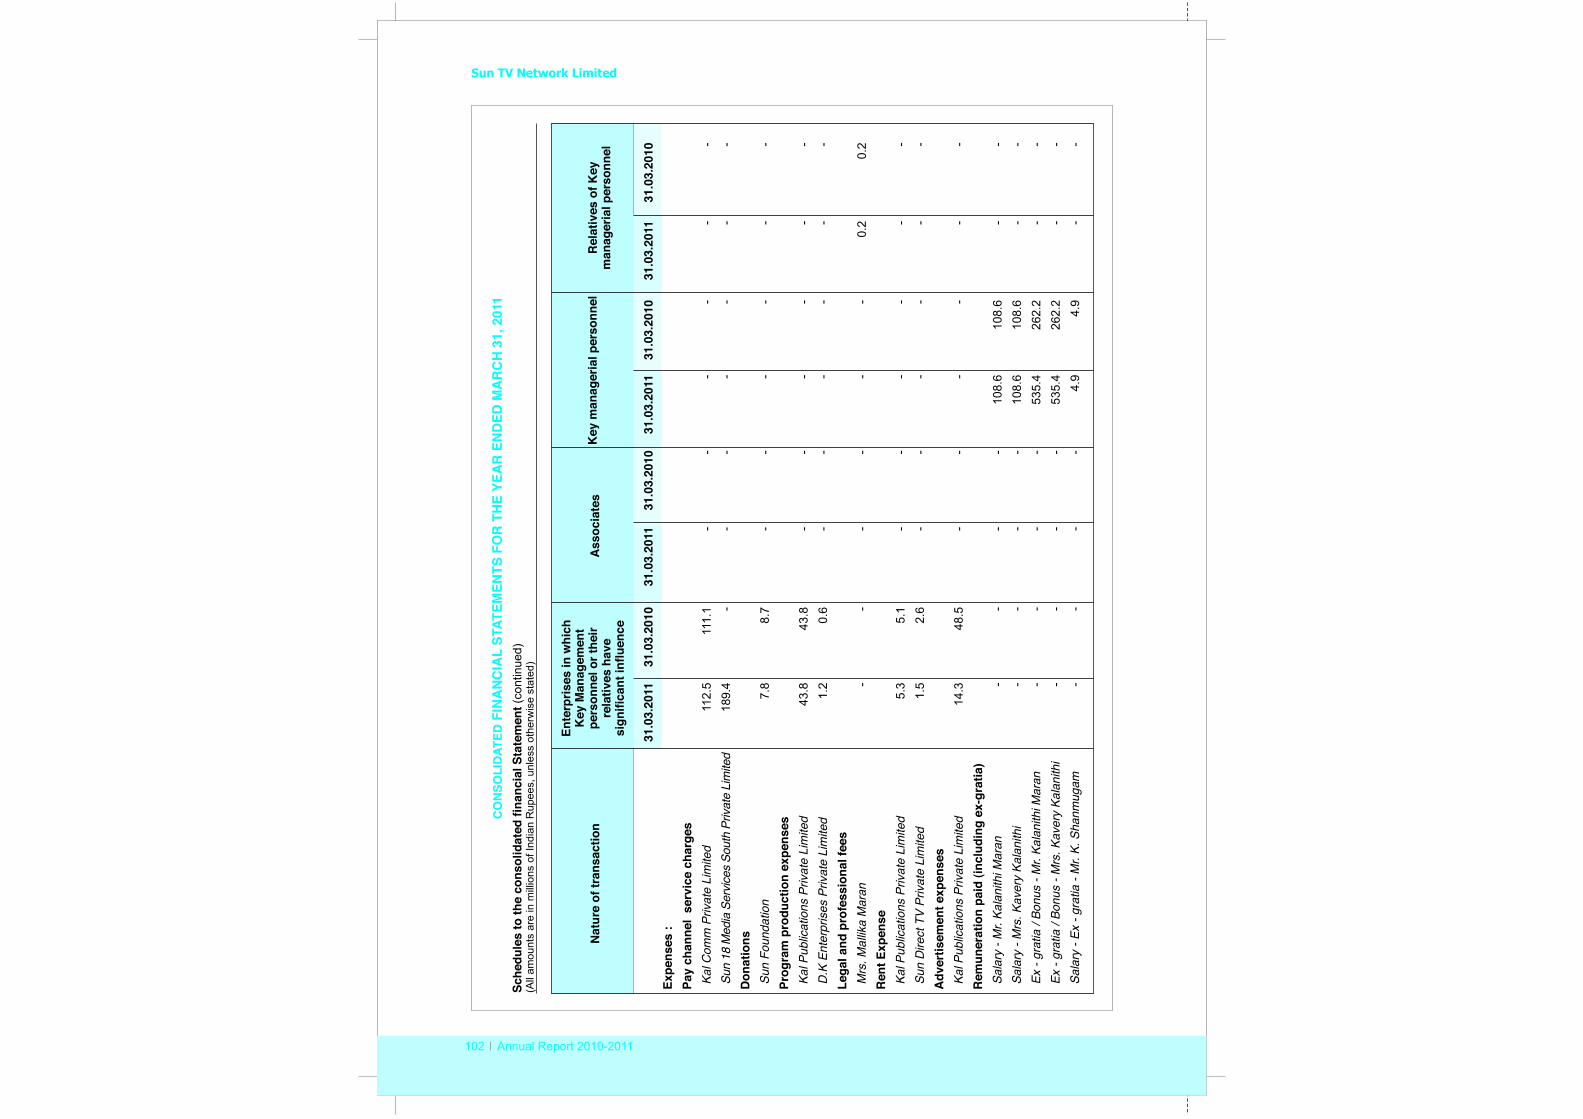
Sun TV Network Limited
102 Annual Report 2010-2011
Rel
ativ
es o
f Key
man
ager
ial p
erso
nnel
Nat
ure
of tr
ansa
ctio
n
Ente
rpris
es in
whi
ch
Key
Man
agem
ent
pers
onne
l or t
heir
rela
tives
hav
e si
gnifi
cant
influ
ence
Ass
ocia
tes
Key
man
ager
ial p
erso
nnel
Sche
dule
s to
the
finan
cial
Sta
tem
ent (
cont
inue
d)(A
ll am
ount
s ar
e in
mill
ions
of I
ndia
n R
upee
s, u
nles
s ot
herw
ise
stat
ed)
cons
olid
ated
CO
NSO
LID
ATED
FIN
AN
CIA
L ST
ATEM
ENTS
FO
R T
HE
YEA
R E
ND
ED M
AR
CH
31,
201
1
31.0
3.20
1131
.03.
2010
31.0
3.20
1131
.03.
2010
31.0
3.20
1131
.03.
2010
31.0
3.20
1131
.03.
2010
Expe
nses
:Pa
y ch
anne
l se
rvic
e ch
arge
sKa
l Com
m P
rivat
e Li
mite
d11
2.5
--
--
--
Sun
18 M
edia
Ser
vices
Sou
th P
rivat
e Li
mite
d18
9.4
--
--
--
-D
onat
ions
Sun
Foun
datio
n7.
88.
7-
--
--
-Pr
ogra
m p
rodu
ctio
n ex
pens
esKa
l Pub
licat
ions
Priv
ate
Lim
ited
43.8
43.8
--
--
--
D.K
Ent
erpr
ises
Priv
ate
Lim
ited
1.2
0.6
--
--
--
Lega
l and
pro
fess
iona
l fee
sM
rs. M
allik
a M
aran
--
--
--
0.2
0.2
Ren
t Exp
ense
Kal P
ublic
atio
ns P
rivat
e Li
mite
d5.
35.
1-
--
--
-Su
n D
irect
TV
Priv
ate
Lim
ited
1.5
2.6
--
--
--
Adv
ertis
emen
t exp
ense
sKa
l Pub
licat
ions
Priv
ate
Lim
ited
14.3
48.5
--
--
--
Rem
uner
atio
n pa
id (i
nclu
ding
ex-
grat
ia)
Sala
ry -
Mr.
Kala
nith
i Mar
an-
--
-10
8.6
108.
6-
-Sa
lary
- M
rs. K
aver
y Ka
lani
thi
--
--
108.
610
8.6
--
Ex -
grat
ia /
Bonu
s - M
r. Ka
lani
thi M
aran
--
--
535.
426
2.2
--
Ex -
grat
ia /
Bonu
s - M
rs. K
aver
y Ka
lani
thi
--
--
535.
426
2.2
--
Sala
ry -
Ex -
grat
ia -
Mr.
K. S
hanm
ugam
--
--
4.9
4.9
--
111.
1

103 Annual Report 2010-2011
31.0
3.20
1131
.03.
2010
31.0
3.20
1131
.03.
2010
31.0
3.20
1131
.03.
2010
31.0
3.20
1131
.03.
2010
Shar
e in
pro
fits
/ (lo
sses
) fro
m A
ssoc
iate
sDe
ccan
Digi
tal N
etwo
rks (
Hyde
raba
d) P
rivat
e Lim
ited
--
12.3
5.9
--
--
Asia
Rad
io B
road
cast
Priv
ate L
imite
d-
-5.
4
(6
.6)
--
--
Pion
eer R
adio
Train
ing S
ervic
es P
rivat
e Lim
ited
--
17.2
9.0
--
--
Div
iden
ds P
aid
/ Pay
able
Mr.
Kala
nith
i Mar
an-
--
-2,
655.
175
8.6
--
Rei
mbu
rsem
ent o
f Cos
t of s
hare
d se
rvic
esKa
l Pub
licat
ions
Priv
ate
Lim
ited
(1.4
)1.
0-
--
--
-
Sale
of A
sset
sKa
l Pub
licat
ions
Priv
ate
Lim
ited
-0.
5-
--
--
-
Expe
nditu
re o
n In
tang
ible
ass
ets
unde
r dev
elop
men
tD.
K. E
nter
prise
s Pr
ivate
Lim
ited
1.0
1.3
--
--
--
Nat
ure
of tr
ansa
ctio
nR
elat
ives
of K
eym
anag
eria
l per
sonn
el
Sche
dule
s to
the
finan
cial
Sta
tem
ent (
cont
inue
d)(A
ll am
ount
s ar
e in
mill
ions
of I
ndia
n R
upee
s, u
nles
s ot
herw
ise
stat
ed)
cons
olid
ated
CO
NSO
LID
ATED
FIN
AN
CIA
L ST
ATEM
ENTS
FO
R T
HE
YEA
R E
ND
ED M
AR
CH
31,
201
1
Ente
rpris
es in
whi
ch
Key
Man
agem
ent
pers
onne
l or t
heir
rela
tives
hav
e si
gnifi
cant
influ
ence
Ass
ocia
tes
Key
man
ager
ial p
erso
nnel

Sun TV Network Limited
104 Annual Report 2010-2011
CO
NSO
LID
ATED
FIN
AN
CIA
L ST
ATEM
ENTS
FO
R T
HE
YEA
R E
ND
ED M
AR
CH
31,
201
1Sc
hedu
les
to th
e fin
anci
al S
tate
men
t (co
ntin
ued)
(All
amou
nts
are
in m
illio
ns o
f Ind
ian
Rup
ees,
unl
ess
othe
rwis
e st
ated
)co
nsol
idat
ed
Nat
ure
of tr
ansa
ctio
nR
elat
ives
of K
eym
anag
eria
l per
sonn
el
Ente
rpris
es in
whi
ch
Key
Man
agem
ent
pers
onne
l or t
heir
rela
tives
hav
e si
gnifi
cant
influ
ence
Ass
ocia
tes
Key
man
ager
ial p
erso
nnel
31.0
3.20
1131
.03.
2010
31.0
3.20
1131
.03.
2010
31.0
3.20
1131
.03.
2010
31.0
3.20
1131
.03.
2010
Bal
ance
Out
stan
ding
:
Uns
ecur
ed lo
ans
paya
ble
Mr.
Kala
nith
i Mar
an-
--
-1.
41.
4-
-
Acco
unts
Rec
eiva
ble
Kal C
omm
Priv
ate
Lim
ited
78.5
191.
3-
--
--
-Su
n Di
rect
TV
Priva
te L
imite
d51
6.2
205.
8-
--
--
-Ka
l Pub
licat
ions
Priv
ate
Lim
ited
69.3
0.5
--
--
--
Sun
18 M
edia
Ser
vices
Sou
th P
rivat
e Li
mite
d21
7.3
--
--
--
-Sp
iceje
t Lim
ited
0.7
--
--
--
-
Loan
s an
d Ad
vanc
esKa
l Pub
licat
ions
Priv
ate
Lim
ited
7.1
--
--
--
-Ka
l Com
m P
rivate
Lim
ited
5.2
5.2
--
--
-AV
Digi
tal N
etwor
ks (H
yder
abad
) Priv
ate Li
mite
d-
-32
1.5
321.
5-
--
-Su
n Di
rect
TV
Priva
te L
imite
d4.
8-
--
--
--
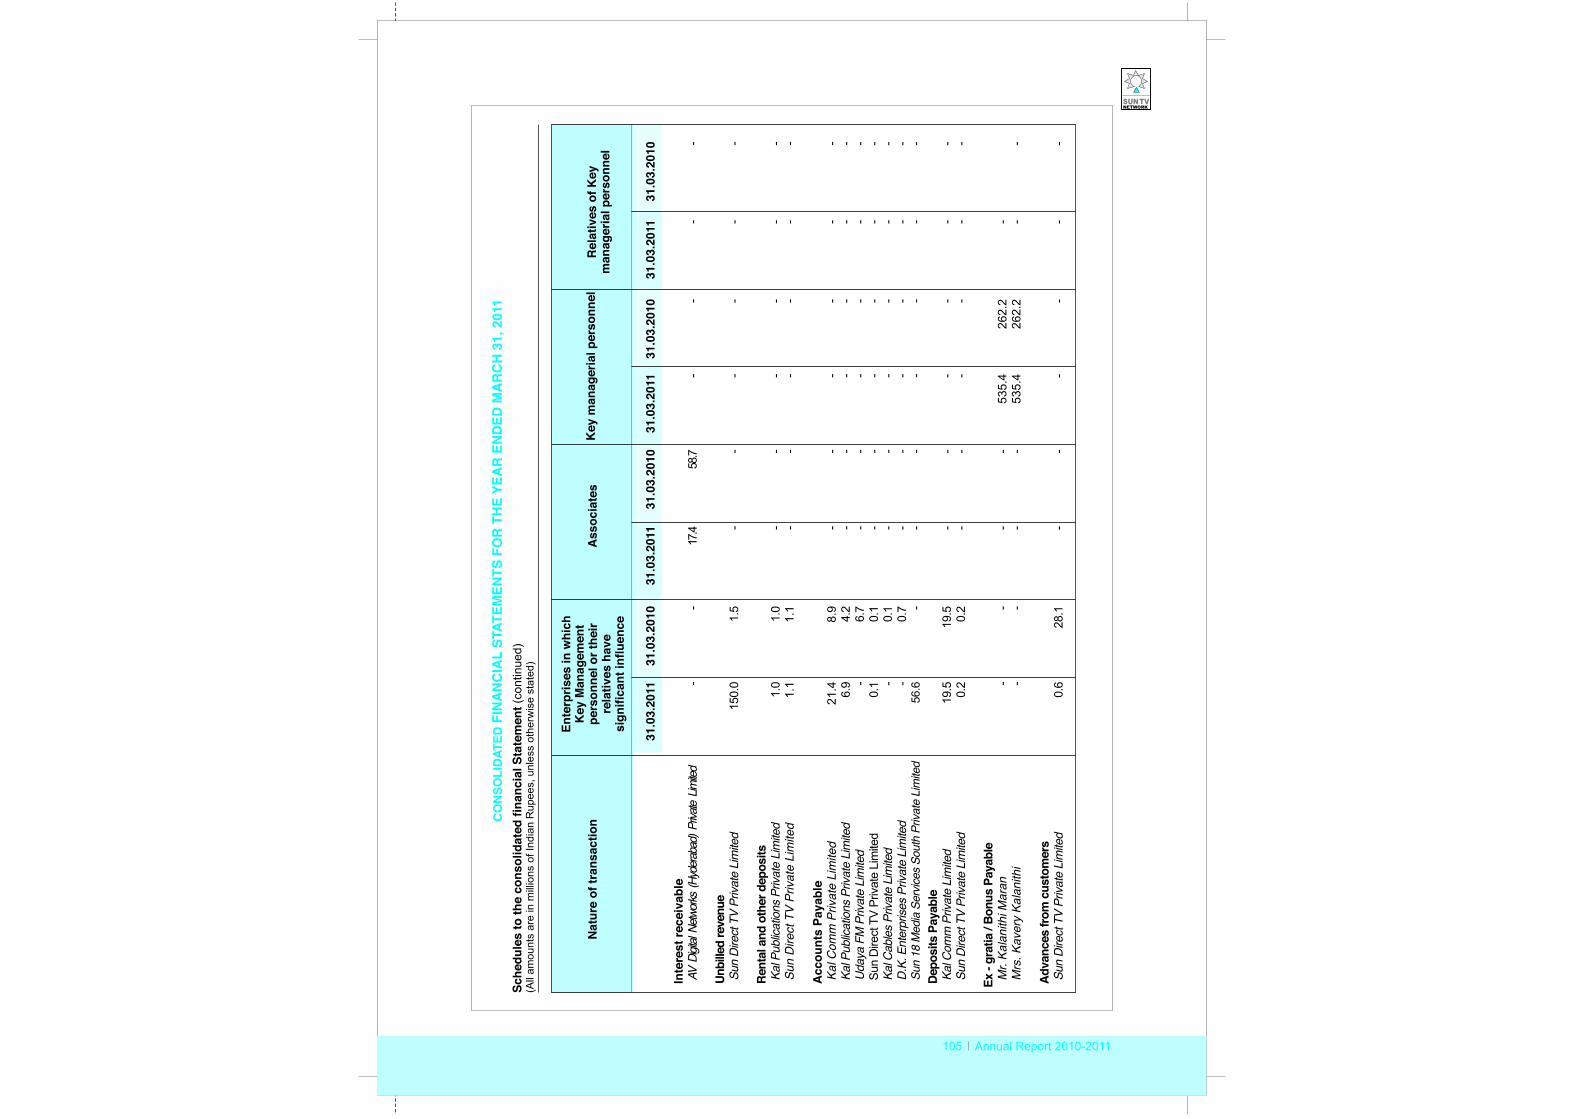
105 Annual Report 2010-2011
CO
NSO
LID
ATED
FIN
AN
CIA
L ST
ATEM
ENTS
FO
R T
HE
YEA
R E
ND
ED M
AR
CH
31,
201
1Sc
hedu
les
to th
e fin
anci
al S
tate
men
t (co
ntin
ued)
(All
amou
nts
are
in m
illio
ns o
f Ind
ian
Rup
ees,
unl
ess
othe
rwis
e st
ated
)co
nsol
idat
ed
Nat
ure
of tr
ansa
ctio
nR
elat
ives
of K
eym
anag
eria
l per
sonn
el
Ente
rpris
es in
whi
ch
Key
Man
agem
ent
pers
onne
l or t
heir
rela
tives
hav
e si
gnifi
cant
influ
ence
Ass
ocia
tes
Key
man
ager
ial p
erso
nnel
31.0
3.20
1131
.03.
2010
31.0
3.20
1131
.03.
2010
31.0
3.20
1131
.03.
2010
31.0
3.20
1131
.03.
2010
Inte
rest
rece
ivab
leAV
Digit
al Ne
twork
s (H
ydera
bad)
Priv
ate L
imite
d-
-17
.458
.7-
--
-
Unbi
lled
reve
nue
Sun
Dire
ct T
V Pr
ivate
Lim
ited
150.
01.
5-
--
--
-
Rent
al a
nd o
ther
dep
osits
Kal P
ublic
atio
ns P
rivat
e Li
mite
d1.
01.
0-
--
--
-Su
n D
irect
TV
Priv
ate
Lim
ited
1.1
1.1
--
--
--
Acc
ount
s Pa
yabl
eKa
l Com
m P
rivat
e Li
mite
d21
.48.
9-
--
--
-Ka
l Pub
licat
ions
Priv
ate
Lim
ited
6.9
4.2
--
--
--
Uday
a FM
Priv
ate
Lim
ited
-6.
7-
--
--
-Su
n D
irect
TV
Priv
ate
Lim
ited
0.1
0.1
--
--
--
Kal C
able
s Pr
ivate
Lim
ited
-0.
1-
--
--
-D.
K. E
nter
prise
s Pr
ivate
Lim
ited
-0.
7-
--
--
-Su
n 18
Med
ia S
ervic
es S
outh
Priv
ate
Lim
ited
56.6
--
--
--
-De
posi
ts P
ayab
leKa
l Com
m P
rivat
e Li
mite
d19
.519
.5-
--
--
-Su
n Di
rect
TV
Priva
te L
imite
d0.
20.
2-
--
--
-
Ex -
grat
ia /
Bonu
s Pa
yabl
eM
r. Ka
lani
thi M
aran
--
--
535.
426
2.2
-M
rs. K
aver
y Ka
lani
thi
--
--
535.
426
2.2
--
Adva
nces
from
cus
tom
ers
Sun
Dire
ct T
V Pr
ivate
Lim
ited
0.6
28.1
--
--
--
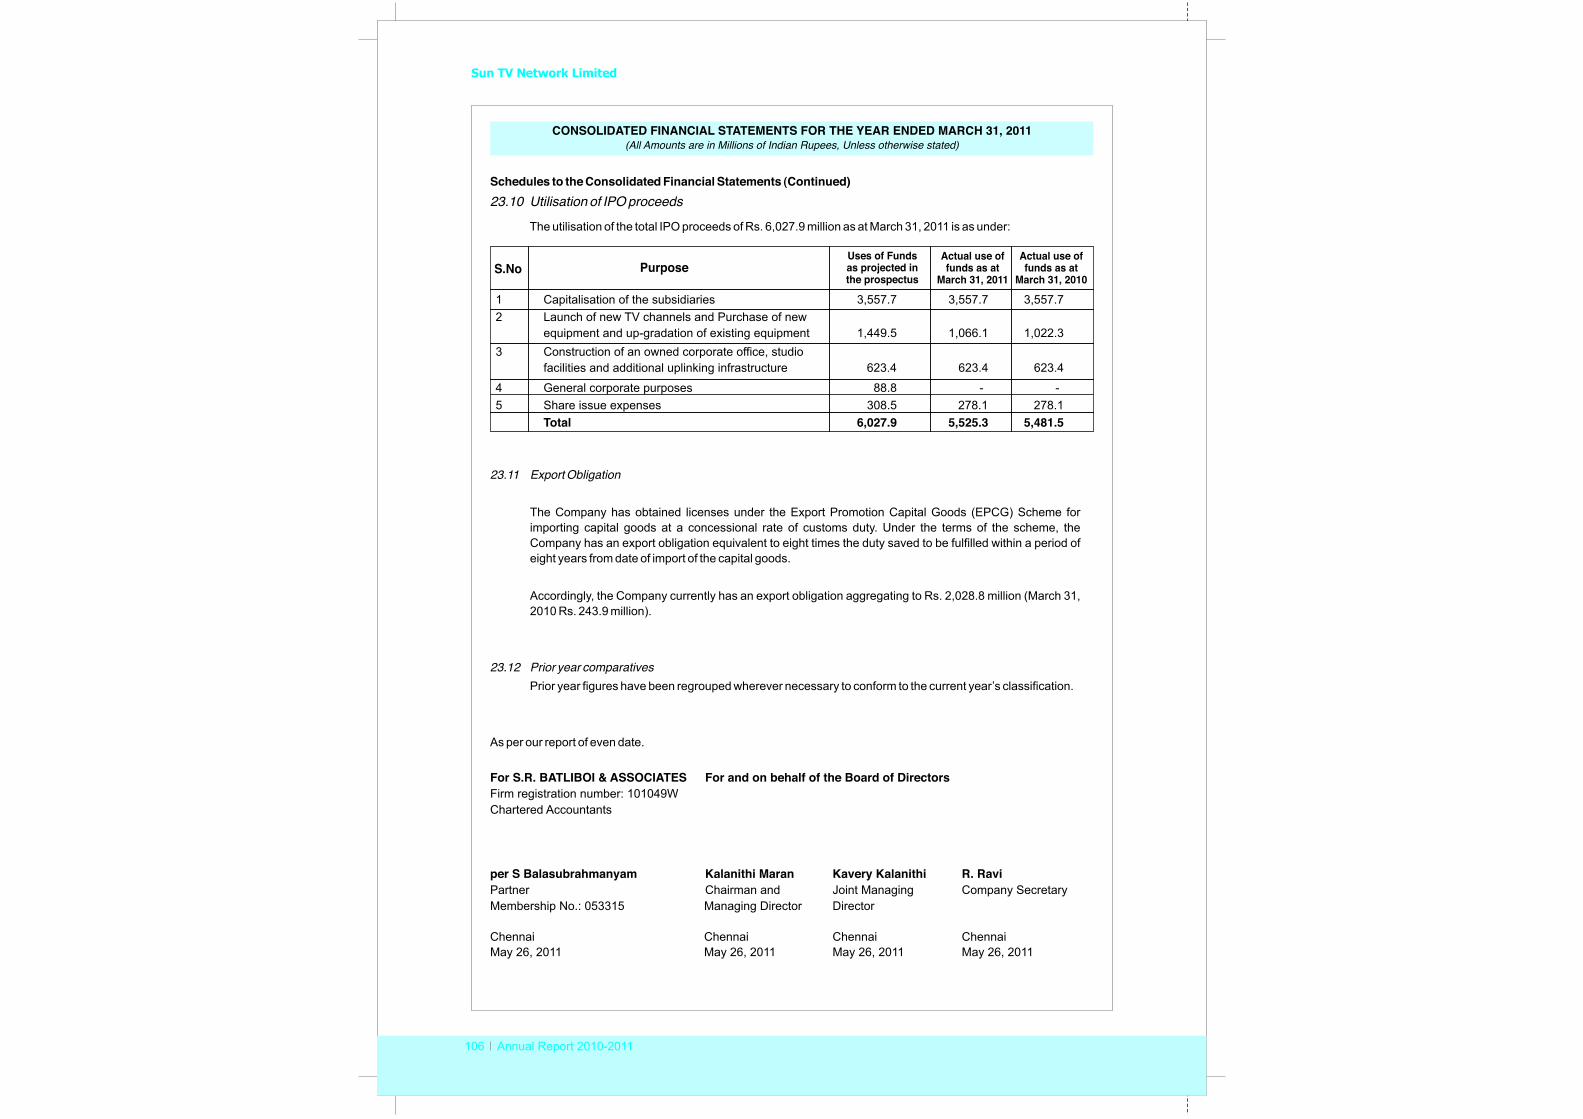
Sun TV Network Limited
106 Annual Report 2010-2011
CONSOLIDATED FINANCIAL STATEMENTS FOR THE YEAR ENDED MARCH 31, 2011 (All Amounts are in Millions of Indian Rupees, Unless otherwise stated)
Schedules to the Consolidated Financial Statements (Continued)23.10 Utilisation of IPO proceeds
The utilisation of the total IPO proceeds of Rs. 6,027.9 million as at March 31, 2011 is as under:
23.11 Export Obligation
The Company has obtained licenses under the Export Promotion Capital Goods (EPCG) Scheme for importing capital goods at a concessional rate of customs duty. Under the terms of the scheme, the Company has an export obligation equivalent to eight times the duty saved to be fulfilled within a period of eight years from date of import of the capital goods.
Accordingly, the Company currently has an export obligation aggregating to Rs. 2,028.8 million (March 31, 2010 Rs. 243.9 million).
23.12 Prior year comparatives Prior year figures have been regrouped wherever necessary to conform to the current year’s classification.
As per our report of even date.
For S.R. BATLIBOI & ASSOCIATES For and on behalf of the Board of DirectorsFirm registration number: 101049WChartered Accountants
per S Balasubrahmanyam Kalanithi Maran Kavery Kalanithi R. RaviPartner Chairman and Joint Managing Company SecretaryMembership No.: 053315 Managing Director Director
Chennai Chennai Chennai Chennai May 26, 2011 May 26, 2011 May 26, 2011 May 26, 2011
Uses of Funds as projected in the prospectus
S.No PurposeActual use of funds as at
March 31, 2011
Actual use of funds as at
March 31, 2010
1 Capitalisation of the subsidiaries 3,557.72 Launch of new TV channels and Purchase of new
equipment and up-gradation of existing equipment 1,449.5 1,066.1 1,022.33 Construction of an owned corporate office, studio
facilities and additional uplinking infrastructure 623.4 623.4 623.4
4 General corporate purposes 88.8 - -5 Share issue expenses 308.5 278.1 278.1
Total 6,027.9
3,557.7 3,557.7
5,525.3 5,481.5
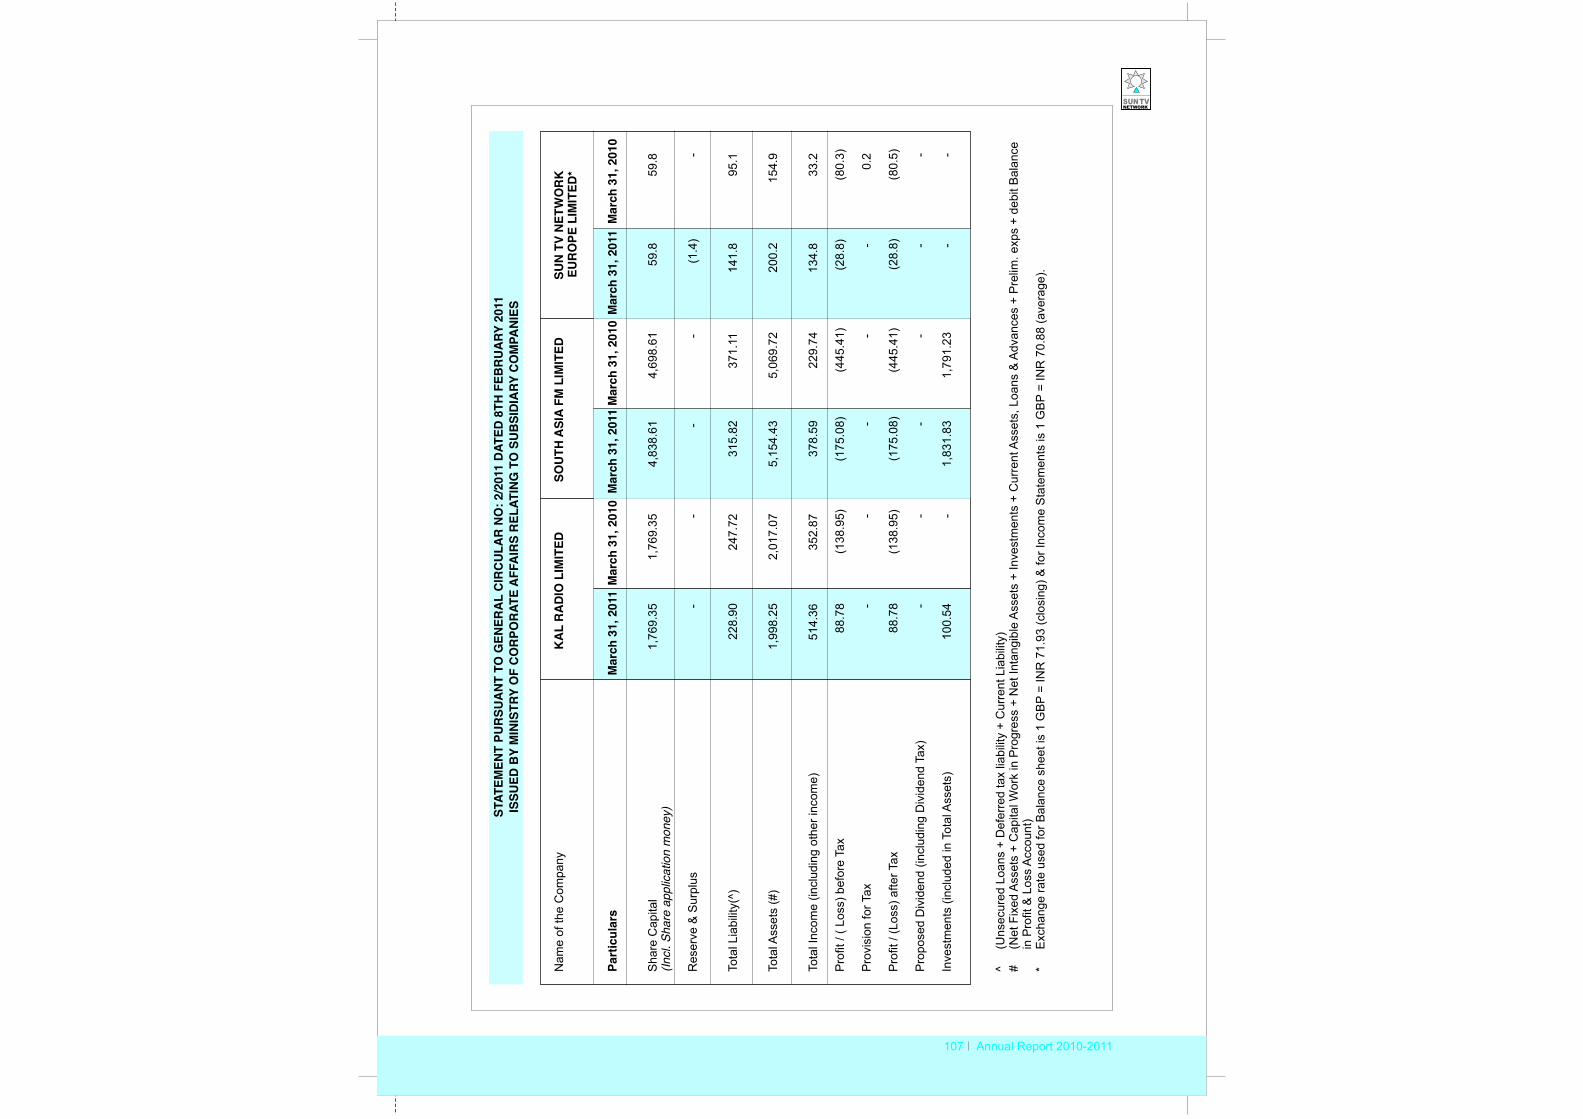
107 Annual Report 2010-2011
Nam
e of
the
Com
pany
KA
L R
AD
IO L
IMIT
EDSO
UTH
ASI
A FM
LIM
ITED
SUN
TV
NET
WO
RK
EUR
OPE
LIM
ITED
*
Part
icul
ars
Mar
ch 3
1, 2
011
Mar
ch 3
1, 2
010
Mar
ch 3
1, 2
011
Mar
ch 3
1, 2
010
Mar
ch 3
1, 2
011
Mar
ch 3
1, 2
010
Sha
re C
apita
l1,
769.
351,
769.
354,
838.
614,
698.
6159
.859
.8(In
cl. S
hare
app
licat
ion
mon
ey)
Res
erve
& S
urpl
us-
--
-(1
.4)
-
Tota
l Lia
bilit
y(^)
228.
9024
7.72
315.
8237
1.11
141.
895
.1
Tota
l Ass
ets
(#)
1,99
8.25
2,0
17.0
75,
154.
435,
069.
7220
0.2
154.
9
Tota
l Inc
ome
(incl
udin
g ot
her i
ncom
e)51
4.36
352.
8737
8.59
229.
7413
4.8
33.2
Pro
fit /
( Los
s) b
efor
e Ta
x88
.78
(138
.95)
(175
.08)
(445
.41)
(28.
8)(8
0.3)
Pro
visi
on fo
r Tax
-
--
--
0.2
Pro
fit /
(Los
s) a
fter T
ax88
.78
(138
.95)
(175
.08)
(445
.41)
(28.
8)(8
0.5)
Pro
pose
d D
ivid
end
(incl
udin
g D
ivid
end
Tax)
--
--
--
Inve
stm
ents
(inc
lude
d in
Tot
al A
sset
s)10
0.54
-1,
831.
831,
791.
23-
-
^(U
nsec
ured
Loa
ns +
Def
erre
d ta
x lia
bilit
y +
Cur
rent
Lia
bilit
y)#
(Net
Fix
ed A
sset
s +
Cap
ital W
ork
in P
rogr
ess
+ N
et In
tang
ible
Ass
ets
+ In
vest
men
ts +
Cur
rent
Ass
ets,
Loa
ns &
Adv
ance
s +
Pre
lim. e
xps
+ de
bit B
alan
ce
in P
rofit
& L
oss
Acc
ount
)*
Exc
hang
e ra
te u
sed
for B
alan
ce s
heet
is 1
GB
P =
INR
71.
93 (c
losi
ng) &
for I
ncom
e S
tate
men
ts is
1 G
BP
= IN
R 7
0.88
(ave
rage
).
STAT
EMEN
T PU
RSU
AN
T TO
GEN
ERA
L C
IRC
ULA
R N
O: 2
/201
1 D
ATED
8TH
FEB
RU
ARY
201
1IS
SUED
BY
MIN
ISTR
Y O
F C
OR
POR
ATE
AFF
AIR
S R
ELAT
ING
TO
SU
BSI
DIA
RY C
OM
PAN
IES
SUN TV NETWORK LIMITEDRegd. Office: Murasoli Maran Towers, 73, MRC Nagar Main Road, MRC Nagar, Chennai – 600 028
ATTENDANCE SLIP
Twenty Sixth Annual General Meeting, 19th September 2011
Regd. Folio No./ DP ID/ Client ID _____________________
No. of shares held ________________
I certify that I am a registered shareholder/proxy for the registered shareholder of the Company. I hereby record my presence at the Twenty Sixth Annual General Meeting of the Company to be held on Monday, the 19th September 2011 at 10.00 AM at
Name of the Member/proxy Signature of the member/proxy(in BLOCK letters)Name of the Member/proxy
Note: Members are requested to fill up this attendance slip and hand it over at the entrance of the meeting hall. No duplicate attendance slips will be issued at the venue of the meeting. Members are requested to bring their copies of the Annual Report to the meeting
SUN TV NETWORK LIMITEDRegd. Office: Murasoli Maran Towers, 73, MRC Nagar Main Road, MRC Nagar, Chennai – 600 028
PROXY FORM
Regd. Folio No./ DP ID/ Client ID _____________________
Twenty Sixth Annual General Meeting, 19th September 2011
No. of shares held ________________
Signed this ____________________ day of __________________ 2011
Note: The proxy form in order to be effective should be duly stamped, completed and deposited at the Registered Office of the Company at Murasoli Maran Towers, 73 MRC Nagar Main Road, MRC Nagar, Chennai – 600 028 not less than 48 hours before the time for holding the meeting.
Kalaignar Arangam, Anna Arivalayam, 367 / 369, Anna Salai, Teynampet, Chennai - 600 018.
Affix 1 Rupee Stamp
I/We of being amember of Sun TV Network Limited hereby appoint of
as my/our Proxy or failing him/her ofas my proxy to vote for me/us on my/our behalf at the Twenty
Sixth Annual General Meeting of the Company to be held on Monday, the 19th September 2011 at 10.00 AM at and at any
adjournment thereof.Kalaignar Arangam, Anna Arivalayam, 367 / 369, Anna Salai, Teynampet, Chennai - 600 018