Embed Size (px)
Citation preview
Board Interlocks and Earnings Management Contagion
Peng-Chia Chiu
The Paul Merage School of Business, University of California-Irvine
Siew Hong Teoh*
The Paul Merage School of Business, University of California-Irvine
Feng Tian
School of Business, The University of Hong Kong
Revised November 2010
*Corresponding author: The Paul Merage School of Business, University of California-Irvine, Irvine, CA 92697-3125, USA; E-mail: [email protected].
We thank participants at the 20th Conference on Financial Economics and Accounting, Rutger’s University (November 2009), workshop participants at Southern Methodist University, University of California-Irvine, and University of Toronto, and David Hirshleifer, Hai Lu, Partha Mohanram, Mort Pincus, and Devin Shanthikumar for very helpful comments.

Board Interlocks and Earnings Management Contagion
Abstract
We test whether earnings management (like a virus) spreads from firm to firm via board
connections of shared directors (virus carriers). We use earnings restatements to identify firms
that managed earnings and to identify the period when these firms manipulated earnings. We
consider firms as infectious in the period when they manipulated earnings. We test whether the
directors of the infected firms carry these earnings management behaviors to susceptible firms on
whose boards they also sit on.
We find evidence of earnings management contagion in firms with interlocked boards. A
firm sharing a common director with an earnings manipulator is more likely to manage earnings.
The contagion is stronger when the shared director has a leadership position (e.g. board chair or
audit committee chair) or an accounting-relevant position (audit committee member) in the
susceptible firm. Contagion effects are not due to reverse causality effects, common industry
shocks, geographical proximity, or common auditor firm. Contagion effects exacerbate earnings
management incentives, such as M&A activities or situations associated with accounting fraud.
Overall, the evidence supports the idea that economic behaviors such as earnings manipulation
also spread through private social networks, and not just through public information channels.
JEL Classification: M40; M41; M49; G34; G39; D83. Keywords: Earnings Management; Restatements; Board Interlocks; Social Networks; Contagion; Governance.

Board interlocks and earnings management contagion
“He that lies with dogs, shall rise up with fleas.” ---Benjamin Franklin
1. Introduction
Theoretical research on social influence has examined how information and behaviors are
transmitted from individual to individual (e.g., Banerjee 1992; Bikhchandani, Hirshleifer, and
Welch 1992). Behaviors can spread for several reasons. Rational observers may follow the
behavior of others based on direct communication of the rationale for the chosen action,
observation of the action, or observation of the outcome of a hidden action. In these cases,
rational Bayesian updating causes followers to behave similarly to predecessors. Observers may
also imitate because of a preference to conform, or because of excessive deference to the
judgment of a high-prestige model.
A growing body of research on social networks examines how social linkages affect the
spread of behaviors and social outcomes. On the empirical side, recent research has documented
that several types of corporate behaviors such as investment choices, mergers and acquisitions,
compensation practices, poison pill adoption, and stock exchange listing decisions spread
through networks of interlocking boards (Davis 1991; Haunschild 1993; Rao, Davis, and Ward.
2000; Cohen, Frazzini, and Malloy 2008; Bizjak, Lemmon, and Whitby 2009; Cai and Sevilir
2009; Fracassi 2009; Stuart and Yim 2010; Ishii and Xuan 2010; see also note 6 for details).
Hirshleifer and Teoh (2009) suggest that financial reporting practices (earnings
management included) may be infectious and may spread through social networks. In this study,
we investigate whether earnings management behaviors are propagated through interlocking
corporate boards. A board link exists when an individual serves on the board of more than one
firm. A typical firm in our sample has nine members on its board of directors, and the median
1

number of links members of a board have to other boards is about 5 (see Panel B of Table 1).
Firms therefore are widely connected by the board of director networks that potentially can serve
as conduits for sharing information that can then lead to correlated earnings management
behaviors (We suggest possible mechanisms for this to happen later).
A common challenge for researchers on earnings management behavior is that earnings
management is difficult to identify reliably. A feasible solution to this problem from past
studies1 is to use ex post identification of earnings management from a sample of restatements
because restatements are a clear symptom of earlier bad financial reporting choices that violated
GAAP. Therefore, we identify a firm that has a restatement as an earnings manipulator, and we
identify the earliest fiscal year in which the infected firm’s earnings had to be restated
manipulation period; see Figure1. An earnings manipulator is considered infectious during the
manipulation period. We test whether the infection (earnings management) spreads to susceptible
firms, which are defined as firms that are connected to the infected firm via common board of
directors. We determine that a susceptible firm managed its earnings if those earnings had to be
restated in a subsequent period.
as the
Our test for earnings management contagion through the propagation of restatements is
similar to the study of the contagion of viral agents using flu outbreaks. A person is most
infectious before the flu symptoms are apparent, and therefore a study of the spread of the flu
virus would focus on the network of people exposed during this earlier infectious period, rather
than in the days when the symptoms are apparent. Similarly, we focus on contagion during the
1 Some examples of previous studies that rely on earnings restatements to identify earnings management activity include Palmrose, Richardson and Scholz (2004), Hribar and Jenkins (2004), Lee, Li and Yue (2006), Gleason, Jenkins and Johnson (2008), Kedia and Rajgopal (2008), McNichols and Stubben (2008), and Badertscher, Phillips, Pincus, and Rego (2009).
2
earlier manipulation (infectious) period that precedes the public announcement of the restatement
(akin to when flu symptoms appear).
For several reasons, we do not study contagion occurring at the time of the restatement
event itself. The restatement announcement is public, and so the announcement period is a less
compelling setting to examine contagion via the private channel of the board network.
Furthermore, restatement contagion is not even feasible unless the prior accounting violated
GAAP. A restatement is also often accompanied by other corporate events such as director
turnovers, and so the board directors who are present at the time of the restatement may be
different from those during the manipulation period.2 Finally, the restatement announcement
itself contains news directly relevant to peers; for example, Durnev and Mangen (2009) suggest
that restatements reveal news about the value of investment projects of the restating firms’
competitors. Such news would contaminate a test for whether the private information conveyed
by the board network channel induces earnings management contagion.
We find strong evidence of earnings management contagion during the manipulation
period. A susceptible firm is more likely to manage earnings when it shares a common director
with an earnings manipulator. The contagion effect is also economically significant. The
regression odds ratio suggests that a board link to a manipulator doubles the firm’s likelihood of
managing earnings. Interestingly, we also find evidence for contagion of good financial
reporting. A board link to a firm that is not a manipulator significantly decreases the likelihood
of the firm being a manipulator. In sum, both good and bad accounting behaviors are contagious
across board networks.
2 Srinivasan (2005) documents that the outside directors of restating firms are more likely to lose not just their board position in the restating firm but also their board positions in other firms.
3

Just as some disease vectors are more effective than others, we also consider whether
directors in some board positions in the susceptible firm spread earnings management more
effectively than directors in other board positions. We differentiate board links in the susceptible
firm by whether the director is or is not the CEO, board chairman, audit committee member, or
audit committee chairman. We find the earnings management contagion is stronger for directors
who hold any of the latter three positions, but not for the CEO position. Board chair and audit
committee positions generally exert a greater influence over the firm’s financial reporting
decisions than other board positions, and can constrain the CEO from her desire to manipulate
earnings. These directors are therefore in a better position either to facilitate or constrain
earnings management contagion. The evidence suggests that board supervision of management is
important for ensuring high quality financial reporting.
There are several potential mechanisms by which the contagion we have identified may
operate. As indicated in the opening paragraph of the introduction, earnings management
behaviors can spread through direct communication in a board network of the earnings
management technology, and direct observation by linked directors of the net benefits to
managing earnings, including the reward of upwardly biased stock returns to earnings
management behaviors of linked firms. Furthermore, when businesses are complex, there is gray
area for what is acceptable under GAAP versus deceptive financial reporting that violates
GAAP. A director of a tainted firm may learn about either the social norm or auditors’ degree of
tolerance for deceptive financial reporting. This information can encourage earnings
management in the linked firm. Gino, Ayal, and Ariely (2009) suggest that observers are more
likely to imitate individuals who are viewed as belonging to the same group (in-group) than out-
group individuals. Directors are more likely to view other members of the board as belonging to
4

the in-group. Thus, the social pressure to conform within the interlocked board network can
induce imitation of earnings management behaviors in susceptible firms.
As opposed to contagion, similarity in financial reporting choices may result from similar
characteristics of linked firms and/or from director fixed effects. As an example of director fixed
effects, a director on two boards may be a lax monitor, encouraging earnings management at
both. As an example of similarity in firm characteristics (together with endogeneity in the hiring
of directors), firms with incentives to manage earnings may deliberately choose directors that are
known to be lax monitors, or have more aggressive or optimistic outlook about firm prospects.
Such firms will thereby end up managing earnings and sharing the same directors.
To ascertain whether the estimated board contagion is real or is an artifact of director
characteristics and/or endogenous matching of board members and firms (reverse causality), we
conduct several additional analyses. First, we examine financial reporting contagion in situations
where the director migrated to the linked test firm after serving on a firm that began to
manipulate earnings. If such a director has a fixed characteristic that promotes earnings
management, then we should observe a stronger apparent contagion effect after the migrating
arrives at the test firm. For example, this would occur if firms that want to manipulate earnings
intentionally recruit such directors. However, we find no evidence that migrating directors
increase earnings management contagion.
Second, if firms that intend to manage earnings choose certain types of directors (lax
directors or directors who know earnings management), we expect to observe stronger earnings
management in firms with newly hired tainted directors. While the migrating director test
requires that the new director be hired at the susceptible firm after gaining earnings management
experience from the infected firm, in this test, we allow for the new director to be hired at the
5

susceptible firm within two years prior to acquiring the earnings management experience from
the infected firm. We also do not find evidence to support the presence of such effect.
Third, we examine whether the timing of when a susceptible firm is board linked to an
earnings manipulator is important for the contagion effect. We perform a “time travel” test that
considers whether the board link to a manipulator exists before or after the time of earnings
management by the manipulator. If a person catches a cold before or after contact with infectious
individual X, we would not attribute the source of infection to X. Similarly, if we find earnings
management in the susceptible firm before or after the manipulation period of the infected firm,
we would not attribute the source to earnings management contagion via a linked board to the
infected firm. Instead, some other common factor shared by the susceptible firm and infected
firm, such as a director fixed effect, resulted in earnings management behaviors in both firms.
We find that a board link to a manipulator at the time when it is managing earnings raises the
likelihood of a susceptible firm to manage earnings whereas a board link at an earlier or later
time does not. Therefore, contagion from board network drives our results and not director or
firm fixed effects.
We would like to emphasize that the focus of our paper on contagion of behaviors, not
just of performance, distinguishes our paper from the past literature. The primary focus in past
studies is on intra-industry transfer of public information (e.g. earnings announcements,
management forecasts, and bank failures).3 Because a public news announcement of a firm
contains both a firm specific component and a common industry component, these studies focus
3Accounting information transfers have been documented for earnings misstatements (Gleason et al. 2008), earnings announcements (Pownall and Waymire 1989; Han and Wild 1990; Freeman and Tse 1992; Ramnath 2002; Thomas and Zhang 2008), bank loan-loss reserve (Docking et al. 1997), management forecasts (Kim, Lacina, and Park 2008) and retailers’ monthly sales reports (Olsen and Dietrich 1985). In addition, studies investigate information transfers for bank failures (Aharony and Swary 1983), bankruptcy filings (Lang and Stulz 1992), dividend initiations (Firth 1996) and nuclear accidents (Bowen et al. 1983).
6

on the investor response of peer firms to the common component of news. For example, Gleason,
Jenkins, and Johnson (2008) find that a restatement announcement of a peer firm in the same
industry triggers a negative spillover effect to non-restating firms.4 A simple analogy to driving
serves to highlight the difference in focus of our study from the past literature. The performance
spillover studies examine whether a car crashing into another causes an interaction in
performance whereas our study examines whether when one driver turns left, other drivers also
turn left as well.
Unlike the studies on information transfer of public announcements, our focus is on
whether private channels of communication via board networks facilitate similar decision
choices. Hence, we focus on contagion during the manipulation period when the earnings
management behaviors are still private. Nevertheless, it remains relevant for us to examine
whether earnings management contagion exists within industry only or also exists across
industries. Board members may be selected for their industry expertise and accounting choices
tend to be more similar within industry, and so reverse causality effects may be more likely to be
present within industry than across industries. Our evidence that there is significant cross-
industry earnings management contagion via board links therefore increases one’s confidence in
the interpretation that there is earnings management contagion through board network.
Past studies find evidence that geographical networks influence accounting and auditing
behaviors (e.g., Kedia and Rajgopal 2008; Defond, Francis and Hu 2009). These papers use
geographic proximity to measure ease of information gathering by firms and monitoring costs
associated with resource constraints on auditors and the SEC staff. In our tests, we also consider
geographical proximity but for a different purpose. Board members may be chosen for reasons of 4 A partial explanation is that firms in the same industry are presumably engaged in similar business transactions, and share common accounting practices so that bad accounting practice in one firm implies similar bad accounting practice in other firms in the industry.
7

geography or for industry expertise as discussed above, and so clustering of board members
within geographical locations and industry may correspond to geographical and industry
clustering of restatements. While geographical proximity facilitates social networking among
board members, for a conservative test for earnings management contagion via board network,
we control for geographical proximity. We find that board networks dominate geographical
networks; our board link variable remains significant while geography-linked variable is not.
This suggests that board networks are more efficacious in propagating financial reporting
behaviors, and previous findings of geographical effects may derive from board interlocks. In
addition, we consider whether earnings management contagion is due to a common lax auditor,
and our results show that there is no evidence that common auditors serve as the conduit for
earnings management contagion.
In sum, our findings contribute to the accounting and social network literature by
demonstrating that earnings management behavior is transmitted from one firm to another
through board interlocks. Unlike studies on spillover effects in returns, we provide evidence of
contagion in behaviors, not just performance, and that board network is the specific conduit for
information transfer. Furthermore, most previous studies on earnings management treat the
earnings management behavior as firm-specific. Granovetter (1985) suggests that economic
choices are generally embedded in social networks such as board interlocks. Our study expands
earnings management research into social network settings. Our paper also contributes to the
corporate governance literature by evaluating whether firm monitoring is influenced by social
networks within interlocked boards. Our findings suggest that to improve financial reporting
quality, regulators also need to pay attention to the board connectivity of companies.
8

The remainder of the paper is organized as follows. Section 2 summarizes related
research in more depth and discusses our predictions on how board links to earnings
manipulators affect earnings quality and the propensity of earnings management. Section 3
discusses the research design and the sample. Section 4 presents our results and Section 5
concludes our paper.
2. Past literature and test predictions
We use restatements to identify previous earnings management because restatements are
clear indicators of GAAP violations (see note 1). Restatements have severe negative capital
market consequences for firms; Palmrose, Richardson, and Scholz (2004) report a market return
of –9.2% over a two-day restatement announcement period. While other earnings management
proxies exist in the literature, their efficacy is widely debated (e.g. see Dechow, Ge, and Schrand
2010 for the debate over discretionary accruals as a measure of earnings management).
Existing studies on earnings management primarily focus on effects on the firm itself and
do not usually examine its effect on other firms. However, behaviors are embedded in social
networks, and executives’ corporate decisions may be influenced by other companies through
social network ties via board interlocks. A growing set of studies provide evidence that firms’
corporate actions are significantly affected by other companies through social networks (see,
e.g., the reviews of Hirshleifer and Teoh, 2003, 2009).
Kedia and Rajgopal’s (2008) study of geographical network effects on restatements finds
that neighboring firms’ misreporting of accounting increases a firm’s tendency to misreport
financial restatements, and that a firm’s distance to the SEC offices is negatively associated with
9
the likelihood of misreporting.5 DeFond et al. (2009) find that the geography of SEC
enforcement is a key factor influencing auditor independence. The premise is that close
proximity to an SEC enforcement office lowers the cost of enforcement and therefore increases
the likelihood of an enforcement action. Specifically, non-Big 4 auditors are less likely to issue
going concern audit opinions when the auditor’s engagement office is located farther from SEC
offices, while Big 4 auditors have the opposite correlation. This result suggests that Big 4
auditors, with reputations to protect, monitor for misreporting more carefully.
Other studies of spillover effects of restatements to non-restating firms include Srinivasan
(2005), Kang (2008), and Gleason et al. (2008). Srinivasan focuses on the managerial labor
market consequence of restatements (see note 2 for details). Both Gleason et al. and Kang study
the spillover effect of a restatement announcement on stock returns, the former on non-restating
firms in the same industry, and the latter on board connected firms. As discussed in the
introduction, our focus is on contagion via private channels during the earlier manipulation
period that precedes the public announcement, and not at the public announcement of the
restatement itself. Moreover, we specifically examine contagion of financial reporting behaviors,
and not on stock return consequence.
Among publicly traded companies, boards of directors supervise and monitor the
operation of the companies, and approve important management decisions. Directors in America
commonly sit on more than one board, and each board meets several times a year—sometimes
frequently, as in the case of Citibank whose board met 16 times in 2002. These interlocking
boards form a social network in which board members can carry knowledge and corporate
5 Kedia and Rajgopal (2009) study geographical network effects on the granting of stock options. They find that stock option granting practices of a firm are largely shaped by neighboring companies’ practices, possibly in response to competitive pressure from a local labor market where individuals within the social network share information about compensation practices.
10

practices (good or bad) from one company to another regardless of location. Directors who serve
on interlocking boards, therefore, are much like carriers of viruses from one firm to another.
Several papers in the finance and strategy literature have tested for potential behavior
contagion via board networks across firms in a wide range of firm activities such as investment,
mergers and acquisitions, option backdating, adoption of antitakeover devices such as poison
pills, going private transactions, exchange listing, and stock option expensing.6 The evidence in
these papers generally identifies higher correlation in behaviors of firms that share common
directors. None of the papers mentioned in note 6 specifically consider contagion of earnings
management behaviors. Furthermore, a distinctive aspect of this paper is that we perform tests to
distinguish the contagion hypothesis from alternative hypotheses based upon independent
common director causation and/or endogeneity of director linkages.
Other studies focus on within-firm networks. Hwang and Kim (2010) focus on the social
ties between CEO and audit committee board members, and find that increased social ties within
the firm facilitate earnings management and higher CEO bonuses. Fracassi and Tate (2009) find
6 Fracassi (2009) finds that a pair of firms with greater social ties between its board and management tends to higher similarities in investment and corporate finance policies. Stuart and Yim (2010) find that private equity offers are more likely if its directors have private equity deal experience at the interlocked firms. Davis (1991) finds that a company is more likely to adopt poison pills if the company is board linked to companies that have adopted poison pills. Haunschild finds that firms that are linked to acquisitive firms tend to become more acquisitive. Rao et al. (2000) find that the NASDAQ firms are more likely to migrate to the NYSE later on when their directors served on the boards of prior migrating companies; this migrating effect was weakened by board links to NASDAQ companies and strengthened by board links to NYSE companies. Bizjak, Lemmon, and Whitby (2009) report that firms with board links to backdating firms are more likely to backdate employee stock options. Reppenhagen (2010) finds that stock option expensing is more likely in firms with links to other stock option expensing firms through board networks, geographical proximity, or industry.
Past studies also show that board networks affect firm performance. Cai and Sevilir (2009) find that greater board connections between acquirers and targets increase acquirer announcement returns and lower takeover premiums. However, Ishii and Xuan (2010) find that alumni ties between acquirers’ board members/executives and target firm board directors/executives lead to poor mergers and acquisition decisions. Cohen, Frazzini, and Malloy (2008) find that strong school ties among mutual fund portfolio managers and among board members of companies lead to improved performance especially during corporate news events, suggesting that these social networks facilitate the communication of information.
11

that firms with greater social ties between the CEO and the own firm’s directors have fewer
voluntary restatements (and more value destroying acquisitions), and have lower valuations.
They infer that social ties within boards reduce effective board monitoring.7 Our paper focuses
on contagion of earnings management behaviors via interlocked directors in board networks
across firms, not within firms.
Within the psychology literature, there is evidence of contagion of unethical behaviors
(Gino, Ayal, and Ariely 2009). Sah (1991) points out that exposure to the dishonesty of others
could lead managers to change their subjective estimate of manipulation costs and benefits. The
social psychology literature also suggests that individuals in groups tend to conform to social
norms even when the social norms are clearly incorrect (Asch 1951). Fich and Shivdasani (2007)
find that firms are more likely to face a financial lawsuit if they have a board member who sits
on the board of another firm that has previously been sued for fraud. The evidence on the higher
frequency of stock option backdating in board interlocked firms mentioned earlier (Bizjak et al.
2009) is also consistent with this effect.
Direct communication of information signals, and observation of actions and preference
interactions through social networks via board interlocks can cause behaviors such as earnings
management to spread from one firm to another. For obvious reasons, earnings management in
firms is unlikely to be publicized widely by the firm and its directors. However, this behavior
may diffuse quietly from one firm to another through individual conversations between directors,
some of whom serve on multiple boards. Whether or not a firm manages its earnings depends on
the subjective perceived cost and benefit of such management. For example, when a company
manipulates its earnings, directors linked to the manipulating firm observe such behavior through 7 Other studies on CEO connectedness with either other firms or with members of its own board on CEO compensation are Engelberg, Gao, and Parson (2009), Horton, Millo, and Serafeim (2009), and Larcker et al. (2007).
12
board interlocks are likely to estimate a lower perceived cost of manipulation and a higher
perceived benefit. This can lead to rational herd behavior or information cascades.
Contagion can operate through directors among firms even if such outside directors have
no direct influence on earnings management decisions, as in a firm with a highly entrenched
manager. Such contagion may occur through communication between outside directors and the
firm’s CFO or top manager. However, the fact that boards have audit committees and
supervisory obligations suggest that earnings management contagion may operate more directly
through the decisions (rather than just conversations) of directors.
Furthermore, board connections to firms that manage earnings can change the directors
and managers’ view of whether managing earnings is a social norm, and therefore can affect the
preferences of directors and executives. The use of earnings management at other firms can be
viewed as a moral justification for its use by others. It can also convey information about what
limits on aggressive accounting is permitted by auditors.
Overall, based on this discussion, we hypothesize that the likelihood of earnings
management for a firm is greater when it has a director who has served on the board of another
firm that previously managed earnings. We next discuss the research design to test this
hypothesis. It is important in tests of contagion to address the issue of independent common
causation (a shared director is the cause of the behavior in both firms, without any contagion
across firms) or endogeneity (firms have a propensity to manage earnings tend to hire the same
directors). One of the distinctive features of our paper is that it performs tests to address the
possibilities of common causation and endogeneity.
3. Research design and data
13
To test whether there is contagion in accounting reporting choices between board-linked
firms, we start with a sample of restatements. Restating firms have clearly violated Generally
Accepted Accounting Principles (GAAP) in the period leading up to the restatement date. We
consider the directors of such firms as infectious agents for earnings management. The general
approach for the tests is to examine whether firms that are linked via common directors with
infectious firms are more likely to manage earnings.
3.1 Sample Selection
We select the initial sample of restatement firms from the first release of the General
Accounting/Government Accountability Office (GAO) report on Oct 4, 2002 that identify
whether a firm restated its financial reports from January 1, 1997 to June 30, 2002. The GAO
sample is widely used by recent studies on earnings management (e.g., Badertscher et al. 2009).
For restatement firms identified in 2002, the manipulation started in 2001 or earlier. So the time
period for earnings management in our sample covers 1997 through 2001.
The GAO also released a second report on restatements covering the period July 1st 2002
to June 30th 2006. We do not use the second GAO release for two reasons. First, the time period
overlaps with the passage and implementation of Sarbanes-Oxley Act (hereafter SOX) of 2002,
and there are significant changes to firms’ financial reporting in the post-SOX era. Second, there
is inconsistency in how restatements are identified between the two GAO releases. Prior studies
suggest that restatements in the second GAO release pertain more to technical issues rather than
intentional accounting irregularities (Hennes et al. 2008; Burks 2011), and therefore are less
suitable candidates as intentional earnings manipulators that is our focus in this paper.
For each restatement firm in the sample, we identify the period when the earnings
violated GAAP to determine the members of its board of directors during this manipulation
14
period. We trace the links of these board members to other firms to identify the board network
using information about directors from Risk Metrics, formerly the Investor Responsibility
Research Center (IRRC) database. The sample size is therefore further limited by the coverage of
Risk Metrics, which is limited to the S&P 1500 firms and about 400 other widely held firms in
our sample period.
In the rest of this section, we describe how the test variables are calculated and the test
method for earnings management contagion. The summary of the definition and calculation of
all variables are in the Appendix.
3.2 Contagion in the earnings manipulation period preceding restatements
We hand collected data from news articles or press releases to identify the manipulation
period for each restatement observation. We gather news articles or press releases from
LexisNexis within two days of the GAO restatement announcement date. We read each article to
identify the start date of the fiscal period for which earnings had to be restated. If this
information is not available, we search the SEC EDGAR system for related Form 10K or 10Q of
restating companies subsequent to restatement announcement dates, and read these documents to
determine the manipulation period. We then identify board links during the manipulation period
for each restatement observation by checking for common director names between infected and
susceptible firms using Risk Metrics.
The relevant dependent variable measures the likelihood that a susceptible firm also
manages earnings, or in other words there is contagion of earnings management. The indicator
variable EM equals 1 for a susceptible firm in year t if year t is the first year for which its
earnings were corrected in an eventual restatement, and is zero otherwise. In other words, a
susceptible firm becomes infected at the time it begins to manipulate its earnings in year t. When
15

a susceptible firm becomes infected in a given year, we do not test for infection again in
subsequent years to avoid multiple counting of the same infection. Some firms restate earnings
for more than one year.
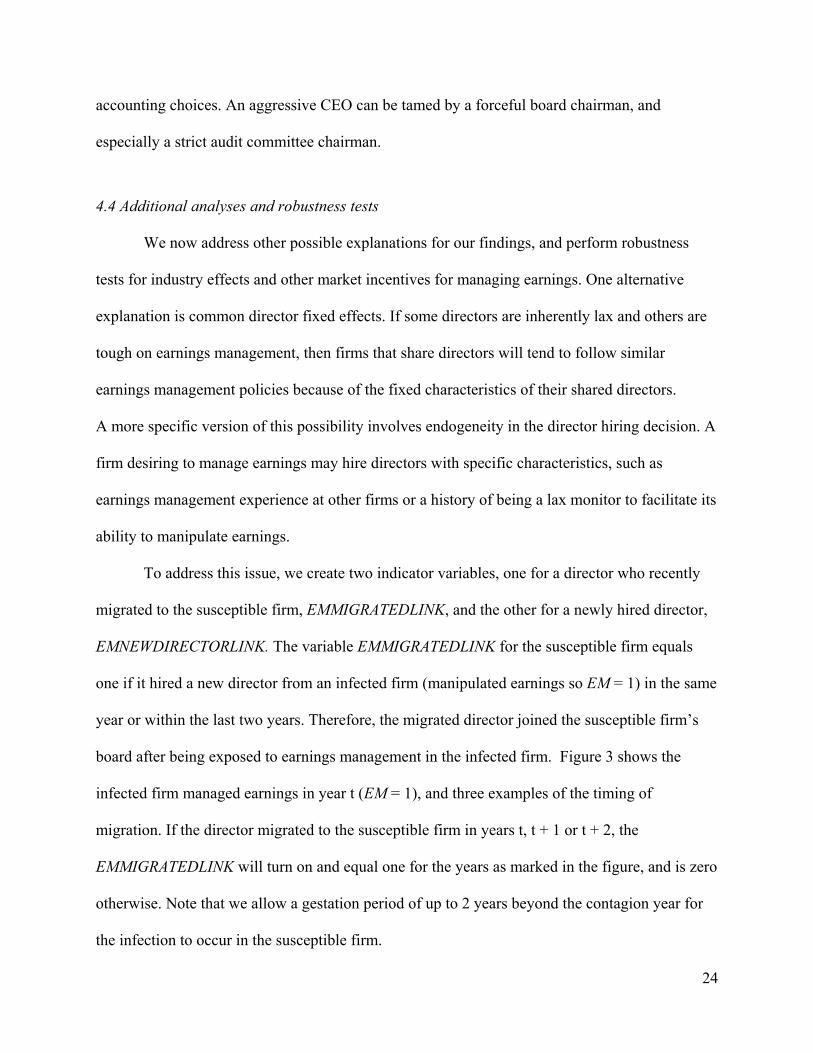
The main independent variable is the indicator EMLINK which equals 1 if the susceptible
firm has a board link to an infected firm either in the current year or in the past two years; see
Figure 2. We allow for a two year incubation period for the infection to occur. In other words,
we allow for the possibility that a susceptible firm learns about earnings management from the
infected firm for two years before it begins manipulating its earnings. We also consider a
measure for the strength of infection using the discrete variable #EMLINK, which measures the
number of such links to distinct firms.
The variable #BOARDLINK is the number of links the firm’s board has to other boards in
general, regardless of whether the linked firms manage earnings that required subsequent
restatement. This measure captures contagion effects via board networks in general. When
included in a regression with #EMLINK, the #BOARDLINK variable captures contagion of
relatively good accounting; i.e., it incrementally captures the effect of the number of links to
firms that are not involved with restatements. This allows us to test for contagion of both positive
and negative financial reporting behaviors.
To test for contagion of earnings management in the initial manipulation period, we run
the following cross-sectional pooled logistic regressions:8
Logit (EM) = F(β0 + β1EMLINK + β2#BOARDLINK + ∑βjControlsj + Year Fixed Effects +
Industry Fixed Effects + ε) …………………………………………….……………….…….(1)
8 We also use the probit models to run all the regressions in the paper and obtain similar results.
16

Logit (EM) = F(β0 + β1#EMLINK + β2#BOARDLINK + ∑βjControlsj + Year Fixed Effects +
Industry Fixed Effects + ε) ..………………………………….………………………………(2)
Furthermore, we also consider whether the presence of a larger number of board links
may dilute the potential contagion effect from the board link to an infected firm. To examine
this, we include an additional interaction variable between #EMLINK and #BOARDLINK as
follows:
Logit (EM) = F(β0 + β1#EMLINK + β2#BOARDLINK + β3#EMLINK×#BOARDLINK +
∑βjControlsj + Year Fixed Effects + Industry Fixed Effects + ε) ..………………………..…(3)
The key coefficients of interest are those for EMLINK and #EMLINK. A positive sign for
these coefficients indicates that a board link to an infected firm during the earnings management
period (i.e. an earnings manipulator that subsequently restated earnings) increases the likelihood
that a susceptible firm becomes infected, i.e., that it also manages earnings to an extent that
required later restatement. The estimated coefficient on the variable #BOARDLINK indicates
whether there is contagion of good financial reporting behaviors. A significant negative
coefficient would suggest that a firm whose board of directors is linked to non-restating firms is
less likely to manipulate its earnings. The interaction variable #EMLINK×#BOARDLINK tests
for whether the number of other non-manipulator board links dilutes the earnings management
contagion from the manipulator-board link.
We further test whether the board position of the linked director matters for the strength
of the contagion. A director’s influence over the financial reporting practices of the firm varies
with the position of the member on the board. The CEO, the board chair, and members of the
audit committee are likely to wield greater influence than other directors on financial reporting
17

issues. We therefore include the additional indicator variables EMCEOLINK,
EMBOARDCHAIRLINK, EMAUDITCHAIRLINK, and EMAUDITCOMLINK to represent links
to manipulating firms by the test firm’s interlocked board member position as the CEO, board
chair, audit committee chair, or audit committee member respectively.
In addition to the earnings management link variable EMLINK, we include one of the
above board member position link variables. For example, we sequentially run the regression:
Logit (EM) = F(β0 + β1 EMLINK + β2EMCEOLINK + β3#BOARDLINK + ∑βjControlsj + Year
Fixed Effects + Industry Fixed Effects + ε) ………………….………………………………(4)
In successive regressions we substitute EMBOARDCHAIRLINK, EMAUDITCHAIRLINK, or
EMAUDITCOMLINK for the EMCEOLINK above. The coefficients on the board position link
variables measure the incremental strength of earnings management contagion as a result of
board position in the susceptible firm of the shared director relative to the average board member
position. We also run a horse race amongst all the board positions by including the various board
position variables in one regression.
3.3 Control variables
The regressions require appropriate controls for other known determinants for
restatement or earnings management. We discuss next the set of control variables associated with
earnings management and restatements from the literature (e.g., Lee et al. 2006; Lennox and
Pittman 2010). Details for all variables used in the paper are summarized in the Appendix. All
the accounting and stock return data are from COMPUSTAT and CRSP respectively. All other
databases used are noted where the relevant variables are discussed below.
18

We control for firm performance with return on total assets (ROA), and a loss indicator
variable, Loss. Size is estimated as the natural logarithm of total assets. Since we use
restatements to identify earnings management, we control for size effects on restatements. Large
firms are more visible and therefore politically more vulnerable to regulators wishing to send a
message of intolerance for earnings manipulation to the capital markets. Growth effects are
controlled using Market to Book, the firm’s equity market-to-book ratio. High growth firms may
be tempted to manage earnings to sustain the perception of high growth when actual growth has
slowed. High growth firms may also be less understood by investors and so may more be able to
get away with earnings manipulation.
Off balance sheet activities can be used to reduce reported liability and inflate earnings
(e.g., Dechow, Ge, Larson and Sloan 2010; Ge 2006). Therefore, we follow Ge (2006) and
construct Operating Lease, which is equal to 1, if the company’s future operating lease
obligations are greater than zero. There is less information asymmetry and information
uncertainty for old firms, and, therefore, it is plausible that old firms are unlikely to manage
earnings. We thus add Firm Age to the regression. In addition, we include a non-financial
indicator of earnings management, Abnormal Employee, in the regressions to complement the
limitation of financial measures for the earnings management tendency (Brazel, Jones and
Zimbelman 2009).
Firms facing higher operating risks have greater incentives to manage earnings. So, we
further control for operating risks using Ret Volatility, measured as the standard deviation of the
stock returns in the fiscal year. The variable Leverage is measured as the ratio total liabilities to
total assets and controls for higher risk of firm failure and higher incentive to manage earnings to
avoid debt-related constraints imposed on management.
19

To control for other governance-related variables that may separately affect earnings
management, we include a corporate governance score using G-index from Gompers, Ishii and
Metrick (2003), and the fraction of institutional holdings, Inst Holdings. To isolate the effect of
contagion from board links as conservatively as possible, we also control for other board
characteristics that prior literature has suggested as a proxy for the strength of monitoring by the
board. These include CEO Duality which is equal to one, if the CEO is also the chairman of the
board, and 0 otherwise, the size of the corporate board, Board Size, and the percentage of
independent board member Pct Ind Directors. We also use the Risk Metrics and Thomson
Financial databases to construct an anti-takeover variable and an institutional holding variable,
both of which are likely to be related to board governance.
4. Empirical results
4.1 Summary statistics and correlations
Table 1 Panel A reports how the earnings management contagion sample is selected. The
sample consists of 118 earnings management observations that eventually restated earnings.9
Combining with all non-restating firms in Risk Metrics for the 1997 to 2001 period gives the
total sample size of 8,161 firm-year observations and 2,406 distinct firms. The number of
observations in each regression varies with data availability for the included variables
Panel B, Table 1 reports the summary characteristics separately for the sample identified
to manage earnings from later restatements (EM group) versus the sample of firm-year
observations that did not manage earnings (Control group). These two groups are similar along
9 The small sample size is common to studies related to accounting fraud. For example, Kang (2008) uses 30 observations of SEC investigations to study spillover reputation effects on stock returns, Erickson et al. (2006) use 50 fraud events to explore the relation between executive equity incentive and accounting fraud and Lee et al. (2006) use 91 restatement cases to investigate the relation between earnings management and performance and growth.
20
several dimensions, but there are exceptions. EM firms have significantly higher EMLINK than
the control sample. 28.8% of EM firms versus 18.7% of control firms have a board link to a firm
that later restated earnings. This initial univariate test suggests that earnings manipulators have
greater exposure via board links to firms that later restated earnings. The number of interlocked
boards, #BOARDLINK, however, is not significantly different between the two groups,
suggesting that any differences in earnings management behavior are not coming from different
levels of connectedness to other firms. EM firms have more volatile stock returns, worse
performance and use more off balance sheet activities than the control sample firms consistent
with these firms facing greater incentives and opportunities to manage earnings.
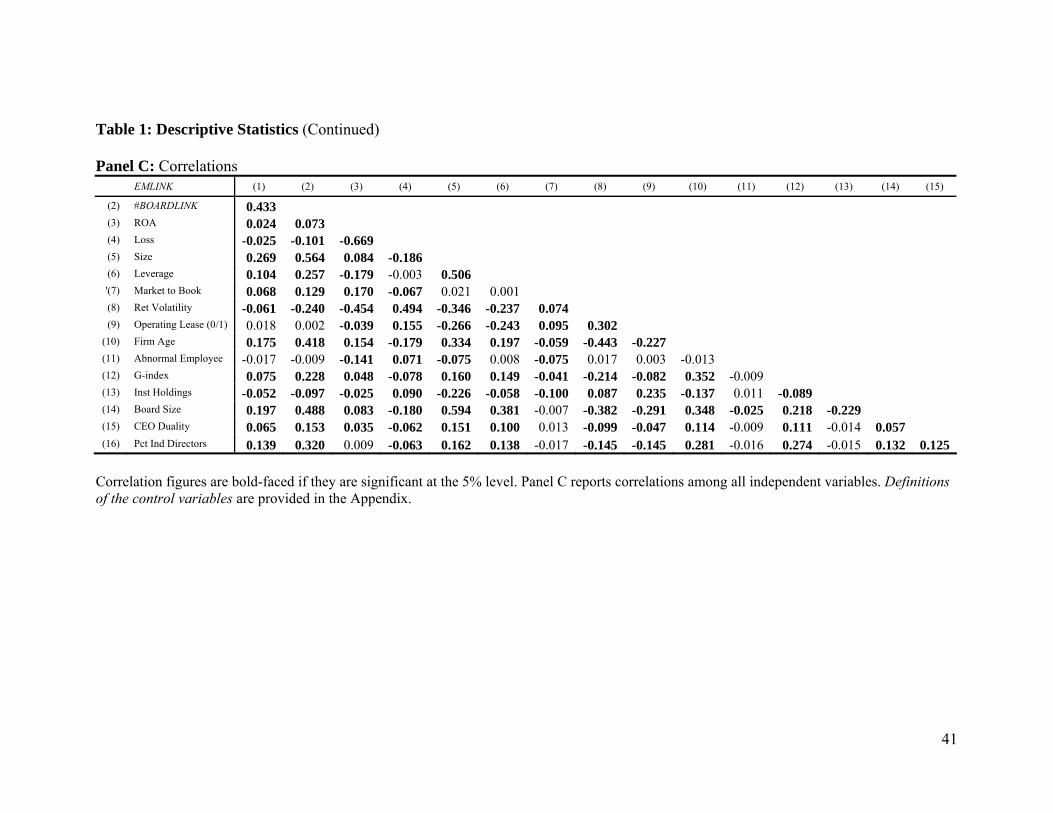
Panel C reports the correlations among independent variables for our main tests. The high
correlation between EMLINK and #BOARDLINK (0.4) suggests that opportunities for earnings
management contagion increases with greater board exposure to other companies.
4.2 Contagion during the earnings manipulation period preceding restatements
The results in Table 2 show that there is a significant positive association between the
likelihood that a firm manipulates earnings and the firm having a director who serves on the
board of another firm that is an earnings manipulator. In all the model specifications, the
coefficient estimate on EMLINK is positive and significant at the 5% level. The results are robust
to the use of the continuous measure #EMLINK that measures the strength of these manipulator
board links.
We calculate the economic significance of the board link variables in two ways using the
multiple logistic regression in Column (4) of Table 2.
P1 = Probability (EM = 1| EMLINK = 1, other controls) = 2.04%
P2 = Probability (EM = 1| EMLINK = 0, other controls) = 1.02%
21
This implies a marginal effect of EMLINK = 1 of 1.02%. The baseline unconditional probability
of earnings management is 1.75% (93 observations where EM = 1 divided by 5192 total number
of firm year observations). Therefore a board link to manipulators (EMLINK = 1) has a marginal
affect that is 1.02/1.75 = 58% as large as the unconditional probability of managing earnings.
Alternatively, the odds ratio [P1/(1 – P1)] / [P2/(1 – P2)] is 2.02, which suggests that a board link
to a manipulator doubles the firm’s likelihood of becoming an earnings manipulator.
Column (5) uses the continuous measure #EMLINK to capture the effect of linkage
intensity on earnings management contagion. The coefficient estimate of 0.374 is significantly
positive (p value = 0.024), with a marginal effect of 0.44%.
Interestingly, the variable #BOARDLINK is significantly negative –0.044 and –0.045 (p
values < 10%) in Columns 4 and 5 respectively, implying that a firm with directors linked to
non-manipulators is less likely to manage earnings. This is evidence that good financial reporting
behaviors are also contagious. In our sample, the average number of board links to other firms is
5, and so the average marginal effect of 0.26% is about 60% of the marginal effect for
#EMLINK. Finally, we also interact #BOARDLINK with EMLINK and find that the interaction
variable has a significant negative coefficient (–0.051, p-value = 0.014) in Column 6 of Table 2.
This indicates that a higher number of other board links to relatively good financial reporting
firms distracts the firm from listening to the information transmitted from a manipulator firm,
and so earnings management contagion is weaker in a larger board network.
4.3 The effect of director position on contagion of earnings management
Table 3 explores whether influential tainted directors, by virtue of their board positions,
have a disproportionate effect on the spread of earnings management across the director network.
22

Among the four types of positions investigated in Table 3, we find that links in which the tainted
board director is either the board chair audit committee chair or audit committee member
significantly raises the likelihood that the firm manages earnings relative to other board
positions.10 The CEO position, however, does not have a significant incremental influence on
earnings management contagion.
Relative to an average director, an audit committee member has a significant incremental
influence, followed by an even larger influence for the board chairman, and the largest influence
is reserved for the audit committee chairman. Compared to the marginal effect of EMLINK, the
marginal effect of EMAUDITCOMLINK is 1.5 times larger, of EMBOARDCHAIRLINK is 3
times larger, and of EMAUDITCHAIRLINK is largest by 4.5 times. In a direct horse race with all
board positions CEO, board chair, audit chair, and audit committee, and all other included in one
regression with controls in the last column of Table 3, the audit chair and audit committee
member positions dominate other board positions in relative importance for earnings
management contagion. Since the audit committee has a supervisory role specifically over
financial reporting, these results are intuitive and consistent with the role of monitoring by the
board.
These results suggest that board governance does matter for the quality of financial
statements. The famous Milgram (1963) experiment indicated that an authority figure can
induce unethical behavior in groups. Even though management is responsible for the financial
reporting choices, the board of directors plays an important role in what is finally reported in the
financial statements. In their role as monitors, they can acquiesce to or limit aggressive
10 Information on audit-committee membership is not available until 1998 from Risk Metrics, so our sample period is from 1998 to 2001 for Column (3), (4) and (5) in Table 4.
23
accounting choices. An aggressive CEO can be tamed by a forceful board chairman, and
especially a strict audit committee chairman.
4.4 Additional analyses and robustness tests
We now address other possible explanations for our findings, and perform robustness
tests for industry effects and other market incentives for managing earnings. One alternative
explanation is common director fixed effects. If some directors are inherently lax and others are
tough on earnings management, then firms that share directors will tend to follow similar
earnings management policies because of the fixed characteristics of their shared directors.
A more specific version of this possibility involves endogeneity in the director hiring decision. A
firm desiring to manage earnings may hire directors with specific characteristics, such as
earnings management experience at other firms or a history of being a lax monitor to facilitate its
ability to manipulate earnings.
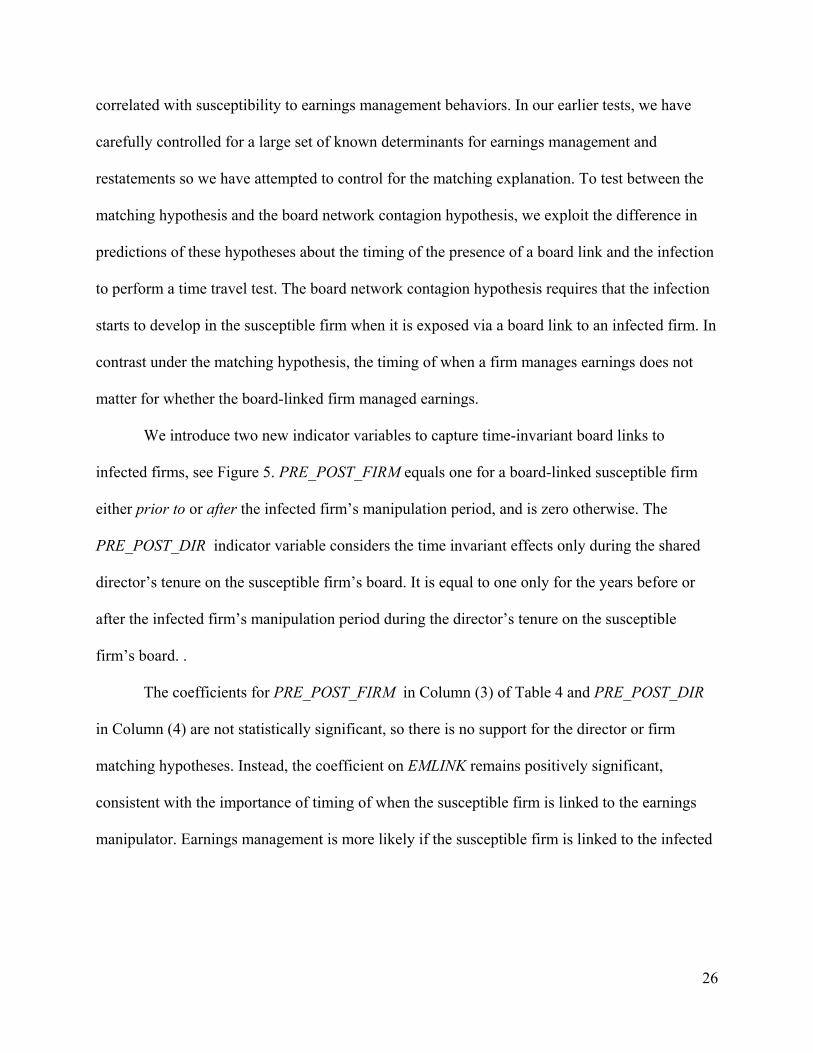
To address this issue, we create two indicator variables, one for a director who recently
migrated to the susceptible firm, EMMIGRATEDLINK, and the other for a newly hired director,
EMNEWDIRECTORLINK. The variable EMMIGRATEDLINK for the susceptible firm equals
one if it hired a new director from an infected firm (manipulated earnings so EM = 1) in the same
year or within the last two years. Therefore, the migrated director joined the susceptible firm’s
board after being exposed to earnings management in the infected firm. Figure 3 shows the
infected firm managed earnings in year t (EM = 1), and three examples of the timing of
migration. If the director migrated to the susceptible firm in years t, t + 1 or t + 2, the
EMMIGRATEDLINK will turn on and equal one for the years as marked in the figure, and is zero
otherwise. Note that we allow a gestation period of up to 2 years beyond the contagion year for
the infection to occur in the susceptible firm.
24

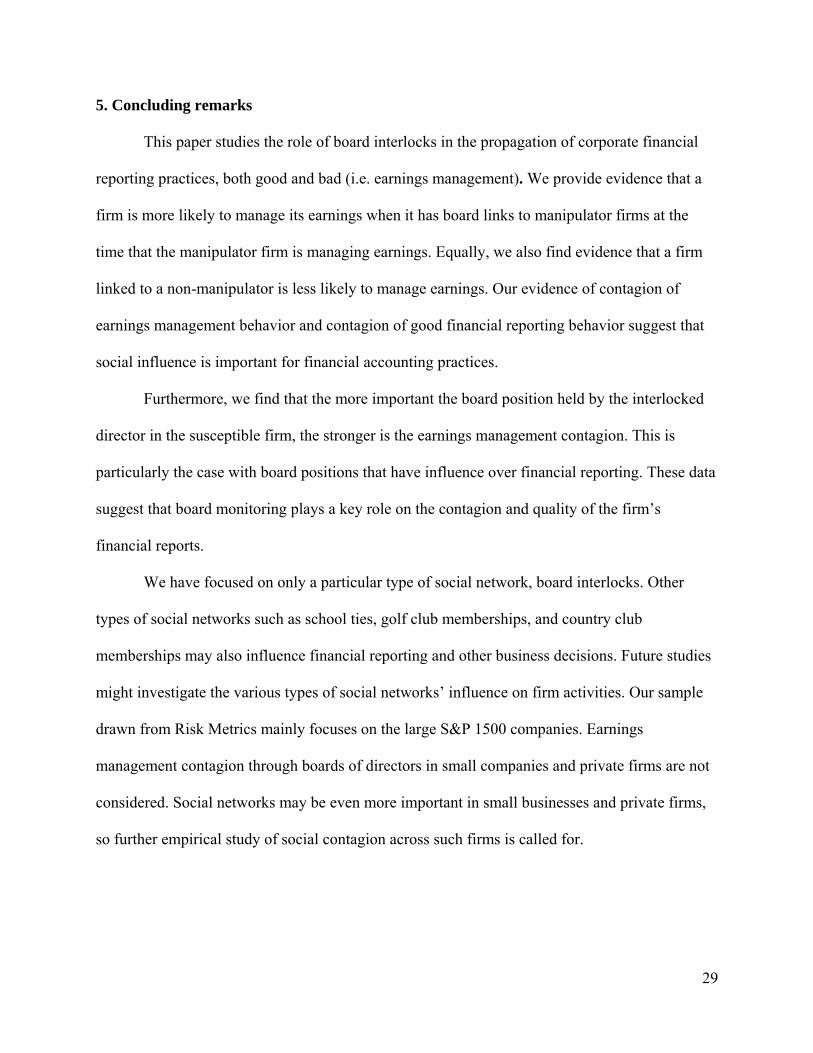
EMNEWDIRECTORLINK is similar in spirit to the migrated director variable but allows
for the newly hired director to join the susceptible firm with two years before exposure to
earnings management from the infected firm. As the first example of Figure 4 shows, the new
director joined the susceptible firm many years ago, so EMLINK equals 1 for years t, t + 1, and t
+ 2, and EMNEWDIRECTORLINK is zero at all times. In the second and third example, the
new director joined the susceptible firm in years t – 1 or t – 2 before the infected firm managed
earnings in year t, so EMNEWDIRECTORLINK equals 1 for years t, t + 1, and t + 2 , and is zero
otherwise.
When there is common director causation, a firm with a migrated director link or a newly
hired tainted director link has a higher likelihood of managing earnings. The result for
EMMIGRATEDLINK is in Column (1) and for EMNEWDIRECTORLINK is in Column (2) of
Table 4. Neither of these two variables’ coefficients is statistically significant, whereas EMLINK
remains statistically significant in both regressions. Thus, the evidence provides no support for
this type of common director causation.
We also perform a further more restrictive test for common firm or common director
causation. We consider the alternative possibility that the assignment of directors to firms is non-
random and is the result of firm or director matching. In this matching explanation, the positive
effect of EMLINK indicates only similarities in the propensity to manage earnings between two
firms that share a common director, and not from an information contagion about the earnings
management technology or about norms for discretionary accounting reporting behaviors. In
other words, “birds of a feather flock together.”
The matching explanation is essentially an omitted variables problem, in which a
potentially omitted factor is anything that determines both director matching to firms and is
25
correlated with susceptibility to earnings management behaviors. In our earlier tests, we have
carefully controlled for a large set of known determinants for earnings management and
restatements so we have attempted to control for the matching explanation. To test between the
matching hypothesis and the board network contagion hypothesis, we exploit the difference in
predictions of these hypotheses about the timing of the presence of a board link and the infection
to perform a time travel test. The board network contagion hypothesis requires that the infection
starts to develop in the susceptible firm when it is exposed via a board link to an infected firm. In
contrast under the matching hypothesis, the timing of when a firm manages earnings does not
matter for whether the board-linked firm managed earnings.
We introduce two new indicator variables to capture time-invariant board links to
infected firms, see Figure 5. PRE_POST_FIRM equals one for a board-linked susceptible firm
either prior to or after the infected firm’s manipulation period, and is zero otherwise. The
PRE_POST_DIR indicator variable considers the time invariant effects only during the shared
director’s tenure on the susceptible firm’s board. It is equal to one only for the years before or
after the infected firm’s manipulation period during the director’s tenure on the susceptible
firm’s board. .
The coefficients for PRE_POST_FIRM in Column (3) of Table 4 and PRE_POST_DIR
in Column (4) are not statistically significant, so there is no support for the director or firm
matching hypotheses. Instead, the coefficient on EMLINK remains positively significant,
consistent with the importance of timing of when the susceptible firm is linked to the earnings
manipulator. Earnings management is more likely if the susceptible firm is linked to the infected
26

firm at the time when the infected firm is managing earnings, and not before or after the
manipulation period.11
We also consider whether earnings management contagion may have occurred because
of a common lax auditor. We include an COMMONAUDITOR variable, which is the number of
EM firms that share a common auditor with the susceptible firm in the past two years and the
current year (t - 2, t - 1, and t) scaled by the number of distinct clients of that common auditor.
As in Reppenhagen (2010), this variable is not significant, so there is no evidence that auditors
serve as the conduit for earnings management contagion.12
Previous studies show that earnings management is correlated geographically (e.g., Kedia
and Rajgopal 2008). Table 5 Column (2) explores whether our findings can be explained by the
earnings management correlation derived from geographical proximity by constructing a variable
GEOPROXIMITY. This variable is calculated as the sum of the reciprocal of the distance
between test firm i and all EM = 1 firms in the same year and prior two years (i.e. ∑ 1/(1 +
distance(i, k) where k is an EM = 1 firm). The results suggest that tainted board links have a
robust effect on the earnings management of linked susceptible firms after additionally
controlling for geographical proximity. Interestingly, GEOPROXIMITY is no longer significant,
though in unreported tests the variable is significant when EMLINK is excluded. This suggests
that the earnings management contagion through board interlocks may help explain the
previously documented earnings management contagion through geographical proximity.
11 Additional unreported test show that EMLINK coefficient is larger than PRE_POST_FIRM and PRE_POST_DIR coefficient at 10% significance level (two-tailed test). 12 We do not have the data to use a more refined measure that takes into account whether the susceptible firm and infected firm share a common local office for the auditor. However, the separate geographical proximity and the auditor link variables are likely to closely approximate such a variable. The geographical proximity and common auditor variables are not significant in our tests.
27

Finally, firms in the same industry tend to have similar accounting practices and face
common business conditions. To test whether the contagion effect we document is the result of
these common factors, the EMLINK indicator variable is restricted to equal one only when the
board link is to an infected firm from a different industry using the Fama-French 48 industry
classification. Table 5 Column (3) shows that the results are not driven solely by same-industry
contagion by including only EMLINK from board networks from different industries in the
regression.
Previous studies have documented circumstances in which earnings management
incentives are especially strong. We test whether earnings management contagion is incremental
to these factors in Table 6. We control for mergers and acquisitions with M&A indicator variable
in Column (1) (Erickson and Wang 1999, Louis 2004), issuances of new equities or debts with
ISSUE indicator variable (e.g., Teoh, Welch and Wong 1998a, 1998b) in Column (2), and the
likelihood of accounting frauds using FSCORE (Dechow et al. 2010) in Column (3), and all three
variables are included jointly in Column (4).
The results in Table 6 show that EMLINK and #BOARDLINK are robust to the inclusion
of these further determinants of earnings management, implying that board networks
incrementally affect both positive and negative accounting reporting behaviors. All three of the
earnings management incentive variables are individually statistically significant, with the fraud
score variable dominating the other two when considered jointly. Furthermore, the interaction
variable with the EMLINK variable (not reported) is statistically significantly positive for two of
the special settings, M&A and fraud, but not for new issues. These results suggest that the board
link to an earnings manipulator enhances earnings management incentives especially for M&A
activities and in situations where financial reporting malfeasance is high.
28
5. Concluding remarks
This paper studies the role of board interlocks in the propagation of corporate financial
reporting practices, both good and bad (i.e. earnings management). We provide evidence that a
firm is more likely to manage its earnings when it has board links to manipulator firms at the
time that the manipulator firm is managing earnings. Equally, we also find evidence that a firm
linked to a non-manipulator is less likely to manage earnings. Our evidence of contagion of
earnings management behavior and contagion of good financial reporting behavior suggest that
social influence is important for financial accounting practices.
Furthermore, we find that the more important the board position held by the interlocked
director in the susceptible firm, the stronger is the earnings management contagion. This is
particularly the case with board positions that have influence over financial reporting. These data
suggest that board monitoring plays a key role on the contagion and quality of the firm’s
financial reports.
We have focused on only a particular type of social network, board interlocks. Other
types of social networks such as school ties, golf club memberships, and country club
memberships may also influence financial reporting and other business decisions. Future studies
might investigate the various types of social networks’ influence on firm activities. Our sample
drawn from Risk Metrics mainly focuses on the large S&P 1500 companies. Earnings
management contagion through boards of directors in small companies and private firms are not
considered. Social networks may be even more important in small businesses and private firms,
so further empirical study of social contagion across such firms is called for.
29
References
Aharony, J., and I. Swary. 1983. Contagion Effects of Bank Failures - Evidence from Capital
Markets. Journal of Business 56 (3):305-322.
Asch, S. 1951. Effects of Group Pressure upon the Modification and Distortion of Judgment. In
Groups, Leadership, and Men, edited by H. Guetzkow. Pittsburgh: Carnegie Press.
Badertscher, B. A., J. D. Phillips, M. Pincus, and S. O. Rego. 2009. Earnings Management
Strategies and the Trade-Off between Tax Benefits and Detection Risk: To Conform or
Not to Conform? The Accounting Review 84 (1):63-97.
Banerjee, A. V. 1992. A Simple-Model of Herd Behavior. Quarterly Journal of Economics 107
(3):797-817.
Bowen, R. M., R. P. Castanias, and L. A. Daley. 1983. Intra-Industry Effects of the Accident at
Three-Mile-Island. Journal of Financial and Quantitative Analysis 18 (1):87-111.
Bikhchandani, S., D. Hirshleifer, and I. Welch. 1992. A Theory of Fads, Fashion, Custom, and
Cultural-change as Informational Cascades. Journal of Political Economy 100 (5):992-
1026.
Bizjak, J., M. Lemmon, and R. Whitby. 2009. Option Backdating and Board Interlocks. Review
of Financial Studies 22 (11):4821-4847.
Brazel, J. F., K. L. Jones, and M. F. Zimbelman. 2009. Using Nonfinancial Measures to Assess
Fraud Risk. Journal of Accounting Research 47 (5):1135-1166.
Burks , J.J. 2011. Are Investors Confused by Restatements after Sarbanes-Oxley? The
Accounting Review, (forthcoming).
Cai, Y., and M. Sevilir. 2009. Board Connections and M&A Transactions: University of North
Carolina.
30

Cohen, L., A. Frazzini, and C. Malloy. 2008. The Small World of Investing: Board Connections
and Mutual Fund Returns. Journal of Political Economy 116 (5):951-979.
Davis, G. F. 1991. Agents without Principles? The Spread of the Poison Pill through the
Intercorporate Network. Administrative Science Quarterly 36 (4):583.
Dechow, P., W. Ge, and C. Schrand. 2010. Understanding Earnings Quality: A Review of the
Proxies, their Determinants and their Consequences. Journal of Accounting and
Economics, (Forthcoming).
Dechow, P. M., W. Ge, C. R. Larson, and R. G. Sloan. 2010. Predicting Material Accounting
Misstatements. Contemporary Accounting Research, (Forthcoming).
Defond, M., J. R. Francis, and X. Hu. 2009. The Geography of Auditor Independence and SEC
Enforcement: AAA.
Docking, D. S., M. Hirschey, and E. Jones. 1997. Information and Contagion Effects of Bank
Loan-loss Reserve Announcements. Journal of Financial Economics 43 (2):219-239.
Durnev, A., and C. Mangen. 2009. Corporate Investments: Learning from Restatements. Journal
of Accounting Research 47 (3):679-720.
Engelberg, J., P. Gao, and C. A. Parsons. 2009. The Value of a Rolodex: CEO Pay and Personal
Networks. SSRN eLibrary.
Erickson, M., M. Hanlon, and E. L. Maydew. 2006. Is There a Link between Executive Equity
Incentives and Accounting Fraud? Journal of Accounting Research 44 (1):113-143.
Erickson, M., and S. W. Wang. 1999. Earnings Management by Acquiring Firms in Stock for
Stock Mergers. Journal of Accounting and Economics 27 (2):149-176.
Fich, E. M., and A. Shivdasani. 2007. Financial Fraud, Director Reputation, and Shareholder
Wealth. Journal of Financial Economics 86 (2):306-336.
31
Firth, M. 1996. Dividend Changes, Abnormal Returns, and Intra-industry Firm Valuations.
Journal of Financial and Quantitative Analysis 31 (2):189-211.
Fracassi, C. 2009. Corporate Finance Policies and Social Networks. SSRN eLibrary.
Fracassi, C., and G. A. Tate. 2009. External Networking and Internal Firm Governance. SSRN
eLibrary.
Freeman, R., and S. Tse. 1992. An Earnings Prediction-Approach to Examining Inter-Company
Information Transfers. Journal of Accounting and Economics 15 (4):509-523.
Ge, W. 2006. Off-Balance-Sheet Activities, Earnings Persistence and Stock Prices: Evidence
from Operating Leases. SSRN eLibrary.
Gino, F., S. Ayal, and D. Ariely. 2009. Contagion and Differentiation in Unethical Behavior: The
Effect of One Bad Apple on the Barrel. Psychological Science 20 (3):393-398.
Gleason, C. A., N. T. Jenkins, and W. B. Johnson. 2008. The Contagion Effects of Accounting
Restatements. The Accounting Review 83 (1):83-110.
Gompers, P., J. Ishii, and A. Metrick. 2003. Corporate Governance and Equity Prices. Quarterly
Journal of Economics 118 (1):107-155.
Granovetter, M. 1985. Economic-Action and Social-Structure - the Problem of Embeddedness.
American Journal of Sociology 91 (3):481-510.
Han, J. C. Y., and J. J. Wild. 1990. Unexpected Earnings and Intra-Industry Information
Transfers - Further Evidence. Journal of Accounting Research 28 (1):211-219.
Haunschild, P. R. 1993. Interorganizational Imitation - The Impact of Interlocks on Corporate
Acquisition Activity. Administrative Science Quarterly 38 (4):564-592.
Hirshleifer, D., and S. H. Teoh. 2003. Herd Behaviour and Cascading in Capital Markets: a
Review and Synthesis. European Financial Management 9 (1):25-66.
32

Hirshleifer, D., and S. H. Teoh. 2009. Contagion in Capital Markets. In Handbook of Financial
Markets: Dynamics and Evolution, edited by W. Ziemba: Elsevier/North-Holland.
Horton, J., Y. Millo, and G. Serafeim. 2009. Paid for Connections? Social Networks, Executive
and Outside Director Compensation. SSRN eLibrary.
Hribar, P., and N. T. Jenkins. 2004. The Effect of Accounting Restatements on Earnings
Revisions and the Estimated Cost of Capital. Review of Accounting Studies 9 (2-3):337-
356.
Hwang, B.-H., and S. Kim. 2010. Earnings Management and Social Ties. SSRN eLibrary.
Ishii, J. L., and Y. Xuan. 2010. Acquirer-Target Social Ties and Merger Outcomes. In SSRN
eLibrary.
Kang, E. 2008. Director Interlocks and Spillover Effects of Reputational Penalties from
Financial Reporting Fraud. Academy of Management Journal 51 (3):537-555.
Kedia, K., and S. Rajgopal. 2008. Geography and the Incidence of Financial Misreporting:
University of Washington
Kedia, S., and S. Rajgopal. 2009. Neighborhood Matters: The Impact of Location on Broad
Based Stock Option Plans. Journal of Financial Economics 92 (1):109-127.
Kim, Y., M. Lacina, and M. S. Park. 2008. Positive and Negative Information Transfers from
Management Forecasts. Journal of Accounting Research 46 (4):885-908.
Lang, L. H. P., and R. M. Stulz. 1992. Contagion and Competitive Intra-industry Effects of
Bankruptcy Announcements - An Empirical Analysis. Journal of Financial Economics
32 (1):45-60.
Larcker, D. F., S. A. Richardson, A. Seary, and A. I. Tuna. 2007. Back Door Links Between
Directors and Executive Compensation. SSRN eLibrary.
33
Lee, C. W. J., L. Y. Li, and H. Yue. 2006. Performance, Growth and Earnings Management.
Review of Accounting Studies 11 (2-3):305-334.
Lennox, C., and J. A. Pittman. 2010. Big Five Audits and Accounting Fraud. Contemporary
Accounting Research 27 (1):209-247.
Louis, H. 2004. Earnings Management and the Market Performance of Acquiring Firms. Journal
of Financial Economics 74 (1):121-148.
McNichols, M. F., and S. R. Stubben. 2008. Does Earnings Management Affect Firms'
Investment Decisions? The Accounting Review 83 (6):1571-1603.
Milgram, S. 1963. Behavioral Study of Obedience. The Journal of Abnormal and Social
Psychology 67 (4):371-378.
Olsen, C., and J. R. Dietrich. 1985. Vertical Information Transfers - the Association between
Retailers Sales Announcements and Suppliers Security Returns. Journal of Accounting
Research 23:144-166.
Palmrose, Z. V., V. J. Richardson, and S. Scholz. 2004. Determinants of Market Reactions to
Restatement Announcements. Journal of Accounting and Economics 37 (1):59-89.
Palmrose, Z. V., and S. Scholz. 2004. The Circumstances and Legal Consequences of Non-
GAAP Reporting: Evidence from Restatements. Contemporary Accounting Research 21
(1):139-180.
Pownall, G., and G. Waymire. 1989. Voluntary Disclosure Choice and Earnings Information
Transfer. Journal of Accounting Research 27:85-105.
Ramnath, S. 2002. Investor and Analyst Reactions to Earnings Announcements of Related
Firms: An Empirical Analysis. Journal of Accounting Research 40 (5):1351-1376.
34
Rao, H., G. F. Davis, and A. Ward. 2000. Embeddedness, Social Identity and Mobility: Why
Firms Leave the NASDAQ and Join the New York Stock Exchange. Administrative
Science Quarterly 45 (2):268-292.
Reppenhagen, D. 2010. Contagion of Accounting Methods: Evidence from Stock Option
Expensing. Review of Accounting Studies 15 (3):629-657.
Sah, R. K. 1991. Social Osmosis and Patterns of Crime. Journal of Political Economy 99
(6):1272-1295.
Srinivasan, S. 2005. Consequences of Financial Reporting Failure for Outside Directors:
Evidence from Accounting Restatements and Audit Committee Members. Journal of
Accounting Research 43 (2):291-334.
Stuart, T. E., and S. Yim. 2010. Board Interlocks and the Propensity to be Targeted in Private
Equity Transactions. Journal of Financial Economics 97 (1):174-189.
Teoh, S. H., I. Welch, and T. J. Wong. 1998a. Earnings Management and the Long-run Market
Performance of Initial Public Offerings. Journal of Finance 53 (6):1935-1974.
Teoh, S. H., I. Welch, and T. J. Wong. 1998b. Earnings Management and the Underperformance
of Seasoned Equity Offerings. Journal of Financial Economics 50 (1):63-99.
Thomas, J., and F. Zhang. 2008. Overreaction to Intra-industry Information Transfers? Journal
of Accounting Research 46 (4):909-940.
35
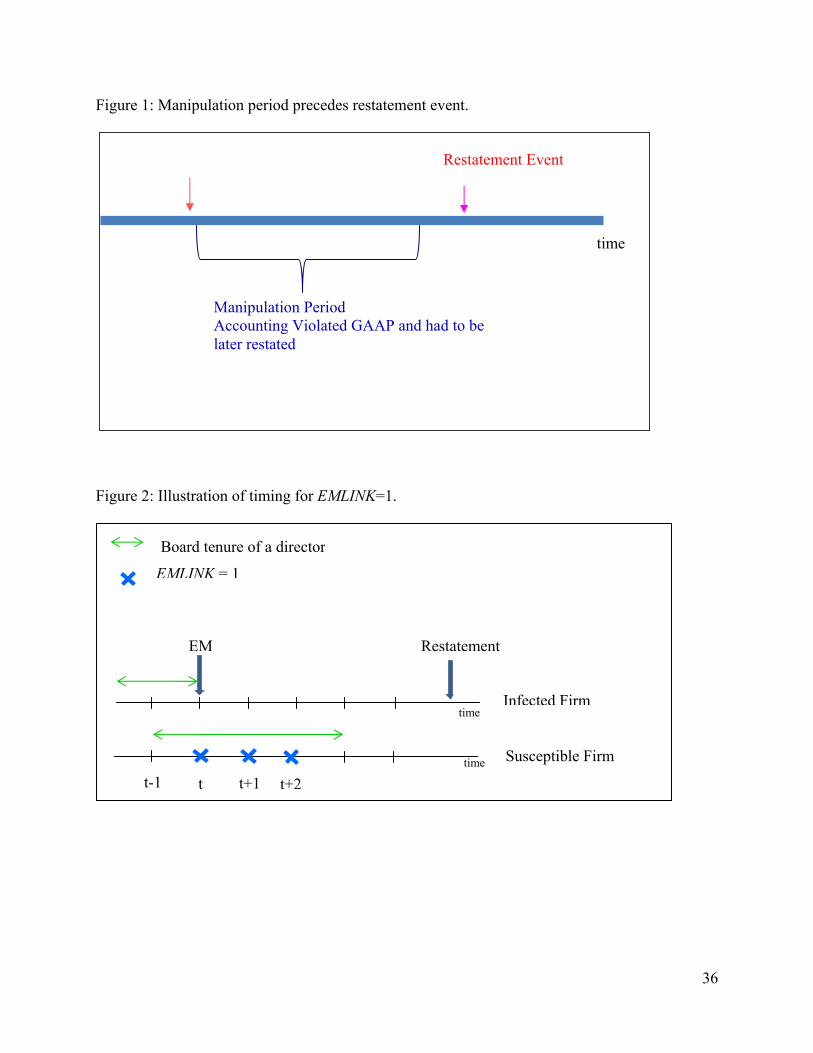
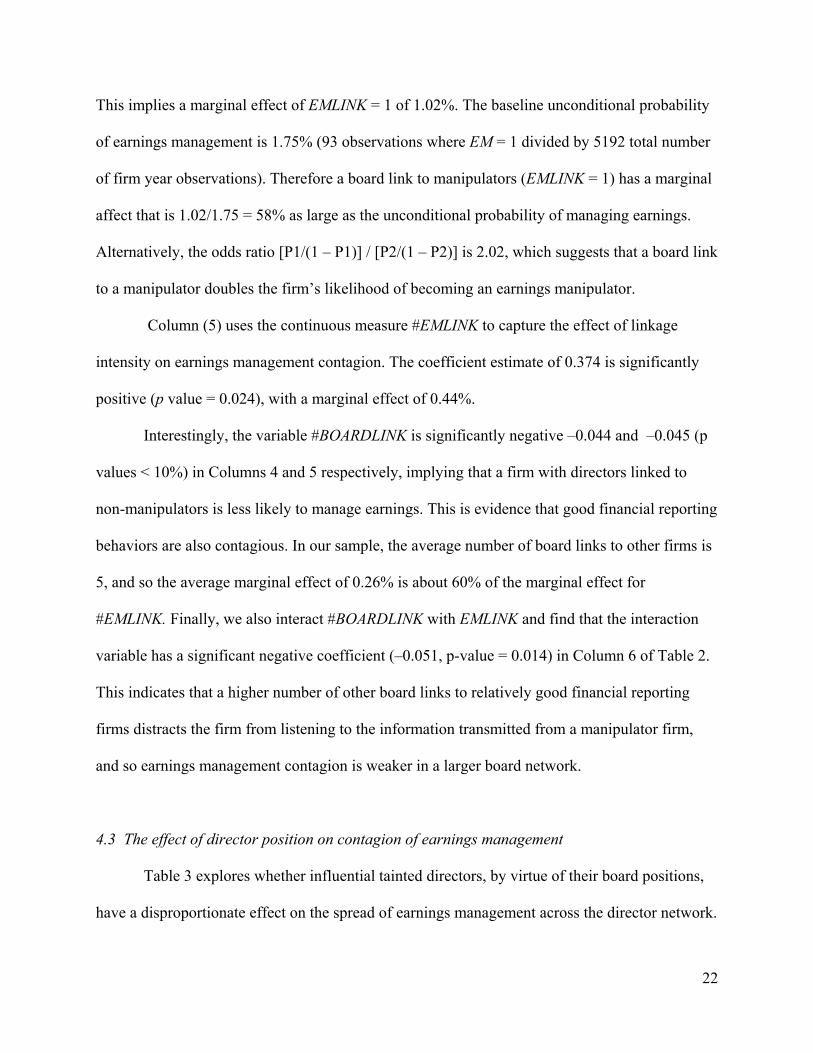
Figure 1: Manipulation period precedes restatement event.
Restatement Event
time
Manipulation Period Accounting Violated GAAP and had to be later restated
Figure 2: Illustration of timing for EMLINK=1.
EM
time
Restatement
EMLINK = 1
time
Board tenure of a director
Infected Firm
Susceptible Firm
t-1 t+1 t t+2
36

Figure 3: Illustration of timing for EMMIGRATEDLINK=1.
EMMIGRATEDLINK = 1
EMLINK = 1 Board tenure in infected firm Board tenure of migrated director in susceptible firm
EM
Infected Firm time
Figure 4: Illustration of timing for EMNEWDIRECTORLINK=1.
time
EM
Infected Firm
Board tenure EMNEWDIRECTORLINK = 1
time Susceptible Firm t-2 t-1 t t+1 t+2 t+3 t+4 t+5
EMLINK = 1
t t+1 t+2 t+3 t+4 t+5 Susceptible Firm time
37
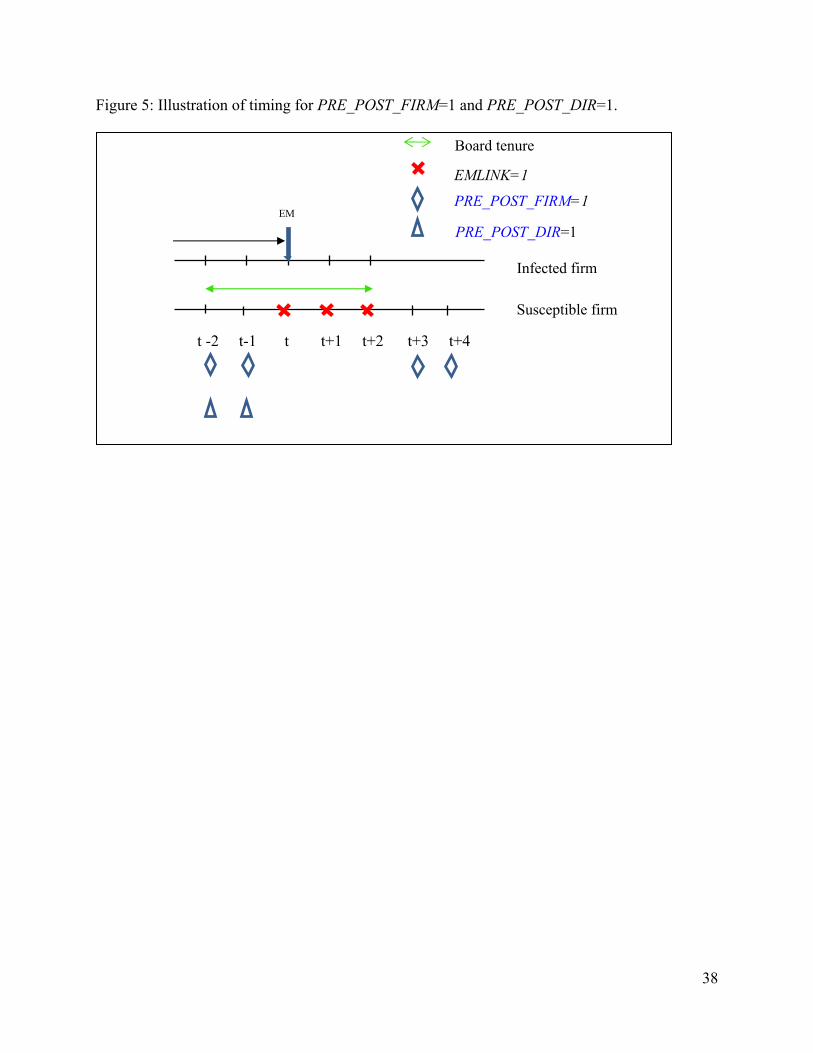
Figure 5: Illustration of timing for PRE_POST_FIRM=1 and PRE_POST_DIR=1.
Board tenure
EMLINK=1
PRE_POST_FIRM=1 EM
PRE_POST_DIR=1
Infected firm
Susceptible firm
t -2 t-1 t t+1 t+2 t+3 t+4
38

39
Table 1: Descriptive Statistics
The table describes the selection process and summary statistics of the sample. The sample consists of all firms in Risk Metrics from 1997 to 2001. Panel A provides the number of observations obtained at each sample selection step beginning with the GAO (2002) restatement sample. Panel B provides the summary statistics for two groups of the sample. In the EM sample, firms are identified as earnings manipulators if the earnings for that firm year had to be restated at a future date. The control group consists of the remaining firms in Risk Metrics not identified as earnings manipulators. Panel C reports correlations among all independent variables. Definitions of the control variables are in the Appendix. Panel A: Sample Selection
GAO sample released on Oct 4, 2002 (1/1/1997-6/30/2002) 919Less: Missing Gvkey 91Not covered by Risk Metrics 606Missing Beginning EM date or outside of Risk Metrics coverage period 79Duplicate Restatements or Multiple Restatements per year 6Multiple Restatements per firm 19Final Usable Sample for identifying earnings management 118
Panel A provides information on how the restatement sample is selected.

Table 1: Descriptive Statistics (Continued)
Panel B: Comparison of firm characteristics for EM sample and Control sample. Control group EM group
Variable N Mean Median Std Dev. N Mean Median Std
Dev.
t-statistics for Mean
Difference
Wilcoxon test for Median
Difference
EMLINK 8,043 0.187 0.000 0.390 118 0.288 0.000 0.455 (-2.40)** (-2.79)*** #BOARDLINK 8,043 7.445 5.000 7.611 118 7.839 6.000 7.584 (-0.56) (-1.10) ROA 7,946 0.026 0.037 0.111 117 0.004 0.025 0.132 (1.81)* (2.56)** Loss 7,964 0.186 0.000 0.389 117 0.239 0.000 0.429 (-1.34) (-1.47) Size 7,946 7.482 7.270 1.636 117 7.665 7.612 1.473 (-1.33) (-1.76) Leverage 7,918 0.584 0.595 0.229 117 0.600 0.599 0.237 (-0.73) (-0.65) Market to Book 7,707 3.345 2.244 3.448 112 3.362 2.338 3.074 (-0.05) (-0.10) Ret Volatility 7,947 3.126 2.739 1.529 117 3.598 3.151 1.638 (-3.10)*** (-3.53)*** Operating Lease 0/1 7,964 0.771 1.000 0.420 117 0.855 1.000 0.354 (-2.53)** (-2.13)** Firm Age 7,964 23.735 19.000 15.569 117 23.444 19.000 16.285 (0.19) (0.40) Abnormal Employee 7,633 -0.057 -0.039 0.229 114 -0.049 -0.021 0.275 (-0.31) (-1.18) G-index 6,877 8.960 9.000 2.761 100 9.290 9.000 2.844 (-1.15) (-1.13) Inst Holdings 8,035 0.153 0.134 0.123 118 0.149 0.139 0.125 (0.33) (0.46) Board Size 8,043 9.600 9.000 3.179 118 9.356 9.000 2.833 (0.93) (0.45) CEO Duality 8,043 0.670 1.000 0.470 118 0.703 1.000 0.459 (-0.79) (-0.77) Pct Ind directors 8,043 60.263 62.500 19.346 118 62.717 66.667 19.086 (-1.39) (-1.42)
* significant at 10% level; ** significant at 5% level; *** significant at 1% level. Panel B compare the characteristics of EM group and Control group. t-statistics are in parentheses for mean difference tests and z-statistics are in parentheses for median difference tests. Definitions of the control variables are provided in the Appendix.
40
41
Table 1: Descriptive Statistics (Continued)
Panel C: Correlations EMLINK (1) (2) (3) (4) (5) (6) (7) (8) (9) (10) (11) (12) (13) (14) (15)
(2) #BOARDLINK 0.433 (3) ROA 0.024 0.073 (4) Loss -0.025 -0.101 -0.669 (5) Size 0.269 0.564 0.084 -0.186 (6) Leverage 0.104 0.257 -0.179 -0.003 0.506 '(7) Market to Book 0.068 0.129 0.170 -0.067 0.021 0.001 (8) Ret Volatility -0.061 -0.240 -0.454 0.494 -0.346 -0.237 0.074 (9) Operating Lease (0/1) 0.018 0.002 -0.039 0.155 -0.266 -0.243 0.095 0.302
(10) Firm Age 0.175 0.418 0.154 -0.179 0.334 0.197 -0.059 -0.443 -0.227 (11) Abnormal Employee -0.017 -0.009 -0.141 0.071 -0.075 0.008 -0.075 0.017 0.003 -0.013 (12) G-index 0.075 0.228 0.048 -0.078 0.160 0.149 -0.041 -0.214 -0.082 0.352 -0.009 (13) Inst Holdings -0.052 -0.097 -0.025 0.090 -0.226 -0.058 -0.100 0.087 0.235 -0.137 0.011 -0.089 (14) Board Size 0.197 0.488 0.083 -0.180 0.594 0.381 -0.007 -0.382 -0.291 0.348 -0.025 0.218 -0.229 (15) CEO Duality 0.065 0.153 0.035 -0.062 0.151 0.100 0.013 -0.099 -0.047 0.114 -0.009 0.111 -0.014 0.057 (16) Pct Ind Directors 0.139 0.320 0.009 -0.063 0.162 0.138 -0.017 -0.145 -0.145 0.281 -0.016 0.274 -0.015 0.132 0.125
Correlation figures are bold-faced if they are significant at the 5% level. Panel C reports correlations among all independent variables. Definitions of the control variables are provided in the Appendix.

Table 2: Propensity to manage earnings on board links to earnings manipulators. (1) (2) (3) (4) (5) (6) # EMLINK 0.374** 1.056*** (0.024) (0.000) EMLINK 0.640** 0.598** 0.597** 0.706** (0.012) (0.023) (0.024) (0.013) # EMLINK×#BOARDLINK -0.051** (0.014) #BOARDLINK -0.009 -0.010 -0.004 -0.044* -0.045* -0.015 (0.525) (0.516) (0.779) (0.061) (0.070) (0.568) ROA -0.154 -0.180 -0.076 (0.904) (0.887) (0.954) Loss 0.062 0.071 0.075 (0.871) (0.852) (0.845) Size 0.385*** 0.390*** 0.380*** (0.000) (0.000) (0.000) Leverage 1.005 0.991 0.996 (0.204) (0.206) (0.216) Market to Book -0.053* -0.050 -0.060* (0.081) (0.101) (0.051) Ret Volatility 0.162 0.157 0.156 (0.129) (0.139) (0.143) Operating Lease (0/1) 0.939** 0.926** 0.909** (0.035) (0.034) (0.041) Firm Age -0.011 -0.011 -0.010 (0.244) (0.245) (0.277) Abnormal Employee -0.161 -0.171 -0.152 (0.741) (0.724) (0.752) G-index 0.058 0.061 0.052 (0.219) (0.194) (0.264) Inst Holdings 0.162 0.204 0.089 (0.866) (0.833) (0.928) Board Size -0.021 -0.021 -0.027 (0.707) (0.716) (0.641) CEO Duality 0.080 0.078 0.088 (0.735) (0.743) (0.712) Pct Ind Directors 0.006 0.006 0.005 (0.408) (0.384) (0.449) Year Fixed Effects No Yes Yes Yes Yes Yes Industry Fixed Effects No No Yes Yes Yes Yes Observations 8161 8161 7019 5292 5292 5292 Pseudo R-Square 0.006 0.016 0.036 0.07 0.067 0.075
The table presents results of logistic regressions of EM on EMLINK or #EMLINK based on Equations (1), (2) or (3). EM equals one if this is the initial year of the restating period for a firm that later had to restate its earnings, and is zero otherwise. EMLINK equals one when a firm has an interlocked board member with another firm whose earnings in that period or two years prior were managed and had to be restated at a future date, and is zero otherwise. # EMLINK is measured as the number of board interlocks with other distinct earnings manipulators. Definitions of all variables are provided in the Appendix. Robust p values are in parentheses. * significant at 10% level; ** significant at 5% level; *** significant at 1% level.
42

Table 3: Propensity to manage earnings and board links to earnings manipulators by board positions in susceptible firm of directors linked to infected firms.
(1) (2) (3) (4) (5) EMLINK 0.623** 0.568* 0.560* 0.347 (0.030) (0.051) (0.064) (0.379) EMCEOLINK 0.631 -0.081 (0.230) (0.957) EMBOARDCHAIRLINK 0.953* 1.149 (0.054) (0.379) EMAUDITCHAIRLINK 1.319** 1.083* (0.015) (0.058) EMAUDITCOMLINK 0.682* 0.661* (0.097) (0.062) EMOTHERLINK -0.242 (0.628) #BOARDLINK -0.044* -0.045* -0.052** -0.057** -0.054** (0.062) (0.059) (0.038) (0.026) (0.044) ROA -0.087 -0.063 -0.048 -0.284 -0.001 (0.946) (0.960) (0.972) (0.828) (1.000) Loss 0.075 0.072 0.102 0.090 0.144 (0.845) (0.854) (0.799) (0.823) (0.723) Size 0.388*** 0.393*** 0.375*** 0.377*** 0.395*** (0.000) (0.000) (0.001) (0.001) (0.001) Leverage 0.999 1.031 1.316 1.268 1.340 (0.205) (0.190) (0.126) (0.139) (0.120) Market to Book -0.052* -0.051* -0.065* -0.065* -0.061* (0.085) (0.095) (0.052) (0.051) (0.064) Ret Volatility 0.161 0.161 0.121 0.118 0.117 (0.130) (0.127) (0.302) (0.310) (0.307) Operating Lease (0/1) 0.962** 0.942** 0.649 0.625 0.608 (0.026) (0.033) (0.105) (0.120) (0.116) Firm Age -0.011 -0.011 -0.011 -0.012 -0.012 (0.236) (0.250) (0.252) (0.202) (0.207) Abnormal Employee -0.155 -0.129 -0.207 -0.181 -0.117 (0.751) (0.791) (0.687) (0.725) (0.820) G-index 0.059 0.062 0.060 0.060 0.062 (0.211) (0.188) (0.229) (0.227) (0.203) Inst Holdings 0.227 0.288 -0.485 -0.438 -0.279 (0.817) (0.766) (0.647) (0.674) (0.794) Board Size -0.022 -0.021 -0.036 -0.028 -0.028 (0.694) (0.701) (0.559) (0.652) (0.647) CEO Duality 0.071 0.058 0.111 0.125 0.104 (0.765) (0.808) (0.656) (0.616) (0.687) Pct Ind Directors 0.006 0.006 0.002 0.003 0.003 (0.400) (0.400) (0.751) (0.692) (0.707) Year & Industry Fixed Effects Yes Yes Yes Yes Yes Observations 5292 5292 4393 4393 4393 Pseudo R-Square 0.071 0.073 0.074 0.072 0.079
43
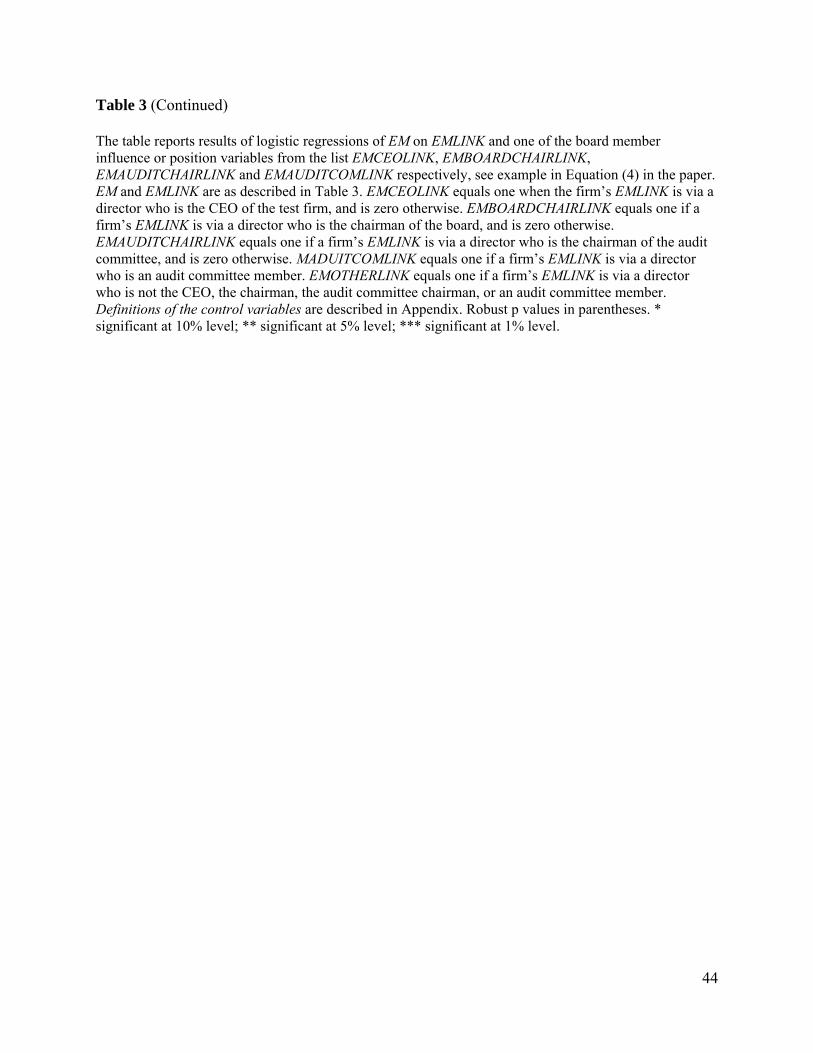
Table 3 (Continued) The table reports results of logistic regressions of EM on EMLINK and one of the board member influence or position variables from the list EMCEOLINK, EMBOARDCHAIRLINK, EMAUDITCHAIRLINK and EMAUDITCOMLINK respectively, see example in Equation (4) in the paper. EM and EMLINK are as described in Table 3. EMCEOLINK equals one when the firm’s EMLINK is via a director who is the CEO of the test firm, and is zero otherwise. EMBOARDCHAIRLINK equals one if a firm’s EMLINK is via a director who is the chairman of the board, and is zero otherwise. EMAUDITCHAIRLINK equals one if a firm’s EMLINK is via a director who is the chairman of the audit committee, and is zero otherwise. MADUITCOMLINK equals one if a firm’s EMLINK is via a director who is an audit committee member. EMOTHERLINK equals one if a firm’s EMLINK is via a director who is not the CEO, the chairman, the audit committee chairman, or an audit committee member. Definitions of the control variables are described in Appendix. Robust p values in parentheses. * significant at 10% level; ** significant at 5% level; *** significant at 1% level.
44

Table 4: Propensity to manage earnings and board links to earnings manipulators by migrated, newly hired directors, and “time travel” firm/director fixed effects.
(1) (2) (3) (4) EMLINK 0.683** 0.712** 0.728** 0.705** (0.020) (0.021) (0.015) (0.018) EMMIGRATEDLINK 0.205 (0.703) EMNEWDIRECTOR -0.018 (0.965) PRE_POST_FIRM 0.075 (0.813) PRE_POST_DIR -0.007 (0.987) #BOARDLINK -0.045* -0.044* -0.045* -0.044* (0.059) (0.062) (0.056) (0.061) ROA -0.180 -0.151 -0.160 -0.154 (0.888) (0.906) (0.901) (0.905) Loss 0.057 0.063 0.063 0.062 (0.882) (0.870) (0.869) (0.871) Size 0.385*** 0.385*** 0.382*** 0.385*** (0.000) (0.000) (0.000) (0.000) Leverage 1.011 1.005 1.005 1.005 (0.202) (0.204) (0.204) (0.205) Market to Book -0.054* -0.053* -0.054* -0.053* (0.080) (0.082) (0.079) (0.082) Ret Volatility 0.161 0.162 0.160 0.162 (0.130) (0.129) (0.129) (0.129) Operating Lease (0/1) 0.948** 0.938** 0.936** 0.939** (0.035) (0.036) (0.036) (0.036) Firm Age -0.011 -0.011 -0.011 -0.011 (0.240) (0.246) (0.243) (0.244) Abnormal Employee -0.166 -0.160 -0.162 -0.161 (0.732) (0.741) (0.739) (0.741) G-index 0.057 0.058 0.057 0.058 (0.224) (0.222) (0.225) (0.218) Inst Holdings 0.141 0.163 0.153 0.163 (0.884) (0.866) (0.874) (0.866) Board Size -0.021 -0.021 -0.022 -0.021 (0.707) (0.706) (0.705) (0.710) CEO Duality 0.079 0.080 0.079 0.080 (0.739) (0.735) (0.737) (0.735) Pct Ind Directors 0.006 0.006 0.006 0.006 (0.404) (0.409) (0.406) (0.409) Year & Industry Fixed Effects Yes Yes Yes Yes Observations 5292 5292 5292 5292 Pseudo R-Square 0.070 0.070 0.070 0.070
45
Table 4 (Continued) The table reports results of logistic regressions of EM on EMLINK and one of the variables EMMIGRATEDLINK, EMNEWDIRECTOR, PRE_POST_FIRM , and PRE_POST_DIR from Column (1) to Column (4). EM and EMLINK are described previously in Table 2. EMMIGRATEDLINK equals one if the director who triggered EMLINK=1 joined the test firm subsequent to his earnings management (EM) experience in the linked firm. EMNEWDIRECTOR equals one if the director joined the test firm for no more than three years, and earned earnings management experience from sitting on other boards at any time in the three year period. PRE_POST_FIRM equals one if a firm at some point in time acquires a director from a firm that has EM = 1; and if EMLINK is not equal to 1 (i.e. has earnings management experience in the pre and post period). PRE_POST_DIR equals one for firm-years if there is a director on board who either is earnings management experienced or will become earnings management experienced, and if EMLINK is not equal to 1. Definitions of the control variables are described in Appendix. Robust p values in parentheses. * significant at 10% level; ** significant at 5% level; *** significant at 1% level.
46
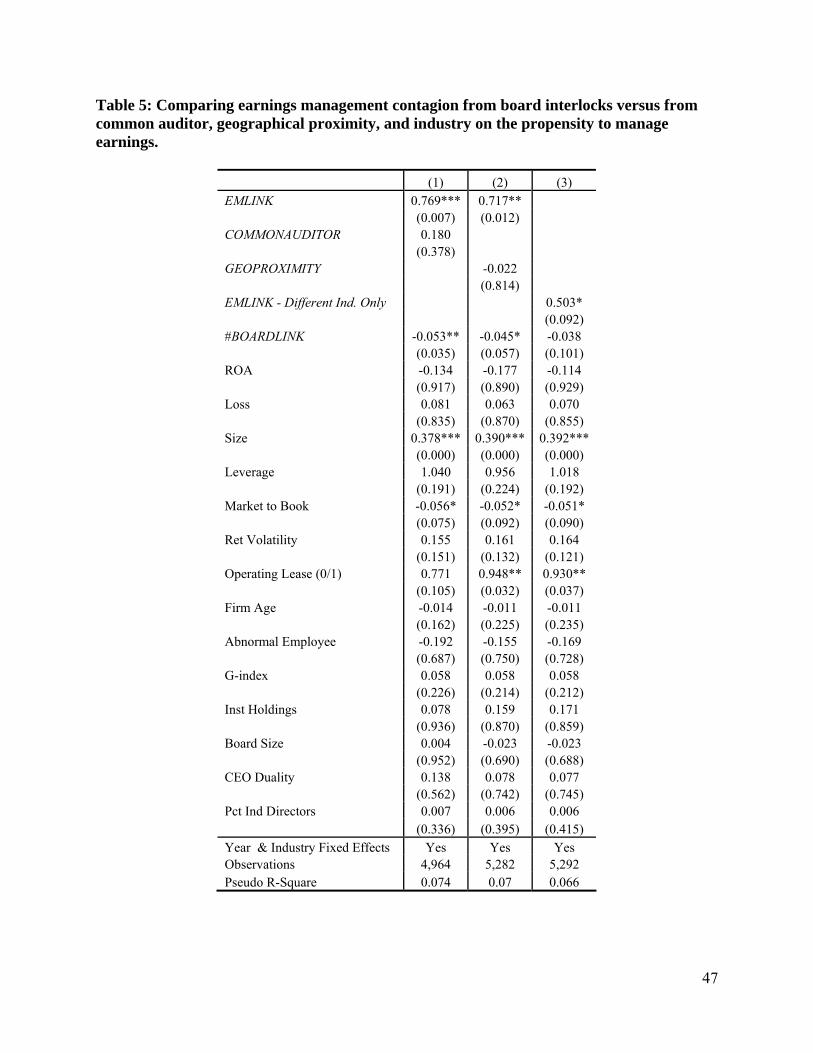
Table 5: Comparing earnings management contagion from board interlocks versus from common auditor, geographical proximity, and industry on the propensity to manage earnings.
(1) (2) (3) EMLINK 0.769*** 0.717** (0.007) (0.012) COMMONAUDITOR 0.180 (0.378) GEOPROXIMITY -0.022 (0.814) EMLINK - Different Ind. Only 0.503* (0.092) #BOARDLINK -0.053** -0.045* -0.038 (0.035) (0.057) (0.101) ROA -0.134 -0.177 -0.114 (0.917) (0.890) (0.929) Loss 0.081 0.063 0.070 (0.835) (0.870) (0.855) Size 0.378*** 0.390*** 0.392*** (0.000) (0.000) (0.000) Leverage 1.040 0.956 1.018 (0.191) (0.224) (0.192) Market to Book -0.056* -0.052* -0.051* (0.075) (0.092) (0.090) Ret Volatility 0.155 0.161 0.164 (0.151) (0.132) (0.121) Operating Lease (0/1) 0.771 0.948** 0.930** (0.105) (0.032) (0.037) Firm Age -0.014 -0.011 -0.011 (0.162) (0.225) (0.235) Abnormal Employee -0.192 -0.155 -0.169 (0.687) (0.750) (0.728) G-index 0.058 0.058 0.058 (0.226) (0.214) (0.212) Inst Holdings 0.078 0.159 0.171 (0.936) (0.870) (0.859) Board Size 0.004 -0.023 -0.023 (0.952) (0.690) (0.688) CEO Duality 0.138 0.078 0.077 (0.562) (0.742) (0.745) Pct Ind Directors 0.007 0.006 0.006 (0.336) (0.395) (0.415) Year & Industry Fixed Effects Yes Yes Yes Observations 4,964 5,282 5,292 Pseudo R-Square 0.074 0.07 0.066
47
Table 5 (Continued) The table reports results of logistic regressions of EM on EMLINK, AUDITOR LINK, and/or GEOPROXIMITY. EM and EMLINK are as described in Table 2. COMMONAUDITOR is defined as the number of EM firms that share a common auditor with the firm in the past two years and the current year scaled by the number of distinct clients of that common auditor. Column (3) replaces the presence of tainted directors (EMLINK) with the presence of tainted directors from different industries (EMLINK-Different Ind. Only). GEOPROXIMITY is the sum of the reciprocal of the distance the test firm and all EM=1 firms in the same year and prior two years. Only Definitions of the control variables are described in Appendix. Robust p values in parentheses. * significant at 10% level; ** significant at 5% level; *** significant at 1% level.
48

Table 6: Comparing board interlock contagion and market incentives on the propensity to manipulate earnings.
(1) (2) (3) (4) EMLINK 0.678** 0.698** 0.701** 0.686** (0.015) (0.014) (0.018) (0.020) #BOARDLINK -0.039* -0.046* -0.046* -0.046* (0.090) (0.051) (0.073) (0.070) M&A 0.764*** 0.446 (0.002) (0.107) ISSUE 0.484** 0.337 (0.049) (0.186) FSCORE 1.642*** 1.048* (0.003) (0.073) ROA 0.070 -0.144 0.022 0.102 (0.958) (0.910) (0.987) (0.942) Loss 0.079 0.086 0.125 0.122 (0.838) (0.821) (0.756) (0.760) Size 0.363*** 0.376*** 0.418*** 0.413*** (0.001) (0.000) (0.000) (0.000) Leverage 1.093 0.888 1.011 0.865 (0.171) (0.271) (0.227) (0.311) Market to Book -0.055* -0.058* -0.069* -0.068* (0.077) (0.060) (0.052) (0.054) Ret Volatility 0.165 0.147 0.106 0.106 (0.122) (0.168) (0.346) (0.340) Operating Lease (0/1) 0.868** 0.845** 0.582 0.591 (0.045) (0.048) (0.207) (0.184) Firm Age -0.009 -0.010 -0.010 -0.010 (0.342) (0.288) (0.265) (0.311) Abnormal Employee -0.002 -0.105 0.320 0.281 (0.995) (0.826) (0.513) (0.555) G-index 0.057 0.057 0.074 0.074 (0.228) (0.223) (0.105) (0.109) Inst Holdings 0.202 0.112 0.374 0.363 (0.836) (0.908) (0.701) (0.713) Board Size -0.023 -0.020 -0.025 -0.026 (0.684) (0.718) (0.671) (0.656) CEO Duality 0.075 0.075 0.097 0.096 (0.751) (0.753) (0.695) (0.700) Pct Ind Directors 0.006 0.006 0.005 0.006 (0.390) (0.369) (0.450) (0.425) Year & Industry Fixed Effects Yes Yes Yes Yes Observations 5292 5292 5129 5129 Pseudo R-Square 0.078 0.074 0.079 0.084
49

Table 6 (Continued) The table reports results of logistic regressions of EM on EMLINK with additional controls of M&A, ISSUE and FSCORE. M&A equals one if a firm has M&A activities in the year, and is zero otherwise. ISSUE equals one if a firm issues new debts or equity in the year, and is zero otherwise. FSCORE is calculated as the propensity of accounting frauds based on the model in Dechow et al. (2010). EM and EMLINK are previously described in Table 2. Definitions of the control variables are described in Appendix. Robust p values in parentheses. * significant at 10% level; ** significant at 5% level; *** significant at 1% level.
50

Appendix: Definitions Table
Variable Name Definition
EM
Indicator variable equals 1 if this is the starting year of the restating period (i.e., the manipulation period) for a firm that had to restate earnings, and is zero otherwise.
EMLINK
Indicator variable equals 1 if a firm shares a director with another firm that experienced EM = 1 either in the current year or in the past two years, and is zero otherwise. In other words, the linked firm is a restating firm and the restating period is either in the current year or in the past two years.
#EMLINK Number of board links a firm has with another firm that has EM =1 in the current or past two years. It is the continuous measure of the EMLINK variable.
#BOARDLINK
Number of other firms connected to the firm through interlocked board network. A firm is interlocked with another firm if there is a common director serving on board of both firms.
ROA Return on total assets ([NI]/[AT]) Compustat labels are in []
Loss Indicator variable equals 1 if the firm's income before extraordinary items [IB] is negative in the year
Size Natural logarithm of firm's total assets [AT]
Leverage Total liabilities [LT] divided by total assets[AT]
Market to Book Market to book ratio( [CSHO]*[PRCC_F]/[CEQ] )
Ret Volatility 100 times stock return volatility in year t
Operating Lease (0/1) Indicator variable equals 1 if firm’s future operating lease obligations ([MRC1],[MRC2],[MRC3],[MRC4] or [MRC5]) are greater than zero, and 0 otherwise
Firm Age Firm's age
Abnormal Employee Firm’s abnormal change in employees equals the number of employees [EMP] for year t minus the number of employees for year t-1, scaled by the number of employees for year t-1, less total assets [AT] at year-end t minus total assets at year-end t-1, scaled by assets at year-end t-1.
G-index G-Score of Gompers et al ( 2003)
Inst Holdings Percentage of Institutional holdings
Board Size Number of board members on the firm’s board in a given year
CEO Duality
Indicator variable equals 1 if the CEO is also Chairman of Board
Pct Ind Directors Percentage of independent board member on the firm’s board
51

52
M&A Indicator variable equals 1if a firm has M&A activities ([AQS]>0) in the year
ISSUE Indicator variable equals 1 if the sum of new long-term debt [DLTIS] plus new equity [SSTK] exceeds 2 percent of total assets [AT] for a firm-year.
FSCORE Average F-score in the past three years; F-score is the propensity of accounting frauds, and its estimation is based on Dechow et al. (2010).
EMCEOLINK Indicator variable equals 1 if a firm' s EMLINK is via a director who is the CEO of the firm
EMBOARDCHAIRLINK Indicator variable equals 1 if a firm's EMLINK is via a director who is the board chairman
EMAUDITCHAIRLINK Indicator variable equals 1 if a firm's EMLINK is via a director who is the chairperson of the audit committee.
EMAUDITCOMLINK
Indicator variable equals 1 if a firm' s EMLINK is via a director who is an audit committee member
EMOTHERLINK
Indicator variable equals one if a firm’s EMLINK is via a director who is not the CEO, the chairman, the audit committee chairman, or an audit committee member.
EMMIGRATEDLINK
Indicator variable equals 1 if the director, who triggered EMLINK=1, joined the susceptible firm subsequent to his earnings management experience in the linked firms
EMNEWDIRECTORLINK Indicator variable equals 1 if the director, who triggered EMLINK=1, joined the susceptible firm for 3 or fewer years
PRE_POST_FIRM
Indicator variable equals 1 when both of the following conditions are met: 1) a firm at some point in time acquires a director from a firm that has EM = 1; 2) EMLINK is not equal to 1 (i.e. has earnings management experience in the pre and post period).
PRE_POST_DIR
Indicator variable equals 1 for firm-years when both of the following conditions are met: 1) there is a director on board who either is earnings management experienced or will become earnings management experienced; 2) EMLINK is not equal to 1.
EMLINK - Different Ind. Only
Indicator variable equals 1 if a firm's EMLINK = 1 is from a firm in a different Fama-French 48 industries. That is, the tainted directors are from firms in a different industry.
GEOPROXIMITY
Sum of the reciprocal of the distance between test firm i and all EM=1 firms k in same year and prior two years (i.e. ∑ 1/(1+distance (i,k) where k is each EM firm)
COMMONAUDITOR 100 times the number of EM firms that share a common auditor with the firm in the past two years and the current year (t-2, t-1, and t), scaled by the number of distinct clients of that common auditor