Embed Size (px)
Citation preview
JOURNAL OF FINANCIAL AND QUANTITATIVE ANALYSIS Vol. 42, No, 3, Sept. 2007, pp . 535-564COPyRIGHT 2007, SCHOOL OF BUSINESS ADMINISTRATION, UNIVERSITY OF WASHINGTON, SEATTLE. WA 98195
Board Composition, Corporate Performance,and the Cadbury Committee Recommendation
Jay Dahya and John J. McConnell*
Abstract
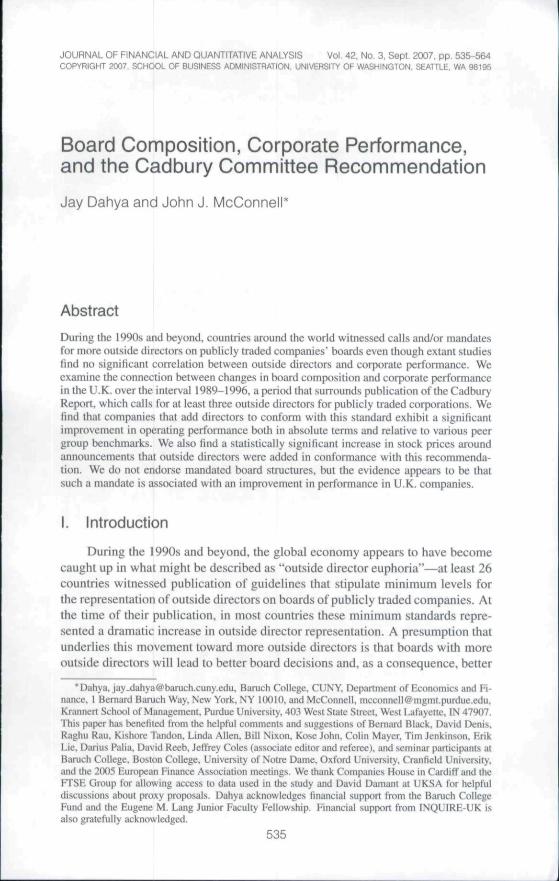
During the iy90s and beyond, countries around the world witnessed calls and/or mandatesfor more outside directors on publicly traded companies' boiird.s even though extant studieslind no significant correlation between out.side directors and corporate perfonnance. Weexamine the connection between changes in board composition and corporate perfonnancein the U.K. over the interval 1989-1996. a period that surrounds publication of the CadburyReport, which calls for at least three outside directors for publicly traded corporations. Wefind that companies that add directors to conform with this standard exhibit a significantimprovement in operating performance both in absolute terms and relative to various peergroup benchmarks. We also find a statistically significant increase in stock prices aroundannouncements that outside directors were added in conformance with this recommenda-tion. We do not endorse mandated board structures, but the evidence appears to be thatsuch a mandate is associated with an improvement in perfonnance in U.K. companies.
I. Introduction
During the 1990s and beyond, the global eeonomy appears to have becomecaughl up in what tnight be described as "outside director euphoria"—at least 26countries witnessed publication of guidelines that stipulate minimum levels forthe representation of outside directors on boards of publicly traded companies. Atthe time of their publication, in most countries these minimum standards repre-sented a dramatic increase in outside director representation. A presumption thatunderlies this movement toward more outside directors is that boards with moreoutside directors will lead to hetter board decisions and, as a consequence, better
•Dahya, [email protected]. Baruch College. CUNY. Department of Economics and Fi-nance, t Bernard Baruch Way, New York, NY 10010, and McConnell. [email protected] School of Managemeni, Purdue Universiiy. 403 Wesl State Street. West Lafayette, IN 47907.This paper has benefited from Ihe helpful comments and suggestions of Bernard Black, David Denis,Raghu Rau, Kishore Tandon, Linda Allen, BH! Nixon, Kose John, Colin Mayer, Tim Jenkirson, ErikLie. Darius Paiia. David Reeb, Jeffrey Coles (associate editor and referee), ;md seminar panicipants alBaruch College. Boston College, University of Notre Dame, Oxford University, Cranfieid University,and the 2005 European Finance Association meetings. We thank Companies House in Cardiff and theFTSE Group for allowing access to data used In the study and David Damanl at UKSA for helpfuldiscussions about proxy proposals. Dahya acknowledges financial support from the Banich CollegeFund and the Eugene M. Lang Junior Faculty Fellowship. Financial support from IN(JU1RE-UK isalso gratefully acknowledged.
535
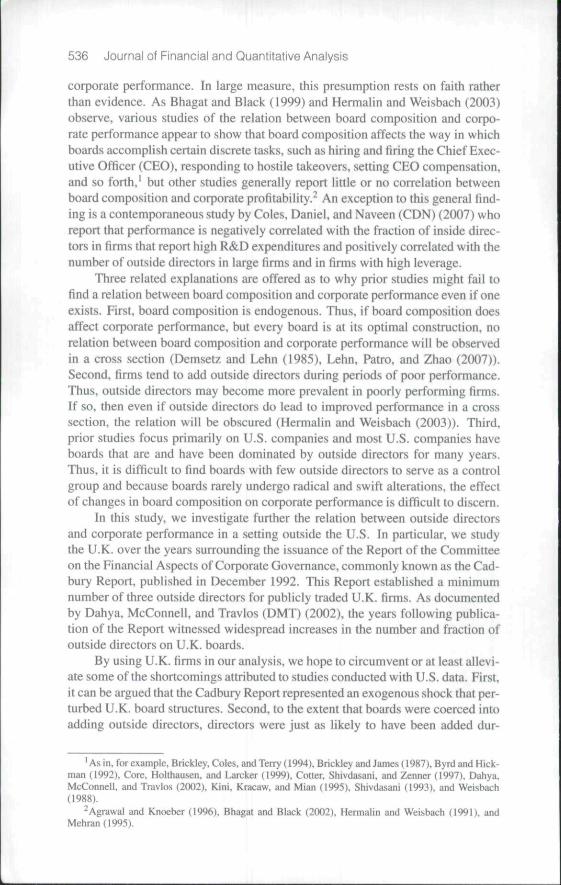
536 Journal of Financial and Quantitative Anaiysis
corporate performance. In large measure, this presumption rests on faith ratherthan evidence. As Bhagat and Black (1999) and Hermalin and Weisbach (2003)observe, various studies of the relation between board composition and corpo-rate perfonnance appear to show that board composition affects the way in whichboards accomplish certain discrete tasks, such as hiring and firing the Chief Exec-utive Officer (CEO), responding to hostile takeovers, setting CEO compensation,and so forth,' but other studies generally report little or no correlation betweenboard composition and corporate profitability.^ An exception to this general find-ing is a contemporaneous study by Coles, Daniel, and Naveen (CDN) (2007) whoreport that performance is negatively correlated with the fraction of inside direc-tors in firms that report high R&D expenditures and positively correlated with thenumber of outside directors in large firms and in firms with high leverage.
Three related explanations are offered as to why prior studies might fail tofind a relation between board composition and corporate performance even if oneexists. First, board composition is endogenous. Thus, if board composition doesaffect corporate performance, but every board is at its optimal construction, norelation between board composition and corporate performance will be observedin a cross section (Demsetz and Lehn (1985). Lehn, Patro, and Zhao (2007)).Second, firms tend to add outside directors during periods of poor performance.Thus, outside directors may become more prevalent in poorly performing firms.If so, then even if outside directors do lead to improved performance in a crosssection, the relation will be obscured (Hermalin and Weisbach (2003)). Third,prior studies focus primarily on U.S. companies and most U.S. companies haveboards that are and have been dominated by outside directors for many years.Thus, it is difficult to find boards with few outside directors to serve as a controlgroup and because boards rarely undergo radical and swift alterations, the effectof changes in board composition on corporate performance is difficult to discern.
In this study, we investigate further the relation between outside directorsand corporate performance in a setting outside tbe U.S. In particular, we studythe U.K. over the years surrounding tbe issuance of the Report of the Committeeon the Financial Aspects of Corporate Governance, commonly known as the Cad-bury Report, published in December 1992. This Report established a minimumnumber of three outside directors for publicly traded U.K. firms. As documentedby Dahya, McConnell, and Travlos (DMT) (2002), the years following publica-tion of the Report witnessed widespread increases in the number and fraction ofoutside directors on U.K. boards.
By using U.K. firms in our analysis, we hope to circumvent or at least allevi-ate some of the shortcomings attributed to studies conducted with U.S. data. First,it can be argued that the Cadbury Report represented an exogenous shock that per-turbed U.K. board structures. Second, to the extent that boards were coerced intoadding outside directors, directors were just as likely to have been added dur-
' As in, for example, Bdckley. Coles, and Terry (1994), Brickley and James (i 987). Byrd and Hick-man (1992), Core. Holthau.sen. and Larcker (1999), Colter. Shivdasani, and Zenner (1997). Dahya.McConnell. and Travlos (2002). Kini. Kracaw. and Mian (1995). Shivdasani (1993). and Weisbach(1988).
^Agrawal and Knoeber (1996). Bhagal and Black (2(X)2). Hermalin and Weisbach (1991), andMehrdn(l995).
Dahya and McConnell 537
ing a period of good performance as during a period of poor performance. And,third, the significant changes in board composition that followed publication oftbe Report were concentrated over a relatively short time interval, thus providinga large sample of boards with altered structures so as to permit a clean before- andafter-event analysis.
The primary question that we address is whether U.K. companies tbat cameinto compliance with the Cadbury Report recommendation of having at least threeoutside directors experienced an improvement in performance. We measure per-formance in two ways. First, we compare the return on assets (ROA) for compa-nies that came into compliance with the Cadbury recommendation against variousbenchmarks. Tbe benchmarks are composed either of companies already in com-pliance with the recommendation prior to the Cadbury Report or of companiesthat never complied with the recommendation during the period of our analysis.Second, we conduct an event study of stock prices around announcements thatcompanies were appointing a sufficient number of outside directors so as to con-form with the recommendation.
We find that compliance with the Cadbury recommendation is followed by astatistically and economically significant improvement in operating performance(i.e., ROA) regardless of tbe performance benchmark employed. For example,from one year before to two years after adoption of the Cadbury recommenda-tion, the adopting firms experienced a statistically significant increase in averageROA of 1.95% from 7.76% to 9.71%. Over the same time interval, the adoptingcompanies' industry peers experienced an insignificant increase in average ROAof 0.12% from 9.52% to 9.64%. To give an indication of the economic magnitudeof this improvement, as of the end of the year prior to adoption the average bookvalue assets of firms that adopted the recommendation was £221 million. An im-provement of 1.95% in ROA translates into an increase in before-tax profits of£4.31 million.
To identify the source of the improvement in ROA. we decompose the changein ROA into its components. In comparison with various categories of their peers,firms that adopted the Cadbury recommendation exhibited a somewhat highergrowth rate in revenue, a slower growth in cost of goods sold (COGS), and. mostimportantly, a much lower growth rate in operating expenses from before to afteradoption of the recommendation. Thus, most of the improvement in ROA appearsto be due to improved control of overhead expenses.
As regards the event study of stock returns, instances in which a companywith fewer than three outside directors announced additions of outside directorsso as to increase the number of outsiders to three or more are accompanied byan average two-day abnormal return (AR) of 0.44%. In comparison, the averagetwo-day AR associated with announcements of tbe addition of inside directors is0.17%. The difference between the two is statistically significant. Thus, the reac-tion of investors to the announcement that a firm bas complied with the Cadburyrecommendation is consistent witb an expectation by investors that the decisionwill lead to an improvement in operating performance, and our analysis finds suchan improvement.
As an extension of our analysis, we also consider a second recommendationof the Cadbury Report—tbat the positions of CEO and Chairman of the Board
538 Journal of Financial and Quantitative Analysis
(COB) be beid by two different persons. We conduct eacb of our analyses ofoperating and stock price performance for firms tbat comply with this recommen-dation. We find no effect on operating performance or stock price for firms tbatsplit the positions of CEO and COB to comply with this recommendation.
Numerous caveats are in order. Perhaps tbe most important is that we do notoffer our results as an endorsement of mandated minimum levels for outside di-rectors. The results do show that companies that increased their number of outsidedirectors to meet the Cadbury standard experienced a significant improvement inperformance, but that experience may be unique to the U.K. or to the time periodstudied. Other studies of other countries will provide insight regarding tbe extentto which the outcome in the U.K. can be generalized.
The next section briefly reviews prior studies of board composition and cor-porate performance and provides furtber details about the Cadbury Report. Sec-tion III describes tbe sample and data we use in our analysis. Section IV presentsour analysis of operating performance. Section V presents our decompositionof operating performance into its various components. Section VI contains theresults of our event study of stock prices. Section VII briefly discusses tests ofwhether splitting the positions of CEO and COB have any effect on operating orstock price performance. Section VIII presents various sensitivity analyses of ourbasic tests. Section IX provides a commentary. Included in tbis Commentary aretwo further analyses that address questions about the extent to which tbe shift inboard structures is due to exogenous (as opposed to endogenous) factors. SectionX concludes.
II. Background
A. Prior Studies
Bhagat and Black (1999) and Hermalin and Weisbach (2003) provide ex-cellent and extensive surveys of prior studies of tbe connection between boardcomposition and corporate decisions. Tbus, our review of this literature will bebrief.
Prior studies of the relation between board composition and performance fallinto one of two categories. In the first, various measures of corporate performanceare regressed against the fraction of tbe board composed of outside directors. Forexample, Hermalin and Weisbacb (1991) study a sample of 134 NYSE firms atthree-year intervals over the period I97I through 1983. They regress operatingearnings and Tobin's Q against the fraction of the board made up of outside direc-tors and various control variables. They experiment with various specifications oftheir regressions, but in none do they find performance to be significantly corre-lated witb tbe fraction of outside directors. Agrawal and Knoeber( 1996) conductcross-sectional regressions witb a sample of 383 large U.S. firms for which theyhave board data for 1987. In their regressions, Tobin's Q is the dependent vari-able. Initially, they report a significant negative correlation between the fractionof outside directors and Q. However, in later work with the same sample andother control variables, the significance of the relation disappears (Agrawal andKnoeber (2001)). Bhagat and Black (2002) analyze the relation between board
Dahya and McConnell 539
composition and four different measures of corporate performance—Q, ROA,sales/assets, and long-term stock returns. They conduct their analysis with a sam-ple of 828 U.S. firms for which they have board data in 1991. They report thatfirms that experience poor performance tend to appoint more outside directors,but that the maneuver does not lead to an improvement in performance. They alsofind no significant relation between board composition and various measures oflong run performance. CDN (2007) analyze a large sample of U.S. firms over theperiod 1992-2001. They find tbat the relation between performance and boardcomposition depends upon certain firm characteristics. Using Tobin's Q as theirmeasure of performance, they report that Q is negatively correlated with ihe frac-tion of inside directors in firms that report high R&D expenditures and positivelycorrelated with the number of outside directors in large firms and in firms withhigh leverage.-'
The second category includes event studies of stock returns around announce-ments of director appointments. Rosenstein and Wyatt (1990), (1997) report thatannouncements of outside director appointments are associated with a significantAR of 0.20% and that announcements of inside director appointments are associ-ated with an insignificant AR. Both of their samples use U.S. companies.
Our analysis falls into a third category in that we use an exogenous changein the environment to study the relation between changes in board compositionand subsequent changes in corporate performance. Prior studies that fall into thiscategory include Schwert (1981), Szewczyk and Tsetsekos (1992), Kole and Lehn(1997), (1999). Brook, Hendershott, and Lee (1998), Coles and Hoi (2003), andothers who study the effect of regulatory changes on economic behavior.
B. The Cadbury Committee
The Cadbury Committee was appointed by the Conservative Government ofthe U.K. in May 1991 with a broad mandate to "... address tbe financial aspectsof corporate governance" (Report of the Committee on the Financial Aspects ofCorporate Governance, 1992, Section 1.8). The Committee, chaired by Sir AdrianCadbury, CEO of the Cadbury confectionary empire, issued its report, tbe cor-nerstone of which was The Code of Best Practice, in December 1992. A keyrecommendation of tbe Code is that boards of publicly traded companies haveat least three non-executive (i.e., outside) directors.* Although the Code has notbeen enacted into law, it does have tbe implicit backing of the U.K. government.Additionally, tbe London Stock Exchange (LSE) requires that any listed companythat does not comply with the Code issue a statement indicating that tbe companyis not in compliance and explaining why it is not.
As reported in DMT (2002), from 1989 through 1992 for a random sampleof 460 LSE firms, the average size of the board of directors was 5.7 memberswith a median of 5.0. Over 1993-1996, the mean board size was 7.3 members
•'The main concern of CDN (2007) is tlie deierminanlK of board composilion. They argue ihatboard composilion will be a function of the advising and oiher requirements of the hnn's management.
••Among other things, the Code also recommended that the positions of CEO and COB be heldby two different individuals. We briefly report the results of our analyses of the e£fecl of splitting thepositions of COB and CEO in Section VII.
540 Journal of Financial and Quantitative Analysis
with a median of 7.0. Over the same two periods, the proportion of outside di-rectors increased from an average of 35% to an average of 46%. Thus, over Iheyears immediately preceding issuance of the Cadbury Report, the average boardbad just under two outside directors. In comparison, over tbe years immediatelyafter tbe issuance of the Report, tbe average board bad about 3.3 outside direc-tors. Tbese statistics indicate that publication of the Code is associated with asignificant increase in the presence of outside directors on U.K. boards.
Arguably, publication of the Code of Best Practice in the U.K. touched off anexplosion of similar codes elsewhere. A commonality of such codes is that tbeyspecify a minimum standard for the representation of outside directors on boardsof publicly traded companies. Sometimes tbese minima are framed as a minimumnumber of outside directors (Australia, Belgium, Denmark, India, New Zealand,Portugal, Russia, Sweden, and Tbailand). sometimes they are framed as a min-imum fraction of outside directors (Brazil, China, Czech Republic, Greece, In-donesia, Japan, Kenya. Mexico, Poland, Singapore, and Switzerland), and some-times they specify both a minimum number and a minimum fraction of outsidedirectors (Cyprus, France, Iceland, Malaysia, South Africa, and South Korea).
III. Sample and Data
The satnple we use in our analysis is tbe universe of industrial companies(witb data on board composition and certain financial information) listed on tbeLSE over tbe period 1989 tbrough 1996.̂ In tbe aggregate, the sample includes1,124 firms that enter tbe analysis with at least one year of data.^
We split the sample into three mutually exclusive groups: i) the set of firmstbat bad at least three outside directors every year in which they were listed on tbeLSE over the period 1989--1996 (we call this the always-in-compliance set, 336firms); ii) the set of firms that never had more than two outside directors any yearin which tbey were listed over the period 1989-1996 (we call this tbe never-in-compliance set, 279 firms); and iii) the remaining set of firms that comprises thosethat added a sufficient number of outside directors so as to come into compliancewith tbe Cadbury recommendation of at least three outside directors any yearduring tbe interval 1989-1996 (we call this the adopted-Cadbury set̂ 509 firms).To determine into which set to classify a firm, we collected the number of outsidedirectors and the total number of directors each year for each LSE firm from tbeStock Excbange Yearbook. In principle, a firm could fall out of compliance, thusgiving rise to a fourth interesting group. In practice, over tbe period of our study,we find no firms that fall out of compliance.
We employ accounting earnings and stock prices to measure corporate per-formance. We use ROA as our measure of accounting earnings. For eacb firm inthe sample, for each year for which data are available, we calculate ROA as earn-ings before depreciation, interest, and taxes divided by tbe begin ning-of-tbe-year
-''Thus, we exclude financial firms.^We idenlified 1,681 industrial companies listed on the LSE over the period 1989 through 1996.
Of these. 344 were dropped due to insufficient accounting daui to calculate ROA; 213 were dmppcdbecause neither the Stock Exchange Yearbook nor the Corporate Register identified whether boardmembers were outsiders.
Dahya and McConnell 541
total assets. For each firm, accounting data are taken from Datastream each yearfor wbich such data are available from 1986 through 1999. Stock prices used inour event study are also from Datastream. Each firm is identified according to itsFinancial Times Industry Classification (FTIC). Because firms enter and exit thesample for various reasons, the number of firms differs from year to year. For anyyear for which a firm has the requisite data, the firm is included in our analysis.
Sununary statistics on board size, outside directors, total assets, and marketvalue of equity along with the number of firms in tbe sample each year are pre-sented in Table I for the three sets of firms. Pane! A is the adopted-Cadbury set;Panel B is the always-in-compliance set; and Panel C is the never-in-complianceset. The average firm in the adopted-Cadbury set shows a marked increase inboard size from 6.8 members in 1989 to 8.2 members in 1996. The always-in-compliance set is relatively constant in terms of board size witb about 8.2 mem-bers (which is the ending board size for the adopted-Cadbury set). The never-in-compliance set exhibits a mild increase from 6.5 to 7.1 members. Thus, in termsof board size, this set is close to the beginning point for the adopted-Cadbury setthroughout the time interval considered.
By definition, the adopted-Cadbury set will end up with a larger number ofoutside directors than it began with, and also exhibits an increase in the fraction ofoutside directors from 26.4%' to 44.9%. Thus, the typical board increased by 1.4members and the number of outsiders by 1.8 members. For the most part then,firms complied with the Cadbury recommendation by adding outside directorsrather than replacing insiders with outsiders. As might be expected, these statis-tics show their largest increase between year-ends 1992 and 1993. The fractionof outsiders also exhibits a relatively large increase from year-end 1991 to year-end 1992 that may reflect anticipation of the Cadbury Report on the part of somefirms.^ In contrast, in terms of board composition, the always-in-compliance setis relatively stable—it begins witb an average of 42.1% outside directors and endswith 45.7%. The never-in-compliance set shows a mild increase in the fractionof outside directors, but does not rise to the level of the other two sets—it beginswith 16.7% and ends with 21.5%. Finally, in terms of market value of equity andbook value of assets, on average, firms in the adopted-Cadbury set are smallerthan those in die always-in-compliance set and larger than those in the never-in-compliance set.
IV. Analysis and Results
A. Operating Performance: An Overview
The statistic tbat we employ for presenting our results is the trimmed meanof the distribution of ROA, wbere the distribution is trimmed at the 1 % and 99%levels. Henceforth, unless we state otherwise, we refer to this statistic as the meanof tbe distribution. We also conduct each of our analyses using medians. Sufficeit to say here and as we comment in Section VIIl, in all cases results based onmedians support those based on irimmed means.
'An initial draft of the Code was issued for comments in May 1991. After various revisions, thefinaJ report was published in December 1992.
542 Journal of Financial and Quantitative Analysis
TABLE 1
Financial and Board Characteristics for U.K. Industrial Firms Listed on the LSE (1989-1996)
Descriptive statistics tor U.K. industrial firms (witin data on board composilion and financial information) lisled on the LSEover the period 1989 tiifough 1996. in the aggregate, the sample includes 1,! 24 firms Ihat enter rhe analysis with at leastone year ot data. The sampie is spiit into Ihree mutualiy exclusive g:oups: the set of firms that had at least 3 outsidedirectors every year in which they were iistett on the LSE over the penoa 1989 through 1996 (the always-in-compliancefirms), the set of firms that never had more than 2 outside directors any year in which they were listed over the period1989 through 1996 (the neuer-in-compliance firms), and the remaining set of firms which compnse those that added asufficient number of outside directors so as to come into compliance with the Cadbury Committee recommendation of atleast 3 outside directors any year dunng 1989 through 1996 (the adopted-Cadbury firms) To determine into which set tociassify a firm, we identified the number ot outside directors each year tor each firm from Ihe Stocti Exchange Yearbook.Accounting information and share prices are taten from Datastream Return on assets (ROA) is caicuiated as earningsbefore interest, taxes, and depreciation divided by begi nn ing-ot year total book vaiue of assets.
Year
Variabie 1989 1990 1991 1992 1993 1994 1995 1996
Panel A. AdaptBd-Cadbury Firms
Sample size
Percenlage ot firms incompliance at year-end
Board size (mean)
Percentage of outside directors(mean)
Book uaiue of assets(mean in millions)
Market value ot equity[mean in miilions)
321
3%
6.8
26 4%
£194.2
£219.5
Panel B. Always-in-CompllancB FirmsSample size
Board size (mean)
Percentage of outside directors(mean)
Book value ct assets(mean in millions)
Market value of equity(mean in millions)
204
8.!
42.1%
£547.7
£620.2
Panel C. Never-in-Compliance Firms
Sample size
Board size (mean)
Percenlage of outside directors(mean)
Book value ot assets(mean m millions)
t^arket value of equity(mean in millions)
175
6.5
16.7%
£221.2
£97.5
373
9%
6,8
26 5%
£149.4
£226.6
240
8.1
44 3%
£602.6
£448.7
190
6.3
16.0%
£256.0
£86.2
395 434 445 463 452 440
15% 25% 54% 75% 89% 100%
6.S 7.0 7.9 8.1 8.2 8.2
27.1% 29.6% 38.9% 40.3% 42.7% 44 9%
£186.4 £215 8 £262.5 £285.6 £312.6 £370 6
£247.9 £277.3 £299.9 £293.6 £322.8 £342.0
237 254 245 284 273 286
8.1 8.1 8.3 8.4 8.4 8.5
45.07o 43.4% 42.5% 44 1% 44.1% 45.7%
£684.9 £741 8 £670.6 £644.9 £740.6 £747.8
£563.7 £ 613.6 £736.4 £682.3 £771.5 £904.4
182 193 192 190 182 176
6.2 65 6.8 70 7.0 7.1
17 7% 18.5% 19,d% 20.1% 21.3% 21.5%
£264.5 £252.7 £247.0 £211.4 £242.2 £231.6
£92.2 £91.8 £100.5 £107.3 £139.6 £134.1
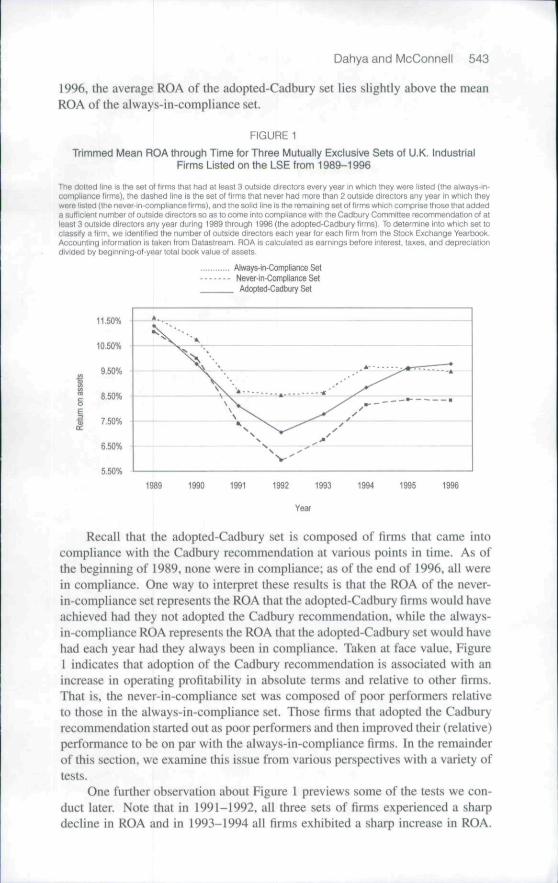
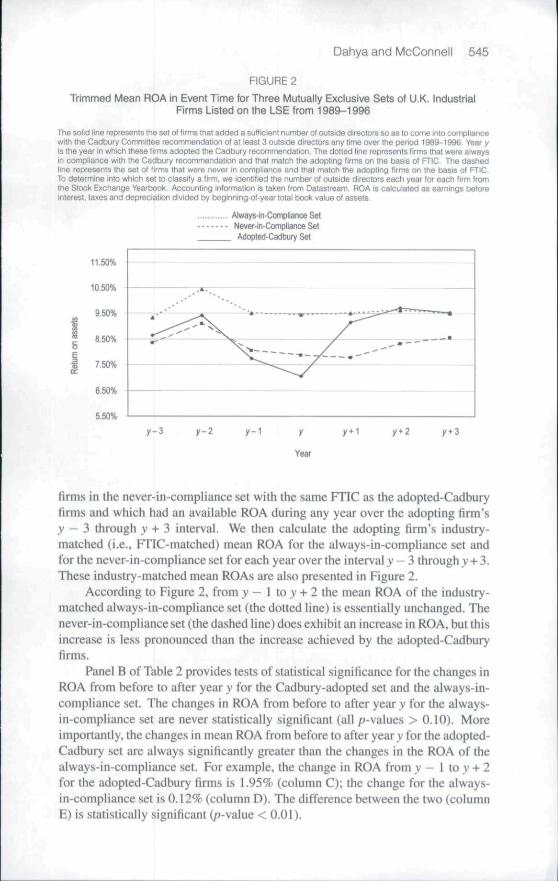
Figure 1 provides an overview of the operating performance of the three setsof firms over the period 1989 through 1996. The figure gives the time-series meanROA for each set of firms. Fir.st, as the figure shows, in each year the average ROAof the always-in-compliance set (the dotted line) lies above the average ROA ofthe never-in-compliance set (the da.shed line). The difference between the tworanges from 0.6% (in 1989) to 2.6% (in 1992), suggesting that firms with three ormore outside directors tend to outperform firms with fewer than three outside di-rectors. Second, and more interestingly, the average ROA of the adopted-Cadburyset (the solid line) starts out in 1989 at the same level as the never-in-complianceset and progressively moves toward the mean of the aiways-in-compliance set. By
Dahya and McConnell 543
1996, the average ROA of the adopted-Cadbury set lies slightly above the meanROA of the always-in-compliance set. '
FIGURE 1
Trimmed Mean ROA through Time for Three Mutually Exclusive Sets of U.K. IndustrialFirms Listed on the LSE from 1989-1996
The doited line is the sei of firms that had at least 3 outside directors every year In which they were listed (Ihe always-tn-compiiance firms), the dashed line is the set o( firms that never had more than 2 outside directors any year In which theywere listed (the never-in-compliaricefirmsl, and the solid lineis the remaining set of firms which comprise those that addeda sufficient number of outside directors so as to come into compliance with the Cadbury Committee recommendation of atleast 3 outside directors any year during 1989 through 1996 (the adopted-Cadbury firms) To determine into which set toclassify a firm, we identified the number ol outside directors each yeai for each firm fiom ttie Stock Exchange Yearbook,Accounting information is taken from Datasiream, ROA is calculated as earnings before interest, taxes, and depreciationdivided by beginning-of-year total book value of assets.
Atways-in-Compliance SetNever-in-Compliance SetAdopfed-Cadbufy Set
sets
1
11.50%
10.50%
9.50%
B.50%
7.50%
6.50%
5.50%
N
N
1990 1991 1992 1993 1994 1995 1996
YSV
Recall that the adopted-Cadbury set is composed of firms that came intocompliance with the Cadbury recommendation at various points in time. As ofthe beginning of 1989, none were in compliance: as of the end of 1996, all werein compliance. One way to interpret these results is that the ROA of the never-in-compliance set represents the ROA that the adopted-Cadbury firms would haveachieved had they not adopted the Cadbury recommendation, while the always-in-compliance ROA represents the ROA that the adopted-Cadbury set would havehad each year had they always been in compliance. Taken at face value. FigureI indicates that adoption of the Cadbury recommendation is associated with anincrease in operating profitability in absolute terms and relative to other firms.That is. the never-in-compliance set was composed of poor performers relativeto those in the always-in-compliance set. Those firms that adopted the Cadburyrecommendation started out as poor performers and then improved their (relative)performance to be on par with the always-in-compliance firms. In the remainderof this section, we examine this issue from various perspectives with a variety oftests.
One further observation about Figure I previews some of the tests we con-duct later. Note that in 1991-1992, all three sets of firms experienced a sharpdecline in ROA and in 1993-1994 all firms exhibited a sharp increase in ROA.
544 Journal of Financial and Quantitative Analysis
This time period happens to coincide with publication of the Cadbury Report andwith an increase in outside directors as Table 1 shows. We investigate whether thecoincidental occurrence of these two events might explain our results.
B. Changes in ROA from before to after Adoption of the CadburyRecommendation in Comparison with Industry-Matched Benchmarks
We now examine changes in operating performance from before to afteradoption of the Cadbury recommendation for the adopted-Cadbury firms in com-parison with various henchmarks. In these analyses, we refer to the year in whicha firm adopted the recommendation as event year y, year v + I is event year y+i,and so forth. (Year v is the calendar year in which a firm that previously had lessthan three outside directors increases the number of outside directors to three ormore. During event year y+l, the Hrm had three or more outside directors for all12 months.)
We present certain of the results in graphical form in Figures 2 and 3. Uni-variate tests of statistical significance are reported in the accompanying Tables 2and 3.
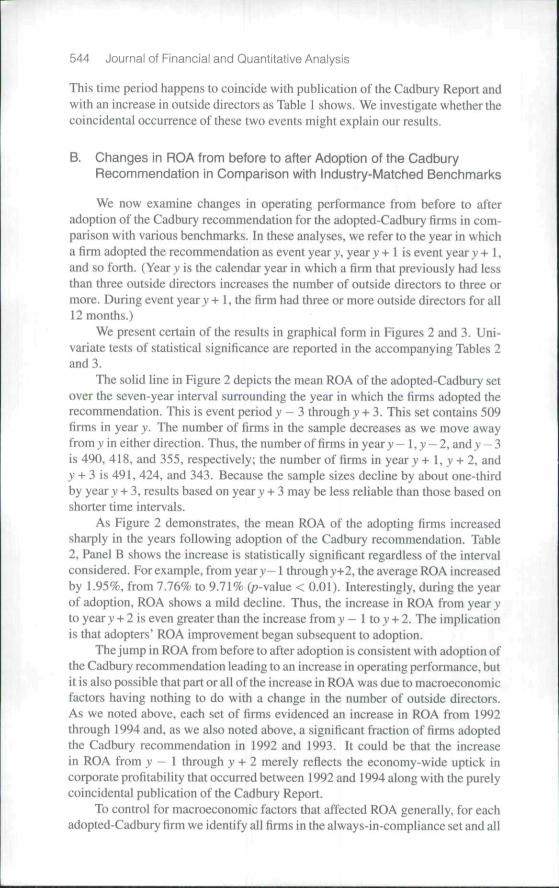
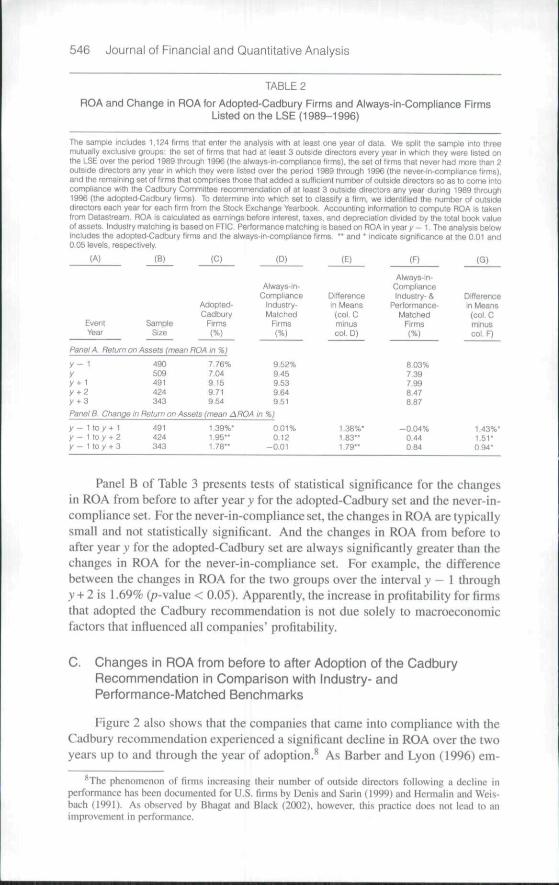
The solid line in Figure 2 depicts the mean ROA of the adopted-Cadbury setover the seven-year interval surrounding the year in which the firms adopted therecommendation. This is event p)eriod y - 3 through v + 3. This set contains 509firms in year y. The number of firms in the sample decreases as we move awayfromy in either direction. Thus, the number of firms in year y - l , y - 2 , a n d y - 3is 490, 418, and 355, respectively; the number of firms in year y + 1, y -t- 2, andy + 3 is 491, 424, and 343. Because the sample sizes decline by about one-thirdby year y + 3, results based on year y + 3 may be less reliable than those based onshorter time intervals.
As Figure 2 demonstrates, the mean ROA of the adopting firms increasedsharply in the years following adoption of the Cadbury recommendation. Table2, Panel B shows the increase is statistically significant regardless of the intervalconsidered. Forexample, from yeary—1 through y-»-2. the average ROA increasedby 1.95%, from 7.76% to 9.71% (/7-value < 0.01). Interestingly, during the yearof adoption, ROA shows a mild decline. Thus, the increase in ROA from year yto yeary + 2 is even greater than the increase from y — 1 to y + 2. The implicationis that adopters' ROA improvement began subsequent to adoption.
The jump in ROA from before to after adoption is consistent with adoption ofthe Cadbury recommendation leading to an increase in operating performance, butit is also possible that part or all of the increase in ROA was due to macroeconomicfactors having nothing to do with a change in the number of outside directors.As we noted above, each set of firms evidenced an increase in ROA from 1992through 1994 and, as we also noted above, a significant fraction of firms adoptedthe Cadbury recommendation in 1992 and 1993. It could be that the increasein ROA from y - 1 through y + 2 merely reflects the economy-wide uptick incorporate profitability that occurred between 1992 and 1994 along witb the purelycoincidental publication of the Cadbury Report.
To control for macroeconomic factors that affected ROA generally, for eachadopted-Cadbury firm we identify all firms in tbe always-in-compliance set and all
Dahya and McConnell 545
FIGURE 2
Trimmed Mean ROA in Event Time for Three Mutually Exclusive Sets of U.K. IndustrialFirms Listed on the LSE from 1989-1996
The solid line represents the set ol firms that added a suHjcieni number ot outside difectors so as to come into comptiancewith the Cadbury Committee recommendation ol at least 3 outside directors any time over the period 1989-1996. Year yis the year in which these tifms adopted the Cadbury recommendation. The dotted line represents firms that were alwaysin compliance with the Cadbury recommendation and that match the adopting lirms on the basis ol FTIC. The dashedline represents the set of firms that were never in compliance and that match the adopting firms on tne basis of FTIC.To determine into which set to classify a (irm, we identilied the number ol outside directors each year (or each firm Ifomthe Stock Exchange Yearbook. Accounting information is taken from Oatastream. ROA is calculated as earnings beforeinterest, taxes and depreciation divided by begrnning-ot-year total book value of assets.
Always-in-CompliancG SetNever-in-ComplJance SetAOopted-Cadbury Sel
11.50%
10.50%
9.50%
8.50%
7.KI%
6,50%
5.50%
y -3 y-2 y -1 y
Year
firms in the never-in-compliance set with the same FTIC as the adopted-Cadburyfirms and wbich had an available ROA during any year over the adopting firm'sy - 3 through y + 3 interval. We then calculate the adopting firm's industry-matched (i.e., FTIC-matched) mean ROA for the always-in-compliance set andfor the never-in-compliance set for each year over the interval y — 3 through y + 3.These industry-matched mean ROAs are also presented in Figure 2.
According to Figure 2, from y — 1 to y -i- 2 the mean ROA of the industry-matched always-in-compliance set (the dotted line) is essentially unchanged. Thenever-in-compliance set {the dashed line) does exhibit an increase in ROA. but thisincrease is less pronounced than the increase achieved by the adopted-Cadburyfirms.
Panel B of Table 2 provides tests of statistical significance for the changes inROA from before to after year y for tbe Cadbury-adopted set and tbe always-in-compliance set. The changes in ROA from hefore to after year y for the always-in-compliance set are never statistically significant {all /j-values > O.IO). Moreimportantly, the changes in mean ROA from before to after yeary for the adopted-Cadbury set are always significantly greater than the changes in the ROA of thealways-in-compliance set. For example, the change in ROA from y - 1 to y + 2for the adopted-Cadbury firms is 1.95% (column C); the change for the always-in-compHance set is 0.12% (colunm D). The difference between the two (columnE) is statistically significant {/J-value < 0.01).
546 Journal of Financial and Quantitative Anaiysis
TABLE 2
ROA and Change in ROA for Adopted-Cadbury Firms and Always-in-Compliance FirmsListed on the LSE (1989-1996)
The sample includes 1,124 tirms Ihat enter the analysis with at leasi one year of data. We split the sample into threemutually exclusive groups the set of firms that had at least 3 outside directors every year in which they were Nsted onthe LSE over the period 1989 through 1996 (the always-in-compliance firms), Ihe set of firms that never had more than 2outside directors any year in which they were Iisted over the period 1989 through 1996 (the never-in-compliance firms),and the remaining set of firms thai comprises those that added a sufficient number of outside di'eotors so as to come intocompliance with the Cadbury Committee recommendation of at least 3 outside directors any year during 1989 tlirough1996 (the adopted-Cadbury firms). To determine into which set to classify a firm, we Identified the number of outsidedirectors each year tor each firm from tfie Stock Exchange Yearbook Accounting information to compute ROA is takenfrom Datastream. ROA is calculated as earnings before interest, taxes, and depreciation divided by the total book valueof assets. Industry matching is based on m C . Performance matching is based on ROA in year y - t The analysis belowincludes the adopted-Cadbury tirms and the always-in-compliance firms. " and " indicate significance at the 0.01 and0 05 levels, respectively.
(A) (B) (C) (D) (E) (F) (G)
Event>iear
SampleSize
Adopted-Cadbury
Firms(%)
Panel A. Return on Assets (mean ROA in %}
y - 1yy + 1y + 2y + 3
490509491424343
7,76%7,049,159,719.54
Always-in-compliance
Industry-Matched
Firms(%)
9,52%9,459.539,649,51
Panel B. Change in Return on Assets (mean A ROA in %j
y - 1 to / + 1y - 1 to y + 2y - 1 to y + 3
491424343
1,39%-1,95"1,78--
0,01%0,12
-0,01
Differencein Means(col Cminuscol.O]
1.38%-1,83"1.79"
Always-in-complianceIndustry- &
Performance-Matched
Firms(%)
8.03%7.397.998.478.87
-0.04%0.440.84
Differencein Means{coLCminuscol, F)
1.43%-1,51-0,94-
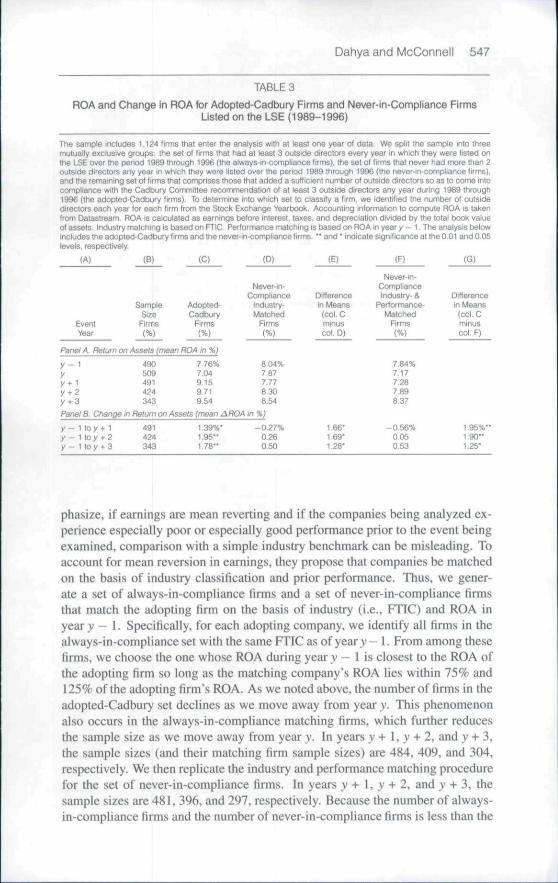
Panel B of Table 3 presents tests of statistical significance for the changesin ROA from before to after year y for the adopted-Cadbury set and the never-in-compliance set. For the never-in-compliance set, the changes in ROA are typicallysmall and not statistically significant. And the changes in ROA from before toafter year v for the adopted-Cadbury set are always significantly greater than thechanges in ROA for the never-in-compliance set. For example, the differencebetween the changes in ROA for the two groups over the interval v - 1 throughy + 2 is 1.69% {p-value< 0.05). Apparently, the increase in profitability for firmsthat adopted the Cadbury recommendation is not due solely to macroeconomicfactors that infiuenced all companies' profitability.
C. Changes in ROA from before to after Adoption of the CadburyRecommendation in Comparison with Industry- andPerformance-Matched Benchmarks
Figure 2 also shows that the companies that came into compliance with theCadbury recommendation experienced a significant decline in ROA over the twoyears up to and through the year of adoption.** As Barber and Lyon (1996) em-
''The phetiotnenon of firms increasing their tiumber of outside directors following a decline inperformance has been documented for U,S. firms by Denis and Sarin (1999) and Hermalin and Weis-bach (1991), As observed by Bhagat and Black (2002). however, this practice does not lead to animprovement in performance.
Dahya and McConnell 547
TABLE 3
ROA and Change in ROA for Adopted-Cadbury Firms and Never-in-Compliance FirmsListed on the LSE (1989-1996)
The sample Includes 1,124 firms that enter ihe analysis with at least ohe year of data. We split the sample into threemutually exclusive groups: the set of firms that had at least 3 outside directors every year in which they were listed onthe LSE over the period 1989 through 1996 (the always-in compliance firms), the set of lirms that never had more than 2outside directors any year in which they were listed over the period 1989 through 1996 (Ihe never-in-compliance firms),and the remaining set of firms that comprises those that added a suflicient number ol outside directors so as to come intccompliance with Ihe CaObury Committee recommendation of al least 3 outside directors any year during 1989 through1996 (the acJopted-Cadbury firms). To determine into which set to classify a firm, we identified the number of outsidedirectors each year tor each firm from ihe Stock Exchange Yearbook. Accounting information to compute ROA is takenfrom Datastream ROA is caiculated as earnings before interest, laxes, and depreciation divided by the total book valueof assets Industry matching is based on FTIC Performance matching is tiased on ROA in year y - 1. The analysis belowincludes the adopled-Cadbury firms and ihe never-in-compliance firms. '" and " indicate significance at the 0.01 and 0,05levels, respectively.
(A) (B) (C) (D) (E) (F) (G)
EventYear
SampleSize
Firms(%)
Adopted-Cadbury
Firms(%)
Panel A Relurn on Assets (mean ROA in %)
y - 1
y + 1y + 2y t 3
4905D&49t424343
7,76%7,049.159719.S4
Never-in-Compiiance
Iridustry-Matched
Rrms(%)
8.04%7B77.778.308.54
Pane'S. Change In Relurn an Assets (mean AROA in %}
y - 1 to y + 1y - 1 t o y + 2/ - 1 to y + 3
491424343
1,39%*1.95"1,78"
-0,27%0,260.50
Oilferencein Means
(col. Cminuscol. D)
1 66"1.69-1.28-
Never-in-ComplianceIndustry- &
Perfofmance-Matched
Firms(%)
7.84%7,177.287.898.37
-0,56%0.050.53
DifferenceIn Means
(col, Cminuscol. F)
1.95%"1.90"1,25-
phasize, if earnings are mean reverting and if the companies being analyzed ex-perience especially poor or especially good performance prior to the event beingexamined, comparison with a simple industry benchmark can be misleading. Toaecount for mean reversion in earnings, they propose that companies be matchedon the basis of industry classification and prior performance. Thus, we gener-ate a set of aiways-in-compliance tirms and a set of never-in-compliance firmsthat match the adopting firm on the basis of industry (i.e., FTIC) and ROA inyear y - 1. Specifically, for each adopting company, we identify all firms in thealways-in-compliance set with the same FTIC as of year y - I. From among thesefirms, we choose the one whose ROA during year y — I is closest to the ROA ofthe adopting firm so long as the matching company's ROA lies within 75% and125% of the adopting firm's ROA. As we noted above, the number of firms in theadopted-Cadhury set declines as we move away from year y. This phenomenonalso occurs in the always-in-compliance matching firms, which further reducesthe sample size as we move away from year y. In years y + \, y + 2, and y + 3,the sample sizes (and their matching firm sampie sizes) are 484, 409, and 304,respectively. We then replicate the industry and performance matching procedurefor the set of never-in-compliance firms. In years y + I. y -i- 2. and y + 3. thesampie sizes are 481, 396, and 297, respectively. Because the number of always-in-compliance firms and the number of never-in-compliance firms is less than the
548 Journal of Financial and Quantitative Analysis
number of adopted-Cadbury firms, some of the matching firms enter the analysismore than once, albeit typically in a different calendar year.
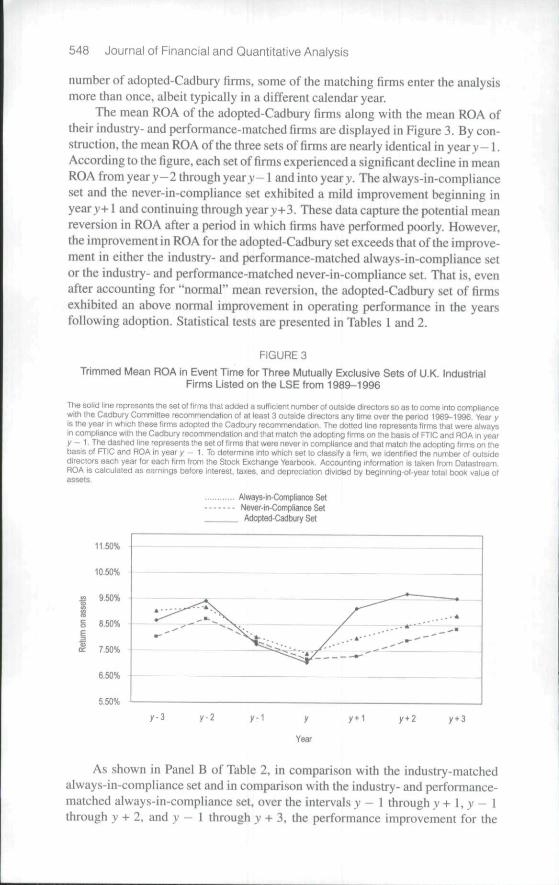
The mean ROA of the adopted-Cadbury firms along with the mean ROA oftheir industry- and performance-matched firms are displayed in Figure 3. By con-struction, the mean ROA of the three sets of firms are nearly identical in yeary-1 .According to the figure, each set of firms experienced a significant decline in meanROA from yeary-2 through yeary-1 and into yeary. The always-in-complianceset and the never-in-compliance set exhibited a mild improvement beginning inyeary+ I and continuing through yeary-i-3. These data capture the potential meanreversion in ROA after a period in which firms have performed poorly. However,the improvement in ROA for the adopted-Cadbury set exceeds that of the improve-ment in either the industry- and performance-matched always-in-compliance setor the industry- and performance-matched never-in-compliance set. That is, evenafter accounting for "normal" mean reversion, the adopted-Cadbury set of firmsexhibited an above normal improvement in operating performance in the yearsfollowing adoption. Statistical tests are presented in Tahles 1 and 2.
FIGURE 3
Trimmed Mean ROA in Event Time for Three Mutually Exclusive Sets of U.K. IndustrialFirms Listed on the LSE from 1989-1996
Tile solid line represents the set ot firms that added a sufticieni number of outside directors so as to come into compliancewith the Cadbury Committee recommendation of at ieast 3 outside directcrs any time over the period 1989-1996 YearyIs the year in which ttiese firms adopted the Cadbury recommendation. The dotted iine represents tirms that were alwaysin compliance wilh the Cadbury recommendation and that match the adopting firms on the basis o( FTIC and ROA in yeary - 1. The dashed line represents the set of lirms that were never in compliance and Ihat match the adopting firms on thebasis o( FTIC and ROA in year y - 1, To determine into which set to classify a firm, we identified the number of outsidedirectors each year for each firm from the Stock Exchange Yearbook, Accounting informaticn is taken from Datastream.ROA is calculated as earnings before interest, taxes, and depreciation divided by Oegifining-of-year total book value ofassets.
Always-in-Compliance SetNever-in-Compliance SetAdopted-Cadbury Sel
y-1 y-1 y
Year
y+1
As shown in Panel B of Table 2, in comparison with the industry-matchedalways-in-compliance set and in comparison with the industry- and performance-matched always-in-compliance set, over the intervals y - 1 through y + 1, y — 1through y -t- 2, and y - 1 through y + 3, the performance improvement for the
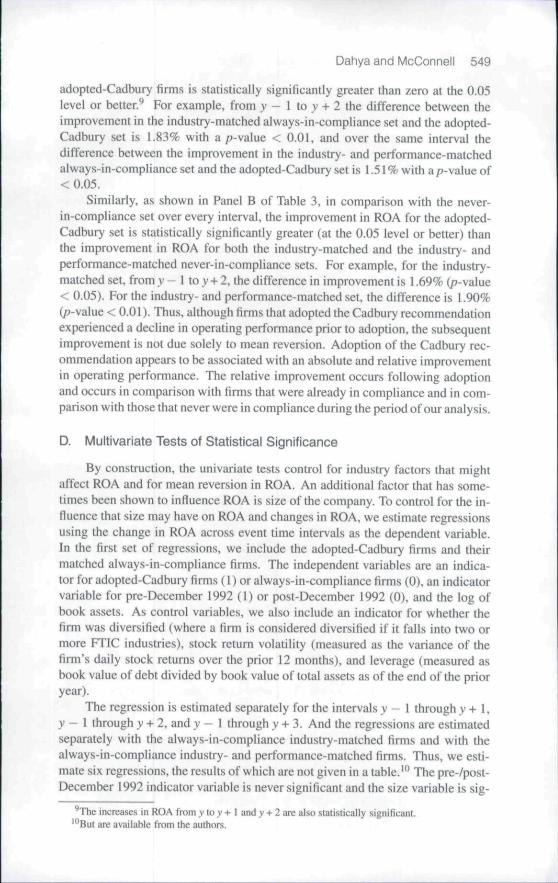
Dahya and McConnell 549
adopted-Cadbury firms is statistically significantly greater than zero at the 0.05level or better.^ For example, from y - I to y + 2 the difference between theimprovement in the industry-matched always-in-compliance set and the adopted-Cadbury set is 1.83% with a /rvalue < 0.01, and over the same interval thedifference between the improvement in the industry- and performance-matchedalways-in-compliance set and the adopted-Cadbury set is 1.51% with a /j-value of< 0.05.
Similarly, as shown in Panel B of Tahle 3, in comparison with the never-in-compliance set over every interval, the improvement in ROA Tor the adopted-Cadbury set is statistically significantly greater (at the 0.05 level or better) thanthe improvement in ROA for both the industry-matched and the industry- andperformance-matched never-in-compliance sets. For example, for the industry-matched set, from y - 1 to y + 2. the difference in improvement is 1.69% (/?-value< 0.05). For the industry- and performance-matched set, the difference is 1.90%(p-value < 0.01). Thus, although firms that adopted the Cadbury recommendationexperienced a decline in operating performance prior to adoption, the subsequentimprovement is not due solely to mean reversion. Adoption of the Cadbury rec-ommendation appears to be associated with an absolute and relative improvementin operating performance. The relative improvement occurs following adoptionand occurs in comparison with firms that were already in compliance and in com-parison with those that never were in compliance during the period of our analysis.
D. Multivariate Tests of Statistical Significance
By construction, the univariate tests control for industry factors that mightaffect ROA and for mean reversion in ROA. An additional factor that has some-times been shown to influence ROA is size of the company. To control for the in-fluence that size may have on ROA and changes in ROA, we estimate regressionsusing the change in ROA across event time intervals as the dependent variable.In the first set of regressions, we include the adopted-Cadbury firms and theirmatched always-in-compliance firms. The independent variables are an indica-tor for adopted-Cadbury firms (1) or always-in-compliance firms {0). an indicatorvariable for pre-December 1992 (1) or post-December 1992 (0), and the log ofbook assets. As control variables, we also include an indicator for whether thefirm was diversified (where a Hrm is considered diversified if it falls into two ormore FTIC industries), stock return volatility (measured as the variance of thefirm's daily stock retums over the prior 12 months), and leverage (measured asbook value of debt divided by book value of total assets as of the end of the prioryear).
The regression is estimated separately for the intervals y - 1 through y + l ,y — 1 through y + 2, and y — I through y + 3. And the regressions are estimatedseparately with the always-in-compliance industry-matched firms and with thealways-in-compliance industry- and performance-matched firms. Thus, we esti-mate six regressions, the results of which are not given in a table.'" The pre-/post-December 1992 indicator variable is never significant and the size variable is sig-
^The increases in ROA from y to v + I and v -»- 2 are also statistically significant,'"But are available from the authors.
550 Journal of Financial and Quantitative Analysis
nificant in about half the regressions. None of the other control variables aresignificant at the 0.05 level in any of the regressions.
We are most interested in the adopted-Cadbury indicator. This variable issignificant at the 0.01 level in five of the six regressions. In the sixth regression,the coefficient is significant at the 0.05 level. Thus, in comparison with firmsthat had at least three outside directors prior to 1989 (the always-in-complianceset) and after controlling for firm size, industry, prior performance, stock returnvolatility, leverage, and whether the firm was diversified, the improvement in op-erating earnings for companies that altered their boards by increasing the numberof outside directors to three or more is significantly greater than zero.
We also estimate a parallel set of regressions using the adopted-Cadburyfirms and the never-in-compliance firms. The coefficient of the adopted-Cadbuiyindicator variable is significant at the 0.01 or better in four of the six regressionsand in the other two it is significant at the 0.05 level."
The multivariate analysis is consistent with the univariate analysis: after con-trolling for industry, pre-adoption performance, asset size, firm diversification,stock price volatility, and debt, compliance with the Cadbury recommendationforeshadowed a significant improvement in corporate earnings.
V. Improvements in Performance: Source of Gains
A. Deccmposition of ROA
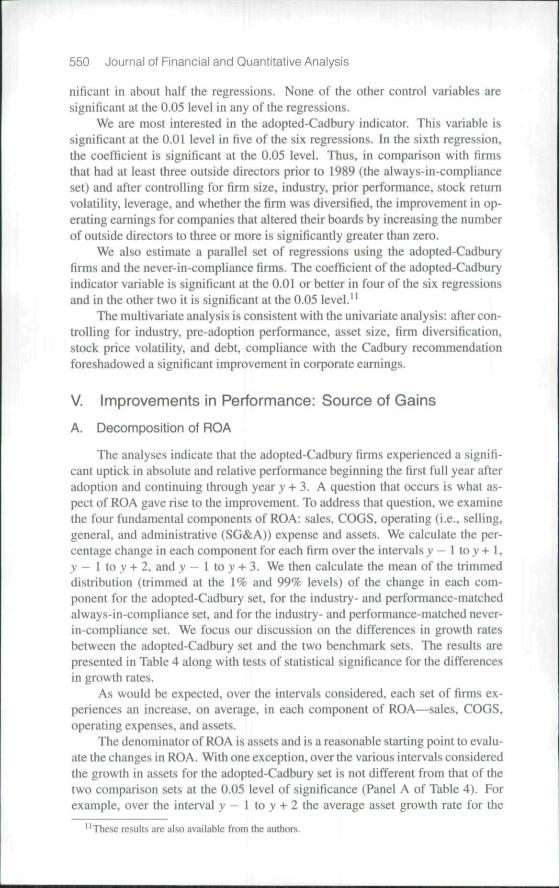
The analyses indicate that the adopted-Cadbury firms experienced a signifi-cant uptick in absolute and relative performance beginning the first full year afteradoption and continuing through year y + 3. A question that occurs is what as-pect of ROA gave rise to the improvement. To address that question, we examinethe four fundamental components of ROA: sales, COGS, operating (i.e., selling,general, and administrative (SG&A)) expense and assets. We calculate the per-centage change in each component for each firm over the intervals y — 1 to y + 1.y — I to y + 2, and y - 1 to y + 3. We then calculate the mean of the trimmeddistribution (trimmed at the 1% and 99% levels) of the change in each com-ponent for the adopted-Cadbury set, for the industry- and performance-matchedalways-in-compliance set, and for the industry- and performance-matched never-in-compliance set. We focus our discussion on the differences in growth ratesbetween the adopted-Cadbury set and the two benchmark sets. The results arepresented in Table 4 along with tests of statistical significance fbr the differencesin growth rates.
As would be expected, over the intervals considered, each set of firms ex-periences an increase, on average, in each component of ROA^sales, COGS,operating expenses, and assets.
The denominator of ROA is assets and is a reasonable starting point to evalu-ate the changes in ROA. With one exception, over the various intervals consideredthe growth in assets for the adopted-Cadbury set is not different from that of thetwo comparison sets at the 0.05 level of significance (Panel A of Table 4). Forexample, over the interval y — 1 to y + 2 the average asset growth rate for the
' ' These results are also available Irom the authors.
Dahya and McConnell 551
adopted-Cadbury firms is 8.5%. This compares with the mean growth rate of8.9% for the always-in-compliance set and 7.6% for the never-in-compliance set.Thus, the relative improvement in ROA for the adopted-Cadbury set is not due tothe shedding of assets.
TABLE 4
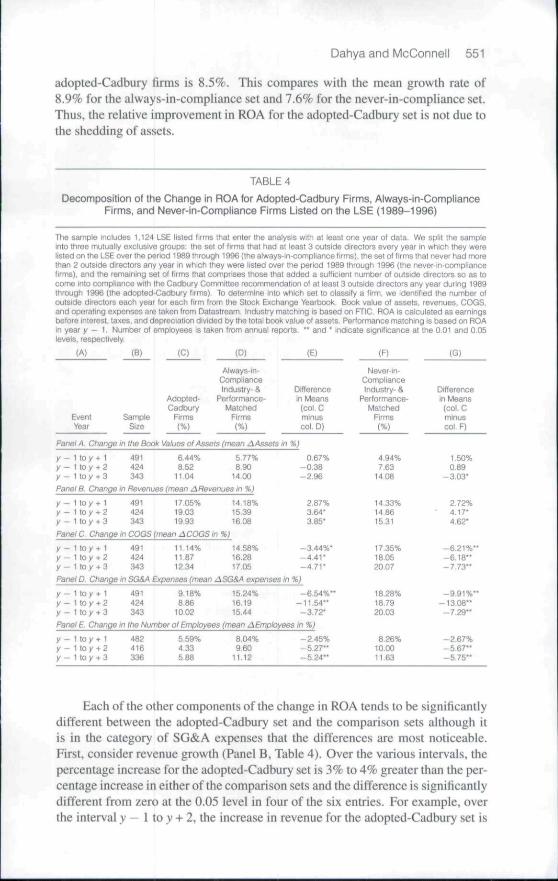
Decomposition of the Change in ROA for Adopted-Cadbury Firms. Always-in-ComplianceFirms, and Never-in-Compliance Firms Listed on the LSE (1989-1996)
The sample includes 1.124 LSE listed firms ihat enter the analysis with at least one year ol data. We split the sampleInto three mutually exciusive groups: the set ot firms that had at least 3 outside directors ewery year in which they werelisted on the LSE over the period 1989 through 1996 [the always-in-compiiance firms), the set of firms thai never had morethan 2 outside directors any year in which they were listed over the period 1969 through 1996 (the never-in-compiiancefirms), and the remaining set of firms that comprises those Ihat added a sufficient number of outside directors so as tocome into compliance wiih the Cadbury Committee recommendation of at least 3 outside directors any year during 1989through 1996 (the adopted-Cadbury firms) To determine into which set to classify a lirm, we identified the number ofoutside directors each year for each firm from the Stock Exchange Yearbook Book value cf assets, revenues, COGS,and operating expenses are taken from Datastream. Industry matching is based on FTIC. ROA is calculated as earningsbefore interest, taxes, and depreciation divided by the total book value of assets. Performance matching is based on ROAin year y - 1 . Number of employees is taken from annual reports. " and ' indicate significance at the 0.01 and 0.05levels, respectively.
(A) (B) (C) (D) (E) (Fl (G)
EventYear
SampleSize
Adopted-Cadbury
Firms(%)
Always-in-CompiianceIndustry- &
Perlormance-Matohed
Firms(%)
Differencein fwleans
(col. Cminuscol, D)
Panei A. Change m Ihe Book Values of Assets (mean AAssels in %}
y - 1 lo y + 1y — Moy + 2y - 1 to y + 3
491424343
6.44%8.52
1104
5.77%8,90
14,M
Panel B. Change in Revenues (mean ARevenues in %)
y — 1 to y + 1y — 1 lo y + 2y - 1 toy + 3
491424343
t7,D5%19,0319,93
14,18%15,3916,08
Panel C. Change in COGS (mean ACOGS in %)
y - 1 to y + 1y - 1 to y + 2y - 1 to y + 3
491424343
11.14%11.8712.34
14.58%16,2a17.05
0,67%-0,38-2,96
2,87%3,64-3.85-
-3.44%'- 4 . 4 1 *- 4 , 7 1 -
Panel D. Change in SGSA Expenses (mean ASG&A expenses in %)
y — 1 to y + 1y - 1 to y t 2y - 1 to y + 3
491424343
9.18%8.86
10.02
15.24%16.1915.44
- 6 . 5 4 % "- 1 1 . 5 4 "
-3-72"
Panel E Change in the Numtier ol Employees (mean AEmpioyees in %)
y — 1 to y t 1y - 1 to y + 2y - 1 to y + 3
482416336
5.59%4.335.88
8 04%9.60
11.12
-2.45%- 5 . 2 7 "- 5 . 2 4 "
Never-in-complianceIndustry- &
Performance-MatcHed
Firms(%)
4.94%7.63
14.08
14.33%14.8615.31
17-35%18.0520.07
18,28%18,7920.03
8,26%10,0011.63
Differencein Means
(col. Cminuscol. F)
1 50%0.89
-3.03-
2.72%' 4.17*
4,62*
- 6 , 2 1 % "- 6 , 1 8 "- 7 , 7 3 "
- 9 . 9 1 % "-13,08**- 7 . 2 9 "
-2.67%- 5 . 6 7 "-5.75**
Each of the other components of the change in ROA tends to be significantlydifferent between tbe adopted-Cadbury set and the comparison sets although itis in tbe category of SG&A expenses that the differences are most noticeable.First, consider revenue growth (Panel B, Table 4). Over the various intervals, tbepercentage increase for the adopted-Cadbury set is 3% to 4% greater tban the per-centage increase in either of the comparison sets and the difference is significantlydifferent from zero at the 0.05 level in four of tbe six entries. For example, overtbe interval v — 1 to y + 2, the increase in revenue for the adopted-Cadbury set is
552 Journal of Financial and Quantitative Analysis
19.0% in comparison with increases of 15.4% for the always-in-compliance setand 14.9% for the never-in-compliance set.
Second, consider COGS (Panel C, Table 4). Here the percentage increase ison the order of 3% to 8% lower for the adopted-Cadbury set than for either of thetwo comparison sets over each of the intervals considered and the difference issignificant at the 0.01 level for three of the six entries and significant af the 0.05level for the other three. For example, over the interval y - I to _y + 2 the increasein COGS for the adopted-Cadbury set is It.9% in comparison with increases of16.3% for the always-in-compliance set and 18.0% for the never-in-complianceset.
Finally, consider SG&A expense (Panel D, Table 4). In this category, thepercentage increases for the adopted-Cadhury set range from 4% fo 13% lowerthan for the other two sets of firms and five of the six differences are significant atthe 0.01 level with the sixth being significant at the 0.05 level. For example, overthe interval y - I to v + 2 the increase in SG&A expense for the adopted-Cadburyset is 8.9% in comparison with increases of 16.2% for the always-in-complianceset and 18.8% for the never-in-compliance set.
In sum. decomposition of ROA into its parts indicates that the improvementin ROA for those firms that complied with the Cadbury recommendation wasnot due to trimming of excess assets. Rather, the improvement appears to havederived from increases in operating efficiency. The efficiency gains show up mostdramatically as cost containment in the area of operating expenses.
B. Number of Employees
Given that the source of the relative improvement in ROA appears to befrom cost containment and much of that appears to be from the containment ofoperating expenses, one place to look for the source of that gain is work forcesize. That is, cost cutting, especially in the short term, often involves reductionsin the "overhead" associated with administrative personnel.
We collected data on the number of employees for each company in our sam-ple from corporate annual reports. With these data, we calculated the percentagechange in the size of each company's work force over the interval > ' - 1 tov+ 1,y— 1 to v + 2, and y — 1 to y + 3. The trimmed means of these percentage changesfor each of our three sets of firms are given Panel E of Table 4. Over each inter-val, the percentage increase in number of employees is significantly lower for theadopted-Cadbury firms than for either set of peers and the difference is significantat the 0.01 level for four of the six entries. For example, over the interval y - I toy + 2 the always-in-compliance firms experienced an increase in the work force of9.6% and the never-in-compliance firms experienced an increase in the work forceof 10.0%. In comparison, the adopted-Cadbury set had a work force increase of4.3%. A reasonable interpretation of these data is that a significant fraction of thecost containment experienced by the adopted-Cadbury firms came about throughcloser management of payroll expenses.
Dahya and McConnell 553
VI. Event Study around Announcements of DirectorAppointments
A. Sample and Methodology
Our analyses of changes in board composition and operating performanceindicate that the addition of outside directors to corporate boards coincided withan improvement in operating performance as measured by ROA. In this section,we perform an event study to analyze stock returns around announcements ofappointments of inside and outside directors to determine whether the addition ofoutside directors showed up as an increase in stock price.'-
To conduct our event study, we use the market model procedure with mar-ket model parameters estimated using daily stock returns over the interval of 153trading days prior to the announcement day through three days prior to that day.We examine market model ARs over the two-day interval that encompasses theday on which the company issued its press release announcing a director appoint-ment and the following day. We conduct two tests of statistical significance: i) a/-test of whether the mean AR is significantly different from zero or whether themeans of two samples are different from each other, and ii) a binomial sign test ofwhether the fraction of positive ARs is significantly greater than 0.50 or whetherthe fraction of positive ARs from two samples are different from each other.
To construct our sample of director appointments, we identified all new di-rectors each year over the period 1989-1996 from the annual corporate reportsof the 1,124 companies in our sample. Many appointments have no effect onboard composition. For example, suppose that in 1994 a board consisted of fourmembers, three of which were insiders and one of which was an outsider. Andsuppose in 1995 the hoard still consisted of four members of which three werethe same insiders as 1994 and the fourth was a different outsider. In this case,we observe the appointment of a new outside director, but the appointment hasno impact on either the number or fraction of outside directors. Because we areinterested in the composition of the board, appointments tbat do not alter the splitbetween insiders and outsiders are dropped from the sample. With this construc-tion, the total number of new directors is 1,988. Of these. 985 are inside directorappointments and 1.003 are outside director appointments. The announcementdate for each appointment of a director is collected from the Extel Weekly NewsSummary. If the company announced the appointment of both an inside and out-side director on the same date, this observation is further excluded from the eventstudy. If the company announced the appointment of multiple outside or multipleinside directors on the same date, this observation remains in the sample. If morethan one inside or outside director is announced on the same day, that observation
'-Because of the Cadbury Reporl, we should nole ihat in this analysis much of the stock priceeffect of moving to three outside directors may have been incorporated into stock prices prior to theannouncements. Thus, whatever stock price effect we find may be attenuated. Consider this proba-bilistic exercise; Suppose thai adopters will increase firm value, non-adopters will have no change itivalue, the market anticipates that proportion SW/l^H will comply, and that 0.44% is ihe market reac-tion assuming attenuation for anticipution. In that case, the full market reaction given no anticipationwould be 1.24%.
554 Journal of Financial and Quantitative Analysis
is included only once. This process leaves 952 outside director and 940 insidedirector appointments.
B. Stock Prices and Appointments of Outside Directors
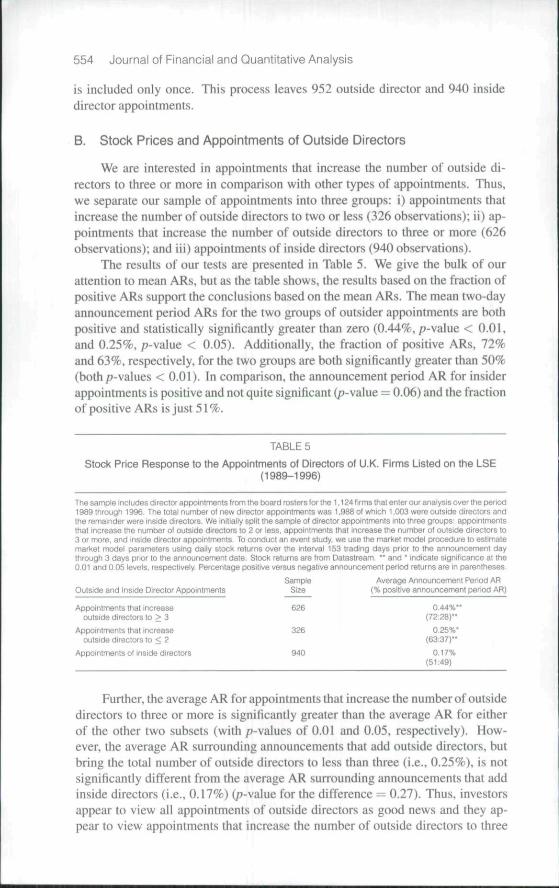
We are interested in appointments that increase the number of outside di-rectors to three or more in comparison with other types of appointments. Thus,we separate our sample of appointments into three groups: i) appointments thatincrease the number of outside directors to two or less (326 observations); ii) ap-pointments that increase the number of outside directors to three or more (626observations); and iii) appointments of inside directors (940 observations).
The results of our tests are presented in Table 5. We give the bulk of ourattention to mean ARs. but as the table shows, the results based on the fraction ofpositive ARs support the conclusions based on the mean ARs. The mean two-dayannouncement period ARs for the two groups of outsider appointments are bothpositive and statistically significantly greater than zero (0.44%, p-value < 0.01,and 0.25%, p-value < 0.05). Additionally, the fraction of positive ARs, 72%and 63%, respectively, for the two groups are both significantly greater than 50%(both p-values < 0.01). In comparison, the announcement period AR for insiderappointments is positive and not quite significant (/J-value — 0.06) and the fractionof positive ARs is just 51%.
TABLE 5
Stock Price Response to the Appointments of Directors of U.K. Firms Listed on the LSE(1989-1996)
The sample includes direclorappointmentsfrorn the board rosters for the !,124tirmsthatenter our analysis over the period1989 through 1996. The total number ol new director appointments was 1,988 of which 1,003 were outside directors andlhe remainder were iriside directors. We initially spiit Ihe sample of director appointments into three groups' appoinlmentsthat increase the number of outside directors to 2 or less, appointments Ihat increase the number ot outside directors to3 or more, and inside director appointments. To conduct an event study, we use the market model procedure to estimatemarket model parameters using dally stock returns over the interval 153 trading days prior to the announoement daythrough 3 days prior to the announcement date. Stock returns are trom Datastream, " and * indicate signiflcanoe at the0.01 and 0.05 levels, respectively Percentage positive versus negative announcement period returns are in parentheses
Sample Average Announcement Period AHOutside and Inside Director Appointments Size (% positive announcement period AR)
Appointments that increase 626 0,44%"outside directors to > 3
Appointments that increase 326 0.25%*outside directors to < 2 (63:37)"
Appointments of inside directors 940 0.17%(51:49)
Further, the average AR for appointments that increase the number of outsidedirectors to three or more is significantly greater than the average AR for eitherof the other two subsets (with p-values of 0.01 and 0.05, respectively). How-ever, the average AR surrounding announcements that add outside directors, butbring the total number of outside directors to less than three (i.e., 0.25%), is notsignificantly differetit from the average AR surrounding announcements that addinside directors (i.e., 0.17%) (/7-value for the difference — 0.27). Thus, investorsappear to view all appointments of outside directors as good news and they ap-pear to view appointments that increase the number of outside directors to three
Dahya and McConnell 555
or more as the best news. These results complement the results from our analysisof operating earnings.
VII. Separating the Positions of CEO and COB
As we noted above, a second component of the Cadbury Report was a rec-ommendation that the positions of COB and CEO not be held by the same in-dividual. We conducted each of our ROA tests separating firms into those thatsplit the positions of CEO and COB, those that always had split CEO and COBpositions, and those that never split the positions over the period of our analy-sis. In no instance, could we reject the null hypothesis that splitting the positionshad an effect on ROA. We also conducted event studies around announcementsthat firms intended to split the positions. Again, in no test could we reject thenull hypothesis that the AR was significantly different from zero. Based uponour evidence, splitting the positions of CEO and COB had no effect on corporateoperating performance or stock prices in the U.K.
These results are most interesting for their lack of any effect. Journalists,politicians, corporate activists, and some academics (e.g., Jensen (1993) and Lip-ton and Lorsch (1992)) have argued that splitting the positions of CEO and COBis an important step in providing improved corporate governance. These com-mentators typically base their claims on the intuition or "common sense" that anindependent COB is likely to provide closer monitoring of the CEO. The evi-dence on this point is at best mixed with Rechner and Dalton (1991) providingsupporting evidence and Brickley, Coles, and Jarreil (1997) providing extensivecounter evidence. Our evidence from the U.K. strongly suggests that splittingthe positions of CEO and COB is unlikely to lead to improved corporate perfor-mance. These results are important because they come from a country outside theU.S. and because we have used a setting in which splitting the positions can beviewed as having arisen from an exogenous shock,
VIII. Sensitivity Analysis
In this section, we discuss certain sensitivity analyses. None of the resultsdiscussed herein are shown in a table, but all are available from the authors.
A. Tests of Operating Performance
We conducted our univariate and multivariate statistical tests of ROA and itscomponents using the mean of the distribution trimmed at the 1% and 99% lev-els. To determine the robustness of these results, we also conducted the tests withmedian changes in ROA. The improvements in ROA were mildly more signifi-cant with medians than with mean changes in ROA. That is, with median ROAthe improvement in performance for the adopted-Cadbury set in comparison withvarious benchmarks generally has lower p-values. We also calculated means trim-ming the distribution at the 0.5% and 99.5% and the 2.0% and 98% levels. Thesignificance of none of the results is changed. We further conducted the analysiswith no trimming. With no trimming, in some cases the mean change in ROA
556 Journal of Financial and Quantitative Analysis
for the adopted-Cadbury firms is not significantly different from the benchmark.That seems to be due to six benchmark firms with extraordinary changes in ROAover some intervals.
In Section IV, we noted that some of the industry- and performance-matchedfirms enter the analysis more than once, albeit usually in different years. We reranall of the tests making sure that each matching firm entered the analysis only once.The significance of the results is unchanged. Thus, our ROA results appear to berobust.
B. Event Study of Stock Prices
To determine whether the results of our stock price event study are robust, weemployed announcement periods of various lengths. We also estimated the mar-ket model parameters over various pre-event intervals. Finally, we used simplemarket-adjusted retums in which the AR was calculated as the difference betweenthe return of the subject stock and the return of a simple equal-weighted marketindex. The event study results are robust to the length of the announcement periodconsidered, the interval used to estimate market model parameters, and whetherwe use the market model or a simple market adjusttnent to calculate ARs.
IX. Commentary
A. Endogeneity
As we noted at the outset, one concern with studies of board compositionand corporate performance is that the two phenomena may be endogenously de-termined outcomes of a simultaneous process (Hermalin and Weisbach (2003)).We have taken various steps to reduce that concern. First, we use publication ofthe Cadbury Report as the date for centering our analysis. That report witnessedsubstantial changes in board composition across U.K. firms that appear unlikelyto have been undertaken completely voluntarily. Testimony to that observation isgiven by the bristling response of various corporate executives to the recommen-dations contained in the Report.'^ Further, over the period 1991-1994, roughly40% of all firms that did not have three outside directors prior to that date movedto having three outside directors. As best we can determine, none of these firmshad ever had three outside directors previously. Furthermore, these firms hadlong histories of operating with fewer than three outside directors; on average,these Cadbury-adopters had been listed on the LSE for 18 years prior to adoption.These observations also strongly suggest that Cadbury adoption was not purelyvoluntary. Finally, of the 845 firms that became Cadbury-compliant during ourperiod of analysis or were in compliance as of the beginning of 1993, none re-verted to less than three outside directors following publication of the CadburyReport. This, too, points to the reasonable presumption that changes in boardcomposition were not totally endogenous during the period of our study.
'^As in, for example, "Self Regulation as lhe Way Forward." Financial Times. May 28. 1992 and"Cadbury Commiltee Draft Orders Mixed News for Shareholder." Financial Times, June 2. 1992.
Dahya and McConneil 557
Second, in all of our analyses, we use changes in board composition andchanges in ROA and we lag change in ROA as a function of the change in boardcomposition. These steps should also allay concerns about endogeneity being thecause of our results.
Nevertheless, we take several further steps to address such concerns. First,using results from contemporaneous studies of U.S. firms as a guide, we estimatea logit model of the determinants of whether an LSE firm has three or more out-side directors. We then insert an indicator variable into the regression to identifypost-December 1992 observations. Significance of this variable implies that pub-lication of the Cadbury Report had an independent effect on board compositionafter controlling for various factors that have been shown to influence board struc-ture in the U.S. The contemporaneous studies of U.S. firms include Linck, Netter,and Yang (2007). Boone, Field, Karpoff, and Raheja (2007). CDN (2007), andLehn, Patro, and Zhao (2007).
The sample used in this regression includes all firm-years for which we havedata over the interval 1989-1996 for ail three sets of firms. The dependent variableis a 1/0 indicator set to 1 for all observations for which the firm has three ormore outside directors. The independent variables include a proxy for firm age{the number of years that a firm has been listed on the LSE prior to the year ofobservation), a diversification proxy (an indicator set to 1 if identified as being intwo or more FTIC business segments), firm risk (measured as the variance of thefirm's daily stock retums over the prior 12 months), firm size (measured as the logof book assets as of the beginning of the year), debt (measured as the log (bookdebt divided by book assets) as of the beginning of the year), and firm market-to-book ratio (measured as log of book debt plus market value of equity dividedby book assets as of the beginning of the year). The regression also includes yearand FTIC two-digit industry indicators.
The results of this regression are given in the first column of Table 6. Thecoefficients of firm age, log (assets), and leverage are positive and significant (p-values < 0-05). The coefficient of the diversification indicator is also positive witha p-value of 0.06. These results are broadly consistent with the results from theU.S.-based studies cited above. Most importantly for the purposes of our studythe coefficient of the post-December 1992 indicator is positive and significant(/j-value — 0.04). Thus, after controlling for fundamental factors that have beenshown to be predictors of board composition elsewhere, LSE firms were morelikely to have at least three outside directors after Cadbury than before. Thisresult is consistent with the Cadbury Report having had an exogenous effect onboard composition.
A second way to address this question is to examine only firms that werenot in compliance with the Cadbury Report as of year-end 1992 and ask whethereconomic factors that infiuence board composition can predict whether a firm sub-sequently adopts the Cadbury recommendation. Thus, we estimate a regressionusing only those firms that had fewer than three outside directors as of December1992. (These are the adopted-Cadbury set and the never-in-compliance set.) Withthese firms, we estimate a logit regression in which the dependent variable is a1/0 indicator set to 1 if a firm moves to three or more outside directors over theperiod 1993-1996.
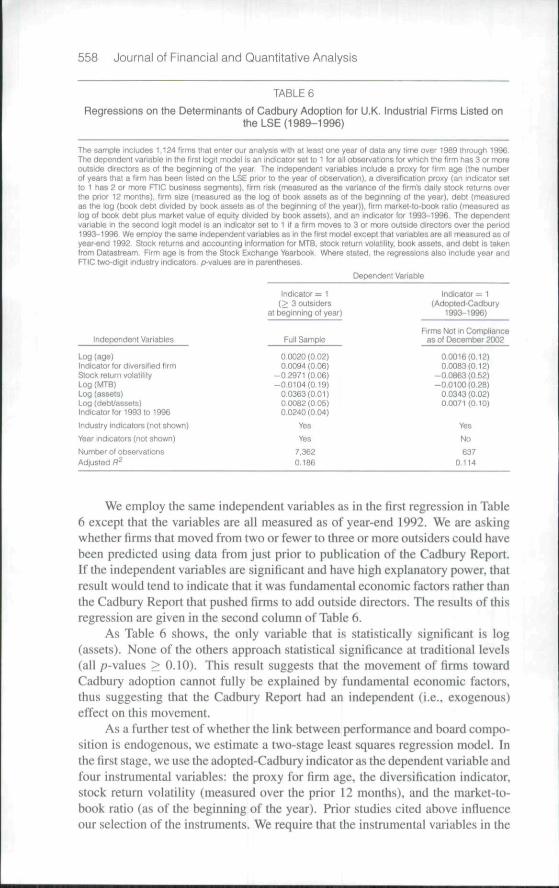
558 Journal of Financial and Quantitative Analysis
TABLE 6
Regressions on the Determinants of Cadbury Adoption for U.K. Industrial Firms Listed onthe LSE (1989-1996)
The sample includes 1,124 firms that enter out analysis wilh a[ ieasi one year ot cJaia any lime over 1989 through 1996.The dependent variable in the tirst logit model is an indicator set to 1 tor ail observations tor which the firm has 3 or moreoutside directors as of the beginning of the year. The independent variables include a proxy (or firm age (the numberof years that a firm has been listed on the LSE prior to the year of observation), a diversification proxy (an indicator setto 1 has 2 or more FTIC business segments), firm risk (measured as the variance of the firm's daily stock returns overtfie prior 12 months), tirm size (measured as the log of book assets as ot the beginning ot the year), debt (measuredas the log (book debt divicted by book assets as of the beginning of the year)), firm market-to-book ratio (measured aslog of book debt plus market value of equity divided by book assets), and an indicator for 1993-1996. The dependentvariabie in the second logit model is an indicator set to 1 if a firm moves lo 3 or more outside directors over the period1993-1996. We employ the same independent variables as in the tirst model except that variables are all measured as otyear-end 1992 Stock returns and accounting intormation for fvlTB, stock return volatility, book assets, and debt is takenfrom Datastream Firm age is from Ihe Stock Exchange Yearbook Where stated, the regressions also include year andFTIC two-digit industry indicators, p-vaiues are in parentheses.
Independent Variables
Log (age)Indicator tor diversified firmStock return volatilityLog (MTB)Log (assets)Log (debt/assets)Indicator for 1993 to 1996
Industry indicators (not shown)
Year indicators (not shown)
Number of observations
Adjusted R^
Indicator = 1( > 3 outsiders
at beginning of year)
Full Sample
0.0020 (0.02)0.0094(0.06)
-0.2971(0.06)-0.0104(0.19)
0.0363(0.01)0.0082 (0 05)0.0240 (0.04)
Yes
YB8
7,36S0.186
Dependent Variable
Indicator = 1(Adopted-Cadbury
1993-1996)
Firms Not in Complianceas of December 2002
0.0016(0.12]0,0083(0,12)
-0.0863(0.52)-0,0100(0,26)
0.0343 (0.02)0,0071 (0.10)
YesNo637
0,114
We employ the same independent variables as in the first regression in Table6 except that the variables are all measured as of year-end 1992. We are askingwhether firms that moved from two or fewer to three or more outsiders could havebeen predicted using data from just prior to publication of the Cadbury Report.If the independent variables are significant and have high explanatory power, thatresult would tend to indicate that it was fundamental economic factors rather thanthe Cadbury Report that pushed firms to add outside directors. The results of thisregression are given in the second column of Table 6.
As Table 6 shows, the only variable that is statistically significant is log(assets). None of the others approach statistical significance at traditional levels(all p-values > 0.10). This result suggests that the movement of firms towardCadbury adoption cannot fully be explained by fundamental economic factors,thus suggesting that the Cadbury Report had an independent (i.e.,. exogenous)effect on this movement.
As a further test of whether the link between performance and board compo-sition is endogenous, we estimate a two-stage least squares regression model. Inthe first stage, we use the adopted-Cadbury indicator as the dependent variable andfour instrumental variables: the proxy for firm age, the diversification indicator,stock return volatility (measured over the prior 12 months), and the market-to-book ratio (as of the beginning of the year). Prior studies cited above influenceour selection of the instruments. We require that the instrumental variables in the
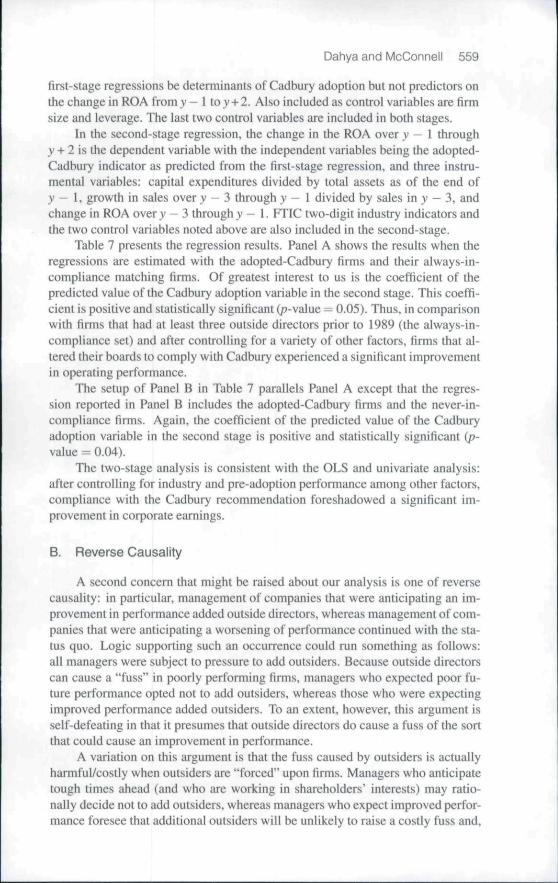
Dahya and McConnell 559
first-stage regressions be determinants of Cadbury adoption but not predictors onthe change in ROA fromy — 1 toy + 2. Also included as control variables are firmsize and leverage. The last two control variables are included in both stages.
In the second-stage regression,, the change in the ROA over v — 1 throughy + 2 is the dependent variable with the independent variables being the adopted-Cadbury indicator as predicted from the first-stage regression, and three instru-mental variables: capital expenditures divided by total assets as of the end ofy — i, growth in sales over y — 3 through v — I divided by sales in y — 3, andchange in ROA overy - 3 through >- - 1. FTIC two-digit industry indicators andthe two control variables noted above are also included in the second-stage.
Tahle 7 presents the regression results. Panel A shows the results when theregressions are estimated with the adopted-Cadbury firms and their aiways-in-compliance matching firms. Of greatest interest to us is the coefficient of thepredicted value of the Cadbury adoption variable in the second stage. This coeffi-cient is positive and statistically significant (p-\a\ue — 0.05). Thus, in comparisonwith firms that had at least three outside directors prior to 1989 (the always-in-compliance set) and after controlling for a variety of other factors,, firms that al-tered their boards to comply with Cadbury experienced a significant improvementin operating performance.
The setup of Panel B in Table 7 parallels Panel A except that the regres-sion reported in Panel B includes the adopted-Cadbury firms and the never-in-compliance firms. Again, the coefficient of the predicted value of the Cadhuryadoption variable in the second stage is positive and statistically significant ip-value ^ 0.04).
The two-stage analysis is consistent with the OLS and univariate analysis:after controlling for industry and pre-adoption performance among other factors,compliance with the Cadbury recommendation foreshadowed a significant im-provement in corporate earnings.
B. Reverse Causality
A second concern that might be raised about our analysis is one of reversecausality: in particular, management of companies that were anticipating an im-provement in performance added outside directors, whereas management of com-panies that were anticipating a worsening of performance continued with the sta-tus quo. Logic supporting such an occurrence could run something as follows:all managers were subject to pressure to add outsiders. Because outside directorscan cause a "fuss" in poorly performing firms, managers who expected poor fu-ture performance opted not to add outsiders, whereas those who were expectingimproved performance added outsiders. To an extent, however, this argument isself-defeating in that it presumes that outside directors do cause a fuss of the sortthat could cause an improvement in performance.
A variation on this argument is that the fuss caused by outsiders is actuallyh;u 111 fu I/cost ly when outsiders are "forced" upon firms. Managers who anticipatetough times ahead (and who are working in shareholders' interests) may ratio-nally decide not to add outsiders, whereas managers who expect improved perfor-mance foresee that additional outsiders will be unlikely to raise a costly fuss and,
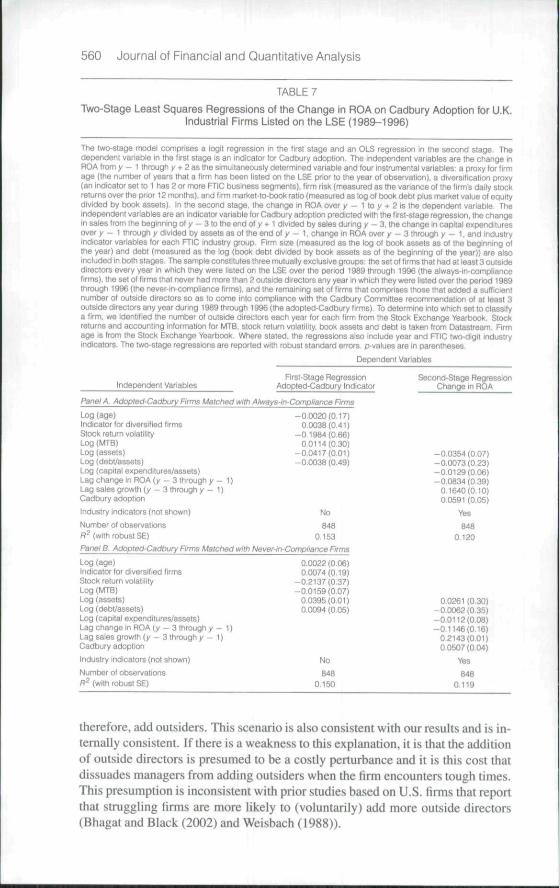
560 Journal of Financial and Quantitative Analysis
TABLE 7
Two-Stage Least Squares Regressions of the Change in ROA on Cadbury Adoption for U.K.Industrial Firms Listed on the LSE (1989-1996)
The two-stage model comprises a logit regression in the tirst stage and an OLS regression in ttie second stage Ttiedependent variabie in the first stage is an indicator for Cadbury adoption. The independent variables are ttie ctiange inROA from y - 1 ihroggh y + 2 as tbe simuitaneously determined variable and four instrumental variables: a proxy for firmage (the number ot years that a firm has been iisted on the LSE prior to the year of observation), a diversification proxy(an indicator set to 1 has 2 or more FTIC business segments), firm risk (measured as the variance ot the firms daily stockreturns over the prior 12 months), and firm market-to-book ratio (measured as log of book debt plus market value of SQultydivided by book assets). In the second stage, the change in ROA over y - 1 to y -f 2 is the dependent variable. Theindependent variables are an indicator vanabie for Cadbury adoption predicted with the first-stage regression, the changein sales from the beginning ot y - 3 to the end of y * t divided by sales during y - 3 , the change in capitai expendituresover / — 1 through y divided by assets as ot the end ot y - 1, change in ROA over y - 3 through y - I, and industryindicator variables for each RIC industry group Firm si2e (measured as the iog of book assets as of the tjeginning ofthe year) and debl (measured as the tog (book debt divided by book assets as of the beginning of the year)) are alsoincluded in both stages. The sampie constitutes three mutually exciusive groups: the set of firms that had at ieast 3 outsidedirectors every year in which they were iisted on the LSE over the period 1969 through t996 (the a1ways-in-compliance(irms), the set of firms that never had more than 2 outside directors any year in which they mere Iisted over the period t989through 1996 (ttie never-in-compliance firms), and the remaining set of firms that compnses those that added a sufficientnumber of outside directors so as to come into compiiance with the Cadbury Committee recommendation of at leasl 3outside directors any year during 1989 through 1996 (tfie adopted-Cadbury firms). To determine into which set to classifya firm, we identified the number of outside directors each year for each tirm from the Stock Exchange Yearbook Stockreturns and accounting information for MTB, stock return volatility book assets and debt is taken from Datastream, Firmage is from the Stock Exchange Yearbook. Where stated, tine regressions also inciude year and RIC two-digit industryindicators The two-stage regressions are reported with robust standard errors. p-va!ues are in parentneses.
Dependent Variables
First-Stage Regression Second-Stage RegressionIndependent Variables Adopted-Cadbury Indicator Change in ROA
Pane/ A. Adopled-CacltiLiry Firms Matched wilh Always-in-Compliance Firms
Log (age) -0.0020(0.17)Indicator for diversified firms 0.0038 (041)Stock return volatiiity -0.1984 (0.66)Log(MTB) 0.01H(Q.30)Log (assets) -0.0417 (0,01) -0,0354 (0.07)Log (debt/assets) -0,0038 (0,49) -0.0073(0.23)Log (capital expenditures/assets) --0.0i29{0.06)Lag change in ROA ( y - 3 through y - 1) -0.0834 (0,39)Lag sales growth (y - 3 through y - 1) 0.1640(0,10)Cadbury adoption 0.0591 (0,05)
Industry indicators (not shown) No Yes
Number of observations 848 848
R^ (with robust SE) 0,153 0.120
Panel B. Aaopied-Cadbury Firms Matcried with Never-in-Compliance Firms
Log (age) 0.0022 (0,06)Indicator for diversified firms 0,0074 (0.19)Stock return volatility -0,2137 (0.37)Log (MTB) -0,0159(0.07)Log (assets) 0,0395 (0,01) 0.0261 (0,30)Log (debt/assets) 0.0094 (0 05) -0.0062 (0.35)Log (capital expenditures/assets) -0.0112(0.08)Lag change in ROA (y - 3 through y - 1) -0,1146(0.16)Lag sales growth (y - 3 through y - 1) 0.2143(0.01)Cadbury adoption 0.0507 (0.04)
Industry indicators (not shown) No Yes
Number of observations 648 648fl^ (with robust SE) 0,150 0,119
therefore, add outsiders. This scenario is also consistent with our results and is in-ternally consistent. If there is a weakness to this explanation, it is that the additionof outside directors is presumed to be a costly perturbance and it is this cost thatdissuades managers from adding outsiders when the firm encounters tough times.This presumption is inconsistent with prior studies based on U.S. firms that reportthat struggling firms are more likely to (voluntarily) add more outside directors(Bhagat and Black (2002) and Weisbach (1988)).
Dahya and McConnell 561
Further, an equally reasonable set of motives could operate in the oppositedirection in that managers of poorly performing firms who expect this poor per-formance to continue might reasonably add outside directors as a way of showingthat they are "doing something" to improve performance or as a "shield" whenmatters do not improve. The latter argument assumes that outside directors areharmless mutations to the board and, as such, this argument is also an internallyconsistent argument, but that argument is rejected by our results.
In sum. it is possible to devise an internally consistent argument for reversecausality that is consistent with our results. Thus, we cannot absolutely rule outsuch a possibility, but the argument does require an assumption that outside di-rectors are harmful when a firm is suffering poor perfonnance. a presumption thatis inconsistent with studies in the U.S. that report that struggling firms are morelikely to add outside directors (Bhagat and Black (2002) and Weisbach (1988)).
C. Earnings Management
A third concern may be that the improvement in ROA that we observe comesabout through "earnings management" rather than a fundamental improvement inperformance. On this point, Peasnell. Pope, and Young (2004) study the relationbetween earnings management and corporate board composition fbr U.K. firmsover the period June 1993 through May 1996. They report "...that firms witha higher proportion of outside board members are associated with less income-increasing earnings management . . . " (p. 20). And conclude that "... outsidedirectors appear to play an important monitoring role in ... helping to upholdthe integrity and credibility of published financial statements'" (p. 25). The im-plication of these findings is that whatever earnings management takes place inthe U.K. is likely to be less than before once a firm has complied with the Cad-bury recommendation. The further implication is that the absolute and relativeimprovement that we observe in ROA is unlikely to be due to earnings manage-ment given that such management would have to be greater following Cadburyadoption than before to explain the increase. Additionally, to the extent that in-vestors can "see through" such earnings management, the event study results arenot consistent with the improvement in performance being attributable to earningsmanagement.
D. Cosfs of Non-Compliance
A further question that arises is: if having three or more outside directorsimproved performance and enhanced value, why did shareholders and/or othermarket forces not compel managers and boards lo have three or more outside di-rectors previously? Various possible factors may have been at work. It couldhave been that shareholder powers were not sufficiently strong or that institu-tional shareholders had conflicts of interest or that the takeover market was notwell developed or it could simply have been inertia in the system. In any event,whatever actions could have been taken involved costs on the part of the primemovers. At the margin, the Cadbury Report may have produced enough impetusfor change that the benefits of compliance overcame whatever impediments ex-isted for marginal firms. Thus, at the margin, firms for which the benefits were
562 Journal of Finaiicial and Quantitative Anaiysis
the greatest moved most quickly to comply with the provisions of the Report. Ofcourse, some LSE firms had still not complied as of the end of 2004. Presumahly,the costs of compliance for the shareholders of these firms still outweighed thebenefits of adoption.
X. Conclusion
During the 1990s and beyond, the global economy has witnessed widespreadcalls for more outside directors on corporate boards. A presumption that underliesthis movement is that boards with more outside directors will lead to hetter boarddecisions and, as a result, hetter corporate performance. DMT (2002) examinethe relation between CEO turnover and corporate performance before and afterfirms adopted the key recommendations of the Cadbury Report. They find thatCEO turiiover is significantly more sensitive to performance after firms came intocompliance with the report by moving to three outside directors. They go on tonote that this result is consistent with the recommendations having improved cor-porate governance, but they remain skeptical as to whether that would inevitablylead to improved corporate performance: "[I]ncreased management turnover andincreased sensitivity of turnover to performance do not necessarily mean an im-provement in performance" (p. 482). In this study, we examine changes in perfor-mance directly, but we began with that same level of skepticism.
Somewhat surprisingly, we find that U.K. firms that moved to three outsidedirectors in conformance with the Cadbury Committee recommendation show animprovement in operating performance both absolutely and relative to variouspeer group benchmarks from before to after moving to three outside directors.We also find that firms that move to three outside directors have a statisticallysignificant stock price increase at the time of announcement of this decision. Theresults strongly suggest that adding outside directors led to improved performanceby U.K. firms and increased value for shareholders. Even, then, however, mostU.K. firms had less than a majority of outside directors—on average, outside di-rectors comprised 44% of U.K. firms' directors. Thus, one question that our studyraises is whether there is an optimal number or fraction of outside directors thatmay be less than 50% for U.K. firms. If so, U.K. firms are ripe for a detailed studyof the determinants of board composition of the type undertaken for U.S. firms byLinck, Netter, and Yang (2007), Boone, Eield, Karpoff, and Raheja (2007), CDN(2007), and Lehn, Patro, and Zhao (2007). A second question is whether theresults from U.K. firms can be generalized to other countries that have adoptedsimilar codes of best practice. We do not answer those questions here, but expectthat future studies by others will.
References
Agrawal, A., and C. R. Knoebcr. "Firm Performance and Meciianisms to Control Agency Problemsbetween Managers and Sharehoiders." Journal of Financial and Quantilalive Analysis. 31 (1996),377-397.
Agrawal, A., and C. R. Knoeber. "Do Some Outside Directors Piay a Political Role?" Journal of Lawand Economics, 44 (2001), 179-198.

Dahya and McConneli 563
Barber, B. M., and J, D. Lyon. "Detecting Abnormal Operating Performance: The Empirical Powerand Specification of Test-Statistics." Journal of Financial Economics. 41 (1996). 359—399.
Bhagat. S., and B. S. Black, 'The Uncertain Relationship Isetween Board Composition and FirmPerformance." Busine.fs iMwyer. .̂ 4 (1999). 921-961.
Bhagai, S.. and B. S. Black. "The Non Correlation between Board Independence and Long-TermFirm Performance." Journal of Corporation Law, 27 (2002), 232-273.
Boone. A. L.; L. C. Field: J. M. Karpoff; and C. G. Raheja. "The Determinants of Corporate BoardSize and Composition: An Empirical Analysis." Journal of Financial Economics, forthcoming(2007),
Brickley, J. A.; J. L. Coles; and R. L. Terry. "Outside Directors and the Adoption of Poison Pills."Journal of Financial Economics. 35 (1994), 371-390.
Brickley. J, A.; J. L. Coles; and G. Jarrell. "Leadership Structure; Separating the CEO and Chairmanof the Board." Journal of Corporate Finance, 3 (1997). 189-220.
Brickley. J. A., and C. James. "The Takeover Market, Corporate Board Composition, and OwnershipStructure: The Case of Banking." Journal of Law and Economics. 30 (1987), 161-180.
Brook. Y.; R. Hendershott; and D. Lee. "The Gains from Takeover Deregulation: Evidence on theEnd of Interstate Banking Restrictions." Journal of Finance, 53 (1998), 2185-2204.
Byrd. J. W., and K. A. Hickman. "Do Outside Directors Monitor Managers? Evidence for TenderOffer Bids." Journal of Financial Economic.<<. i2{\992h 195-221.
Coles, J, L.; N, D. Daniel; and L. Naveen. "Board: Does One Size Fit All?" Journal of FiiuuicialEconomics, forthcoming (2007).
Coles. J. L.. and C. K. Hoi. "New Evidence on the Market for Directors: Board Membership andPennsylvania Senate Bill 1310." Journal of Finance, 58 (2003), 197-230.
Core. J. E.; R. W. Holthausen; and D. F. Larcker. "Corporate Governance. Chief Executive OfheerCompensation and Firm Performance." Journal of Financial Economics. 51 (1999), 373-406.
Cotter, j . F.; A. Shivdasani; and M. Zenner. "Do Independent Directors Enhance Target ShareholderWealth during Tender Offers?" Journal of Financial Economics. 43 (1997), 195-218,
Dahya, J.: J. J. McConnell; and N. G. Travlo^. "The Cadbury Committee. Corporate Performance,and Top Management Turnover." Journal of Finance. 57 (2002), 461-483.
Demsetz, H., and K. Lehn. "The Structure of Corporate Ownership: Causes and Consequences."Journal ofPolifical Economy, 93 (1985). 1155-1177.
Denis. D. J.. and A. Sarin, "Ownership and Board Structures in Publicly Traded Firms." Journal ofFinancial Economics. 52 (1999). 187-223.
Hermalin, B. E.. and M. S, Weisbach. 'The Effects of Board Composition and Direct Incentives onFirm Performance." Financial Manaf^emeni. 20 (1991). 101-112.
Hermalin. B. E., and M. S. Weisbach. "Boards of Directors as an Endogenously Determined Institu-tion: A Survey of the Economic Literature," Economic Policy Review. April (2003). 7-26.
Jensen, M. J, 'The Modem Industrial Revolution, Exit and the Failure of Internal Control Systems."Journal of Finance. 48 (1993), 831-880.
Kini, O.; W. A. Kracaw; and S. Mian. "Corporate Takeovers, Firm Performance, and Board Compo-sition." Journal of Corporate Finance. 1 (1995), 383^12.
Koie, S. R., and K. M. Lehn. "Deregulation, the Evolution of Corporate Governance Structure, andSurvival." American Economic Review. 87 (1997). 421-425.
Kole. S. R., and K. M. Lehn. "Deregulation and the Adaptation of Governance Structure: The Caseof the U.S. Airline Industry." Journal of Financial Fconomics. 52 (1999), 79-117.
Lehn, K. M.; S. Patro; and M. Zhao. "Determinants of the Size and Structure of Corporate Boards;I935-2O(K)." Journal of Corporate Finance, forthcoming (2007).
Linck, J. S.; J. M. Netter; and T. Yang. "The Determinants of Board Structure." Journal of FinancialEconomics, forthcoming (2007).
Lipton, M.. and J. W. Lorsch. "A Modest Proposal for Improved Corporate Governance." BusinessLawyer, 48 (\^2).59-n.
Mehran. H. "Executive Compensation Strucmre, Ownership and Firm Performance." Journal ofFinuncial Economics. 38 (1995), 16.3-184.
Pcasnell, K.; P. Pope; and S. Young. "Board Monitoring and Earnings Management: Do OutsideDirectors Influence Abnormal Accruals?" Journal of Business Finance and Accounting. 32 (2(X)5),1311-1346.
Rechner, 1. E. and D. R. Dalton. "CEO Duality and Organizational Performance: A LongitudinalAnalysis." Strategic Management Journal. 12 (1991), 155-160.
Rosenstein, S.. and J. G. Wyatt. "Outside Directors. Board Independence, and Shareholder Wealth."Journal of Financial Economics, 26 (1990), 175-191.
Rosenstein, S., and J. G. Wyatt. "Inside Directors. Board Effectiveness, and Shareholder Wealth,"Journal of Financial Economics. 44 (1997), 229-250.

564 Journal of Financial and Quantitative Analysis
Schwert, W. G. "Using Financial Data to Measure Effects of Regulation." Joumal of Law and Eco-/lomJcj. 24(1981). 121-158.
Shivdasani. A, "Board Cotnposition, Ownership Structure, and Hostile Takeovers." Joumal of Ac-counting and Economics. 16(1993), 167-198,
Szewczyk, S, H.. and G. P. Tsetsekos. "State Intervention in the Market for Corporate Control: TheCase of Pennsylvania Senate Bill n\Qr Journal of Financial Economics, 31 (1992). 3-23,
Weisbach. M. S, "Outside Directors and CEO Turnover," Jouniat of Financial Economics. 20 (1988),431^60.