Embed Size (px)
Citation preview
Electronic copy available at: http://ssrn.com/abstract=1907103
1
Board compensation, corporate governance, and firm
performance in Indonesia
Salim Darmadi
Indonesian Capital Market and Financial Institution Supervisory Agency (Bapepam-LK)
Jalan Lapangan Banteng Timur No. 2-4, Jakarta 10710, Indonesia
Indonesian College of State Accountancy (STAN)
Bintaro Jaya Sektor V, Tangerang Selatan 15222, Indonesia
This version: 9 August 2011
Abstract
This paper examines the determinants of board compensation in a developing economy that
adopts a two-tier board structure system. Corporate governance structure, firm-specific
characteristics, and firm performance are hypothesized as significant determinants. The sample
consists of 442 firm-year observations, comprising 255 listed firms on the Indonesia Stock
Exchange (IDX) in the financial years 2006 and 2007. I provide empirical evidence that
profitability, firm size, and the number of board members are positively associated with
compensation level. Smaller firms are found to spend higher proportion of their financial
resources to compensate their board members. Additionally, firm size and family control play
important roles in explaining the relationship between board compensation and firm
performance. Further, this study investigates pay-performance sensitivity and reveals that
changes in firm value are positively associated with changes in board compensation.
JEL classification: G34, J33, M12, M52
Keywords: Board compensation, corporate governance, Indonesia, pay-performance sensitivity,
two-tier board
_______________________
The views expressed in this paper are those of the author and do not represent the views of
Bapepam-LK, or of the author’s colleagues on the staff of Bapepam-LK. The author thanks
Setiyono Miharjo, Muhammad Agung Prabowo, and the participants of the 14th National
Symposium of Accounting at Universitas Syiah Kuala, Banda Aceh, Indonesia, for their helpful
comments on earlier versions of this paper. All remaining errors and omissions remain the
author’s responsibility.
Email: [email protected]; [email protected]
Electronic copy available at: http://ssrn.com/abstract=1907103
2
1. Introduction
In a corporation, where the separation between ownership and control exists, agency
problems may arise because the management may not behave in the best interests of the
shareholders (Jensen and Meckling, 1976). Given this condition, internal and external corporate
governance mechanisms play important roles in minimizing the principal-agent conflicts. These
governance mechanisms include ownership structure, board size, board independence, board
meetings, and auditor choice, among others, which are well-established in the literature. Another
governance mechanism gaining wider and wider attention in the literature is the compensation of
board members or top executives, which is also viewed as an important tool in minimizing the
agency problems (Dong and Ozkan, 2008). The compensation scheme is considered significant
to motivate executives to perform their managerial duties in line with the best interests of the
shareholders, as well as to recruit and maintain high-quality managers (Anderson and Bizjak,
2003).
Following widespread calls for better corporate governance, executive compensation is
more and more widely addressed in the literature. As counted by Hallock and Murphy (1999),
studies on executive pay in the United States have grown from one or two papers per year before
1985 to sixty papers in 1995. In the financial economics literature, mostly based on the agency
theory, scholars have attempted to investigate the linkage between compensation structure and a
number of variables, such as firm performance (e.g. Jensen and Murphy, 1990; Bushman et al.,
1996), corporate governance structure (e.g. Core et al., 1999; Newman and Mozes, 1999), capital
structure (John and John, 1993), and investment behavior (Bizjak et al., 1993). In other
disciplines, previous studies have investigated the association between executive pay and various
aspects, including earnings management (Holthausen et al., 1995), industrial regulation (Hubbard
3
and Palia, 1995), strategic interactions (Aggarwal and Samwick, 1999), and social comparisons
(O’Reilly et al., 1988).
It is important to note that previous research on the determinants of compensation structure
is largely dominated by US studies. Public disclosure of executive compensation in the US has
long been regulated (Andjelkovic et al., 2002; Brunello et al., 2001), resulting in an extensive
body of empirical studies using the country’s data. On the other hand, such studies outside the
US are relatively limited, partly due to data availability issues (Unite et al., 2008). Empirical
evidence from developed markets is provided by studies in the context of the United Kingdom
(Laing and Weir, 1999), Japan (Basu et al., 2007), Italy (Brunello et al., 2001), Germany
(Kaplan, 1998), and Hong Kong (Cheng and Firth, 2006), among others. Such evidence from
emerging markets, where public disclosure of executive compensation is relatively weaker, is
unsurprisingly scarce. Researchers have conducted studies using the data from Bulgaria (Jones
and Kato, 1996), China (Firth et al., 2006), the Philippines (Unite et al., 2006), and Malaysia
(Abdullah, 2006; Abdul-Wahab and Abdul-Rahman, 2009), among others.
The purpose of the present study is to examine the determinants of board compensation of
the Indonesian listed corporations. It also seeks to investigate how changes in firm performance
lead to changes in board compensation. This study extends the existing literature by examining
such an issue in a developing economy that has different regulatory and social environments
from those of developed economies, where most previous research has been conducted.
Indonesia, which is one of twenty largest economies in the world, has an emerging capital
market that attracts growing foreign investments. Additionally, Indonesia provides interesting
setting since it adopts a two-tier board system, like such countries as Germany, the Netherlands,
Austria, and China, where corporations shall have supervisory and management boards. Hence, it
4
extends the scope of previous studies that are mostly based on economies adopting a unitary
board system. Further, as an emerging market, Indonesia already has a system of corporate
governance regulations, but the practice is still relatively left behind international best practices.
Compensation structure of the Indonesian listed firms is a relatively well-kept secret and
generally not disclosed to the public[1]. Further, as documented by Claessens et al. (2000), most
listed firms in Indonesia are family-controlled; probably making the secrecy of the compensation
package is more prevalent.
I employ an unbalanced panel data set, which comprises 442 firm-year observations of 255
non-financial firms listed on the Indonesia Stock Exchange (IDX) in the financial years 2005 and
2006. I hypothesize that corporate governance structure, firm performance, and firm-specific
characteristics are positively associated with the compensation structure. I provide empirical
evidence that profitability, board size, and firm size are positively associated with compensation
level. It is also found that smaller firms tend to expend higher proportion of their financial
resources to reward their board members. Additionally, this study suggests that firm size and
family control play important roles in explaining the relationship between board compensation
and firm performance. Further, this paper also examines whether changes in financial
performance and firm value lead to changes in board pay. From the final sample, I organize a
balanced panel data set comprising 186 observations. It is revealed that changes in firm value are
positively associated with changes in board compensation.
The present paper is organized in the following manner. Section 2 describes the two-tier
system and the disclosure practice of board compensation in Indonesia. Section 3 reviews prior
studies and develops hypotheses. This is followed by Section 4, which describes the data and
5
methodology used in this study. Empirical results and discussions are presented in Section 5.
Finally, Section 6 provides concluding remarks.
2. Two-tier system and board compensation disclosure in Indonesia
As regulated in the county’s Corporation Law enacted in 1995, Indonesian corporations
shall have two boards in their organizational structures, namely Dewan Komisaris (“Board of
Commissioners”, hereafter “BOC”) and Direksi (“Board of Directors”, hereafter “BOD”)[2]. The
members of these two boards are elected by the shareholders in their general meeting. While
BOC is responsible to the shareholders, BOD is responsible to both BOC and the shareholders.
The membership of the two boards is separated, so that there is no role duality issue as found in
unitary board structure.
BOC acts as the representatives of the shareholders and conducts supervising and advising
roles on BOD. Thus, the function of BOC is totally non-executive. BOC members consist of
independent members (from outside the firm) and non-independent members (affiliated to the
firm). BOC is headed by a president commissioner, which is relatively equivalent to the board
chairman in unitary board structure. The president commissioner may be elected from either
independent or non-independent members of BOC. Applicable capital market regulations require
listed firms to have independent commissioners of at least 30 percent of the number of BOC
members. BOD, whose members are highest-level managers, conducts the day-to-day
management of the corporation. It is headed by a president director, which is equivalent to the
chief executive officer (CEO) in unitary board structure.
As regulated in the Corporation Law, the shareholders in their general meeting make
decisions on the compensation structure of board members. Capital market regulations have
6
required the Indonesian listed firms to disclose the total compensation of board members, but do
not require the disclosure of compensation for each individual member. As such, detailed
disclosure of individual board member compensation is voluntary. In 2006, Indonesia’s National
Committee on Governance Policy (Komite Nasional Kebijakan Governance or KNKG), an
independent committee initiated by the government, issued Guidelines on Good Corporate
Governance. These guidelines are intended as recommendations for the implementation of good
corporate governance (GCG), especially for publicly-listed firms. The guidelines recommend the
establishment of a nomination and remuneration committee, whose members are totally
independent or from outside the firm. The committee is established to assist BOC in nominating
future board members and determining appropriate compensation level for board members. The
guidelines recommend firms to include GCG Report as a part of their annual reports. Board
remuneration policies and levels are also recommended to be reported in the GCG Report.
3. Literature review and hypotheses development
3.1. Theoretical framework
In modern corporations, where the separation between the shareholders and the managers
exists (Berle and Means, 1932), managers may have incentives that are different from those of
the shareholders, leading them to making decisions that are not in line with the shareholders’
interests. Jensen and Meckling (1976) address this issue as the principal-agent problem and then
formalize the agency theory. They argue that “it is generally impossible for the principal and the
agent at zero cost to ensure that the agent will make optimal decisions from the principal’s
viewpoint” (p. 5). Managers may pursue their own personal interests such as salary, job security,
and prestige, which could be contradicting the interest of the shareholders, who want their wealth
7
to be maximized (Mak and Li, 2001). However, it is important to note that this principal-agent
conflict seem to appear in corporations whose ownership structure is dispersed. Shleifer and
Vishny (1986) contend that in corporations with concentrated ownership structure, such
problems exist between the controlling shareholder and minority shareholders, where the former
can expropriate the firm’s assets in the expense of the latter.
Corporate governance mechanisms are intended to minimize the agency conflicts. In other
words, the purpose of such mechanisms is to encourage managers to act in the best interest of the
shareholders. Denis (2001) provides examples of such mechanisms, such as bonding managers
contractually, monitoring them, and providing them with incentives for their good performance.
In this case, compensation schemes for executives have an important role. As argued by John
and John (1993), executive compensation plays important roles in aligning incentives of the
management with those of the shareholders, as well as to mitigate risk-shifting incentives.
Conyon and He (2004), summarizing the propositions of previous work, state that executive
compensation package is optimally determined by the board of directors based on economic
determinants, the nature of agency conflicts, and difficulties in monitoring. Some firms also use
compensation consultants and peer groups in determining the remuneration scheme (Bizjak et al.,
2008).
Since the goal of a firm is to increase shareholders wealth, executive compensation
structure should be determined on the basis of shareholders wealth (Jensen and Murphy, 1990).
Hence, compensation structure would appear to be powerful incentives for managers to increase
firm value. Additionally, Holmstrom (1979) contends that compensation structure should be
ideally based on performance measures that are as informative as possible. Compensation
scheme on the basis of observable performance measures is expected to align the interests of the
8
shareholders and the management (Brunello et al., 2001). The change in compensation level
based on the change in firm performance, which is commonly called as “pay-performance
sensitivity”, also gains wider and wider attention from researchers in the literature.
Corporate governance structure, which includes board and ownership characteristics, is
also viewed as significant determinants of compensation structure. Boards of directors are
expected to have independent directors with certain experiences and expertise to better monitor
the management (Jensen and Meckling, 1976) and to protect the rights of minority shareholders.
As addressed in a number of studies, board structure plays an important role in determining
compensation structure. Fama (1980) and Fama and Jensen (1983) suggest that decisions on
compensation structure should be made by independent directors, because they are better able to
make unbiased opinions. On the other hand, Crystal (1991) argues that the decisions on
compensation structure made by outside directors are ineffective because those directors are
essentially hired by the CEO. This condition leads to remuneration scheme that is suboptimal for
the firm, but advantageous for the CEO (Core et al., 1999). To the best of my knowledge, the
propositions on the role of ownership structure in determining compensation level are scarce in
the literature. According to Cheng and Firth (2006), board members or top managers that have
the firm’s shareholdings seem to have lower compensation due to large dividend payouts and the
avoidance of adverse publicity, but they may also have higher compensation since they can use
their voting rights to reward themselves higher.
Further, firm-specific characteristics may also have significant influences on the level of
executive compensation. As summarized by Brunello et al. (2001) and Firth et al. (1999), it is
common that the level of top executive pay is positively associated with firm size. In a
competitive market for managers, higher-quality people may be allocated to top-level positions
9
in large firms (Rosen, 1992). Large firms generally have a more extensive organizational
hierarchy, where there are different compensation schemes for each managerial level (Simon,
1957). Additionally, it is common that larger firms have higher absolute profit compared to their
smaller counterparts. Hence, high level of executive compensation in a large firm may appear to
be insignificant compared to the firm’s total operational expenses (Firth et al., 1999).
3.2. Firm performance and compensation level
Holmstrom (1979) and Jensen and Murphy (1990) argue that it is appropriate for firms to
determine director compensation level based on the firm performance. This means that board
members should be better paid for their good performance. Previous studies use various
measures of firm performance as the determinant of compensation level of board members or
executives, including return on assets (ROA), return on equity (ROE), Tobin’s Q, and stock
returns.
A number of studies provide evidence on the positive association between accounting-
based performance (such as ROA and ROE) and the level of CEO pay, such as Sanders and
Carpenter (1998), Laing and Weir (1999), Newman and Mozes (1999), Zhou (2000),
Andjelkovic et al. (2002), and Cheng and Firth (2006). Other studies also find positive
relationships between the level of CEO pay and market-based performance (Tobin’s Q and stock
returns), including Bustman et al. (1996), Chung and Pruitt (1996), Conyon and Peck (1998),
Core et al. (1999), Vafeas (2003), and Chhaochharia and Grinstein (2009). A different result is
suggested by Jiang et al. (2009), which find that CEO pay is negatively related to ROA. It is
important to note that these studies are based on samples in few countries such as the US and the
10
UK, where the pay level of board members and top executives, including CEO, are commonly
disclosed by listed firms.
In countries where the disclosure of countries level tends to be weaker, researchers use
other proxies to measure the pay level, such as total board compensation and average director
compensation. Andreas et al. (2010), addressing German companies, find that ROA is positively
associated with average director compensation. Using total board compensation as the proxy for
pay level, Abdul-Wahab and Abdul-Rahman (2009) also indicate the positive relationship in the
context of Malaysia. Based on the data of Japanese firms, Basu et al. (2007) find that ROA and
market-to-book ratio positively and significantly affect total executive compensation.
In the Indonesian case, I posit a direct relationship between firm performance and
compensation level. Firms with higher level of performance may appreciate their board members
with higher level of compensation. Many Indonesian studies (e.g. Darmadi, 2011) show that
better performance are likely to belong to larger firms, which probably have more financial
resources to pay their board members. The large firms may be also more attractive for high-
quality managers, which tend to be more highly-compensated. I formulate the first and second
hypotheses as follows:
H1a: There is a positive association between profitability (accounting-based performance) and
compensation level.
H2a: There is a positive association between firm value (market-based performance) and
compensation level.
11
3.3. Board structure and compensation level
Pearce and Zahra (1992) and Dalton et al. (1999) suggest that board size is one of the
important determinants of effective governance. It is argued that larger groups have more skills
and expertise that are required to solve problems (Jackson, 1992). The relationship between
board size and firm performance is well-established in the literature (e.g. Yermack, 1996;
Eisenberg et al., 1998; Coles et al., 2008), yet relatively few studies hypothesize that board size
has a significant influence on compensation level. Using samples of US firms, Core et al. (1999)
and Conyon and He (2004) find that the influence of board size on the compensation level is
significantly positive. Additionally, Sanders and Carpenter (1998) provide evidence that the size
of top management team positively influences the level of CEO pay.
Within the context of Indonesia, it is expected that firms with larger board size tend to have
more financial resources to hire more people serving on their boards. Darmadi (2011) suggests
that firms with larger board size are likely to have larger firm size. Given this condition, I posit
that board size positively influences the compensation. Hence, the hypothesis is stated as:
H3a: There is a positive between board size and compensation level.
As abovementioned, different arguments persist in the literature on whether independent
directors better determine executive compensation. Arguing that independent directors conduct
better monitoring on the board compensation, Firth et al. (1999) and Abdul-Wahab and Abdul
Rahman (2009) provide evidence on the negative relationship between board independence and
the compensation level based on the data of Hong Kong and Malaysia, respectively. Contrary to
their results, Core et al. (1999) find that the proportion of inside directors is negatively related to
CEO level in US firms. Similarly, Li et al. (2007) suggest a positive relationship between board
independence and CEO compensation in Chinese firms.
12
For the Indonesian case, we predict that the relationship between the fraction of
independent members on BOC and the compensation level is positive. Such an environment in
Indonesia seems to be relatively similar to that in Hong Kong, where the management typically
nominates the independent directors, which can later encourage higher compensation for the
management (Cheng and Firth, 2006). Further, Darmadi (2011) suggests that higher proportion
of independent commissioners tends to belong to larger firms. As such, it is hypothesized that:
H4a: There is a positive association between the proportion of independent commissioners and
compensation level.
3.4. Ownership structure and compensation level
Concentrated ownership is viewed as one of the important governance mechanisms to
minimize agency problems (Kaplan and Minton, 2004) and to better monitor the management
(Shivdasani, 1993), but it can also lead to asset expropriation tendency of the controlling
shareholder (Shleifer and Vishny, 1986). Concentrated ownership may affect the design of
compensation level in a firm. A number of previous studies have documented a negative
association between blockholders ownership and the compensation level (e.g. Hambrick and
Finkelstein, 1995; Core et al., 1999; Cheng and Firth, 2006).
As indicated by Claessens et al. (2000), concentrated ownership is common in firms listed
on East Asian capital markets, including Indonesia. Again, I base my hypothesis on the
correlation between concentrated ownership and firm size. As suggested by Darmadi (2011),
higher level of concentrated ownership is more likely to exist among smaller firms, which may
have lower compensation level than their larger counterparts. Therefore, my hypothesis is:
H5a: There is a negative association between concentrated ownership and compensation level.
13
The proportion of shares held by board members or the management may affect the pay
level, either positively or negatively (Cheng and Firth, 2006). Some studies show that insider
ownership positively influences the compensation level, such as Basu et al. (2007), Li et al.
(2007), and Byrd et al. (2010).Other research, however, provides evidence on the negative
relationship between insider ownership and pay level. Such studies include Mehran (1995), Core
et al. (1999), Firth et al. (1999), and Andreas et al. (2010).
In the Indonesian setting, where shareholdings in the name of insiders are quite uncommon,
it is expected that insider ownership negatively affects compensation level. It seems that insider
ownership is more common in family-controlled firms, where the insiders tend to have family
relationships with the founder or the controlling shareholder. They may increase their wealth
from larger dividend payouts rather than higher salary. This prediction leads me to formulate the
following hypothesis:
H6a: There is a negative association between board members ownership and compensation
level.
Claessens et al. (2000) also show that listed firms in East Asian capital markets are mainly
family controlled. Thus, people serving in the boardroom are partly due to family relationships
with the founder or the controlling shareholder. To a particular extent, the control of a firm in the
hand of family tends to lead to weaker monitoring mechanisms on the management. Similar to
Hypothesis 6, I predict that family control has a negative impact on compensation level. It is
predicted that the controlling family increases the wealth of the board members from sources
other than the remuneration scheme. Additionally, family-controlled firms tend to be smaller
firms (Darmadi, 2011), which have relatively less financial resources to hire people serving on
the board. Hence, it is hypothesized that:
14
H7a: There is a negative association between family control and compensation level.
3.5. Firm-specific characteristics and compensation level
Previous studies on the board compensation generally find that firm size is positively
associated with the compensation level. Simon (1957), Rosen (1992), and Firth et al. (1999)
provide arguments on this finding as abovementioned. Additionally, larger firms are likely to
have more financial resources to hire more high-quality people holding seats in their
boardrooms. Further, larger firms tend to have higher level of business risks and diversification,
thus they compensate their board members and executives higher to handle their complex and
highly-skilled jobs. Following prior findings, I hypothesize that:
H8a: There is a positive association between firm size and compensation level.
H9a: There is a positive association between business complexity and compensation level.
I also consider the firm’s debt as a significant determinant of the pay level. Using the Hong
Kong data, Cheng and Firth (2006) do not find any significant link between leverage and CEO
pay. Additionally, Abdullah (2006) find that financially-distressed Malaysian listed firms pay
their directors significantly lower than their peers.
For the Indonesian case, even though the managers of financially-distressed firms have to
deal with difficult jobs to make the firms healthier, I predict that those firms may not have a
considerable amount of financial resources to pay their managers. Hence, following Abdullah
(2006), it is hypothesized that:
H10a: There is a negative association between firm leverage and compensation level.
15
3.6. Determinants of compensation spending
Different from other studies, Byrd et al. (2010) define CEO pay to be average
compensation paid to the CEO relative to firm size. This variable allows them to examine the
determinants of the compensation level a firm pays to its CEO, compared to its own financial
resources. Investigation on the determinants of compensation spending, relative to firm size, may
provide interesting insights to answer the question of why the firm spends certain proportion of
its financial resources to pay its board members or CEO. As suggested by Firth et al. (1999),
even though larger firms provide their board members with higher absolute value of
compensation level, this amount is probably insignificant compared to their larger business scale.
Hypotheses 1a through 10a, which address the determinants of compensation level, are
mostly formulated by considering firm size. Taking this into account, I further formulate
Hypotheses 1b trough 10b on the determinants of compensation spending relative to firm size
(not stated here). However, considering the proposition of Firth et al. (1999), the hypothesized
signs for compensation spending are the opposite of those for compensation level. For instance,
while the association between firm size and compensation level is positive, it is predicted that
firm size is negatively associated with compensation spending relative to firm size.
4. Research design
4.1. Sample description
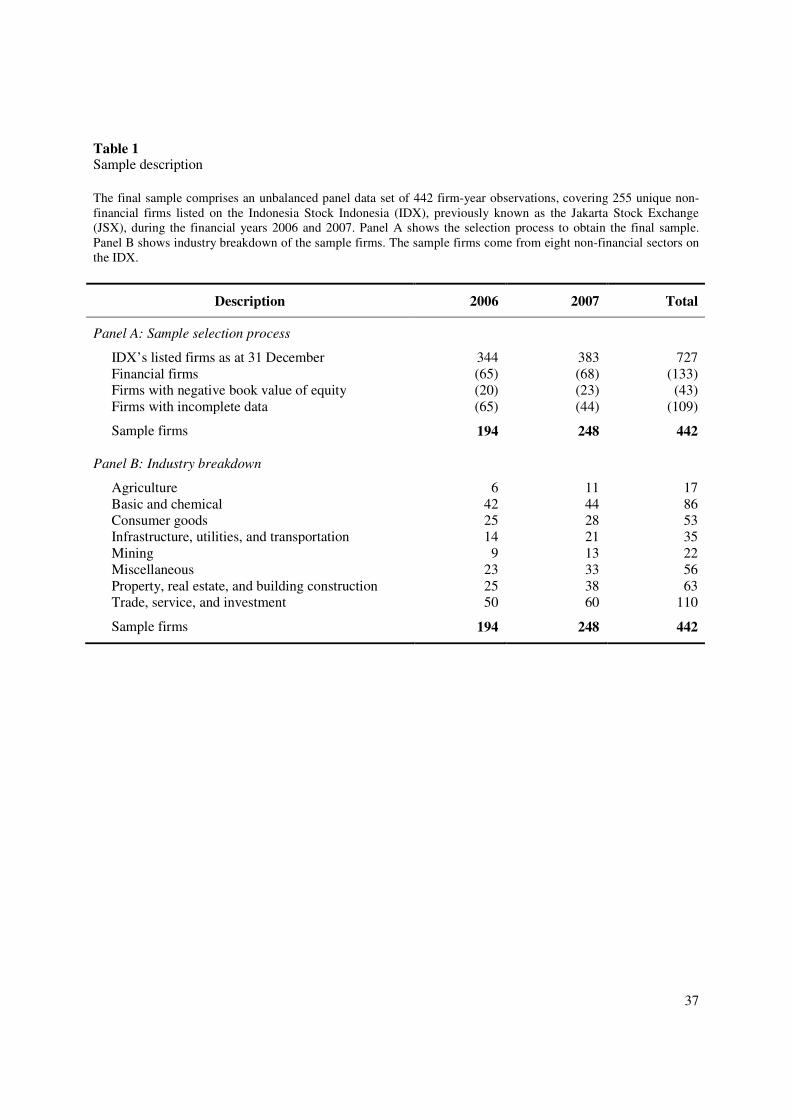
To capture the recent development in the determinants of board compensation, I collect the
data from the financial years 2006 and 2007. My initial sample comprises all firms listed on the
Indonesia Stock Exchange (IDX), previously known as the Jakarta Stock Exchange (JSX), as at
31 December of respective years. Due to their unique characteristics, banks and financial firms
16
are excluded from the sample. I also exclude firms with negative book value of equity and firms
with incomplete data. This selection process ends up in 194 and 248 sample firms for the years
2006 and 2007, respectively. There are 255 unique firms captured in the 442 firm-year
observations. The data are mainly obtained from the IDX Watch, previously published as the JSX
Watch, an annual capital market directory issued by Bisnis Indonesia, a prominent business
newspaper in the country. Additionally, some of the data are also hand-collected from the annual
reports and financial statements of the sample firms, which are downloadable from the Internet.
Table 1 shows selection process and industry breakdown of the sample firms.
[Insert Table 1 about here]
4.2. Regression model
Previous studies employ different estimation technique in their multivariate analysis, such
as ordinary least squares (OLS), two-stage least squares (2SLS), and fixed effects. In the present
study, I mainly employ OLS regressions, following Firth et al. (1999) and Unite et al. (2008) that
also use two-year data. Moreover, similar to Coles et al. (2008), it is argued that the variations in
compensation level tend to appear in the cross-section rather than in the time-series, hence OLS
is considered more appropriate. In analyzing the determinants of board compensation, the
econometric model is specified as follows:
Compensation = β0 + δ1 (Firm performance) + δ2 (Board structure)
+ δ3 (Ownership structure) + δ4 (Firm-specific characteristics) (1)
Next, I examine pay-performance sensitivity, which addresses whether changes in
performance and other firm characteristics have positive impacts on changes in pay. Similar to
17
Shaw and Zhang (2010), I use percentage of the changes instead of absolute values of such
changes. The following model is also employed:
Change in compensation = β0 + δ1 (Change in firm performance)
+ δ2 (Change in firm-specific characteristics) (2)
4.3. Variable measurement
In countries where the disclosure of individual executive compensation is common, such as
the US, the UK, and Australia, researchers commonly use pay level of CEO or each individual
executive as the dependent variable in their regression models. In such studies as Core et al.
(1999) and Clarkson et al. (2006), regressions are even conducted separately for different types
of CEO compensation, namely salary, cash, and bonus. Indonesia is among countries with
relatively weak disclosure of board compensation. The country’s capital market regulations only
require listed firms to disclose the aggregate amount of compensation rewarded to the members
of BOC and BOD.
In this study, I use two proxies for compensation level. First, I employ total compensation
paid to board members, as reported by listed firms in notes to the financial statements. Using
publicly-available data, this aggregate amount seems to be the most reasonable choice. I hand-
collect annual reports of 143 firms included in my sample, and find that there are only ten firms
disclosing the compensation of each individual board member. The total compensation is also
used in previous studies, such as Adams (2003), Unite et al. (2008), and Abdul-Wahab and
Abdul-Rahman (2009). Second, I use average compensation level for each individual board
member, which is obtained by dividing total compensation divided by the number of people
serving on BOC and BOD. A number of studies employ this average pay level, including Muslu
18
(1998), Firth et al. (1999), and Andreas et al. (2010). Further, following Byrd et al. (2010),
another dependent variable used here is compensation spending, which is obtained by dividing
total compensation paid to board members by the firm’s book value of assets.
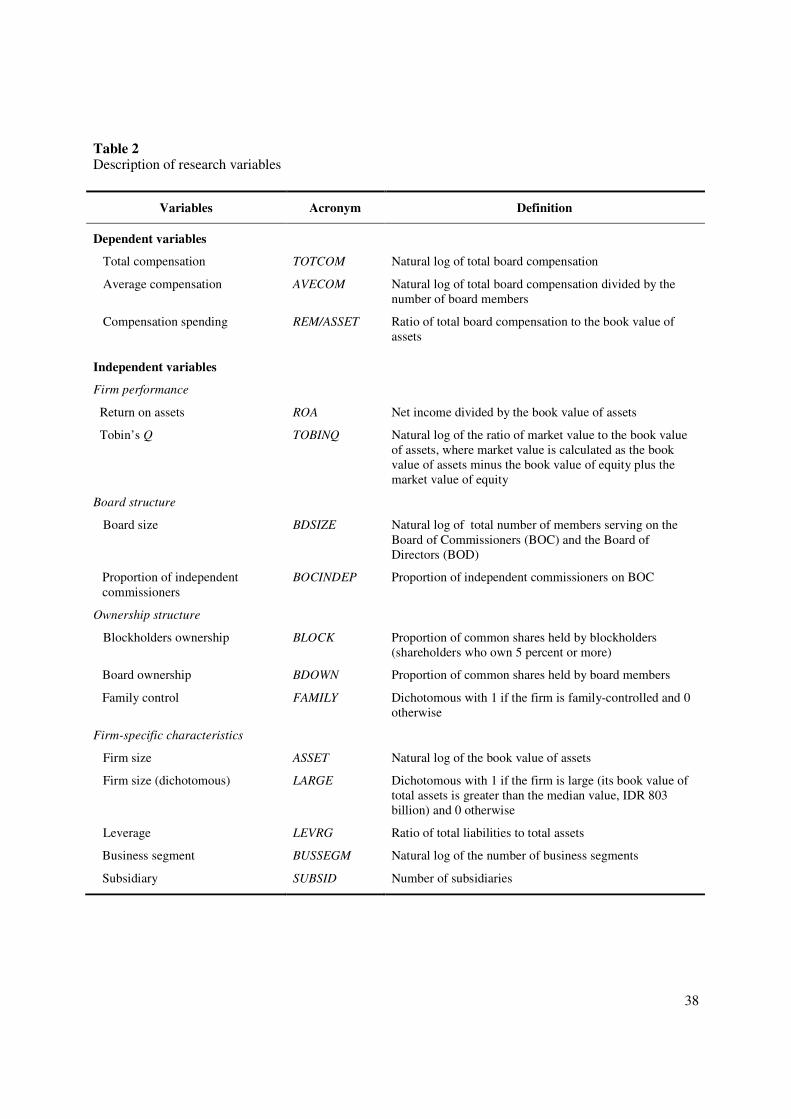
Table 2 shows the description of research variables. I include independent variables on firm
performance, board structure, ownership ownership, and firm-specific characteristics in our
models. The numbers of business segments and subsidiaries are used as proxies for business
complexity. Additionally, concentrated ownership is measured using the proportions of common
shares held by the largest shareholder and blockholders. Following previous studies (Mak and
Kusnadi, 2005; Haniffa and Hudaib, 2006), blockholders are defined as shareholders who own 5
percent of common shares or more.
In determining whether a firm is family-controlled, relatively similar to some prior studies
(Claessens et al., 2000; Faccio and Lang, 2002; Achmad, 2006), I classify the sample firms into
four groups based on the largest shareholder. The types of the largest shareholder are foreign
institutions, government entities, domestic non-business entities (cooperatives and foundations),
and domestic business entities. Firms whose the largest shareholder is domestic business entities
are considered family-controlled firms, except in pyramiding and cross-shareholding cases[3].
[Insert Table 2 about here]
5. Empirical results and discussions
5.1. Descriptive statistics and univariate analysis
Table 3 reports descriptive statistics of variables used in the present study. Total board
compensation (TOTCOM) is found to vary greatly, ranging from Indonesian Rupiah (IDR) 49
million to IDR 297 billion per annum. Accordingly, such a great variability is also found in
19
average board compensation (AVECOM). Further, the sample firms on average expend 0.9
percent of the book value of their assets to compensate their board members (COM/ASSET).
As indicated by previous Indonesian studies, ROA of the sample firms also shows a great
range, with the average of 3.22 percent. The market value of these firms generally exceeds their
book value of assets, which is indicated by the average Tobin’s Q of 1.69. With respect to board
structure, the combined number of people serving on BOC and BOD (BDSIZE) is 8.79, on
average. The mean and median values of the proportion of independent commissioners
(BOCINDEP) are 0.38 and 0.33, respectively. Hence, most firms in our sample have complied
with the country’s capital market regulations, which require listed firms to have independent
commissioners of at least 30 percent of the number of BOC members.
In terms of ownership structure, the descriptive statistics confirm the findings of Claessens
et al. (2000) in their studies on nine East Asian markets, including Indonesia. They document
that concentrated ownership is common among listed firms in these countries. Among my
sample firms, the proportion of shares held by blockholders (BLOCK) is 70 percent, on average.
In some cases, the largest shareholder appears to be the only blockholder, indicating that the
proportion of public ownership (i.e. shares that are freely traded on the stock exchange) is
relatively low. Claessens et al. (2000) also indicate that most listed firms in East Asian countries
are family-controlled. Accordingly, I find that 58 percent of the sample firms are family-
controlled, as indicated using a dichotomous variable (FAMILY). Even though most of the firms
are family-controlled, the shareholdings by BOC and BOD members (BDOWN) are quite
uncommon, where the mean and median values are 2 percent and zero, respectively.
From the 442 firm-year observations, there are 186 firms with complete data for both 2006
and 2007. I construct 186 observations to analyze changes in complete level and firm
20
performance. It is found that board compensation of my observations grows 29 percent on
average. The average values of the growth of ROA and Tobin’s Q are 17 percent and 60 percent,
respectively. Finally, the book value of assets shows positive annual growth of 26 percent in
2007, on average.
[Insert Table 3 about here]
Table 4 reports the comparison of mean values of selected variables between different
types of firm. Panel A shows the differences between larger and smaller firms. A firm is
considered large if its book value of assets is larger than the median value (IDR 803 billion). In
addition to total assets, total board compensation and ROA of the larger firms are found to be
significantly higher than their smaller counterparts. This may be partly due to the fact that larger
firms generally have more financial resources to compensate their board members with high
salary to cope with their complex operational activities. To deal with their nature of business,
those larger firms may also attract high-quality managers and provide them with higher pay
level. In terms of compensation spending (the ratio of total board compensation to total assets),
smaller firms expend significantly higher than their larger counterparts to pay their board
members. Thus, this confirms the proposition of Firth et al. (1999) that board pay in larger firms
seems to be insignificant compared to their large business scale.
Panel B differentiates between family-controlled and non-family-controlled firms. As
previously defined, a firm is considered family-controlled if its largest shareholder is a domestic
business entity, except in pyramiding and cross-shareholding cases. The total assets of non-
family firms are significantly larger than their family-controlled counterparts, implying that
family-controlled firms are likely to be smaller ones. Accordingly, total board compensation and
ROA of family-controlled firms are found to be significantly lower. In addition, compensation
21
spending, relative to total assets, of family-controlled firms is significantly higher than that of
non-family firms, but the difference is marginally significant at the 0.10 level.
[Insert Table 4 about here]
The results of correlation analysis, using Pearson correlation coefficients, are reported in
Table 5. It is revealed that TOTCOM is positively related to ASSET, implying that larger firms
expend higher absolute value of money to pay their board members. ASSET is found to be
positively correlated with four variables, namely ROA, BDSIZE, BUSSEGM, and SUBSID.
Accordingly, these four variables are positively associated with TOTCOM. These findings imply
that that higher absolute value of board compensation is likely to be expended by larger firms,
which are characterized by higher profitability, larger board size, and greater numbers of
business segments and subsidiaries. Further, ASSET has a negative association with FAMILY,
suggesting that family-controlled firms are likely to be smaller firms. In line with this, the
correlation between FAMILY and TOTCOM is found to be negative.
In terms of compensation expenditure relative to total assets (COM/ASSET), the table
shows that smaller firms spend higher proportion of their assets to pay their board members,
which can be seen from the negative correlation between ASSET and COM/ASSET. Smaller
board size, which is more likely to belong to smaller firms, is also significantly correlated with
higher COM/ASSET. Again, this confirms the proposition of Firth et al. (1999) that higher
absolute value of board compensation in large firms is insignificant compared to their larger
business scale.
Table 5 shows that both ASSET and BDSIZE have positive relationships with business
complexity, as measured by the numbers of business segments (BUSSEGM) and subsidiaries
(SUBSID). This result seems to suggest that larger firms employ more people on the board to
22
better deal with higher level of business complexity, and they thereby are willing to allocate
more financial resources to compensate their board members.
[Insert Table 5 about here]
5.2. Determinants of board compensation
I further conduct multivariate regression analyses to examine the impacts of firm
performance, board structure, ownership structure, and firm-specific characteristics on board
compensation. Before the regressions are run, the models need to be tested first to make sure that
they do not suffer from multicollinearity, heteroskedasticity, and autocorrelation problems. I deal
with potential heteroskedasticity and autocorrelation problems by using White or Newey-West
standard error estimates, as suggested by Brooks (2008). In terms of multicollinearity,
Wooldridge (2003) explains that the actual magnitude of a multicollinearity problem is not well-
defined. The results of the correlation analysis, as reported in Table 5, generally indicate that
multicollinearity problems do not exist.
To capture potential differences in compensation level across industries and years, I include
industry and year dummy variables, as suggested by Basu et al. (2007). For all models, I use
robust t-statistics, based on Newey-West heteroskedasticity- and autocorrelation-consistent
standard errors. Based on Equation (1), the regression result of the determinants of compensation
level is reported in Table 6. Models (1) and (2) indicate quite similar results, with Model (1)
showing stronger explanatory power.
From these three models, a positive and statistically significant coefficient is reported for
ROA but not on Tobin’s Q. Hence, this finding supports Hypothesis 1a and does not support
Hypothesis 2a. This is consistent with the results of previous studies, such as Abdul-Wahab and
23
Abdul-Rahman (2009) in the Malaysian setting. This suggests that highly-profitable firms pay
their board members more than their peers. On the other hand, this result indicates that firm
value is not a significant determinant of the compensation level. Higher level of ROA is
associated with larger firm size in Indonesia, as indicated by the result of correlation analysis
provided in Table 5. These larger firms probably have more financial resources to compensate
their board members and top executives.
With respect to board structure, I find that both BDSIZE and BOCINDEP are positively
related to compensation level. As such, Hypotheses 3a and 4a are supported. Again, size of the
firm may explain these positive associations. As presented in Table 5, the two variables are
positively correlated with ASSET at the 0.01 and 0.10 levels, respectively. This implies that firms
hiring greater number of board members and higher proportion of independent commissioners,
which are likely to have larger size, tend to allocate higher absolute value of their financial
resources for compensation. The positive association between board size and compensation level
confirms the findings of Sanders and Carpenter (1998) and Core et al. (1999). These large firms
may also have more financial resources to recruit greater number of and higher-quality
independent commissioners. Another possible interpretation is that independent commissioners
may be dominated by the management and non-independent commissioners in terms of the
arrangement of pay level, given a particular level of business complexity of the firm. This is
consistent with the finding of Core at al. (1999) and Li et al. (2007), which use the data from the
US and China, respectively.
Further, I find weak evidence on the association between ownership structure and the
compensation level. Consistent with my expectation, blockholders ownership (as a proxy for
concentrated ownership) has a negative association with the compensation package at the 0.10
24
level. From the theoretical viewpoint, this finding may imply that concentrated ownership in
Indonesia seems to be more efficient in monitoring and, thus, discouraging higher level of
compensation. However, in the case of Indonesia, I believe that firm size contributes to
explaining this positive association. Blockholders ownership is more prevalent in smaller firms,
which can be seen from a negative and significant correlation between BLOCK and ASSET as
presented in Table 5. These smaller firms probably have lower level of business complexity and,
hence, pay their board members lower than their larger counterparts. Board members ownership
(BDOWN) and family control (FAMILY) are found to have insignificant impacts on the pay level.
It should be noted that the influence of family control on compensation level, though significant,
is positive. The positive sign is contrary to that hypothesized. This may partly indicate that the
expropriation of assets by the controlling shareholder, which can be seen from the relatively
excessive compensation for board members, persists in family-controlled firms.
Supporting Hypothesis 8a, firm size (ASSET) has a positive and significant relationship
with compensation level. This finding is then consistent with the result of many studies
previously conducted. Larger firms may have more financial resources to hire greater number of
high-quality people serving in their boardrooms. Further, larger firms tend to have higher level of
business risks and diversification, thus they compensate their board members and executives
higher to handle such complex and highly-skilled jobs. Hypothesis 9a is also supported. This
supports my abovementioned view that firm size plays an important role in explaining the
significance of variables in our models in determining compensation level. Larger firms in
Indonesia tend to have greater number of business segments and subsidiaries. Hence, BUSSEGM
and SUBSID positively influence pay level, though marginally significant at the 0.10 level.
Finally, contrary to my expectation, the level of firm leverage (LEVRG) has an insignificant
25
association with pay level. Hence, financially-distressed firms pay their board members neither
significantly higher nor lower compared to their healthier counterparts.
Using compensation spending relative to firm size (COM/ASSET) as the dependent
variable, I report the regression results in Model (3) of Table 6. I start from ASSET. The
relationship between ASSET and COM/ASSET is negative. This finding suggests that smaller
firms expend higher percentage of their financial resources to compensate board members. As
suggested by Firth et al. (1999), higher level of compensation provided by large firms to their
board members and top management is relatively insignificant compared to their business scale.
Accordingly, family-controlled firms, which tend to be smaller in size, are more likely to allocate
higher proportion of their resources for board compensation, as indicated by the positive and
significant relationship (at the 0.05 level) between FAMILY and COM/ASSET. In line with these
findings, ROA (which is positively correlated with ASSET) is found to have a negative
association with the compensation spending relative to firm size.
It is found that board ownership is negatively associated with COM/ASSET, suggesting that
board members do not benefit from its share ownership to allocate more resources to reward
themselves. The increase of their wealth may also be obtained from other sources, such as
dividend payouts for themselves as the shareholders, as well as control of the firm in the hand of
their family. The latter example is more prevalent in family-controlled firms, where family
members of the controlling shareholder are commonly involved as the members of BOC and
BOD (Achmad, 2006).
[Insert Table 6 about here]
26
5.3. Pay-performance relationship: Do firm size and family control matter?
In addressing the factors influencing the relationship between compensation level and firm
performance, I consider two main features of the Indonesian capital market. First, I consider
whether firm size plays an important role in explaining pay-performance relationship. The
trading and liquidity of the country’s capital market are heavily dominated by larger firms. The
largest fifty firms account for more than 80 percent of IDX’s total market capitalization. Second,
I also consider family control, underlying the documentation of Claessens et al. (2000) that listed
firms on East Asian capital markets, including Indonesia, are mainly family-controlled.
I test the impacts of firm size and family control by interacting performance measures and
dichotomous variables indicating whether firms are larger and family-controlled. The results are
presented in Table 7. For the sake of brevity, I use two dependent variables only, namely
TOTCOM and COM/ASSET. Models (1) and (3) report the results considering firm size, while
the results involving family control are shown in Models (2) and (4).
The results reveal that firm size and family control are significant determinants of pay-
performance relationship. Firm size significantly explains the relationship between Tobin’s Q
and total board compensation. This implies that among larger firms, higher compensation level is
associated with higher market value. Larger firms tend to dominate the trading on the stock
exchange, resulting in wider coverage by analysts and the media (Haniffa and Hudaib, 2006) and
higher demand by investors. Thus, it is not uncommon that market prices of large firms’ shares
are far exceeding their par values. From my finding, it is found that board members of larger
firm are paid higher when the firm value is higher. Further, the interaction of ROA and LARGE is
negatively associated with COM/ASSET.
27
Differently, family control significantly and positively influences the relationship between
accounting profitability and total board compensation, though marginally significant at the 0.10
level. Hence, among family-controlled firms, board members are paid higher as the profitability
increases. In such firms, where the family control is prevalent, profitability seems to be an
important issue in determining the board pay. Board members are rewarded more for their
success in generating profit. However, both firm size and family control are found not to
significantly influence the relationship between firm performance and COM/ASSET.
[Insert Table 7 about here]
5.4. Pay-performance sensitivity
Similar to a number of studies in the literature, I examine whether changes in firm
performance lead to changes in the compensation level. The results of this examination are
presented in Table 8. For all models, I include industry dummies and use robust t-statistics based
on White heteroskedasticity-consistent standard errors. It can be seen that Models (1) and (2)
have weak explanatory powers (p-values of the F-statistics are greater than 0.10). Even though
these two models are not good enough to explain the variability of changes in board
compensation level, it is found that changes in Tobin’s Q are positively associated with changes
in total board compensation, as shown in Model (1). This suggests that enhanced firm value
appears to be the firm’s consideration to increase the pay level of their board members. This may
be related to the goal of the firm, which is maximizing the wealth of its shareholders. Thus, when
firm value (Tobin’s Q) is enhanced, the shareholders seem to appreciate the performance of the
board members and then increase their compensation. This finding is in line with previous
empirical evidence, such as Firth et al. (2006) and Merhebi (2006), who find that the increase of
28
the shareholders’ wealth has a positive and significant relationship with the increase of CEO pay.
On the other hand, changes in profitability (ROA) are not significantly associated with such
changes in the compensation level, implying that firm value is considered more important in
reflecting the performance of board members.
As reported in Model (3) of Table 8, changes in Tobin’s Q are again found to be positively
related to the changes in compensation spending relative to firm size (ChCOM/ASSET). It is
important to note that Model (3) is highly significant (F-statistic = 139.755) in explaining the
variability of ChCOM/ASSET. As such, when the firm value is enhanced, it seems that the
shareholders are happy to expend increased proportion of the firm’s assets to reward their board
members. Additionally, changes in ROA are also marginally significant at the 0.10 level. This
implies that to a particular extent, the increase of profitability may be behind the decision of the
shareholders to increase the compensation spending, relative to firm size, for board members.
[Insert Table 8 about here]
Next, I examine the impacts of firm size and family control on the pay-performance
sensitivity. The results are reported in Table 9. Again, for the sake of brevity, the dependent
variables employed here are TOTREM and COM/ASSET. Models (1) and (3) involve the
interaction between firm size and changes in firm performance, while the interaction between
family control and changes in firm performance are reported in Models (2) and (4).
In terms of total board compensation, firm size is not significant in explaining the pay-
performance sensitivity. On the other hand, family control is significant at the 0.05 level in
explaining the relationship between changes in Tobin’s Q and changes in board pay. This implies
that the positive influence of changes in Tobin’s Q on changes in total board compensation is
stronger in family-controlled firms. These firms, which may not be widely covered by the
29
analysts and highly-demanded by investors, might see the increase in firm value as an
extraordinary achievement, so that they increase the level of compensation paid to their board
members. I find the same condition when considering changes in compensation spending. Firm
size is again found not to be significant in explaining the association between changes in firm
performance and changes in compensation spending. Similar to the finding in Model (2), the
positive effect of the changes in firm value on changes in compensation spending is stronger in
family-controlled firms. Different from the other three models, the F-statistic of Model (4)
suggests that the model is very good in explaining variability of the compensation spending
changes. Further, findings reported in Table 9 also generally suggest that neither firm size nor
family control is significant to explain the sensitivity between profitability and board
compensation.
[Insert Table 9 about here]
6. Concluding remarks
Previous research on board and executive pay is mostly based on developed economies.
This paper extends the existing literature by investigating the determinants of board
compensation in a developing country that adopts a two-tier board system and has a weaker
disclosure environment. Being one of twenty largest economies in the world, Indonesia is one of
the main emerging markets in Asia and attracts growing foreign portfolio investments. It is
hypothesized that firm performance, board structure, ownership structure, and firm-specific
characteristics are significantly associated with board compensation. This study uses three
different dependent variables, namely total board compensation, average board compensation,
and compensation spending relative to total assets.
30
This study employs an unbalanced panel data set, comprising 442 firm-year observations of
255 non-financial firms listed on the IDX in the financial years 2006 and 2007. The results from
the multivariate regression analyses reveal that firm size, profitability, board size, board
independence, and business complexity are positively associated with compensation level. In
addition, blockholders ownership is found to be negatively related. It is important to note that
larger firms are featured by higher profitability, larger board size, higher board independence,
lower level of blockholders ownership, and higher level of business complexity, based on the
result of correlation analysis. Provided this condition, firm size plays an important role in the
interpretation of the regression results. When compensation spending, relative to firm size, is
employed as the dependent variable, it is found that firm size and ROA are negatively associated
with the expenditure. Family control, which is less prevalent in large firms, is found to be
positively significant. Again, firm size plays an important role in interpreting the results. Even
though larger firms provide higher compensation level for their board members, the amount is
considered insignificant compared to their total assets, as suggested by Firth et al. (1999). On the
other hand, family-controlled firms, which are likely to be smaller ones, tend to expend higher
proportion of their financial resources to compensate their boards.
In the pay-performance analysis, my results reveal a number of major findings. First, firm
size positively influences the relationship between Tobin’s Q and compensation level. This
suggests that among large firms, firm value is considered important in determining the board
pay. Differently, family control is found to positively affect the association between ROA and
pay level at the 0.10 level. As such, in firms where the family control is prevalent, profitability
seems to be an important issue in determining the board pay. Second, based on 186 cross-
sectional observations, it is found that changes in total compensation level and spending have
31
positive and significant relationships with changes in Tobin’s Q. The shareholders may
appreciate the management and board members for the increases in firm value and their wealth,
leading to the increases in compensation level and spending. This pay-performance sensitivity is
stronger in family-controlled firms.
This research is subject to some limitations. First, it only employs the data for two financial
years. Hence, future research needs to use longer time span to provide more powerful insights
into the determinants of board compensation. Second, OLS is mainly used as a tool in the
multivariate regression analyses in this study. Using longer time span, more sophisticated
estimation techniques may need to be employed to check the robustness of the results.
My results may also bring some practical implications. Based on the findings of my pay-
performance analysis, this seems that top management of the Indonesian listed firms tends to be
relatively less rewarded for the improvement of firm performance. This research then confirms
the importance of a remuneration committee, which is expected to provide independent
recommendations on the appropriate level of compensation for top managers based on their
performance. However, in smaller firms, the costs to establish and maintain such a committee
may outweigh the benefits. In this case, independent commissioners on BOC are expected to
play such a role.
Notes
[1] From my observation, there are very few listed firms that disclose the details of
compensation structure and levels for each individual board member.
[2] The use of the term “Board of Directors” within the context of Indonesia’s two-tier system is
obviously different from that in the unitary board system. Since BOD in Indonesia conducts
the day-to-day management of the firm, it is relatively equivalent to top management team
in the unitary system.
32
[3] I recognize that this identification method may be ambiguous to a particular extent.
Descriptive statistics in Table 3 shows that 58 percent of our observations are family-
controlled. Based on a sample of 178 Indonesian listed firms for the financial year 1996,
Claessens et al. (2000) documented that 69 percent of those firms are family-controlled.
Hence, I consider my identification method relatively appropriate. Following La Porta et al.
(1999), a firm’s structure is a pyramid if there is at least one listed firm between it and the
ultimate owner in the chain of control; while in a cross-shareholding, a listed firm own
shares in its controlling shareholders (another listed firm) or in the firms along the chain of
control. Claessens et al. (2000) suggest that pyramid structure and cross-shareholdings are
common in East Asian capital markets.
33
References
Abdul-Wahab, E. A. and Abdul-Rahman, R. (2009), “Institutional investors and director
remuneration: do political connections matter?” in Hirschey, M., John, K., and Makhija, A.
K. (Eds.), Corporate Governance and Firm Performance (Advances in Financial
Economics), Vol. 13, Emerald Group Publishing Limited, Bingley, UK, pp. 139-169.
Abdullah, S. N. (2006), “Directors’ remuneration, firm’s performance and corporate governance
in Malaysia among distressed companies”, Corporate Governance, Vol. 6 No. 2, pp. 162-
174.
Achmad, T. (2007), “Corporate governance of family firms and voluntary disclosure: the case of
Indonesian manufacturing firms”, Unpublished PhD thesis, The University of Western
Australia, Perth.
Adams, R. B. (2003), “What do boards do? Evidence from board committee and director
compensation data”, working paper, Federal Reserve Bank of New York, New York, 13
March.
Aggarwal, R. K. and Samwick, A. A. (1999), “Executive compensation, strategic competition,
and relative performance evaluation: theory and evidence”, Journal of Finance, Vol. 54 No.
6, pp. 1999-2043.
Anderson, R. C. and Bizjak, J. M. (2003), “An empirical examination of the role of the CEO and
the compensation committee in structuring executive pay”, Journal of Banking and Finance,
Vol. 27 No. 7, pp. 1323-1348.
Andjelkovic, A., Boyle, G., and McNoe, W. (2002), “Public disclosure of executive
compensation: do shareholders need to know?” Pacific-Basin Finance Journal, Vol. 10 No.
1, pp. 97-117.
Andreas, J. M., Rapp, M. S., and Wolff, M. (2010), “Determinants of director compensation in
two-tier systems: evidence from German panel data”, Review of Managerial Science, DOI:
10.1007/s11846-010-0048-z.
Basu, S., Hwang, L. S., Mitsudome, T., and Weintrop, J. (2007), “Corporate governance, top
executive compensation and firm performance in Japan”, Pacific-Basin Finance Journal,
Vol. 15 No. 1, pp. 56-79.
Berle, A. A. and Means, G. C. (1932), The Modern Corporation and Private Property,
Macmillan, New York.
Bizjak, J. M, Brickley, J., and Coles, J. M. (1993), “Stock-based incentive compensation and
investment behavior”, Journal of Accounting and Economics, Vol. 16 No. 1-3, pp. 349-372.
Bizjak, J. M., Lemmon, M. L., and Naveen, L. (2008), “Does the use of peer groups contribute to
higher pay and less efficient compensation?” Journal of Financial Economics, Vol. 90 No. 2,
pp. 152-168.
Brooks, C. (2008), Introductory Econometrics for Finance, 2nd edition, Cambridge University
Press, Cambridge, UK.
Brunello, G., Graziano, C., and Parigi, B. (2001),”Executive compensation and firm performance
in Italy”, International Journal of Industrial Organization, Vol. 19 No. 1-2, pp. 133-161.
Bushman, R. M, Indjejikian, R. J., and Smith, A. (1996), “CEO compensation: the role of
individual performance evaluation”, Journal of Accounting and Economics, Vol. 21 No. 2,
pp. 161-193.
Byrd, J., Cooperman, E. S., and Wolfe, G. A. (2010), “Director tenure and the compensation of
bank CEOs”, Managerial Finance, Vol. 36 No. 2, pp. 86-102.
34
Cheng, S. and Firth, M. (2006), “Family ownership, corporate governance, and top-management
compensation”, Managerial and Decision Economics, Vol. 27 No. 7, pp. 549-561.
Chhaochharia, V. and Grinstein, Y. (2009), “CEO compensation and board structure”, Journal of
Finance, Vol. 64 No. 1, pp. 231-261.
Chung, K. H. and Pruitt, S. W. (1996), “Executive ownership, corporate value, and executive
compensation: a unifying framework”, Journal of Banking and Finance, Vol. 20 No. 7, pp.
1135-1159.
Claessens, S., Djankov, S., and Lang, L. H. P. (2000), “The separation of ownership and control
in East Asian corporations”, Journal of Financial Economics, Vol. 58 No. 1-2, pp. 81-112.
Clarkson, P., Van Bueren, A. L., and Walker, J. (2006), “Chief executive officer remuneration
disclosure quality: corporate responses to an evolving disclosure environment”, Accounting
and Finance, Vol. 46 No. 5, pp. 771-796.
Coles, J.L., Daniel, N.D., and Naveen, L. (2008), “Boards: Does one size fit all?” Journal of
Financial Economics, Vol.87 No. 2, pp. 329-356.
Conyon, M. J. and He, L. (2004), “Compensation committee and CEO compensation incentives
in US entrepreneurial firms”, Journal of Management Accounting Research, Vol. 16 No. 1,
pp. 35-56.
Conyon, M. J. and Peck, S. I. (1998), “Board control, remuneration committees, and top
management compensation”, Academy of Management Journal, Vol. 41 No. 2, pp. 146-157.
Core, J. E., Holthausen, R. W., and Larcker, D. F. (1999), “Corporate governance, chief
executive officer compensation, and firm performance”, Journal of Financial Economics,
Vol. 51 No. 3, pp. 371-406.
Crystal, G. (1991), In Search of Excess: The Overcompensation of American Executives, W. W.
Norton & Company, New York.
Dalton, D. R., Daily, C. M., Johnson, J. L., and Ellstrand, A. E. (1999), “Number of directors and
financial performance: a meta-analysis”, Academy of Management Journal, Vol. 42 No. 6,
pp. 674-686.
Darmadi, S. (2010), “Women on top management and firm performance: Indonesian
evidence”,paper presented at the 3rd
International Accounting Conference, 27-28 October,
Bali.
Denis, D. K. (2001), “Twenty-five years of corporate governance research … and counting”,
Review of Financial Economics, Vol. 10 No. 3, pp. 191-212.
Dong, M. and Ozkan, A. (2008), “Institutional investor and board pay: an empirical study of UK
companies”, Journal of Multinational Financial Management, Vol. 18 No. 1, pp. 16-29.
Eisenberg, T., Sundgren, S., and Wells, M. (1998), “Larger board size and decreasing firm value
in small firms”, Journal of Financial Economics, Vol. 48 No. 1, pp. 35-54.
Faccio, M. and Lang, L. H. P. (2002), “The ultimate ownership of Western European
corporations”, Journal of Financial Economics, Vol. 65 No. 3, pp. 365-395.
Fama, E. F. (1980), “Agency problems and theory of the firm”, Journal of Political Economy,
Vol. 88 No. 2, pp. 288-307.
Fama, E. F. and Jensen, M. C. (1983), “Separation of ownership and control”, Journal of Law
and Economics, Vol. 26, pp. 301-325.
Firth, M., Fung, P. M. Y., and Rui, O. M. (2006), “Corporate performance and CEO
compensation in China”, Journal of Corporate Finance”, Vol. 12 No. 4, pp. 693-714.
Firth, M., Tam, M., and Tang, M. (1999), “The determinants of top management pay”, Omega:
The International Journal of Management Science, Vol. 27 No. 6, pp. 617-635.
35
Hallock, K. and Murphy, K. J. (1999), The Economics of Executive Compensation, Edward Elgar
Publishing, Cheltenham, UK.
Hambrick, D. C. and Finkelstein, S. (1995), “The effects of ownership structure on conditions at
the top: the case of CEO pay raises”, Strategic Management Journal, Vol. 16 No. 3, pp. 175-
193.
Haniffa, R. and Hudaib, M. (2006), “Corporate governance structure and performance of
Malaysian listed companies”, Journal of Business Finance and Accounting, Vol. 33 No. 7-8,
pp. 1034-1062.
Holmstrom, B. (1979), “Moral hazard and observability”, Bell Journal of Economics, Vol. 10
No. 1, pp. 74-91.
Holthausen, R., Larcker, D., and Sloan, R. (1995), “Annual bonus schemes and the manipulation
of earnings”, Journal of Accounting and Economics, Vol. 19 No. 1, pp. 29-74.
Hubbard, R. and Palia, D. (1995), “Executive pay and performance: evidence from the US
banking industry”, Journal of Financial Economics, Vol. 39 No. 1, pp. 105-130.
Jensen, M. C. and Meckling, W. (1976), “Theory of the firm: managerial behavior, agency costs
and ownership structure”, Journal of Financial Economics, Vol. 3 No. 4, pp. 305-360.
Jensen, M. C. and Murphy, K. J. (1990), “Performance pay and top-management incentives”,
Journal of Political Economy, Vol. 98 No. 2, pp. 225-264.
Jiang, H., Habib, A., and Smallman, C. (2009), “The effect of ownership concentration on CEO
compensation-firm performance relationship in New Zealand”, Pacific Accounting Review,
Vol. 21 No. 2, pp. 104-131.
Jackson, S. (1992), “Consequences of group composition for the interpersonal dynamics of
strategic issue processing”, in Dutton, J., Huff, A., and Shrivastava, P. (Eds.), Advances in
Strategic Management, Vol. 8, JAI Press, Greenwich, CT, pp. 345-382.
John, T. and John, K. (1993), “Top-management compensation and capital structure”, Journal of
Finance, Vol. 48 No. 3, pp. 949-974.
Jones, D. and Kato, T. (1996), “The determinants of chief executive compensation in transitional
economies: evidence from Bulgaria”, Labour Economics, Vol. 3 No. 3, pp. 319-336.
Kaplan, S. N. (1998), “Top executive incentives in Germany, Japan, and the US: a comparison”,
working paper, University of Chicago, Chicago, February.
Kaplan, S. N. and Minton, B. A. (1994), “Appointments of outsiders to Japanese boards:
determinants and implications for managers”, Journal of Financial Economics, Vol. 36 No.
2, pp. 225-258.
La Porta, R., Lopez-de-Silanes, F., and Shleifer, A. (1999), “Corporate ownership around the
world”, Journal of Finance, Vol.54 No. 2, pp. 471-518.
Laing, D. and Weir, C. (1999), “Corporate performance and the influence of human capital
characteristics on executive compensation in the UK”, Personnel Review, Vol. 28 No. 1-2,
pp. 28-40.
Li, D., Moshirian, F., Nguyen, P., and Tan, L. (2007), “Corporate governance or globalization:
what determines CEO compensation in China?” Research in International Business and
Finance, Vol. 21 No. 1, pp. 32-49.
Mak, Y.T. and Kusnadi, Y. (2005), “Size really matters: further evidence on the negative
relationship between board size and firm value”, Pacific-Basin Finance Journal, Vol. 13 No.
3, pp. 301-318.
Mak, Y.T. and Li, Y. (2001), “Determinants of corporate ownership and board structure:
evidence from Singapore”, Journal of Corporate Finance, Vol. 7 No. 3, pp. 235-256.
36
Mehran, H. (1995), “Executive compensation structure, ownership, and firm performance”,
Journal of Financial Economics, Vol. 38 No. 2, pp. 163-184.
Merhebi, R., Pattenden, K., Swan, P. L., and Zhou, X. (2006), “Australian chief executive officer
remuneration: pay and performance”, Accounting and Finance, Vol. 46 No. 3, pp. 481-497.
Muslu, V. (1998), “Effect of board independence on incentive compensation and compensation
disclosure: evidence from Europe”, unpublished PhD thesis, Massachusetts, Institute of
Technology, Cambridge, MA.
Newman, H. A. and Mozes, H. A. (1999), “Does the composition of the compensation
committee influence CEO compensation practices?” Financial Management, Vol. 28 No. 3,
pp. 41-53.
O’Reilly, C., Main, B., and Crystal, G. (1988), “CEO compensation as tournament and social
comparison: a tale of two theories”, Administrative Science Quarterly, Vol. 33 No. 2, pp.
257-274.
Pearce II, J. A. and Zahra, S. A. (1992), “Board composition from a strategic contingency
perspective”, Journal of Management Studies, Vol. 29 No. 4, pp. 411-438.
Rosen, S. (1992), “Contracts and the market for executives”, in Werin, L. and Wijkander, H.
(Eds.), Contractual Economics, Blackwell, Oxford, UK, pp. 181-211.
Sanders, W. M. G. and Carpenter, M. A. (1998), “The roles of CEO compensation, top team
composition, and board structure”, Academy of Management Journal, Vol. 41 No. 2, pp. 158-
178.
Shaw, K. W. and Zhang, M. H. (2010), “Is CEO cash compensation punished for poor firm
performance?”Accounting Review, Vol. 85 No. 3, pp. 1065-1093.
Shivdasani, A. (1993), “Board composition, ownership structure, and hostile takeovers”, Journal
of Accounting and Economics, Vol. 16 No. 1-3, pp. 167-198.
Shleifer, A. and Vishny R. W. (1986), “Large shareholders and corporate control”, Journal of
Political Economy, Vol. 94 No. 3, pp. 461-488.
Simon, H. A. (1957), “Compensation of executives”, Sociometry, Vol. 20 No. 1, pp. 32-35.
Unite, A. A., Sullivan, M. J., Brookman, J., Majadillas, M. A., and Taningco, A. (2008),
“Executive pay and firm performance in the Philippines”, Pacific-Basin Finance Journal,
Vol. 16 No. 5, pp. 606-623.
Vafeas, N. (2003), “Further evidence on compensation committee composition as a determinant
of CEO compensation”, Financial Management, Vol. 32 No. 2, pp. 53-70.
Wooldridge, J. M. (2003), Introductory Econometrics: A Modern Approach, 2nd edition, South-
Western, Mason, OH.
Yermack, D. (1996), “Higher market valuation of companies with a small board of directors”,
Journal of Financial Economics, Vol. 40 No. 2, pp. 185-211.
Zhou, X. (2000), “CEO pay, firm size, and corporate performance: evidence from Canada”,
Canadian Journal of Economics, Vol. 33 No. 1, pp. 213-251.
37
Table 1 Sample description
The final sample comprises an unbalanced panel data set of 442 firm-year observations, covering 255 unique non-
financial firms listed on the Indonesia Stock Indonesia (IDX), previously known as the Jakarta Stock Exchange
(JSX), during the financial years 2006 and 2007. Panel A shows the selection process to obtain the final sample.
Panel B shows industry breakdown of the sample firms. The sample firms come from eight non-financial sectors on
the IDX.
Description 2006 2007 Total
Panel A: Sample selection process
IDX’s listed firms as at 31 December 344 383 727
Financial firms (65) (68) (133)
Firms with negative book value of equity (20) (23) (43)
Firms with incomplete data (65) (44) (109)
Sample firms 194 248 442
Panel B: Industry breakdown
Agriculture 6 11 17
Basic and chemical 42 44 86
Consumer goods 25 28 53
Infrastructure, utilities, and transportation 14 21 35
Mining 9 13 22
Miscellaneous 23 33 56
Property, real estate, and building construction 25 38 63
Trade, service, and investment 50 60 110
Sample firms 194 248 442
38
Table 2 Description of research variables
Variables Acronym Definition
Dependent variables
Total compensation TOTCOM Natural log of total board compensation
Average compensation AVECOM Natural log of total board compensation divided by the
number of board members
Compensation spending REM/ASSET Ratio of total board compensation to the book value of
assets
Independent variables
Firm performance
Return on assets ROA Net income divided by the book value of assets
Tobin’s Q TOBINQ Natural log of the ratio of market value to the book value
of assets, where market value is calculated as the book
value of assets minus the book value of equity plus the
market value of equity
Board structure
Board size BDSIZE Natural log of total number of members serving on the
Board of Commissioners (BOC) and the Board of
Directors (BOD)
Proportion of independent
commissioners
BOCINDEP Proportion of independent commissioners on BOC
Ownership structure
Blockholders ownership BLOCK Proportion of common shares held by blockholders
(shareholders who own 5 percent or more)
Board ownership BDOWN Proportion of common shares held by board members
Family control FAMILY Dichotomous with 1 if the firm is family-controlled and 0
otherwise
Firm-specific characteristics
Firm size ASSET Natural log of the book value of assets
Firm size (dichotomous) LARGE Dichotomous with 1 if the firm is large (its book value of
total assets is greater than the median value, IDR 803
billion) and 0 otherwise
Leverage LEVRG Ratio of total liabilities to total assets
Business segment BUSSEGM Natural log of the number of business segments
Subsidiary SUBSID Number of subsidiaries
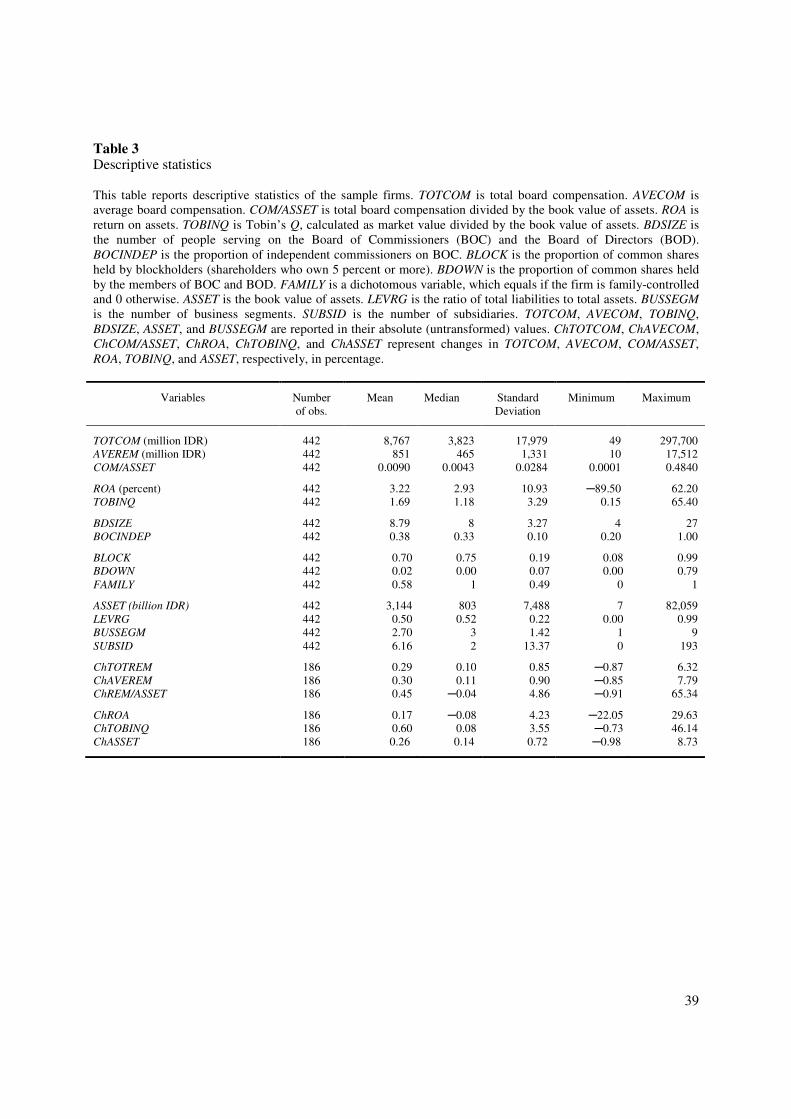
39
Table 3 Descriptive statistics
This table reports descriptive statistics of the sample firms. TOTCOM is total board compensation. AVECOM is
average board compensation. COM/ASSET is total board compensation divided by the book value of assets. ROA is
return on assets. TOBINQ is Tobin’s Q, calculated as market value divided by the book value of assets. BDSIZE is
the number of people serving on the Board of Commissioners (BOC) and the Board of Directors (BOD).
BOCINDEP is the proportion of independent commissioners on BOC. BLOCK is the proportion of common shares
held by blockholders (shareholders who own 5 percent or more). BDOWN is the proportion of common shares held
by the members of BOC and BOD. FAMILY is a dichotomous variable, which equals if the firm is family-controlled
and 0 otherwise. ASSET is the book value of assets. LEVRG is the ratio of total liabilities to total assets. BUSSEGM
is the number of business segments. SUBSID is the number of subsidiaries. TOTCOM, AVECOM, TOBINQ,
BDSIZE, ASSET, and BUSSEGM are reported in their absolute (untransformed) values. ChTOTCOM, ChAVECOM,
ChCOM/ASSET, ChROA, ChTOBINQ, and ChASSET represent changes in TOTCOM, AVECOM, COM/ASSET,
ROA, TOBINQ, and ASSET, respectively, in percentage.
Variables Number
of obs.
Mean Median Standard
Deviation
Minimum Maximum
TOTCOM (million IDR) 442 8,767 3,823 17,979 49 297,700
AVEREM (million IDR) 442 851 465 1,331 10 17,512
COM/ASSET 442 0.0090 0.0043 0.0284 0.0001 0.4840
ROA (percent) 442 3.22 2.93 10.93 ─89.50 62.20
TOBINQ 442 1.69 1.18 3.29 0.15 65.40
BDSIZE 442 8.79 8 3.27 4 27
BOCINDEP 442 0.38 0.33 0.10 0.20 1.00
BLOCK 442 0.70 0.75 0.19 0.08 0.99
BDOWN 442 0.02 0.00 0.07 0.00 0.79
FAMILY 442 0.58 1 0.49 0 1
ASSET (billion IDR) 442 3,144 803 7,488 7 82,059
LEVRG 442 0.50 0.52 0.22 0.00 0.99
BUSSEGM 442 2.70 3 1.42 1 9
SUBSID 442 6.16 2 13.37 0 193
ChTOTREM 186 0.29 0.10 0.85 ─0.87 6.32
ChAVEREM 186 0.30 0.11 0.90 ─0.85 7.79
ChREM/ASSET 186 0.45 ─0.04 4.86 ─0.91 65.34
ChROA 186 0.17 ─0.08 4.23 ─22.05 29.63
ChTOBINQ 186 0.60 0.08 3.55 ─0.73 46.14
ChASSET 186 0.26 0.14 0.72 ─0.98 8.73
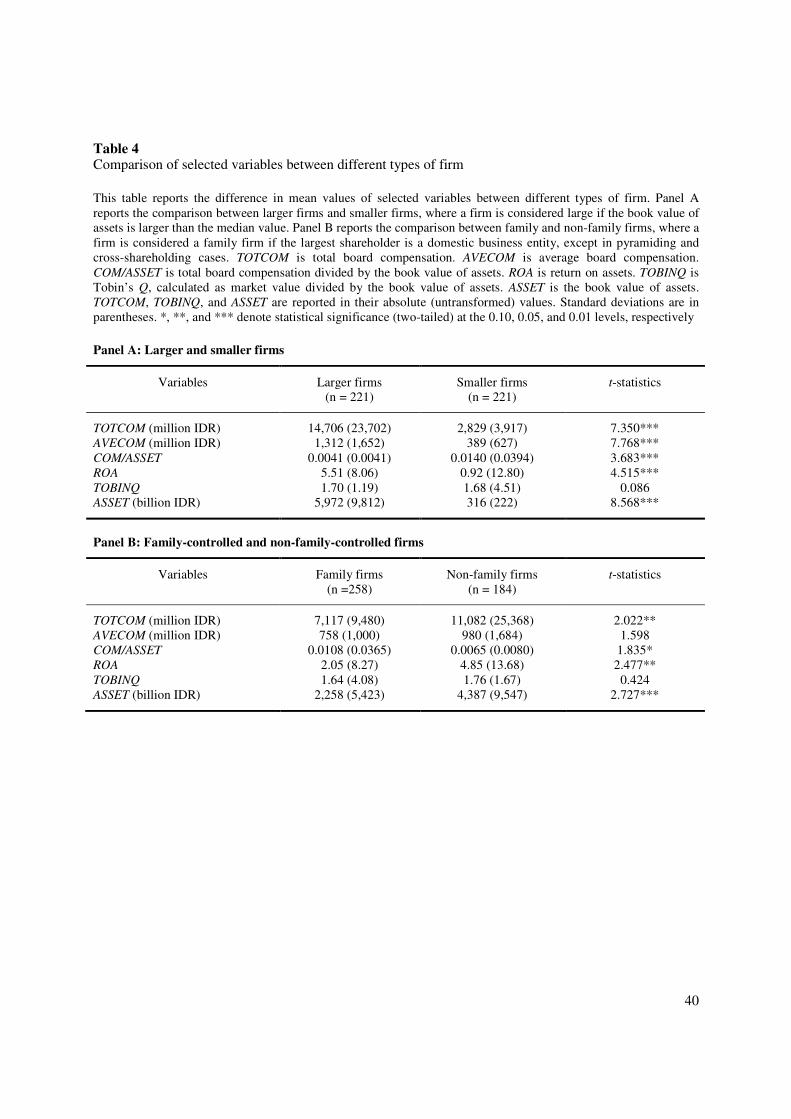
40
Table 4 Comparison of selected variables between different types of firm
This table reports the difference in mean values of selected variables between different types of firm. Panel A
reports the comparison between larger firms and smaller firms, where a firm is considered large if the book value of
assets is larger than the median value. Panel B reports the comparison between family and non-family firms, where a
firm is considered a family firm if the largest shareholder is a domestic business entity, except in pyramiding and
cross-shareholding cases. TOTCOM is total board compensation. AVECOM is average board compensation.
COM/ASSET is total board compensation divided by the book value of assets. ROA is return on assets. TOBINQ is
Tobin’s Q, calculated as market value divided by the book value of assets. ASSET is the book value of assets.
TOTCOM, TOBINQ, and ASSET are reported in their absolute (untransformed) values. Standard deviations are in
parentheses. *, **, and *** denote statistical significance (two-tailed) at the 0.10, 0.05, and 0.01 levels, respectively
Panel A: Larger and smaller firms
Variables Larger firms
(n = 221)
Smaller firms
(n = 221)
t-statistics
TOTCOM (million IDR) 14,706 (23,702) 2,829 (3,917) 7.350***
AVECOM (million IDR) 1,312 (1,652) 389 (627) 7.768***
COM/ASSET 0.0041 (0.0041) 0.0140 (0.0394) 3.683***
ROA 5.51 (8.06) 0.92 (12.80) 4.515***
TOBINQ 1.70 (1.19) 1.68 (4.51) 0.086
ASSET (billion IDR) 5,972 (9,812) 316 (222) 8.568***
Panel B: Family-controlled and non-family-controlled firms
Variables Family firms
(n =258)
Non-family firms
(n = 184)
t-statistics
TOTCOM (million IDR) 7,117 (9,480) 11,082 (25,368) 2.022**
AVECOM (million IDR) 758 (1,000) 980 (1,684) 1.598
COM/ASSET 0.0108 (0.0365) 0.0065 (0.0080) 1.835*
ROA 2.05 (8.27) 4.85 (13.68) 2.477**
TOBINQ 1.64 (4.08) 1.76 (1.67) 0.424
ASSET (billion IDR) 2,258 (5,423) 4,387 (9,547) 2.727***
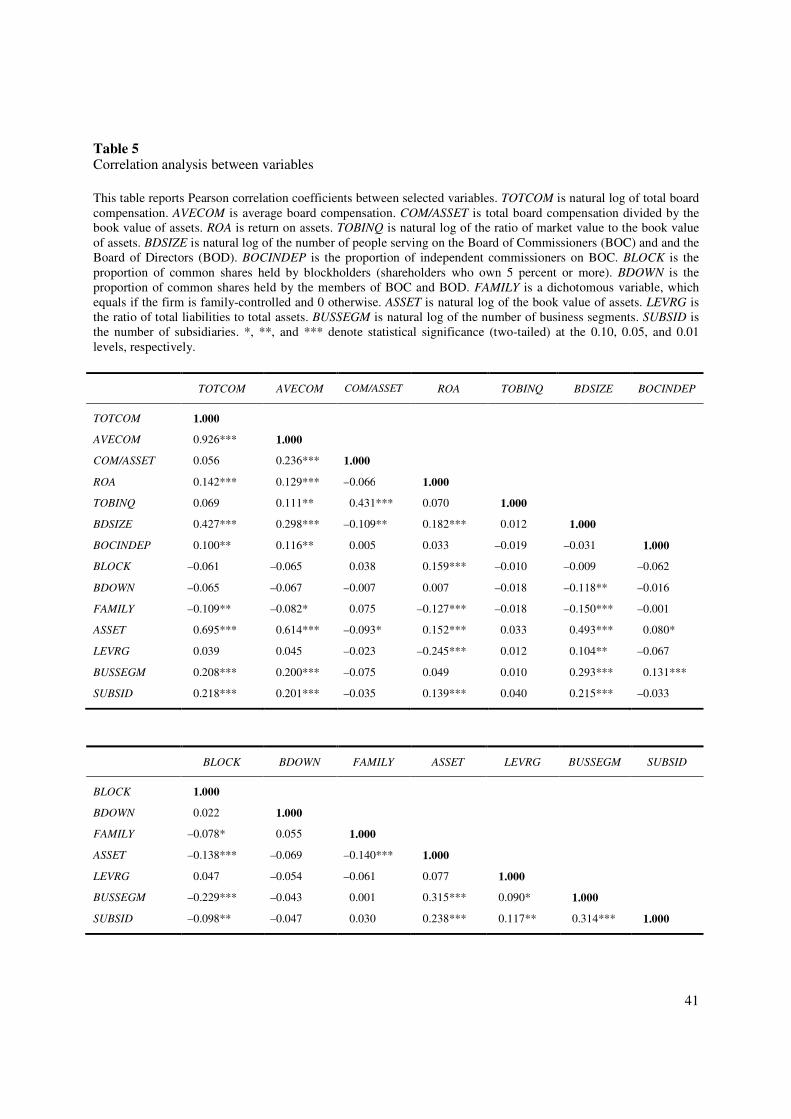
41
Table 5 Correlation analysis between variables
This table reports Pearson correlation coefficients between selected variables. TOTCOM is natural log of total board
compensation. AVECOM is average board compensation. COM/ASSET is total board compensation divided by the
book value of assets. ROA is return on assets. TOBINQ is natural log of the ratio of market value to the book value
of assets. BDSIZE is natural log of the number of people serving on the Board of Commissioners (BOC) and and the
Board of Directors (BOD). BOCINDEP is the proportion of independent commissioners on BOC. BLOCK is the
proportion of common shares held by blockholders (shareholders who own 5 percent or more). BDOWN is the
proportion of common shares held by the members of BOC and BOD. FAMILY is a dichotomous variable, which
equals if the firm is family-controlled and 0 otherwise. ASSET is natural log of the book value of assets. LEVRG is
the ratio of total liabilities to total assets. BUSSEGM is natural log of the number of business segments. SUBSID is
the number of subsidiaries. *, **, and *** denote statistical significance (two-tailed) at the 0.10, 0.05, and 0.01
levels, respectively.
TOTCOM AVECOM COM/ASSET ROA TOBINQ BDSIZE BOCINDEP
TOTCOM 1.000
AVECOM 0.926*** 1.000
COM/ASSET 0.056 0.236*** 1.000
ROA 0.142*** 0.129*** –0.066 1.000
TOBINQ 0.069 0.111** 0.431*** 0.070 1.000
BDSIZE 0.427*** 0.298*** –0.109** 0.182*** 0.012 1.000
BOCINDEP 0.100** 0.116** 0.005 0.033 –0.019 –0.031 1.000
BLOCK –0.061 –0.065 0.038 0.159*** –0.010 –0.009 –0.062
BDOWN –0.065 –0.067 –0.007 0.007 –0.018 –0.118** –0.016
FAMILY –0.109** –0.082* 0.075 –0.127*** –0.018 –0.150*** –0.001
ASSET 0.695*** 0.614*** –0.093* 0.152*** 0.033 0.493*** 0.080*
LEVRG 0.039 0.045 –0.023 –0.245*** 0.012 0.104** –0.067
BUSSEGM 0.208*** 0.200*** –0.075 0.049 0.010 0.293*** 0.131***
SUBSID 0.218*** 0.201*** –0.035 0.139*** 0.040 0.215*** –0.033
BLOCK BDOWN FAMILY ASSET LEVRG BUSSEGM SUBSID
BLOCK 1.000
BDOWN 0.022 1.000
FAMILY –0.078* 0.055 1.000
ASSET –0.138*** –0.069 –0.140*** 1.000
LEVRG 0.047 –0.054 –0.061 0.077 1.000
BUSSEGM –0.229*** –0.043 0.001 0.315*** 0.090* 1.000
SUBSID –0.098** –0.047 0.030 0.238*** 0.117** 0.314*** 1.000
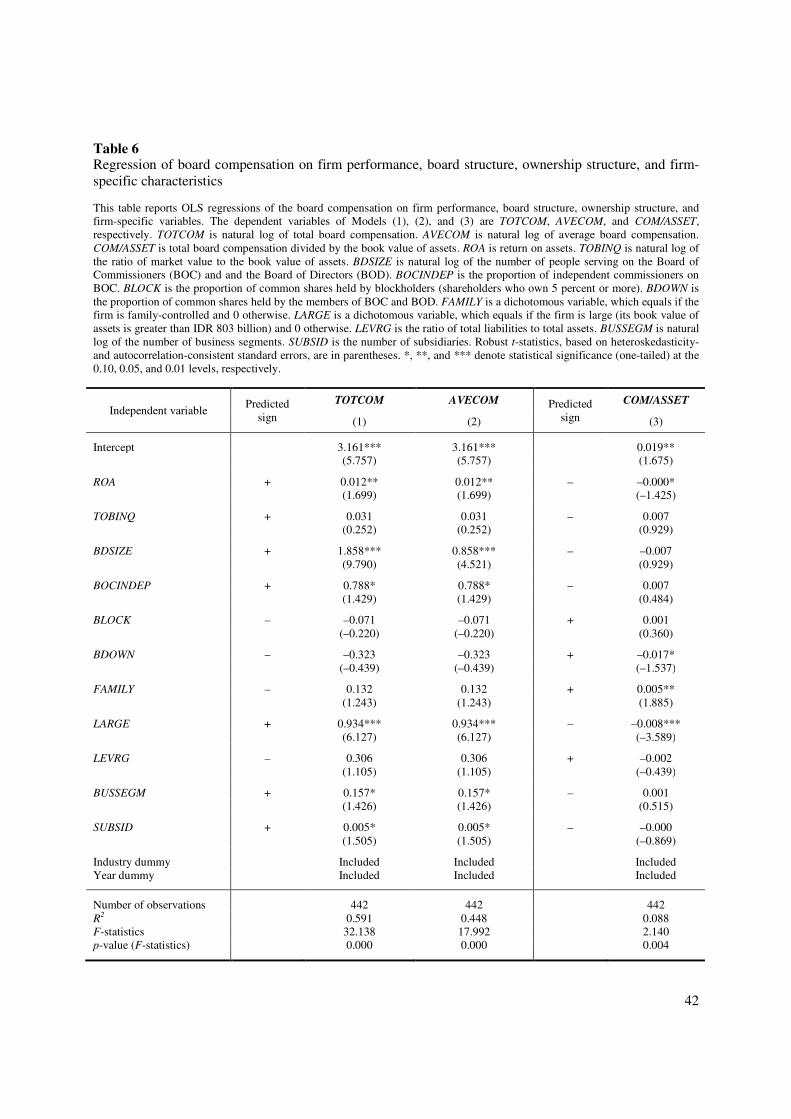
42
Table 6 Regression of board compensation on firm performance, board structure, ownership structure, and firm-
specific characteristics
This table reports OLS regressions of the board compensation on firm performance, board structure, ownership structure, and
firm-specific variables. The dependent variables of Models (1), (2), and (3) are TOTCOM, AVECOM, and COM/ASSET,
respectively. TOTCOM is natural log of total board compensation. AVECOM is natural log of average board compensation.
COM/ASSET is total board compensation divided by the book value of assets. ROA is return on assets. TOBINQ is natural log of
the ratio of market value to the book value of assets. BDSIZE is natural log of the number of people serving on the Board of
Commissioners (BOC) and and the Board of Directors (BOD). BOCINDEP is the proportion of independent commissioners on
BOC. BLOCK is the proportion of common shares held by blockholders (shareholders who own 5 percent or more). BDOWN is
the proportion of common shares held by the members of BOC and BOD. FAMILY is a dichotomous variable, which equals if the
firm is family-controlled and 0 otherwise. LARGE is a dichotomous variable, which equals if the firm is large (its book value of
assets is greater than IDR 803 billion) and 0 otherwise. LEVRG is the ratio of total liabilities to total assets. BUSSEGM is natural
log of the number of business segments. SUBSID is the number of subsidiaries. Robust t-statistics, based on heteroskedasticity-
and autocorrelation-consistent standard errors, are in parentheses. *, **, and *** denote statistical significance (one-tailed) at the
0.10, 0.05, and 0.01 levels, respectively.
Independent variable Predicted
sign
TOTCOM AVECOM Predicted
sign
COM/ASSET
(1) (2) (3)
Intercept 3.161*** 3.161*** 0.019**
(5.757) (5.757) (1.675)
ROA + 0.012** 0.012** – –0.000*
(1.699) (1.699) (–1.425)
TOBINQ + 0.031 0.031 – 0.007
(0.252) (0.252) (0.929)
BDSIZE + 1.858*** 0.858*** – –0.007
(9.790) (4.521) (0.929)
BOCINDEP + 0.788* 0.788* – 0.007
(1.429) (1.429) (0.484)
BLOCK – –0.071 –0.071 + 0.001
(–0.220) (–0.220) (0.360)
BDOWN – –0.323 –0.323 + –0.017*
(–0.439) (–0.439) (–1.537)
FAMILY – 0.132 0.132 + 0.005**
(1.243) (1.243) (1.885)
LARGE + 0.934*** 0.934*** – –0.008***
(6.127) (6.127) (–3.589)
LEVRG – 0.306 0.306 + –0.002
(1.105) (1.105) (–0.439)
BUSSEGM + 0.157* 0.157* – 0.001
(1.426) (1.426) (0.515)
SUBSID + 0.005* 0.005* – –0.000
(1.505) (1.505) (–0.869)
Industry dummy Included Included Included
Year dummy Included Included Included
Number of observations 442 442 442
R2 0.591 0.448 0.088
F-statistics 32.138 17.992 2.140
p-value (F-statistics) 0.000 0.000 0.004
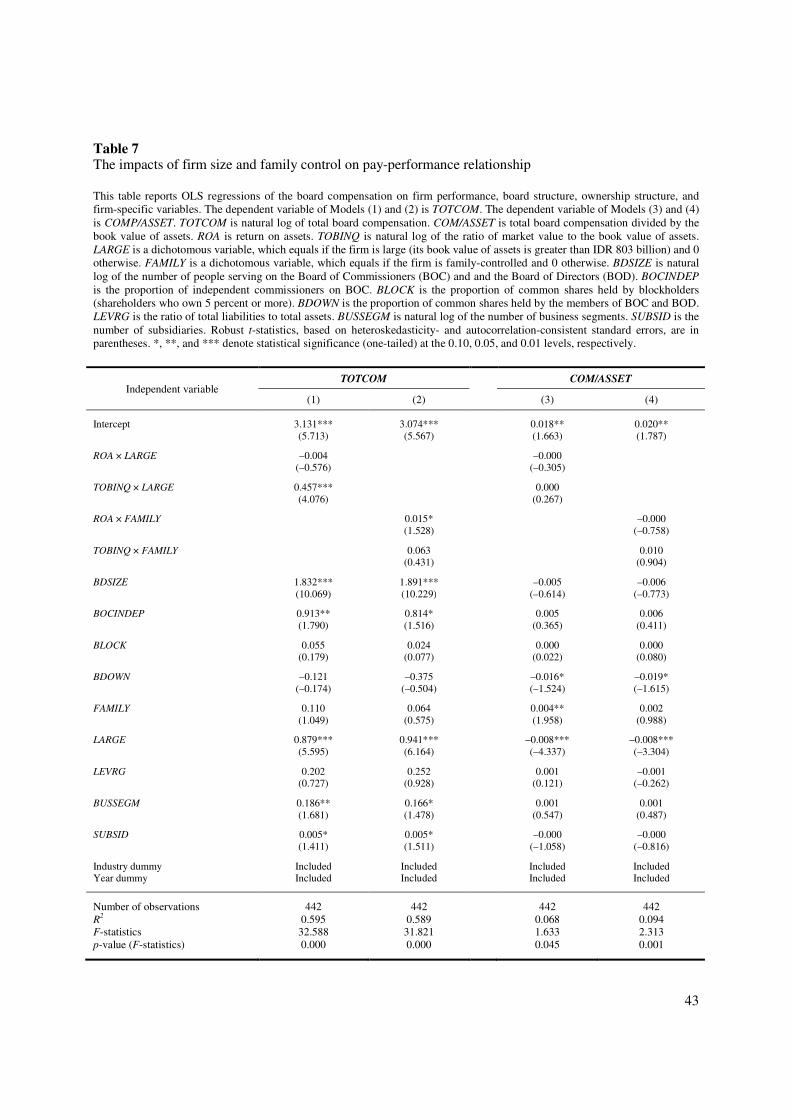
43
Table 7 The impacts of firm size and family control on pay-performance relationship
This table reports OLS regressions of the board compensation on firm performance, board structure, ownership structure, and
firm-specific variables. The dependent variable of Models (1) and (2) is TOTCOM. The dependent variable of Models (3) and (4)
is COMP/ASSET. TOTCOM is natural log of total board compensation. COM/ASSET is total board compensation divided by the
book value of assets. ROA is return on assets. TOBINQ is natural log of the ratio of market value to the book value of assets.
LARGE is a dichotomous variable, which equals if the firm is large (its book value of assets is greater than IDR 803 billion) and 0
otherwise. FAMILY is a dichotomous variable, which equals if the firm is family-controlled and 0 otherwise. BDSIZE is natural
log of the number of people serving on the Board of Commissioners (BOC) and and the Board of Directors (BOD). BOCINDEP
is the proportion of independent commissioners on BOC. BLOCK is the proportion of common shares held by blockholders
(shareholders who own 5 percent or more). BDOWN is the proportion of common shares held by the members of BOC and BOD.
LEVRG is the ratio of total liabilities to total assets. BUSSEGM is natural log of the number of business segments. SUBSID is the
number of subsidiaries. Robust t-statistics, based on heteroskedasticity- and autocorrelation-consistent standard errors, are in
parentheses. *, **, and *** denote statistical significance (one-tailed) at the 0.10, 0.05, and 0.01 levels, respectively.
Independent variable TOTCOM COM/ASSET
(1) (2) (3) (4)
Intercept 3.131*** 3.074*** 0.018** 0.020**
(5.713) (5.567) (1.663) (1.787)
ROA × LARGE –0.004 –0.000
(–0.576) (–0.305)
TOBINQ × LARGE 0.457*** 0.000
(4.076) (0.267)
ROA × FAMILY 0.015* –0.000
(1.528) (–0.758)
TOBINQ × FAMILY 0.063 0.010
(0.431) (0.904)
BDSIZE 1.832*** 1.891*** –0.005 –0.006
(10.069) (10.229) (–0.614) (–0.773)
BOCINDEP 0.913** 0.814* 0.005 0.006
(1.790) (1.516) (0.365) (0.411)
BLOCK 0.055 0.024 0.000 0.000
(0.179) (0.077) (0.022) (0.080)
BDOWN –0.121 –0.375 –0.016* –0.019*
(–0.174) (–0.504) (–1.524) (–1.615)
FAMILY 0.110 0.064 0.004** 0.002
(1.049) (0.575) (1.958) (0.988)
LARGE 0.879*** 0.941*** –0.008*** –0.008***
(5.595) (6.164) (–4.337) (–3.304)
LEVRG 0.202 0.252 0.001 –0.001
(0.727) (0.928) (0.121) (–0.262)
BUSSEGM 0.186** 0.166* 0.001 0.001
(1.681) (1.478) (0.547) (0.487)
SUBSID 0.005* 0.005* –0.000 –0.000
(1.411) (1.511) (–1.058) (–0.816)
Industry dummy Included Included Included Included
Year dummy Included Included Included Included
Number of observations 442 442 442 442
R2 0.595 0.589 0.068 0.094
F-statistics 32.588 31.821 1.633 2.313
p-value (F-statistics) 0.000 0.000 0.045 0.001
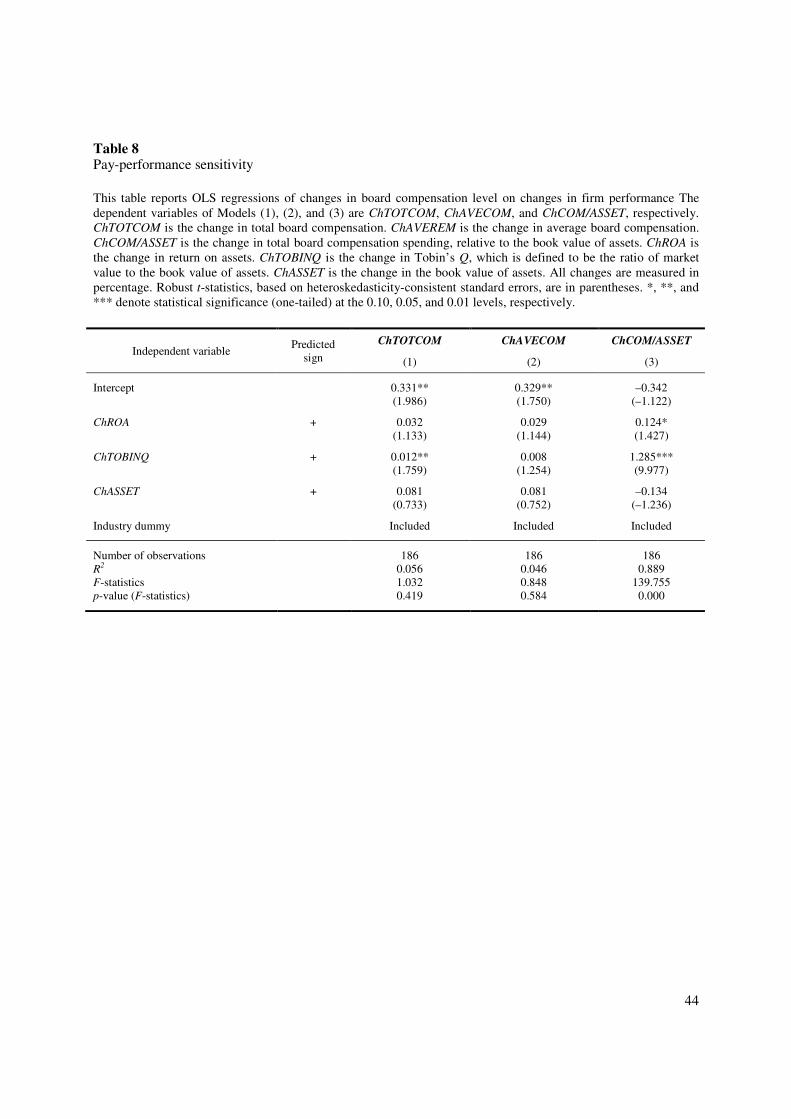
44
Table 8 Pay-performance sensitivity
This table reports OLS regressions of changes in board compensation level on changes in firm performance The
dependent variables of Models (1), (2), and (3) are ChTOTCOM, ChAVECOM, and ChCOM/ASSET, respectively.
ChTOTCOM is the change in total board compensation. ChAVEREM is the change in average board compensation.
ChCOM/ASSET is the change in total board compensation spending, relative to the book value of assets. ChROA is
the change in return on assets. ChTOBINQ is the change in Tobin’s Q, which is defined to be the ratio of market
value to the book value of assets. ChASSET is the change in the book value of assets. All changes are measured in
percentage. Robust t-statistics, based on heteroskedasticity-consistent standard errors, are in parentheses. *, **, and
*** denote statistical significance (one-tailed) at the 0.10, 0.05, and 0.01 levels, respectively.
Independent variable Predicted
sign
ChTOTCOM ChAVECOM ChCOM/ASSET
(1) (2) (3)
Intercept 0.331** 0.329** –0.342
(1.986) (1.750) (–1.122)
ChROA + 0.032 0.029 0.124*
(1.133) (1.144) (1.427)
ChTOBINQ + 0.012** 0.008 1.285***
(1.759) (1.254) (9.977)
ChASSET + 0.081 0.081 –0.134
(0.733) (0.752) (–1.236)
Industry dummy Included Included Included
Number of observations 186 186 186
R2 0.056 0.046 0.889
F-statistics 1.032 0.848 139.755
p-value (F-statistics) 0.419 0.584 0.000
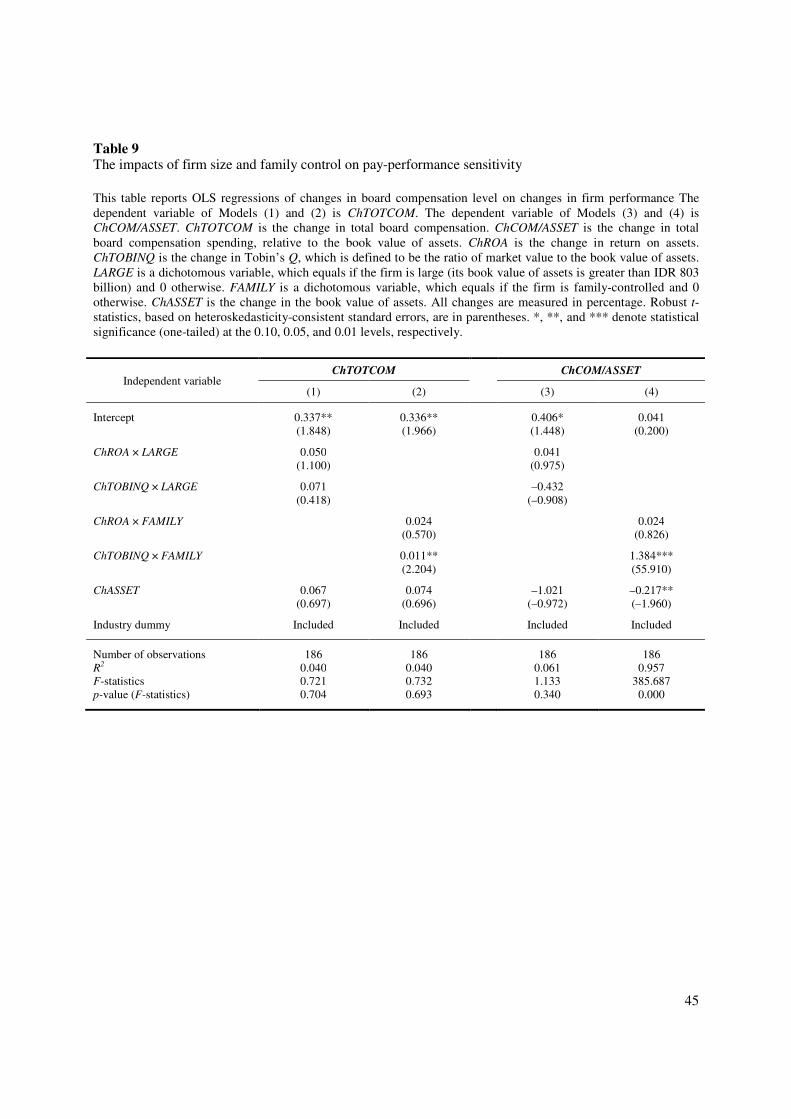
45
Table 9 The impacts of firm size and family control on pay-performance sensitivity
This table reports OLS regressions of changes in board compensation level on changes in firm performance The
dependent variable of Models (1) and (2) is ChTOTCOM. The dependent variable of Models (3) and (4) is
ChCOM/ASSET. ChTOTCOM is the change in total board compensation. ChCOM/ASSET is the change in total
board compensation spending, relative to the book value of assets. ChROA is the change in return on assets.
ChTOBINQ is the change in Tobin’s Q, which is defined to be the ratio of market value to the book value of assets.
LARGE is a dichotomous variable, which equals if the firm is large (its book value of assets is greater than IDR 803
billion) and 0 otherwise. FAMILY is a dichotomous variable, which equals if the firm is family-controlled and 0
otherwise. ChASSET is the change in the book value of assets. All changes are measured in percentage. Robust t-
statistics, based on heteroskedasticity-consistent standard errors, are in parentheses. *, **, and *** denote statistical
significance (one-tailed) at the 0.10, 0.05, and 0.01 levels, respectively.
Independent variable ChTOTCOM ChCOM/ASSET
(1) (2) (3) (4)
Intercept 0.337** 0.336** 0.406* 0.041
(1.848) (1.966) (1.448) (0.200)
ChROA × LARGE 0.050 0.041
(1.100) (0.975)
ChTOBINQ × LARGE 0.071 –0.432
(0.418) (–0.908)
ChROA × FAMILY 0.024 0.024
(0.570) (0.826)
ChTOBINQ × FAMILY 0.011** 1.384***
(2.204) (55.910)
ChASSET 0.067 0.074 –1.021 –0.217**
(0.697) (0.696) (–0.972) (–1.960)
Industry dummy Included Included Included Included
Number of observations 186 186 186 186
R2 0.040 0.040 0.061 0.957
F-statistics 0.721 0.732 1.133 385.687
p-value (F-statistics) 0.704 0.693 0.340 0.000