Embed Size (px)
Citation preview
BNP Paribas: Project Management on
Budget Automation
A Major Qualifying Project Report
Submitted to the Faculty of
Worcester Polytechnic Institute
In Partial Fulfillment of the Requirements for the
Degree of Bachelor of Science
Submitted By:
Nan Zhang, Computer Science and Industrial Engineering
Project Advisor:
Professor Renata Konrad, Foisie School of Business
Submitted on:
March 24, 2017

Abstract
The Global Markets (GM) IT division of BNP Paribas aims to use web-based technology
to automate its annual budgeting process. This paper discusses the project management aspect of
implementing the new process. To manage this implementation, project planning, scheduling and
control are considered. A Work Breakdown Structure, an Expectation Table, and a Network
Diagram are employed to plan and schedule the project.

Executive Summary
The Global Markets (GM) IT division of BNP Paribas (New York Branch) is currently
using a process to allocate its yearly budget to the projects that it runs throughout a year. The
current process is deemed to be inefficient, and it consists of email exchanges between senior
managers and team leads, requiring hundreds of man hours to complete. My team was asked to
design and evaluate a new automated budget allocation process of using web-based technologies.
Based on my team’s design work of the new process, actions are needed to implement our
application. This paper discusses the project management aspect of implementing the newly
designed application.
Based on a literature review of project management knowledge and data collected from
interviews with BNP Paribas employees, I created a Work Breakdown Structure, an Expectation
Table, and a Network Diagram to help the GM IT division of BNP Paribas manage the
implementation of the new process. The Work Breakdown Structure is a tool used for planning
the project. It breaks down a project goal into multiple sub activities. Both the Expectation Table
and the Network Diagram are used for project scheduling. The Expectation Table addresses the
concern for estimating finish time and sequence of each activity from the Work Breakdown
Structure, and the Network Diagram shows the flow of these activities. By using these three
tools, this MQP provides a project plan and schedule for the new budget allocation process. The
MQP report concludes a discussion of risks in the context of project management.

Table of Contents
Chapter 1. Introduction........................................................................................................ 1
Chapter 2. Background ........................................................................................................ 3 2.1 – Introduction of BNP Paribas ................................................................................................3 2.2 – Review on Project Management ...........................................................................................3 2.3 – Problem Statement ...............................................................................................................5 2.4 – Objectives .............................................................................................................................5
Chapter 3. Methodology ....................................................................................................... 6 3.1 – Project Planning ...................................................................................................................6 3.2 – Project Scheduling ................................................................................................................6
Chapter 4. Design ................................................................................................................. 9 4.1 – Work Breakdown Structure .................................................................................................9 4.2 – Expectation Table ............................................................................................................... 10 4.3 – Network Diagram ............................................................................................................... 11 4.4 – Discussion ........................................................................................................................... 12
Chapter 5. Conclusion ........................................................................................................ 14 5.1 – Summary ............................................................................................................................ 14 5.2 – Industrial Engineering Reflection ....................................................................................... 14
Bibliography ....................................................................................................................... 15

1
Chapter 1. Introduction Companies frequently adopt new technologies to achieve their business goals. Examples
of new technologies include, but not limited to, web-based applications, mobile applications, and
desktop software. For instance, all major banks in North America have websites for managing
internal business needs. The business needs for web-based banking can be classified into three
major categories: “to market information, to deliver banking products and services and to
improve customer relationship” (Diniz, 1998). By employing the newest technology,
organizations may potentially decrease long-term costs. For example, currently there is a
tendency of using cloud computing technology to save money for government agencies. “New
advances in cloud computing have made it possible for public and private sector agencies alike
to access software, services, and data storage through remote file servers” (West, 2010). With
this type of technology, many local machines are no longer needed, and costs saving are realized. However, adopting a new technology inevitably means changing or getting rid of a
current process. Managing the implementation of adopting new technology requires resources.
Such resources include personnel hours and license fees. Leaders within an organization should
consider how strong their willingness is to adopt a new technology. Within banking industry,
research has shown that leaders’ willingness depends on factors like bank size, and market
structure (Hannan, 1984).
When an organization decides to utilize a new technology, implementing the technology
plays a large part in its success. When my team worked in BNP Paribas, the Global Markets
(GM) IT division of the company was evaluating the possibility of deploying a web-based
application to facilitate its current budgeting process (Zhang & Ngo, 2017). According to
Andrew Clark, a senior manager within GM IT and my onsite liaison, the current semi-yearly
budgeting process requires hundreds of man hours, which is deemed to be inefficient. The
current process requires sending emails back and force between senior managers and team leads.
These emails contain the allocation percentage for each project the department annually runs,
and these percentages are the key numbers that drive the allocation of annual department budget.
Considering that team leads need to use Microsoft Excel to filter their relevant information on
budget data, my team was tasked to evaluate whether a newer technology such as implementing
a web application to automate current process was a feasible solution to make the current
budgeting process more efficient. We worked closely with budget team at BNP Paribas.
Our team designed a web-based application for addressing the automation of the current
budget allocation process. Figure 1 shows the business process diagram of the web-based
application that my team designed onsite. This diagram displays the flow of each website page
and a typical usage pattern that a user of the application may follow along.

2
Figure 1 – Business Process Diagram of the Web-based Application
As Figure 1 indicates, typical user requests that the application needs to address are:
viewing and editing the allocation template, checking revision history, source file upload, editing
profit centers, and editing users’ permission. For more details on the application background and
design, please see the report my team created (Zhang & Ngo, 2017). The paper discusses every
component of the application, from database to front-end interface.
In this web-based application, the first page that all users will see is the User Log in Page.
After successfully logging in, the Main Menu Page serves as the redirection page to all the
functionalities of the application. Note that checking revision history or viewing the current
allocation template will not change anything in the database. However, when there is a need to
make a change in the database, only the insert and update commands are allowed. Because we do
not want to lose any piece of history data, the delete command is not used in this application.
The project at BNP Paribas is an example of using web-based technology. The following
chapters will elaborate on how to manage the implementation of this technology.
3
Chapter 2. Background This chapter serves as the background of this paper. The chapter begins by providing a
brief overview of BNP Paribas, discusses the project, reviews project management techniques,
initiates the problem statement, and develop objectives.
2.1 – Introduction of BNP Paribas BNP Paribas is an international bank which provides services to customers from more
than 70 countries. As one of the largest banks in the world, the headquarter of the company is in
Paris. This French bank was formed through the merge of Banque Nationale de Paris and Paribas
in 2000. The bank’s business interest concentrates on three major areas: Retail Banking,
Corporate & Investment Banking, and Investment Solutions (“Graduate Careers For Bright
Minds,” n.d.). Retail Banking represents banking services to individual customers. These
services include credit card, debit card, and so on. Corporate & Investment Banking concentrates
on providing services to corporate customers. Investment Solutions strives to offer investment
advisory to clients. The New York Branch of BNP Paribas is where I worked for onsite, and it
offers all three services.
2.2 – Review on Project Management Project Management is one of the key elements that determines the success of a project. It
is a broad area that requires a variety of administration tasks and involves leadership. A recent
study highlighted the critical role of project managers in that “Project managers must strive not
only to meet specific scope, time, cost, and quality goals of projects, they must also facilitate the
entire process to meet the needs and expectations of people involved in project activities or
affected by them” (Schwalbe, 2015). As project managers need to consider many details such as
time constraints and product reliability, managing a multi-person team project requires a lot of
effort. For example, in 1997, the U.S. Federal Aviation Administration (FAA) cooperated with
NASA to initiate a project on designing a system for air traffic control. This system was
expected to conduct data analysis on “more than 60 million flights that take off and land at
airports across the United States” (Taylor, 2010). Although the engineers involved used
numerous new technologies to facilitate their development process, it still took FAA and NASA
about eight years to finish the development period of the system. During the eight-year period,
because the designed system required cooperation between key stakeholders and system users,
“17 meetings were held for systems users to keep them informed and gather feedback” (Taylor,
2010). This case study demonstrates the complexity of doing project management. For a project
that is as complex as this case, senior executives need to consider many important factors, such
as internal cooperation and project pace. On the other hand, when a project is not managed
properly, the project may end up with a failure. For example, a project was implemented in
Germany on encouraging general practitioners to promote smoking cessation. Although effective
evidence-based methodologies were used for promoting smoking cessation, the engagement of
the general practitioners was low. Improper project management and inadequate training for the
general practitioners resulted in less effective smoking cessation (Twardella, 2005).
Besides project failure, when project is not managed correctly, a significant possible
outcome might be a delay in deployment. Take a phenomenon recently observed in Malaysia as
an example. While the Malaysian construction industry is growing very quickly, delays in
construction are difficult to overcome (Hamza, 2011). When a new construction project is
initiated, project owners’ carelessness sometimes results in poor building schedule. As a result,

4
project cannot be finished on time. This example stresses the importance of paying attention to
details like scheduling activities.
Successful project management leads to project success. For instance, when the
Australian government planned to build Sydney Opera House, this construction project was
divided into two stages: Design Stage and Construction Stage (Eid, 1983). Detailed risk analysis
was conducted for each of the stage, such as estimating cost and designing a safe building
structure. Because every aspect of the construction project was properly considered, the project
was managed well, and Sydney Opera House became one of the most famous sites all over the
world. It is clear to see that project management is a tool to handle complex projects.
Based on the discussion above, project management is beneficial to completing complex
projects. Project Management is a field of management which considers three parts: planning,
scheduling, and controlling. Generally, planning means anticipating on all the possible activities
required to complete the project. Scheduling estimates how long each activity will take, and
controlling ensures every activity is implemented on time.
Effective project management requires good planning. A research paper on World Bank
supervisors suggests that supervision should focus more on project planning (Ik, 2015). By
employing project planning, a client country or government is able to achieve better economic
performance. In project planning, the project manager attempts to list all the activities that are
required to finish the project. After the project manager plans the tasks, each team is made aware
of the project activities for which it is responsible for. Project planning is analogous to breaking
down an objective into many sub objectives. For instance, to development a company website,
certain steps are required, such as designing a front-end, writing server code, and so on.
After planning out all possible activities to finish the project, project scheduling comes
next. Once the team leaders determine the activities a particular team needs to finish, they need
to schedule these activities to make sure all of them can be finished on time. Team leaders will
determine the expected time to finish a certain activity, and they will also determine the sequence
of finishing each activity. Scheduling project activities is important, as it establishes
responsibility and a time line. However, more often than not, project scheduling is not a simple
task: “The presence of scarce resources as well as precedence relations between activities makes
project scheduling a difficult task” (Hartmann, 2010). Prediction tools may be needed to support
scheduling process. For example, using Excel Open Solver can help construct a mathematical
model to schedule project activities. Suppose the objective of the model is to minimize the total
time for finishing a project, subject to time, personnel and budgetary resource constraints. Such a
model will determine the optimal allocation of resources if a feasible solution exists.
The final step of project management is project control. Control means to make sure
every project activity is completed and delivered on time as defined in the planning and
scheduling phases. A project control system “aims to minimize the gap between project planning
and project execution in order to achieve project aims, i.e., cost, time, and content” (Rozenes,
2006). If a particular deadline is missed, one possible solution is to allocate more resources
toward the corresponding activity. However, the allocation of additional resources is typically
undesirable as overall project costs tend to increase. While project control is a vital part of
project management, it is beyond the scope of this paper, as it involves actual supervision of
team members.

5
2.3 – Problem Statement Budget allocation affects the entire GM IT division at BNP Paribas (New York Branch).
The current allocation process is considered inefficient and time consuming. In response, my
team designed an automated budgeting process onsite (Zhang & Ngo, 2017). While the new
process and associated technology is expected to increase efficiency, it has yet to be
implemented. The new budget allocation process is complex, because it involves numerous
stakeholders and drives the budget for the entire division. Poor implementation can result in
additional costs and user dissatisfaction, which could lead to project failure.
This paper addresses the project management aspect of implementing the automated
budgeting process. The following chapters will discuss the methodology and actual design.
2.4 – Objectives This paper elaborates on the project management aspect of implementing our team’s
budget automation process. By introducing the methodology in the later chapter, the following
objectives will be met to address.
Objective 1: Design a Work Breakdown Structure for the web-based budgeting application with
defined categories and activities.
Objective 2: Deliver an Expectation Table corresponding to the WBS with accurate activity
duration.
Objective 3: Design a Network Diagram illustrating the flow of activities required to implement
the budget automation project within GM IT division at BNP Paribas (New York Branch).

6
Chapter 3. Methodology This chapter discusses the methodology employed to design the project management
process for implementing the automated budgeting process. The chapter focuses on approaches
to plan and schedule projects.
3.1 – Project Planning Work breakdown structure (WBS) is a tool used by management to plan projects. By
displaying all the defined activities, WBS “provides input for the project schedule” (Meredith &
Scott, 2010). For this reason, WBS should be the first step in project management. Figure 2
displays an example of a WBS from an external source (Golany & Shtub, 2001).
Figure 2 – An Example of WBS (Golany & Shtub, 2001)
A typical WBS spreads out like a tree structure. As shown in Figure 2, a WBS consists of
many hieratical levels, and the bottom level denotes all the defined activities to be finished, like
“Land Acquisition” and “Purchasing”. Upper levels are considered as the parent levels, and they
denote the categories that each activity falls under. This kind of hierarchy forms the major
content of WBS. When project managers look at a WBS, they refer to the upper levels to assign
appropriate resources to each activity.
WBS is commonly used in project planning. For example, in a software development
project, managers use WBS to break the software program down to module implementation and
interface design. In this fashion, different kinds of developers know the activities for which they
are responsible for. When developers find that a particular activity requires more time than
expected, they partition this event “into a small number of comprehensive component subtasks”
(Tausworthe, 1979). In summary, a WBS identifies all the key activities of a project and serves
as the guideline for project planning.
3.2 – Project Scheduling After completing the WBS, various project stakeholders (typically managers) provide
their input regarding project scheduling. The two methodologies that this paper adopts are
Expectation Table and Network Diagram. An Expectation Table shows the expected time of
completing each activity based on the WBS. It also shows the sequence of completing each of
these activities. The key for constructing expectation table is to have achievable, realistic, and
accurate data. For example, to determine the expected completion time of a specific activity, an
estimation is made by a manager based on the urgency of the project and the amount of available
resources. Suppose a certain activity is complex, and the team does not have sufficient headcount

7
for the activity. Scheduling this activity with a short completion time would be considered as an
unrealistic action. Perhaps to complete this activity, the team requires additional training, or
additional resources would have to be hired. Without realistic data, expectation table will be
meaningless.
The second method used for project scheduling is a Network Diagram. The Network
Diagram focuses on activity sequencing. Using the sequence from an Expectation Table, a
Network Diagram is a graphical representation of the sequence of activities. Figure 3 shows a
sample activity node in a Network Diagram.
Figure 3 – A Sample Activity Node in Network Diagram (Meredith & Scott, 2010)
In Figure 3, the topmost part of the node displays the activity name (“Activity” in Figure
3) and activity’s time length (“te” in Figure 3). In the middle part of the node, “TES” represents
early start time, and “TEF” is early finish time. In other words, early start time represents the
earliest time that the activity can start, and early finish time means the earliest time that the
activity can be finished. Since the expected finish time of the activity is already identified, the
early finish time equals to the early start time plus the time length of the activity. Both “TES” and
“TEF” assume that the activity starts right after preceding activities get finished. At the
bottommost row of the node, “TLS” represents latest start time, and “TLF” represents latest finish
time. The latest start time is the latest time when the activity can start without delaying the whole
project. Similarly, latest finish time represents the time when the activity can be finished at latest
without any delay. The latest finish time of an activity equals to the latest start time plus the time
length of the activity.
Figure 3 displays an example of a Network Diagram from an external source” (Meredith
& Scott, 2010). In this diagram, the unit of time is day.

8
Figure 4 – An Example of a Network Diagram (Meredith & Scott, 2010)
As shown in Figure 4, by drawing directed arcs from the “start” node to the “end” node, a
Network Diagram illustrates the flow of activities and provides insight regarding the scheduling
of each activity. For instance, the time length of activity H is 5 days, and it can only start after
the completion of activity C. Assuming that each activity starts right after the preceding activities
are finished, we traverse through the network to calculate the total number of days that is
required to finish the project. Then, we figure out the critical path is “Start-A-D-J-End”. The
critical path represents a sequence of activities that determines the finish time of the whole
project. In order to finish the project as early as possible, each of the activity along the critical
path should start promptly after the completion of the preceding ones. D should begin
immediately after A is complete. For activities that are not on the critical path, they may be
scheduled later than their early start time. For example, after figuring out that the whole project
takes 21 days to finish, project managers can schedule activity H on day 8 at latest.
A Network Diagram is the fundamental part of project scheduling. Practitioners
frequently use Network Diagram to conduct task scheduling analysis. By utilizing some
computerized software, researchers successfully developed interfaces and simulation for the
network flow (Chinowsky, 2010).

9
Chapter 4. Design This chapter details the design of the project management aspect of implementing the
automated budgeting process. The purpose of this chapter is to address the three objectives listed
in Section 2.4.
4.1 – Work Breakdown Structure To implement the automated budgeting process described in the Introduction chapter, a
series of activities need to be completed. Because our team designed the automated process
onsite, the activities shown in the work breakdown structure are planned based on my prior
knowledge of the process. After confirming with Kunal who served as my team’s mentor, I
designed the WBS as shown in Figure 5. The WBS shows the activities required to implement
the automated process.
Figure 5 – WBS Required to Implement the Automated Process
In Figure 5, the middle layer of the WBS exhibits the categories that each activity will
fall under. Note that “Technical Implementation” represents all the technical work needed to
prepare for the automated process. The seven activities at the bottom level of the WBS are
required in order for the budget automation application to be implemented. These activities are
labeled with capital letters ranging from A to G. Below is the detailed description of each
activity.
A. Design for Blended Keys Allocation. The Blended Keys Allocation Process follows
different rules than the currently designed process. Instead of letting managers input their
own allocation percentage, this process calculates values called blended keys and use
these keys for budget allocation. For more details on Blended Keys Allocation Process,
please refer to (Zhang and Ngo, 2016) which my team finished. As my team created the
database for this process, the activity involves designing the front-end interface and
writing SQL queries for data binding.

10
B. Design for Reallocation Process. The Reallocation Process is about reallocating the
budget that was previously allocated to some profit centers. This process is an additional
one that runs parallel with the Blended Keys Allocation. For more details on Reallocation
Process, please refer to (Zhang and Ngo, 2016) which my team finished. As my team
created the database for this process, the activity involves designing the front-end
interface and writing SQL queries for data binding.
C. Data Binding. Data Binding means to write code in Python and JavaScript for data
transfer in order to realize the design for front-end interface. This activity binds the data
between the database and the front-end. By finishing Data Binding, various user requests
can be properly handled by the application.
D. Password Encryption. Password Encryption means to encrypt all users’ password in the
designed SQL database. This step may be achieved by a security engineer using the
current user ID system at BNP Paribas.
E. Testing. This step means to test all functionalities of the web-based application to make
sure the application can be used as expected. As testing these functionalities requires
checking all possible cases when a user may potentially do to the application, this activity
should be carried out by an experienced software engineer.
F. Project Deployment. Deploying the project makes this application accessible to all the
users within company’s internal web system. An experienced web programmer is
required for this activity, and he or she is expected to follow the BNP’s current web
policy regarding web-based applications.
G. Employee Training. Since this web-based application introduces a number of
functionalities which may be unfamiliar to users, all expected users should undergo
training. Appropriate training materials and delivery platform need to be developed (e.g.
seminars, web-based training). The budget team within GM IT division should be
responsible for preparing these training materials.
4.2 – Expectation Table The WBS in Section 4.1 defines seven activities which serve as inputs into an
Expectation Table as illustrated in Table 1. To ensure accuracy of the data as realistic as
possible, I worked closely with Kunal at BNP Paribas.

11
Activity Expected Time to Finish (in
Hours)
Preceding Activities
A. Design for Blended
Keys Allocation
12 ≤ 15 ≤ 20 --
B. Design for
Reallocation Process
12 ≤ 15 ≤ 20 --
C. Data Binding 20 ≤ 24 ≤ 28 A, B
D. Password
Encryption
4 ≤ 8 ≤ 10 A,B,C
E. Testing 15 ≤ 20 ≤ 30 A, B, C, D
F. Project Deployment 3 ≤ 5 ≤ 8 A, B, C, D
G. Employee Training 12 ≤ 15 ≤ 18 A, B, C, D, E, F
Table 1 – Expectation Table
As shown in Table 1, the expected time to finish each activity is estimated based on the
complexity of each activity. The upper and lower bounds for finishing each activity are also
displayed. Although this paper concentrates on analyzing the time duration without upper and
lower bounds, the table has the bounds available to show the uncertainty of each activity.
This table assumes that all the activities are to be completed by only one appropriately
skilled person. Although a different person may be assigned to a particular activity, only one
person is responsible for the completion of each activity. Activity G is the only exception. Note
that employee training applies to everyone who expects to use the web-based application. The
expected finish time of employee training is set as 15 hours, and this time length includes one
person creating the training manual and then the other users learning material from the manual.
When this activity is implemented, one person will take time to make the training manual, and
then all the expected users will start to learn the manual. In this expectation table, activities A
and B are the first two activities that should be finished, and they do not have preceding
activities. Activity G is considered as the final step that finishes the budget automation project.
4.3 – Network Diagram The construction of a Network Diagram is based on corresponding Expectation table.
Using the standard Network Diagram notation (as illustrated in Figure 3), Figure 6 displays the
Network Diagram that shows the flow of activities required to implement the budget automation
project at GM IT division of BNP Paribas.
12
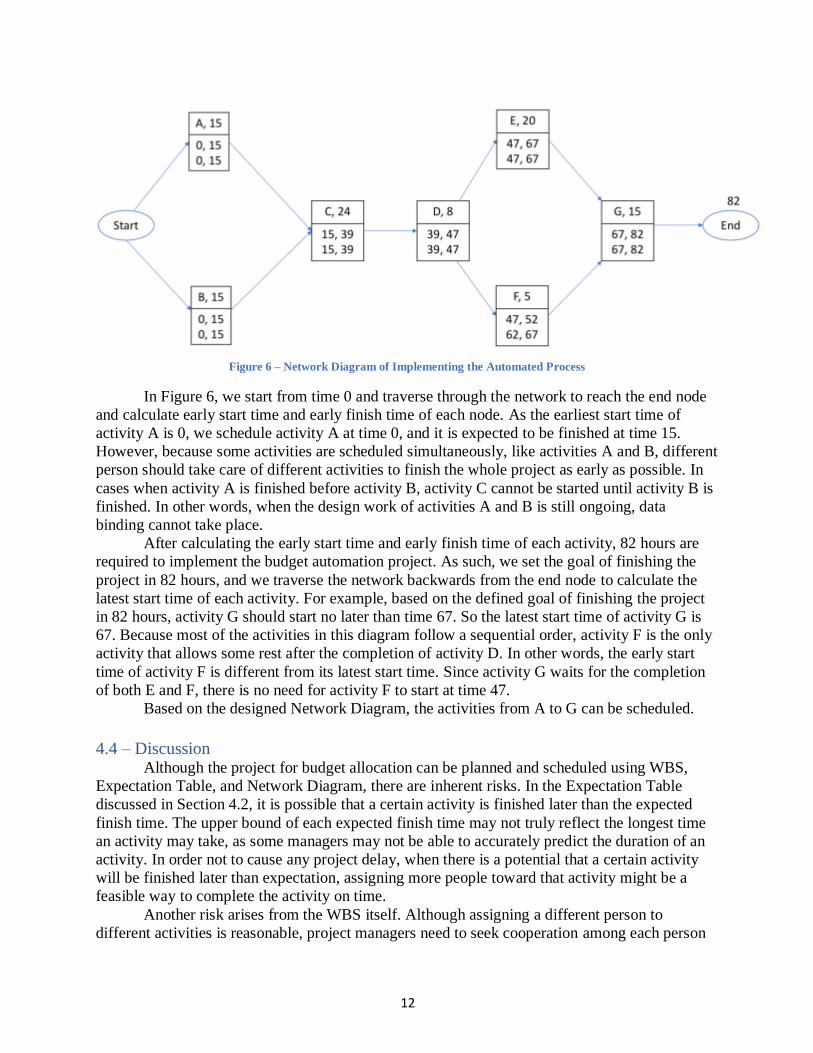
Figure 6 – Network Diagram of Implementing the Automated Process
In Figure 6, we start from time 0 and traverse through the network to reach the end node
and calculate early start time and early finish time of each node. As the earliest start time of
activity A is 0, we schedule activity A at time 0, and it is expected to be finished at time 15.
However, because some activities are scheduled simultaneously, like activities A and B, different
person should take care of different activities to finish the whole project as early as possible. In
cases when activity A is finished before activity B, activity C cannot be started until activity B is
finished. In other words, when the design work of activities A and B is still ongoing, data
binding cannot take place.
After calculating the early start time and early finish time of each activity, 82 hours are
required to implement the budget automation project. As such, we set the goal of finishing the
project in 82 hours, and we traverse the network backwards from the end node to calculate the
latest start time of each activity. For example, based on the defined goal of finishing the project
in 82 hours, activity G should start no later than time 67. So the latest start time of activity G is
67. Because most of the activities in this diagram follow a sequential order, activity F is the only
activity that allows some rest after the completion of activity D. In other words, the early start
time of activity F is different from its latest start time. Since activity G waits for the completion
of both E and F, there is no need for activity F to start at time 47.
Based on the designed Network Diagram, the activities from A to G can be scheduled.
4.4 – Discussion Although the project for budget allocation can be planned and scheduled using WBS,
Expectation Table, and Network Diagram, there are inherent risks. In the Expectation Table
discussed in Section 4.2, it is possible that a certain activity is finished later than the expected
finish time. The upper bound of each expected finish time may not truly reflect the longest time
an activity may take, as some managers may not be able to accurately predict the duration of an
activity. In order not to cause any project delay, when there is a potential that a certain activity
will be finished later than expectation, assigning more people toward that activity might be a
feasible way to complete the activity on time.
Another risk arises from the WBS itself. Although assigning a different person to
different activities is reasonable, project managers need to seek cooperation among each person

13
who is responsible for different activities. By doing that, the transition from an activity to
another will be more seamless, and the person who is waiting for the completion of the previous
activity will always be kept updated.

14
Chapter 5. Conclusion
5.1 – Summary The current budget process within GM IT division of BNP Paribas was deemed to be
time consuming and inefficient. Our team developed a new application by using web-based
technologies which can automate the budget process (Zhang and Ngo, 2016). However, to
successfully implement this application, project management is required. The three objectives
regarding project planning and scheduling are: designing WBS, delivering Expectation Table,
and constructing Network Diagram. WBS corresponds to project planning, and it breaks an
overall project objective into many sub activities. The Expectation Table and the Network
Diagram corresponds to project scheduling. The Expectation Table assigns each activity with a
finish time, and the Network Diagram indicates the internal flow of each activity.
5.2 – Industrial Engineering Reflection Industrial Engineering is a field of study which aims to make a process be more efficient.
This paper discusses the management over project implementation, and the purpose is to
automate the current budget allocation process within GM IT division of BNP Paribas. The
approach used in this paper centers on applying WBS, Expectation Table and Network Diagram
concepts which in turn aims to make project management more effective. Improving the efficacy
of a process is a typical goal of Industrial Engineering.
In completing this project, I identified a constraint in the design of the project
management aspect of implementing the automated budgeting process, namely the inability to be
present at BNP Paribas during project implementation. Project control is an important aspect of
project management. However, as I am not directly responsible for administering the project, my
design in the management of this project is constrained.

15
Bibliography Diniz, E. (1998). Web banking in USA. Revista de Administração de Empresas, 38(4), 57-62.
West, D. M. (2010). Saving money through cloud computing. Governance Studies at Brookings.
Hannan, T. H., & McDowell, J. M. (1984). The determinants of technology adoption: The case
of the banking firm. The RAND Journal of Economics, 328-335.
Graduate Careers For Bright Minds. (n.d.). Retrieved March 24, 2017, from
https://www.brightnetwork.co.uk/graduate-employer-company/bnp-paribas
Schwalbe, K. (2015). Information technology project management. Cengage Learning.
Taylor, B. (2010). Introduction To Management Science. Prentice Hall, 337-338.
Hamzah, N., Khoiry, M. A., Arshad, I., Tawil, N. M., & Ani, A. C. (2011). Cause of construction
delay-Theoretical framework. Procedia Engineering, 20, 490-495.
Kerzner, H. (2013). Project management: a systems approach to planning, scheduling, and
controlling. John Wiley & Sons.
Ika, L. A. (2015). Opening the black box of project management: Does World Bank project
supervision influence project impact?. International Journal of Project Management, 33(5),
1111-1123.
Hartmann, S., & Briskorn, D. (2010). A survey of variants and extensions of the resource-
constrained project scheduling problem. European Journal of Operational Research, 207(1),
1-14.
Rozenes, S., Vitner, G., & Spraggett, S. (2006). Project Control. Literature Review Project
Management Journal, 37(4), 5-14.
Meredith, J. & Scott, S. (2010). Operations Management For MBAs, John. Wiley & Sons Inc,
218-219.
Tausworthe, R. C. (1979). The work breakdown structure in software project
management. Journal of Systems and Software, 1, 181-186.
Chinowsky, P., Taylor, J. E., & Di Marco, M. (2010). Project network interdependency
alignment: New approach to assessing project effectiveness. Journal of Management in
Engineering, 27(3), 170-178.
Zhang, N. & Ngo, J. (2017). BNP Paribas: budget automation. MQP Report submitted to WPI
January 2017.

16
Twardella, D., & Brenner, H. (2005). Lack of training as a central barrier to the promotion of
smoking cessation: a survey among general practitioners in Germany. The European Journal
of Public Health, 15(2), 140-145.
Eid, K. (1983). Sydney Opera House. Risk Management Case Study. Report prepared for the
University of Auckland.
Golany, B., & Shtub, A. (2001). Work Breakdown Structure. Handb. Ind. Eng. Technol. Oper.
Manag, 3, 1263-1280.