Embed Size (px)
Citation preview
1
BNP Paribas: Enterprise Architecture – Phase II
A Major Qualifying Project Report
Submitted to the faculty of the
WORCESTER POLYTECHNIC INSTITUTE
In partial fulfillment of the requirements of the
Degree of Bachelor of Science
by
Yuchen Zhang, Computer Science and Actuarial Mathematics
Yanxin Zhou, Computer Science and Mathematical Science
Jian Mao, Computer Science and Mathematical Science
Project Sponsor: BNP Paribas
Submitted to:
On- Site Liaisons: Tom Keyes
Arjun Kohli
Dhaval Oza
Project Advisors: Professor Jon Abraham, Department of Mathematics
Professor Arthur Gerstenfeld, Department of Management
Professor Micha Hofri, Department of Computer Science
Submitted on:
Tuesday, March 5, 2013
i
Abstract
The primary goal of this project, sponsored by the Global Equities and
Commodity Derivatives (GECD) at BNP Paribas NY, was to adapt and scale the
Enterprise Architecture (EA) – Prototype for production used by the GECD IT
Application Support Team and the GECD Transversal BA Team. At the end of the
project, BNP Paribas NY IT operations and support was fully reflected in flows and
infrastructure/data available in the EA toolset. The visualizations available within
the EA application served as a common hub for illustrating the current state of IT
applications and underlying infrastructure in discussions, documentation and
planning for BNP Paribas GECD NY.
The secondary goal was to work with GECD Business Management to review
and update their requirements and translate these into a proposed Design
Specification for Phase III of the project being proposed in BNP Paribas NY for 2013.
ii
Acknowledgement
There were many people involved with the Enterprise Architecture project
both from BNP Paribas and Worcester Polytechnic Institute. Foremost we would
like to thank Mr. Dhaval Oza and Mr. Tom Keyes, our sponsors, who oversaw the
project from the BNP Paribas side. Also Mr. Arjun Kohli, the project manager, who
managed the day-to-day operations of the project. We want to extend our gratitude
towards Professor Arthur Gerstenfeld, director of the Wall Street Project Center, for
creating such an energizing experience. Along with Professor Gerstenfeld, we want
to thank Professors Micha Hofri and Professor Jon Abraham, our faculty advisors,
for their continued support and advice and assistance in our final report and
presentation. Finally we thank everyone in the GECD division of BNP Paribas who
lent their advice, support and opinions concerning the eventual destination of the
project. Thank you.
iii
Authorship
The academic work of this project consists of 3/3 unit of work in B-Term
2012 (October 2012 – December 2012) and an additional 1/3 unit of work in C-
Term 2013 (January 2013 – March 2013). Yanxin Zhou and Yuchen Zhang took
credit of the work done in B-Term 2012. Later since Yanxin Zhou and Yuchen Zhang
are both double major, they partnered with Jian Mao and finished the rest 1/3 unit
of work related to this project in C-Term 2013.
For the work done in B Term 2012, all sections were created and edited as a
team, with equal contributions between Yanxin Zhou and Yuchen Zhang.
The work done in C Term 2013 was reported as Appendix IV – Report of C
Term 2013. This section was created and edited by Jian Mao, Yanxin Zhou and
Yuchen Zhang, with equal contributions.
iv
Executive Summary
BNP Paribas’ Global Equities and Commodity Derivatives (GECD) division
offers a variety of industry leading financial products. To keep its businesses
operating smoothly, the division relies on various internal applications and
hardware that conduct and support many business operations to function correctly
and efficiently. As a result, maintaining good health of these applications and
hardware is crucial within the context of different business flows. Whenever a
performance problem happens, IT managers and infrastructure team should be
informed right away.
For years, however, managers have been keeping track of business flows and
performed capacity planning manually. It was extremely costly and inefficient.
To increase efficiency and achieve automation in this area, IT managers at
BNP Paribas want to visualize their entire enterprise architecture. Meanwhile,
Human Resources managers and Business managers were also looking for a better
application to display visualization of organization. Their existing database level of
presentation of the data could not meet their need.
With this said, this project aimed to help BNP Paribas to visualize and
maintain their enterprise architecture. The goal of the project was to adapt and
scale the Enterprise Architecture (EA) – Prototype for production used by the GECD
IT Application Support Team and the GECD Transversal BA Team. There are three
primary components of the implementation. The first one is to automatically extract
data from the database and feed it into a data management interface. The second
component is to visualize the flow. The last component is about graph interactivity.
This project was a continuation of Enterprise Architecture – Phase I. This
project concentrated on the core development of Enterprise Architecture. It
involved two parts: front end user interface development and back end database
development. Based on the proof of concept done in Phase I, Oracle Application
Express (ApEx) was used to develop the front end user interface. It provided handy
methods to interact with back end Oracle database. For the back end database
v
development, information about each diagram was stored in corresponding tables
in the database. The database also contained various functions that can be applied
to diagrams. Moreover, on rendering a diagram, the database would trigger the
Graphviz render engines through a pre-defined Oracle database job scheduler.
Graphviz was the visualization tool that passed the feasibility test in Phase I.
Some further researches on the Graphviz tool were finished during the
project. Graphviz has its strength in positioning optimization and it is rich in
graphical attribute options. Furthermore, Graphviz offers different layout engines,
each of which has some unique features. Moreover, all engines provided by Graphviz
can use the same input, making it easier to switch between different layout engines.
These were all crucial merits that contribute to the development of the final
application.
By the end of this project, a well-integrated browser-based data visualization
and management application was built. The application has the following features:
Visualization based on User Selection, Graph Interactivity, Table Interactivity,
Interactions between Graphs and Tables, and Data management. It also has other
functionalities including Export to Diagrams, and Graphical Attribute Management.
The application is an excellent blend of various technologies. Three major
tools, four programming languages, and other technical concept were deployed. SQL
Developer as the programming environment, Graphviz as graphing tool, and ApEx
as application interface developer, were heavily used and well integrated to function
as a unit. Towards the end of the project, real data were plugged into the application
for testing. After a week of testing, the first version of the application was finally
released to the Business Analyst team for real life testing.
There are many business uses of Enterprise Architecture. In general, the
visualizations available within the Enterprise Architecture application would serve
as a common hub for illustrating the current state of IT applications and underlying
infrastructure in discussions, documentation and planning for GECD New York.
vi
Table of Contents
Abstract _____________________________________________________________________________________ i
Authorship _______________________________________________________________________________ iii
Executive Summary ______________________________________________________________________ iv
List of Figures _____________________________________________________________________________ ix
List of Tables _______________________________________________________________________________ x
1. Introduction _________________________________________________________________________ 1
2. Background __________________________________________________________________________ 3
2.1 What is EA _________________________________________________________________________________ 3
2.2 EA – Current Implementation__________________________________________________________ 6
2.3 Technology Review ______________________________________________________________________ 7
2.3.1 Applications ___________________________________________________________________________ 7
2.3.2 Programming Languages ____________________________________________________________ 8
3. EA Phase II Requirements _________________________________________________________ 9
3.1 Front End Enhancement ________________________________________________________________ 9
3.2 Back End Enhancement _______________________________________________________________ 10
4. Front End Development ___________________________________________________________ 11
4.1 Table Interactivity _____________________________________________________________________ 11
4.1.1. Design _______________________________________________________________________________ 11
4.1.2. Methodology _______________________________________________________________________ 12
4.2 Graph Interactivity ____________________________________________________________________ 13
4.2.1. Design _______________________________________________________________________________ 14
4.2.2. Methodology _______________________________________________________________________ 14
4.3 Interactions Between Graphs and Tables __________________________________________ 18
4.3.1. Design _______________________________________________________________________________ 18
vii
4.3.2. Method ______________________________________________________________________________ 19
5. Back End Development ____________________________________________________________ 21
5.1 Database Design _______________________________________________________________________ 21
5.2 Database Structure ____________________________________________________________________ 22
5.3 Methodology ____________________________________________________________________________ 23
5.3.1. The Implementation of User Preferences ________________________________________ 23
5.3.2. Embedment of Diagrams __________________________________________________________ 23
5.3.3. Interaction with Front End User Interface _______________________________________ 24
6. Results _______________________________________________________________________________ 25
6.1 Applications Pages Overview ________________________________________________________ 25
6.1.1. Instance Node-Edit Page __________________________________________________________ 25
6.1.2. Home Page __________________________________________________________________________ 27
6.1.3. Diagram Page _______________________________________________________________________ 28
6.2 Specific Features Overview __________________________________________________________ 29
6.2.1. Auto Filter on Actions List ________________________________________________________ 29
6.2.2. Multi Selection of Nodes ___________________________________________________________ 29
7. Conclusions and Recommendations ____________________________________________ 30
Appendix I – BNP Paribas and GECD _________________________________________________ 33
Appendix II – Enterprise Architecture Application – Phase I Implementation 34
Appendix III – A Complete Business Flow Diagram ________________________________ 36
Appendix IV – Report of C Term 2013 _______________________________________________ 37
Introduction _____________________________________________________________________________ 37
Background ______________________________________________________________________________ 39
Operating Efficiency _________________________________________________________________________ 39
Operating Efficiency Model _________________________________________________________________ 39
viii
Data Envelopment Analysis _________________________________________________________________ 40
Methodology _____________________________________________________________________________ 41
Data Collection ________________________________________________________________________________ 41
Data Analysis __________________________________________________________________________________ 43
CCR Model ___________________________________________________________________________________ 44
BCC Model ___________________________________________________________________________________ 45
Efficiency and Stability Analysis ___________________________________________________________ 46
Result _____________________________________________________________________________________ 47
Conclusions ______________________________________________________________________________ 51
Appendix A. Input/Ouput Data for FY 2007 – FY 2010 __________________________ 52
Reference _________________________________________________________________________________ 56
ix
List of Figures
Figure 1 EA Logical Architecture _____________________________________________________________________________ 5
Figure 2 Layers of Aggregation and Enrichment____________________________________________________________ 5
Figure 3 EA Phase I Sample Diagram _______________________________________________________________________ 10
Figure 4 Home Page Design __________________________________________________________________________________ 11
Figure 5 Node-Edit Page Design _____________________________________________________________________________ 11
Figure 6 Link Table Pencil Icon (Edit Button) ______________________________________________________________ 13
Figure 7 Diagram Page Design ______________________________________________________________________________ 14
Figure 8 Diagram Link to Node-Edit Page __________________________________________________________________ 18
Figure 9 Add/Remove Nodes from Home Page _____________________________________________________________ 19
Figure 10 Master and Instance Design ______________________________________________________________________ 21
Figure 11 Node Edit Page ____________________________________________________________________________________ 25
Figure 12 Home Page ________________________________________________________________________________________ 27
Figure 13 Diagram Page _____________________________________________________________________________________ 28
Figure 14 Auto Filter on Actions List ________________________________________________________________________ 29
Figure 15 Multi Selection of Nodes __________________________________________________________________________ 29
Figure 16 Summary of Functions ____________________________________________________________________________ 34
Figure 17 EA Phase I Graph Interactivity ___________________________________________________________________ 35
Figure 18 EA Phase II Production Diagram _________________________________________________________________ 36
Figure 19. Mapping plane of DEA____________________________________________________________________________ 40
x
List of Tables
Table 1 Actions Related To Single Node _____________________________________________________________________ 16
Table 2 Other Actions ________________________________________________________________________________________ 16
Table 3 Instructions of Node-Edit Page _____________________________________________________________________ 26
Table 4 Instruction of Home Page ___________________________________________________________________________ 27
Table 5 Instructions of Diagram Page _______________________________________________________________________ 28
Table 6. Input and output data for FY2011 _________________________________________________________________ 42
Table 7. Currency conversion rate for 2007 - 2011 _________________________________________________________ 43
Table 8. Result from CCR Model _____________________________________________________________________________ 47
Table 9. Result from BCC Model _____________________________________________________________________________ 48
Table 10. Efficiency and Stability Analysis for CCR Model __________________________________________________ 49
Table 11. Efficiency and Stability Analysis for BCC Model __________________________________________________ 50
Table 12. Input/Output for FY2010 _________________________________________________________________________ 52
Table 13. Input/Output for FY2009 _________________________________________________________________________ 53
Table 14. Input/Output for FY2008 _________________________________________________________________________ 54
Table 15. Input/Output for FY2007 _________________________________________________________________________ 55
1
1. Introduction
BNP Paribas Global Equities & Commodity Derivatives (GECD) is a
worldwide leading provider of financial products and services. GECD combines
three complementary business lines, including structured equity, flow and financing
covers products and services, and commodity derivatives. All these leading edge
technologies and processes are developed and maintained by over 1,500 middle-
office, back-office and IT professionals, together with the support of various internal
applications, systems and hardware. On the other hand, IT managers also have to
monitor the health of these internal applications and hardware within the context of
different business flows, where the monitor data can reflect any system
performance problems and help IT professionals to understand the impact of over-
capacity server on any particular flow.
In the times of automated and high frequency trading, it is vital to make sure
the machines won’t trigger mistaken orders. On August 2nd, 2012, the Knight
Capital Group announced that it lost $440 million when it sold all the stocks it
accidently bought on August 1st, 2012 because of a computer glitch. The loss was
nearly four times the company’s 2011 profit, crippled the firm and brought it to the
edge of bankruptcy. The disaster was eventually concluded as a result of a bug
occurred in the company’s trading algorithm. The company might not be able to
detect and fix the bug before it happened; however, if the company could discover
the ill system performance in time through monitoring and shut down the algorithm
immediately, the loss would be much less than $440 million.
From the appalling “2010 Flash Crash” event, which caused the Dow Jones
Industrial Average plunged 998.5 points in a few minutes only to recover its losses
several minutes later, to the catastrophe of the Knight Capital Group, and till now,
errors made by computer glitches in marketplace happened occasionally. In order to
protect the financial industry from program bugs, we either need perfectly healthy
programs, which is extremely hard to achieve, or reliable applications that can
discover problems before they go big.
2
As a result, BNP Paribas NY developed a new application GECD Enterprise
Architecture (EA) application that provides the unique capability of visualizing and
managing an organization’s live data in a contextual and inter-related manner. EA’s
key benefits include process visualization & management, operational capacity &
performance management, data management and impact analysis. EA - prototype
has already been created in the project led by Arjun Kohli in the fourth quarter
2011, with WPI students Zhen He and Joe Servi. The scope of the initial project in
2011 was a proof of concept to demonstrate that enterprise data management of
application and server inventory could be represented and managed visually off a
referential database/inventory system. With this visualization in place, business
process flows can be tracked for metrics related to underlying application
performance and alert statuses.
With EA – prototype in practice, the primary goal was to adapt and scale the
Enterprise Architecture (EA) – Prototype for production used by the GECD IT
Application Support Team and the GECD Transversal BA Team. At the end of the
project, BNP Paribas NY IT operations and support was fully reflected in flows and
infrastructure/data available in the EA toolset. The visualizations available within
the EA application served as a common hub for illustrating the current state of IT
applications and underlying infrastructure in discussions, documentation and
planning for BNP Paribas GECD NY.
The secondary goal was to work with GECD Business Management to review
and update their requirements and translate these into a proposed Design
Specification for Phase III of the project being proposed in BNP Paribas NY for 2013.
3
2. Background
In this background chapter, we will briefly talk about the idea of Enterprise
Architecture (EA), the project that has been done in 2011 and the development plan
for deploying EA to IT Application Support, Business Analysts and Business
Management of BNP Paribas Global Equities & Commodity Derivatives (GECD).
2.1 What is EA
Briefly speaking, EA is a data management toolset that can provide the
unique capability of visualizing and managing an organization’s live data in a
contextual and inter-related manner. It will have the following detailed
functionalities:
It is a web application;
It can graph and diagram a large number of elements with complex
relationships, where the information comes from a live database and is not
static data;
It integrates existing organizational data, including application, hardware,
organization unit, people and process;
The graph / diagram it generates can scale to potentially thousands of on-
screen elements;
It manages and enriches the data and relationships between data elements;
It provides on screen interactivity to build and display the diagram
elements;
It charts live data to make the diagram a living representation of system
flows;
It has dashboard capabilities that list performance statistics on certain
capacity attributes;
It has data entry and modification forms;
4
It does not use static / stale data; all the data are directly retrieved from
referential sources and EA database;
It provides bi-direction data synchronization – via on screen interaction
with data, and via database refresh;
It provides the visualization of real time health through metrics, key
performance indicators (KPI’s) and capacity utilization, which are layered
on top of relationship diagrams;
It has powerful data integration capabilities and open API for downstream
applications;
It records interactions to trigger downstream actions for organization or
process changes;
It provides tailor made representation of individual or group’s perimeter of
responsibilities.
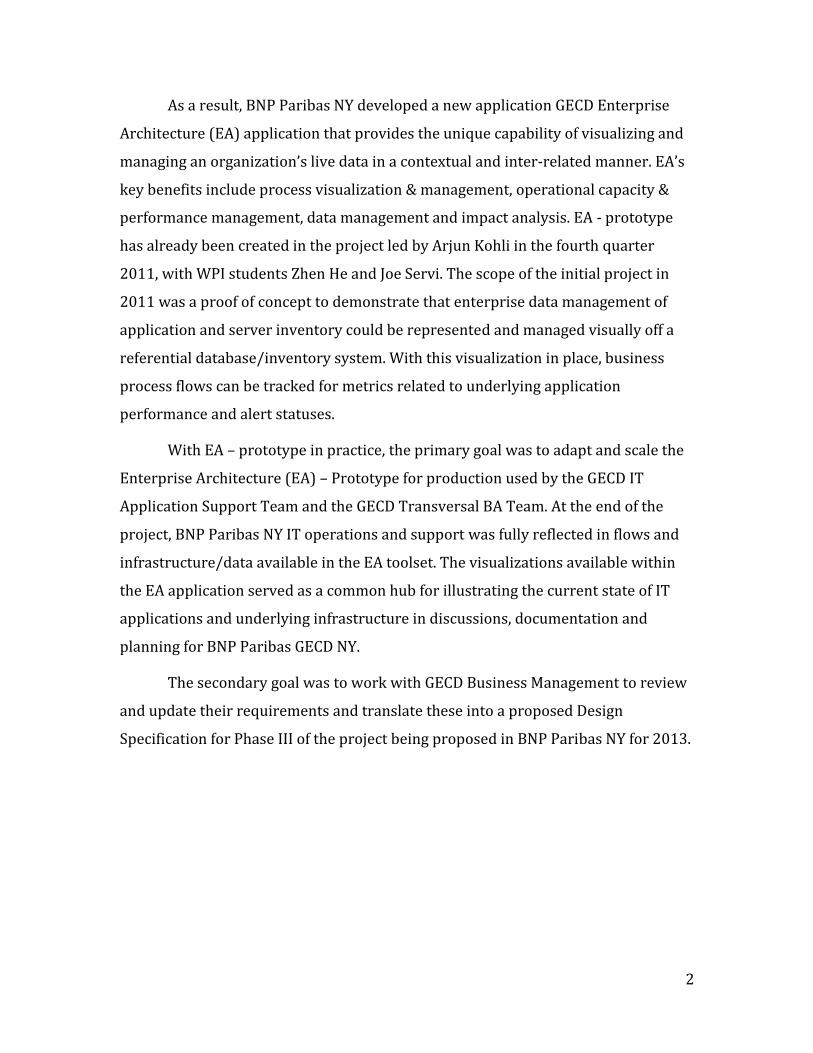
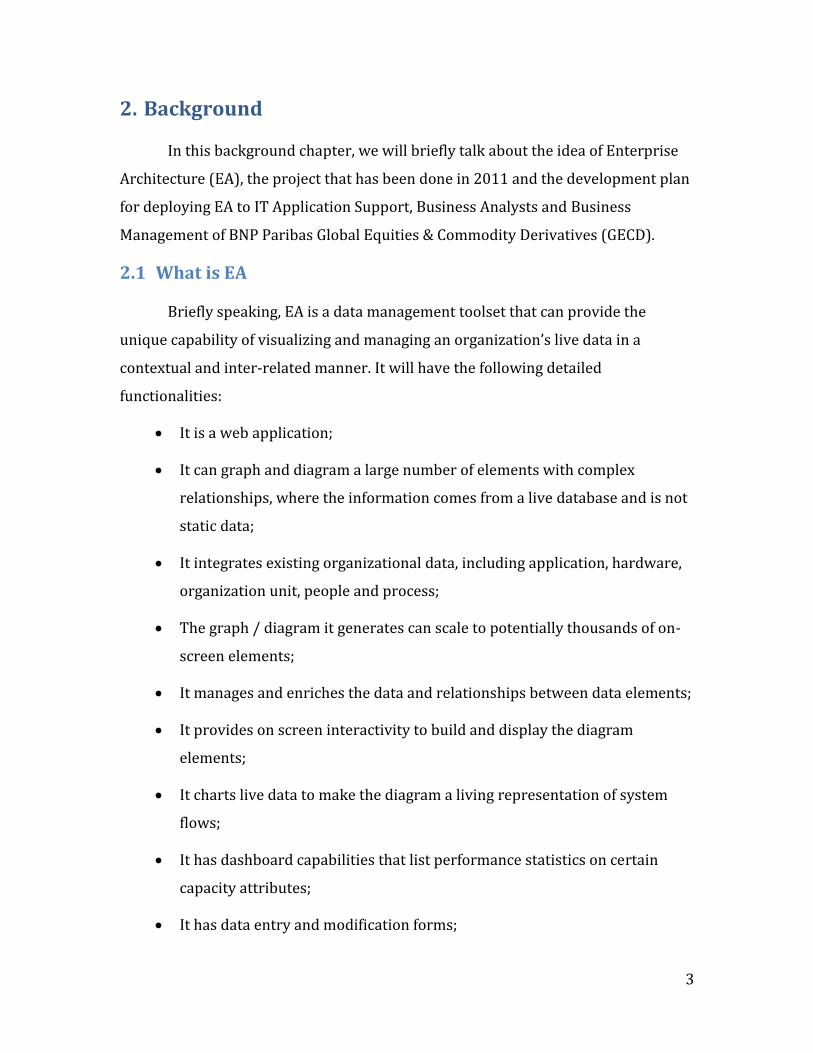
The EA application can be conceptualized as a tool, which aggregates existing
data assets in its own data access/integration, and then transforms these into a
model where they can be interrelated (see Figure 1 and Figure 2 below). The
Ontologies layer is exposed to the user via the web user interface (UI) hosted using
the Application Express (ApEx) platform. It selects data elements based on user
criteria in the Query panel to draw the elements and their inter-relationships or
links to draw a representative diagram using the Graphviz engine.
5
Figure 1 EA Logical Architecture
Figure 2 Layers of Aggregation and Enrichment
����� �$
������������������������������ ������������������������ �
�
(������������������,������������6�������7����&-�+�K�L.K�L'�++ �+�����������+����������&������.� +�����C�A9BC�.�� �7� ����������������'���������������;����+ ��������� ���� ���#� �����������������7�� ��������,����� �������(��9�����+������� ����������������� ��������,B�����������+����������������� ���&����'����#� �����������������������,��������� � ��� �������O�� ��������� �7&R� �7�R'������������������ ���� A ������������� ���0���� �7� �� �������������+ ������+���> �����6��+������������.��, ��+������������#��
(�������������������� ��,����������#���9�����+������� ������������������+ ��������� �����#B���������������������� ���� ���7���������+ �������������(����� ����������������������������, ������� ������ ����������������0�����+������� ���B�������������������.������ �,�����#��������������,�������,�����0��+��������������������������� ���#� ��������+������#����������������� �������������H�����������,�����+������� ���������+ ��B�� ������#� �;�� ���B��%��+ ������,����������� ��������������,�����������7������������������������ �����7���� �# ���# ����� �#� ������������� ����(�����+ ����������,��� �������� �����.��������� �����������7����8��B/�� 7�,���0�������,� �#� ��������������������.���#������.P� �C�.�������0��� ���� �� �����,��0�� 0��
/���������������,�� ���������#� �����������������,����������� ���� ������������� �������� -��7�M7��������������,�����0�����������#������ ������� � ���� �������� ��
������ ��������1�+����� �������� ��
������ ������1��� ��#�++ �+�����3�� �������
������ �����)"��(��������� �������� ��
5� ����?�@!��+D@?D � �� ���� �������� �,�� ��+�=�#?�
6
Relationships may be created in EA for the application and business layers to
create Business Processes or Flows, which themselves become key elements of the
overall Enterprise Architecture.
2.2 EA – Current Implementation
Some major functionalities and capabilities of EA have been implemented in
the 2011 project. They include:
Database Visualization based on User Selection: Within the context of a
saved diagram, users can select/deselect through checkboxes the entities they want
to include/exclude in their visualization. They can further indicate if the entity is
expanded downward to include child entities or collapsed as a single node. The
visualization of the selected entities is then displayed.
Graph Interactivity: Users can expand and collapse nodes and branches or
add and remove nodes and links using the on screen UI methods. In addition, the
attributes of each element may be edited by clicking the edit method that exposes a
screen for data management of that element and its relationships. Users can also
choose to see their data in a summary view, which collapses all the physical
instances of an entity into one single node, or a detailed view, which in contrast,
rolls down to show every instance of an entity.
KPI’s, Metrics and Notification: These may be defined with thresholds at
multiple levels, including infrastructure, application and process. The metrics are a
time-based series of performance statistics measured against certain attributes (e.g.
latency, memory). Alerts are logged and may be propagated via downstream API's.
These alerts can be defined at a process or individual component (e.g. application
instance, server) level.
More details of the previous implementation can be found in Appendix II –
Enterprise Architecture Application – Phase I Implementation.
7
2.3 Technology Review
A variety of technologies contributed to the development of the project.
Below is a literature review of each of them.
2.3.1 Applications
Oracle APEX
Oracle Application Express, usually known as Oracle APEX, is a handy web
application development tool that sits on top of Oracle Databases. It is a pure
browser-based Rapid Application Development (RAD) software, which offers
conversions from and to spreadsheet and MS Access databases. It can be used to
build applications that will be accessed by thousands of users at the same time with
high speed because its framework adds very little load to each request.
Oracle SQL Developer
Oracle SQL Developer is a free integrated development environment that
simplifies the development and management of Oracle Database. SQL Developer
offers complete end-to-end development of PL/SQL applications, a worksheet for
running queries and scripts, a Database Administration console for managing the
database, a reports interface, a complete data modeling solution, and a migration
platform for moving your 3rd party databases to Oracle. This software is used to
create Oracle database and set up connection to Oracle database server from client
machines.
Graphviz
Graphviz, short for Graph Visualization Software is a package of open-source
tools initiated by AT&T Labs Research for drawing graphs specified in DOT
language scripts. This software takes description of a graph, which is written in a
simple text language called DOT, as input, which can be later rendered into a variety
of formats including JPEG and SVG with different layout options such as radial and
circular layout. In the market, Graphviz is known as industry-standard graph
8
visualization software. It has many important applications in networking,
bioinformatics, software engineering, database and other technical areas.
2.3.2 Programming Languages
PL/SQL
Procedural Language/ Structural Query Language (PL/SQL) is Oracle
Corporation’s procedural extension language for SQL and Oracle relational
Database. It is designed specifically for the seamless processing of SQL commands.
Server-side PL/SQL is stored and compiled in Oracle Database and runs within the
Oracle executable. As one of the three key languages embedded in the Oracle
Database, it automatically inherits the robustness, security, and portability of Oracle
Database.
DOT Language
DOT is a plain text graph description language. It is a way to describe graphs.
The files in DOT language usually have extensions like .gv or .dot. Many programs
can process DOT files, including dot, neato, fdp, and circo. Most of the programs are
part of the Graphviz package.
HTML
HTML, short for Hyper Text Markup Language, is a markup language that
uses tags to describe web pages. HTML documents are equivalent to web pages.
Web browsers read these documents, interpret the content by HTML tags, and
display them as web pages.
JavaScript
JavaScript is a prototype-based scripting language that supports object-
oriented, imperative and functional programming styles. It is primarily used in the
client side, implemented as part of a web browser to provide enhanced user
interfaces and dynamic websites. Besides web pages, it has other applications such
as PDF document.
9
3. EA Phase II Requirements
This phase envisions upgrading the EA Prototype to Production ready
deployment to the specifications of GECD Transversal BA team and GECD IT
Application Support team. The requirements of this project come from 2 major
areas.
3.1 Front End Enhancement
This requirement is to improve the current user interface, implemented in
Phase I, to visualize flows, architecture and monitoring of capacity and alert status
at different levels of the architecture. Users will be able to manipulate nodes in a
graph as well as collapse, expand sub-graphs on the web page in a more user
friendly way. Also, in this phase, the current user interface needs to be improved so
that, without loss of generality and information amount, users can easily navigate
through different part of graphs and perform different actions to the graphs,
including but not limited to displaying and updating general information of every
node. Furthermore, user can modify graph structure by simply dragging and
dropping nodes to each other to modify the connection between them. It is expected
to have more detailed enhancements as the application will be deployed and bring
into daily use to both teams when the user interface design is finished and database
server is set up for use.
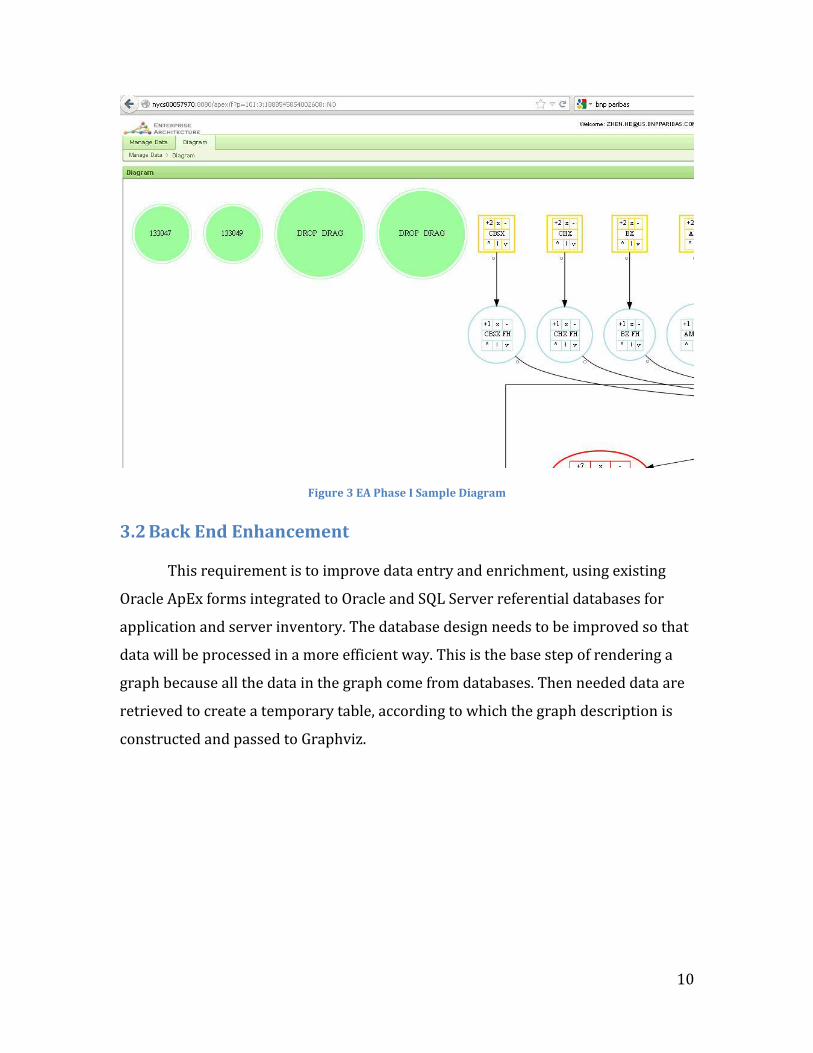
Figure 3 is an example of layout of an organization chart, where users can
define relationship between different nodes using dragging and dropping functions.
Also, users can edit details of node from the buttons on each node. The goal of this
phase is to make these functions work properly and user-friendly, so that users can
start with EA by working on the graph they request. With EA, users can have a
better picture of how each part in the company connects and collaborates with
others. And EA makes it easier to audit trail changes in the databases, which will in
return enhance the security level of the complete database.
10
Figure 3 EA Phase I Sample Diagram
3.2 Back End Enhancement
This requirement is to improve data entry and enrichment, using existing
Oracle ApEx forms integrated to Oracle and SQL Server referential databases for
application and server inventory. The database design needs to be improved so that
data will be processed in a more efficient way. This is the base step of rendering a
graph because all the data in the graph come from databases. Then needed data are
retrieved to create a temporary table, according to which the graph description is
constructed and passed to Graphviz.
11
4. Front End Development
The front-end development involved three major improvements: table
interactivity, graph interactivity, and interactions between graphs and tables. This
chapter explains design and methodology used in developing these three aspects.
4.1 Table Interactivity
According to the requirement, we want it to be easier to navigate between
different tables and forms. Users should find all the table contents meaningful and
could easily look up or make changes to the data through the web user interface.
4.1.1. Design
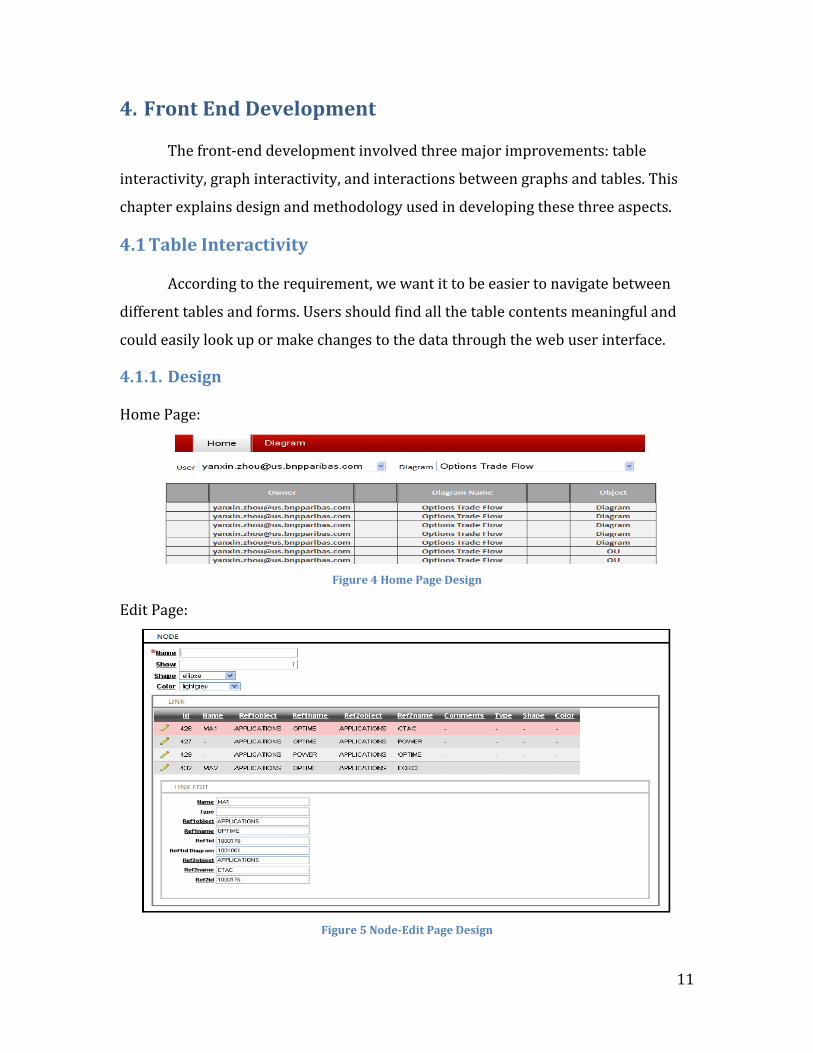
Home Page:
Figure 4 Home Page Design
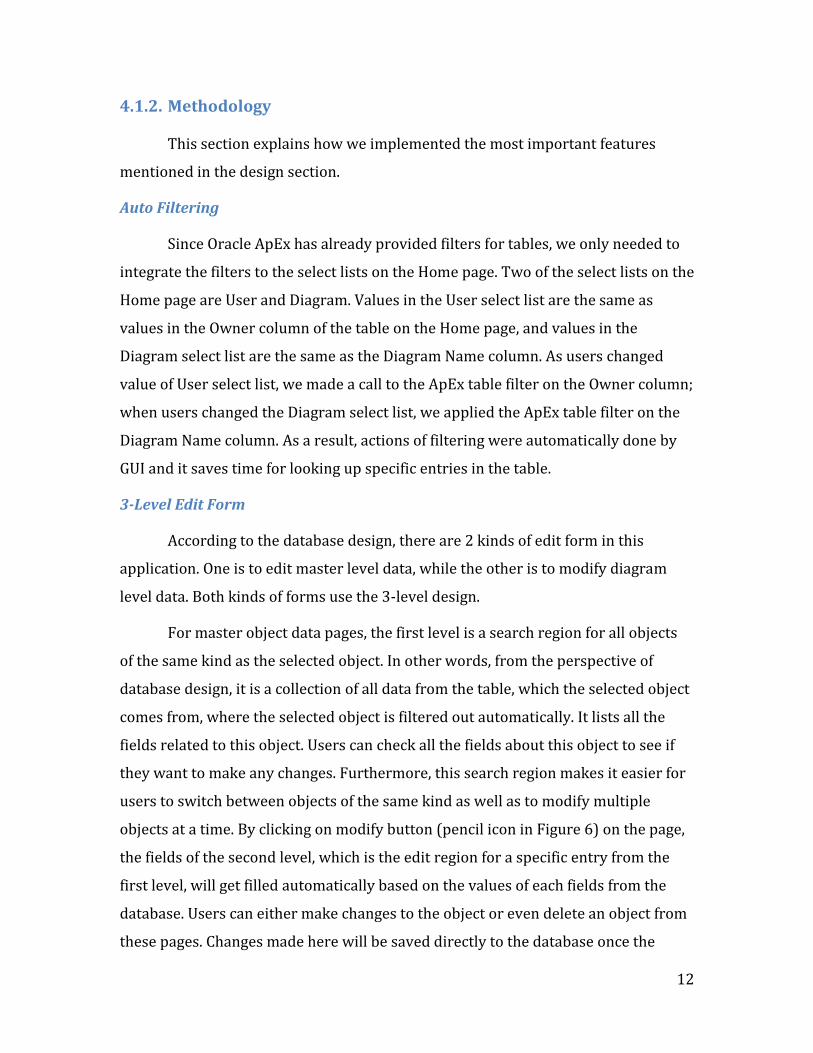
Edit Page:
Figure 5 Node-Edit Page Design
12
4.1.2. Methodology
This section explains how we implemented the most important features
mentioned in the design section.
Auto Filtering
Since Oracle ApEx has already provided filters for tables, we only needed to
integrate the filters to the select lists on the Home page. Two of the select lists on the
Home page are User and Diagram. Values in the User select list are the same as
values in the Owner column of the table on the Home page, and values in the
Diagram select list are the same as the Diagram Name column. As users changed
value of User select list, we made a call to the ApEx table filter on the Owner column;
when users changed the Diagram select list, we applied the ApEx table filter on the
Diagram Name column. As a result, actions of filtering were automatically done by
GUI and it saves time for looking up specific entries in the table.
3-Level Edit Form
According to the database design, there are 2 kinds of edit form in this
application. One is to edit master level data, while the other is to modify diagram
level data. Both kinds of forms use the 3-level design.
For master object data pages, the first level is a search region for all objects
of the same kind as the selected object. In other words, from the perspective of
database design, it is a collection of all data from the table, which the selected object
comes from, where the selected object is filtered out automatically. It lists all the
fields related to this object. Users can check all the fields about this object to see if
they want to make any changes. Furthermore, this search region makes it easier for
users to switch between objects of the same kind as well as to modify multiple
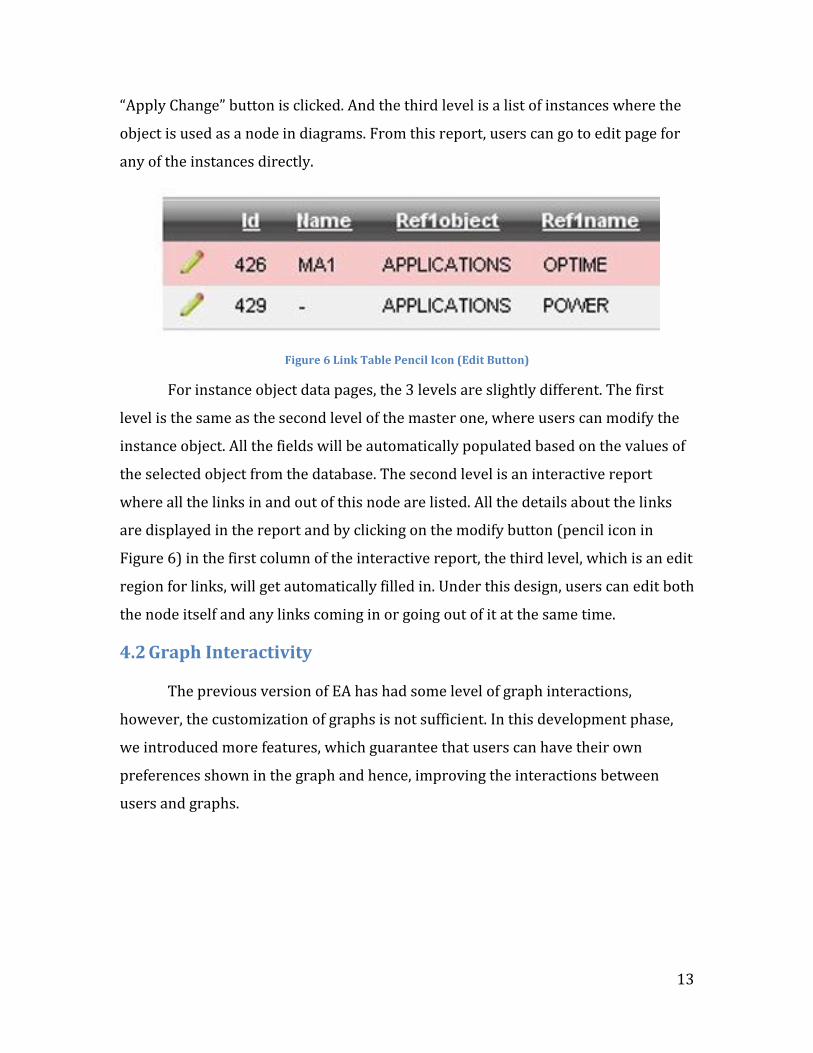
objects at a time. By clicking on modify button (pencil icon in Figure 6) on the page,
the fields of the second level, which is the edit region for a specific entry from the
first level, will get filled automatically based on the values of each fields from the
database. Users can either make changes to the object or even delete an object from
these pages. Changes made here will be saved directly to the database once the
13
“Apply Change” button is clicked. And the third level is a list of instances where the
object is used as a node in diagrams. From this report, users can go to edit page for
any of the instances directly.
Figure 6 Link Table Pencil Icon (Edit Button)
For instance object data pages, the 3 levels are slightly different. The first
level is the same as the second level of the master one, where users can modify the
instance object. All the fields will be automatically populated based on the values of
the selected object from the database. The second level is an interactive report
where all the links in and out of this node are listed. All the details about the links
are displayed in the report and by clicking on the modify button (pencil icon in
Figure 6) in the first column of the interactive report, the third level, which is an edit
region for links, will get automatically filled in. Under this design, users can edit both
the node itself and any links coming in or going out of it at the same time.
4.2 Graph Interactivity
The previous version of EA has had some level of graph interactions,
however, the customization of graphs is not sufficient. In this development phase,
we introduced more features, which guarantee that users can have their own
preferences shown in the graph and hence, improving the interactions between
users and graphs.
14
4.2.1. Design
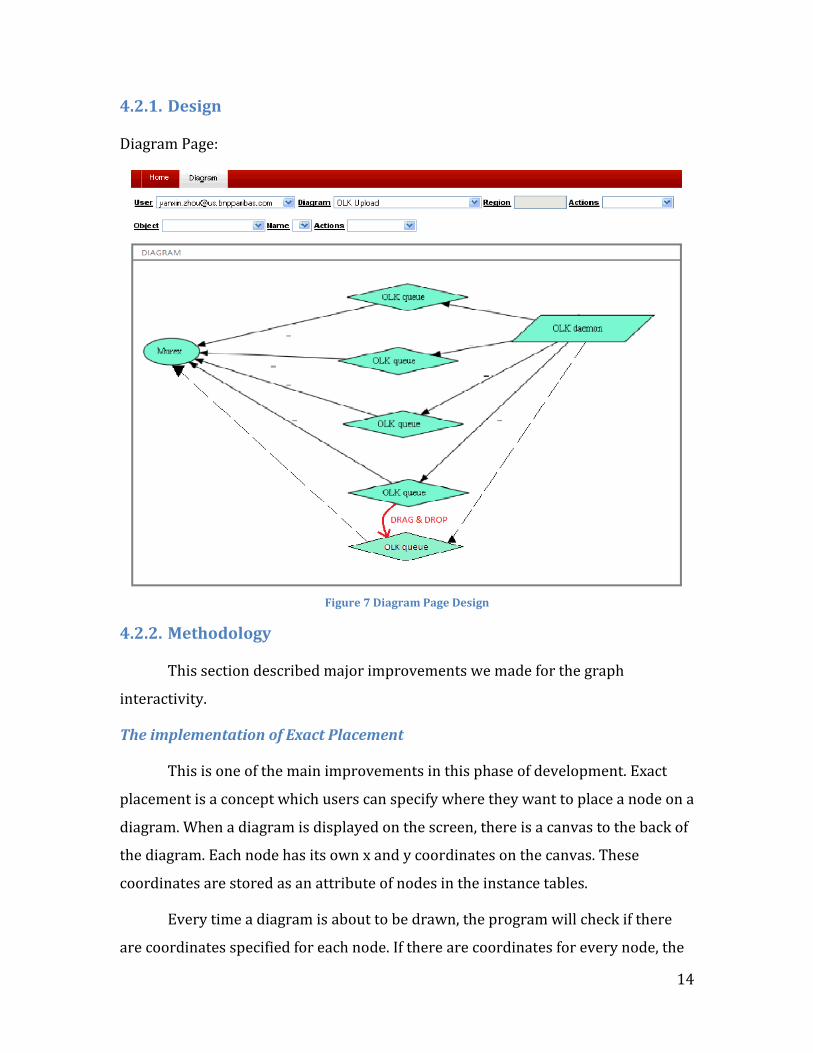
Diagram Page:
Figure 7 Diagram Page Design
4.2.2. Methodology
This section described major improvements we made for the graph
interactivity.
The implementation of Exact Placement
This is one of the main improvements in this phase of development. Exact
placement is a concept which users can specify where they want to place a node on a
diagram. When a diagram is displayed on the screen, there is a canvas to the back of
the diagram. Each node has its own x and y coordinates on the canvas. These
coordinates are stored as an attribute of nodes in the instance tables.
Every time a diagram is about to be drawn, the program will check if there
are coordinates specified for each node. If there are coordinates for every node, the
15
program will use Neato engine to place each node at exactly their coordinates.
Otherwise, the program will use Dot engine to draw the diagram in an most
optimized and compact way. Because nodes in a diagram are set to be not
overlapping with each other, there might be slight difference between the real
position of the node in the diagram and the coordinates in the database. The engine
will take care of this and try to locate the nodes at the nearest available spot. Based
on the generated files, the program will collect updated coordinates in the current
diagram and update corresponding columns in the database.
On the screen, when users send request of updating coordinates, the
program will detect the position of mouse cursor using JavaScript API. Then the
program will calculate the real coordinates in the diagram by finding its relative
position towards the origin on the diagram, where the effect of both horizontal and
vertical scroll bars as well as the effect of current scale of the diagram is taking into
account.
This implementation is one of the major improvements from Phase I of this
project last year, because it makes drag and drop to place a node feasible in our
application; therefore our application is now comparable with other 2 dimensional
graph drawing software, like Visio and OmniGraffle where users have the freedom
of placing nodes at positions they specify.
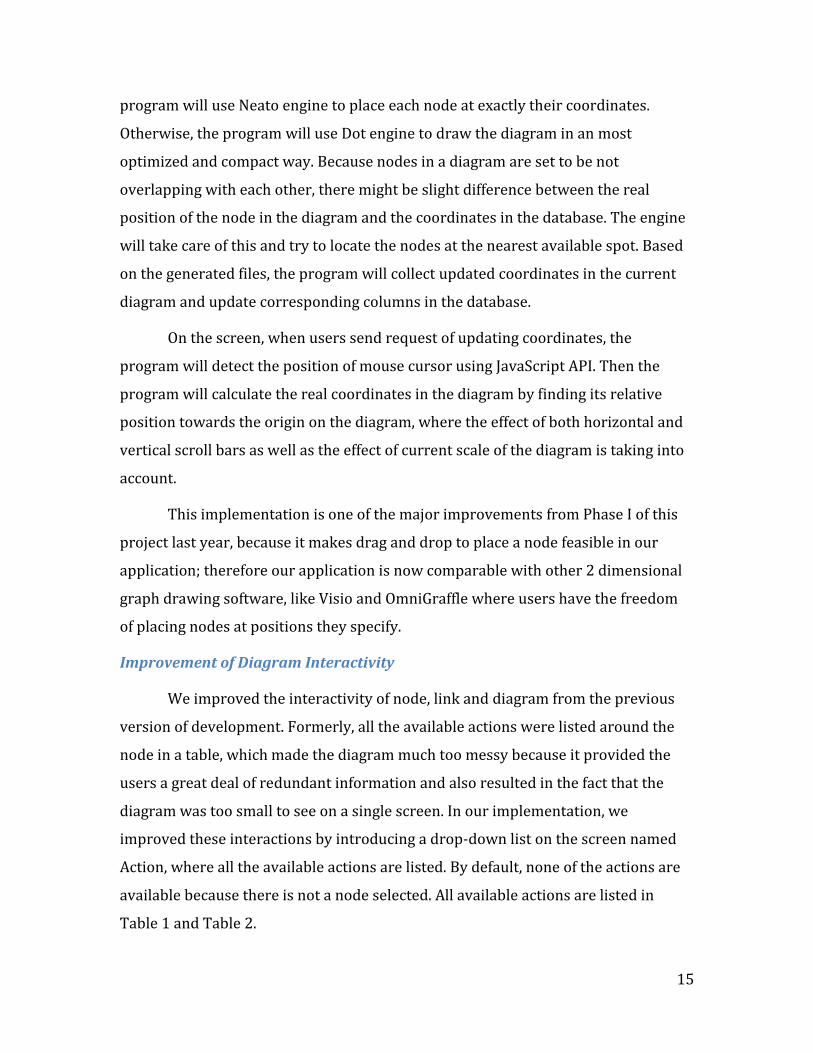
Improvement of Diagram Interactivity
We improved the interactivity of node, link and diagram from the previous
version of development. Formerly, all the available actions were listed around the
node in a table, which made the diagram much too messy because it provided the
users a great deal of redundant information and also resulted in the fact that the
diagram was too small to see on a single screen. In our implementation, we
improved these interactions by introducing a drop-down list on the screen named
Action, where all the available actions are listed. By default, none of the actions are
available because there is not a node selected. All available actions are listed in
Table 1 and Table 2.
16
Table 1 Actions Related To Single Node
Objects
Actions Diagram Node Common Node
Remove
Will remove this diagram, including
all the nodes and sub-diagrams in it
and all the links within, in and out of
it
Will remove this node
and all the links in and
out of it
Next Level Will show the hidden nodes which this node connects to
Drag and Drop
to Move
Will move the diagram node of this
diagram to the new position where
users release the mouse and move
the rest of the diagram relatively to
the diagram node
Will move this node to
the new position
where users release
the mouse
Show
Will show all nodes within this
diagram and all links in and out of the
diagram
N/A
Hide Will collapse this diagram to a single
diagram node
Will hide this node and
all the links in and out
of it
Table 2 Other Actions
Actions Usage
Create Links Dragging a node and dropping it on another will create
a link from the previous one to the latter one.
Clone Diagram Will create a copy of the current diagram under the
current user’s account
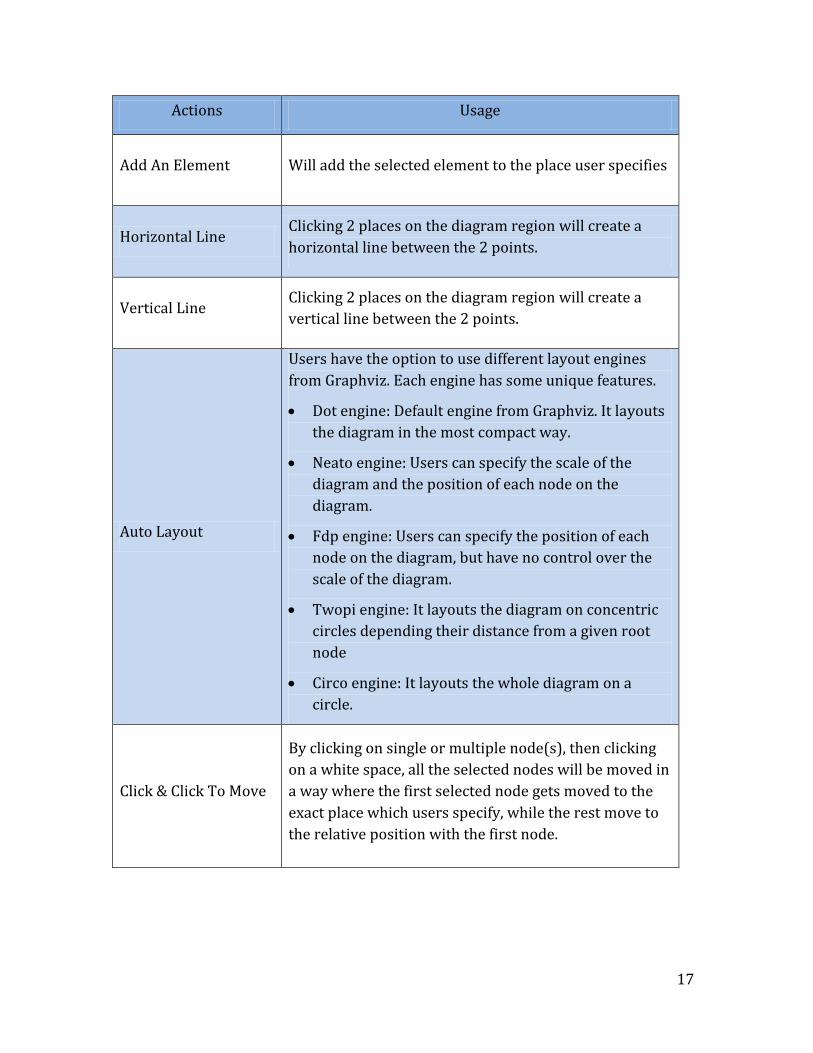
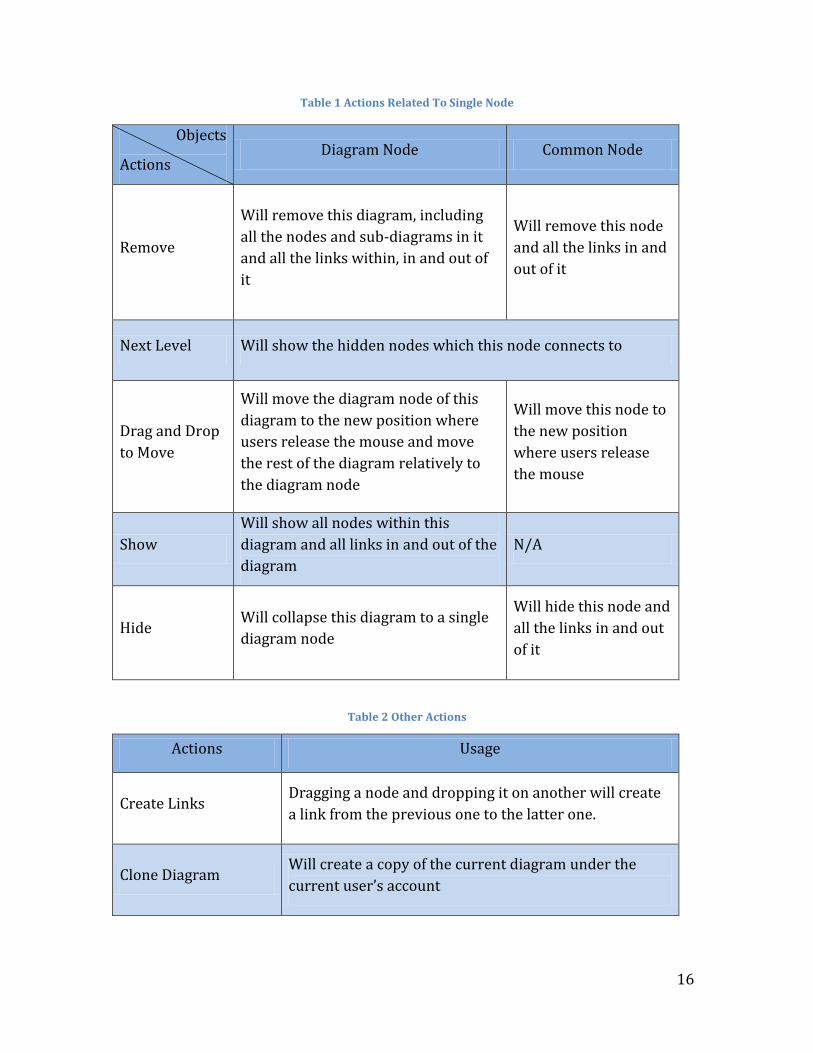
17
Actions Usage
Add An Element Will add the selected element to the place user specifies
Horizontal Line Clicking 2 places on the diagram region will create a
horizontal line between the 2 points.
Vertical Line Clicking 2 places on the diagram region will create a
vertical line between the 2 points.
Auto Layout
Users have the option to use different layout engines
from Graphviz. Each engine has some unique features.
Dot engine: Default engine from Graphviz. It layouts
the diagram in the most compact way.
Neato engine: Users can specify the scale of the
diagram and the position of each node on the
diagram.
Fdp engine: Users can specify the position of each
node on the diagram, but have no control over the
scale of the diagram.
Twopi engine: It layouts the diagram on concentric
circles depending their distance from a given root
node
Circo engine: It layouts the whole diagram on a
circle.
Click & Click To Move
By clicking on single or multiple node(s), then clicking
on a white space, all the selected nodes will be moved in
a way where the first selected node gets moved to the
exact place which users specify, while the rest move to
the relative position with the first node.
18
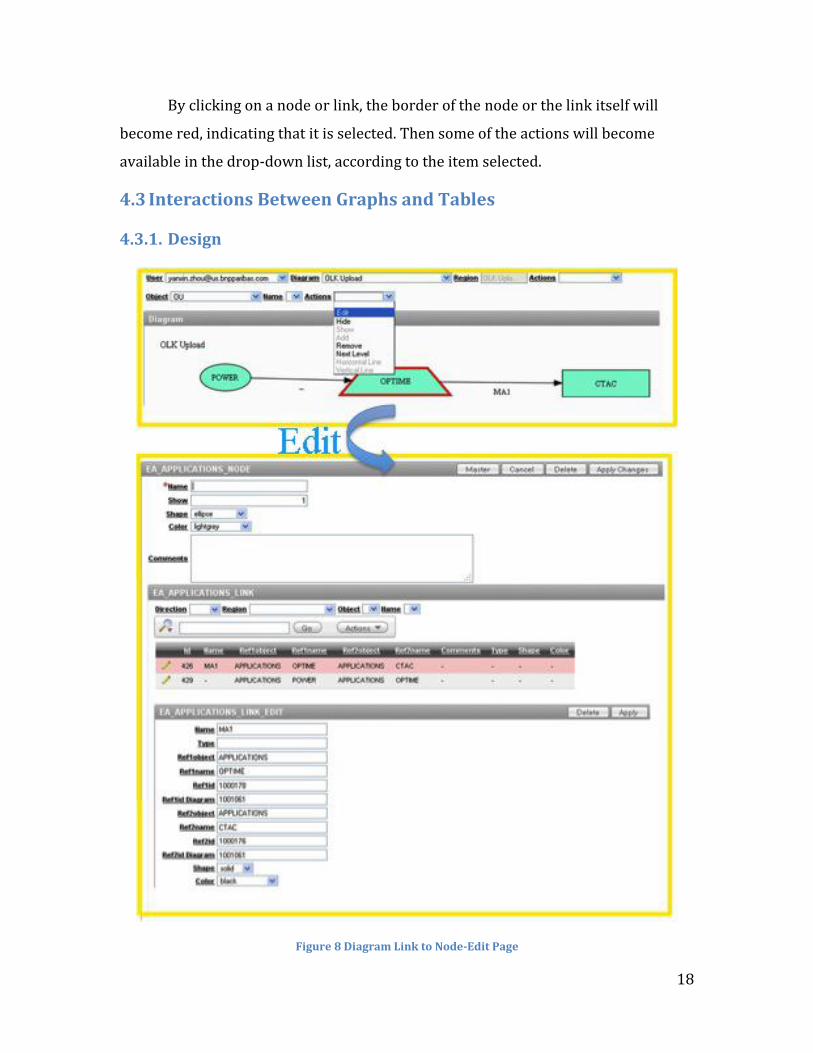
By clicking on a node or link, the border of the node or the link itself will
become red, indicating that it is selected. Then some of the actions will become
available in the drop-down list, according to the item selected.
4.3 Interactions Between Graphs and Tables
4.3.1. Design
Figure 8 Diagram Link to Node-Edit Page
19
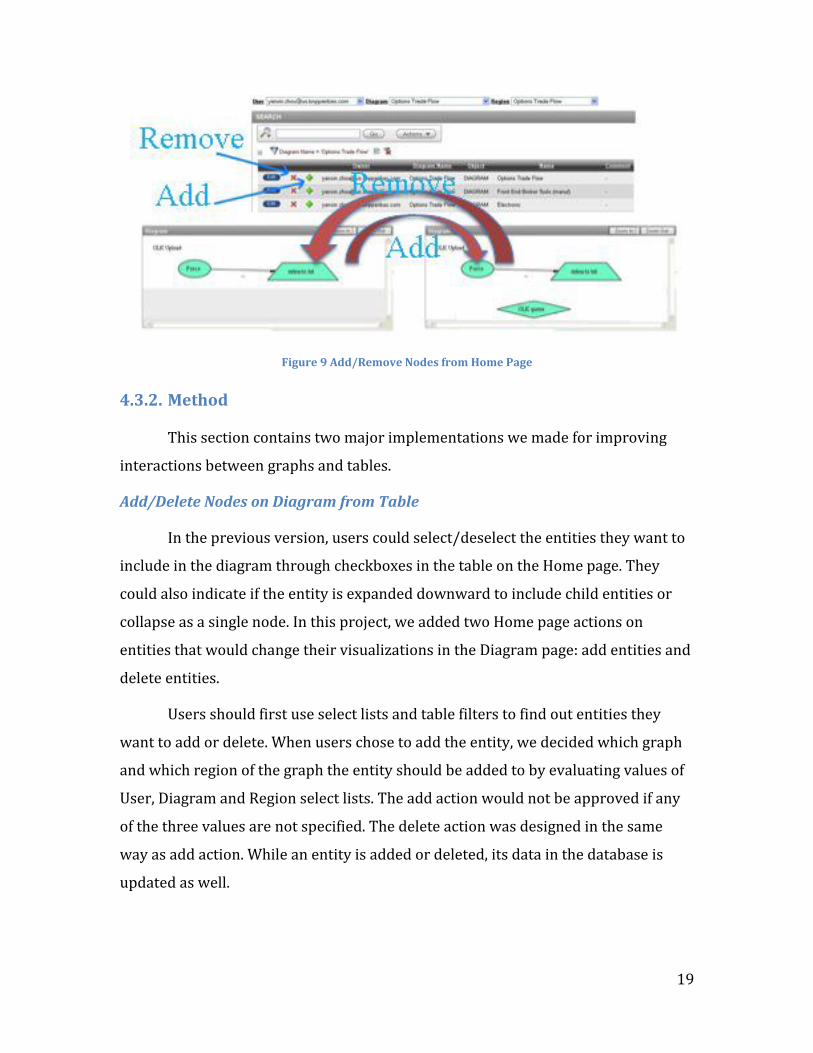
Figure 9 Add/Remove Nodes from Home Page
4.3.2. Method
This section contains two major implementations we made for improving
interactions between graphs and tables.
Add/Delete Nodes on Diagram from Table
In the previous version, users could select/deselect the entities they want to
include in the diagram through checkboxes in the table on the Home page. They
could also indicate if the entity is expanded downward to include child entities or
collapse as a single node. In this project, we added two Home page actions on
entities that would change their visualizations in the Diagram page: add entities and
delete entities.
Users should first use select lists and table filters to find out entities they
want to add or delete. When users chose to add the entity, we decided which graph
and which region of the graph the entity should be added to by evaluating values of
User, Diagram and Region select lists. The add action would not be approved if any
of the three values are not specified. The delete action was designed in the same
way as add action. While an entity is added or deleted, its data in the database is
updated as well.
20
Enter Node Edit Page from Diagram
In this version, users can navigate to the node-edit page not only by clicking
the edit button in the table on the Home page, but also by selecting a node on the
Diagram page and then choose “edit” in the Action select list. This improvement
gives users a direct viewing of which node needs editing. In the node-edit page,
users could change all the editable attributes of the node, including links connect to
or from it. When users got back to the Diagram page after the modification, all the
changes done in the node-edit page were shown on the diagram visually. The
corresponding data of the node was also updated.
When users navigate to the node-edit page, all the current values of the
node’s attributes were filled in corresponding text fields or select lists. This auto fill
was accomplished by using the function “htmldb_Get”. When users clicked on a
node, hyperlink embedded in this node launched some JavaScript functions to fill
hidden fields that stored the node’s information on the Diagram page. When users
chose “edit”, we passed the node’s information in the hidden fields as parameters to
the function htmldb_Get, and then this function called the corresponding function in
database with those parameters so that database could return correct values of the
node’s current attributes.
Users could also link to the node-edit page by selecting a link in the Diagram
page and then chose “edit”. The difference is that in the second-level form on the
node-edit page, except the selected link on the Diagram page, all the other links are
filtered out. The auto filtering was implemented in the same way as the auto
filtering on the Home page, since we could get the link’s id through htmldb_Get and
then filtered the link table by id.
21
5. Back End Development
In this phase of development, we built up the database with new structure
and design. This decision was made for the reason that the new design increases the
flexibility and changeability of the database as we implemented more functions.
Database
5.1 Database Design
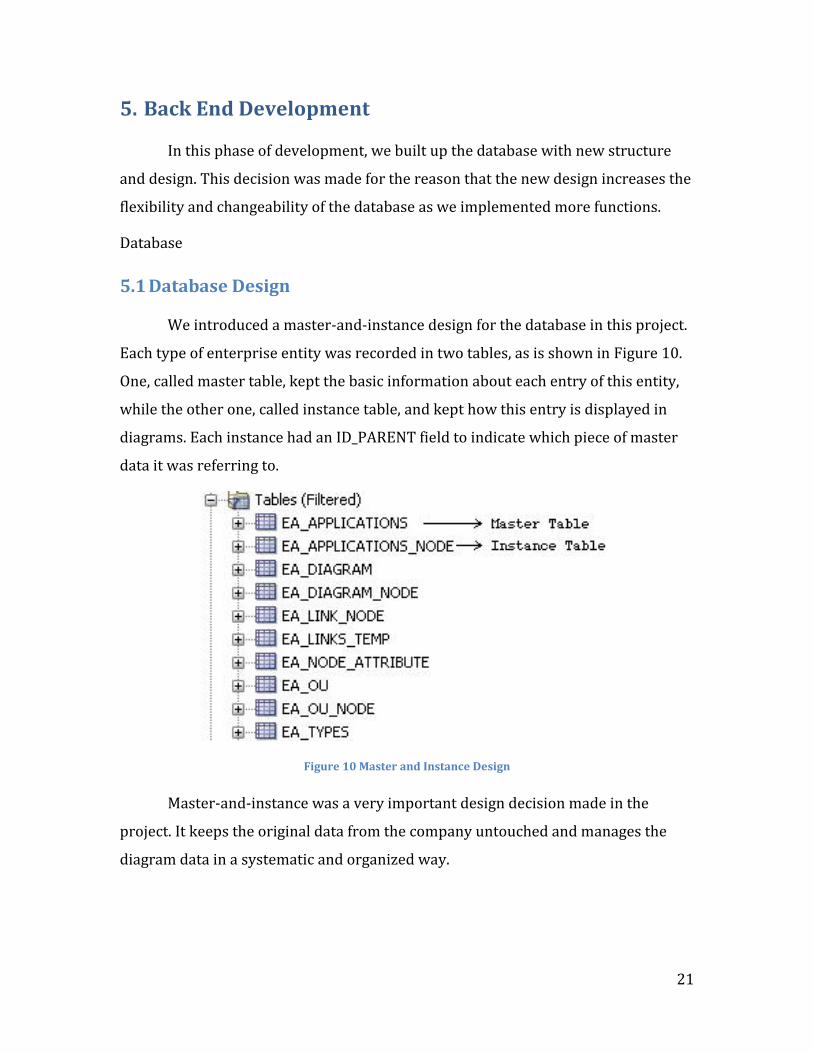
We introduced a master-and-instance design for the database in this project.
Each type of enterprise entity was recorded in two tables, as is shown in Figure 10.
One, called master table, kept the basic information about each entry of this entity,
while the other one, called instance table, and kept how this entry is displayed in
diagrams. Each instance had an ID_PARENT field to indicate which piece of master
data it was referring to.
Figure 10 Master and Instance Design
Master-and-instance was a very important design decision made in the
project. It keeps the original data from the company untouched and manages the
diagram data in a systematic and organized way.
22
5.2 Database Structure
There are 17 different types of enterprise entities in the visualization, each of
which is consisted of a series of master data. They come directly from 17 tables in
the company’s currently database. All of them can become nodes in diagrams. How
to store these 17 types of entities as well as their relationships between each other
in the database becomes especially significant. We designed a database management
system where we keep those 17 types of entities and their properties as it is in 17
tables. Because different entities can have totally different properties, it is hard to
accommodate all the needs for different entities in one table. Then, 17
corresponding instance level tables are created to store attributes about how each
piece of master data is displayed in different diagrams, including shape and color as
well as placement. Every time users want to add a node to a diagram, it must come
from a piece of the master level data and then an instance of this master will be
created and stored in the corresponding instance level data table.
Besides these 34 tables, there are still several more tables to store diagram
information. For general diagram data, we have a master data table, EA_DIAGRAM,
where basic information like name and owner of diagram is stored, and an instance
data table, EA_DIAGRAM_NODE, where users can keep different versions of the
same diagram. Also, there is a table to store all the links information, where links are
defined as source-to-destination 2-dimensional records to specify relationships
among these 17 types of entities. Lastly, there is a table to store all available
customizable attributes of nodes or links and their possible values.
For simplicity of retrieving data from the database, several views are defined.
EA_MASTER_VIEW is a generalization of all master level data, while EA_NODE_VIEW
is a generalization of all instance level data. EA_LINK_VIEW collects information
about all the relationships between entities in diagrams in the whole system. And
EA_SEARCH_VIEW is a generalization of the other 3 views.
23
5.3 Methodology
This section illustrates the implementation of most critical functions in the
database.
5.3.1. The Implementation of User Preferences
In this phase of development, we introduce a very important idea that every
node in every diagram is an instance of the master data. Under this design, we can
offer great freedom to users, where they can customize a great many details for each
node, including name, shape, color and etc. Considering user experience, if users do
not want to spend much time on customizing these details, by default, the node will
always inherit these settings from the master data they come from. For example, in
cases where users want to have multiple versions of the same diagram, they can
simply make copies of the original diagram and all of them will have the same
master; therefore, all these diagrams have the same default settings. Users can then
make changes to different copies for different uses. Also this design is useful for data
maintenance, where diagram data are separated from master ones; hence by
changing attributes at diagram level will not affect the same nodes in any other
diagrams, while by changing attributes at master level will make changes to all the
diagrams where the piece of data is displayed. Last but not least, this design can be
easily re-apply to any database system, because what needs to be done are simply
building up the diagram level database structure and creating one-to-many
relationships from the master data to diagram data. Then the database is ready to be
used for diagram constructing.
5.3.2. Embedment of Diagrams
We inherited the idea of embedded diagrams from last year, where each
diagram can have multi-level embedded diagrams within it and each sub-diagram
will be surrounded by a square, indicating that it is a sub-diagram. When rendering
a diagram, always the most inner ones will be drawn first and then moving outside
level by level until the outer most diagram is finished.
24
This functionality adds more flexibility to the diagram; however, it is
implemented in a distinct way in our design, where each diagram created has a field
called ID_DIAGRAM to denote the ID of its parent level diagram. If the diagram itself
is of the highest level, then its ID_DIAGRAM will show the same as its own ID.
5.3.3. Interaction with Front End User Interface
A lot of functions mentioned in Section 4.3.2 would send request to the back
end through the function “htmldb_Get”. This generally involves look-ups or updates
to the data.
Rendering Diagrams
Every time users asked to display a diagram on the screen, it actually sent
request to database. A function defined in the database would retrieve information
of every element, including sub-diagrams, nodes, and links, within the diagram and
transfer them into Graphviz format. Then the database would call Oracle Job
Scheduler to render the diagram.
Diagram Interactions
Every diagram interaction would make some changes to the diagram. The
application would record the changes by modifying some values in the database.
Generally speaking, all attributes about each node, each diagram and each link were
stored in the database. Users requested changes on the diagram would result in
value changes in the database. Then the application would re-render the diagram
with those changes in effect.
25
6. Results
At the end of the project, a well-integrated visualization and data
management application was built. This chapter is a full presentation of the final
product.
6.1 Applications Pages Overview
This section shows the most important pages in Enterprise Architecture.
They were implemented closely following the application design.
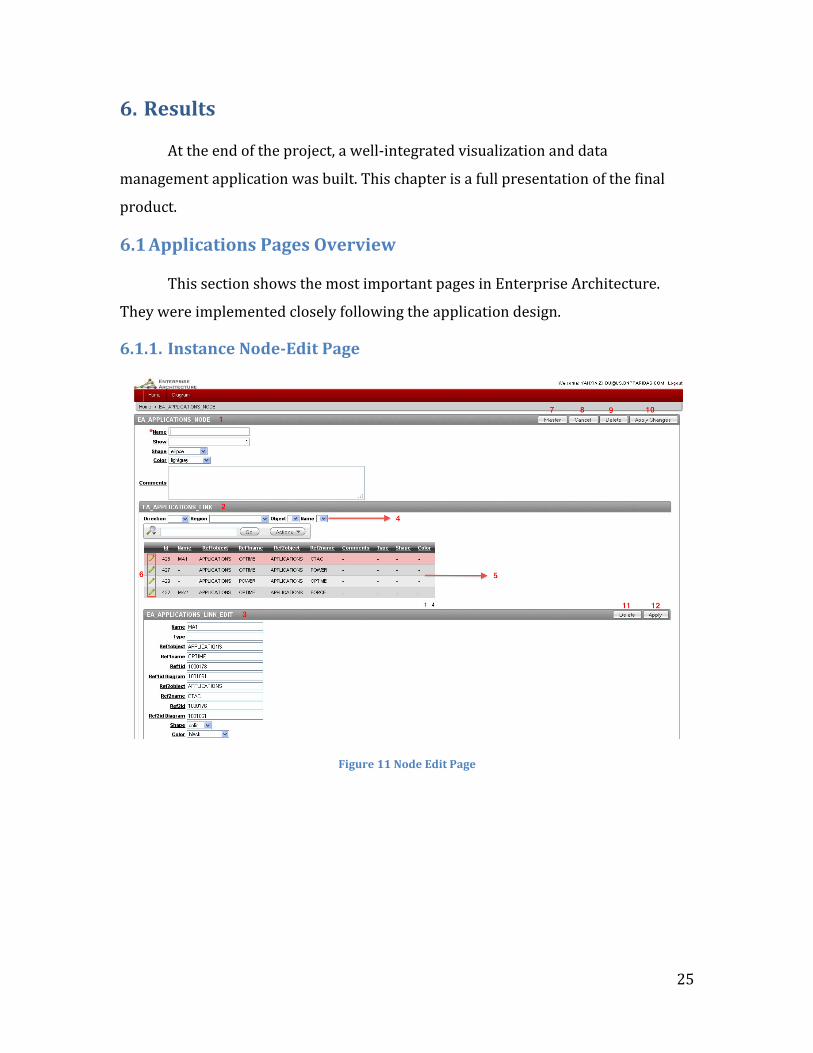
6.1.1. Instance Node-Edit Page
Figure 11 Node Edit Page
26
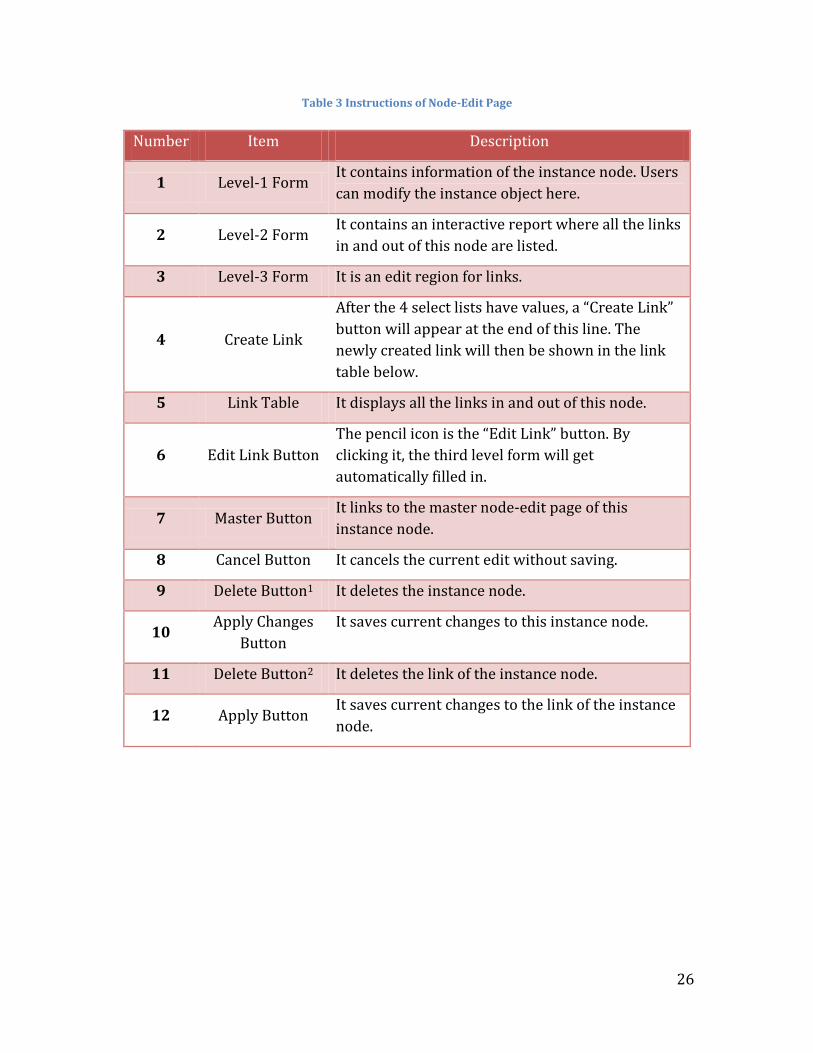
Table 3 Instructions of Node-Edit Page
Number Item Description
1 Level-1 Form It contains information of the instance node. Users
can modify the instance object here.
2 Level-2 Form It contains an interactive report where all the links
in and out of this node are listed.
3 Level-3 Form It is an edit region for links.
4 Create Link
After the 4 select lists have values, a “Create Link”
button will appear at the end of this line. The
newly created link will then be shown in the link
table below.
5 Link Table It displays all the links in and out of this node.
6 Edit Link Button
The pencil icon is the “Edit Link” button. By
clicking it, the third level form will get
automatically filled in.
7 Master Button It links to the master node-edit page of this
instance node.
8 Cancel Button It cancels the current edit without saving.
9 Delete Button1 It deletes the instance node.
10 Apply Changes
Button
It saves current changes to this instance node.
11 Delete Button2 It deletes the link of the instance node.
12 Apply Button It saves current changes to the link of the instance
node.
27
6.1.2. Home Page
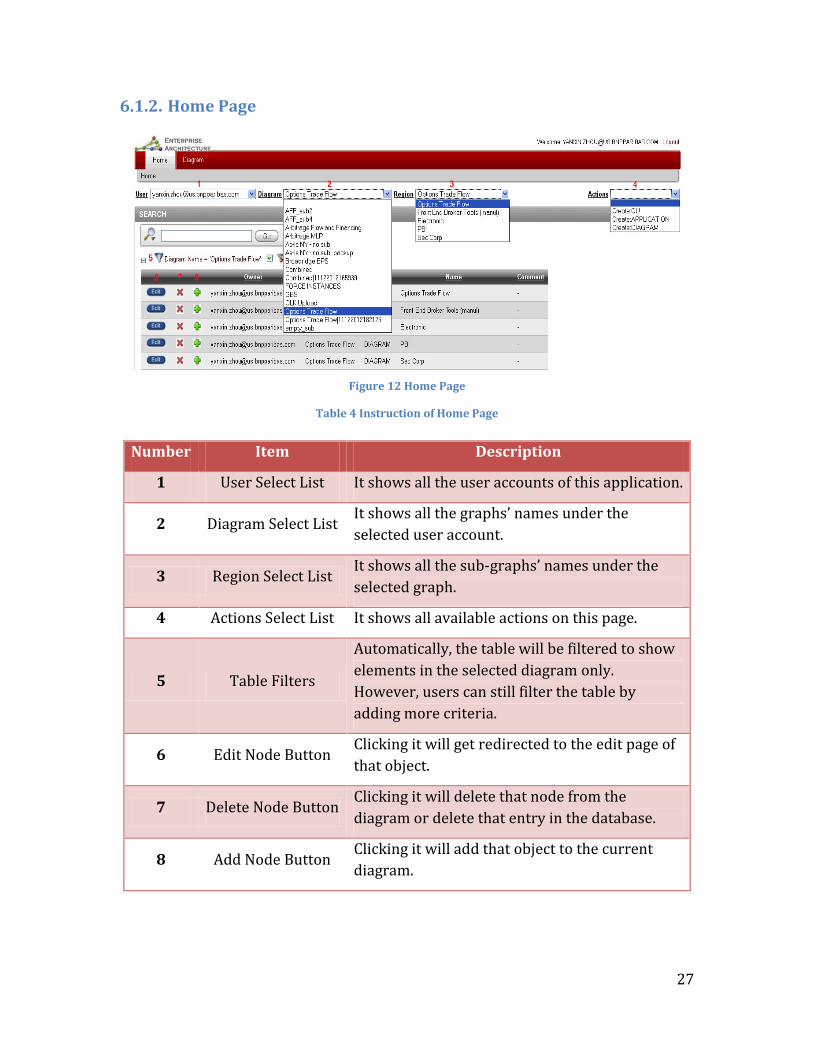
Figure 12 Home Page
Table 4 Instruction of Home Page
Number Item Description
1 User Select List It shows all the user accounts of this application.
2 Diagram Select List It shows all the graphs’ names under the
selected user account.
3 Region Select List It shows all the sub-graphs’ names under the
selected graph.
4 Actions Select List It shows all available actions on this page.
5 Table Filters
Automatically, the table will be filtered to show
elements in the selected diagram only.
However, users can still filter the table by
adding more criteria.
6 Edit Node Button Clicking it will get redirected to the edit page of
that object.
7 Delete Node Button Clicking it will delete that node from the
diagram or delete that entry in the database.
8 Add Node Button Clicking it will add that object to the current
diagram.
28
6.1.3. Diagram Page
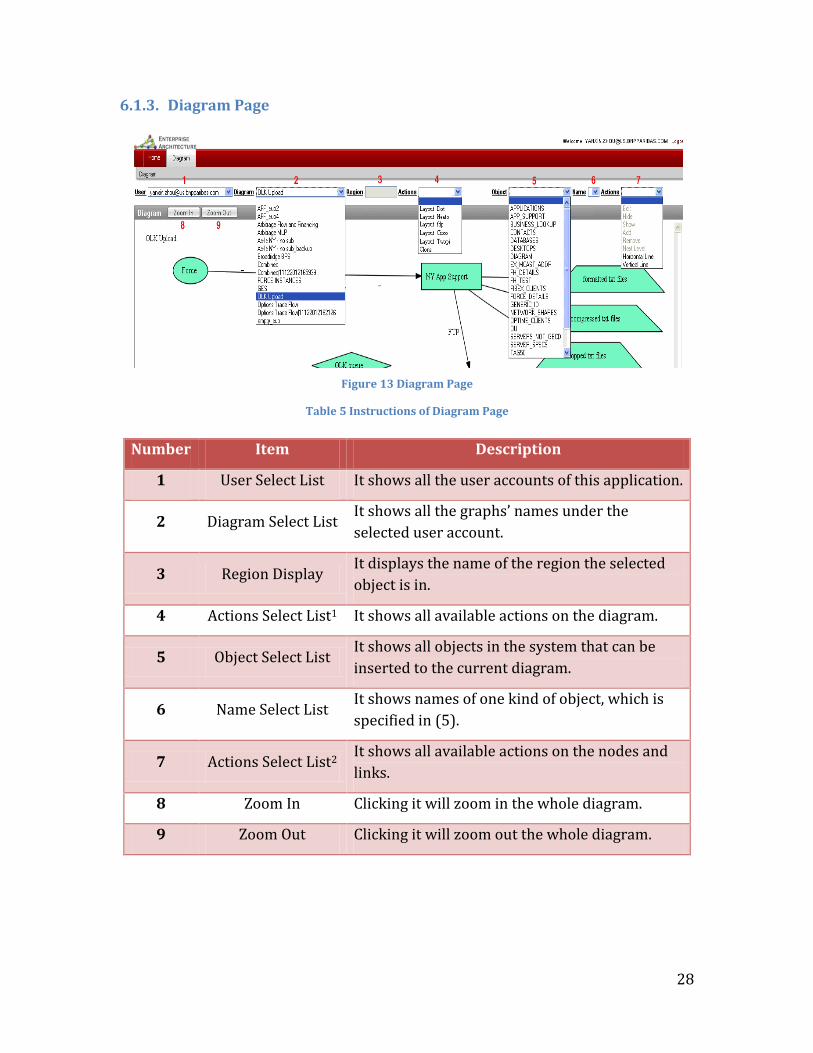
Figure 13 Diagram Page
Table 5 Instructions of Diagram Page
Number Item Description
1 User Select List It shows all the user accounts of this application.
2 Diagram Select List It shows all the graphs’ names under the
selected user account.
3 Region Display It displays the name of the region the selected
object is in.
4 Actions Select List1 It shows all available actions on the diagram.
5 Object Select List It shows all objects in the system that can be
inserted to the current diagram.
6 Name Select List It shows names of one kind of object, which is
specified in (5).
7 Actions Select List2 It shows all available actions on the nodes and
links.
8 Zoom In Clicking it will zoom in the whole diagram.
9 Zoom Out Clicking it will zoom out the whole diagram.
29
6.2 Specific Features Overview
This section displays some specific features on the application user interface.
They greatly improve user experience.
6.2.1. Auto Filter on Actions List
Figure 14 Auto Filter on Actions List
Actions list will show different available actions as users select different kind
of objects. Some actions in the list are not applicable to nodes, while some are not
applicable to links.
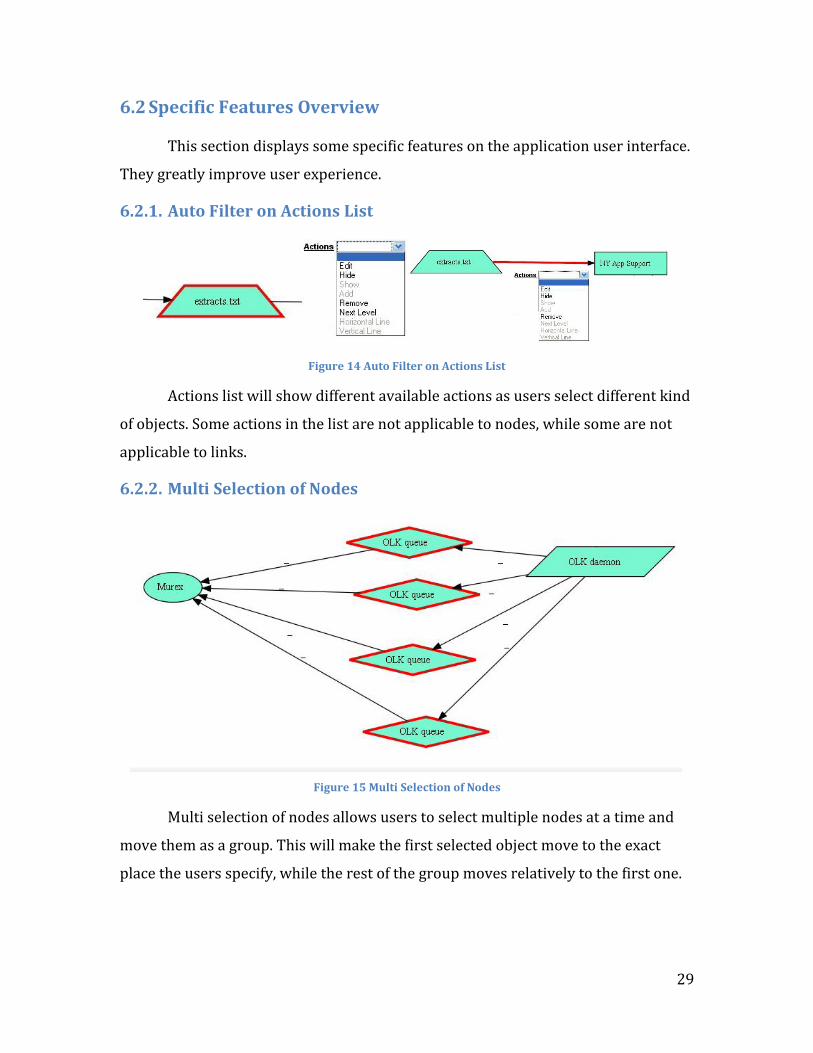
6.2.2. Multi Selection of Nodes
Figure 15 Multi Selection of Nodes
Multi selection of nodes allows users to select multiple nodes at a time and
move them as a group. This will make the first selected object move to the exact
place the users specify, while the rest of the group moves relatively to the first one.
30
7. Conclusions and Recommendations
In this project, we adapted and scaled the Enterprise Architecture prototype
to a well-integrated browser-based data visualization and management tool. The
application prototype underwent extensive developments and improvements in
aspects of table interactivity, graph interactivity, interactions between tables and
graphs, database reconstruction and data management. All these improvements
greatly enhanced the ability of customizing visualizations of data. Summarized
descriptions of each aspect of development are as follows:
Table Interactivity:
Introduced the 3-level edit form, which provides users great convenience to
make changes to master nodes, instance nodes and links in the same page.
Introduced auto filtering while changing values of select lists. It saves users’ time
for looking up specific entries in the table.
Graph Interactivity:
Introduced exact placement of nodes. This makes our application now
comparable with other 2 dimensional graph drawing software, like Visio and
OmniGraffle, where users have the freedom of placing nodes at positions they
specify.
Introduced 5 actions on single node and 7 actions on diagrams and links. Greatly
improved the ability of user customization.
Interactions between Graphs and Tables:
Introduced add/delete functions in the table on the Home page. It avoids the
long graph-rendering time after each add/delete action on nodes on the Diagram
page.
Introduced the link between graphs and node-edit page. This improvement gives
users a direct viewing of which node needs editing.
Database Reconstruction:
31
Introduced user preference functions. It provides full control over the attributes
of diagrams to the users.
Introduced master and instance object design. It encapsulates the original
database from the company, while building up diagrams in instance tables.
Introduced the interaction between back end and front end. It makes it feasible
for users to direct modify diagrams on the user interface.
The Enterprise Architecture still remains some limitations at the end of
development phase II, and we summarized them into two major development
objectives for teams that will work further on this application:
Actions on nodes, links and graphs need capabilities of “undo” and “redo”:
Without undo and redo, it can sometimes cause catastrophes to the whole
database because a simple click could mess up the data and the whole database,
where the only way to make up for this is to roll back the complete database which
will for sure result in inestimable loss to the company.
For further developments, teams should consider to have backup database,
which at least stores one previous state of the whole system. This may involve
extensive design of how to switch between two states fast and accurately.
Multi-user processing needs to be implemented:
In current development, Oracle database will raise concurrency error when
two or more users try to modify the same diagram at the same time. This decreases
the usability of the application to some extent. In real life, it is very likely that two
users work on the same diagram concurrently. However, Oracle database banned
these multi-user processes.
For further developments, teams should consider to have a request list,
where all requests from different users are kept in a list and will be finished one by
one in a time-efficient manner.
Besides the above two major objectives, future teams should also consider to
optimize data processing algorithms used in this system. Since Enterprise

32
Architecture Phase I and II were mainly focused on proofs of feasibilities and
implementations of major features that can bring this product to live as soon as
possible, algorithms used in the system did not go through extensive designs and
tests. Optimizing these algorithms will incredibly improve the system behavior.
33
Appendix I – BNP Paribas and GECD
BNP Paribas is a leader in banking and financial services in Europe. The
Group is present in 80 countries. Headquartered in New York, BNP Paribas North
America has locations in all of the major corporate and financial centers of the
United States and Canada. The bank serves a world-class client base of multinational
corporates and mid-capitalization companies, as well as major issuers and
institutional buyers. BNP Paribas North America relies on strong, established
franchises in order to provide a full-service institutional corporate and investment
banking approach, and to offer a broad range of advisory services and corporate
finance capabilities to key industry sectors. BNP Paribas Global Equities & Commodity
Derivatives, a branch of BNP Paribas Corporate and Investment Banking, offers
derivatives on equities and commodities, as well as financing solutions and integrated
equity brokerage platform. It is organized into 3 lines of business: Structured Equity,
Flow & Financing and Commodity Derivatives.
Structured Equity
It provides structured solutions to a broad variety of business customers,
banking networks, insurance companies and pension funds. It provides customized or
exchange-traded structured products to meet their needs in capital protection, yield
and diversification.
Flow and Financing
It caters to the needs of institutional investors and hedge funds. It designs
appropriate and innovative investment and hedging strategies in equity market and
provides its clients with a rapidly developing integrated equity brokerage platform.
Commodity Derivatives
It provides a range of risk hedging solutions to corporate clients and access
to commodities through various investment strategies and structured solutions to
investors.
34
Appendix II – Enterprise Architecture Application – Phase
I Implementation
Summary of functions
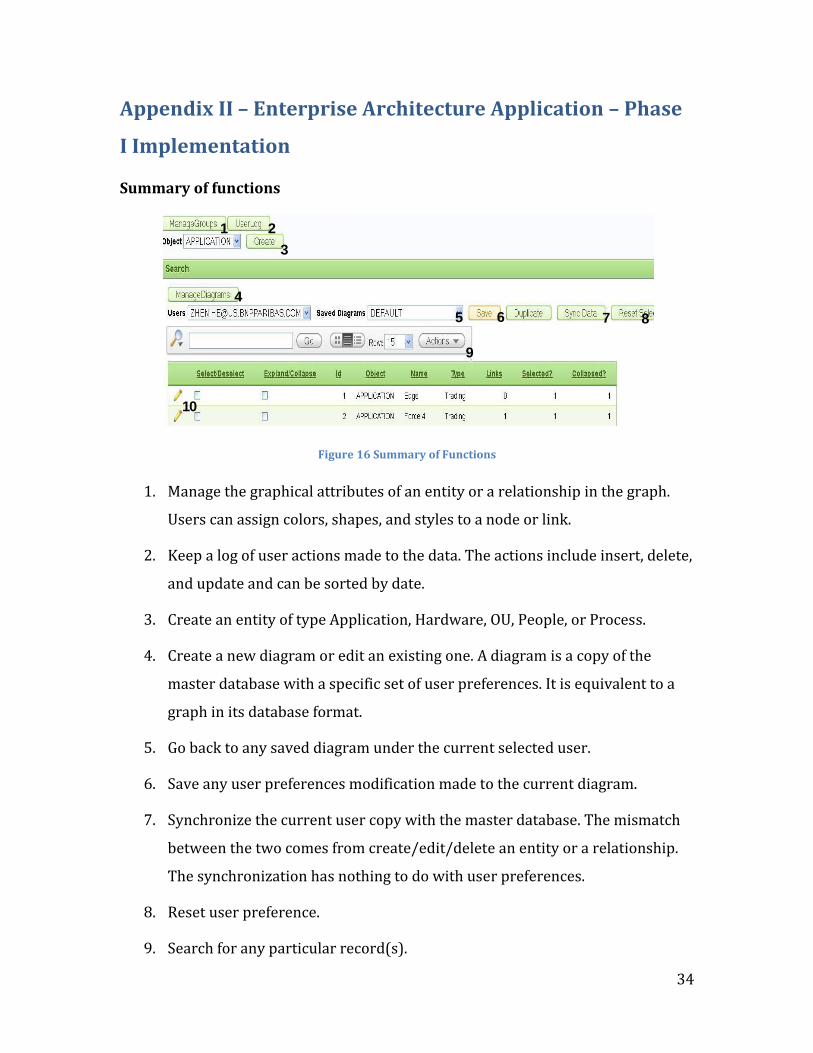
Figure 16 Summary of Functions
1. Manage the graphical attributes of an entity or a relationship in the graph.
Users can assign colors, shapes, and styles to a node or link.
2. Keep a log of user actions made to the data. The actions include insert, delete,
and update and can be sorted by date.
3. Create an entity of type Application, Hardware, OU, People, or Process.
4. Create a new diagram or edit an existing one. A diagram is a copy of the
master database with a specific set of user preferences. It is equivalent to a
graph in its database format.
5. Go back to any saved diagram under the current selected user.
6. Save any user preferences modification made to the current diagram.
7. Synchronize the current user copy with the master database. The mismatch
between the two comes from create/edit/delete an entity or a relationship.
The synchronization has nothing to do with user preferences.
8. Reset user preference.
9. Search for any particular record(s).
Page | 55
7.2. Summaryoffunctions
Figure 34: Summary of functions in ApEx interface.
1. Manage the graphical attributes of an entity or a relationship in the graph.
Users can assign colors, shapes, and styles to a node or link.
2. Keep a log of user actions made to the data. The actions include insert, delete,
and update and can be sorted by date.
3. Create an entity of type Application, Hardware, OU, People, or Process.
4. Create a new diagram or edit an existing one. A diagram is a copy of the
master database with a specific set of user preferences. It is equivalent to a
graph in its database format.
5. Go back to any saved diagram under the current selected user.
6. Save any user preferences modification made to the current diagram.
7. Synchronize the current user copy with the master database. The mismatch
between the two comes from create/edit/delete an entity or a relationship. The
synchronization has nothing to do with user preferences.
8. Reset user preference.
9. Search for any particular record(s).
10. Edit an existing entity. Relationships that involve that entity can be edited
from the editing page for that entity.
1 2
3
4
5 6 7 8
9
10
35
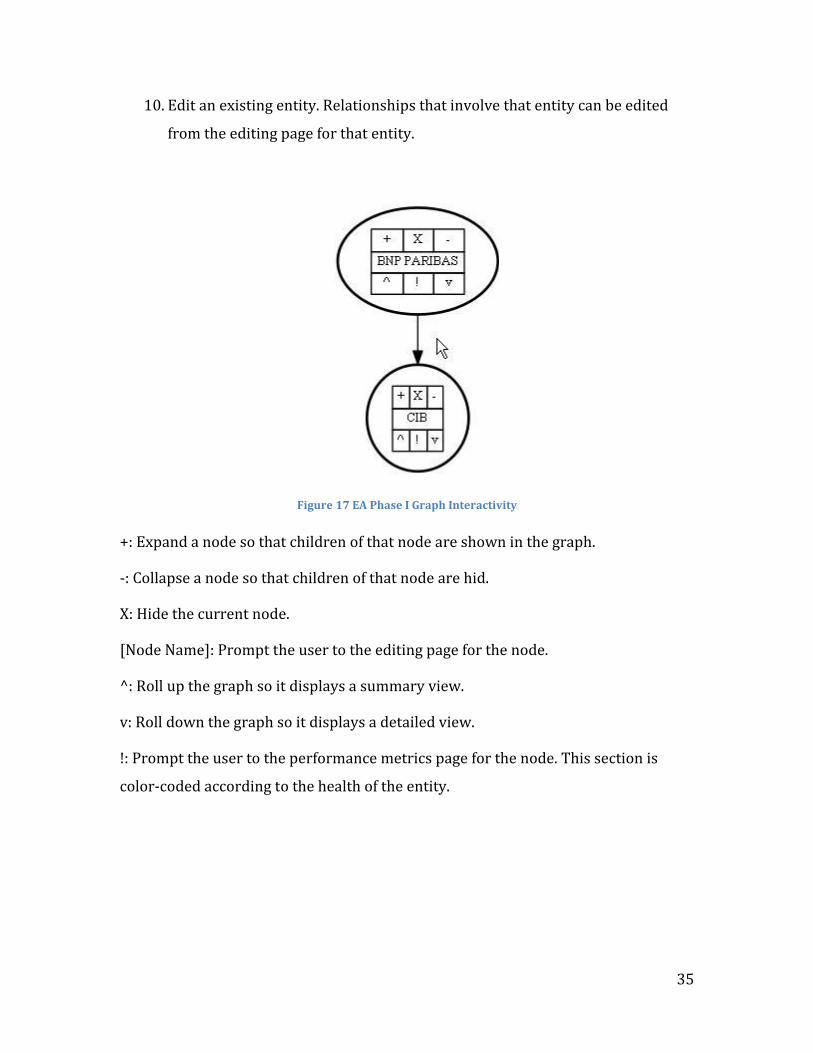
10. Edit an existing entity. Relationships that involve that entity can be edited
from the editing page for that entity.
Figure 17 EA Phase I Graph Interactivity
+: Expand a node so that children of that node are shown in the graph.
-: Collapse a node so that children of that node are hid.
X: Hide the current node.
[Node Name]: Prompt the user to the editing page for the node.
^: Roll up the graph so it displays a summary view.
v: Roll down the graph so it displays a detailed view.
!: Prompt the user to the performance metrics page for the node. This section is
color-coded according to the health of the entity.
36
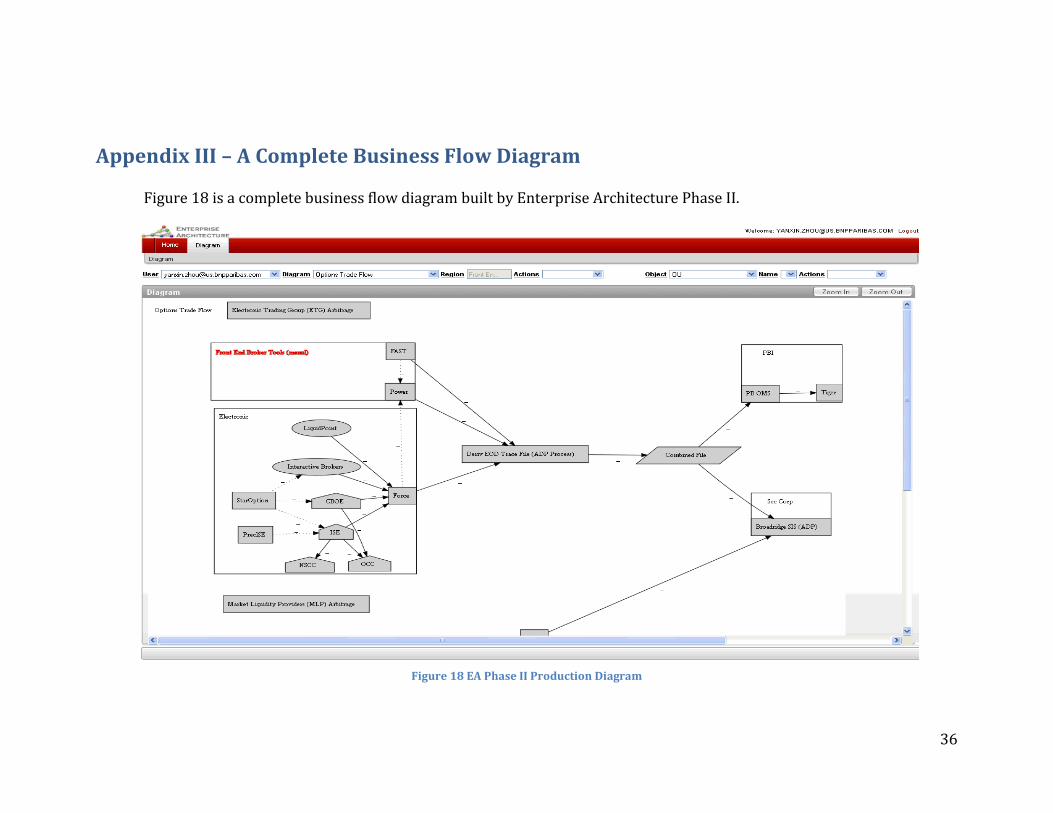
Appendix III – A Complete Business Flow Diagram
Figure 18 is a complete business flow diagram built by Enterprise Architecture Phase II.
Figure 18 EA Phase II Production Diagram
37
Appendix IV – Report of C Term 2013
Introduction
Under the pressures of globalization, competitions from non-banking financial
industries and the volatile market dynamics (Soteriou & Zenios, 1997), commercial banks
have to constantly modify operating strategies, in order to maintain their stabilities in the
financial world. The study carried out by Abul Shamsuddin and Dong Xiang has shown that
the operating efficiency of banks determines the stability of the banking system. They
observed that during the Asian financial crisis and the subprime mortgage crisis, the
Australian banks were resilient to external shocks, which suggested the fact that “an
economically efficient bank can withstand financial market turmoil better than its
inefficient counterpart and can contribute more to the efficient allocation of capital and the
stability of the financial system” (Shamsuddin & Xiang, 2012).
In order to know whether world’s top banks perform in a cost-effective manner or
not, and which of them are doing better than their competitors, we evaluated the operating
efficiency of the world’s top banks in this project. To attain this goal, we selected the
world’s top 20 banks (ranking based on the annual total revenue in 2011 - 2012) and
completed the following objectives:
Create an inventory of information of target banks;
Conduct data analysis and calculate the operating efficiency of these selected banks.
To fulfill these objectives, we collected the data from the 2007 – 2011 annual
reports of each bank. We then used the Data Envelopment Analysis (DEA) method to
analyze the efficiency of these banks. Data Envelopment Analysis is a method to assess the
efficiency and performance of each unit. The calculation requires the same input and
output factors for each unit. After determining the input factors and output factors, we used
two DEA models in the analysis, including 1) CCR Model and 2) BCC Model. In addition, we

38
used the averages and standard deviations of the results from previous analysis to
determine the average efficiency and stability of each bank.
Lastly, we identified banks that have fully consistent high operating efficiency and
banks that need improvements. We also provided recommendations to enhance our
evaluation process.
39
Background
Operating Efficiency
Operating Efficiency has been defined as:
“What occurs when the right combination of people, process, and technology come
together to enhance the productivity and value of any business operation, while driving
down the cost of routine operations to a desired level. The end result is that resources
previously needed to manage operational tasks can be redirected to new, high-value
initiatives that bring additional capabilities to the organization. (Schawk, Inc., 2008)”
In other words, operating efficiency is the indicator of an enterprise’s capability to
sell products and services for high revenues at low costs. It is usually calculated as the ratio
between the input to produce products and services and the output gained by the
enterprise.
It is important to monitor operating efficiency since it reflects the enterprise’s
stability in the financial market. It helps managers to predict potential risks the enterprise
may come into and adjust future operational strategies. It is also an indicator that
determines whether an enterprise performs in a cost-effective manner.
Operating Efficiency Model
There are two major approaches for evaluating operating efficiency, a production
approach and an intermediation approach (Soteriou & Zenios, 1997). In the production
approach, the enterprise is considered as a “factory” that it provides products and services
to its customers in the form of transactions. Operating efficiency in this approach examines
how well the enterprise uses its resources, such as personnel, computers and space, to
produce the largest possible number of transactions. While in the intermediation approach,
the enterprise’s resources are various types of costs, and those are combined to produce
the largest possible revenues.
40
Data Envelopment Analysis
The above two model approaches are both established based on the Data
Envelopment Analysis (DEA) technique. DEA is developed by Charnes, Cooper and Rhodes
(1978) to evaluate the relative efficiency of public sectors. Now it has widespread
applications in measuring the operating efficiency of banks, hospitals, schools, and so on.
DEA is commonly used to evaluate the efficiency of a number of producers using a
linear programming procedure (Trick, 1998). Each producer has a set of inputs and a set of
outputs. Through DEA, producers will be mapped on to a plane of outputs versus inputs.
Then linear programming formulations are used to define the envelopment surface
(Soteriou & Zenios, 1997). Efficient units will always be on the envelopment surface, but
we can also project inefficient units onto the efficient frontier as virtual units. This could be
done by decreasing inputs, known as the input minimization model, or by increasing
outputs, which is called the output maximization model.
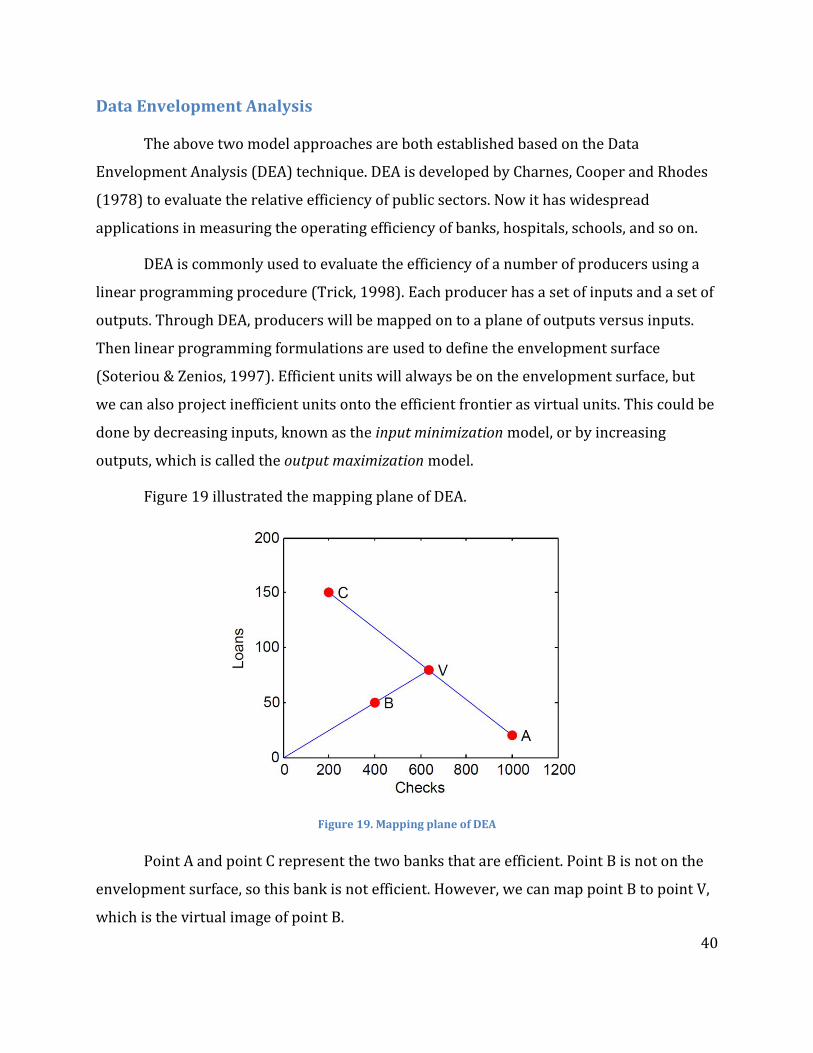
Figure 19 illustrated the mapping plane of DEA.
Figure 19. Mapping plane of DEA
Point A and point C represent the two banks that are efficient. Point B is not on the
envelopment surface, so this bank is not efficient. However, we can map point B to point V,
which is the virtual image of point B.
41
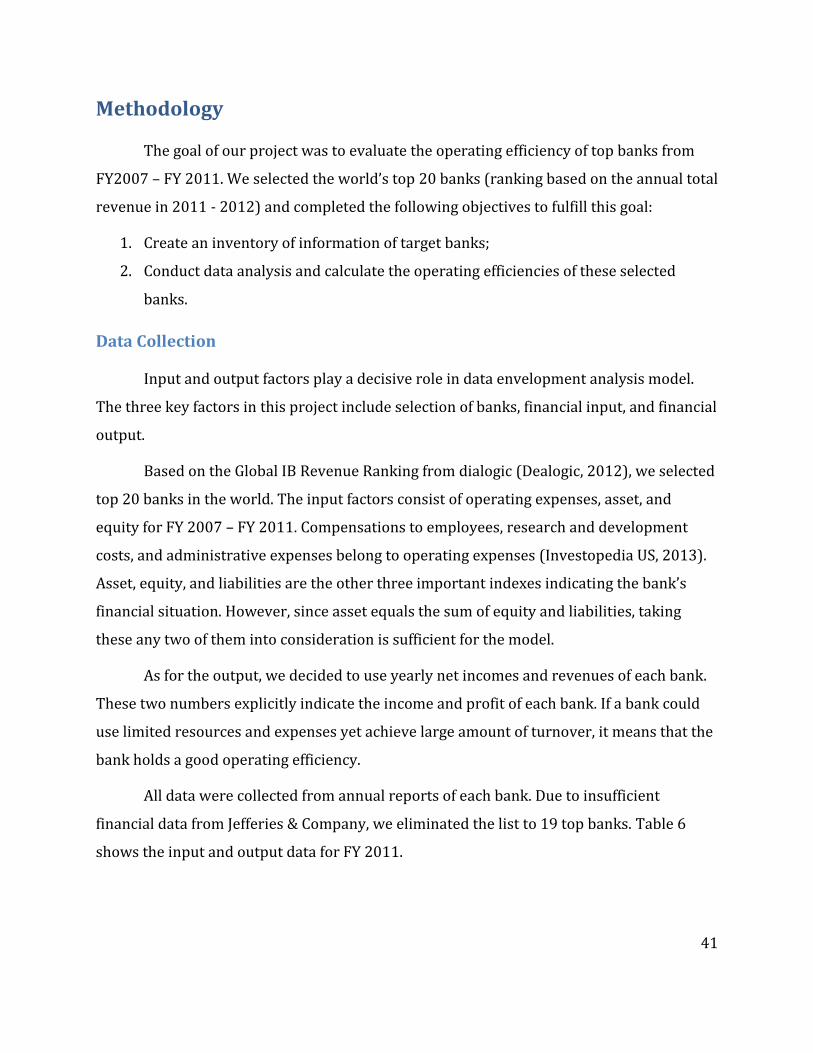
Methodology
The goal of our project was to evaluate the operating efficiency of top banks from
FY2007 – FY 2011. We selected the world’s top 20 banks (ranking based on the annual total
revenue in 2011 - 2012) and completed the following objectives to fulfill this goal:
1. Create an inventory of information of target banks;
2. Conduct data analysis and calculate the operating efficiencies of these selected
banks.
Data Collection
Input and output factors play a decisive role in data envelopment analysis model.
The three key factors in this project include selection of banks, financial input, and financial
output.
Based on the Global IB Revenue Ranking from dialogic (Dealogic, 2012), we selected
top 20 banks in the world. The input factors consist of operating expenses, asset, and
equity for FY 2007 – FY 2011. Compensations to employees, research and development
costs, and administrative expenses belong to operating expenses (Investopedia US, 2013).
Asset, equity, and liabilities are the other three important indexes indicating the bank’s
financial situation. However, since asset equals the sum of equity and liabilities, taking
these any two of them into consideration is sufficient for the model.
As for the output, we decided to use yearly net incomes and revenues of each bank.
These two numbers explicitly indicate the income and profit of each bank. If a bank could
use limited resources and expenses yet achieve large amount of turnover, it means that the
bank holds a good operating efficiency.
All data were collected from annual reports of each bank. Due to insufficient
financial data from Jefferies & Company, we eliminated the list to 19 top banks. Table 6
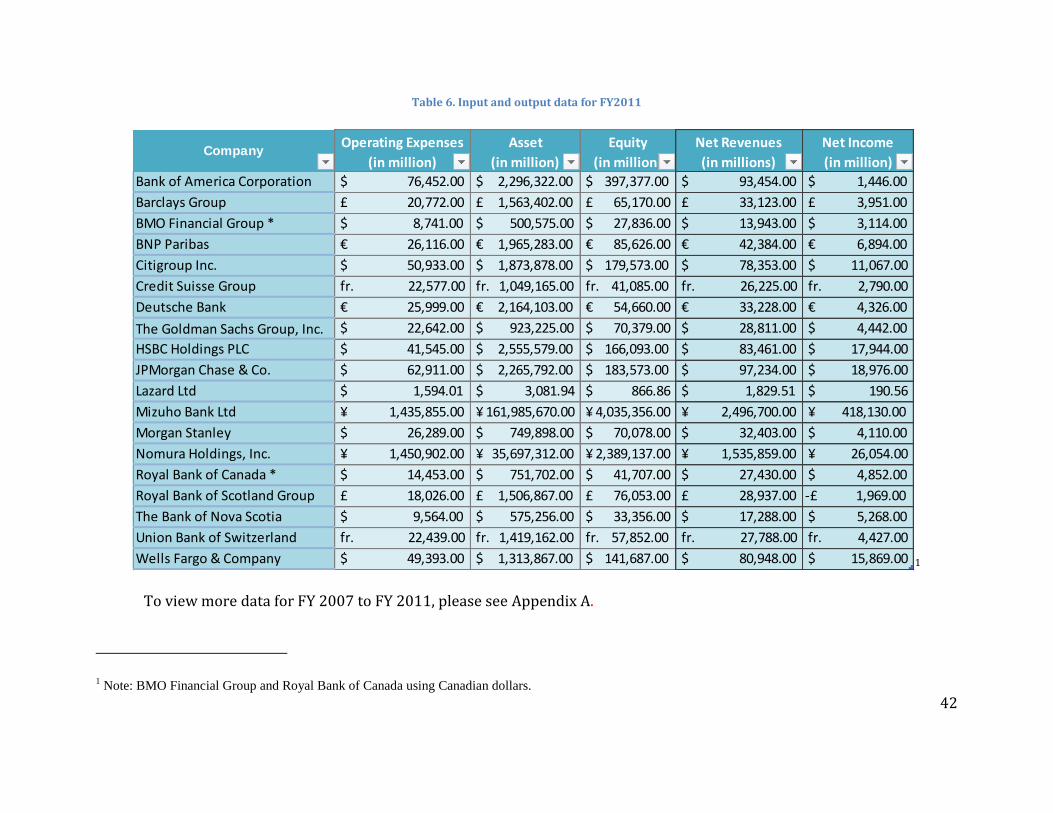
shows the input and output data for FY 2011.
42
Table 6. Input and output data for FY2011
1
To view more data for FY 2007 to FY 2011, please see Appendix A.
1 Note: BMO Financial Group and Royal Bank of Canada using Canadian dollars.
CompanyOperating Expenses
(in million)
Asset
(in million)
Equity
(in million)
Net Revenues
(in millions)
Net Income
(in million)
Bank of America Corporation $ 76,452.00 $ 2,296,322.00 $ 397,377.00 $ 93,454.00 $ 1,446.00
Barclays Group £ 20,772.00 £ 1,563,402.00 £ 65,170.00 £ 33,123.00 £ 3,951.00
BMO Financial Group * $ 8,741.00 $ 500,575.00 $ 27,836.00 $ 13,943.00 $ 3,114.00
BNP Paribas € 26,116.00 € 1,965,283.00 € 85,626.00 € 42,384.00 € 6,894.00
Citigroup Inc. $ 50,933.00 $ 1,873,878.00 $ 179,573.00 $ 78,353.00 $ 11,067.00
Credit Suisse Group fr. 22,577.00 fr. 1,049,165.00 fr. 41,085.00 fr. 26,225.00 fr. 2,790.00
Deutsche Bank € 25,999.00 € 2,164,103.00 € 54,660.00 € 33,228.00 € 4,326.00
The Goldman Sachs Group, Inc. $ 22,642.00 $ 923,225.00 $ 70,379.00 $ 28,811.00 $ 4,442.00
HSBC Holdings PLC $ 41,545.00 $ 2,555,579.00 $ 166,093.00 $ 83,461.00 $ 17,944.00
JPMorgan Chase & Co. $ 62,911.00 $ 2,265,792.00 $ 183,573.00 $ 97,234.00 $ 18,976.00
Lazard Ltd $ 1,594.01 $ 3,081.94 $ 866.86 $ 1,829.51 $ 190.56
Mizuho Bank Ltd ¥ 1,435,855.00 ¥ 161,985,670.00 ¥ 4,035,356.00 ¥ 2,496,700.00 ¥ 418,130.00
Morgan Stanley $ 26,289.00 $ 749,898.00 $ 70,078.00 $ 32,403.00 $ 4,110.00
Nomura Holdings, Inc. ¥ 1,450,902.00 ¥ 35,697,312.00 ¥ 2,389,137.00 ¥ 1,535,859.00 ¥ 26,054.00
Royal Bank of Canada * $ 14,453.00 $ 751,702.00 $ 41,707.00 $ 27,430.00 $ 4,852.00
Royal Bank of Scotland Group £ 18,026.00 £ 1,506,867.00 £ 76,053.00 £ 28,937.00 -£ 1,969.00
The Bank of Nova Scotia $ 9,564.00 $ 575,256.00 $ 33,356.00 $ 17,288.00 $ 5,268.00
Union Bank of Switzerland fr. 22,439.00 fr. 1,419,162.00 fr. 57,852.00 fr. 27,788.00 fr. 4,427.00
Wells Fargo & Company $ 49,393.00 $ 1,313,867.00 $ 141,687.00 $ 80,948.00 $ 15,869.00
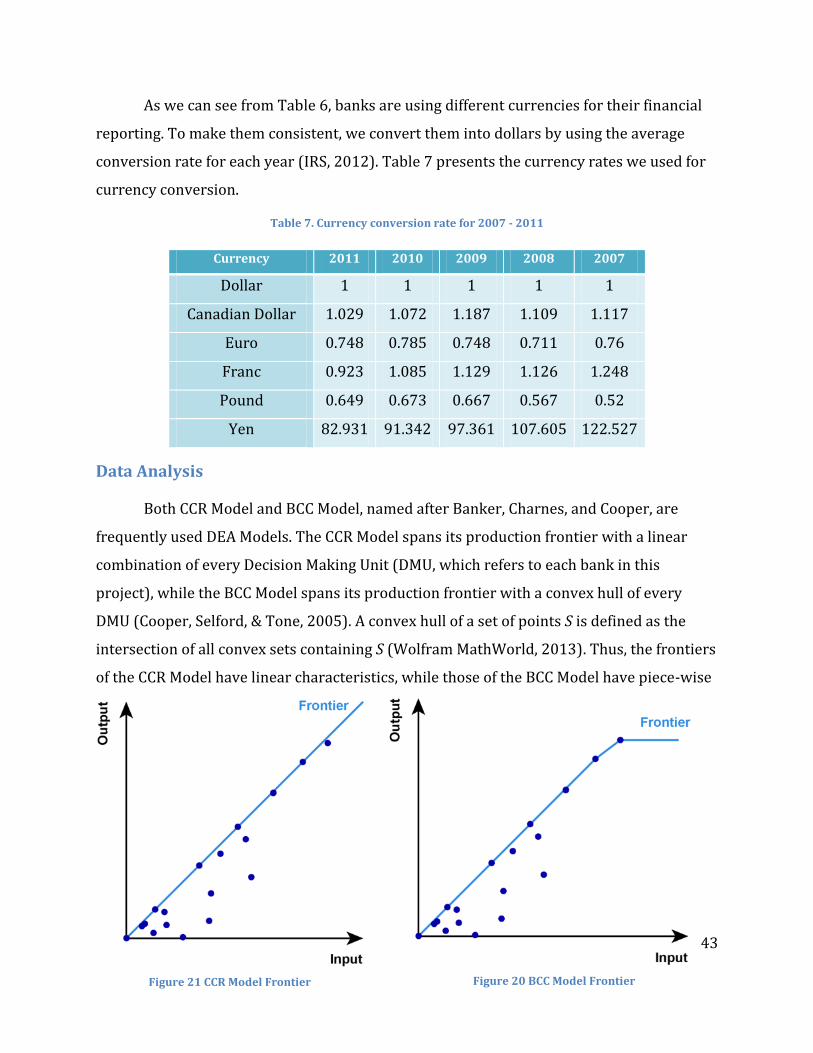
43
As we can see from Table 6, banks are using different currencies for their financial
reporting. To make them consistent, we convert them into dollars by using the average
conversion rate for each year (IRS, 2012). Table 7 presents the currency rates we used for
currency conversion.
Table 7. Currency conversion rate for 2007 - 2011
Currency 2011 2010 2009 2008 2007
Dollar 1 1 1 1 1
Canadian Dollar 1.029 1.072 1.187 1.109 1.117
Euro 0.748 0.785 0.748 0.711 0.76
Franc 0.923 1.085 1.129 1.126 1.248
Pound 0.649 0.673 0.667 0.567 0.52
Yen 82.931 91.342 97.361 107.605 122.527
Data Analysis
Both CCR Model and BCC Model, named after Banker, Charnes, and Cooper, are
frequently used DEA Models. The CCR Model spans its production frontier with a linear
combination of every Decision Making Unit (DMU, which refers to each bank in this
project), while the BCC Model spans its production frontier with a convex hull of every
DMU (Cooper, Selford, & Tone, 2005). A convex hull of a set of points S is defined as the
intersection of all convex sets containing S (Wolfram MathWorld, 2013). Thus, the frontiers
of the CCR Model have linear characteristics, while those of the BCC Model have piece-wise
Figure 20 BCC Model Frontier Figure 21 CCR Model Frontier
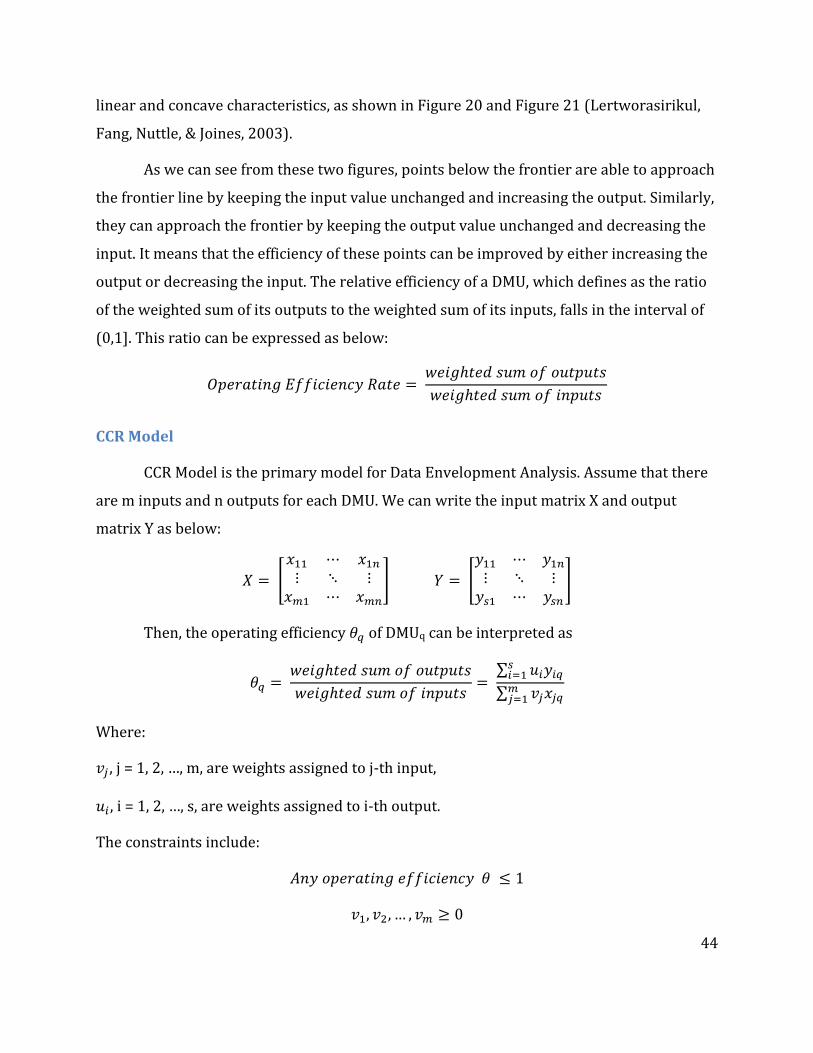
44
linear and concave characteristics, as shown in Figure 20 and Figure 21 (Lertworasirikul,
Fang, Nuttle, & Joines, 2003).
As we can see from these two figures, points below the frontier are able to approach
the frontier line by keeping the input value unchanged and increasing the output. Similarly,
they can approach the frontier by keeping the output value unchanged and decreasing the
input. It means that the efficiency of these points can be improved by either increasing the
output or decreasing the input. The relative efficiency of a DMU, which defines as the ratio
of the weighted sum of its outputs to the weighted sum of its inputs, falls in the interval of
(0,1]. This ratio can be expressed as below:
CCR Model
CCR Model is the primary model for Data Envelopment Analysis. Assume that there
are m inputs and n outputs for each DMU. We can write the input matrix X and output
matrix Y as below:
[
] [
]
Then, the operating efficiency of DMUq can be interpreted as
∑
∑
Where:
, j = 1, 2, …, m, are weights assigned to j-th input,
, i = 1, 2, …, s, are weights assigned to i-th output.
The constraints include:
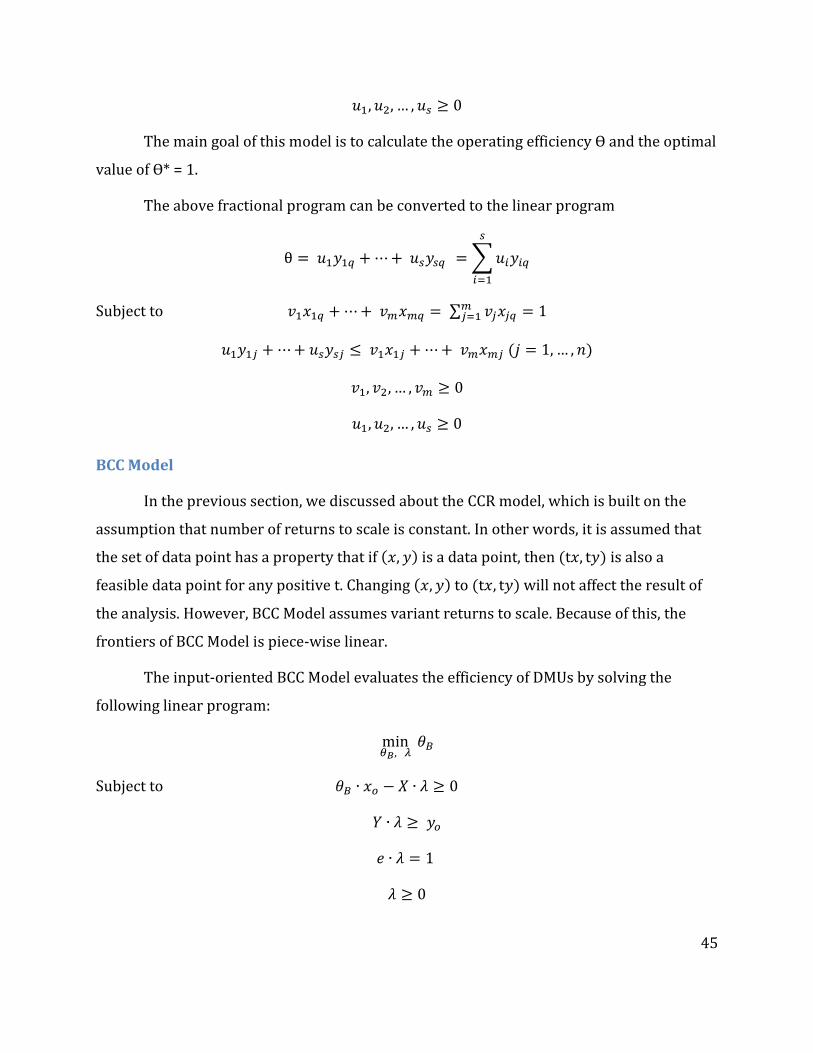
45
The main goal of this model is to calculate the operating efficiency Ɵ and the optimal
value of Ɵ* = 1.
The above fractional program can be converted to the linear program
∑
Subject to ∑
BCC Model
In the previous section, we discussed about the CCR model, which is built on the
assumption that number of returns to scale is constant. In other words, it is assumed that
the set of data point has a property that if is a data point, then is also a
feasible data point for any positive t. Changing to will not affect the result of
the analysis. However, BCC Model assumes variant returns to scale. Because of this, the
frontiers of BCC Model is piece-wise linear.
The input-oriented BCC Model evaluates the efficiency of DMUs by solving the
following linear program:
Subject to

46
where
is the efficiency we are trying to solve for.
are values of corresponding indicator of DMUo
is a column vector that defines the weight of each input.
X and Y are input and output data sets.
We applied input-oriented BCC Model to our evaluation of banks’ operating
efficiency. The inputs and outputs remained the same, where inputs comprised Asset,
Equity, and Operating Expenses, and outputs contained Net Income and Net Revenue. By
solving the above BCC Model in MATLAB, we got the annual operating efficiency of all 19
banks from FY2007 to FY2011, as displayed in Table 9.
Efficiency and Stability Analysis
In addition to calculating the operating efficiency using two models, we still
conducted analysis for the efficiency and stability. Two indicators we used are average
operating efficiency among the five years and the standard deviations. From the average
value, we can determine whether the bank has high operating efficiency or not. Meanwhile,
the standard deviation reveals the stability of the bank over the five years. Based on these
two indicators, we divided the banks into four categories
Category 1. Consistently efficient (high average and small standard deviation)
Category 2. Efficient but unsteady (high average but large standard deviation)
Category 3. Neither efficient nor steady (low average and large standard deviation)
Category 4. Consistently inefficient (low average and small standard deviation)
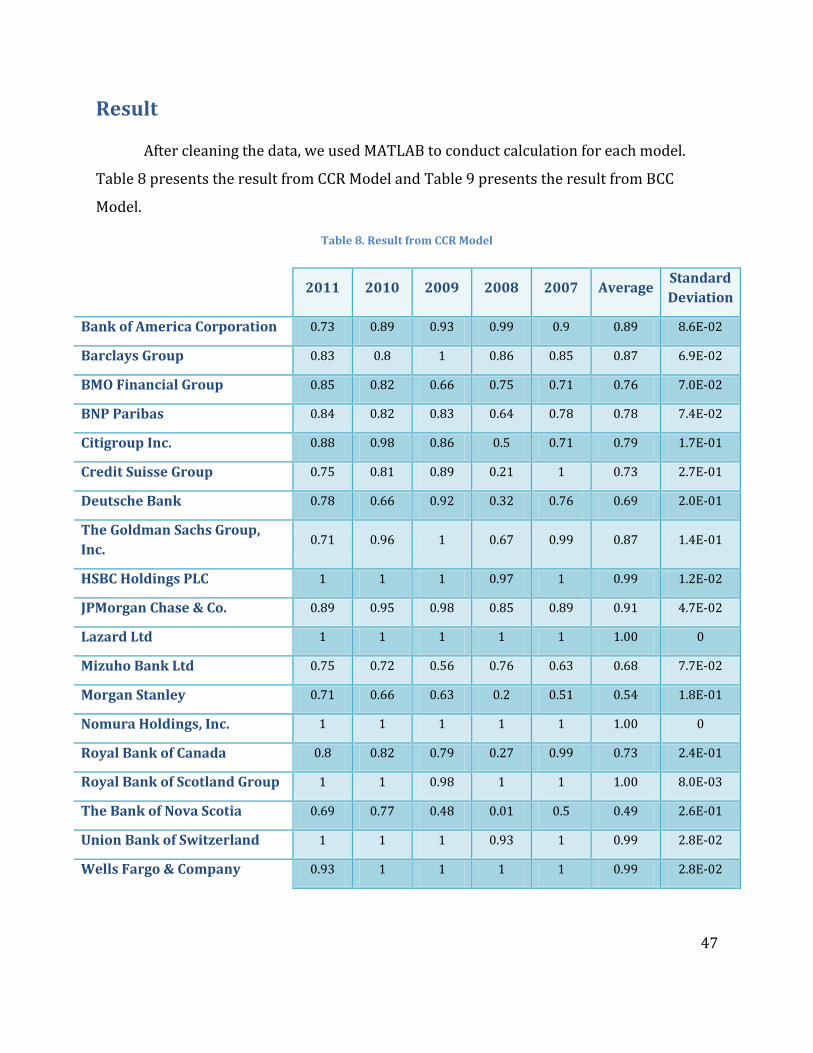
47
Result
After cleaning the data, we used MATLAB to conduct calculation for each model.
Table 8 presents the result from CCR Model and Table 9 presents the result from BCC
Model.
Table 8. Result from CCR Model
2011 2010 2009 2008 2007 Average
Standard
Deviation
Bank of America Corporation 0.73 0.89 0.93 0.99 0.9 0.89 8.6E-02
Barclays Group 0.83 0.8 1 0.86 0.85 0.87 6.9E-02
BMO Financial Group 0.85 0.82 0.66 0.75 0.71 0.76 7.0E-02
BNP Paribas 0.84 0.82 0.83 0.64 0.78 0.78 7.4E-02
Citigroup Inc. 0.88 0.98 0.86 0.5 0.71 0.79 1.7E-01
Credit Suisse Group 0.75 0.81 0.89 0.21 1 0.73 2.7E-01
Deutsche Bank 0.78 0.66 0.92 0.32 0.76 0.69 2.0E-01
The Goldman Sachs Group,
Inc. 0.71 0.96 1 0.67 0.99 0.87 1.4E-01
HSBC Holdings PLC 1 1 1 0.97 1 0.99 1.2E-02
JPMorgan Chase & Co. 0.89 0.95 0.98 0.85 0.89 0.91 4.7E-02
Lazard Ltd 1 1 1 1 1 1.00 0
Mizuho Bank Ltd 0.75 0.72 0.56 0.76 0.63 0.68 7.7E-02
Morgan Stanley 0.71 0.66 0.63 0.2 0.51 0.54 1.8E-01
Nomura Holdings, Inc. 1 1 1 1 1 1.00 0
Royal Bank of Canada 0.8 0.82 0.79 0.27 0.99 0.73 2.4E-01
Royal Bank of Scotland Group 1 1 0.98 1 1 1.00 8.0E-03
The Bank of Nova Scotia 0.69 0.77 0.48 0.01 0.5 0.49 2.6E-01
Union Bank of Switzerland 1 1 1 0.93 1 0.99 2.8E-02
Wells Fargo & Company 0.93 1 1 1 1 0.99 2.8E-02
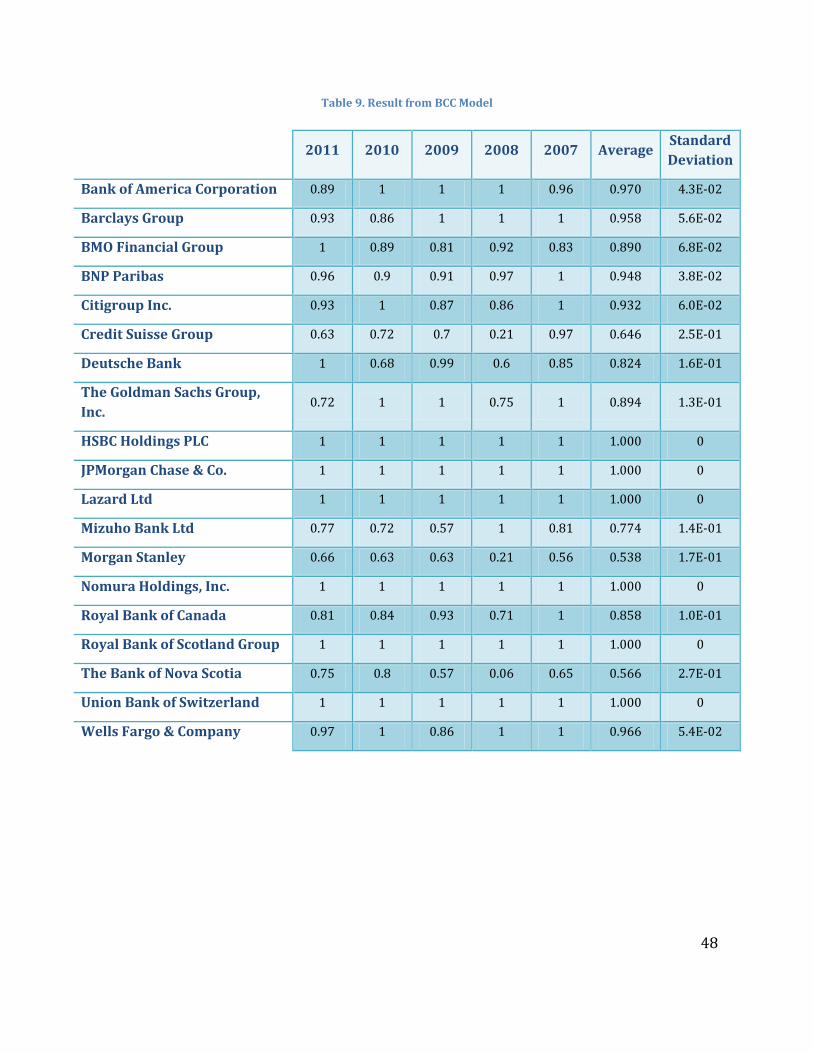
48
Table 9. Result from BCC Model
2011 2010 2009 2008 2007 Average
Standard
Deviation
Bank of America Corporation 0.89 1 1 1 0.96 0.970 4.3E-02
Barclays Group 0.93 0.86 1 1 1 0.958 5.6E-02
BMO Financial Group 1 0.89 0.81 0.92 0.83 0.890 6.8E-02
BNP Paribas 0.96 0.9 0.91 0.97 1 0.948 3.8E-02
Citigroup Inc. 0.93 1 0.87 0.86 1 0.932 6.0E-02
Credit Suisse Group 0.63 0.72 0.7 0.21 0.97 0.646 2.5E-01
Deutsche Bank 1 0.68 0.99 0.6 0.85 0.824 1.6E-01
The Goldman Sachs Group,
Inc. 0.72 1 1 0.75 1 0.894 1.3E-01
HSBC Holdings PLC 1 1 1 1 1 1.000 0
JPMorgan Chase & Co. 1 1 1 1 1 1.000 0
Lazard Ltd 1 1 1 1 1 1.000 0
Mizuho Bank Ltd 0.77 0.72 0.57 1 0.81 0.774 1.4E-01
Morgan Stanley 0.66 0.63 0.63 0.21 0.56 0.538 1.7E-01
Nomura Holdings, Inc. 1 1 1 1 1 1.000 0
Royal Bank of Canada 0.81 0.84 0.93 0.71 1 0.858 1.0E-01
Royal Bank of Scotland Group 1 1 1 1 1 1.000 0
The Bank of Nova Scotia 0.75 0.8 0.57 0.06 0.65 0.566 2.7E-01
Union Bank of Switzerland 1 1 1 1 1 1.000 0
Wells Fargo & Company 0.97 1 0.86 1 1 0.966 5.4E-02
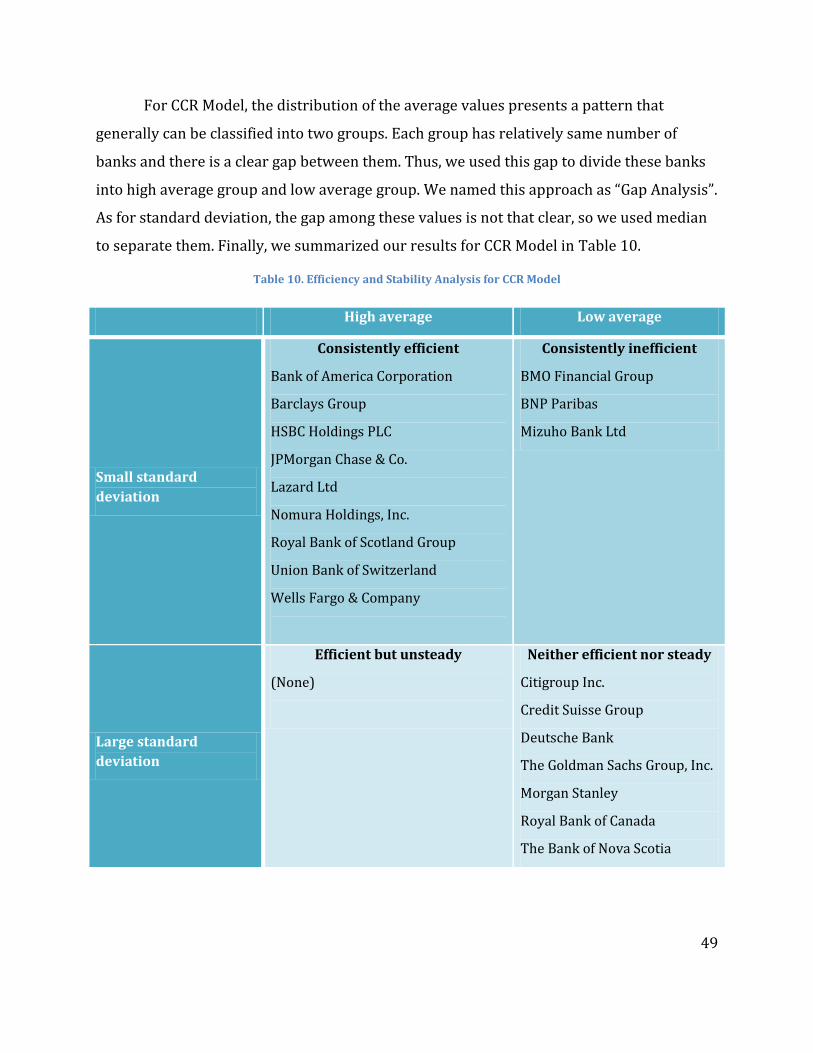
49
For CCR Model, the distribution of the average values presents a pattern that
generally can be classified into two groups. Each group has relatively same number of
banks and there is a clear gap between them. Thus, we used this gap to divide these banks
into high average group and low average group. We named this approach as “Gap Analysis”.
As for standard deviation, the gap among these values is not that clear, so we used median
to separate them. Finally, we summarized our results for CCR Model in Table 10.
Table 10. Efficiency and Stability Analysis for CCR Model
High average Low average
Small standard
deviation
Consistently efficient
Bank of America Corporation
Barclays Group
HSBC Holdings PLC
JPMorgan Chase & Co.
Lazard Ltd
Nomura Holdings, Inc.
Royal Bank of Scotland Group
Union Bank of Switzerland
Wells Fargo & Company
Consistently inefficient
BMO Financial Group
BNP Paribas
Mizuho Bank Ltd
Large standard
deviation
Efficient but unsteady
(None)
Neither efficient nor steady
Citigroup Inc.
Credit Suisse Group
Deutsche Bank
The Goldman Sachs Group, Inc.
Morgan Stanley
Royal Bank of Canada
The Bank of Nova Scotia
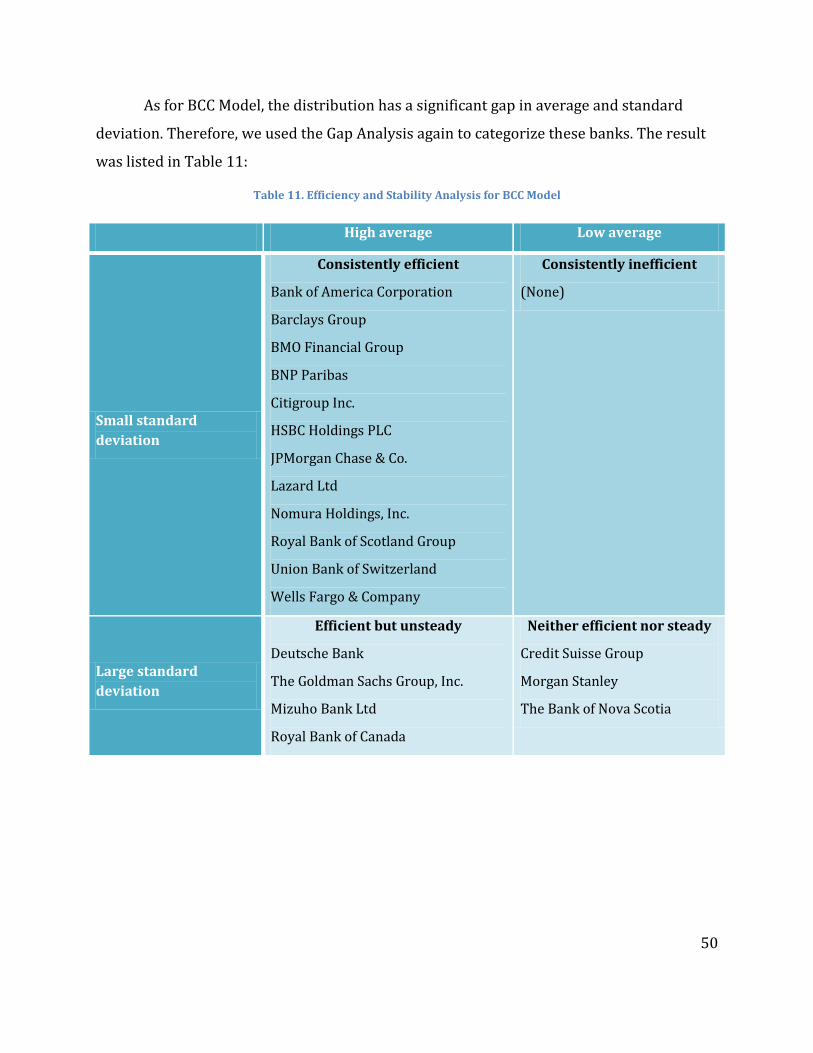
50
As for BCC Model, the distribution has a significant gap in average and standard
deviation. Therefore, we used the Gap Analysis again to categorize these banks. The result
was listed in Table 11:
Table 11. Efficiency and Stability Analysis for BCC Model
High average Low average
Small standard
deviation
Consistently efficient
Bank of America Corporation
Barclays Group
BMO Financial Group
BNP Paribas
Citigroup Inc.
HSBC Holdings PLC
JPMorgan Chase & Co.
Lazard Ltd
Nomura Holdings, Inc.
Royal Bank of Scotland Group
Union Bank of Switzerland
Wells Fargo & Company
Consistently inefficient
(None)
Large standard
deviation
Efficient but unsteady
Deutsche Bank
The Goldman Sachs Group, Inc.
Mizuho Bank Ltd
Royal Bank of Canada
Neither efficient nor steady
Credit Suisse Group
Morgan Stanley
The Bank of Nova Scotia
51
Conclusions
Based on the data analysis from two models, we concluded that Bank of America
Corporation, Barclays Group, HSBC Holdings PLC, JPMorgan Chase & Co., Lazard Ltd,
Nomura Holdings, Inc., Royal Bank of Scotland Group, Union Bank of Switzerland, Wells
Fargo & Company have fully consistent efficiency. Credit Suisse Group, Morgan Stanley and
The Bank of Nova Scotia are neither efficient nor steady.
On the other hand, the evaluation process is not very comprehensive. People can
improve it in following aspects:
Increasing the number of DMUs
The DEA model works better for large dataset. Insufficient data will lead to
inaccurate result. Currently, this project targeted on the top 20 banks worldwide.
Taking more banks or banks in different revenue levels into account can create
more comprehensive evaluation result.
Considering unrelated input/output factors
Since DEA model takes each input/output factor as an independent variable,
correlated input/output may cause uneven weight to each factor.
Considering more input/output factors
This project only used five factors. Feeding more elements into the model will make
the evaluation result more convincing and comprehensive.
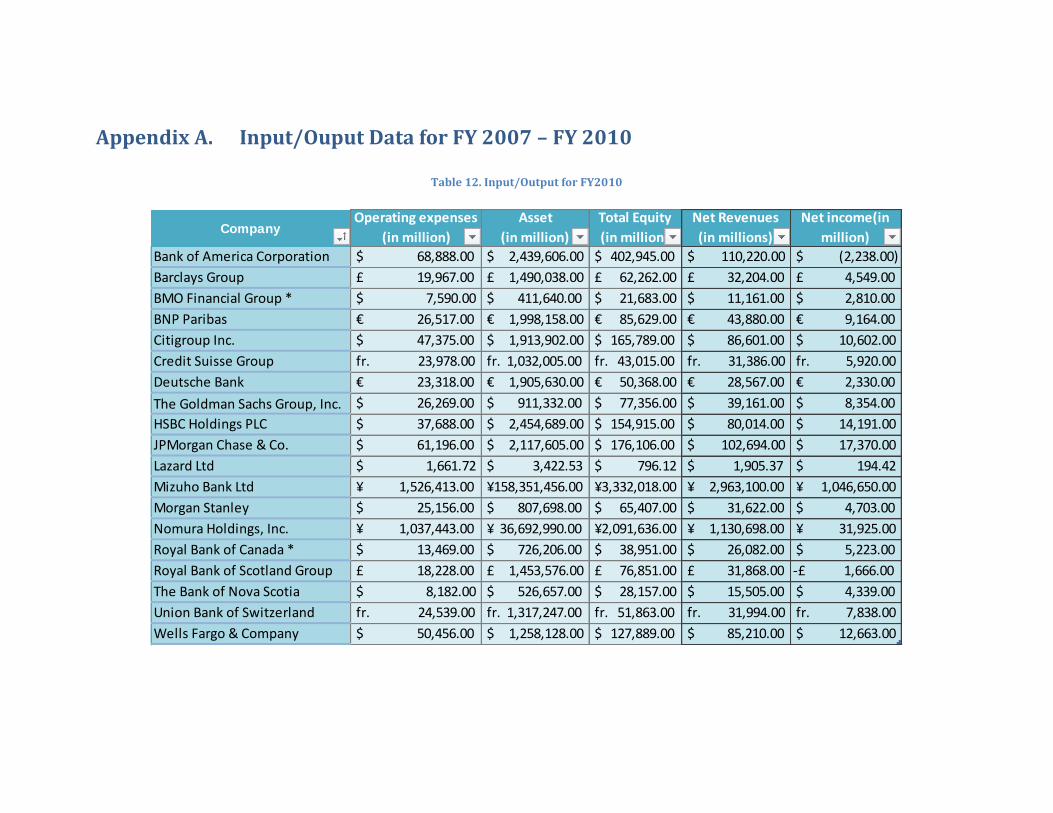
Appendix A. Input/Ouput Data for FY 2007 – FY 2010
Table 12. Input/Output for FY2010
CompanyOperating expenses
(in million)
Asset
(in million)
Total Equity
(in million)
Net Revenues
(in millions)
Net income(in
million)
Bank of America Corporation $ 68,888.00 $ 2,439,606.00 $ 402,945.00 $ 110,220.00 $ (2,238.00)
Barclays Group £ 19,967.00 £ 1,490,038.00 £ 62,262.00 £ 32,204.00 £ 4,549.00
BMO Financial Group * $ 7,590.00 $ 411,640.00 $ 21,683.00 $ 11,161.00 $ 2,810.00
BNP Paribas € 26,517.00 € 1,998,158.00 € 85,629.00 € 43,880.00 € 9,164.00
Citigroup Inc. $ 47,375.00 $ 1,913,902.00 $ 165,789.00 $ 86,601.00 $ 10,602.00
Credit Suisse Group fr. 23,978.00 fr. 1,032,005.00 fr. 43,015.00 fr. 31,386.00 fr. 5,920.00
Deutsche Bank € 23,318.00 € 1,905,630.00 € 50,368.00 € 28,567.00 € 2,330.00
The Goldman Sachs Group, Inc. $ 26,269.00 $ 911,332.00 $ 77,356.00 $ 39,161.00 $ 8,354.00
HSBC Holdings PLC $ 37,688.00 $ 2,454,689.00 $ 154,915.00 $ 80,014.00 $ 14,191.00
JPMorgan Chase & Co. $ 61,196.00 $ 2,117,605.00 $ 176,106.00 $ 102,694.00 $ 17,370.00
Lazard Ltd $ 1,661.72 $ 3,422.53 $ 796.12 $ 1,905.37 $ 194.42
Mizuho Bank Ltd ¥ 1,526,413.00 ¥158,351,456.00 ¥3,332,018.00 ¥ 2,963,100.00 ¥ 1,046,650.00
Morgan Stanley $ 25,156.00 $ 807,698.00 $ 65,407.00 $ 31,622.00 $ 4,703.00
Nomura Holdings, Inc. ¥ 1,037,443.00 ¥ 36,692,990.00 ¥2,091,636.00 ¥ 1,130,698.00 ¥ 31,925.00
Royal Bank of Canada * $ 13,469.00 $ 726,206.00 $ 38,951.00 $ 26,082.00 $ 5,223.00
Royal Bank of Scotland Group £ 18,228.00 £ 1,453,576.00 £ 76,851.00 £ 31,868.00 -£ 1,666.00
The Bank of Nova Scotia $ 8,182.00 $ 526,657.00 $ 28,157.00 $ 15,505.00 $ 4,339.00
Union Bank of Switzerland fr. 24,539.00 fr. 1,317,247.00 fr. 51,863.00 fr. 31,994.00 fr. 7,838.00
Wells Fargo & Company $ 50,456.00 $ 1,258,128.00 $ 127,889.00 $ 85,210.00 $ 12,663.00

53
Table 13. Input/Output for FY2009
CompanyOperating expenses
(in million)
Asset
(in million)
Total Equity
(in million)
Net Revenues
(in millions)
Net income(in
million)
Bank of America Corporation $ 66,713.00 $ 2,443,068.00 $ 250,196.00 $ 119,643.00 $ 6,276.00
Barclays Group £ 17,849.00 £ 1,378,929.00 £ 58,478.00 £ 29,954.00 £ 10,288.00
BMO Financial Group * $ 7,381.00 $ 388,458.00 $ 20,197.00 $ 9,461.00 $ 1,787.00
BNP Paribas € 23,340.00 € 2,057,698.00 € 80,344.00 € 40,191.00 € 6,474.00
Citigroup Inc. $ 47,822.00 $ 1,856,646.00 $ 154,973.00 $ 80,285.00 $ (1,606.00)
Credit Suisse Group fr. 24,711.00 fr. 1,031,427.00 fr. 48,328.00 fr. 33,294.00 fr. 6,411.00
Deutsche Bank € 20,120.00 € 1,500,664.00 € 37,969.00 € 27,952.00 € 4,958.00
The Goldman Sachs Group, Inc. $ 25,344.00 $ 848,942.00 $ 70,714.00 $ 45,173.00 $ 13,385.00
HSBC Holdings PLC $ 34,395.00 $ 2,364,452.00 $ 135,661.00 $ 78,631.00 $ 6,694.00
JPMorgan Chase & Co. $ 52,352.00 $ 2,031,989.00 $ 165,365.00 $ 100,434.00 $ 11,728.00
Lazard Ltd $ 1,712.75 $ 3,147.76 $ 523.10 $ 1,530.52 $ (188.25)
Mizuho Bank Ltd ¥ 1,525,101.00 ¥155,083,031.00 ¥1,037,180.00 ¥ 2,836,400.00 -¥ 1,058,447.00
Morgan Stanley $ 22,150.00 $ 771,462.00 $ 52,780.00 $ 23,434.00 $ 1,346.00
Nomura Holdings, Inc. ¥ 1,045,575.00 ¥ 32,230,428.00 ¥2,133,014.00 ¥ 1,150,822.00 ¥ 68,086.00
Royal Bank of Canada * $ 14,558.00 $ 654,989.00 $ 36,906.00 $ 29,106.00 $ 3,858.00
Royal Bank of Scotland Group £ 21,478.00 £ 1,696,486.00 £ 94,631.00 £ 38,690.00 -£ 2,323.00
The Bank of Nova Scotia $ 7,919.00 $ 496,516.00 $ 25,316.00 $ 14,457.00 $ 3,661.00
Union Bank of Switzerland fr. 25,162.00 fr. 1,340,538.00 fr. 48,633.00 fr. 22,601.00 fr. -2,125.00
Wells Fargo & Company $ 49,020.00 $ 1,243,646.00 $ 114,359.00 $ 88,686.00 $ 12,667.00

54
Table 14. Input/Output for FY2008
CompanyOperating expenses
(in million)
Asset
(in million)
Total Equity
(in million)
Net Revenues
(in millions)
Net income(in
million)
Bank of America Corporation $ 41,529.00 $ 1,843,985.00 $ 164,837.00 $ 72,782.00 $ 4,008.00
Barclays Group £ 14,394.00 £ 2,053,029.00 £ 43,574.00 £ 21,436.00 £ 5,287.00
BMO Financial Group * $ 6,894.00 $ 416,050.00 $ 17,904.00 $ 8,875.00 $ 1,978.00
BNP Paribas € 18,400.00 € 2,075,551.00 € 58,968.00 € 27,376.00 € 3,452.00
Citigroup Inc. $ 69,240.00 $ 1,938,470.00 $ 141,630.00 $ 51,599.00 $ (27,684.00)
Credit Suisse Group fr. 23,357.00 fr. 1,170,350.00 fr. 32,302.00 fr. 9,268.00 fr. -10,837.00
Deutsche Bank € 18,278.00 € 2,202,423.00 € 31,914.00 € 13,490.00 € (3,896.00)
The Goldman Sachs Group, Inc. $ 19,886.00 $ 884,547.00 $ 64,369.00 $ 22,222.00 $ 2,322.00
HSBC Holdings PLC $ 49,099.00 $ 2,527,465.00 $ 100,229.00 $ 88,571.00 $ 6,498.00
JPMorgan Chase & Co. $ 43,500.00 $ 2,175,052.00 $ 166,884.00 $ 67,252.00 $ 5,605.00
Lazard Ltd $ 1,532.07 $ 2,862.93 $ 311.75 $ 1,557.21 $ (0.24)
Mizuho Bank Ltd ¥ 1,450,653.00 ¥151,317,756.00 ¥3,568,157.00 ¥ 4,205,200.00 ¥ 228,618.00
Morgan Stanley $ 22,452.00 $ 658,812.00 $ 50,831.00 $ 24,739.00 $ 1,707.00
Nomura Holdings, Inc. ¥ 1,092,892.00 ¥ 24,837,848.00 ¥1,551,546.00 ¥ 312,627.00 -¥ 709,441.00
Royal Bank of Canada * $ 12,351.00 $ 723,859.00 $ 30,638.00 $ 21,582.00 $ 4,555.00
Royal Bank of Scotland Group £ 54,033.00 £ 2,401,652.00 £ 80,498.00 £ 25,868.00 -£ 34,542.00
The Bank of Nova Scotia $ 7,296.00 $ 507,625.00 $ 22,125.00 $ 11,876.00 $ 3,259.00
Union Bank of Switzerland fr. 28,555.00 fr. 2,014,815.00 fr. 40,533.00 fr. 796.00 fr. -20,724.00
Wells Fargo & Company $ 22,598.00 $ 1,309,639.00 $ 102,316.00 $ 41,877.00 $ 2,698.00
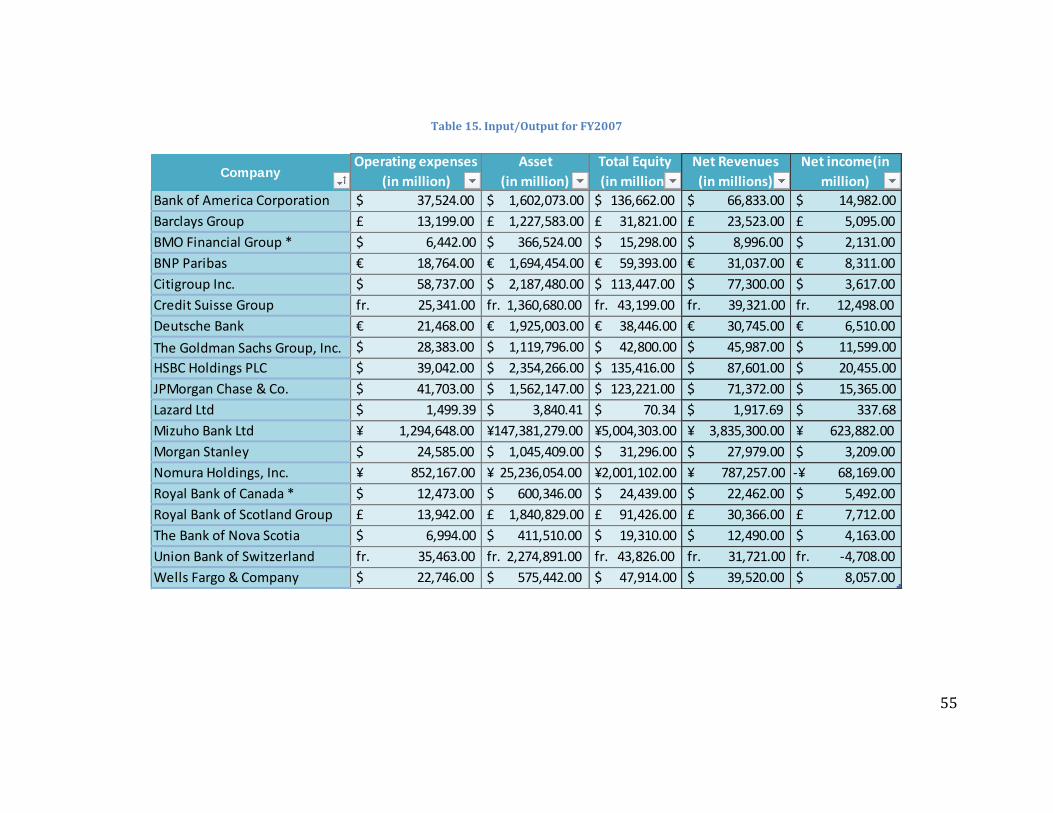
55
Table 15. Input/Output for FY2007
CompanyOperating expenses
(in million)
Asset
(in million)
Total Equity
(in million)
Net Revenues
(in millions)
Net income(in
million)
Bank of America Corporation $ 37,524.00 $ 1,602,073.00 $ 136,662.00 $ 66,833.00 $ 14,982.00
Barclays Group £ 13,199.00 £ 1,227,583.00 £ 31,821.00 £ 23,523.00 £ 5,095.00
BMO Financial Group * $ 6,442.00 $ 366,524.00 $ 15,298.00 $ 8,996.00 $ 2,131.00
BNP Paribas € 18,764.00 € 1,694,454.00 € 59,393.00 € 31,037.00 € 8,311.00
Citigroup Inc. $ 58,737.00 $ 2,187,480.00 $ 113,447.00 $ 77,300.00 $ 3,617.00
Credit Suisse Group fr. 25,341.00 fr. 1,360,680.00 fr. 43,199.00 fr. 39,321.00 fr. 12,498.00
Deutsche Bank € 21,468.00 € 1,925,003.00 € 38,446.00 € 30,745.00 € 6,510.00
The Goldman Sachs Group, Inc. $ 28,383.00 $ 1,119,796.00 $ 42,800.00 $ 45,987.00 $ 11,599.00
HSBC Holdings PLC $ 39,042.00 $ 2,354,266.00 $ 135,416.00 $ 87,601.00 $ 20,455.00
JPMorgan Chase & Co. $ 41,703.00 $ 1,562,147.00 $ 123,221.00 $ 71,372.00 $ 15,365.00
Lazard Ltd $ 1,499.39 $ 3,840.41 $ 70.34 $ 1,917.69 $ 337.68
Mizuho Bank Ltd ¥ 1,294,648.00 ¥147,381,279.00 ¥5,004,303.00 ¥ 3,835,300.00 ¥ 623,882.00
Morgan Stanley $ 24,585.00 $ 1,045,409.00 $ 31,296.00 $ 27,979.00 $ 3,209.00
Nomura Holdings, Inc. ¥ 852,167.00 ¥ 25,236,054.00 ¥2,001,102.00 ¥ 787,257.00 -¥ 68,169.00
Royal Bank of Canada * $ 12,473.00 $ 600,346.00 $ 24,439.00 $ 22,462.00 $ 5,492.00
Royal Bank of Scotland Group £ 13,942.00 £ 1,840,829.00 £ 91,426.00 £ 30,366.00 £ 7,712.00
The Bank of Nova Scotia $ 6,994.00 $ 411,510.00 $ 19,310.00 $ 12,490.00 $ 4,163.00
Union Bank of Switzerland fr. 35,463.00 fr. 2,274,891.00 fr. 43,826.00 fr. 31,721.00 fr. -4,708.00
Wells Fargo & Company $ 22,746.00 $ 575,442.00 $ 47,914.00 $ 39,520.00 $ 8,057.00
Reference
Cooper, W., Selford, L., & Tone, K. (2005). Introduction to Data Envelopment Analysis and Its
Uses.
Dealogic. (2012). Global IB Revenue Ranking - 26 Feb 2012 - 25 Feb 2013. Retrieved Feburary
5, 2013, from Financial News: http://fn.dealogic.com/fn/IBRank.htm
Gansner, E. R., Koutsofios, E., & North, S. (2010, November 2). Drawing graphs with dot.
Geller, A., & Lyon, M. (2010, May). AJAX Implementation in APEX. Retrieved November 2012,
from PACKT: http://www.packtpub.com/article/ajax-implementation-apex
Graphviz. (n.d.). attrs. Retrieved October 2012, from Graphviz - Graph Visualization
Software: http://www.graphviz.org/content/attrs
He, Z., Servi, J., Chen, Q., & Wang, S. (2012). BNP Paribas: Enterprise Architecture.
Investopedia US. (2013). Operating Expense. Retrieved Feburary 10, 2013, from
http://www.investopedia.com/terms/o/operating_expense.asp#axzz2M2KafQlv
IRS. (2012, August 21). Yearly Average Currency Exchange Rates Translating foreign
currency into U.S. dollars. Retrieved Feburary 22, 2013, from IRS:
http://www.irs.gov/Individuals/International-Taxpayers/Yearly-Average-
Currency-Exchange-Rates
Karam, S. (n.d.). Using ApEx (HTML-DB) with AJAX. Retrieved November 2012, from
Burleson Consulting: http://www.dba-
oracle.com/t_html_db_apex_ajax_application_express.htm
Kohli, A., Oza, D., & Keyes, T. (2012). Enterprise Architecture - Phase II.
Kohli, A., Oza, D., & Keyes, T. (2012). Enterprise Architecture - Phase III.
Lertworasirikul, S., Fang, S.-C., Nuttle, H., & Joines, J. (2003). Fuzzy BCC Model for Data
Envelopment Analysis.
North, S. C. (2004, April 26). Drawing graphs with NEATO.
57
Oracle. (2002). PL/SQL User's Guide and Reference. Retrieved October 2012, from Oracle
PL/SQL: http://docs.oracle.com/cd/B10501_01/appdev.920/a96624/toc.htm
Oracle. (2013). Oracle® Database 2 Day + Application Express Developer's Guide Release 4.2.
Retrieved October 2012, from Oracle Application Express:
http://docs.oracle.com/cd/E37097_01/doc/doc.42/e35122/toc.htm
Schawk, Inc. (2008). Operational Efficiency. Retrieved Feburary 26, 2013, from
http://www.schawk.com/sites/default/files/documents/Schawk-
Operational_Efficiency.pdf
Shamsuddin, A., & Xiang, D. (2012). Does bank efficiency matter? Market value relevance of
bank efficiency in Australia. Applied Economics, 3563-3571.
Soteriou, A., & Zenios, S. (1997). Efficiency, Profitability and Quality of Banking Services.
Pennsylvania: The Wharton School.
Trick, M. (1998). Chapter 12. Data Envelopment Analysis. Retrieved Feburary 20, 2013, from
Michael Trick's Operations Research Page:
http://mat.gsia.cmu.edu/classes/QUANT/NOTES/chap12.pdf
Wolfram MathWorld. (2013). Convex Hull. Retrieved Feburary 22, 2013, from Wolfram
MathWorld: http://mathworld.wolfram.com/ConvexHull.html