Embed Size (px)
Citation preview
BNL-68430Informal Report
ANALYSIS OF MEASUREMENT UNCERTAINTIES IN THE NULLING TESTFOR AIR LEAKAGE FROM RESIDENTIAL DUCTS
JOHN W. ANDREWS
APRIL 2001
Prepared for:OffIce of Building TechnologiesState and Community ProgramsU.S. Department of EnergyWashington, DC 20585
Under Contract No. DE-ACO2-98CH1O886
DISCLAIMER
. This report was prepared as an account of work sponsored by an agency of the UnitedS&es Government. Neither the United States Government nor any agency thereof, nor any oftheir employees, nor any of their contractors, subcontractors, or their employees makes anywarranty, express or implied, or assumes any legal liability or responsibility for the accuracy,completeness, or usefulness of any information, apparatus, product or process disclosed, orrepresents that its use would not infringe privately owned rights. Reference herein to My specificcommercial product, process, or service by trade name, trademark manufacturer, or otherwise,does not necessarily constitute or imply its endorsement, recommendation, or favoring by theUnited States Government or any agency thereof. The views and opinions of authors expressedherein do not necessarily state or reflect those of the United States Government or any agency,contractor, or subcontractor thereof.
TABLE OF CONTENTS
Page
EXECUTIVE S~Y ... . . . . . . . . . . . . . . . .. . . . . . . . . . . . . . . . . . . . . . . .. . . . . . . . . . . . . . . . . . . . . . . . 1
~TRODUCTION ... . . . . . . . . . . . . . . . . . . .. . . .. . . . . . . . . . . . . . . . . . . . . . . . . . . . . . . . . . . . . . . . . . . . . . . . . . . . 3
NO~NCLATW ... . . . . . . . . . . . . . . . . . . . . . . . . . . . . . . . . . . . . . . . . . . . . . . . . . . . . . . . . . . . . . . . . . . . . . . . . . 4
DESC~TION OF T=~L~G~ST ... . . . . . . . . . . . . . . . . . . . . . . . . . . . . . . . . . . . . . . . . . . . . . 4
Inside.kr Method . . . . . . . . . . . . . . . . . . . . . . . . . . . . . . . . . . . . . . . . . . . . . . . . . . . . . . . . . . . . . . . . . . . . . . . . . . . . . . 5
Outside.Air Method . . . . . . . . . . . . . . . . . . . . . . . . . . . . . . . . . . . . . . . . . . . . . . . . . . . . . . . . . . . . . . . . . . . . . . . . . . . . 5
ACC~ACY DEPE~SON E~LOPETIGHNSS . . . . . . . . . . . . . . . . . . . . . . . . . . . . . . . 6
FIRST PART OF NULLING TEST: MEASUREMENT OF UNBALANCEDLEXAGE . . . . . . . . . . . . . . . . . . . . . . . . . . . . . . . . . . . . . . . . . . . . . . . . . . . . . . . . . . . . . . . . . . . . . . . . . . . . . . .. 6
SECOND PART OF THE NULLING TEST: MEASURING THE SUPPLYLEXAGE . . . . . . . . . . . . . . . . . . . . . . . . . . . . . . . . . . . . . . . . . . . . . . . . . . . . . . . . . . . . . . . . . . . . . . . . . . . . . . . 12
Inside.Mr Method . . . . . . . . . . . . . . . . . . . . . . . . . . . . . . . . . . . . . . . . . . . . . . . . . . . . . . . . . . . . . . . . . . . . . . . . . . . .. 12
Outside.Alr Method . . . . . . . . . . . . . . . . . . . . . . . . . . . . . . . . . . . . . . . . . . . . . . . . . . . . . . . . . . . . . . . . . . . . . . . . ... 13
BENC~~G T~~CERT~TIES . . . . . . . . . . . . . . . . . . . . . . . . . . . . . . . . . . . . . . . . . . . 14
Inside.Air Method . . . . . . . . . . . . . . . . . . . . . . . . . . . . . . . . . . . . . . . . . . . . . . . . . . . . . . . . . . . . . . . . . . . . . . . . . . . . 17
Outside.Air Method . . . . . . . . . . . . . . . . . . . . . . . . . . . . . . . . . . . . . . . . . . . . . . . . . . . . . . . . . . . . . . . . . . . . . . . . .. 17
cO~~SON WITH E~EMNTfi DATA . . . . . . . . . . . . . . . . . . . . . . . . . . . . . . . . . . . . . 18
CONCLUSIONS . . . . . . . . . . . . . . . . . . . . . . . . . . . . . . . . . . . . . . . . . . . . . . . . . . . . . . . . . . . . . . . . . . . . . . . . . . . .. 22
POSSIBLE FURTHER DEVELOPMENT OF THE NULLING TEST. . . . . . . . . . . . . 22
ACKNOWEDG~NTS . . . . . . . . . . . . . . . . . . . . . . . . . . . . . . . . . . . . . . . . . . . . . . . . . . . . . . . . . . . . . . . . . . 24
=FEWNCES . . . . . . . . . . . . . . . . . . . . . . . . . . . . . . . . . . . . . . . . . . . . . . . . . . . . . . . . . . . . . . . . . . . . . . . . . . . . . . . 24
Table 1.
Table 2.
Table 3.
Table 4.
Table 5.
Table 6.
Table 7.
Table 8.
Figure 1.
LIST OF TABLES
Page
Values of the coefficient in Equation 11 for n~,,”= 0.65 . . . . . . . . . . . . . . . . . . . . . 10
Values of 1.5 (Ce.v)2(errP)2”envfor benchmark values of envelope . . . . . . . . . 16
Uncertainties in supply leakage (errQ,l’W) for the inside-air method,using Equation 17 for selected values of envelope and measurementuncertainty of pressures and air-flows . . . . . . . . . . . . .. . . . . . . . . . . . . . . . . . . . . . . . . . . . . 19
Uncertainties in return leakage (errQ,l~~) for the inside-air method,Using Equation 19 for selected values of envelope leakage andMeasurement uncertainty of pressures and air-flows . . . . . . . . . . . . . . . . . . . . . . . . 19
Uncertainties in supply leakage (errQ,l,A) for the outside-air method,using Equation 17 for selected values of envelope and measurementuncertainty of pressures and air-flows . . . . . . . . . . . . . . . . . . . . . . . . . . . . . . . . . . . . . . . . . . 20
Uncertainties in return leakage (errQ,l,J for the outside-air method,Using Equation 19 for selected ”values of envelope leakage andMeasurement uncertainty of pressures and air-flows . . . . . . . . . . . . . . . . . . . . . . . . 20
Deviations of Nulling Test from “Best Estimate” from FranciscoAnd Pahniter 1999 . . . . . . . . . . . . . . . . . . . . . . . . . . . . . . . . . . . . . . . . . . . . . . . . . . . . . . . . . . . .
Deviations of Nulling Test from “Best Estimate” from CummingsAnd Withers 1999 . . . . . . . . . . . . . . . . . . . . . . . . . . . . . . . . . . . . . . . . . . . . . . . . . . . . . . . . . . . .
LIST OF FIGURES
Schematic of Nulling Test Setup . . . . . . . . . . . . . . . . . . . . . . . . . . . . . . . . . . . . . . . . . .
21
21
I%Jgg
25
ANALYSIS OF MEASUREMENT UNCERTAINTIES IN THENULLING TEST FOR AIR LEAKAGE FROM RESIDENTIAL DUCTS
John W. AndrewsBrookhaven National Laboratory
Upton, NY 11973
jwmdrews~.bnl. %OV
April, 2000
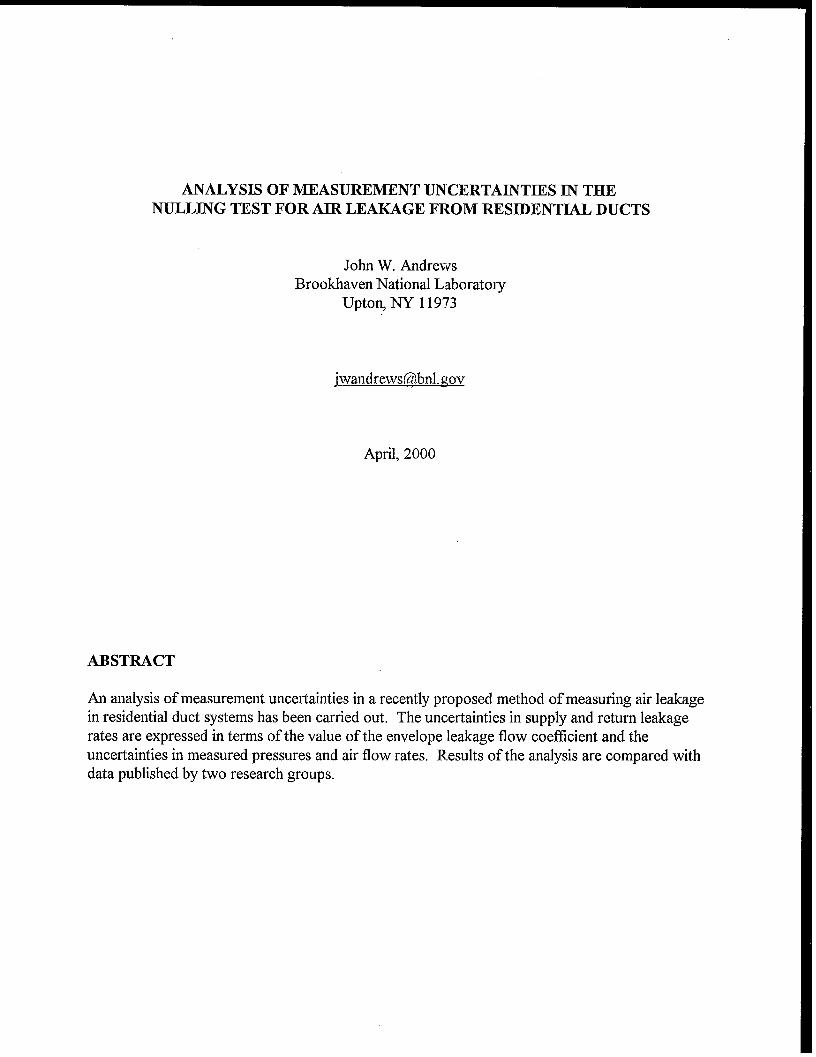
ABSTRACT
An analysis of measurement uncertainties in a recently proposed method of measuring air leakagein residential duct systems has been carried out. The uncertainties in supply and return leakagerates are expressed in terms of the value of the envelope leakage flow coefficient and theuncertainties in measured pressures and air flow rates. Results of the analysis are compared withdata published by two research groups.
EXECUTIVE SUMMARY
This report discusses an analysis of experimental uncertainties in a new test for air leakage fromresidential duct systems. The test, called the nulling test because it uses an adjustable-speed fanto zero out or “null” the difference between two measured pressures, was proposed in 1999 byresearchers at Ecotope, Inc., in Seattle.
The test uses a calibrated fanhlowmeter (blower door or duct blower) to match the pressure in thehouse with the system fan onto a target value measured with the system fan off. With the ductsystem in its as-found condition, the flow rate through the fan/ flowmeter is then equal to theunbalanced duct leakage (supply leakage to outside minus return leakage from outside). Byblocking off the return portion of the system and using a second fan/flowmeter to feed the supplyside of the duct system, the same technique can be used to measure the supply leakage separately.The return leakage is then calculated as the difference between the supply leakage (a positivenumber) and the unbalanced leakage (which can be positive, negative, or zero).
The measurement of supply leakage can be carried out in two different ways. In one of these (the“inside-air method”) the air supplied to the second fatiflowmeter is taken from the conditionedspace via a tempora~ duct. In the alternative procedure (the “outside-air method”) the secondfanhlowmeter takes its air fi-om its immediate surroundings, which in a well-vented buffer spacemeans it comes from the outside. The outside-air method is easier to do, but it is expected to beless accurate because it obtains the supply leakage as a difference between two larger air flowsthat are not greatly different in percentage terms. Small fractional uncertainties in each of twonearly-equal quantities can lead to a large fractional uncertainty in their difference.
One advantage of the nulling technique is that the value of the envelope leakage flow coefficientdoes not enter into the calculation, as it does for a conceptually similar test called the housepressure test that is currently in ASHRAE Standard 152P. Another advantage is that the neutral-pressure level is kept the same throughout the test. As a consequence, the nulling test does not adepend on some mathematical assumptions that have been questioned in the house pressure test.The Ecotope group also found, in some field trials, that the nulling test fared better than otherduct leakage tests in a comparison of measured values with “best estimate” values that they hadreason to believe were quite close to the actual duct leakage rates.
However, despite the fact that the duct leakaqe rates calculated from the nullin~ test do notdepend on the value of the envelope leakage flow coeticient, the accwacv of the nulling test doesdepend on this coefficient. The nulling test will be less accurate in a leaky house than in a tightone, for the reason that, given any specific tolerance for how closely the fan-on and fan-offpressures in the house are matched, the range of air flow rates that meet this tolerance will bewider if the envelope is leaky than if it is tight. In the limit of a very leaky envelope (openwindows and doors), the pressures will match regardless of what is done with the fan/flowmeterand we will have’ no information at all about duct leakage. rates.
1
This report derives equations for the experimental uncertainties in the supply and return leakagerates in terms of the value of the envelope leakage flow coefficient, the uncertainties in themeasured flow rates, and another uncertainty reflecting how closely the house pressure with thesystem fan on can be matched to the value with the system fan off.
The major conclusion is that, except for very tight envelopes, experimental uncertainties in thenulling test will be controlled by how leaky the house envelope is and by how precisely the housepressures can be matched, and not by the accuracy of the air-flow measurements.
The above statement applies to the inside-air method. The outside-air method adds twosignificant additional sources of error: the uncertainty in the system fan flow rate and a greatlyincreased uncertainty in the air flow rate across the envelope during the second part of the testthat measures supply leakage.
The expected uncertainties in the supply and return leakage rates were benchmarked in terms ofuncertainties in the directly-measured quantities (e.g., pressures, flow rates) derived from fieldexperience and manufacturer’s specifications. For example, a house with an envelope CFM50 of-2500 and assuming a 0.2 Pa uncertainty in pressure measurements, a one-standard-deviationuncertainty using the inside-air method is on the supply side and +126 cfm on the return side.Tightening the envelope to -1250 CFM50 and the pressure-measurement uncertainty to 0.1 Pareduces these leakage uncertainties to +29 cfm and +40 cfm, respectively.
The calculated uncertainties are broadly consistent with those extracted from the limited field datacurrently available. However, the expected greater uncertainty in the return leakage (as comparedwith the uncertainty in the supply leakage) was not seen in the comparison of the referenced datawith the researchers’ “best estimate” duct leakage values. It is not known to what extent this isdue to: a) statistical fluctuation; b) an artifact of the procedures used by the referencedexperimenters in choosing their “best estimate” duct leakage rates for comparison; or c) somesignificant factor that was not captured in this analysis.
Except for the case of well-controlled pressure matching in very tight envelopes, the calculateduncertainties (even in the inside-air method) are sufficiently large to warrant a search for ways toreduce them. There is a need for fbrther field work on the test, to assess the magnitude of theuncertainties, to compare these with theoretical analyses such as this one, and to determinewhether the uncertainties in the nulling test can be reduced in any practical way.
Some suggestions have been provided for firther work on enhancing the accuracy of the nullingtest. These involve various plans for adding an additional piece of data to serve as a “cross-check” on the nulling-test results, and a possible procedure for tightening the tolerance limit onthe pressure matching that is at the heart of the test.
2
INTRODUCTION
Recently, a group of researchers based in Seattle proposed a new test to measure air leakage ratesin residential duct systems (Francisco and Pahniter 1999). The test, which they have called the“nulling test,” is based on matching the pressure in the house with the system fan onto a target
value measured with the system fan off. The matching is achieved by using a calibratedfan/flowmeter (either a blower door or a duct blower) to blow air into or out of the house at arate sufficient to adjust the pressure within the house back to what it was when the system fanwas off. With the duct system in its as-found condition, the flow rate through the fanlflowmeteris then equal to the unbalanced duct leakage (supply leakage to outside minus return leakage fromoutside). By blocklng off the return portion of the system and making some other changes, thesame technique can be used to measure the supply leakage separately. The return leakage is thencalculated as the difference between the supply leakage (a positive number) and the unbalancedleakage (which might be positive, negative, or zero).
One advantage claimed for this “nulling” technique is that the value of the envelope leakage flowcoefficient does not enter into the calculation, as it does for a conceptually similar test called thehouse pressure test that is currently in Standard 152P of the American Society of Heating,Refilgerating, and Air Conditioning Engineers (ASHRAE 1999). Another advantage is that theair infiltration regime is not altered in the nulling test. That is, the neutral level is kept the sameduring the air flow test that it is during the fan-off house pressure measurement.
These factors remove a dependence on mathematical assumptions that have been questioned inthe house pressure test. Francisco and Palmiter also found, in some tests of a preliminary nature,that the nulling test fared better than other duct leakage tests in a comparison of measured valueswith “best estimate” values that they had reason to believe were quite close to the actual ductleakage rates.
In view of this initial promise, it seemed appropriate to petiorm an analysis of the measurementuncertainties of the nulling test. The objectives of this analysis were, first, to quanti~ expecteduncertainties in measured values of supply and return leakage, and second, to determine whetherany practical steps might be available to reduce these errors consistent with reasonable economyof effort. This report discusses the derivation and results of this analysis, compares it with twoavailable sources of data, and makes suggestions on how the accuracy of the nulling test might beenhanced.
3
NOMENCLATURE
The following terminology is used in the report without firther definition. Unless otherwisestated, it is assumed that air-flow rates will be measured in cubic feet per minute (cfm) and thatpressures will be measured in pascals (Pa). (One pascal is equal to one newton per square meteror 0.004 inches of water column.)
Measured house pressure (pressure in the conditioned space, with respect to theoutside), intended to equal the null pressure PO.The “null pressure” or target pressure, measured with the system fan off, to whichthe house pressure is returned (using a fanhlowmeter) when the system fan isturned on.Air flow rate across the envelope (+ for flow into house) during the measurementof unbalanced leakage. The “bd” subscript stands for “blower door,” but it isunderstood that the measurement may actually be made with a smaller version ofthe blower door, often referred to by a common trade name “duct blaster,” buthere termed (generically) a duct blower.Air flow rate across the envelope (+ for flow into house) during the measurementof supply leakage.Air flow rate delivered to the living space by the supply duct system.Net air leakage into the building envelope (+ for net inward leakage).Return duct leakage from outside under normal operating conditions.Supply duct leakage to outside under normal operating conditions.
(Note: Both Q,,,,, and Q,eakare defined to be positive quantities under normalconditions of outward supply leakage and inward return leakage.)Algebraic difference of supply leakage minus return leakage as measured directlyin the first part of the nu]ling test. (Mght not equal Q,l.,k - Q,l.,~ due tomeasurement errors.)
DESCRIPTION OF THE NULLING TEST
As summarized in the Introduction, the nulling test has two distinct parts. The first part measuresthe unbalanced leakage (Q,l,,k+,l,,~)and the second part measures the supply-side leakage (Q,l,~.The return side leakage (Q,l,,~) is then calculated using Q,l,,k= Q,l.,k - Q,l,.k+,l.,k.
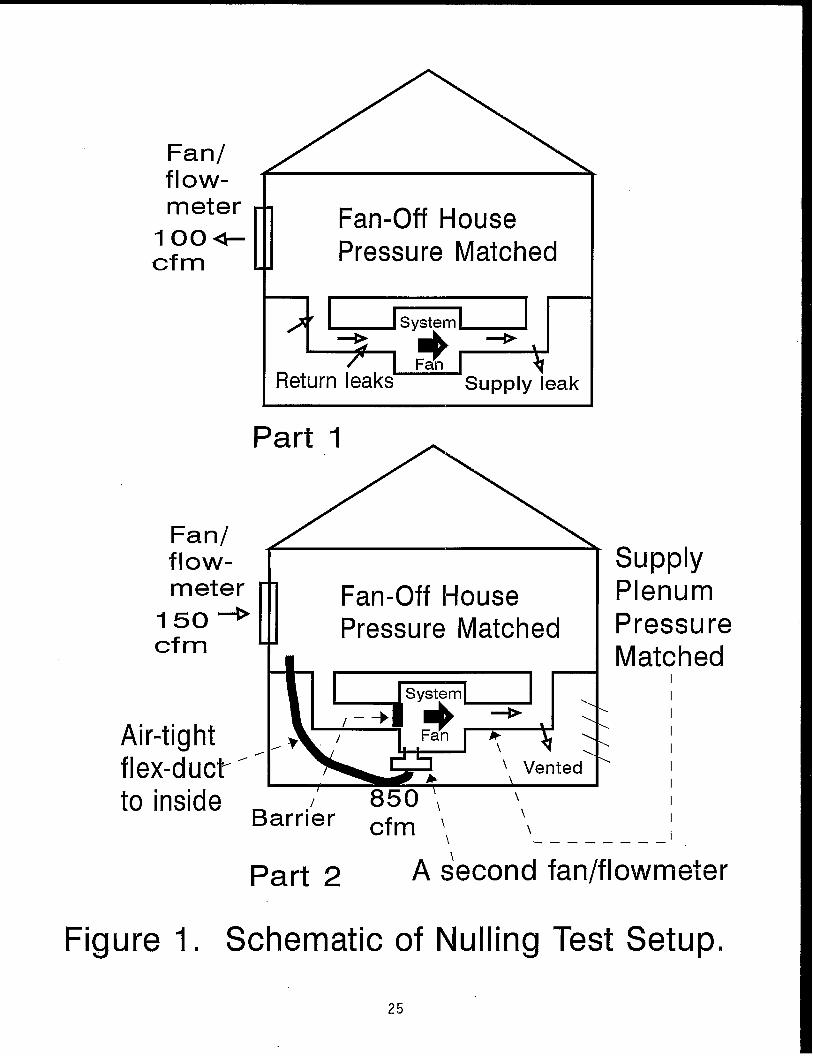
The experimental setup for the first part of the nulling test is shown in Figure 1. In Part 1, thepressure in the living space with respect to the outside is measured with the system fan off. Thesystem fan is then turned on, and a fardflowmeter (blower door or duct blower) mounted in anoutside doorway or window opening is turned on and adjusted until the house pressure is thesame as it was with the system fan off. The air flow rate through the fan.hlowmeter is then readoff and set equal to the unbalanced duct leakage (Q~l~~k+~l~~k). If the air flow is into the envelope, itmeans that the supply leakage exceeds the return leakage (QS1~~k+~l~&> O) while if the air flow is to
the outside, the return leakage dominates (Q,l,,~+,l,,k< 0).
4
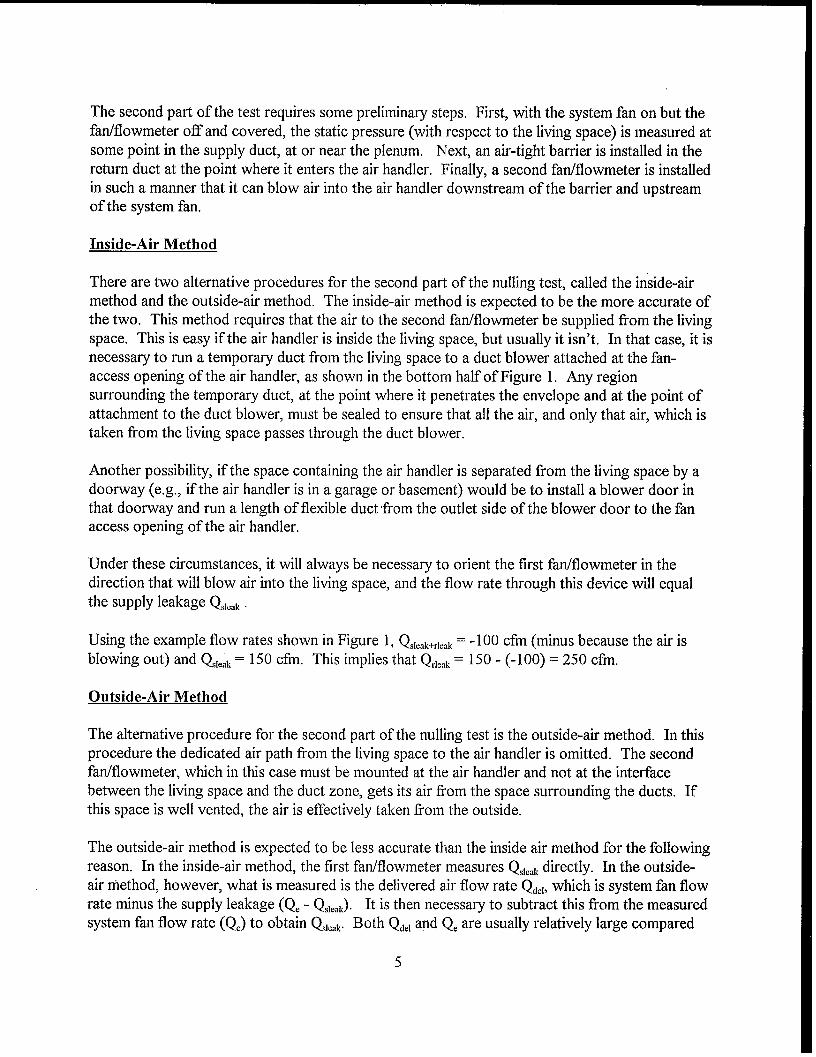
Thesecond patiofthe test requires someprelilnina~ steps. First, withthe system fanon butthefan/flowmeter off and covered, the static pressure (with respect to the living space) is measured atsome point in the supply duct, at or near the plenum. Next, an air-tight barrier is installed in thereturn duct at the point where it enters the air handler. Finally, a sec&d fan/flowmeter is installedin such a manner that itof the system fan.
can blow air into the air handler downstream of the barrier and upstream
Inside-Air Method
There are two alternative procedures for the second part of the nulling test, called the inside-airmethod and the outside-air method. The inside-air method is expected to be the more accurate ofthe two. This method requires that the air to the second fan/flowmeter be supplied from the livingspace. Thk is easy if the air handler is inside the living space, but usually it isn’t. In that case, it isnecessary to run a temporary duct from the living space to a duct blower attached at the fan-access opening of the air handler, as shown in the bottom half of Figure 1. Any regionsurrounding the temporary duct, at the point where it penetrates the envelope and at the point ofattachment to the duct blower, must be sealed to ensure that all the air, and only that air, which istaken from the living space passes through the duct blower.
Another possibility, if the space containing the air handler is separated from the living space by adoorway (e.g., if the air handler is in a garage or basement) would be to install a blower door inthat doorway and run a length of flexible duct from the outlet side of the blower door to the fanaccess opening of the air handler.
Under these circumstances, it will always be necessary to orient the first fan/flowmeter in thedirection that will blow air into the living space, and the flow rate through this device will equalthe supply leakage Q,l,,~ .
Using the example flow rates shown in Figure 1, Q,l,,k+,l,,k= -100 cfm (minus because the air isblowing out) and Q,l,~~= 150 cfin. This implies that Q,l,,~= 150- (-100)= 250 cfm.
Outside-Air Method
The alternative procedure for the second part of the nulling test is the outside-air method. In thisprocedure the dedicated air path from the living space to the air handler is omitted. The secondfan/flowmeter, which in this case must be mounted at the air handler and not at the interfacebetween the living space and the duct zone, gets its air from the space surrounding the ducts. Ifthis space is well vented, the air is effectively taken from the outside.
The outside-air method is expected to be less accurate than the inside air method for the followingreason. In the inside-air method, the first fanlflowmeter measures Q,l~&directly. In the outside-air method, however, what is measured is the delivered air flow rate Q~,l,which is system fan flowrate minus the supply leakage (Q. - Q,l,,~). It is then necessary to subtract this from the measuredsystem fan flow rate (Q.) to obtain Q,l,,~. Both Q~,land Q. are usually relatively large compared
5
with the duct leakage rates, and so Q,l,,~ is calculated as the difference between two numbers ofsimilar size, which is a classic recipe for large percentage error in the result.
Despite this, we’ll not reject the outside-air method out of hand. It might happen that it couldyield uncertainties that, while larger than those of the inside-air method, are still acceptable. Inthat case, the convenience of not having to link the air handler to the conditioned space mightoutweigh the larger errors which, on average, the outside-air method would entail.
ACCURACY DEPENDS ON ENVELOPE TIGHTNESS
Before beginning the analysis, it is important to point out one major factor in the overallevaluation of the nulling test. Despite the fact that the envelope leakage flow coefficient does notfigure in the calculations of duct leakage rates, the accuracv of the test does depend on envelopetightness.
It is true that the nulling test does not change the neutral level (the vertical height at which theinside-to-outside pressure difference is zero), It is also true that the nulling test renders mootcertain mathematical assumptions that are needed in the house pressure test.
Nevertheless, the leakier the house envelope, the less accurate the nulling test will be. That thisis so can be seen by visualizing the nulling process not as an attempt to match exactly the targethouse pressure (an impossibility) but rather to bring the house pressure within a given tolerance ofthe target. One then recognizes that, for a leaky envelope, the range of air flow rates through thefan/flowmeter that will bring the house pressure within such a tolerance limit will be greater thanthe corresponding range if the envelope is tight. The limiting case is if the envelope has a verylarge hole (such as all the doors and windows open). In that case, the house pressure will be zeroregardless of what is done with the system fan and the fanhlowmeter, and the measured ductleakage rates will have extremely large error bars.
FIRST PART OF NULLING TEST: MEASUREMENT OF UNBALANCED LEAKAGE
In the first part of the nulling test, which measures the unbalanced leakage, the house pressure isinitially measured with the system fan off. This provides the “null pressure” that is to bematched, after the system fan is turned on, by adjusting the blower-door air-flow until the housepressure reverts back to the null pressure. This assures that the envelope pressure distribution isthe same as it was before.1 Since the net leakage into the envelope Q,~vmust be zero under those
lStrictly speaking, the ducts should be isolated from the conditioned space during theinitial pressure measurement, since otherwise leakage area in the ducts themselves will bias theresult. Francisco and Palmiter (1999) pointed out this potential for bias but did not adjust for itexperimentally, presumably in the belief that the amount of bias would not be important. Thatmay well be the case in most instances. If it turns out to be a problem, blocklng the registersduring the initial test should solve it.
6
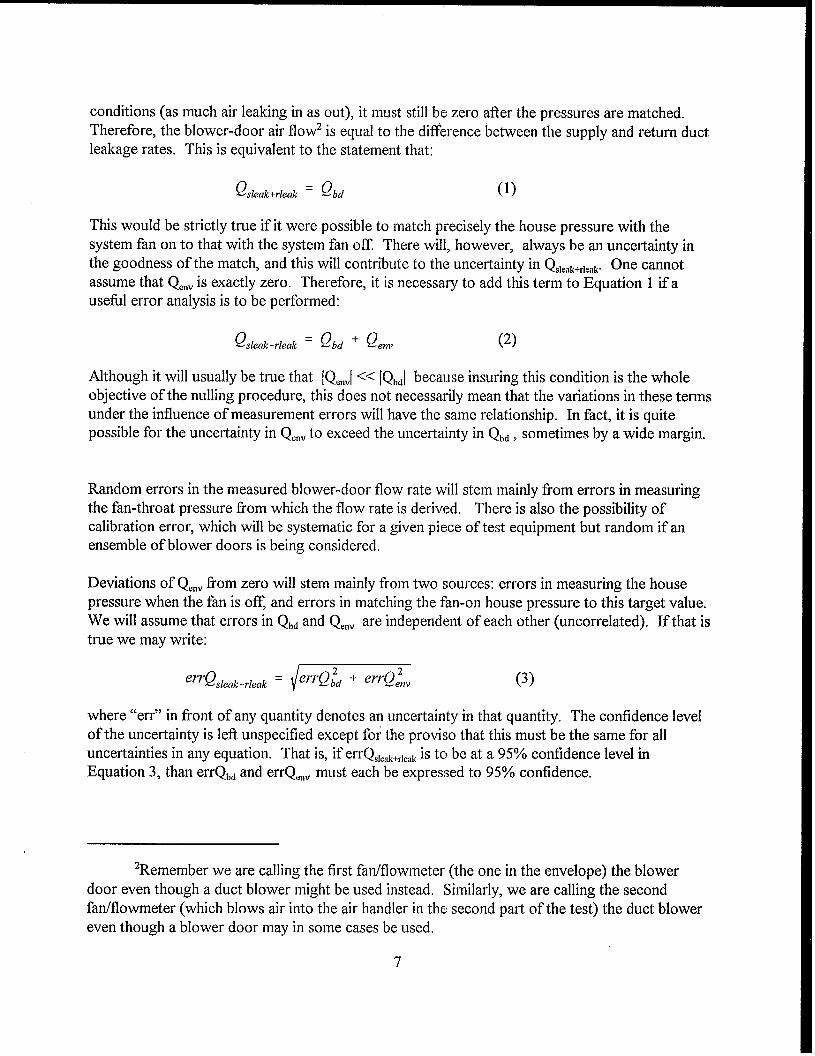
conditions (as much air leaklng in as out), it must still be zero after the pressures are matched.Therefore, the blower-door air flow2 is equal to the difference between the supply and return ductleakage rates. This is equivalent to the statement that:
~sle(bldt=~bcl(1)
This would be strictly true if it were possible to match precisely the house pressure with thesystem fan on to that with the system fan off. There will, however, always be an uncertainty inthe goodness of the match, and this will contribute to the uncertainty in Q,l,,k+,l,.k. One cannotassume that Q,~vis exactly zero. Therefore, it is necessary to add this term to Equation 1 if ausefil error analysis is to be performed:
~deak+rleak = ~bd + ~erw (2)
Although it will usually be true that [Q.nv[<< [Q~~[because insuring this condition is the wholeobjective of the nulling procedure, this does not necessarily mean that the variations in these termsunder the influence of measurement errors will have the same relationship. In fact, it is quitepossible for the uncertainty in Q,,,vto exceed the uncertainty in Q~~, sometimes by a wide margin.
Random errors in the measured blower-door flow rate will stem mainly from errors in measuringthe fan-throat pressure from which the flow rate is derived. There is also the possibility ofcalibration error, which will be systematic for a given piece of test equipment but random if anensemble of blower doors is being considered.
Deviations of Q,~vfi-om zero will stem mainly from two sources: errors in measuring the housepressure when the fan is off, and errors in matching the fan-on house pressure to this target value.We will assume that errors in Q~~and Q,~v are independent of each other (uncorrelated). If that istrue we may write:
(3)
where “err” in front of any quantity denotes an uncertainty in that quantity. The confidence levelof the uncertainty is left unspecified except for the proviso that this must be the same for alluncertainties in any equation. That is, if errQ,l$,~+,l,~~is to be at a 95°/0 confidence level inEquation 3, than errQ~~and errQ~,,vmust each be expressed to 95°/0 confidence.
2Remember we are calling the first fardflowmeter (the one in the envelope) the blowerdoor even though a duct blower might be used instead. Similarly, we are calling the secondfanhlowmeter (which blows air into the air handler in the second part of the test) the duct blowereven though a blower door may in some cases be used.
7
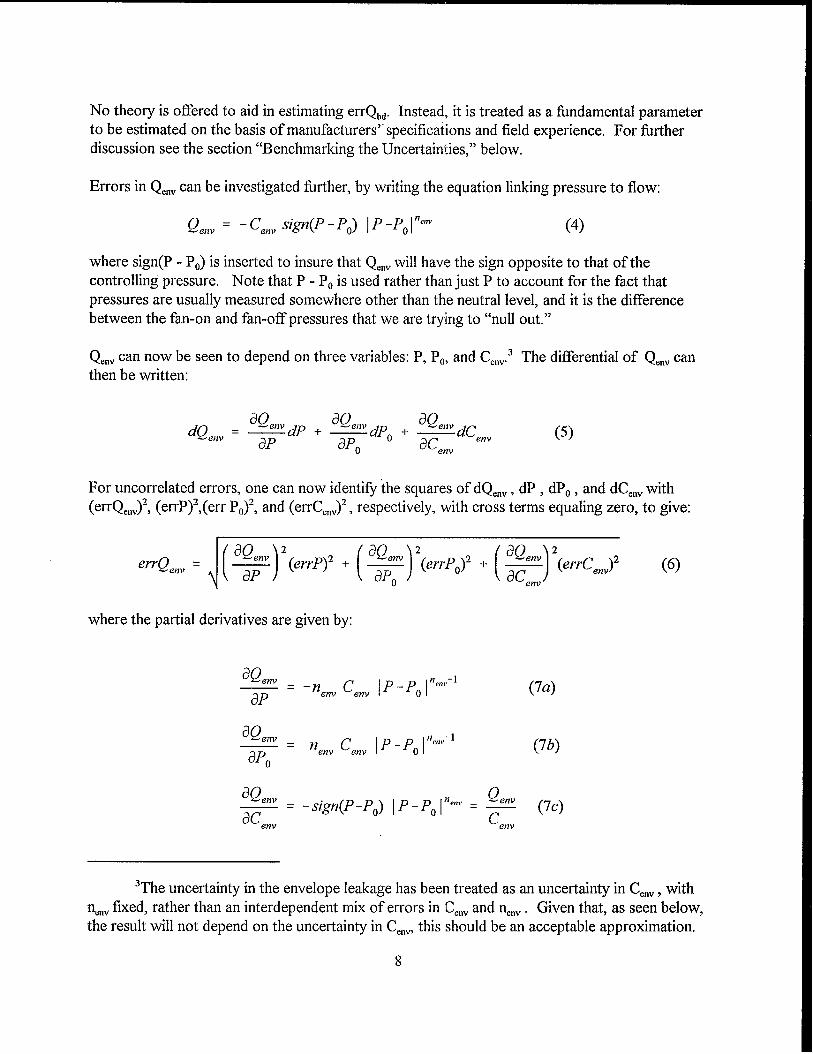
No theory is offered to aid in estimating errQ~~. Instead, it is treated as a fimdamental parameterto be estimated on the basis of manufacturers” specifications and field experience. For firtherdiscussion see the section “Benchmarking the Uncertainties,” below.
Errors in Q,~vcan be investigated fi.u-ther,by writing the equation linking pressure to flow:
a..=-c..,m-@-Po) 1P -Po[”’”” (4)
where sign(p - PO)is inserted to insure that Q,nvwill have the sign opposite to that of thecontrolling pressure. Note that P -PO is used rather than just P to account for the fact thatpressures are usually measured somewhere other than the neutral level, and it is the differencebetween the fan-on and fan-off pressures that we are trying to “null out.”
Q..v can now be seen to depend on three variables: P, PO,and C~,,V3The differential of Q~nvcanthen be written:
a~ a~e,,v ~p ~ dQdQenv = -#alp + _ ~dCen,l
dPo 0 aqnv(5)
For uncorrelated errors, one can now identifi the squares of dQ,,,v, dP , dPO, and dC~~vwith(errQ.nv)2, (errP)’,(err PO)’, and (errC,nv)2, respectively, with cross terms equaling zero, to give:
where the partial derivatives are given by:
a~env—=
‘nenl’ Cen, /P-p. [%-lap
aQenv Q- = - Sign(P-Po) /P -P. [“o””= &acenv
em
(7a)
(7b)
(7C)
‘The uncertainty in the envelope leakage has been treated as an uncertainty in C,~v, withn,~vfixed, rather than an interdependent mix of errors in C,,,vand n,nv. Given that, as seen below,the result will not depend on the uncertainty in C,nmthis should be an acceptable approximation.
8
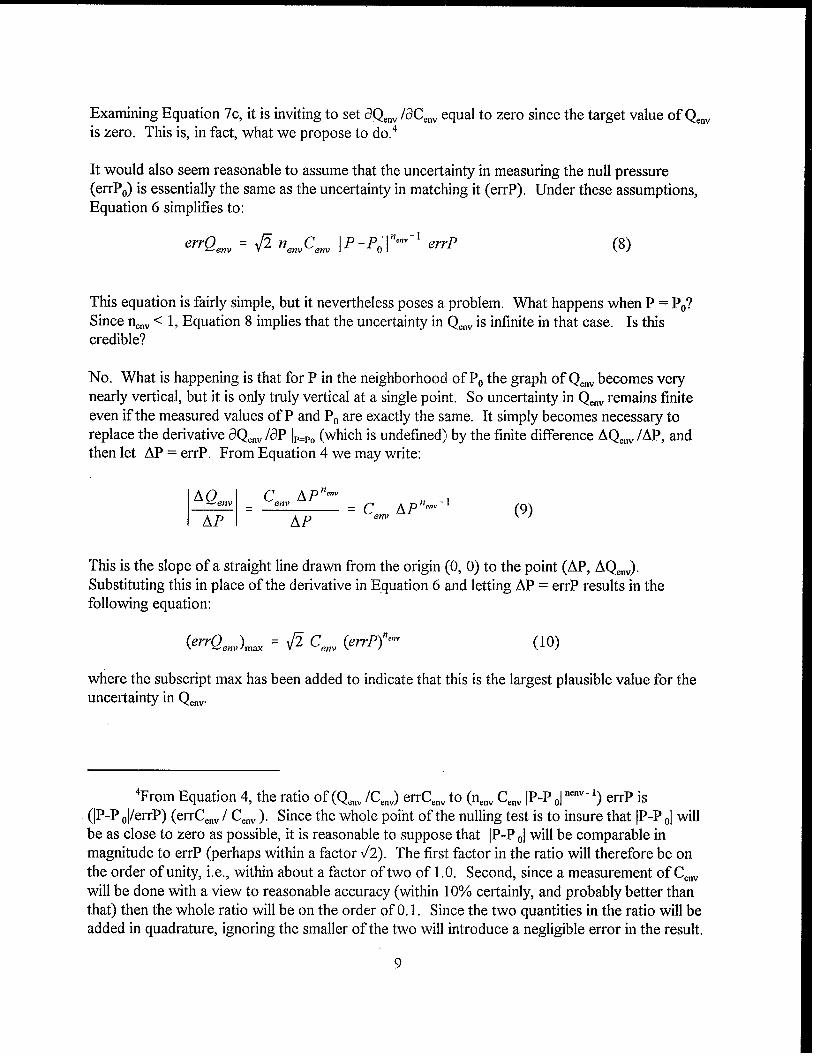
Examining Equation 7c, it is inviting to set 13Q,nv/dC,,v equal to zero since the target value of Q,nvis zero. This is, in fact, what we propose to do.4
It would also seem reasonable to assume that the uncertainty in measuring the null pressure(errPO) is essentially the same as the uncertainty in matching it (errP). Under these assumptions,Equation 6 simplifies to:
errQ@nv= G nen”cenv 1P -Po”\n”’’”-’eHP (8)
This equation is fairly simple, but it nevertheless poses a problem. What happens when P = PO?Since n~~v<1, Equation 8 implies that the uncertainty in Q~nvis infinite in that case. Is thiscredible?
No. What is happening is that for P in the neighborhood of POthe graph of Q~nvbecomes verynearly vertical, but it is only truly vertical at a single point. So uncertainty in Q~nvremains finiteeven if the measured values of P and POare exactly the same. It simply becomes necessary toreplace the derivative ~Q~~v/dP IP.PO(which is undefined) by the finite difference AQ~nv/AP, andthen let AP = errP. From Equation 4 we may write:
A Q~flv CaHvAP ‘“”V— = = CgflvAP ‘“”v-1
AP AP(9)
This is the slope of a straight line drawn from the origin (0, O) to the point (AP, AQ,~v).Substituting this in place of the derivative in Equation 6 and letting AP = errP results in thefollowing equation:
(errQanv)m== @ Cenv(errP)n’”” (lo)
where the subscript max has been added to indicate that this is the largest plausible value for theuncertainty in Q,nv.
4From Equation 4, the ratio of (Q,,,v/C,l,v) errC,,,v to (n,,,vC,~v[P-P ~1““V-1, errP is(1P-P ,\/errP) (errC,nv / C,nv). Since the whole point of the nulling test is to insure that 1P-PJ willbe as close to zero as possible, it is reasonable to suppose that 1P-P~1will be comparable inmagnitude to errP (perhaps within a factor d2). The first factor in the ratio will therefore be onthe order of unity, i.e., within about a factor of two of 1.0. Second, since a measurement of C,flvwill be done with a view to reasonable accuracy (within 10°/0certainly, and probably better thanthat) then the whole ratio will be on the order of 0.1. Since the two quantities in the ratio will beadded in quadrature, ignoring the smaller of the two will introduce a negligible error in the result.
9
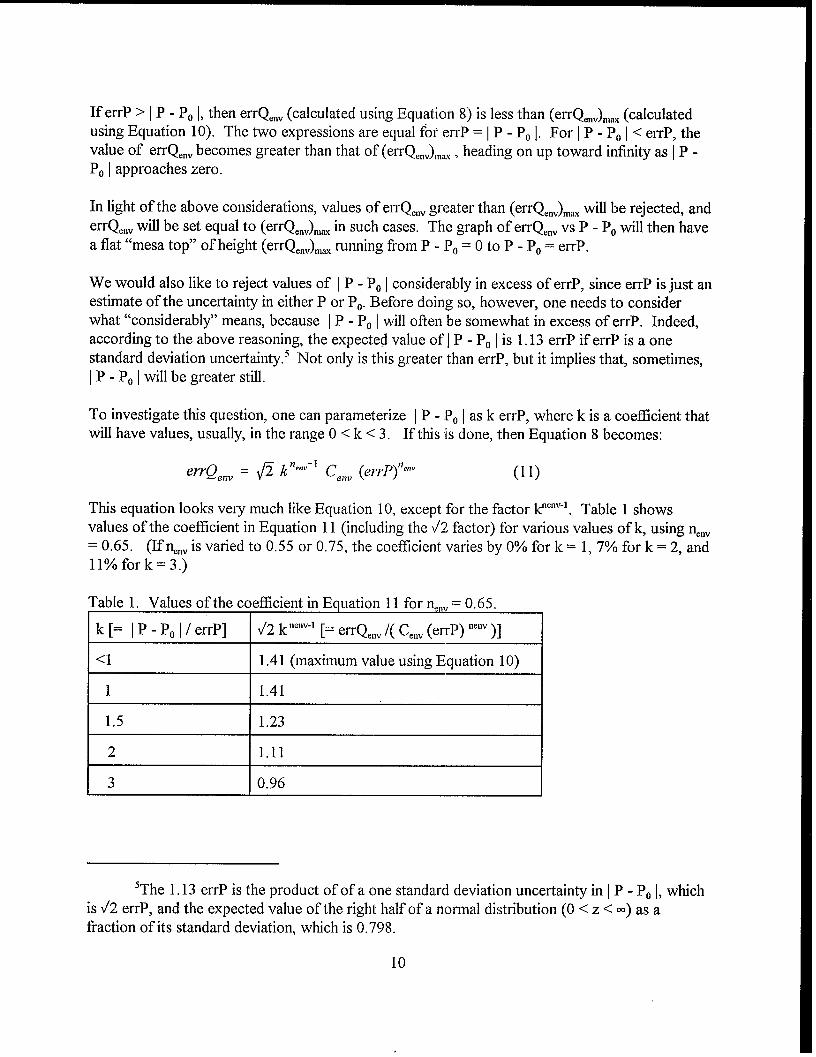
If errP > IP - PO1,then errQ~,,v(calculated using Equation 8) is less than (errQ.nv)~,aY(calculatedusing Equation 10). The two expressions are equal for errP = IP - PO1. For \ P - POI < errP, thevalue of errQ,nv becomes greater than that of (errQ ),nv,,,,,, heading on up toward infinity as IP -POI approaches zero.
In light of the above considerations, values of errQ,~vgreater than (errQ~nv)~ZYwill be rejected, and
errQe.. will be set equal to (errQ.nv)n,&.in such cases. The graph of errQ,nv vs P - POwill then havea flat “mesa top” of height (errQ,nv)n,,Xrunning from P - PO= Oto P - PO= errP.
We would also like to reject values of IP -PO] considerably in excess of errP, since errP is just anestimate of the uncertainty in either P or PO.Before doing so, however, one needs to considerwhat “considerably” means, because \ P -PO Iwill often be somewhat in excess of errP. Indeed,according to the above reasoning, the expected value of IP - POI is 1.13 errP if errP is a onestandard deviation uncertainty. 5 Not only is this greater than errP, but it implies that, sometimes,IP -PO Iwill be greater still.
To investigate this question, one can parametrize IP -PO I as k errP, where k is a coefficient thatwill have values, usually, in the range O< k <3. If this is done, then Equation 8 becomes:
et7Qenv = @ kn’”v-lCgnv(emP)nC’lv (11)
This equation looks very much like Equation 10, except for the factor kn’nv-l. Table 1 showsvalues of the coefficient in Equation 11 (including the /2 factor) for various values of k, using n~nv= 0.65. (If n,ovis varied to 0.55 or 0.75, the coefficient varies by 0?40fork= 1, 7V0fork= 2, andll%fork =3.)
Table 1. Values of the coefficient in Equation 11 for n,,,v= 0.65.
k[= lP-POl/errP] ~2 k“’””-’[= errQ,,,v /( C,,,v(errP) ““v )]
<1 1.41 (maximum value using Equation 10)
]1 I 1.41 I
I 1.5 I 1.23 II 1.11 I
13 I 0.96 I
5The 1.13 errP is the product of of a one standard deviation uncertainty in j P - PO1,whichis /2 errP, and the expected value of the right half of a normal distribution (O < z < m) as afraction of its standard deviation, which is 0.798.
10
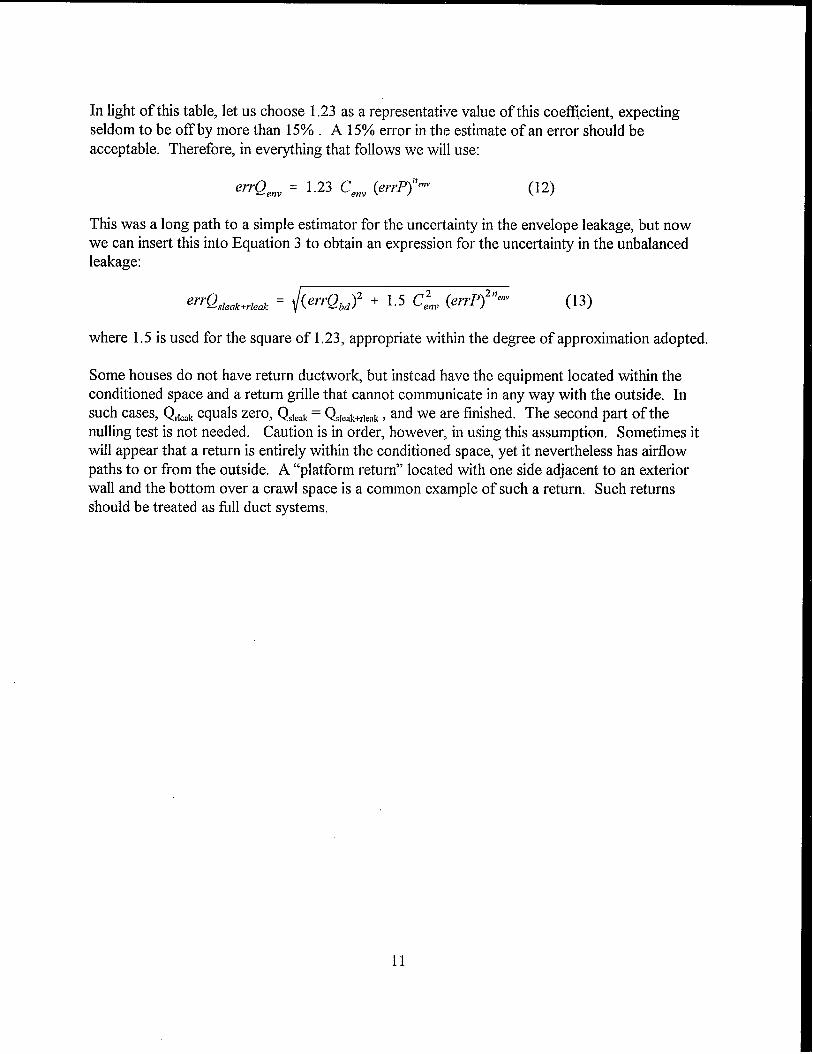
In light of this table, let us choose 1.23 as a representative value of this coefficient, expectingseldom to be off by more than 15°/0 . A 15% error in the estknate of an error should beacceptable. Therefore, in everything that follows we will use:
ewQenv = 1.23 C~flv(errP)”’nv (12)
This was a long path to a simple estimator for the uncertainty in the envelope leakage, but nowwe can insert this into Equation 3 to obtain an expression for the uncertainty in the unbalancedleakage:
‘TrQsleuk+rleak = /(e~K!bd)2 + 1.5 C~H,,(errp)’”,’r (13)
where 1.5 is used for the square of 1.23, appropriate within the degree of approximation adopted.
Some houses do not have return ductwork, but instead have the equipment located within theconditioned space and a return grille that cannot communicate in any way with the outside. Insuch cases, Q~l~~kequals zero, QSle~k= QS[o~k+rl~~k,and we are finished. The second part of thenulling test is not needed. Caution is in order, however, in using this assumption. Sometimes itwill appear that a return is entirely within the conditioned space, yet it nevertheless has airflowpaths to or from the outside. A “platform return” located with one side adjacent to an exteriorwall and the bottom over a crawl space is a common example of such a return. Such returnsshould be treated as fill duct systems,
11
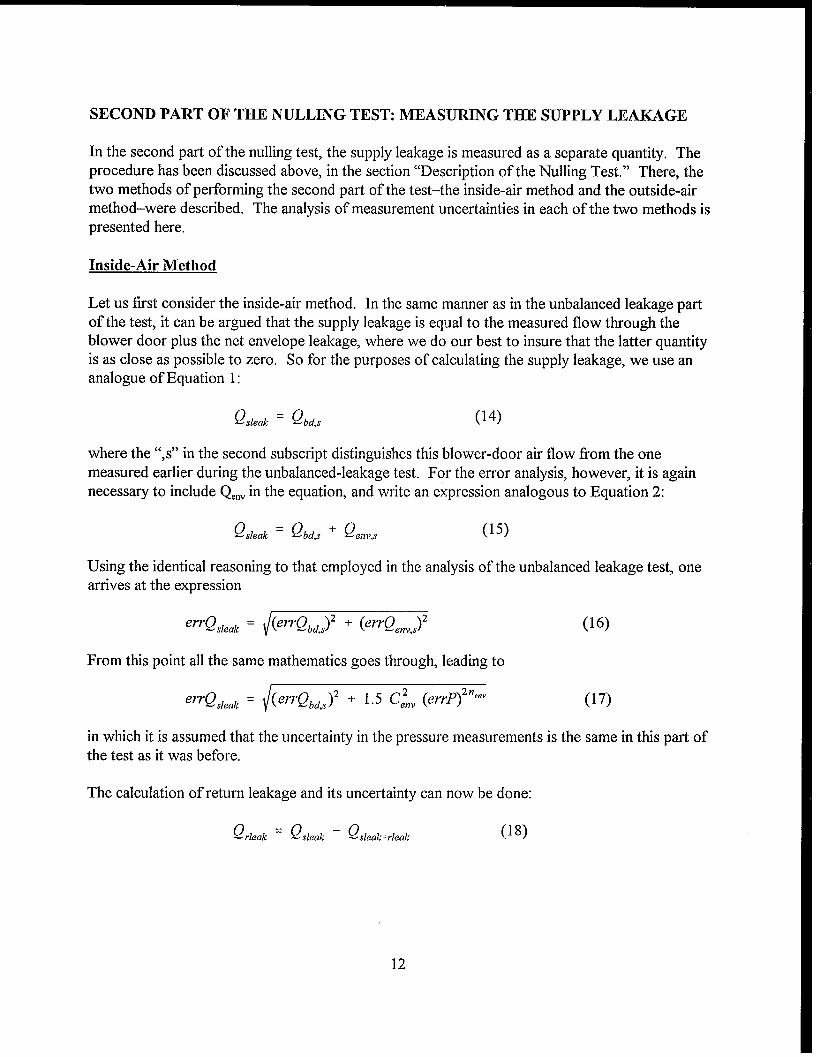
SECOND PART OF THE NULLING TEST: MEASURING THE SUPPLY LEAKAGE
Inthesecond patiofthe nulling test, thesupply leakage ismeasured asaseparate quantity. Theprocedure has been discussed above, inthesection ``Description of the Nulling Test.'' There, thetwo methods of petiorming the second part of the test–the inside-air method and the outside-airmethod–were described. The analysis of measurement uncertainties in each of the two methods ispresented here.
Inside-Air Method
Let us first consider the inside-air method. In the same manner as in the unbalanced leakage partof the test, it can be argued that the supply leakage is equal to the measured flow through theblower door plus the net envelope leakage, where we do our best to insure that the latter quantityis as close as possible to zero. So for the purposes of calculating the supply leakage, we use ananalogue of Equation 1:
!2,1eak=~bd-, (14)
where the “,s” in the second subscript distinguishes this blower-door air flow from the onemeasured earlier during the unbalanced-leakage test. For the error analysis, however, it is againnecessary to include Q,nvin the equation, and write an expression analogous to Equation 2:
Using the identical reasoning to that employed in the analysis of the unbalanced leakage test, onearrives at the expression
From this point all the same mathematics goes through, leading to
(16)
e~@~leQk ‘rrQbd,,)2+ 1.5 C~~,,(e~rp)’n””” (17)
in which it is assumed that the uncertainty in the pressure measurements is the same in this part ofthe test as it was before.
The calculation of return leakage and its uncertainty can now be done:
!2,1..k=(?,l..k-Q,leak+rleak (18)
12
If all errors are uncorrelated, the uncertainty in Q,l,,~is given by:
= ~(errQ,,)2 + (errQ,,,,)’ + 3 c:.. (errF’)’”env (19)
Equation 19 is likely to overestimate somewhat the contribution of the blower-doormeasurements, because the errors in the two measurements are likely to be significantlycorrelated, and Q,,.~~is found by subtracting them. A lower limit on errQ,lo,~can be found byassuming that the deviations of Q~~and Q~A,from their “true” values are maximally correlated andequal. In that case, their errors cancel and Equation 19 reduces to:
(errQrleak)min= 1.7 Cen,,(errP)”’n” (20)
Outside-Air Method
In the outside-air method, the provision of an air path from the living space to the duct blower isomitted. This will usually save time and effort, but it comes at the cost of adding uncertainty inthe results. For one thing, there is an extra term in the uncertainty expression. For another, oneof the existing terms becomes much larger. These things happen because the blower door nowmeasures, not the supply leakage directly, but the rate of air delivery to the house by the ductsystem. The supply leakage must be calculated by subtracting this measured flow rate from theair flow rate at the system fan:
Q.,.., = Q. - Qixi,s (21)
for the purposes of calculation, and
for the purposes of uncertainty analysis.
This leads to the following expression for the uncertainty in the supply leakage:
@’!&uk= /(errQ.)’ +(cwQJ’+ 1.5 c:..(wf’)’n’”” (23),
Not only is there a term in Equation 23 that was absent in Equation 17, but the uncertainty in theblower-door air flow rate (errQ~L,) will usually be much larger in Equation 23 than in Equation 17because the size of the flow to be measured is larger. For example, suppose the system fan flowrate is 1200 cfm and the supply leakage rate is 200 cfm. Then Q~~,,will be -200 cfin in Equation17 but -1000 cfm in Equation 22. (Generally, the larger a flow rate, the larger will be theuncertainty in its measured value.)
13
In the outside-air method, the return leakage is calculated the same way as in the inside-airmethod, using Equation 18:
Q~~~*~= Q~~~Q~- Q~~~~~+~~.*~ (18 repeated)
from which the uncertainty in the return leakage works out to:
= /(errQ.)’ + (errQ,,)’ + (wQ,d,)2 + q.z~f..(err~)’n”nvW,
In the outside-air method, errQ~~,,>> errQh~, so Equation 24 can be simplified to:
The gross inequality of errQ~~and errQ~~,,renders moot any concern about correlation of thesetwo uncertainties.
BENCHMARKING THE UNCERTAINTIES
At this point, we have obtained expressions for the uncertainties in the supply and return leakagerates as measured using both versions of the nulling test. It remains to put typical numbers onthese uncertainties, and to see whether some of the terms in Equations 17, 19, 22, and 23 arealways or usually more significant than others. Should that be the case, some simplification ofthese equations may be achieved.
The quantities appearing in these equations can be listed:
c n errP errQ~denv env errQL1d,5 errQe
The first two speci~ the leakage characteristics of the erwelope, and the other four areuncertainties in the measured quantities. Let USlook at each of these in turn.
Envelope leakage rates in American housing vary widely, but in terms of CFM50 most will fall inthe range 500 to 5000. The measured exponents also vary, but usually fall in the range 0.55 to0.75. For the purposes of this benchmarking exercise, we’ll set nenv = 0.65, a conventionalchoice, and run several values of Cenv: 50, 100, 200, 300, and 400 cfin/Pa65.
14
The other quantities are all measurement uncertainties, and an uncertainty is meaningless unless itis accompanied by a confidence level. Unfortunately, in the benchmarking process below, it is notpossible to be as precise as one would like about this, because the data necessary to do this arenot always available. Particularly with regard to a manufacturer’s specification of accuracy, it isdifficult to know what level of confidence to assign to this. So it is necessary to make someassumptions, but at least these should be stated as clearly as possible:
1. Estimates of statistical uncertainties will be made as one standard deviation in a normallydistributed set of measurements.
2. Where a manufacturer’s estimate of accuracy is used, it will be assumed that the units areuniformly distributed within the specified limits. One standard deviation will then span -60°/0 ofthe specified range. this is equivalent to assuming a normal distribution in which 92°A of the unitsmeet the manufacturer’s specification,
Let us start with a consideration of pressure measurements. These are usually made with a digital
gauge that reads to tenths of a pascal. It is possible to reduce random uncertainty in ameasurement by repeating it many times, so that the standard deviation of the mean decreases asthe square root of the number of measurements. Theoretically, there is no lower limit to thisuncertainty. Nevertheless, systematic error in instrument calibration and variations in pressures,caused by wind shifts and gusts, will put a practical floor on achievable accuracy. The digitalgauges generally used in the field read to tenths of a pascal, so it seems reasonable to claim that0.1 Pa is the lower limit of plausible uncertainties in P. One such meter is quoted as having anaccuracy of *1 0/0,or 2 counts, whichever is greater. This would seem to imply a minimumuncertainty of 0.2 Pa. However, since the nulling test only requires that one pressure be matchedto another, a systematic error in the house pressure readings will not matter. So from thisstandpoint a 0.1 Pa lower limit for errP is still a possibility.
Practical experience, however, indicates that reducing the random uncertainty in the housepressure to 0.1 Pa will require many measurements. Even reducing this to 0.2 Pa maybe difficultin anythhg but calm wind conditions, We will proceed with the benchmarking analysis using 0.1,0.2, and 0.3 Pa as candidate values for the uncertainty in house pressure.
The uncertainties in air-flow measurements (errQ~~ and errQ~~,,)may depend on the equipmentused. For low flow rates one will do well to employ a duct blower rather than a blower door,since the lower limit of flow rates that can be measured with a typical blower door is -100 cfm ifthe smallest ring is used, whereas a typical duct blower can measure flows as small as 20 cfm.
A manufacturer of test equipment claims 5’XOaccuracy for a blower door and 3% for a ductblower, within the range of calibration. This includes instrument error only; additional uncertaintymay be expected because of operator error, which may have both systematic and random
15
components. The random component may in some cases be reduced to the 10/0- 2°/0 range.G Auniform distribution with a *5°/0 range will be used as a benchmark, which implies a one standarddeviation error bar of 3%.
If this is agreed upon, then for the inside-air method, the blower door will be measuring flow ratescomparable to duct leakage rates, i.e., usually in the range O-300 cfin. The range ofmeasurement errors then will be O-9 cfim. For benchmarking purposes, we’ll take 10 cfm as aconservative estimate. For the outside-air method (in the second part of the test), the flow rate tobe measured will be larger, because it is now the delivered air flow rate rather than the ductleakage rate. This may be benchmarked as typically a 1200 cfm system fan flow rate minus atypical 200 cfm leakage rate, or -1000 cfin. A 3’XOerror will then be -30 cfm.
System fan flow can be measured in several ways. ASHRAE Standard 152P prescribes a methodusing a duct blower applied to a system with blocked return, very similar to what is used in thesecond part of the nulling test. In one “round robin” test of the fan flow measurement procedure(Andrews et al. 1998) the standard deviation of fan flow measurements was 3.6% of the mean offive measurements. Allowing that an experienced operator might be able to reduce thisuncertainty somewhat, we will benchmark a 30/0uncertainty in the fan flow rate. Three percent ofa typical 1200 cfm flow rate is 36 cfin.
The quantities appearing under a radical in Equations 17, 19, 23, and 25 are:
● (errQ~~v)2= 1.6 (C~nv)2(errP)’n’”v● (errQ,,)’● (errQbdS)2● (errQ.~
All but the first of these have been benchmarked above. To summarize, we are using:
● errQ~~= 10 cfin, so (errQ~d)2= 100 cfin’.● errQb&,= 10 cfin for the inside-air method, so (errQbd,,)2= 100 cfm’ if inside air is used..
= 50 cfm for the outside-air method, so (errQ~~,,)2= 2500 cfm2 in this case.● errQ, = 60 cfin (relevant to outside-air method only), so (errQ~)2 = 3600 cfin’.
The quantity 1.5 (C~nv)2(errP) 2“’””is composed of two parameters for which it was foundnecessa~ to consider ranges of values as opposed to a single benchmark. Therefore, a matrix ofvalues for this quantity will be needed. Table 2 shows values of 1.5 (C,nv)2(errP)2nenvfor thebenchmark values of errP and C,nv.
‘In a study relating to another duct leakage test (Andrews 2000) the average deviation ofblower-door measurements from the theoretical curve was found to be in the 1’%to 2% range.
16
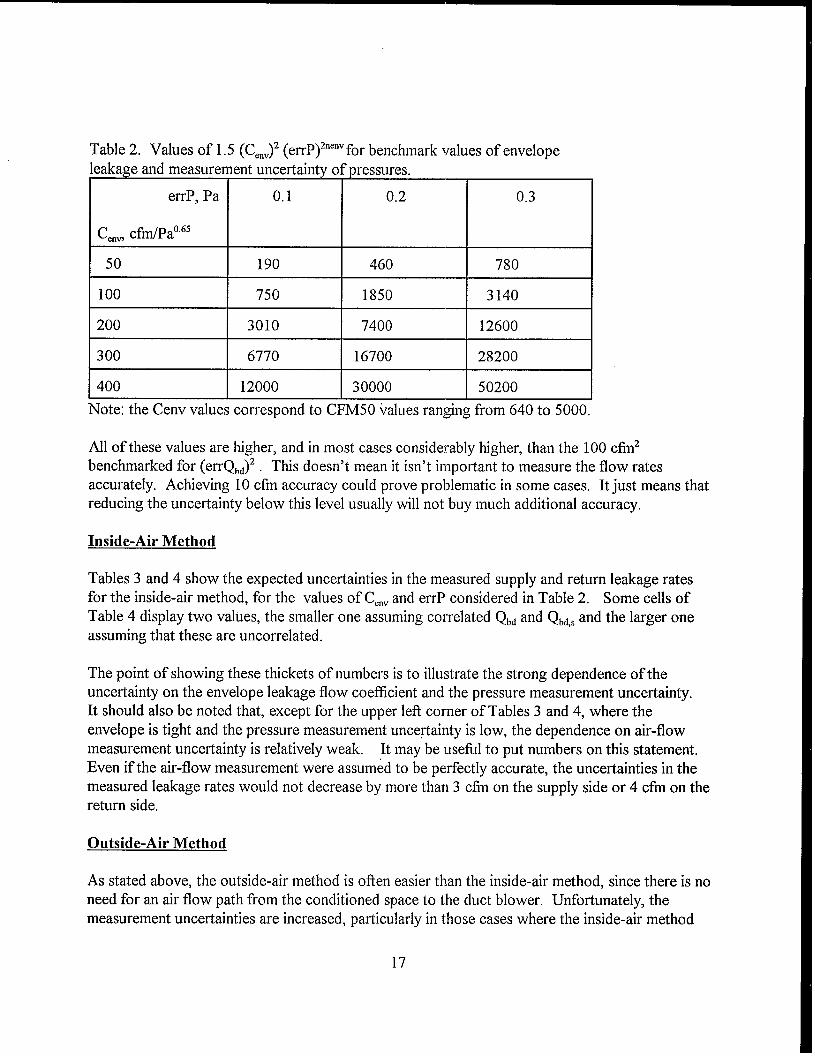
Table 2. Values of 1.5 (C,nv)2(errP)’n’”vfor benchmark values of envelopeleakage and measurement uncertainty of pressures.
errP, Pa 0.1 0.2 0.3
C.nmcffla0G5
50 190 460 780
100 750 1850 3140
200 3010 7400 12600
300 6770 16700 28200
400 12000 30000 50200
Note: the Cenv values correspond to CFM50 values ranging from 640 to 5000.
All of these values are higher, and in most cases considerably higher, than the 100 cfm’benchmarked for (errQ~~)2. This doesn’t mean it isn’t important to measure the flow ratesaccurately. Achieving 10 cfm accuracy could prove problematic in some cases. It just means thatreducing the uncertainty below this level usually will not buy much additional accuracy.
Inside-Air Method
Tables 3 and 4 show the expected uncertainties in the measured supply and return leakage ratesfor the inside-air method, for the values of C,,,vand errP considered in Table 2. Some cells ofTable 4 display two values, the smaller one assuming correlated Q~~and Q~4, and the larger oneassuming that these are uncorrelated.
The point of showing these thickets of numbers is to illustrate the strong dependence of theuncertainty on the envelope leakage flow coefficient and the pressure measurement uncertainty.It should also be noted that, except for the upper left corner of Tables 3 and 4, where theenvelope is tight and the pressure measurement unce~ainty is low, the dependence on air-flowmeasurement uncertainty is relatively weak. It maybe usefi.d to put numbers on this statement.Even if the air-flow measurement were assumed to be perfectly accurate, the uncertainties in themeasured leakage rates would not decrease by more than 3 cfin on the supply side or 4 cfin on thereturn side.
Outside-Air Method
As stated above, the outside-air method is often easier than the inside-air method, since there is noneed for an air flow path from the conditioned space to the duct blower. Unfortunately, themeasurement uncertainties are increased, particularly in those cases where the inside-air method
17
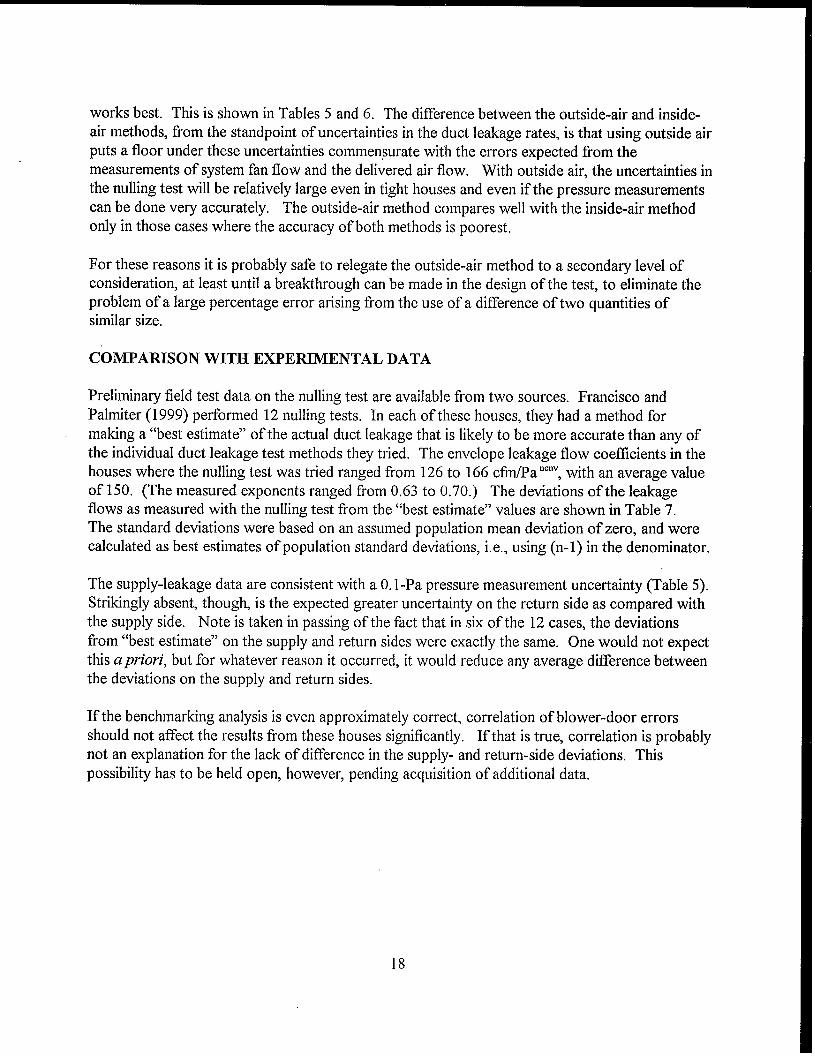
works best. This is shown in Tables 5 and 6. The difference between the outside-air and inside-air methods, from the standpoint of uncertainties in the duct leakage rates, is that using outside airputs a floor under these uncertainties commensurate with the errors expected from themeasurements of system fan flow and the delivered air flow. With outside air, the uncertainties inthe nulling test will be relatively large even in tight houses and even if the pressure measurementscan be done very accurately. The outside-air method compares well with the inside-air methodonly in those cases where the accuracy of both methods is poorest.
For these reasons it is probably safe to relegate the outside-air method to a secondary level ofconsideration, at least until a breakthrough can be made in the design of the test, to eliminate theproblem of a large percentage error arising from the use of a difference of two quantities ofsimilar size.
COMPARISON WITH EXPERIMENTAL DATA
Preliminary field test data on the nulling test are available from two sources. Francisco andPalmiter (1 999) petiormed 12 nulling tests. In each of these houses, they had a method formaking a “best estimate” of the actual duct leakage that is likely to be more accurate than any ofthe individual duct leakage test methods they tried. The envelope leakage flow coefficients in thehouses where the nulling test was tried ranged from 126 to 166 cfin/Pa ““V,with an average valueof 150. (The measured exponents ranged from 0.63 to 0.70.) The deviations of the leakageflows as measured with the nulling test from the “best estimate” values are shown in Table 7.The standard deviations were based on an assumed population mean deviation of zero, and werecalculated as best estimates of population standard deviations, i.e., using (n-1) in the denominator.
The supply-leakage data are consistent with a 0.1 -Pa pressure measurement uncertainty (Table 5).Strikingly absent, though, is the expected greater uncertainty on the return side as compared withthe supply side. Note is taken in passing of the fact that in six of the 12 cases, the deviationsfrom “best estimate” on the supply and return sides were exactly the same. One would not expectthis apriori, but for whatever reason it occurred, it would reduce any average difference betweenthe deviations on the supply and return sides.
If the benchmarking analysis is even approximately correct, correlation of blower-door errorsshould not affect the results from these houses significantly. If that is true, correlation is probablynot an explanation for the lack of difference in the supply- and return-side deviations. Thispossibility has to be held open, however, pending acquisition of additional data.
18
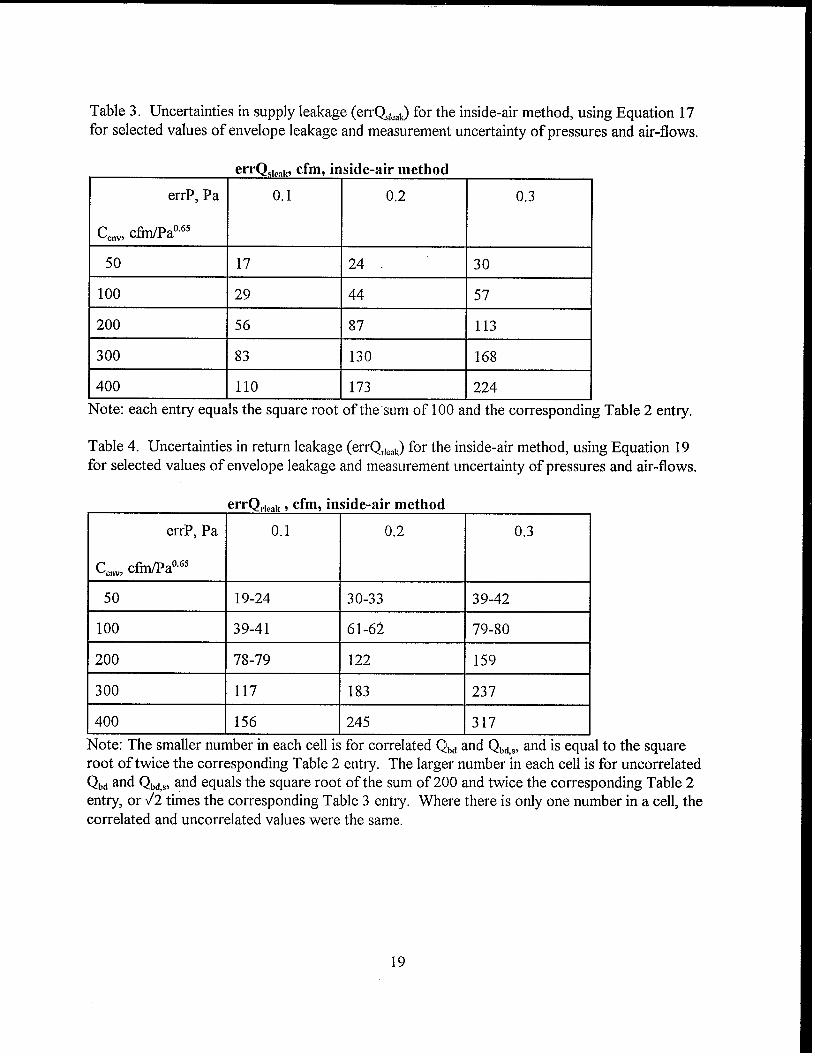
Table 3. Uncertainties in supply leakage (errQ,l,,~) for the inside-air method, using Equation 17for selected values of envelope leakage and measurelnent uncertainty of pressures and air-flows.
errO.,_,,. cfm. inside-air methocl>,, V<, IL. ,
errP, Pa 0.1 0.2 0.3
C..W cffla0b5
50 17 24 30
100 29 44 57
200 56 87 113
300 83 130 168
400 110 173 224
lote: each entry equals the square root of the ‘sum of 100 and the corresponding Table 2 entry.
Table 4. Uncertainties in return leakage (errQ,{,,~ for the inside-air method, using Equation 19for selected values of envelope leakage and measurement uncertainty of pressures and air-flows.
errQ,,,,k, cfm, inside-air method
errP, Pa 0.1 0.2 0.3
C.nv, cfrn/Pa0”b5
50 19-24 30-33 39-42
100 39-41 61-62 79-80
200 78-79 122 159
300 117 183 237
400 156 245 317
Note: The smaller number in each cell is for correlated Q[,~and Q,,~,,,and is equal to the squareroot of twice the corresponding Table 2 entry. The larger number in each cell is for uncorrelated
Q,, and Qb4,, and equals the square root of the sum of 200 and twice the corresponding Table 2entry, or/2 times the corresponding Table 3 entry. Where there is only one number in a cell, thecorrelated and uncorrelated values were the same.
19
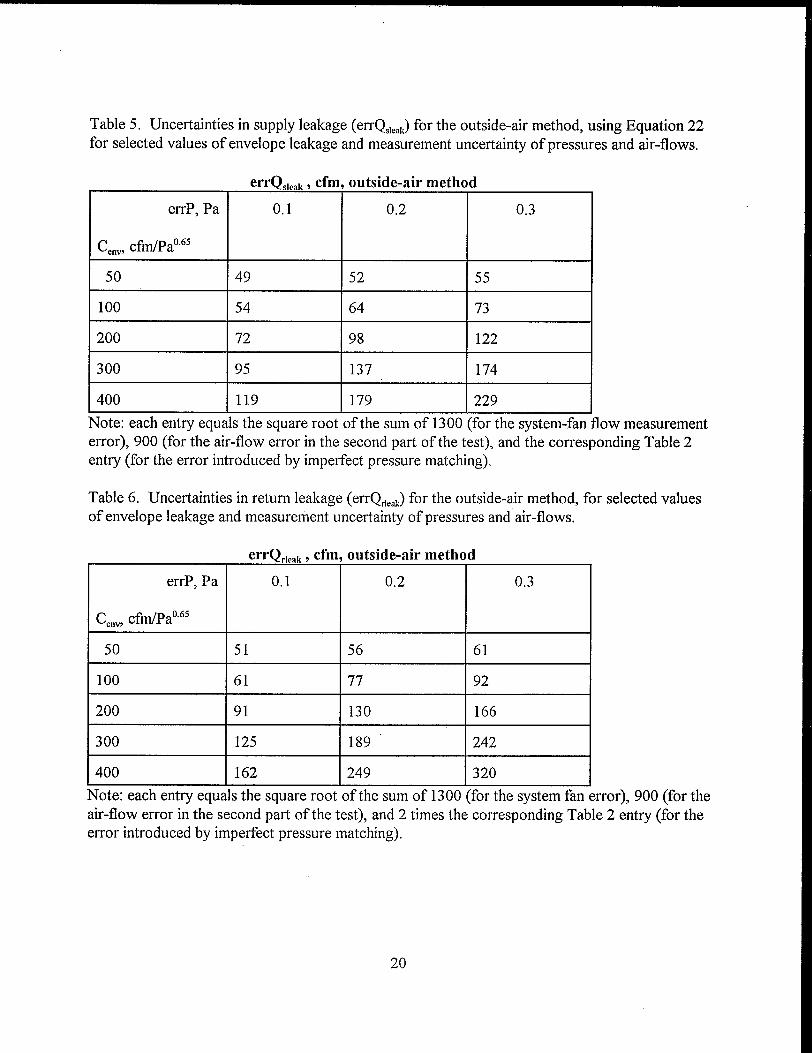
Table5. Uncefiainties insupply leakage (errQ,l,,~) fortheoutside-air method, using Equation22for selected values of envelope leakage and measurement uncertainty of pressures and air-flows.
errP, Pa
C,nv,cf~a0G5
50
100
200
300
400
errQ,leak~cfm
0.1
49
54
72
95
119
outside-air method
0.2 0.3
52 55
137 174
179 229
low measurement1
Note: each entry equals the square root of the sum of 1300 (for the system-fanerror), 900 (for the air-flow error in the second part of the test), and the corresponding Table 2entry (for the error introduced by imperfect pressure matching),
Table 6. Uncertainties in return leakage (errQ,l,,~) for the outside-air method, for selected valuesof envelope leakage and measurement uncertainty of pressures and air-flows.
erro.,..,. . cfm. outsirie-nir method_.—=1 lWIK 7 -– ---7
. . . . . . ..- . . . . . ------- —
errP, Pa 0.1 0.2 0.3
C,nv cfm/Pa0G5
50 51 56 61
100 61 77 92
200 91 130 166
300 125 189 242
400 162 249 320
Note: each entry equals the square root of the sum of 1300 (for the system fan error), 900 (for theair-flow error in the second part of the test), and 2 times the corresponding Table 2 entry (for theerror introduced by imperfect pressure matching).
20
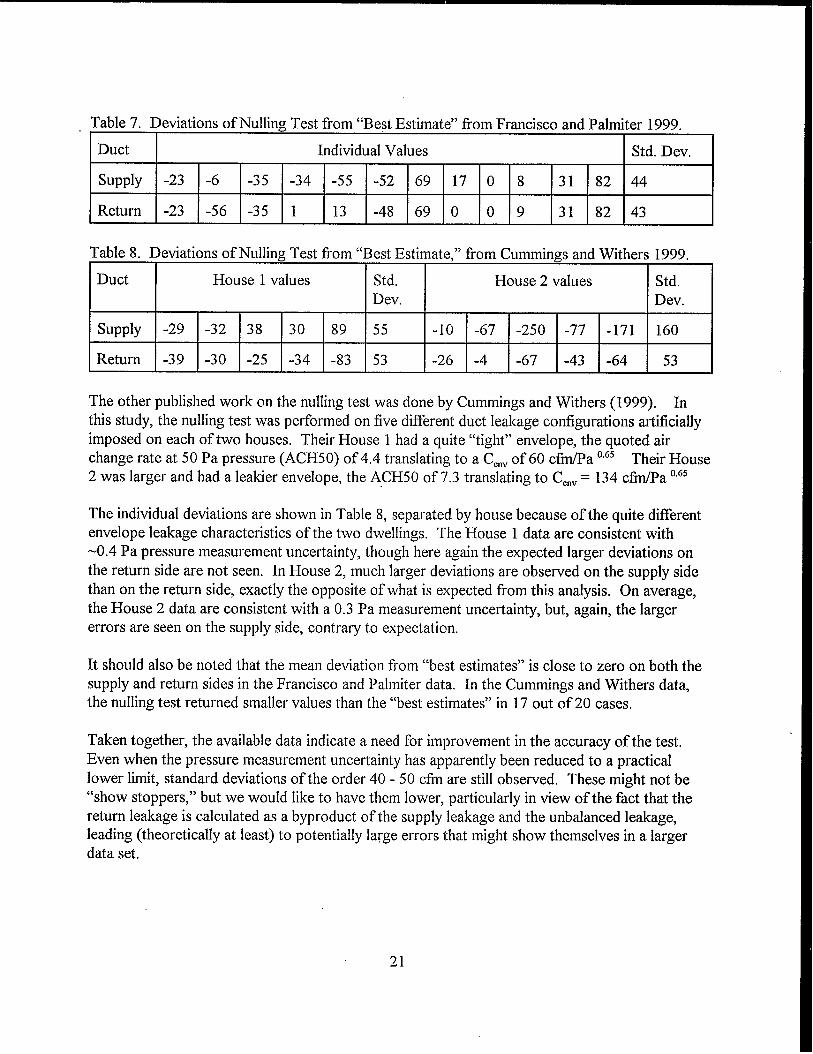
Table 7. Deviations of Nulling Test from “Best Estimate” from Francisco and Palmiter 1999.
Duct Individual Values Std. Dev.
supply -23 -6 -35 -34 -55 -52 69 17 0 8 31 82 44
Return -23 -56 -35 1 13 -48 69 0 0 9 31 82 43
Table 8. Deviations of Nulling Test from “Best Estimate,” from Cummings and Withers 1999.
Duct House 1 values Std. House 2 values Std.Dev. Dev.
supply -29 -32 38 30 89 55 -lo -67 -250 -77 -171 160
Return -39 -30 -25 -34 -83 53 -26 -4 -67 -43 -64 53
The other published work on the nulling test was done by Cummings and Withers (1 999). Inthis study, the nulling test was petiormed on five different duct leakage configurations artificiallyimposed on each of two houses. Their House 1 had a quite “tight” envelope, the quoted airchange rate at 50 Pa pressure (ACH50) of 4.4 translating to a C~nvof 60 cffla 0“65 Their House2 was larger and had a leakier envelope, the ACH50 of 7.3 translating to C~nv= 134 cfm/Pa 0.65
The individual deviations are shown in Table 8, separated by house because of the quite differentenvelope leakage characteristics of the two dwellings. The House 1 data are consistent with-0.4 Pa pressure measurement uncertainty, though here again the expected larger deviations onthe return side are not seen. In House 2, much larger deviations are observed on the supply sidethan on the return side, exactly the opposite of what is expected from this analysis. On average,the House 2 data are consistent with a 0.3 Pa measurement uncertainty, but, again, the largererrors are seen on the supply side, contrary to expectation,
It should also be noted that the mean deviation from “best estimates” is close to zero on both thesupply and return sides in the Francisco and Palmiter data. In the Cummings and Withers data,the nulling test returned smaller values than the “best estimates” in 17 out of 20 cases.
Taken together, the available data indicate a need for improvement in the accuracy of the test.Even when the pressure measurement uncertainty has apparently been reduced to a practicallower limit, standard deviations of the order 40-50 cfm are still observed. These might not be“show stoppers,” but we would like to have them lower, particularly in view of the fact that thereturn leakage is calculated as a byproduct of the supply leakage and the unbalanced leakage,leading (theoretically at least) to potentially large errors that might show themselves in a largerdata set.
21
CONCLUSIONS
1. The major conclusion of this report is that, except for very tight envelopes, experimentaluncertainties in the inside-air method of the nulling test will be driven by the value of the envelopeleakage flow coefllcient and by the uncertainty in the pressure-matching process, rather than byerrors in measuring the air flow rates across the envelope.
2. The outside-air method adds two significant additional sources of error: the uncetiainty in thesystem fan flow rate and the uncertainty in the air flow rate across the envelope during the secondpart of the test that measures supply leakage.
3. The calculated uncertainties are broadly consistent with those extracted from the limited fielddata currently available. However, the expected greater uncertainty in the return leakage (ascompared with the uncertainty in the supply leakage) was not seen in the comparison of thereferenced data with the researchers’ “best estimate” duct leakage values. It is not known to whatextent this is due to: a) statistical fluctuation; b) an artifact of the procedures used by thereferenced experimenters in choosing their “best estimate” duct leakage rates for comparison; orc) some significant factor that was not captured in this analysis.
4. Except for the case of well-controlled pressure matching in very tight envelopes, the calculateduncertainties are sufficiently large to warrant a search for ways to reduce them. There is a needfor fhrther field work on the nulling test to assess the magnitude of the uncertainties, to comparethese with theoretical analyses such as this one, and to determine whether the uncertainties in thenulling test can be reduced in any practical way.
POSSIBLE FURTHER DEVELOPMENT OF THE NULLING TEST
Can the nulling test be made more accurate? Although that question cannot be answered in this
report, it is appropriate to offer some suggestions for how this might be done. Several of theseinvolve combining data from the nulling test with information from other duct leakage tests, toover constrain the solution in what has elsewhere been called the “data cross-check” approach(Andrews 1998). There is reason to focus in particular on the return duct, since that side of thesystem is not directly measured in the nulling test.
1. One approach would be to use the same procedure that Palmiter and Francisco (1999)employed to obtain their “best estimate” leakage rates. Here it is suggested that if in the interestsof economy of effort the procedure can only be done on one side of the duct system, the priorityshould be given to the return side, in part for the above-stated reason that the return leakage isotherwise only indirectly measured in the nulling test, but also because the return side has fewerregisters and the Francisco-Pahniter “best-estimate” procedure would therefore be easier to do onthat side. The percentage errors in this method will be lower if the return side is leaky than if it istight. This method can be summarized as follows:
22
A.
B.
c.
D.
E.
Measure the air flow into the return register(s) with a flow hood.
Subtract this from the system fan flow to obtain total return leakage. (Make sure the flowhood used in A is calibrated against the duct blower used in B to minimize equipmentcalibration bias.)
Measure the total leakage flow coeticient for the return duct with a duct blower.
Use the above information to obtain a “best estimate” of the return-side operatingpressure.
Measure the leakage flow coefilcient between the return duct and the outside by bringingboth the house and the duct to the same pressure, and combine that with the “best - -estimate” operating pressure to obtain the return-side leakage from outside, as describedin ASHRAE 1999.
2. If one side of the system is relatively “tight,” then the air leakage rate on that side can beaccurately measured (as a fraction of system fan flow) using fan pressurization, even if theoperating pressure in the duct is only approximately known. This will be particularly helpfbl ifthe return side is the “tight” side. This procedure could be usefil in testing systems with platformreturns.
3. It might also prove usefil to cross-check the unbalanced leakage as obtained using the firstpart of the nulling test against the value for this same quantity as obtained using the housepressure test. Although the use of the house pressure testis limited in ASHRAE 1999 to asubset of all houses meeting certain criteria, the first part of this test is probably more generallyapplicable. The unbalanced-leakage part of the house pressure test is easy to do, and may providea usefi.d adjunct to the information gained from the nulling test.
4. The fourth suggestion is in a different genre from the above. It might be possible to make thepressure matching more precise by measuring the air flows over a range of house pressures thatincludes the target pressure. This would provide a multiplicity of pressure and air-flow valuesthat could be plotted on a graph and used in some type of least-squares fit. Interspersed withthese measurements, the house pressure with the system fan off could be measured to get amultiplicity of values for the target pressure. These multiple values of the target pressure and theair flow vs. house pressure curve could help to even out random fluctuations caused by wind.Finally, at some point in the test, a comparison of the fan-off house pressure with and withoutblocked registers could remove any bias from that source.
It is recognized that some of these suggestions may add significantly to the labor content of thetest, and so may not be appropriate for anything but research. Nevertheless, the possibilityremains that a diagnostic-type test might yet be distilled out of these ideas. Even if that proves to
23
be infeasible, the availability of multiple tests from a research standpoint can be extremely valuablein any effort to validate individual tests, as each test helps to cross-check the others.
ACKNOWLEDGMENTS
This work was supported by the OffIce of Building Technologies, State and Community Programs(13TS) of the U.S. Department of Energy, for which I am gratefl.d. I thank Esher Kweller of BTSfor his support and encouragement over the years. I thank Paul Francisco of Ecotope, Inc. andJim Cummings of the Florida Solar Energy Center for their cooperation in publishing sufficientdata from their projects to enable the comparisons in this report,
REFERENCES
Andrews, J.W., R,L. Hedrick, M.R. Lubliner, B.P. Reid, B.L. Pierce, and D.W. Saum. 1998.Reproducibility of ASHRAE Standard 152P: Results of a Round-Robin Test. ASHRAETransactions V. 104, Pt. IB, pp. 1376-1388.
Andrews, J.W. 1998. Error Reduction in Duct Leakage Testing Through Data Cross-Checks.BNL-66 147, December.
Andrews, J.W. 2000. Measurement Uncertainties in the Delta Q Test for Duct Leakage.Brookhaven National Laboratory report in preparation.
ASHRAE 1999. Standard 152P: Method of Test for Determining the Design and SeasonalEfficiencies of Residential Thermal Distribution Systems. American Society of Heating,Refrigerating, and Air-Conditioning Engineers, Inc., Atlanta, GA. May.
Cummings, J.B. and C.R. Withers, 1999. Assessment of the Duct Leakage Estimation Proceduresof the Standard and Alternative Test Methodologies of ASHRAE 152P. FSEC-CR- 1135-99.December.
Francisco, P.W. and Palmiter, L. 1999. Field Validation of ASHRAE Standard 152. Ecotope,Inc., Seattle, WA. ASHR.AE Project 1056-RP Final Report. October.
24
Fan/flow-meter Fan-Off House
100+cfm Pressure Matched. .
r System
; +1 +’$Fan
Return leaks Supply leak
Fan/flow-meter
150+cf m
Air-tightflex-ductO’to inside
Fan-Off HousePressure Matched
Barrier cfm
Part 2
\\
\ \\ .—— —
supplyPlenumPressureMatched
I
I
I
I
I.
I
I
I
I
I——— .
second fan/f lowtmter
Figure 1. Schematic of Nulling Test Setup,
25