Embed Size (px)
Citation preview
B M O N E S B I T T B U R N S
JUNE 30, 2012
BMO Nesbitt Burns Group of Funds
Semi-Annual Financial StatementsBMO NESBITT BURNS BALANCED PORTFOLIO FUND
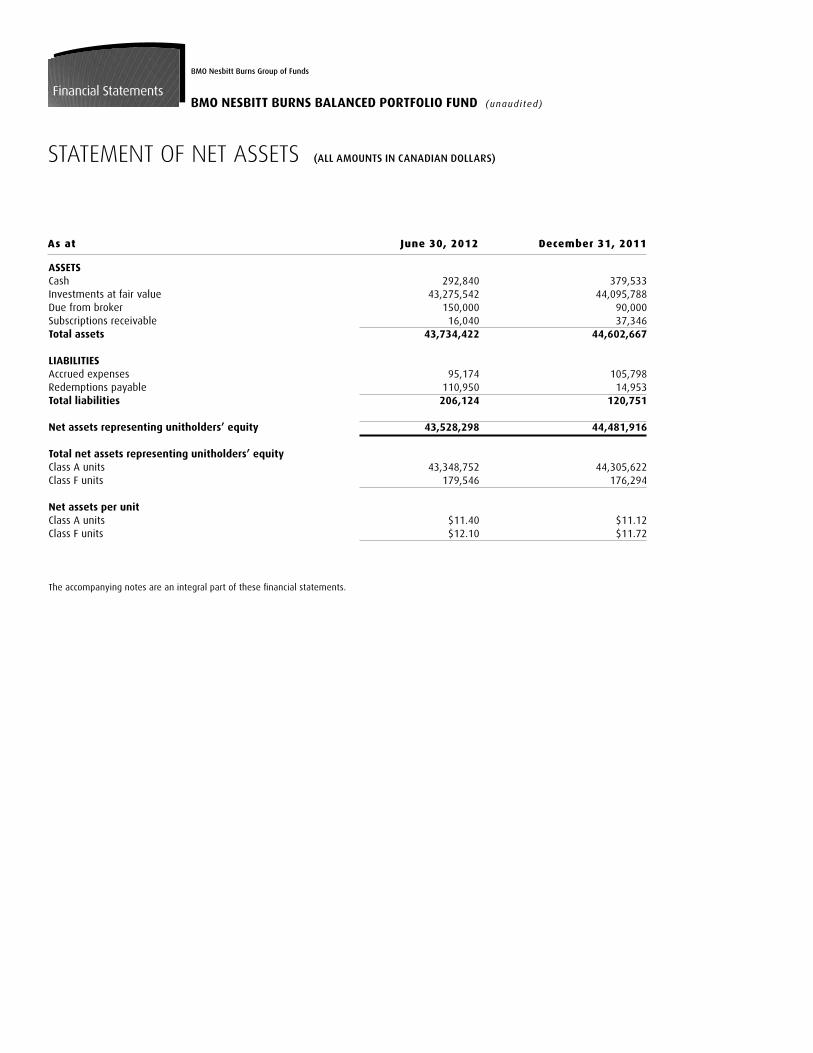
As at June 30, 2012 December 31, 2011
STATEMENT OF NET ASSETS (all amounts in Canadian dollars)
Financial Statements
Bmo nesbitt Burns Group of Funds
BMO NESBITT BURNS BALANCED PORTFOLIO FUND (unaudi ted)
ASSETSCash 292,840 379,533 Investments at fair value 43,275,542 44,095,788 Due from broker 150,000 90,000Subscriptions receivable 16,040 37,346Total assets 43,734,422 44,602,667 LIABILITIES Accrued expenses 95,174 105,798Redemptions payable 110,950 14,953Total liabilities 206,124 120,751 Net assets representing unitholders’ equity 43,528,298 44,481,916
Total net assets representing unitholders’ equity Class A units 43,348,752 44,305,622Class F units 179,546 176,294
Net assets per unit Class A units $11.40 $11.12Class F units $12.10 $11.72
The accompanying notes are an integral part of these financial statements.
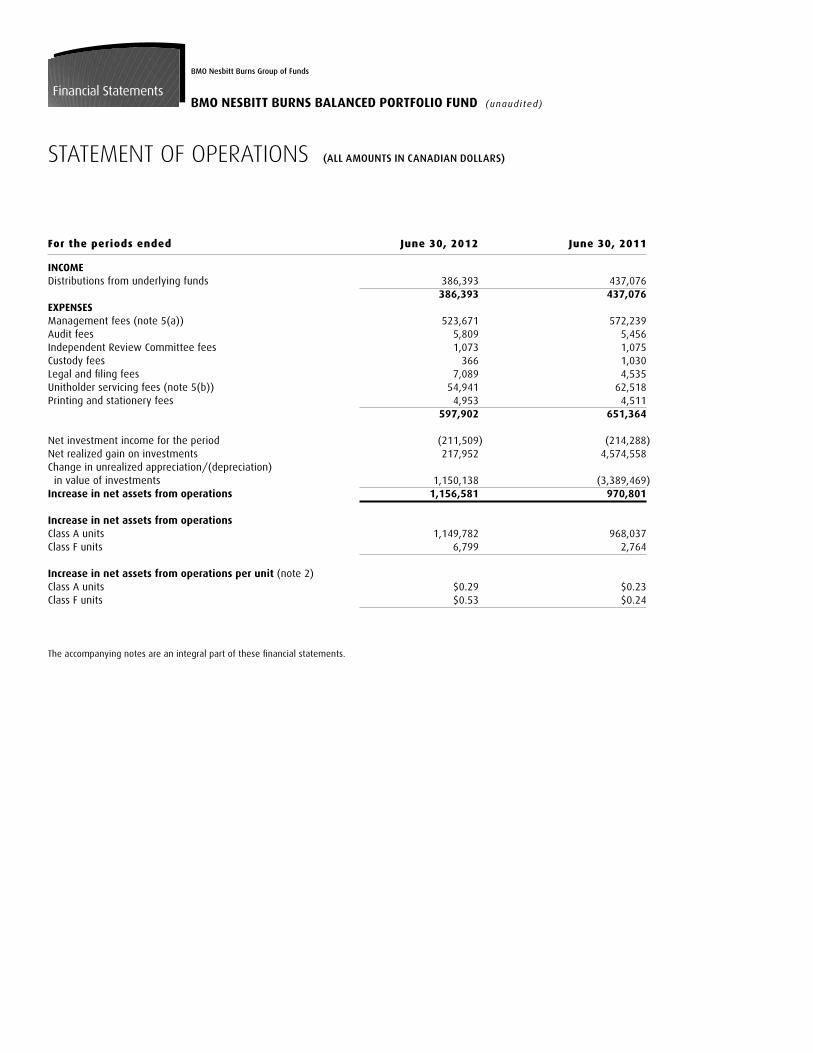
For the periods ended June 30, 2012 June 30, 2011
STATEMENT OF OPERATIONS (all amounts in Canadian dollars)
Financial Statements
Bmo nesbitt Burns Group of Funds
BMO NESBITT BURNS BALANCED PORTFOLIO FUND (unaudi ted)
INCOMEDistributions from underlying funds 386,393 437,076 386,393 437,076EXPENSESManagement fees (note 5(a)) 523,671 572,239Audit fees 5,809 5,456Independent Review Committee fees 1,073 1,075Custody fees 366 1,030Legal and filing fees 7,089 4,535Unitholder servicing fees (note 5(b)) 54,941 62,518Printing and stationery fees 4,953 4,511 597,902 651,364 Net investment income for the period (211,509) (214,288)Net realized gain on investments 217,952 4,574,558Change in unrealized appreciation/(depreciation) in value of investments 1,150,138 (3,389,469)Increase in net assets from operations 1,156,581 970,801
Increase in net assets from operationsClass A units 1,149,782 968,037Class F units 6,799 2,764
Increase in net assets from operations per unit (note 2)Class A units $0.29 $0.23Class F units $0.53 $0.24
The accompanying notes are an integral part of these financial statements.
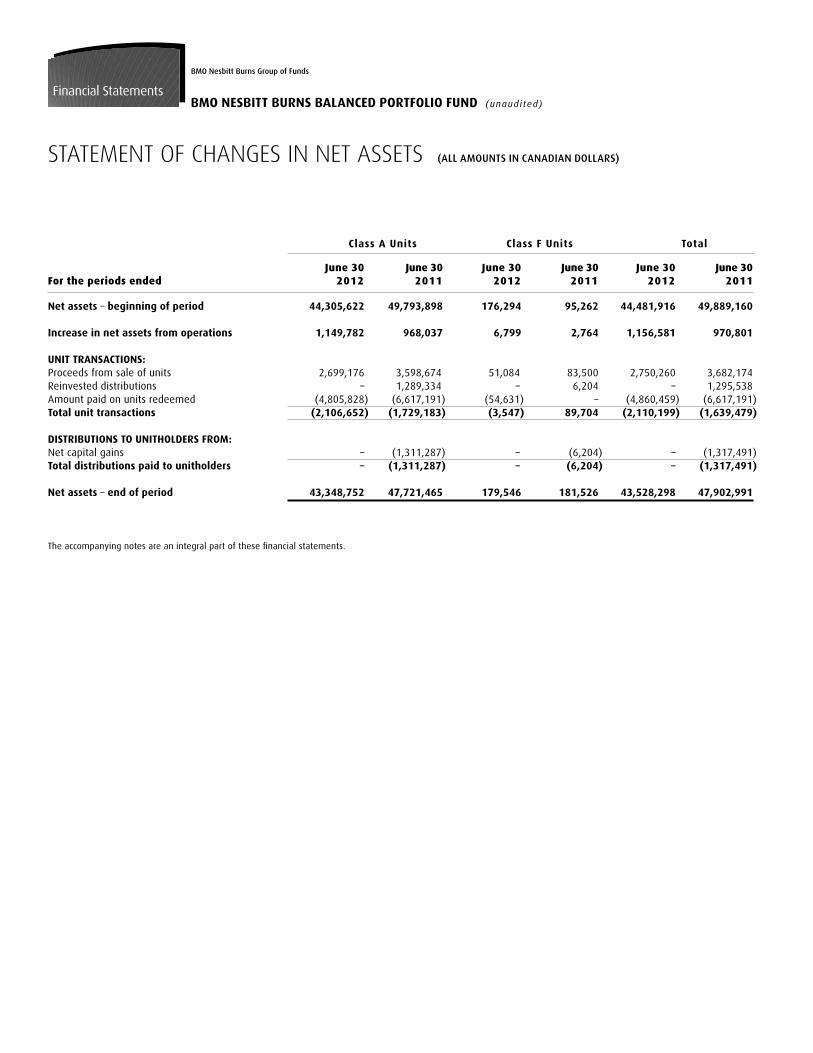
STATEMENT OF CHANGES IN NET ASSETS (all amounts in Canadian dollars)
Financial Statements
Bmo nesbitt Burns Group of Funds
BMO NESBITT BURNS BALANCED PORTFOLIO FUND (unaudi ted)
Net assets – beginning of period 44,305,622 49,793,898 176,294 95,262 44,481,916 49,889,160
Increase in net assets from operations 1,149,782 968,037 6,799 2,764 1,156,581 970,801
UNIT TRANSACTIONS:Proceeds from sale of units 2,699,176 3,598,674 51,084 83,500 2,750,260 3,682,174 Reinvested distributions – 1,289,334 – 6,204 – 1,295,538 Amount paid on units redeemed (4,805,828) (6,617,191) (54,631) – (4,860,459) (6,617,191)Total unit transactions (2,106,652) (1,729,183) (3,547) 89,704 (2,110,199) (1,639,479) DISTRIBUTIONS TO UNITHOLDERS FROM: Net capital gains – (1,311,287) – (6,204) – (1,317,491)Total distributions paid to unitholders – (1,311,287) – (6,204) – (1,317,491) Net assets – end of period 43,348,752 47,721,465 179,546 181,526 43,528,298 47,902,991
The accompanying notes are an integral part of these financial statements.
Class A Units Class F Units Total
June 30 June 30 June 30 June 30 June 30 June 30 For the periods ended 2012 2011 2012 2011 2012 2011
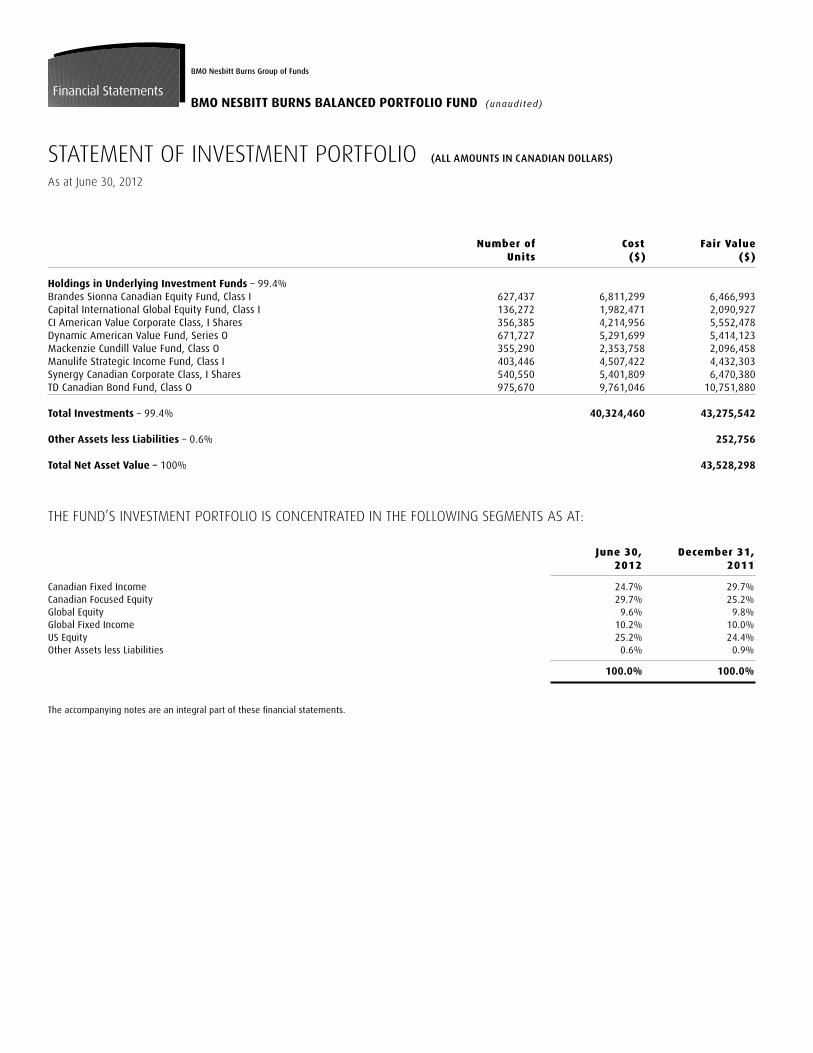
STATEMENT OF INVESTMENT PORTFOLIO (all amounts in Canadian dollars)
As at June 30, 2012
Financial Statements
Bmo nesbitt Burns Group of Funds
BMO NESBITT BURNS BALANCED PORTFOLIO FUND (unaudi ted)
Number of Cost Fair Value Units ($) ($)
Holdings in Underlying Investment Funds – 99.4%Brandes Sionna Canadian Equity Fund, Class I 627,437 6,811,299 6,466,993 Capital International Global Equity Fund, Class I 136,272 1,982,471 2,090,927 CI American Value Corporate Class, I Shares 356,385 4,214,956 5,552,478 Dynamic American Value Fund, Series O 671,727 5,291,699 5,414,123 Mackenzie Cundill Value Fund, Class O 355,290 2,353,758 2,096,458 Manulife Strategic Income Fund, Class I 403,446 4,507,422 4,432,303 Synergy Canadian Corporate Class, I Shares 540,550 5,401,809 6,470,380 TD Canadian Bond Fund, Class O 975,670 9,761,046 10,751,880 Total Investments – 99.4% 40,324,460 43,275,542 Other Assets less Liabilities – 0.6% 252,756 Total Net Asset Value – 100% 43,528,298
THE FUND’S INVESTMENT PORTFOLIO IS CONCENTRATED IN THE FOLLOWING SEGMENTS AS AT:
June 30, December 31, 2012 2011
Canadian Fixed Income 24.7% 29.7%Canadian Focused Equity 29.7% 25.2%Global Equity 9.6% 9.8%Global Fixed Income 10.2% 10.0%US Equity 25.2% 24.4%Other Assets less Liabilities 0.6% 0.9%
100.0% 100.0%
The accompanying notes are an integral part of these financial statements.
BMO Nesbitt Burns Group of FundsNotes to Financial Statements
JUNE 30, 2012BMO NESBITT BURNS BALANCED PORTFOLIO FUND (unaudi ted)
1. THE FUND
BMO Nesbitt Burns Balanced Portfolio Fund (the “Fund”) is an open-ended mutual fund trust established under the laws of the province of Ontario and is governed by a Master Declaration of Trust dated November 1, 2004, amended October 31, 2008. The Fund is authorized to issue an unlimited number of units in an unlimited number of classes. Each class is intended for different kinds of investors and has different management fees. Refer to Note 8(a) for the classes issued in this Fund and the respective launch dates, and Note 8(d) for management fee rates for each class.
BMO Nesbitt Burns Inc. (the “Manager”) is responsible for the management of the Fund. The Manager is a wholly-owned subsidiary of the Bank of Montreal.
Class A units are available to all investors.
Class F units are available for purchase by investors who are enrolled in dealer sponsored wrap programs or flat fee accounts. Instead of paying a commission on each transaction, these investors pay an annual fee to the Manager based on the value of their assets.
The information provided in these unaudited financial statements is for the periods ended June 30, 2012 and 2011, except for the comparative information in the Statement of Net Assets and the related notes, which are as at December 31, 2011. Financial information provided for a class established during the period(s) is presented from the launch date as noted in Note 8(a), as applicable.
2. SUMMARy OF SIgNIFICANT ACCOUNTINg POLICIES
These interim financial statements have been prepared in accordance with Canadian generally accepted accounting principles (“Canadian GAAP”), including estimates and assumptions made by management that may affect the reported amounts of assets, liabilities, income and expenses during the reported periods. Actual results could differ from estimates.
Valuation of investments
Canadian GAAP requires the use of bid prices for long positions and ask prices for short positions in the fair valuation of investments traded in an active market, rather than the use of closing prices currently used for the purpose of determining Net Asset Value (“NAV”). For investments that are not traded in an active market, Canadian GAAP requires the use of valuation techniques, incorporating factors that market participants would consider in setting a price.
The NAV is the fair value of the total assets of a fund less the fair value of its total liabilities at a Valuation Date (the “Valuation Date” is each day on which the Toronto Stock Exchange is opened for trading) determined in accordance with Part 14 of National Instrument 81-106 – Investment Fund Continuous Disclosure (“NI 81-106”) for the purpose of processing unitholder transactions. For financial statement purposes, valuations are determined in accordance with Canadian GAAP. This may result in a difference between the Net Assets per unit for each class and the NAV per unit for each class. Refer to Note 8(b) for details of the comparison between NAV per unit and Net Assets per unit for each class.
Investments are deemed to be held for trading. Investments are recorded at their fair value with the change between this amount and average cost being recorded as unrealized appreciation (depreciation) in value of investments in the Statement of Operations.
Securities listed on a recognized public securities exchange in North America are valued for financial statement purposes at their bid prices for long positions and ask prices for short positions. Procedures are in place to fair value securities traded in countries outside of North America daily, to avoid stale prices and to
take into account, among other things, any significant events occurring after the close of a foreign market. The Manager uses fair value pricing when the price of a security held in the Fund is unavailable, unreliable or not considered to reflect the current value, and may determine another value which it considers to be fair and reasonable using the services of third-party valuation service providers, or using a valuation technique that, to the extent possible, makes maximum use of inputs and assumptions based on observable market data including volatility, comparable companies and other applicable rates or prices.
For bonds, debentures, asset-backed securities and other debt securities, the fair value represents the bid price provided by independent security pricing services. Short-term investments are included in the Statement of Investment Portfolio at their fair value. Mutual Fund units held as investments are valued at their respective NAVs on each Valuation Date, as these values are the most readily and regularly available.
Investment transactions
Investment transactions are accounted for on the trade date. Realized gains (losses) from the sale of investments and unrealized appreciation (depreciation) in the value of investments are calculated with reference to the average cost of the related investments which exclude brokerage commissions and other trading expenses. All net realized gains (losses), unrealized appreciation (depreciation) in value, and transaction costs are attributable to investments and derivative instruments which are deemed held for trading, and are included in the Statement of Operations.
Client brokerage commissions, where applicable, are used as payment for order execution services or research services. The portfolio advisers or the Manager may select brokers, including their affiliates, who charge commission in excess of that charged by other brokers (“soft dollars”) if they determine in good faith that the commission is reasonable in relation to the order execution and research services utilized. It is the Manager’s objective that over time, all clients receive benefits from client brokerage commissions.
Transaction costs, such as brokerage commissions (if any), incurred in the purchase and sale of securities by the Fund are expensed and included in “Commissions and other portfolio transaction costs” in the Statement of Operations.
Cost of investments
The cost of investments represents the amount paid for each security and is determined on an average cost basis.
Income recognition
Interest income is recognized on accrual basis. Dividend income and distri-butions from investment trust units are recognized on the ex-dividend date and ex-distribution date respectively.
Distributions received from investment fund holdings are recognized by the Fund in the same form in which they were received from the underlying funds.
Translation of foreign currencies
The fair value of investments and other assets and liabilities denominated in foreign currencies are translated into the Fund’s functional currency, the Canadian Dollar, at the rates of exchange prevailing at the period-end date. Purchases and sales of investments, and income and expenses are translated at the rates of exchange prevailing on the respective dates of such transactions. Foreign exchange gains (losses) on completed transactions are included in “Realized gain (loss) on investments” and unrealized foreign exchange gains
BMO Nesbitt Burns Group of FundsNotes to Financial Statements
JUNE 30, 2012BMO NESBITT BURNS BALANCED PORTFOLIO FUND (unaudi ted)
(losses) are included in “Change in unrealized appreciation (depreciation) in value of investments” in the Statement of Operations. Realized and unrealized foreign exchange gains (losses) on assets (other than investments) and liabilities are included in “Realized/unrealized gain (loss) on foreign exchange”, respectively, in the Statement of Operations.
Increase or decrease in net assets from operations per unit
“Increase (decrease) in net assets from operations per unit” of a class in the Statement of Operations represents the increase (decrease) in net assets from operations attributable to the class, divided by the weighted average number of units of the class outstanding during the period.
Short-term trading penalty
To discourage excessive trading, the Fund may, at the Manager’s sole discretion, charge a short-term trading penalty. This penalty is paid directly to the Fund and is included in “Interest” in the Statement of Operations, if any.
Other assets and liabilities
Income receivable, subscriptions receivable, and due from broker are designated as loans and receivables and recorded at cost or amortized cost. Similarly, amounts due to broker, accrued expenses and redemptions payable are designated as financial liabilities and reported at cost or amortized cost. Other assets and liabilities are short-term in nature, and are carried at cost or amortized cost, which approximates fair value.
3. UNIT VALUATION
Units of the Fund are offered for sale on a continuous basis and may be purchased or redeemed on any Valuation Date at the NAV per unit of a particular class. The NAV per unit of a class for the purposes of subscription or redemption is computed by dividing the NAV of the Fund attributable to the class (that is, the total value of the assets attributable to the class less the liabilities attributable to the class) by the total number of units of the class of the Fund outstanding at such time. This amount may be different from the Net Assets per unit of a class calculation, which is presented on the Statement of Net Assets. Generally, any differences are due to valuing actively traded securities at bid prices for Canadian GAAP purposes while NAV typically utilizes closing price to determine value for the purchase and redemption of units. See Note 8(b) for details of the comparison between NAV per unit and Net Assets per unit for each class.
Expenses directly attributable to a class are charged to that class. Other expenses, income, realized and unrealized gains and losses from investment transactions are allocated proportionately to each class based upon the relative NAV of each class.
Capital
The capital of the Fund is represented by issued and redeemable units with no par value. The units are entitled to distributions, if any, and to payment of a proportionate share based on the Fund’s NAV per unit upon redemption. The Fund has no restrictions or specific capital requirements on the subscriptions and redemptions of units except as disclosed in Note 8(a), if any. The relevant movements in capital are shown on the Statement of Changes in Net Assets. In accordance with its investment objectives and strategies, and the risk management practices outlined in Note 6, the Fund endeavours to invest the subscriptions received in appropriate investments while maintaining sufficient liquidity to meet redemptions, such liquidity being augmented by short-term borrowings or disposal of investments where necessary.
4. TAXES
Income taxes
The Fund qualifies as a mutual fund trust under the provisions of the Income Tax Act (Canada) (the “Tax Act”). Distributions of all net taxable income and sufficient amounts of net realized capital gains for each taxation year will be paid to unitholders. Part of the Fund’s net income and net realized capital gains not paid or payable, is subject to income tax. It is the intention of the Fund to distribute all of its income and sufficient net realized capital gains so that the Fund will not be subject to income tax. Income tax on net realized capital gains not paid or payable is generally recoverable by virtue of refunding provisions contained in tax legislation, as redemptions occur.
Non-capital losses that arose in 2004 and 2005 are available to be carried forward for ten years and applied against future taxable income. Non-capital losses that arose in 2006 and thereafter are available to be carried forward for twenty years. Capital losses for income tax purposes may be carried forward indefinitely and applied against capital gains realized in future years.
The Fund’s available non-capital and capital losses for income tax purposes as of the tax year ended December 2011 are included in Note 8(c), if applicable.
5. RELATED PARTy TRANSACTIONS
(a) Management feesThe Manager is responsible for the day-to-day management of the Fund and its investment portfolio in compliance with the Fund’s constating documents. The Manager monitors and evaluates the performance of the Fund, pays for the investment management services of the investment advisors and provides all related administrative services required by the Fund. As compensation for its services the Manager is entitled to receive a fee payable monthly, calculated at the maximum annual rates included in Note 8(d).
The Manager may, in some years and in certain cases, absorb a portion of management fees and other operating expenses of the Fund or class of the Fund. The decision to absorb these expenses is reviewed periodically and determined at the discretion of the Manager, without notice to unitholders.
(b) Unitholder servicingThe Fund is provided with certain facilities and services by the Manager and its affiliates. A portion of the unitholder servicing expenses include expenses incurred in the administration of the Fund that were paid to Bank of Montreal Ireland p.l.c.
Refer to Note 8(d) for related party fees charged to the Fund for the periods ended June 30, 2012 and 2011.
(c) Initial investmentsIn order to establish a new fund, the Manager makes an initial investment in the Fund. Pursuant to the policies of the Canadian Securities Administrators, an initial investor cannot redeem its investments until an additional $500,000 has been received from other investors with respect to the same class of units. Refer to Note 8(d) for the investment in units of the Fund held by the Manager as at June 30, 2012 and December 31, 2011 where applicable.
d) Other related party transactionsFrom time to time, the Manager may on behalf of the Fund enter into transactions or arrangements with or involving other members of the Bank of Montreal Group of Companies, or certain other persons or companies that are related or connected to the Manager of the Fund. These transactions or arrangements may include transactions or arrangements with or involving the Bank of Montreal Group of Companies, BMO Harris Investment Management Inc., BMO Asset Management Inc., BMO InvestorLine Inc., HIM Monegy Inc., BMO Trust Company, Pyrford International Ltd. or other investment funds
BMO Nesbitt Burns Group of FundsNotes to Financial Statements
JUNE 30, 2012BMO NESBITT BURNS BALANCED PORTFOLIO FUND (unaudi ted)
offered by BMO, and may involve the purchase or sale of portfolio securities through or from a member of Bank of Montreal Group of Companies, the purchase or sale of securities issued or guaranteed by a member of Bank of Montreal Group of Companies, the purchase or redemption of units of other BMO Mutual Funds or the provision of services to the Manager.
6. FINANCIAL INSTRUMENT RISk
The Fund may be exposed to a variety of financial risks that are concentrated in its investment holdings, including derivative instruments. The Statement of Investment Portfolio groups securities by asset type, geographic region and/or market segment. The Fund’s risk management practice includes the monitoring of compliance to investment guidelines.
The Manager manages the potential effects of these financial risks on the Fund’s performance by employing and overseeing professional and experienced portfolio managers that regularly monitor the Fund’s positions, market events and diversify investment portfolios within the constraints of the investment guidelines.
Where the Fund invests in other mutual fund(s), it may be indirectly exposed to the financial instruments risks of the underlying fund(s), depending on the investment objectives and the type of securities held by the underlying fund(s). The decision to buy or sell an underlying fund is based on the investment quidelines and positions, rather than the exposure of the underlying fund(s).
(a) Currency riskCurrency risk is the risk that the value of investments denominated in currencies, other than the functional currency of the Fund, will fluctuate due to changes in foreign exchange rates. All investments and derivative instruments, denominated in foreign currencies are identifiable on the Statement of Investment Portfolio. Investments in foreign markets are exposed to currency risk as the prices denominated in foreign currencies are converted to the Fund’s functional currency in determining fair value. The Fund may enter into forward currency contracts for hedging purposes to reduce foreign currency exposure or to establish exposure to foreign currencies. The Fund’s exposure to currency risk, if any, is further discussed in Note 8(f).
(b) Interest rate riskInterest rate risk is the risk that the fair value of the Fund’s interest-bearing investments will fluctuate due to changes in market interest rates. The Fund’s exposure to interest rate risk is concentrated in its investment in debt securities (such as bonds, money market instruments, short-term investments and debentures) and interest rate derivative instruments, if any. Other assets and liabilities are short-term in nature and/or non-interest bearing. The Fund’s exposure to interest rate risk, if any, is further discussed in Note 8(f).
(c) Other market riskOther market risk is the risk that the fair value of a financial instrument will fluctuate as a result of changes in market prices (other than those arising from interest rate risk or currency risk), whether those changes are caused by factors specific to the individual financial instrument or its issuer, or factors affecting all similar financial instruments traded in a market. Other assets and liabilities are monetary items that are short term in nature, and as such they are not subject to other market risk. The Fund’s sensitivity analysis incorporates the different methods of risk monitoring approaches used by the managers of the underlying portfolios, such as the use of beta or other assumptions of the relationship of the respective portfolios to other market prices. The Fund’s exposure to other market risk, if any, is further discussed in Note 8(f).
(d) Credit riskCredit risk is the risk that a loss could arise from a security issuer or counterparty to a financial instrument not being able to meet it’s financial obligations. The fair value of debt securities includes consideration of the credit worthiness of the
debt issuer. Credit risk exposure for over-the-counter derivative instruments, if any, is based on the Fund’s unrealized gain of the contractual obligations with the counterparty as at the reporting date. The credit exposure of other assets is represented by its carrying amount. The Fund’s exposure to credit risk, if any, is further discussed in Note 8(f).
(e) Liquidity riskThe Fund’s exposure to liquidity risk is concentrated in the daily cash redemptions of units. The Fund primarily invests in securities that are traded in active markets and can be readily disposed of. In addition, the Fund retains sufficient cash and cash equivalent positions to maintain liquidity. The Fund may, from time to time, enter into over the-counter derivative contracts or invest in unlisted securities, which are not traded in an organized market and may be illiquid. Securities for which a market quotation could not be obtained and may be illiquid are identified on the Statement of Investment Portfolio. The proportion of illiquid securities to the NAV of the Fund is monitored by the Manager to ensure it does not exceed the regulatory limit and does not significantly affect the liquidity required to meet the Fund’s financial obligations.
7. TRANSITION TO INTERNATIONAL FINANCIAL REPORTINg STANDARDS
In March 2011, the Canadian Accounting Standards Board (“AcSB”) amended its mandatory requirement for all Canadian publicly accountable enterprises to prepare their financial statements in accordance with International Financial Reporting Standards (“IFRS”) as issued by the International Accounting Standards Board (“IASB”), permitting investment companies, which include mutual funds, to defer the adoption of IFRS. On December 12, 2011, the AcSB decided to extend by one year the deferral from fiscal years beginning on or after January 1, 2013 to January 1, 2014.
The deferral of the mandatory IFRS changeover date to January 1, 2014 is to prevent Canadian investment companies and segregated accounts of life insurance enterprises from having to change their current accounting treatment for controlled investees while the IASB finalizes its proposed investment entities standard. Under IFRS 10 Consolidated Financial Statements, investment companies are required to consolidate their controlled investments. The IASB has issued an exposure draft that will exempt entities that qualify as investment entities from consolidating their controlled investments and requires such entities to record, with very limited exceptions, all of their investments at fair value through profit or loss account. This exposure draft is still under review. Canadian GAAP permits investment companies to fair value their investments regardless of whether those investments are controlled. The AcSB will continue to monitor the need to revise the IFRS changeover date for these entities.
The Fund has not elected to early adopt IFRS, therefore it will adopt IFRS effective January 1, 2014. The Fund expects to report its financial results for the six month period ending June 30, 2014 prepared on an IFRS basis. The Fund will also provide comparative data on an IFRS basis, including an opening balance sheet as at January 1, 2013. Further revisions by the AcSB to the IFRS adoption date for investment companies are possible.
The Manager has not identified any changes that will impact NAV per unit as a result of the changeover to IFRS. However, this determination is subject to change as the Manager finalizes its assessment of potential IFRS differences and as new standards are issued by the IASB prior to the Fund’s adoption of IFRS. The criteria contained within the IAS 32 Financial Instruments: Presentation standard may require unitholders’ equity to be classified as a liability within the Fund’s Statement of Net Assets, unless certain conditions are met. The Manager is currently assessing the Fund’s unitholder structure to confirm classification.
BMO Nesbitt Burns Group of FundsNotes to Financial Statements
JUNE 30, 2012BMO NESBITT BURNS BALANCED PORTFOLIO FUND (unaudi ted)
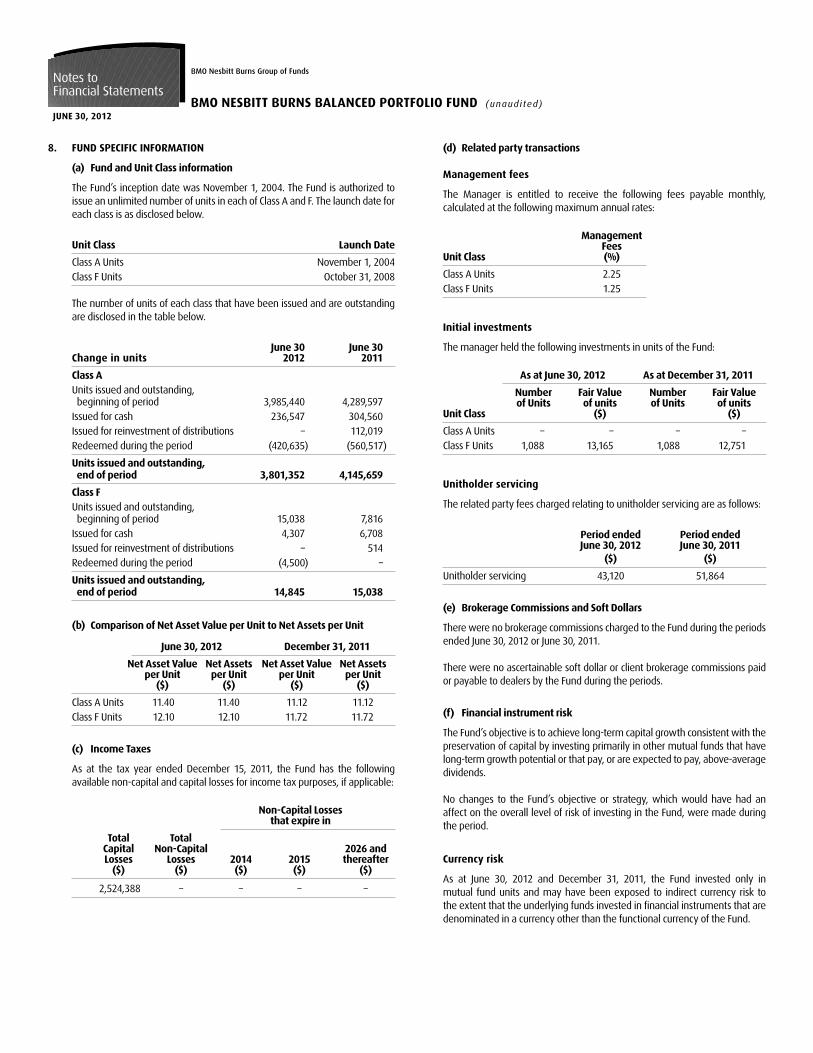
8. FUND SPECIFIC INFORMATION
(a) Fund and Unit Class information
The Fund’s inception date was November 1, 2004. The Fund is authorized to issue an unlimited number of units in each of Class A and F. The launch date for each class is as disclosed below.
Unit Class Launch Date
Class A Units November 1, 2004Class F Units October 31, 2008
The number of units of each class that have been issued and are outstanding are disclosed in the table below.
June 30 June 30Change in units 2012 2011
Class AUnits issued and outstanding, beginning of period 3,985,440 4,289,597Issued for cash 236,547 304,560Issued for reinvestment of distributions – 112,019Redeemed during the period (420,635) (560,517)
Units issued and outstanding, end of period 3,801,352 4,145,659
Class FUnits issued and outstanding, beginning of period 15,038 7,816Issued for cash 4,307 6,708Issued for reinvestment of distributions – 514Redeemed during the period (4,500) –
Units issued and outstanding, end of period 14,845 15,038
(b) Comparison of Net Asset Value per Unit to Net Assets per Unit
June 30, 2012 December 31, 2011
Net Asset Value Net Assets Net Asset Value Net Assets per Unit per Unit per Unit per Unit ($) ($) ($) ($)
Class A Units 11.40 11.40 11.12 11.12 Class F Units 12.10 12.10 11.72 11.72
(c) Income Taxes
As at the tax year ended December 15, 2011, the Fund has the following available non-capital and capital losses for income tax purposes, if applicable:
Non-Capital Losses that expire in
Total Total Capital Non-Capital 2026 and Losses Losses 2014 2015 thereafter ($) ($) ($) ($) ($)
2,524,388 – – – –
(d) Related party transactions
Management fees
The Manager is entitled to receive the following fees payable monthly, calculated at the following maximum annual rates:
Management FeesUnit Class (%)
Class A Units 2.25Class F Units 1.25
Initial investments
The manager held the following investments in units of the Fund:
As at June 30, 2012 As at December 31, 2011
Number Fair Value Number Fair Value of Units of units of Units of unitsUnit Class ($) ($)
Class A Units – – – –Class F Units 1,088 13,165 1,088 12,751
Unitholder servicing
The related party fees charged relating to unitholder servicing are as follows:
Period ended Period ended June 30, 2012 June 30, 2011 ($) ($)
Unitholder servicing 43,120 51,864
(e) Brokerage Commissions and Soft Dollars
There were no brokerage commissions charged to the Fund during the periods ended June 30, 2012 or June 30, 2011.
There were no ascertainable soft dollar or client brokerage commissions paid or payable to dealers by the Fund during the periods.
(f) Financial instrument risk
The Fund’s objective is to achieve long-term capital growth consistent with the preservation of capital by investing primarily in other mutual funds that have long-term growth potential or that pay, or are expected to pay, above-average dividends.
No changes to the Fund’s objective or strategy, which would have had an affect on the overall level of risk of investing in the Fund, were made during the period.
Currency risk
As at June 30, 2012 and December 31, 2011, the Fund invested only in mutual fund units and may have been exposed to indirect currency risk to the extent that the underlying funds invested in financial instruments that are denominated in a currency other than the functional currency of the Fund.
BMO Nesbitt Burns Group of FundsNotes to Financial Statements
JUNE 30, 2012BMO NESBITT BURNS BALANCED PORTFOLIO FUND (unaudi ted)
Interest rate risk
As at June 30, 2012 and December 31, 2011, the Fund invested only in mutual fund units and may have been exposed to indirect interest rate risk to the extent that the underlying funds invested in interest-bearing financial instruments.
Other market risk
As at June 30, 2012 and December 31, 2011, the Fund invested only in mutual fund units and may have been exposed to other market risk to the extent that the underlying funds invested in securities that trade on global markets. If the global markets increased or decreased by 10% as at the periods ended, with all other factors remaining constant, Net Assets could possibly have increased or decreased, respectively, by approximately $4,327,554 (December 31, 2011 – $4,409,579). In practice, actual results may differ from this sensitivity analysis and the difference could be material.
Credit risk
As at June 30, 2012 and December 31, 2011, the Fund invested only in mutual fund units and may have been exposed to indirect credit risk to the extent that the underlying funds invested in debt instruments, preferred securities and derivatives.
(g) Fair Value Hierarchy
There was no significant change in the composition of the Fund’s financial instruments levels as at June 30, 2012 compared to the classification as at December 31, 2011. Please refer to the December 31, 2011 audited annual financial statements for the disclosure of the Fund’s financial assets and liabilities into the fair value levels classification.
TRUSTEES
Richard Belley, Toronto, OntarioPatrick W. J. French, Oakville, OntarioMary Lafazanis, Scarborough, OntarioDarcy M. Lake, Toronto, OntarioJennifer Marks, Toronto, OntarioJamie Loughery, Newmarket, OntarioBruce Ferman, North York, Ontario William Brown, Toronto, Ontario
MANAGER, PROMOTER AND DISTRIBUTOR
BMO Nesbitt Burns Inc.1 First Canadian Place37th Floor, P.O. Box 150Toronto, OntarioM5X 1H3
INDEPENDENT AUDITORS
PricewaterhouseCoopers LLPPwC Tower18 York Street, Suite 2600Toronto, OntarioM5J 0B2
ClIENT SERvICES
Toll Free: 1-800-361-1392Fax: 1-866-486-2846
Email: [email protected]: www.bmonesbittburns.com
INvESTMENT ADvISORS
BMO Asset Management Inc.77 King Street WestSuite 4200Toronto, OntarioM5K 1J5
Harris Investment Management Inc.190 South LaSalle Street, 4th floorChicago, Illinois60690-0755
Pyrford International Limited79 Grosvenor StreetLondon, United KingdomW1K 3JU
® “BMO (M-bar roundel symbol)” is a registered trade-mark of Bank of Montreal, used under licence. ® “Nesbitt Burns” is a registered trade-mark of BMO Nesbitt Burns Corporation Limited, used under licence.