Embed Size (px)
Citation preview
1
BMO Nesbitt BurnsFebruary 2005
2
About Implats About Implats ……. the premier . the premier platinum investmentplatinum investment
2
3
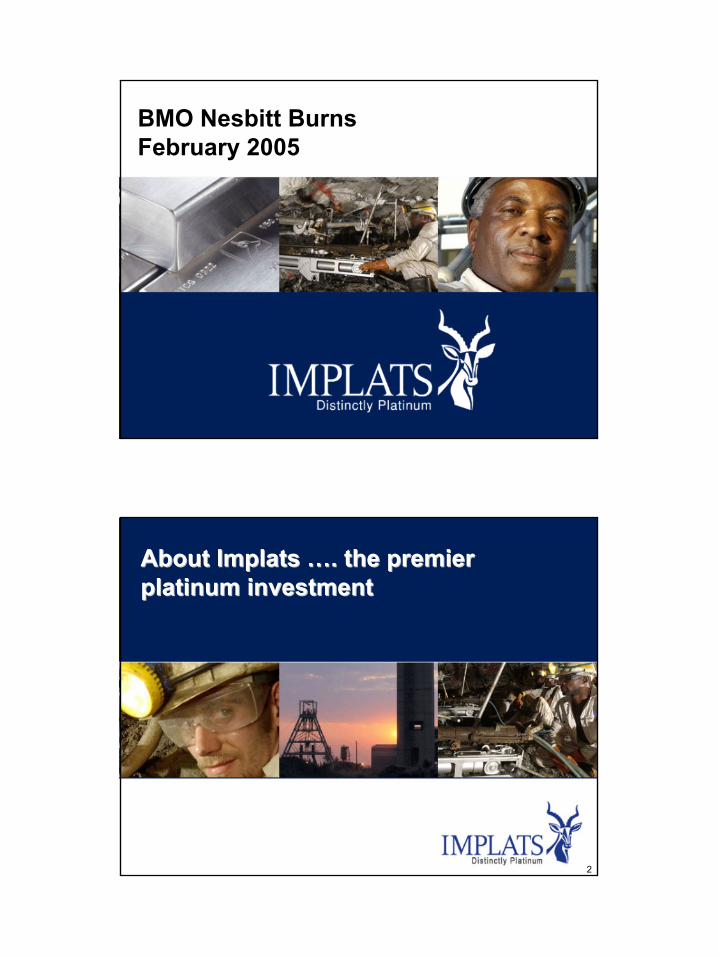
Key statisticsKey statisticsImplats• Has operations located on two prime PGM deposits:
• the Bushveld Complex in South Africa (Impala and Marula) and
• the Great Dyke in Zimbabwe (Zimplats and Mimosa)
• Produced 1.96Moz of platinum in FY2004 (0.88Moz in first half FY2005)
• Generated sales revenue of $1.716 billion in FY2004 – up 32% ($1 billion in first half FY2005)
4
Sales, profit and earnings Sales, profit and earnings
1 1081 5731 1841 3031 716Sales
538924693561571HEPS
357611462373428Net profit
20002001200220032004$m
3
5
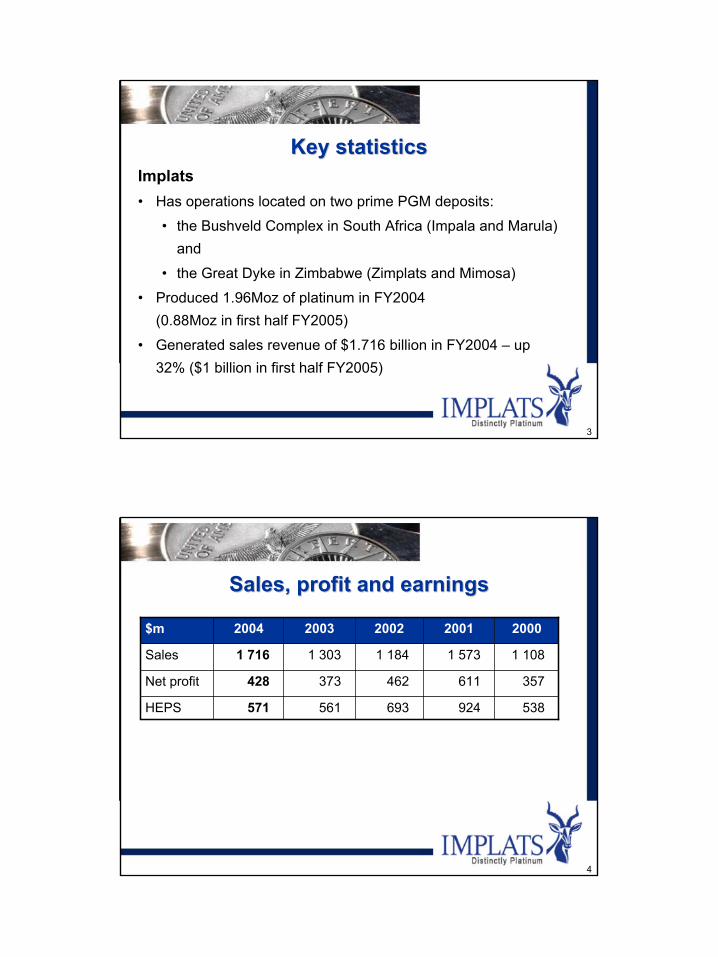
Share price performanceShare price performance
0.00
20.00
40.00
60.00
80.00
100.00
120.00
2003/01/02 2004/01/02 2005/01/02
$
Jan 2004Jan 2003 Jan 2005
6
Comparison of share price performanceComparison of share price performance
60
70
80
90
100
110
120
130
140
Jun-03 Dec-03 Jun-04 Dec-04
June 2003 = 100
Source: Deutshe Securities, Datastream, I-Net
Implats Competitor 1
4
7
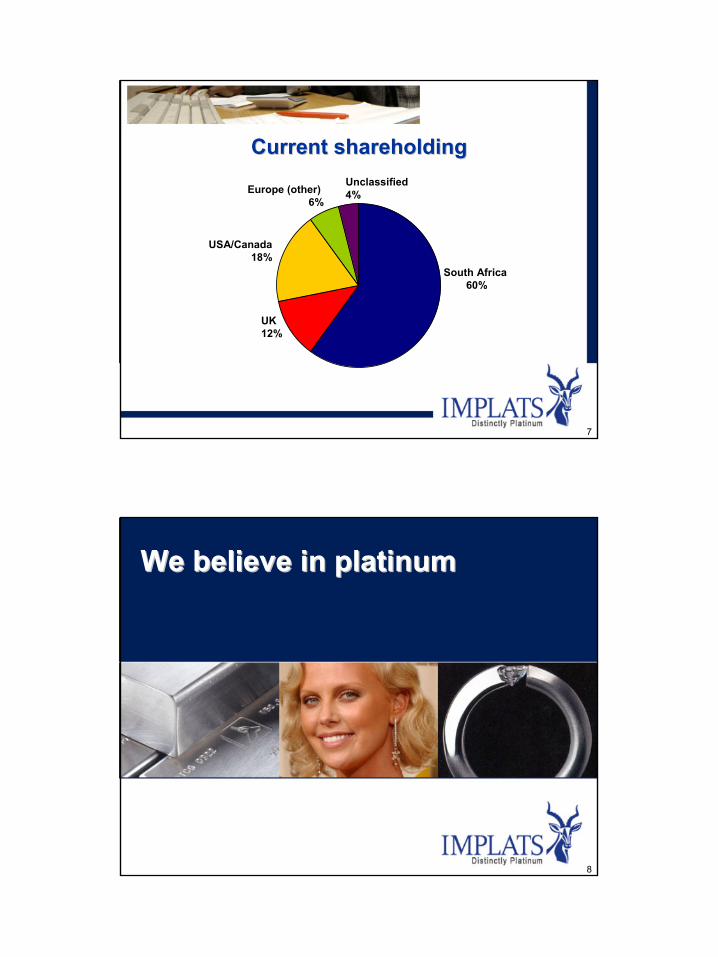
Current shareholdingCurrent shareholding
South Africa 60%
UK 12%
USA/Canada 18%
Europe (other) 6%
Unclassified 4%
8
We believe in platinumWe believe in platinum
5
9
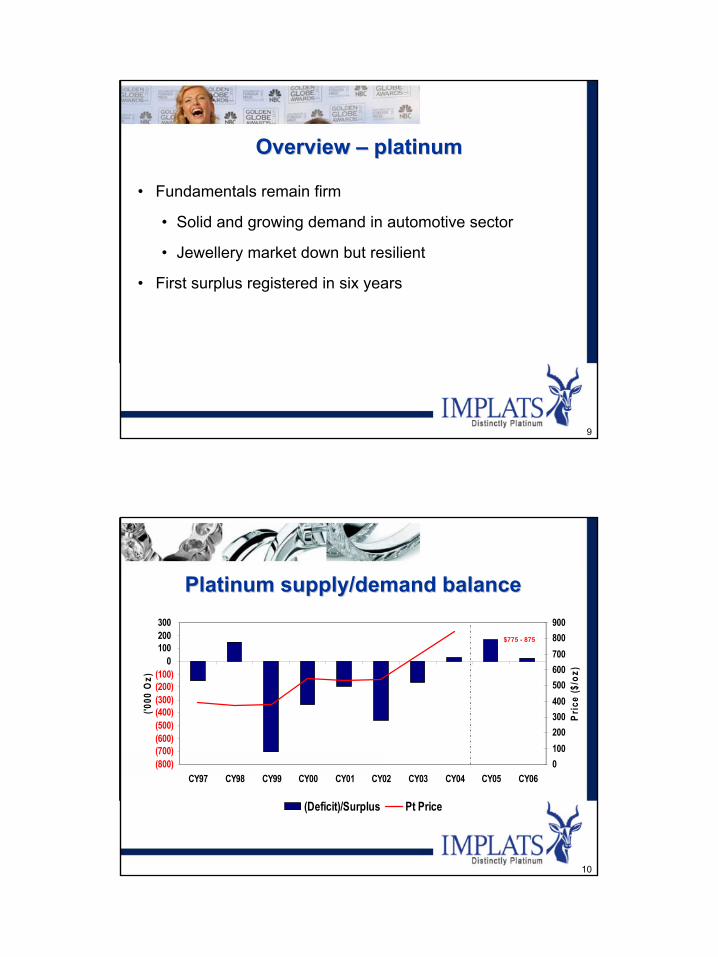
Overview Overview –– platinumplatinum
• Fundamentals remain firm
• Solid and growing demand in automotive sector
• Jewellery market down but resilient
• First surplus registered in six years
10
Platinum supply/demand balancePlatinum supply/demand balance
(800)(700)(600)(500)(400)(300)(200)(100)
0100200300
CY97 CY98 CY99 CY00 CY01 CY02 CY03 CY04 CY05 CY06
('000
Oz)
0100200300400500600700800900
Pric
e ($
/oz)
(Deficit)/Surplus Pt Price
$775 - 875
6
11
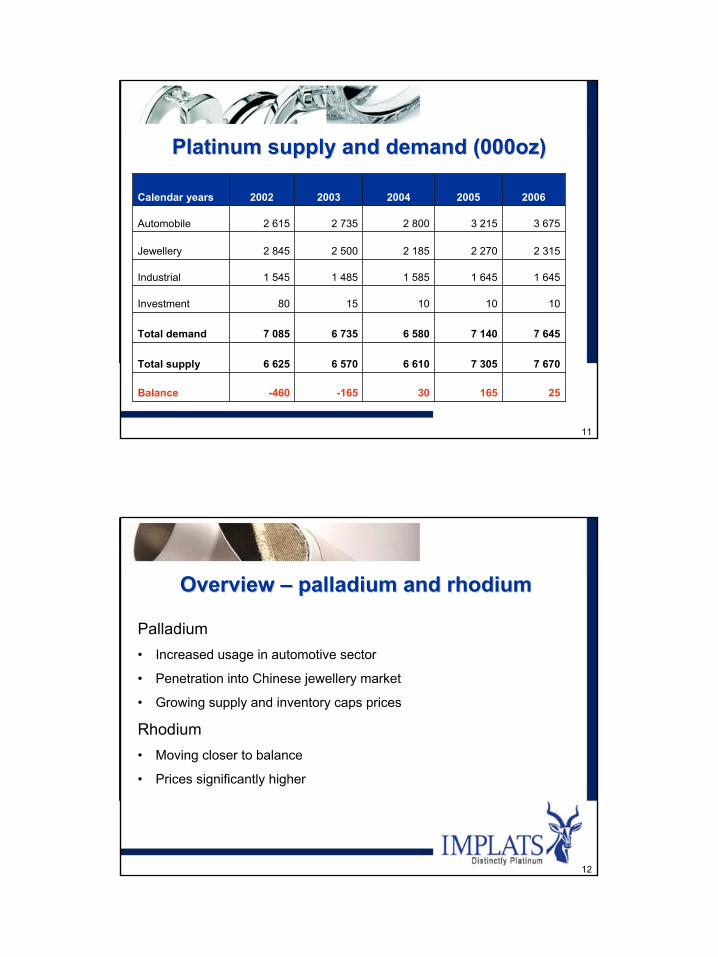
Platinum supply and demand (000oz)Platinum supply and demand (000oz)
2516530-165-460Balance
7 6707 3056 6106 570 6 625Total supply
7 6457 1406 5806 7357 085Total demand
1010101580Investment
1 6451 6451 5851 4851 545Industrial
2 3152 2702 1852 5002 845Jewellery
3 6753 2152 8002 7352 615Automobile
20062005200420032002Calendar years
12
Overview Overview –– palladium and rhodiumpalladium and rhodium
Palladium• Increased usage in automotive sector
• Penetration into Chinese jewellery market
• Growing supply and inventory caps prices
Rhodium• Moving closer to balance
• Prices significantly higher
7
13
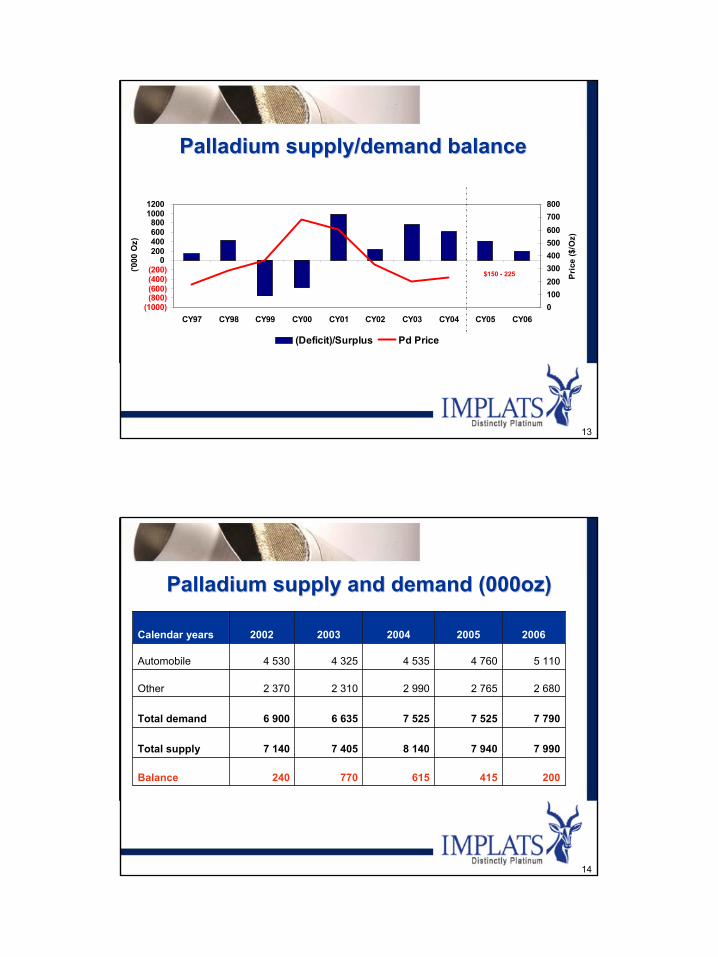
Palladium supply/demand balancePalladium supply/demand balance
(1000)(800)(600)(400)(200)
0200400600800
10001200
CY97 CY98 CY99 CY00 CY01 CY02 CY03 CY04 CY05 CY06
('000
Oz)
0100200300400500600700800
Pric
e ($
/Oz)
(Deficit)/Surplus Pd Price
$150 - 225
14
Palladium supply and demand (000oz)Palladium supply and demand (000oz)
200415615770240Balance
7 9907 9408 1407 405 7 140Total supply
7 7907 5257 5256 6356 900Total demand
2 6802 7652 9902 3102 370Other
5 1104 7604 5354 3254 530Automobile
20062005200420032002Calendar years
8
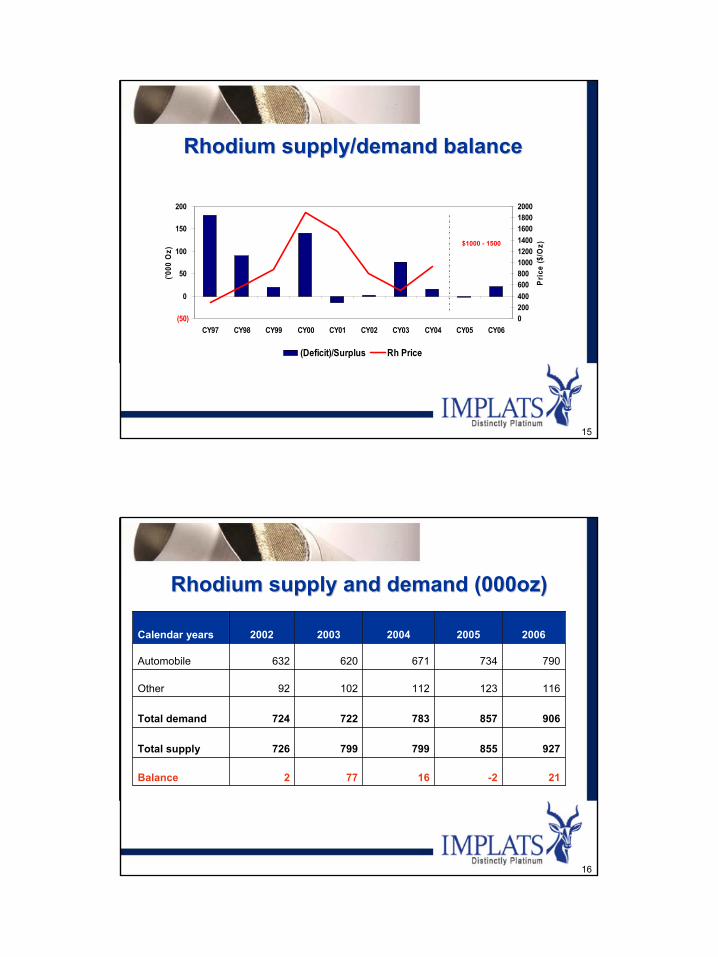
15
Rhodium supply/demand balanceRhodium supply/demand balance
(50)
0
50
100
150
200
CY97 CY98 CY99 CY00 CY01 CY02 CY03 CY04 CY05 CY06
('000
Oz)
0200400600800100012001400160018002000
Pric
e ($
/Oz)
(Deficit)/Surplus Rh Price
$1000 - 1500
16
Rhodium supply and demand (000oz)Rhodium supply and demand (000oz)
21-216772Balance
927855799799 726Total supply
906857783722724Total demand
11612311210292Other
790734671620632Automobile
20062005200420032002Calendar years
9
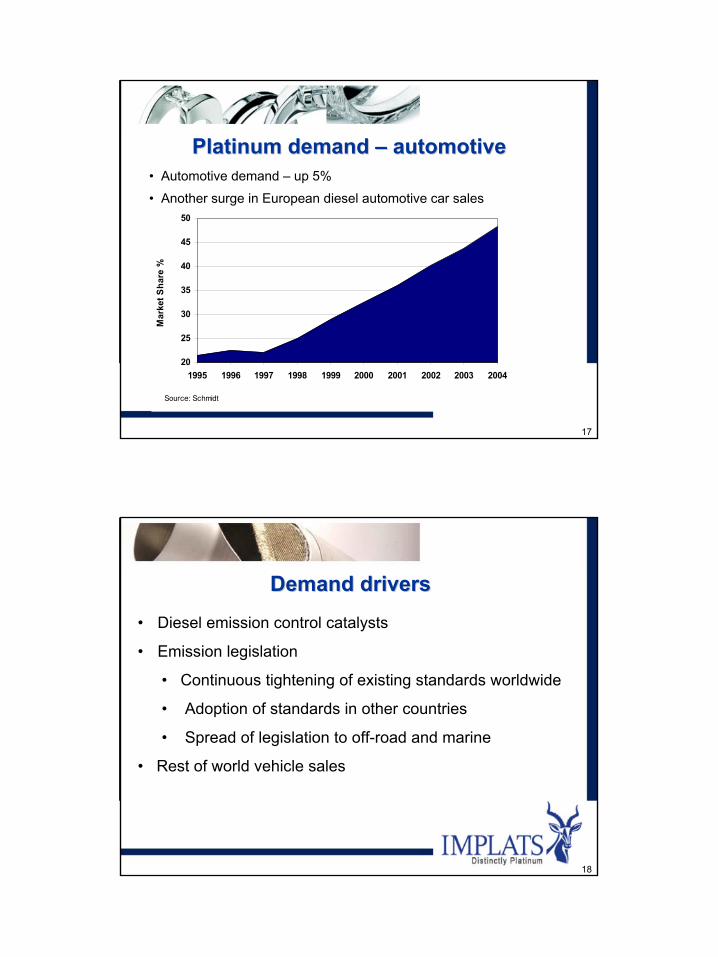
17
Source: Schmidt
20
25
30
35
40
45
50
1995 1996 1997 1998 1999 2000 2001 2002 2003 2004
Mar
ket S
hare
%Platinum demand Platinum demand –– automotiveautomotive
• Automotive demand – up 5%
• Another surge in European diesel automotive car sales
18
• Diesel emission control catalysts
• Emission legislation
• Continuous tightening of existing standards worldwide
• Adoption of standards in other countries
• Spread of legislation to off-road and marine
• Rest of world vehicle sales
Demand driversDemand drivers
10
19
0
0.5
1
1.5
2
2.5
04 05 06 07 08 09 10
HC,
NO
x &
PM E
mis
sion
Lim
its [g
/bhp
*hr]
00.020.040.060.08
0.10.120.140.160.180.2
PM
Em
issi
on L
imits
HCNOxPM
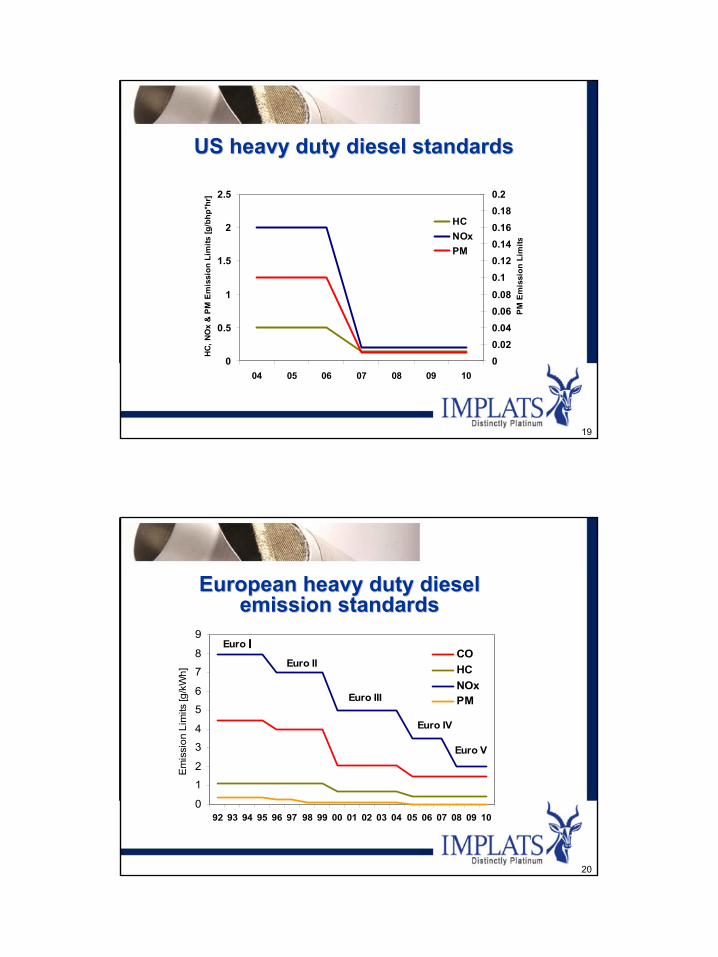
US heavy duty diesel standardsUS heavy duty diesel standards
20
0
1
2
3
4
5
6
7
8
9
92 93 94 95 96 97 98 99 00 01 02 03 04 05 06 07 08 09 10
Em
issi
on L
imits
[g/k
Wh]
COHCNOxPM
Euro IEuro II
Euro III
Euro IV
Euro V
European heavy duty diesel European heavy duty diesel emission standardsemission standards
11
21
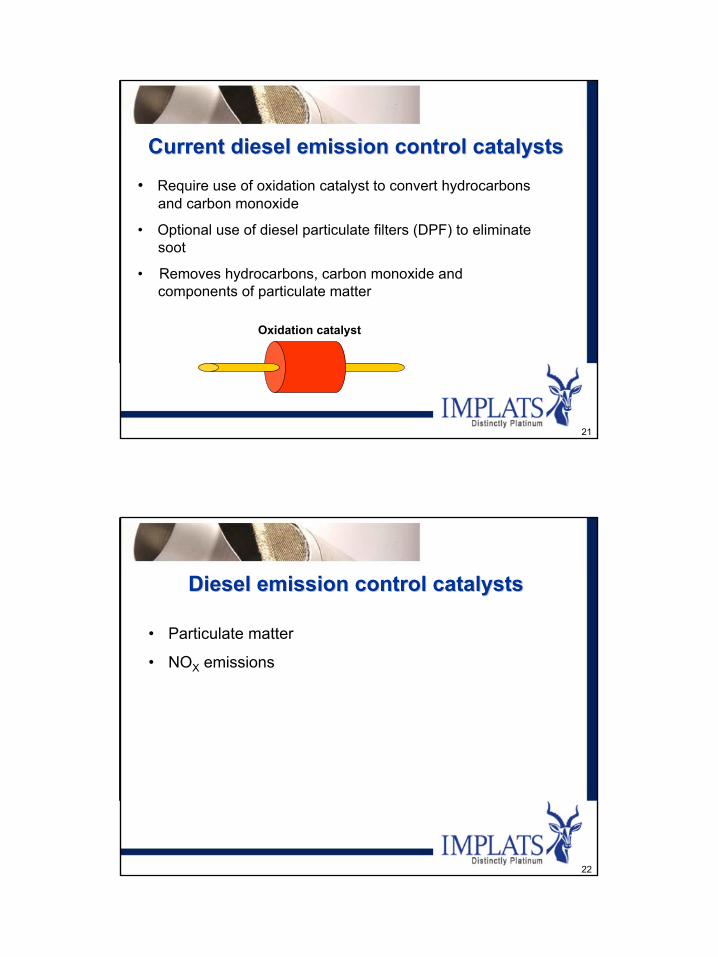
• Require use of oxidation catalyst to convert hydrocarbonsand carbon monoxide
• Optional use of diesel particulate filters (DPF) to eliminatesoot
• Removes hydrocarbons, carbon monoxide andcomponents of particulate matter
Current diesel emission control catalystsCurrent diesel emission control catalysts
Oxidation catalyst
22
Diesel emission control catalystsDiesel emission control catalysts
• Particulate matter
• NOX emissions
12
23
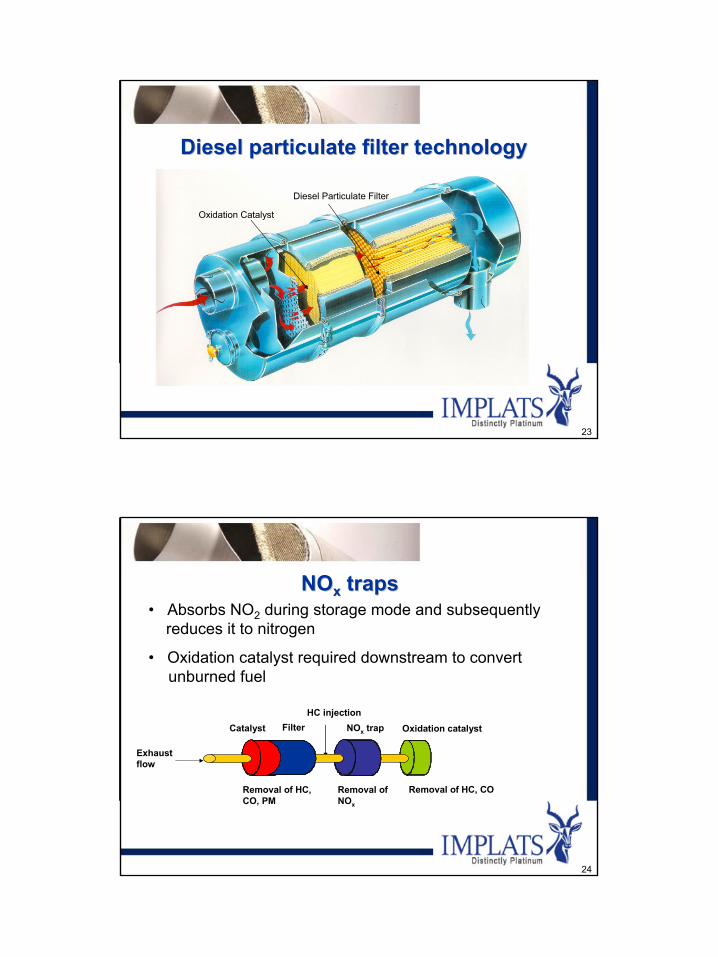
Diesel particulate filter technologyDiesel particulate filter technology
Oxidation Catalyst
Diesel Particulate Filter
24
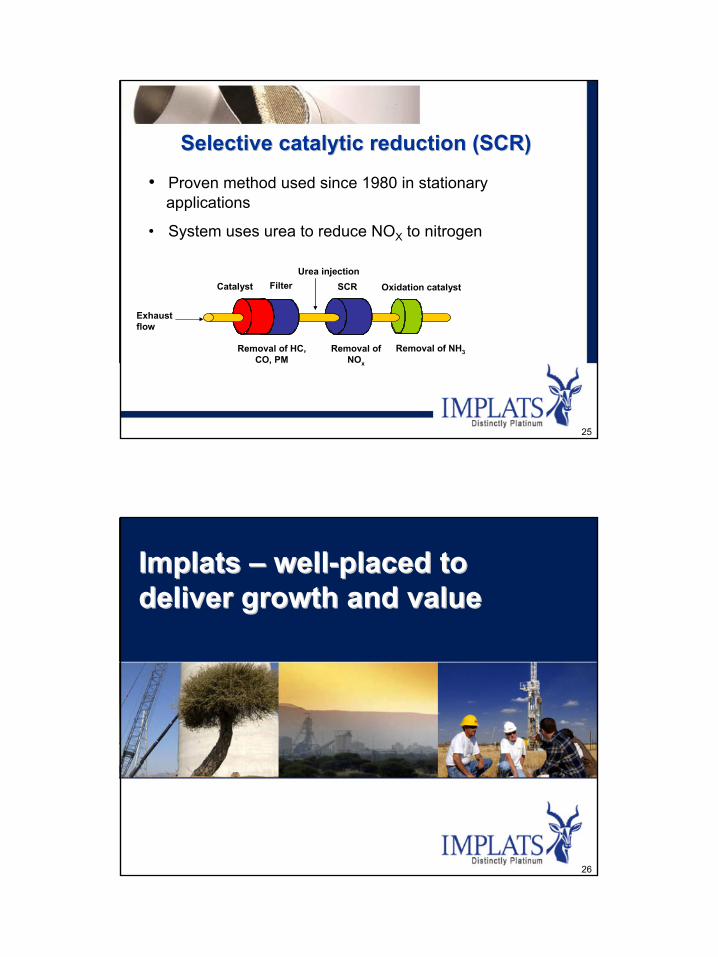
• Absorbs NO2 during storage mode and subsequently reduces it to nitrogen
• Oxidation catalyst required downstream to convert unburned fuel
NONOxx trapstraps
Removal of HC, CO
Catalyst NOx trap Oxidation catalyst
Removal of NOx
Removal of HC, CO, PM
HC injectionFilter
Exhaust flow
13
25
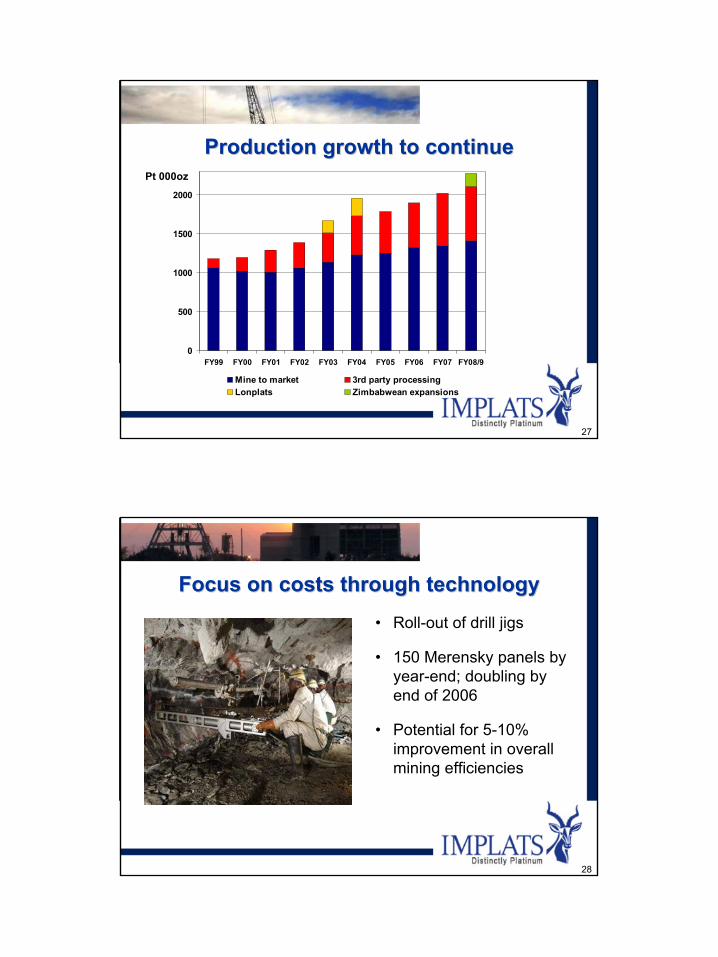
• Proven method used since 1980 in stationaryapplications
• System uses urea to reduce NOX to nitrogen
Removal of NH3
Catalyst SCR Oxidation catalyst
Removal of NOx
Removal of HC, CO, PM
Urea injection
Selective catalytic reduction (SCR)Selective catalytic reduction (SCR)
Filter
Exhaust flow
26
Implats Implats –– wellwell--placed to placed to deliver growth and valuedeliver growth and value
14
27
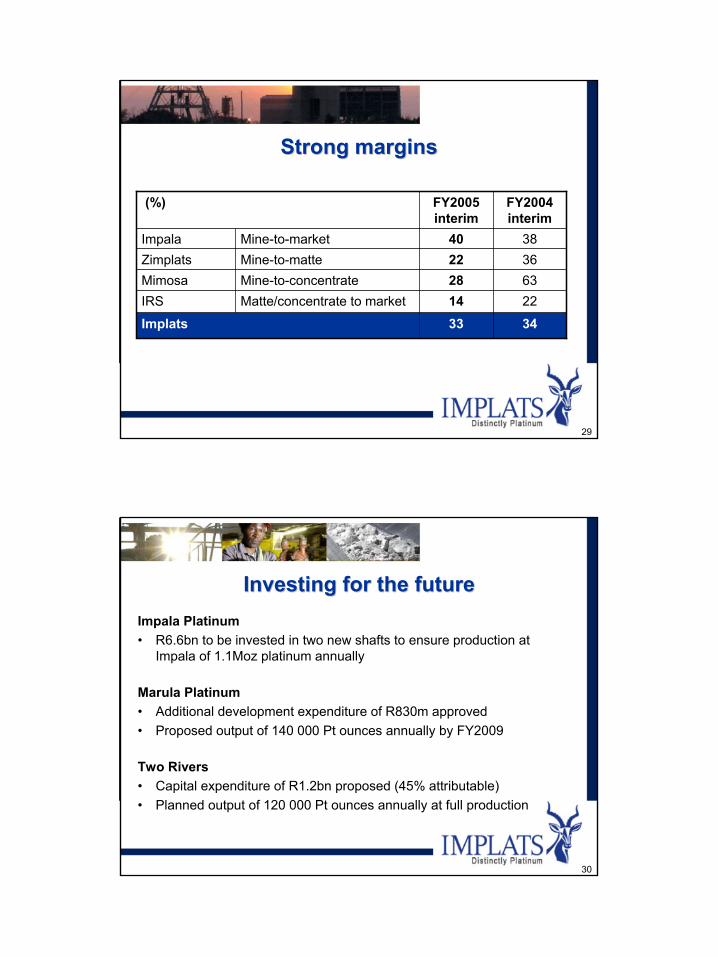
Production growth to continueProduction growth to continuePt 000oz
0
500
1000
1500
2000
FY99 FY00 FY01 FY02 FY03 FY04 FY05 FY06 FY07 FY08/9
Mine to market 3rd party processingLonplats Zimbabwean expansions
28
Focus on costs through technologyFocus on costs through technology• Roll-out of drill jigs
• 150 Merensky panels by year-end; doubling by end of 2006
• Potential for 5-10% improvement in overall mining efficiencies
15
29
Strong marginsStrong margins
3433Implats2214Matte/concentrate to marketIRS6328Mine-to-concentrateMimosa3622Mine-to-matteZimplats3840Mine-to-marketImpala
FY2004interim
FY2005interim
(%)
30
Investing for the futureInvesting for the futureImpala Platinum• R6.6bn to be invested in two new shafts to ensure production at
Impala of 1.1Moz platinum annually
Marula Platinum• Additional development expenditure of R830m approved• Proposed output of 140 000 Pt ounces annually by FY2009
Two Rivers• Capital expenditure of R1.2bn proposed (45% attributable)• Planned output of 120 000 Pt ounces annually at full production
16
31
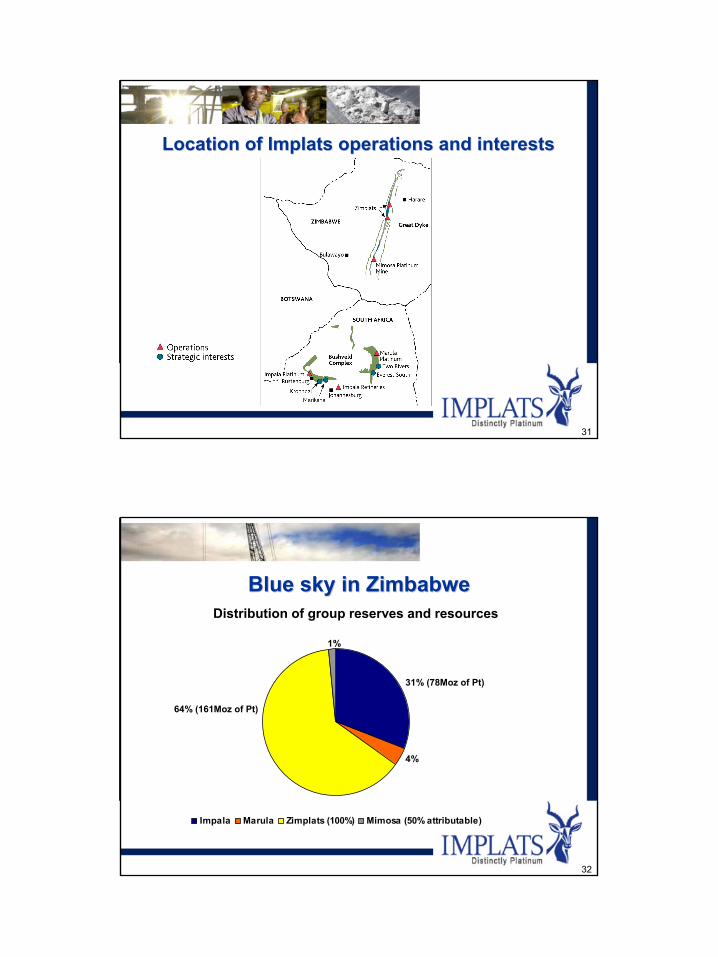
Location of Implats operations and interestsLocation of Implats operations and interests
32
Impala Marula Zimplats (100%) Mimosa (50% attributable)
Blue sky in ZimbabweBlue sky in Zimbabwe
31% (78Moz of Pt)
64% (161Moz of Pt)
Distribution of group reserves and resources
1%
4%
17
33
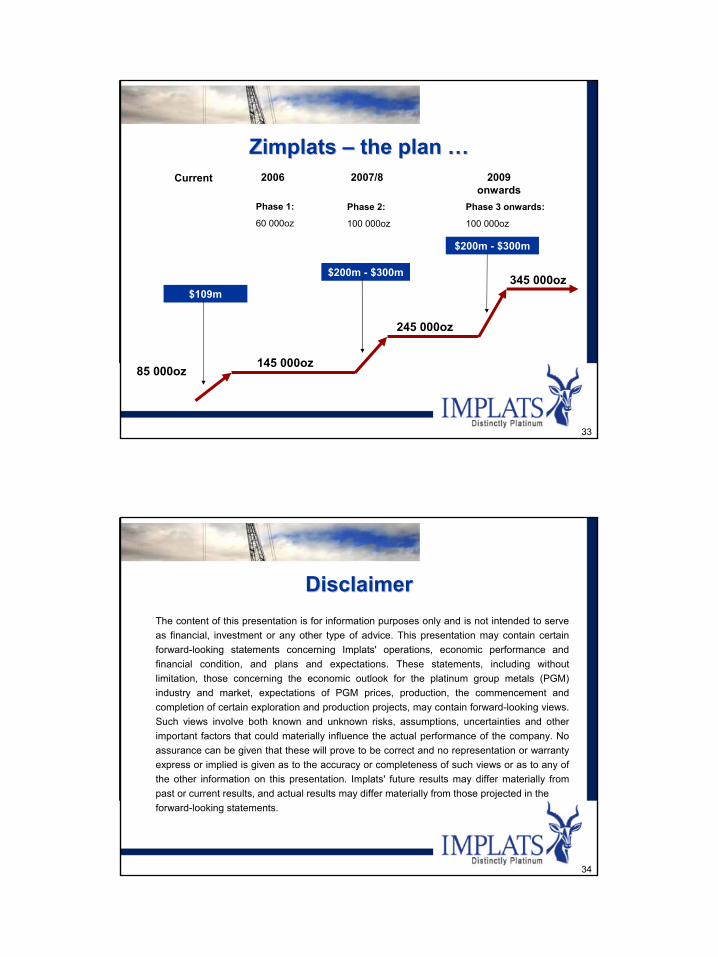
Zimplats Zimplats –– the plan the plan ……
85 000oz145 000oz
245 000oz
345 000oz
Current 2006 2007/8 2009onwards
Phase 1:
60 000oz
Phase 2:
100 000oz
Phase 3 onwards:
100 000oz
$109m
$200m - $300m
$200m - $300m
34
DisclaimerDisclaimerThe content of this presentation is for information purposes only and is not intended to serve as financial, investment or any other type of advice. This presentation may contain certain forward-looking statements concerning Implats' operations, economic performance and financial condition, and plans and expectations. These statements, including without limitation, those concerning the economic outlook for the platinum group metals (PGM) industry and market, expectations of PGM prices, production, the commencement and completion of certain exploration and production projects, may contain forward-looking views. Such views involve both known and unknown risks, assumptions, uncertainties and other important factors that could materially influence the actual performance of the company. No assurance can be given that these will prove to be correct and no representation or warranty express or implied is given as to the accuracy or completeness of such views or as to any of the other information on this presentation. Implats' future results may differ materially from past or current results, and actual results may differ materially from those projected in theforward-looking statements.

18