Embed Size (px)
Citation preview

8/6/2019 BmE_16
http://slidepdf.com/reader/full/bme16 1/5
12-May-11
1
Prof. Dr. Nizamettin AYDIN
http://www.yildiz.edu.tr/~naydin
Biomedical Instrumentation
1
Electrical Safety
Figure 14.1 Physiological effects of electricity Threshold or estimatedmean values are given for each effect in a 70 kg human for a 1 to 3 sexposure to 60 Hz current applied via copper wires grasped by the hands.
Figure 14.2 Distributions of perception thresholds and let-go currents Thesedata depend on surface area of contact (moistened hand grasping AWG No. 8copper wire). (Replotted from C. F. Dalziel, "Electric Shock," Advances in Biomedical Engineering, edited by J. H. U. Brown and J. F. Dickson III, 1973 3,
223-248.)
Figure 14.3 Let-gocurrent versusfrequency Percentilevalues indicate
variability of let-gocurrent amongindividuals. Let-gocurrents for womenare about two-thirds
the values for men.(Reproduced, withpermission, from C. F.Dalziel, "Electric
Shock," Advances in Biomedical Engineering, edited byJ. H. U. Brown and J.F. Dickson III, 1973, 3,223–248.) Figure 14.4 Normalized analytical strength–duration curve for current I , charge
Q , and energy U . The x axis shows the normalized duration of d /τ (FromGeddes, L. A., and L. E. Baker, Principles of Applied Biomedical
Instrumentation , 3rd ed. New York: John Wiley & Sons, 1989).

8/6/2019 BmE_16
http://slidepdf.com/reader/full/bme16 2/5
12-May-11
2
Figure 14.5 Fibrillationcurrent versus shockduration. Thresholds for
ventricular fibrillation inanimals for 60 Hz accurrent. Duration ofcurrent (0.2 to 5 s) andweight of animal bodywere varied. (From L. A.Geddes, IEEE Trans.Biomed. Eng., 1973, 20,465–468. Copyright 1973by the Institute ofElectrical andElectronics Engineers.Reproduced with
permission.)Figure 14.6 Effect of entry points on current distribution (a) Macroshock,externally applied current spreads throughout the body, (b) Microshock, allthe current applied through an intracardiac catheter flows through the heart.
(From F. J. Weibell, "Electrical Safety in the Hospital," Annals of Biomedical Engineering, 1974, 2, 126–148.)
Figure 14.7. Percentile plot of thresholds forcontinuous capture and VF (or sustainedVT). Cumulative percent of patients isshown on abscissa and root-mean-squareAC current (in µA) on ordinate. Squaresdenote unipolar data; circles, bipolar data.Solid symbols identify data from patients inwhom the only clinical arrhythmia was atrialfibrillation (AF). Top, Thresholds forcontinuous capture. Current strength of 50µA caused continuous capture in 5 patients(12%) with unipolar AC and in 9 (22%) withbipolar AC (P =0.49). Bottom, Thresholds forsustained VT/VF. These plots do not reach100% because sustained-VT/VF thresholdsexceeded maximum output of stimulator in6 patients (15%) with bipolar AC and 8 (20%)
with unipolar AC. From Swerdlow, C. D., W.H. Olson, M. E. O’Connor, D. M. Gallik, R. A.Malkin, M. Laks, “Cardiovascular collapsecaused by electrocardiographically silent60-Hz intracardiac leakage current –Implications for electrical safety.”Circulation., 1999, 99, 2559–2564. Figure 14.8 Simplifed electric-power distribution for 115 V circuits. Power
frequency is 60 Hz.
Figure 14.9 Power-isolation-transformer system with a line-isolation monitorto detect ground faults.
Figure 14.10 Macroshockdue to a ground fault fromhot line to equipmentcases for (a) ungroundedcases and (b) grounded
chassis.

8/6/2019 BmE_16
http://slidepdf.com/reader/full/bme16 3/5
12-May-11
3
Figure 14.11 Microshockleakage-current pathways.Assume 100 µA of leakagecurrent from the power line tothe instrument chassis, (a)Intact ground, and 99.8 µA flows
through the ground, (b) Brokenground, and 100 µA flowsthrough the heart, (c) Brokenground, and 100 µA flowsthrough the heart in the
opposite direction.
Figure 14.11 Microshock leakage-current pathways. Assume 100 µA ofleakage current from the power line to the instrument chassis, (a) Intactground, and 99.8 µA flows through the ground, (b) Broken ground, and 100 µA
flows through the heart, (c) Broken ground, and 100 µA flows through theheart in the opposite direction.
Figure 14.13 (a) Largeground-fault current raisesthe potential of one groundconnection to the patient. Themicroshock current can thenflow out through a catheterconnected to a differentground, (b) Equivalent circuit.Only power-system groundsare shown.
Table 14.1
Figure 14.14Grounding system Allthe receptacle groundsand conductive surfacesin the vicinity of thepatient are connected to
the patient-equipmentgrounding point. Eachpatient-equipmentgrounding point isconnected to the
reference groundingpoint that makes asingle connection to thebuilding ground.
Figure 14.15 Ground-fault
circuit interrupters (a)Schematic diagram of a solid-state GFCI (three wire, twopole, 6 mA). (b) Ground-fault
current versus trip time for aGFCI. [Part (a) is from C. F.Dalziel, "Electric Shock," inAdvances in Biomedical
Engineering, edited by J. H.U. Brown and J. F. Dickson III,1973, 3: 223–248.]

8/6/2019 BmE_16
http://slidepdf.com/reader/full/bme16 4/5
12-May-11
4
Figure 14.16 Electrical
isolation of patientleads to biopotentialamplifiers (a) Generalmodel for an isolationamplifier, (b)Transformer isolationamplifier (Courtesy ofAnalog Devices, Inc.,AD202). (c) Simplifiedequivalent circuit for anoptical isolator(Copyright © 1989 Burr-Brown Corporation.Reprinted in whole or inpart, with thepermission of Burr-Brown Corporation.Burr Brown ISO100). (d)Capacitively coupledisolation amplifier(Horowitz and Hill, Art ofElectronics, CambridgeUniv. Press, Burr BrownISO106).
fi _14_1Figure 14.16 (Continued)
Figure 14.17 Three-LED receptacle tester Ordinary silicon diodes preventdamaging reverse-LED currents, and resistors limit current. The LEDs areON for line voltages from about 20 V rms to greater than 240 V rms, so these
devices should not be used to measure line voltage.Figure 14.18 Ground-pin-to-chassis resistance test
Figure 14.19 (a) Chassisleakage-current test, (b)Current-meter circuit to beused for measuring leakagecurrent. It has an inputimpedance of 1 kΩΩΩΩ and a
frequency characteristicthat is flat to 1 kHz, dropsat the rate of 20 dB/decadeto 100 kHz, and thenremains flat to 1 MHz orhigher. (Reprinted withpermission from NFPA 99-2005, "Health CareFacilities," Copyright ©2005, National FireProtection Association,Quincy, MA 02269. Thisreprinted material is not thecomplete and officialposition of the National FireProtection Association, onthe referenced subject,which is represented onlyby the standard in itsentirety.)
Figure 14.20 Test for leakage current from patient leads to ground
(Reprinted with permission from NFPA 99-2005, "Health Care Facilities,"Copyright ©2005, National Fire Protection Association, Quincy, MA 02269.This reprinted material is not the complete and off icial position of theNational Fire Protection Association, on the referenced subject, which isrepresented only by the standard in its entirety.)
8/6/2019 BmE_16
http://slidepdf.com/reader/full/bme16 5/5
12-May-11
5
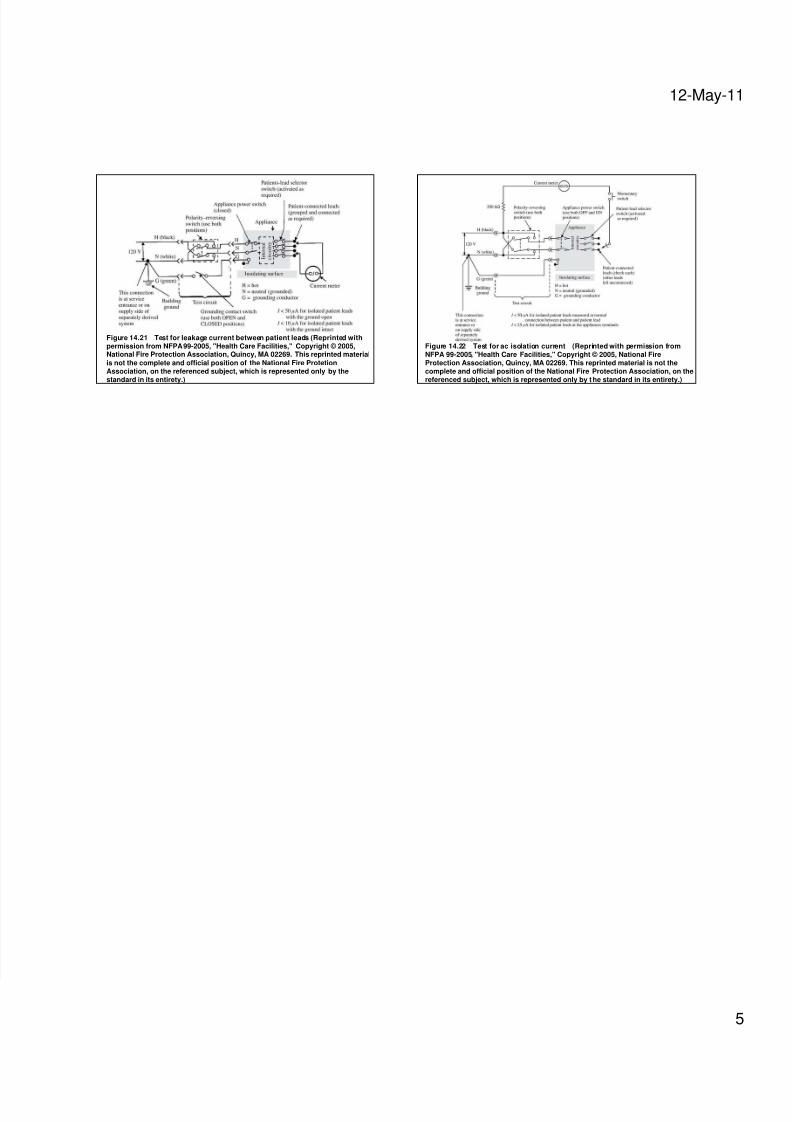
Figure 14.21 Test for leakage current between patient leads (Reprinted withpermission from NFPA 99-2005, "Health Care Facilities," Copyright © 2005,National Fire Protection Association, Quincy, MA 02269. This reprinted material
is not the complete and official position of the National Fire ProtetionAssociation, on the referenced subject, which is represented only by thestandard in its entirety.)
Figure 14.22 Test for ac isolation current (Reprinted with permission fromNFPA 99-2005, "Health Care Facilities," Copyright © 2005, National FireProtection Association, Quincy, MA 02269. This reprinted material is not thecomplete and official position of the National Fire Protection Association, on thereferenced subject, which is represented only by the standard in its entirety.)


