Embed Size (px)
Citation preview
BMCE BANK’SCONSOLIDATED FINANCIAL STATEMENTS
UNDER IAS/IFRSAND NOTES TO THE FINANCIAL STATEMENTS
30 June 2013
BMCE BANK
Established in 1959 and privatised in 1995, BMCE Bank is a universal bank which offers a diversified range of products and services through a domestic network of 630 branches. BMCE Bank, Morocco’s third largest bank in terms of market share for deposits and loans, currently has operations in about thirty countries in sub-Saharan Africa, Europe and Asia.
BMCE Bank’s activities primarily include commercial banking, specialised financial services, asset management, investment banking and international activities.
BMCE Bank in Morocco
BMCE Bank’s activities in Morocco include:
- Retail Banking, sub-divided by market specialisation – retail customers, professional banking customers, private clients and Moroccans living abroad;
- Corporate Banking, including SMEs and large enterprises.
It is worth noting that BMCE Bank has embarked on a regional strategy aimed at moving the decision-making process closer to the customer and improving the Bank’s impact from a commercial perspective. The Bank’s distribution network, now organised on a regional basis and enjoying greater independence, encompasses both Retail Banking as well as Corporate Banking activities.
- BMCE Capital, the Bank’s investment banking subsidiary, is organised by business line on an integrated basis which include asset management, wealth management, brokerage and capital markets activities as well as M&A and other corporate advisory services.
- Specialised financial subsidiaries, whose products are primarily marketed via the branch network, the aim being to develop intra-Group commercial and operational synergies – consumer credit, leasing, bank-insurance, factoring and vehicle leasing. RM Experts, subsidiary specialising in recovery, was established in 2010.
BMCE Bank’s international activities
BMCE Bank’s international vocation can be traced back to its origins as a bank specialising in foreign trade. The Bank rapidly turned to international markets by building a strong presence in Europe. In 1972, it became the first Moroccan bank to open a branch in Paris. The Group’s European activities are conducted through BMCE Bank International in London, Paris and Madrid, which constitute the Group’s European platform for investing in Africa.
The Bank also has some twenty representative offices providing banking services to Moroccans living abroad. The Bank recently established BMCE Euroservices as a result of the recent re-organisation of its European business. This entity, which is responsible for banking for expatriates, will work closely with the domestic branch network.
BMCE Bank has also developed, since the 1980s, sizeable operations in the African market following the restructuring of Banque de Développement du Mali, the country’s leading bank, in which it has a 27.4% stake.
Similarly, in 2003, in Congo Brazzaville, BMCE Bank acquired a 25% stake in La Congolaise de Banque, which it restructured, resulting in it becoming the undisputed market leader in its industry.
BMCE Bank’s development accelerated in 2007 following the acquisition of a 25% stake in Bank of Africa which has operations in about fifteen countries. BMCE Bank has since increased its stake the pan-African bank to 72.6%.
As part of on-going efforts to improve governance across the Bank’s various operations, a major project got underway at end-June 2012 relating to the implementation of a global risk control and internal control policy. On the project’s completion, BMCE Bank will boast a new organisational structure commensurate with international banking groups and a significantly enhanced system of governance in respect of Group risk.
ContentI. CONSOLIDATED BALANCE SHEET, CONSOLIDATED INCOME STATEMENT, STATEMENT OF NET INCOME, STATEMENT OF CHANgES IN
SHAREHOLDERS’ EqUITy, CASH FLOw STATEMENTS AND SUMMARy OF ACCOUNTINg POLICIES
1.1. Consolidated Balance Sheet 1.2. Consolidated Income Statement 1.3. Statement of Net Income and Gains and Losses Recognised Directly in Shareholders’ Equity 1.4. Statement of Changes in Shareholders’ Equity 1.5. Cash Flow Statements at 30 june 2013 1.6. Summary of Accounting Policies Applied by the Group
II. NOTES TO THE INCOME STATEMENT FOR THE yEAR ENDED 30 jUNE 2013
2.1. Net Interest Income 2.2. Net Fee Income 2.3. Net Gains on Financial Instruments at Fair Value Through Profit or Loss 2.4. Net Gains on Available-For-Sale Financial Assets 2.5. Net Income From Other Activities 2.6. Cost of Risk 2.7. Net Gains on Other Assets 2.8. Income Tax
III. SEgMENT INFORMATION
3.1. Income by Business Activity 3.2. Assets and Liabilities by Business Activity 3.3. Breakdown of Loans and Receivables
Iv. NOTES TO THE BALANCE SHEET FOR THE yEAR ENDED
4.1. Assets and Liabilities at Fair Value Through Income 4.2. Available-For-Sale Financial Assets 4.3. Interbank Transactions, Receivables and Amounts due From Credit Institutions 4.4. Loans, Receivables and Amounts due From Customers 4.5. Debt Securities, Subordinated Debt and Special Guarantee Funds 4.6. Held-To-Maturity Financial Assets4.7. Current and Deferred Tax 4.8. Accrued Income and Expenses, Other Assets and Liabilities 4.9. Investments in Companies Accounted for Under the Equity Method 4.10. Property, Plant and Equipment and Intangible Assets Used in Operations and Investment Property 4.11. Goodwill 4.12. Provisions for Risks and Charges
v / FINANCINg AND gUARANTEE COMMITMENTS
5.1. Financing Commitments 5.2. Guarantee Commitments
vI / SALARy AND EMPLOyEE BENEFITS
6.1. Description of Calculation Method 6.2. Summary of Provisions and Description of Existing Schemes
vII /ADDITIONAL INFORMATION
7.1. Changes in Share Capital and Earnings Per Share 7.2. Scope of Consolidation 7.3. Remuneration and Benefits Awarded to the Main Directors 7.4. Relations With Related Parties 7.5. Leases
vIII / NOTE CONCERNINg RISKS
8.1. Risk Management Policy 8.2. Credit Risk 8.3. Rating Model 8.4. Exposure to Credit Risk 8.5. Credit Risk Control and Monitoring Procedure 8.6. Description of the Policy for Managing Liquidity and Interest Rate Risks 8.7. Market Risk 8.8. Operational Risk
STATUTORy AUDITORS REPORTIFRS CONSOLIDATED FINANCIALS
LIMITED REvIEw ATTESTATION OF THE CONSOLIDATEDSITUATION AS OF jUNE 30, 2013(This is a free translation of the original French text for information purposes only)
We have conducted a limited review of the consolidated situation of the Banque Marocaine du Commerce Extérieur and its subsidiaries (BMCE Bank Group) including the consolidated balance sheet, the consolidated income statement, the global income statement, the cash flow statement, the statement of changes in shareholders’ equity and a selection of explicative notes to the financial statements covering the first half of the year 2013. This consolidated financial situation shows a consolidated shareholders’ equity of KMAD 17.917.889, including a consolidated net income of KMAD 876.140.
We conducted our limited review in accordance with the Moroccan Standards. Those standards require that we plan and perform the limited review in order to obtain a moderate assurance about whether that the consolidated financial statements mentioned above in the first paragraph are free from significant misstatement. A limited review consists essentially of interviews with the personnel of the company and the analytical review of the financial data; in thus provides a lower level of assurance than an audit. We did not carry out an audit and as a consequence, we do not express an opinion of audit.
Based on our limited review, we did not identify any fact that makes us believe that the attached consolidated financial statements does not give a true and fair view of the results of the operations of the first half, as well as the financial situation and assets of the BMCE Bank Group at June 30, 2013, in accordance with IAS/IFRS international accounting standards.
Casablanca, September 20th, 2013
The Statutory Auditors
Faïçal MEKOUARPartner
Bachir TAZI Partner
6
I. CONSOLIDATED BALANCE SHEET, CONSOLIDATED INCOME STATEMENT, STATEMENT OF NET INCOME, STATEMENT OF CHANgES IN SHAREHOLDERS’ EqUITy, CASH FLOw STATEMENTS AND SUMMARy OF ACCOUNTINg POLICIES
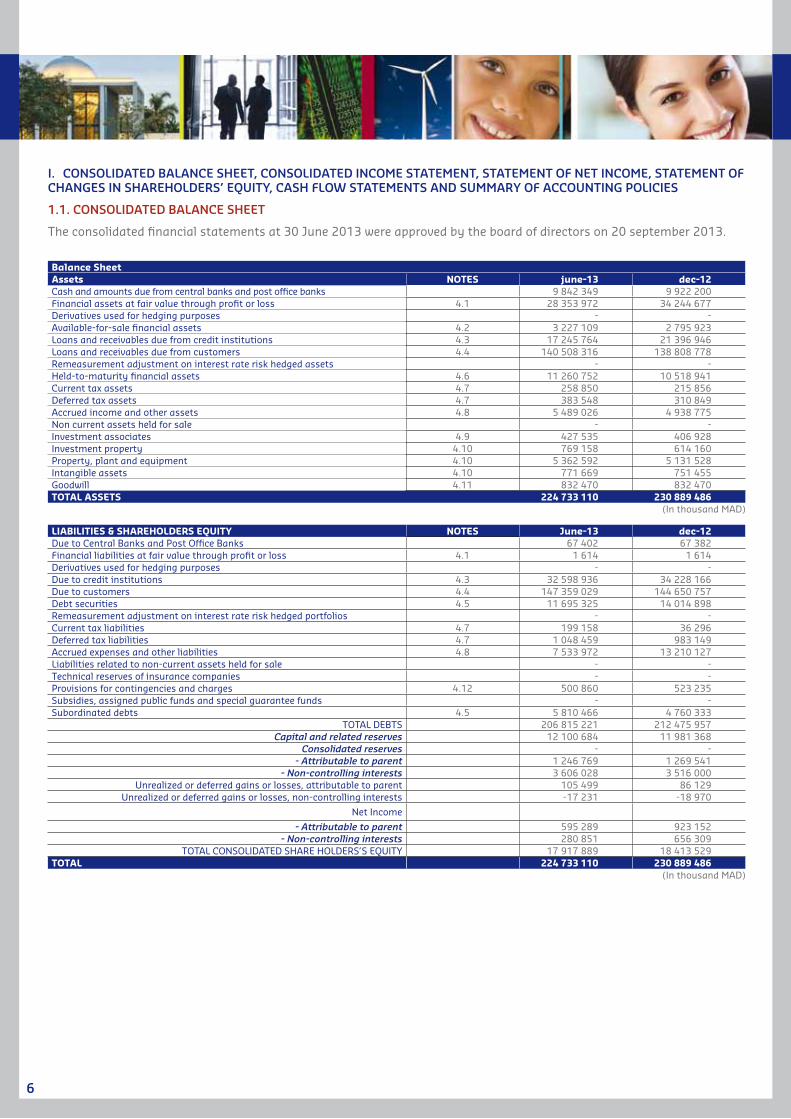
1.1. CONSOLIDATED BALANCE SHEET
The consolidated financial statements at 30 June 2013 were approved by the board of directors on 20 september 2013.
Balance SheetAssets NOTES june-13 dec-12Cash and amounts due from central banks and post office banks 9 842 349 9 922 200 Financial assets at fair value through profit or loss 4.1 28 353 972 34 244 677 Derivatives used for hedging purposes - - Available-for-sale financial assets 4.2 3 227 109 2 795 923 Loans and receivables due from credit institutions 4.3 17 245 764 21 396 946 Loans and receivables due from customers 4.4 140 508 316 138 808 778 Remeasurement adjustment on interest rate risk hedged assets - - Held-to-maturity financial assets 4.6 11 260 752 10 518 941 Current tax assets 4.7 258 850 215 856 Deferred tax assets 4.7 383 548 310 849 Accrued income and other assets 4.8 5 489 026 4 938 775 Non current assets held for sale - - Investment associates 4.9 427 535 406 928 Investment property 4.10 769 158 614 160 Property, plant and equipment 4.10 5 362 592 5 131 528 Intangible assets 4.10 771 669 751 455 Goodwill 4.11 832 470 832 470 TOTAL ASSETS 224 733 110 230 889 486
(In thousand MAD)
LIABILITIES & SHAREHOLDERS EQUITY NOTES June-13 dec-12Due to Central Banks and Post Office Banks 67 402 67 382 Financial liabilities at fair value through profit or loss 4.1 1 614 1 614 Derivatives used for hedging purposes - - Due to credit institutions 4.3 32 598 936 34 228 166 Due to customers 4.4 147 359 029 144 650 757 Debt securities 4.5 11 695 325 14 014 898 Remeasurement adjustment on interest rate risk hedged portfolios - - Current tax liabilities 4.7 199 158 36 296 Deferred tax liabilities 4.7 1 048 459 983 149 Accrued expenses and other liabilities 4.8 7 533 972 13 210 127 Liabilities related to non-current assets held for sale - - Technical reserves of insurance companies - - Provisions for contingencies and charges 4.12 500 860 523 235 Subsidies, assigned public funds and special guarantee funds - - Subordinated debts 4.5 5 810 466 4 760 333
TOTAL DEBTS 206 815 221 212 475 957 Capital and related reserves 12 100 684 11 981 368
Consolidated reserves - - - Attributable to parent 1 246 769 1 269 541
- Non-controlling interests 3 606 028 3 516 000 Unrealized or deferred gains or losses, attributable to parent 105 499 86 129
Unrealized or deferred gains or losses, non-controlling interests -17 231 -18 970
Net Income
- Attributable to parent 595 289 923 152 - Non-controlling interests 280 851 656 309
TOTAL CONSOLIDATED SHARE HOLDERS’S EQUITY 17 917 889 18 413 529 TOTAL 224 733 110 230 889 486
(In thousand MAD)
7
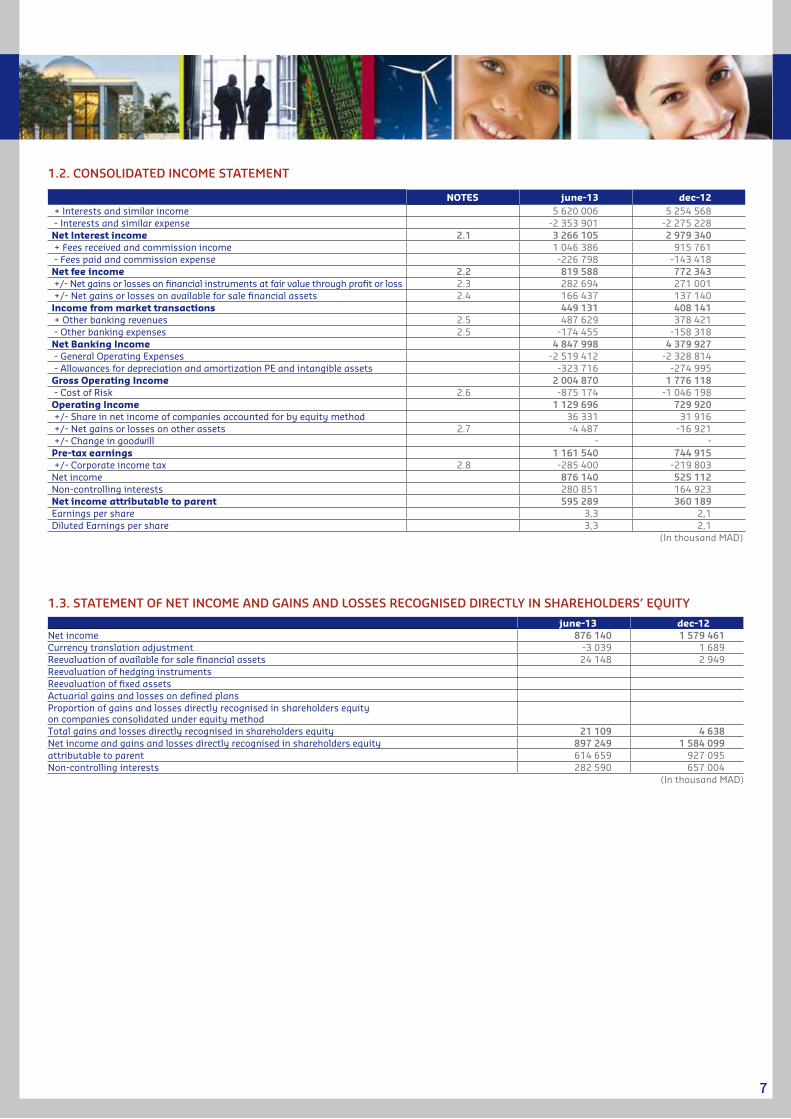
NOTES june-13 dec-12 + Interests and similar income 5 620 006 5 254 568 - Interests and similar expense -2 353 901 -2 275 228 Net Interest income 2.1 3 266 105 2 979 340 + Fees received and commission income 1 046 386 915 761 - Fees paid and commission expense -226 798 -143 418 Net fee income 2.2 819 588 772 343 +/- Net gains or losses on financial instruments at fair value through profit or loss 2.3 282 694 271 001 +/- Net gains or losses on available for sale financial assets 2.4 166 437 137 140 Income from market transactions 449 131 408 141 + Other banking revenues 2.5 487 629 378 421 - Other banking expenses 2.5 -174 455 -158 318 Net Banking Income 4 847 998 4 379 927 - General Operating Expenses -2 519 412 -2 328 814 - Allowances for depreciation and amortization PE and intangible assets -323 716 -274 995 Gross Operating Income 2 004 870 1 776 118 - Cost of Risk 2.6 -875 174 -1 046 198 Operating Income 1 129 696 729 920 +/- Share in net income of companies accounted for by equity method 36 331 31 916 +/- Net gains or losses on other assets 2.7 -4 487 -16 921 +/- Change in goodwill - - Pre-tax earnings 1 161 540 744 915 +/- Corporate income tax 2.8 -285 400 -219 803 Net income 876 140 525 112 Non-controlling interests 280 851 164 923 Net income attributable to parent 595 289 360 189 Earnings per share 3,3 2,1 Diluted Earnings per share 3,3 2,1
(In thousand MAD)
1.2. CONSOLIDATED INCOME STATEMENT
1.3. STATEMENT OF NET INCOME AND gAINS AND LOSSES RECOgNISED DIRECTLy IN SHAREHOLDERS’ EqUITy
june-13 dec-12Net income 876 140 1 579 461Currency translation adjustment -3 039 1 689Reevaluation of available for sale financial assets 24 148 2 949Reevaluation of hedging instrumentsReevaluation of fixed assetsActuarial gains and losses on defined plansProportion of gains and losses directly recognised in shareholders equityon companies consolidated under equity methodTotal gains and losses directly recognised in shareholders equity 21 109 4 638Net income and gains and losses directly recognised in shareholders equity 897 249 1 584 099attributable to parent 614 659 927 095Non-controlling interests 282 590 657 004
(In thousand MAD)
8
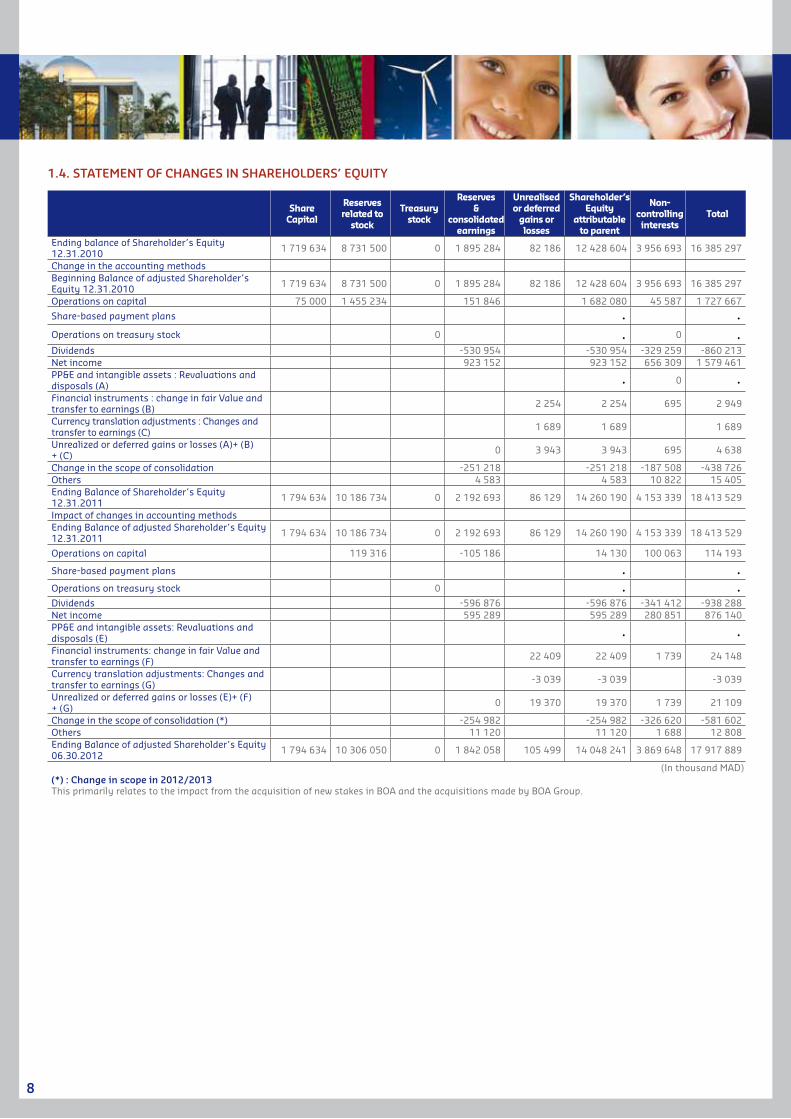
Share Capital
Reserves related to
stock
Treasury stock
Reserves &
consolidated earnings
Unrealised or deferred
gains or losses
Shareholder’s Equity
attributable to parent
Non-controlling
interestsTotal
Ending balance of Shareholder’s Equity 12.31.2010 1 719 634 8 731 500 0 1 895 284 82 186 12 428 604 3 956 693 16 385 297
Change in the accounting methodsBeginning Balance of adjusted Shareholder’s Equity 12.31.2010 1 719 634 8 731 500 0 1 895 284 82 186 12 428 604 3 956 693 16 385 297
Operations on capital 75 000 1 455 234 151 846 1 682 080 45 587 1 727 667
Share-based payment plans 0 0Operations on treasury stock 0 0 0 0Dividends -530 954 -530 954 -329 259 -860 213Net income 923 152 923 152 656 309 1 579 461PP&E and intangible assets : Revaluations and disposals (A) 0 0 0Financial instruments : change in fair Value and transfer to earnings (B) 2 254 2 254 695 2 949
Currency translation adjustments : Changes and transfer to earnings (C) 1 689 1 689 1 689
Unrealized or deferred gains or losses (A)+ (B) + (C) 0 3 943 3 943 695 4 638
Change in the scope of consolidation -251 218 -251 218 -187 508 -438 726Others 4 583 4 583 10 822 15 405Ending Balance of Shareholder’s Equity 12.31.2011 1 794 634 10 186 734 0 2 192 693 86 129 14 260 190 4 153 339 18 413 529
Impact of changes in accounting methodsEnding Balance of adjusted Shareholder’s Equity 12.31.2011 1 794 634 10 186 734 0 2 192 693 86 129 14 260 190 4 153 339 18 413 529
Operations on capital 119 316 -105 186 14 130 100 063 114 193
Share-based payment plans 0 0Operations on treasury stock 0 0 0Dividends -596 876 -596 876 -341 412 -938 288Net income 595 289 595 289 280 851 876 140PP&E and intangible assets: Revaluations and disposals (E) 0 0Financial instruments: change in fair Value and transfer to earnings (F) 22 409 22 409 1 739 24 148
Currency translation adjustments: Changes and transfer to earnings (G) -3 039 -3 039 -3 039
Unrealized or deferred gains or losses (E)+ (F) + (G) 0 19 370 19 370 1 739 21 109
Change in the scope of consolidation (*) -254 982 -254 982 -326 620 -581 602Others 11 120 11 120 1 688 12 808Ending Balance of adjusted Shareholder’s Equity 06.30.2012 1 794 634 10 306 050 0 1 842 058 105 499 14 048 241 3 869 648 17 917 889
(In thousand MAD)(*) : Change in scope in 2012/2013This primarily relates to the impact from the acquisition of new stakes in BOA and the acquisitions made by BOA Group.
1.4. STATEMENT OF CHANgES IN SHAREHOLDERS’ EqUITy
9
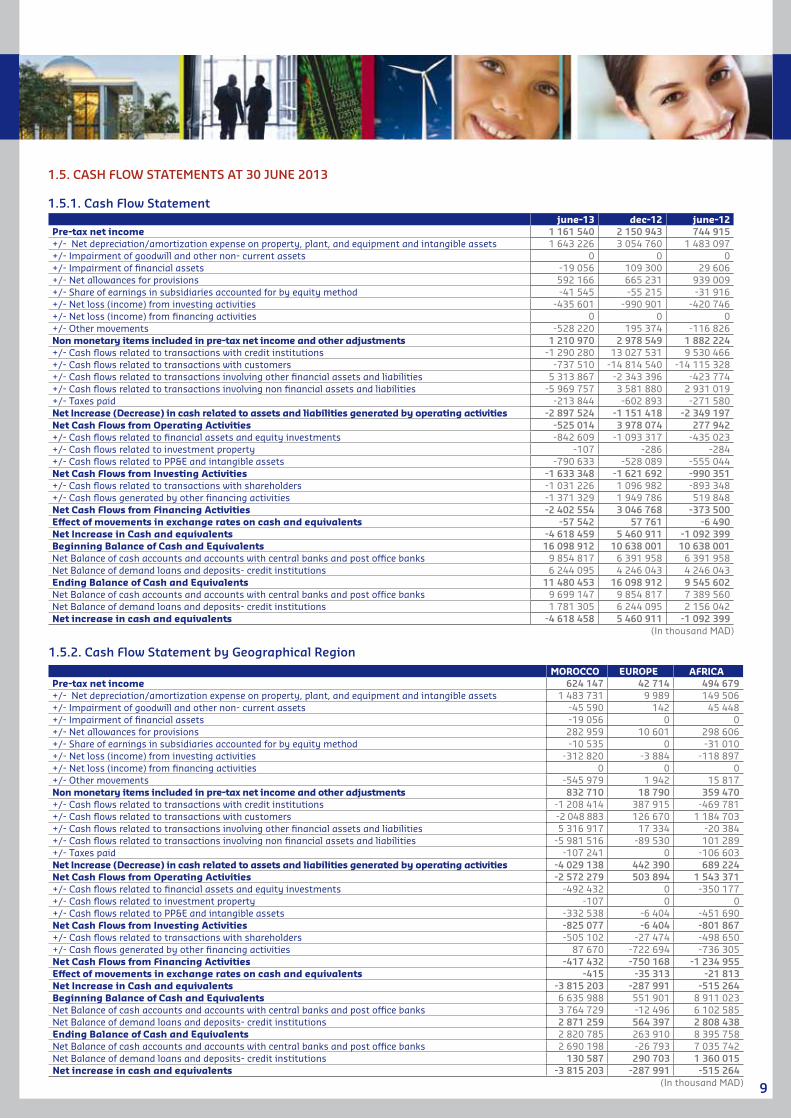
1.5. CASH FLOw STATEMENTS AT 30 jUNE 2013
1.5.1. Cash Flow Statementjune-13 dec-12 june-12
Pre-tax net income 1 161 540 2 150 943 744 915+/- Net depreciation/amortization expense on property, plant, and equipment and intangible assets 1 643 226 3 054 760 1 483 097+/- Impairment of goodwill and other non- current assets 0 0 0+/- Impairment of financial assets -19 056 109 300 29 606+/- Net allowances for provisions 592 166 665 231 939 009+/- Share of earnings in subsidiaries accounted for by equity method -41 545 -55 215 -31 916+/- Net loss (income) from investing activities -435 601 -990 901 -420 746+/- Net loss (income) from financing activities 0 0 0+/- Other movements -528 220 195 374 -116 826Non monetary items included in pre-tax net income and other adjustments 1 210 970 2 978 549 1 882 224+/- Cash flows related to transactions with credit institutions -1 290 280 13 027 531 9 530 466+/- Cash flows related to transactions with customers -737 510 -14 814 540 -14 115 328+/- Cash flows related to transactions involving other financial assets and liabilities 5 313 867 -2 343 396 -423 774+/- Cash flows related to transactions involving non financial assets and liabilities -5 969 757 3 581 880 2 931 019+/- Taxes paid -213 844 -602 893 -271 580Net Increase (Decrease) in cash related to assets and liabilities generated by operating activities -2 897 524 -1 151 418 -2 349 197Net Cash Flows from Operating Activities -525 014 3 978 074 277 942+/- Cash flows related to financial assets and equity investments -842 609 -1 093 317 -435 023+/- Cash flows related to investment property -107 -286 -284+/- Cash flows related to PP&E and intangible assets -790 633 -528 089 -555 044Net Cash Flows from Investing Activities -1 633 348 -1 621 692 -990 351+/- Cash flows related to transactions with shareholders -1 031 226 1 096 982 -893 348+/- Cash flows generated by other financing activities -1 371 329 1 949 786 519 848Net Cash Flows from Financing Activities -2 402 554 3 046 768 -373 500Effect of movements in exchange rates on cash and equivalents -57 542 57 761 -6 490Net Increase in Cash and equivalents -4 618 459 5 460 911 -1 092 399Beginning Balance of Cash and Equivalents 16 098 912 10 638 001 10 638 001Net Balance of cash accounts and accounts with central banks and post office banks 9 854 817 6 391 958 6 391 958Net Balance of demand loans and deposits- credit institutions 6 244 095 4 246 043 4 246 043Ending Balance of Cash and Equivalents 11 480 453 16 098 912 9 545 602Net Balance of cash accounts and accounts with central banks and post office banks 9 699 147 9 854 817 7 389 560Net Balance of demand loans and deposits- credit institutions 1 781 305 6 244 095 2 156 042Net increase in cash and equivalents -4 618 458 5 460 911 -1 092 399
(In thousand MAD)
1.5.2. Cash Flow Statement by geographical Region
MOROCCO EUROPE AFRICAPre-tax net income 624 147 42 714 494 679+/- Net depreciation/amortization expense on property, plant, and equipment and intangible assets 1 483 731 9 989 149 506+/- Impairment of goodwill and other non- current assets -45 590 142 45 448+/- Impairment of financial assets -19 056 0 0+/- Net allowances for provisions 282 959 10 601 298 606+/- Share of earnings in subsidiaries accounted for by equity method -10 535 0 -31 010+/- Net loss (income) from investing activities -312 820 -3 884 -118 897+/- Net loss (income) from financing activities 0 0 0+/- Other movements -545 979 1 942 15 817Non monetary items included in pre-tax net income and other adjustments 832 710 18 790 359 470+/- Cash flows related to transactions with credit institutions -1 208 414 387 915 -469 781+/- Cash flows related to transactions with customers -2 048 883 126 670 1 184 703+/- Cash flows related to transactions involving other financial assets and liabilities 5 316 917 17 334 -20 384+/- Cash flows related to transactions involving non financial assets and liabilities -5 981 516 -89 530 101 289+/- Taxes paid -107 241 0 -106 603Net Increase (Decrease) in cash related to assets and liabilities generated by operating activities -4 029 138 442 390 689 224Net Cash Flows from Operating Activities -2 572 279 503 894 1 543 371+/- Cash flows related to financial assets and equity investments -492 432 0 -350 177+/- Cash flows related to investment property -107 0 0+/- Cash flows related to PP&E and intangible assets -332 538 -6 404 -451 690Net Cash Flows from Investing Activities -825 077 -6 404 -801 867+/- Cash flows related to transactions with shareholders -505 102 -27 474 -498 650+/- Cash flows generated by other financing activities 87 670 -722 694 -736 305Net Cash Flows from Financing Activities -417 432 -750 168 -1 234 955Effect of movements in exchange rates on cash and equivalents -415 -35 313 -21 813Net Increase in Cash and equivalents -3 815 203 -287 991 -515 264Beginning Balance of Cash and Equivalents 6 635 988 551 901 8 911 023Net Balance of cash accounts and accounts with central banks and post office banks 3 764 729 -12 496 6 102 585Net Balance of demand loans and deposits- credit institutions 2 871 259 564 397 2 808 438Ending Balance of Cash and Equivalents 2 820 785 263 910 8 395 758Net Balance of cash accounts and accounts with central banks and post office banks 2 690 198 -26 793 7 035 742Net Balance of demand loans and deposits- credit institutions 130 587 290 703 1 360 015Net increase in cash and equivalents -3 815 203 -287 991 -515 264
(In thousand MAD)
10
1.6. SUMMARy OF ACCOUNTINg POLICIES APPLIED By THE gROUP
1.6.1. Applicable accounting standards
The first consolidated financial statements to be prepared by BMCE Bank Group in accordance with international accounting standards (IFRS) were those for the period ended 30 June 2008 with an opening balance on 1 January 2007.
The consolidated financial statements of BMCE Bank Group have been prepared in accordance with international accounting standards (International Financial Reporting Standards – IFRS), as approved by the IASB.
The Group produces the notes relating to the intermediate situation in accordance with IAS 34.
1.6.2. Consolidation principles
a. Scope of consolidation
The scope of consolidation includes all Moroccan and foreign entities in which the Group directly or indirectly holds a stake.
BMCE Bank Group includes within its scope of consolidation all entities, whatever their activity, in which it directly or indirectly holds 20% or more of existing or potential voting rights. In addition, it consolidates entities if they meet the following criteria:
• The subsidiary’s total assets exceed 0.5% of the parent company’s;
• The subsidiary’s net assets exceed 0.5% of the parent company’s;
• The subsidiary’s banking income exceeds 0.5% of the parent company’s ;
• “Cumulative” thresholds which ensure that the combined total of entities excluded from the scope of consolidation does not exceed 5% of the consolidated total.
b. Consolidation methods
The method of consolidation adopted (fully consolidated or accounted for under the equity method) will depend on whether the Group has full control, joint control or exercises significant influence.
At 30 june 2013, no Group subsidiary was jointly controlled.
c. Consolidation rules
The consolidated financial statements are prepared using uniform accounting policies for reporting like transactions and other events in similar circumstances.
Elimination of intragroup balances and transactions
Intragroup balances arising from transactions between consolidated companies, and the transactions themselves, including income, expenses and dividends, are eliminated. Profits and losses arising from intragroup sales of assets are eliminated, except where there is an indication that the asset sold is impaired.
Translation of financial statements prepared in foreign currencies
BMCE Bank Group’s consolidated financial statements are
prepared in dirhams. The financial statements of companies whose functional currency is not the dirham are translated using the closing rate method. Under this method, all assets and liabilities, both monetary and non-monetary, are translated using the spot exchange rate at the balance sheet date. Income and expenditures are translated at the average rate for the period.
d. Business combinations and measurement of goodwill
Cost of a business combination
The cost of a business combination is measured as the aggregate fair value of assets acquired, liabilities incurred or assumed and equity instruments issued by the acquirer in consideration for control of the acquired company. Costs attributable to the acquisition are recognised through income.
Allocating the cost of a business combination to the assets acquired and liabilities incurred or assumed
The Group allocates, at the date of acquisition, the cost of a business combination by recognising those identifiable assets, liabilities and contingent liabilities of the acquired company which meet the criteria for fair value recognition at that date.
Any difference between the cost of the business combination and the Group’s share of the net fair value of the identifiable assets, liabilities and contingent liabilities is recognised under goodwill.
goodwill
At the date of acquisition, goodwill is recognised as an asset. It is initially measured at cost, that is, the difference between the cost of the business combination over the Group’s share of the net fair value of the identifiable assets, liabilities and contingent liabilities.
The Group has adopted from 2012 the “full goodwill” method for new acquisitions. This method consists of measuring goodwill based on the difference between the cost of the business combination and minority interests over the fair value of the identifiable assets, liabilities and contingent liabilities.
It is worth noting that the Group has not restated business combinations occurring before 1 January 2008, the date of first-time adoption of IFRS, in accordance with IFRS 3 and as permitted under IFRS 1.
Measurement of goodwill
Following initial recognition, goodwill is measured at cost less cumulative impairment.
In accordance with IAS 36, impairment tests must be conducted whenever there is any indication of impairment that a unit may be impaired and at least once a year to ensure that the goodwill recognised for each CGU does not need to be written down.
The recoverable amount of a cash-generating unit is the higher of the net fair value of the unit and its value in use.
Value in use is based on an estimate of the current value of future cash flows generated by the unit’s activities as part of the Bank’s market activities:
11
• If the subsidiary’s recoverable amount is more than the carrying amount, then there is no reason to book an impairment charge;
• If the subsidiary’s recoverable amount is less than the carrying amount, the difference is recognised as an impairment charge. It will be allocated to goodwill as a priority and subsequently to other assets on a pro-rata basis.
The Bank has employed a variety of methods for measuring CGU value in use depending on the subsidiary. These methods are based on assumptions and estimates:
• A revenue-based approach, commonly known as the “dividend discount model”, is a standard method used by the banking industry. The use of this method depends on the subsidiary’s business plan and will value the subsidiary based on the net present value of future dividend payments. These flows are discounted at the cost of equity.
• The “discounted cash flow method” is a standard method for measuring firms in the services sector. It is based on discounting available cash flows at the weighted average cost of capital.
Step acquisitions
In accordance with revised IFRS 3, the Group does not calculate additional goodwill on step acquisitions once control has been obtained.
In particular, in the event that the Group increases its percentage interest in an entity which is already fully consolidated, the difference at acquisition date between the cost of acquiring the additional share and share already acquired in the entity is recognised in the Group’s consolidated reserves.
1.6.3. Financial assets and liabilities
a. Loans and receivables
Loans and receivables include loans provided by the Group.
Loans and receivables are initially measured at fair value or equivalent, which, as a general rule, is the net amount disbursed at inception including directly attributable origination costs and certain types of fees or commission (syndication commission, commitment fees and handling charges) that are regarded as an adjustment to the effective interest rate on the loan.
Loans and receivables are subsequently measured at amortised cost. The income from the loan, representing interest plus transaction costs and fees and commission included in the initial value of the loan, is calculated using the effective interest method and taken to income over the life of the loan.
b. Securities
Classification of securities
Securities held by the Group are classified under one of three categories.
Financial assets at fair value through P&L
This category includes financial assets and liabilities held for trading purposes. They are measured at fair value at
the balance sheet date under “financial assets at fair value through P&L”. Changes in fair value are recognised in the income statement under “Net gains or losses on financial instruments at fair value through P&L”.
It is worth noting that the Group has not designated, on initial recognition, non-derivative financial assets and liabilities at fair value through income using option available under IAS 39.
Held-to-maturity financial assets
Held-to-maturity financial assets include securities with fixed or determinable payments and fixed maturity securities that the Group has the intention and ability to hold until maturity.
Assets in this category are accounted for at amortised cost using the effective interest method, which builds in amortisation of premium and discount, corresponding to the difference between the asset’s purchase price and redemption value and acquisition costs, if material. They may be written down, if applicable, in the event of issuer default. Income earned from this category of assets is included in “Interest and similar income” in the income statement.
Available-for-sale financial assets
Available-for-sale financial assets are fixed income and floating rate securities other than those classified under the two previous categories.
Assets included in the available-for-sale category are initially recognised at fair value plus transaction costs, if material. At the balance sheet date, they are re-measured at fair value, with changes in fair value shown on a separate line in shareholders’ equity. Upon disposal, these unrealised gains and losses are transferred from shareholders’ equity to the income statement, where they are shown on the line “Net gains or losses on available-for-sale financial assets”. The same applies in the event of impairment.
Income recognised using the effective interest method for fixed income available-for-sale securities is recorded under “Interest and similar income” in the income statement.
Dividend income from floating rate securities is recognised under “Net gains or losses on available-for-sale financial assets” when the Group’s right to receive payment is established.
Temporary acquisitions and sales
Repurchase agreements
Securities subject to repurchase agreements are recorded in the Group’s balance sheet in their original category.
The corresponding liability is recognised in the under “Borrowings” as a liability on the balance sheet.
Securities temporarily acquired under reverse repurchase agreements are not recognised in the Group’s balance sheet. The corresponding receivable is recognised under “Loans and receivables”.
Securities lending and borrowing transactions
Securities lending transactions do not result in de-

12
recognition of the lent securities while securities borrowing transactions result in recognition of a debt on the liabilities side of the Group’s balance sheet.
Date of recognition of securities transactions
Securities recognised at fair value through income or classified under held-to-maturity or available-for-sale financial assets are recognised at the trade date.
Regardless of their classification (recognised as loans and receivables or debt), temporary sales of securities as well as sales of borrowed securities are initially recognised at the settlement date.
These transactions are carried on the balance sheet until the Group’s rights to receive the related cash flows expire or until the Group has substantially transferred all the risks and rewards related to ownership of the securities.
c. Foreign currency transactions
Monetary assets and liabilities denominated in foreign currencies
At each balance sheet date, the Group determines whether there is objective evidence of impairment to a financial asset or group of financial assets as a result of an event or several events occurring after initial recognition, whether this event affects the amount or timing of future cash flows and whether the consequences of the event can be reliably measured.
The Group assesses, in the first instance, whether there is objective evidence of impairment on an individual basis for individually material assets or on a collective basis for financial assets which are not individually material.
If the Group determines that there is no objective evidence of impairment to a financial asset, whether considered individually material or not, it includes this asset within a group of financial assets with a similar credit risk profile and subjects them to an impairment test on a collective basis.
At an individual level, objective evidence that a financial asset is impaired includes observable data relating to the following events:
• The existence of accounts which are past the due date;
• Any knowledge or evidence that the borrower is experiencing significant financial difficulty, such that a risk can be considered to have arisen, regardless of whether the borrower has missed any payments;
• Concessions in respect of the credit terms granted to the borrower that the lender would not have considered had the borrower not been experiencing financial difficulty.
Impairment is measured as the difference between the carrying amount and the present value, discounted at the asset’s original effective interest rate, of those components (principal, interest, collateral, etc.) regarded as recoverable.
The Group’s portfolio doubtful loan portfolio is categorised as follows :
Individually material loans : Each of these loans is reviewed individually in order to estimate recovery payments and
determine recovery schedules. Impairment under IFRS relates to the difference between amounts owing and the net present value of expected recovered payments.
Non-individually material loans : Loans not reviewed on an individual basis are segmented into different risk categories having similar characteristics and are assessed using a statistical model, based on historical data, of annual recovery payments by each risk category.
Counterparties not showing any evidence of impairment
These loans are risk-assessed on a portfolio basis with similar characteristics. This assessment draws upon historical data, adjusted if necessary to reflect circumstances prevailing at the balance sheet date. This analysis enables the Group to identify counterparty groups which, as a result of events occurring since inception of the loans, have collectively acquired a probability of default at maturity that provides objective evidence of impairment of the entire portfolio but without it being possible at that stage to allocate the impairment to individual counterparties.
This analysis also estimates the loss relating to the portfolios in question, taking account of trends in the economic cycle during the assessment period.
Based on the experienced judgement of the Bank’s divisions or Risk Division, the Group may recognise additional collective impairment provisions in respect of an economic sector or geographical region affected by exceptional economic events. In this regard the Group established watch lists of the accounts at risk.
Provisions and provision write-backs are recognised in the income statement under “Cost of risk” while the theoretical income earned on the carrying amount of impaired loans is recognised under “Interest and similar income” in the income statement.
Impairment of available-for-sale financial assets
Impairment of “available-for-sale financial assets”, which mainly comprise equity instruments, is recognised through income if there is objective evidence of impairment as a result of one or more events occurring since acquisition.
The Group has determined two types of non-cumulative impairment for equity instruments recorded under “available-for-sale financial assets”. The first one is a significant decline in the security’s price. By “significant” is implied a fall of more than 40% from the acquisition price. The second is a prolonged decline, defined as an unrealised loss over a one-year period.
For financial instruments quoted on a liquid market, impairment is determined using quoted prices and, for unquoted financial instruments, is based on valuation models.
Impairment losses taken against equity securities are recognised as a component of net banking income under “Net gains or losses on available-for-sale financial assets” and may only be reversed through income after these securities are sold. Any subsequent decline in fair value constitutes an additional impairment loss, recognised in through income.
In the case of debt instruments, impairment is assessed

13
on the basis of the same criteria applied to loans and receivables, that is, on an individual basis if there is objective evidence of impairment or on a collective basis if there is no evidence of impairment.
Given the characteristics of its portfolio, the Group is not concerned by debt instruments.
Restructuring of assets classified as “Loans and receivables”
An asset classified in “Loans and receivables” is considered to be restructured due to the borrower’s financial difficulty when the Group, for economic or legal reasons related to the borrower’s financial difficulty, agrees to modify the terms of the original transaction that it would not otherwise consider, resulting in the borrower’s contractual obligation to the Group, measured at present value, being reduced compared with the original terms.
At the time of restructuring, a discount is applied to the loan to reduce its carrying amount to the present value of the new expected future cash flows discounted at the original effective interest rate.
The decrease in the asset value is recognised through income under “Cost of risk”.
For each loan, the discount is recalculated at the renegotiation date using original repayment schedules and renegotiation terms.
The discount is calculated as the difference between:
• The sum, at the renegotiation date, of the original contractual repayments discounted at the effective interest rate;
• The sum, at the renegotiation date, of the renegotiated contractual repayments discounted at the effective interest rate. The discount, net of amortisation, is recognised by reducing loan outstandings through income. Amortisation will be recognised under net banking income.
e. Issues of debt securities
Financial instruments issued by the Group are qualified as debt instruments if the Group company issuing the instruments has a contractual obligation to deliver cash or another financial asset to the holder of the instrument. The same applies if the Group is required to exchange financial assets or liabilities with another entity on terms that are potentially unfavourable to the Group, or to deliver a variable number of the Group’s treasury shares.
In the Group’s case, this concerns certificates of deposit issued by Group banks such as BMCE BANK and BANK OF AFRICA as well as notes issued by finance companies MAGHREBAIL and SALAFIN.
f. Treasury shares
“Treasury shares” refer to shares issued by the parent company, BMCE Bank SA, or by its fully consolidated subsidiaries. Treasury shares held by the Group are deducted from consolidated shareholders’ equity regardless of the purpose for which they are held. Gains and losses arising on such instruments are eliminated from the consolidated income statement.
At 30 june 2013 and at 31 December 2012, the Bank did not hold any treasury shares.
g. Derivative instruments
All derivative instruments are recognised in the balance sheet on the trade date at the trade price and are re-measured to fair value on the balance sheet date.
Derivatives held for trading purposes are recognised “Financial assets at fair value through income” when their fair value is positive and in “Financial liabilities at fair value through income” when their fair value is negative.
Realised and unrealised gains and losses are recognised in the income statement under “Net gains or losses on financial instruments at fair value through income”.
h. Determining the fair value of financial instruments
Fair value is defined as the amount for which an asset could be exchanged, or a liability settled, between knowledgeable, willing parties in an arm’s length transaction.
Financial assets classified under “Financial assets at fair value through income” and “Available-for-sale financial assets” are measured at fair value.
Fair value in the first instance relates to the quoted price if the financial instrument is traded on a liquid market.
If no liquid market exists, fair value is determined by using valuation techniques (internal valuation models as outlined in Note 4.15 on fair value).
Depending on the financial instrument, these involve the use of data taken from recent arm’s length transactions, the fair value of substantially similar instruments, discounted cash flow models or adjusted book values.
Characteristics of a liquid market include regularly available prices for financial instruments and the existence of real arm’s length transactions.
Characteristics of an illiquid market include factors such as a significant decline in the volume and level of market activity, a significant variation in available prices between market participants or a lack of recent observed transaction prices.
i. Income and expenses arising from financial assets and liabilities
The effective interest rate method is used to recognise income and expenses arising from financial instruments, which are measured at amortised cost.
The effective interest rate is the rate that exactly discounts estimated future cash flows through the expected life of the financial instrument or, when appropriate, a shorter period, to the net carrying amount of the asset or liability in the balance sheet. The effective interest rate calculation takes into account all fees received or paid that are an integral part of the effective interest rate of the contract, transaction costs, and premiums and discounts.
j. Cost of risk
“Cost of risk” includes impairment provisions net of write-backs and provisions for credit risk, losses on irrecoverable loans and amounts recovered on amortised loans as well as provisions and provision write-backs for other risks such as operating risks.
14
k. Offsetting financial assets and liabilities
A financial asset and a financial liability are offset and the net amount presented in the balance sheet if, and only if, the Group has a legally enforceable right to offset the recognised amounts and intends either to settle on a net basis or to realise the asset and settle the liability simultaneously.
1.6.4. Property plant and equipment and intangible assets
a. Property, plant and equipment
The Group has opted for the cost model to measure property, plant and equipment and intangible assets.
It is worth noting that, in application of the option provided under IFRS 1, the Group has chosen to measure certain items of property, plant and equipment at the transition date at their fair value and use this fair value as deemed cost at this date.
In accordance with IAS 23, borrowing costs directly attributable to the acquisition are included in the acquisition cost of items of property, plant and equipment.
As soon as they are available for use, items of property, plant and equipment are amortised over the asset’s estimated useful life.
Given the character of BMCE Bank Group’s property, plant and equipment, it has not adopted any residual value except for transport equipment owned by LOCASOM, a subsidiary.
In respect of the Group’s other assets, there is neither a sufficiently liquid market nor a replacement policy over a period that is considerably shorter than the estimated useful life for any residual value to be adopted.
This residual value is the amount remaining after deducting from the acquisition cost all allowable depreciable charges.
Given the Group’s activity, it has adopted a component-based approach for property. The option adopted by the Group is a component-based amortised cost method by applying using a component-based matrix established as a function of the specific characteristics of each of BMCE Bank Group’s buildings.
Component-based matrix adopted by BMCE BANK
Head office property Other propertyPeriod Share Period Share
Structural works 80 55% 80 65%Fasade 30 15%General & technical installations
20 20% 20 15%
Fixtures and fittings 10 10% 10 20%
Impairment
The Group has deemed that impairment is only applicable to buildings and, as a result, the market price (independently-assessed valuation) will be used as evidence of impairment.
b. Investment property
IAS 40 defines investment property as property held to earn rentals or for capital appreciation or both. An investment property generates cash flows that are largely independent from the company’s other assets in contrast to property primarily held for use in the production or supply of goods or services.
The Group qualifies investment property as any non-operating property.
BMCE Bank Group has opted for the cost method to value its investment property. The method used to value investment property is identical to that for valuing operating property.
c. Intangible assets
Intangible assets are initially measured at cost which is equal to the amount of cash or cash equivalent paid or any other consideration given at fair value to acquire the asset at the time of its acquisition or construction.
Subsequent to initial recognition, intangible assets are measured at cost less cumulative amortisation and impairment losses.
The amortisation method adopted reflects the rate at which future economic benefits are consumed.
Impairment is recognised when evidence (internal or external) of impairment exists. Evidence of impairment is assesses at each balance sheet date.
Given the character of the intangible assets held, the Group considers that the concept of residual value is not relevant in respect of its intangible assets. As a result, residual value has not been adopted.
1.6.5. Leases
Group companies may either be the lessee or the lessor in a lease agreement.
Leases contracted by the Group as lessor are categorised as either finance leases or operating leases.
a. Lessor accounting
Finance leases
In a finance lease, the lessor transfers the substantial portion of the risks and rewards of ownership of an asset to the lessee. It is treated as a loan made to the lessee to finance the purchase of the asset.
The present value of the lease payments, plus any residual value, is recognised as a receivable.
The net income earned from the lease by the lessor is equal to the amount of interest on the loan and is taken to the income statement under “Interest and other income”. The lease payments are spread over the lease term and are allocated to reducing the principal and to interest such that the net income reflects a constant rate of return on the outstanding balance. The rate of interest used is the rate implicit in the lease.
Individual and portfolio impairments of lease receivables are determined using the same principles as applied to other loans and receivables.
Operating leases

15
An operating lease is a lease under which the substantial portion of the risks and rewards of ownership of an asset are not transferred to the lessee.
The asset is recognised under property, plant and equipment in the lessor’s balance sheet and depreciated on a straight-line basis over the lease term. The depreciable amount excludes the asset’s residual value. The lease payments are taken to the income statement in full on a straight-line basis over the lease term.
Lease payments and depreciation expenses are taken to the income statement under “Income from other activities” and “Expenses from other activities”.
b. Lessee accounting
Leases contracted by the Group as lessee are categorised as either finance leases or operating leases.
Finance leases
A finance lease is treated as an acquisition of an asset by the lessee, financed by a loan. The leased asset is recognised in the balance sheet of the lessee at the lower of fair value or the present value of the minimum lease payments calculated at the interest rate implicit in the lease.
A matching liability, equal to the fair value of the leased asset or the present value of the minimum lease payments, is also recognised in the balance sheet of the lessee. The asset is depreciated using the same method as that applied to owned assets after deducting the residual value from the amount initially recognised over the useful life of the asset. The lease obligation is accounted for at amortised cost.
Operating leases
The asset is not recognised in the balance sheet of the lessee. Lease payments made under operating leases are taken to the lessee’s income statement on a straight-line basis over the lease term.
1.6.6. Non-current assets held for sale and discontinued activities
An asset is classified as held for sale if its carrying amount is obtained through the asset’s sale rather than through its continuous use in the business.
At 30 june 2013, the Group did not recognise any assets as held for sale or discontinued activities.
1.6.7. Employee benefits
Classification of employee benefits
a. Short-term benefits
Short-term benefits are due within twelve months of the close of the financial year in which employees provided the corresponding services. They are recognised as expenses in the year in which they are earned.
b. Defined-contribution post-employment benefits
The employer pays a fixed amount in respect of contributions into an external fund and has no other liability. Benefits received are determined on the basis of cumulative contributions paid plus any interest and are recognised as expenses in the year in which they are earned.
c. Defined-benefit post-employment benefits
Defined-benefit post-employment benefits are those other than defined-contribution schemes. The employer undertakes to pay a certain level of benefits to former employees, whatever the liability’s cover. This liability is recognised as a provision.
The Group accounts for end-of-career bonuses as defined-benefit post-employment benefits: these are bonuses paid on retirement and depend on employees’ length of service.
d. Long-term benefits
These are benefits which are not settled in full within twelve after the employee rendering the related service. Provisions are recognised if the benefit depends on employees’ length of service.
The Group accounts for long-service awards as long-term benefits: these are payments made to employees when they reach 6 different thresholds of length of service ranging from 15 to 40 years.
e. Termination benefits
Termination benefits are made as a result of a decision by the Group to terminate a contract of employment or a decision by an employee to accept voluntary redundancy. The company may set aside provisions if it is clearly committed to terminating an employee’s contract of employment.
a. Calculation method
The recommended method for calculating the liability under IAS 19 is the “projected unit credit” method. The calculation is made on an individual basis. The employer’s liability is equal to the sum of individual liabilities.
Under this method, the actuarial value of future benefits is determined by calculating the amount of benefits due on retirement based on salary projections and length of service at the retirement date. It takes into consideration variables such as discount rates, the probability of the employee remaining in service up until retirement as well as the likelihood of mortality.
The liability is equal to the actuarial value of future benefits in respect of past service within the company prior to the calculation date. This liability is determined by applying to the actuarial value of future benefits the ratio of length of service at the calculation date to length of service at the retirement date.
The annual cost of the scheme, attributable to the cost of an additional year of service for each participant, is determined by the ratio of the actuarial value of future benefits to the anticipated length of service on retirement.
b. Accounting principles
A provision is recognised under liabilities on the balance sheet to cover for all obligations.
Actuarial gains or losses arise on differences related to changes in assumptions underlying calculations (early retirement, discount rates etc.) or between actuarial assumptions and what actually occurs (rate of return on pension fund assets etc.) constitute.
16
The past service cost is spread over the remaining period for acquiring rights.
The annual expense recognised in the income statement under “Salaries and employee benefits” in respect of defined-benefit schemes comprises:
• The rights vested by each employee during the period (the cost of service rendered);
• The interest cost relating to the effect of discounting the obligation ;
• The expected income from the pension fund’s investments (gross rate of return);
• The effect of any plan curtailments or settlements.
1.6.8. Share-based payments
The Group offers its employees the possibility of participating in share issues in the form of share purchase plans.
New shares are offered at a discount on the condition that they retain the shares for a specified period.
The expense related to share purchase plans is spread over the vesting period if the benefit is conditional upon the beneficiary’s continued employment.
This expense, booked under “Salaries and employee benefits”, with a corresponding adjustment to shareholders’ equity, is calculated on the basis of the plan’s total value, determined at the allotment date by the Board of Directors.
In the absence of any market for these instruments, financial valuation models are used that take into account performance-based criteria relating to the BMCE Bank share price. The plan’s total expense is determined by multiplying the unit value per option or bonus share awarded by the estimated number of options or bonus shares acquired at the end of the vesting period, taking into account the conditions regarding the beneficiary’s continued employment.
1.6.9. Provisions recorded under liabilities
Provisions recorded under liabilities on the Group’s balance sheet, other than those relating to financial instruments and employee benefits mainly relate to restructuring, litigation, fines, penalties and tax risks.
A provision is recognised when it is probable that an outflow of resources providing economic benefits will be required to settle an obligation arising from a past event and a reliable estimate can be made about the obligation’s amount. The amount of such obligations is discounted in order to determine the amount of the provision if the impact of discounting is material.
A provision for risks and charges is a liability of uncertain timing or amount.
The accounting standard provides for three conditions when an entity must recognise a provision for risks and charges:
• A present obligation towards a third party ;
• An outflow of resources is probable in order to settle the obligation;
• The amount can be estimated reliably.
1.6.10. Current and deferred taxes
The current income tax charge is calculated on the basis of the tax laws and tax rates in force in each country in which the Group has operations.
Deferred taxes are recognised when temporary differences arise between the carrying amount of an asset or liability in the balance sheet and its tax base.
A deferred tax liability is a tax which is payable at a future date. Deferred tax liabilities are recognised for all taxable temporary differences other than those arising on initial recognition of goodwill or on initial recognition of an asset or liability for a transaction which is not a business combination and which, at the time of the transaction, has not impact on profit either for accounting or tax purposes.
A deferred tax asset is a tax which is recoverable at a future date. Deferred tax assets are recognised for all deductible temporary differences and unused carry-forwards of tax losses only to the extent that it is probable that the entity in question will generate future taxable profits against which these temporary differences and tax losses can be offset.
The Group has opted to assess the probability of recovering deferred tax assets.
Deferred taxes assets are not recognised if the probability of recovery is uncertain. Probability of recovery is ascertained by the business projections of the companies concerned.
1.6.11. Cash flow statement
The cash and cash equivalents balance is composed of the net balance of cash accounts and accounts with central banks and the net balances of sight loans and deposits with credit institutions.
Changes in cash and cash equivalents related to operating activities reflect cash flows generated by the Group’s operations, including cash flows related to investment property, held-to-maturity financial assets and negotiable debt instruments.
Changes in cash and cash equivalents related to investing activities reflect cash flows resulting from acquisitions and disposals of subsidiaries, associates or joint ventures included in the consolidated group, as well as acquisitions and disposals of property, plant and equipment excluding investment property and property held under operating leases.
Changes in cash and cash equivalents related to financing activities reflect the cash inflows and outflows resulting from transactions with shareholders, cash flows related to subordinated debt, bonds and debt securities (excluding negotiable debt instruments).
1.6.12. Use of estimates in the preparation of the financial statements
Preparation of the financial statements requires managers of business lines and corporate functions to make assumptions and estimates that are reflected in the measurement of income and expense in the income statement and of assets and liabilities in the balance sheet and in the disclosure of information in the notes to the financial statements.

17
This requires the managers in question to exercise their judgement and to make use of information available at the time of preparation of the financial statements when making their estimates.
The actual future results from operations where managers have made use of estimates may in reality differ significantly from those estimates depending on market conditions. This may have a material impact on the financial statements.
Those estimates which have a material impact on the financial statements primarily relate to:
• Impairment (on an individual or collective basis) recognised to cover credit risks inherent in banking intermediation activities ;
Other estimates made by the Group’s management primarily relate to :
• Goodwill impairment tests ;
• Provisions for employee benefits;
• The measurement of provisions for risks and charges.
18
II. NOTES TO THE INCOME STATEMENT FOR THE yEAR ENDED 30 jUNE 2013
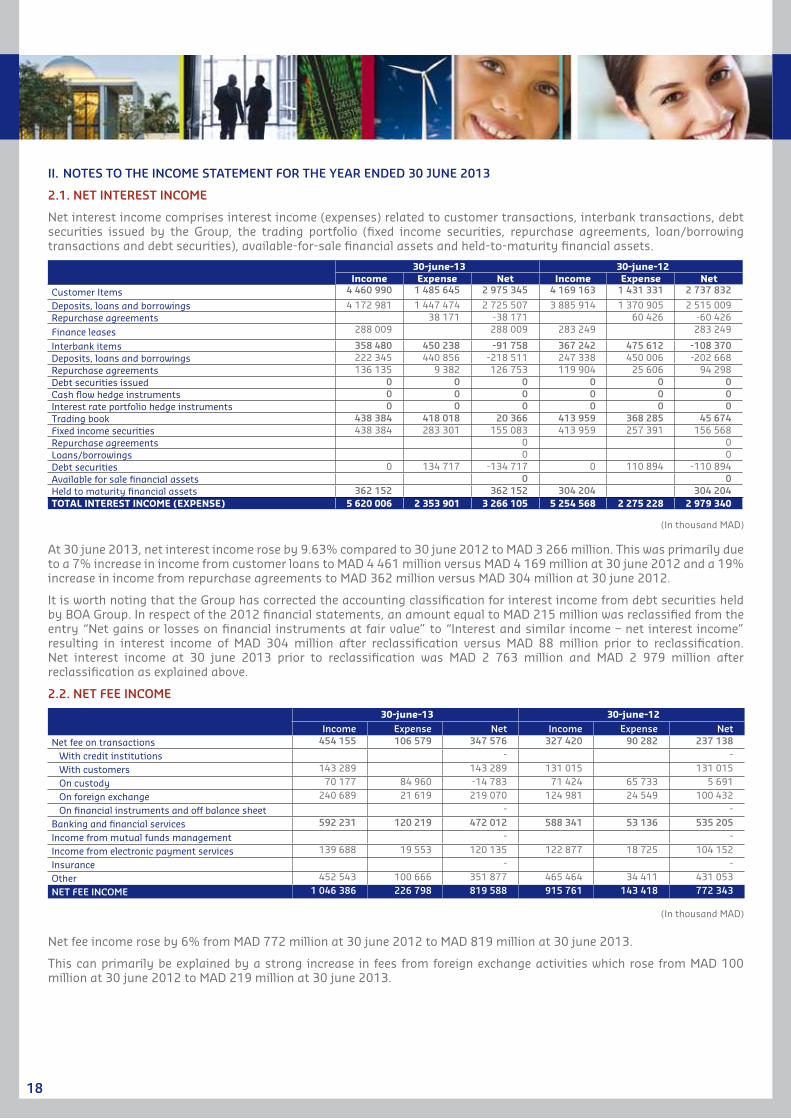
2.1. NET INTEREST INCOME
Net interest income comprises interest income (expenses) related to customer transactions, interbank transactions, debt securities issued by the Group, the trading portfolio (fixed income securities, repurchase agreements, loan/borrowing transactions and debt securities), available-for-sale financial assets and held-to-maturity financial assets.
30-june-13 30-june-12Income Expense Net Income Expense Net
Customer Items 4 460 990 1 485 645 2 975 345 4 169 163 1 431 331 2 737 832
Deposits, loans and borrowings 4 172 981 1 447 474 2 725 507 3 885 914 1 370 905 2 515 009Repurchase agreements 38 171 -38 171 60 426 -60 426
Finance leases 288 009 288 009 283 249 283 249
Interbank items 358 480 450 238 -91 758 367 242 475 612 -108 370Deposits, loans and borrowings 222 345 440 856 -218 511 247 338 450 006 -202 668Repurchase agreements 136 135 9 382 126 753 119 904 25 606 94 298Debt securities issued 0 0 0 0 0 0Cash flow hedge instruments 0 0 0 0 0 0Interest rate portfolio hedge instruments 0 0 0 0 0 0Trading book 438 384 418 018 20 366 413 959 368 285 45 674Fixed income securities 438 384 283 301 155 083 413 959 257 391 156 568Repurchase agreements 0 0Loans/borrowings 0 0Debt securities 0 134 717 -134 717 0 110 894 -110 894Available for sale financial assets 0 0Held to maturity financial assets 362 152 362 152 304 204 304 204TOTAL INTEREST INCOME (ExPENSE) 5 620 006 2 353 901 3 266 105 5 254 568 2 275 228 2 979 340
(In thousand MAD)
At 30 june 2013, net interest income rose by 9.63% compared to 30 june 2012 to MAD 3 266 million. This was primarily due to a 7% increase in income from customer loans to MAD 4 461 million versus MAD 4 169 million at 30 june 2012 and a 19% increase in income from repurchase agreements to MAD 362 million versus MAD 304 million at 30 june 2012.
It is worth noting that the Group has corrected the accounting classification for interest income from debt securities held by BOA Group. In respect of the 2012 financial statements, an amount equal to MAD 215 million was reclassified from the entry “Net gains or losses on financial instruments at fair value” to “Interest and similar income – net interest income” resulting in interest income of MAD 304 million after reclassification versus MAD 88 million prior to reclassification. Net interest income at 30 june 2013 prior to reclassification was MAD 2 763 million and MAD 2 979 million after reclassification as explained above.
2.2. NET FEE INCOME
30-june-13 30-june-12
Income Expense Net Income Expense NetNet fee on transactions 454 155 106 579 347 576 327 420 90 282 237 138
With credit institutions - -
With customers 143 289 143 289 131 015 131 015
On custody 70 177 84 960 -14 783 71 424 65 733 5 691
On foreign exchange 240 689 21 619 219 070 124 981 24 549 100 432
On financial instruments and off balance sheet - -
Banking and financial services 592 231 120 219 472 012 588 341 53 136 535 205
Income from mutual funds management - -
Income from electronic payment services 139 688 19 553 120 135 122 877 18 725 104 152
Insurance - -
Other 452 543 100 666 351 877 465 464 34 411 431 053
NET FEE INCOME 1 046 386 226 798 819 588 915 761 143 418 772 343
(In thousand MAD)
Net fee income rose by 6% from MAD 772 million at 30 june 2012 to MAD 819 million at 30 june 2013.
This can primarily be explained by a strong increase in fees from foreign exchange activities which rose from MAD 100 million at 30 june 2012 to MAD 219 million at 30 june 2013.
19
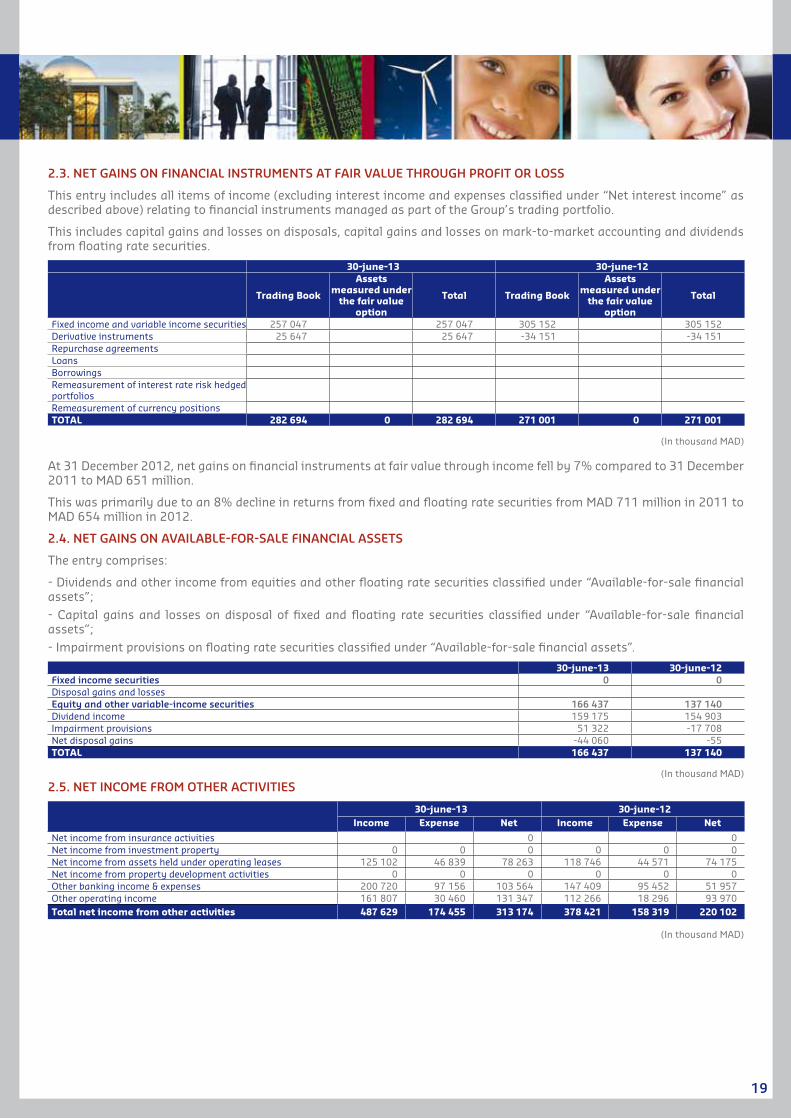
2.3. NET gAINS ON FINANCIAL INSTRUMENTS AT FAIR vALUE THROUgH PROFIT OR LOSS
This entry includes all items of income (excluding interest income and expenses classified under “Net interest income” as described above) relating to financial instruments managed as part of the Group’s trading portfolio.
This includes capital gains and losses on disposals, capital gains and losses on mark-to-market accounting and dividends from floating rate securities.
30-june-13 30-june-12
Trading Book
Assets measured under
the fair value option
Total Trading Book
Assets measured under
the fair value option
Total
Fixed income and variable income securities 257 047 257 047 305 152 305 152Derivative instruments 25 647 25 647 -34 151 -34 151Repurchase agreementsLoansBorrowingsRemeasurement of interest rate risk hedged portfoliosRemeasurement of currency positionsTOTAL 282 694 0 282 694 271 001 0 271 001
(In thousand MAD)
At 31 December 2012, net gains on financial instruments at fair value through income fell by 7% compared to 31 December 2011 to MAD 651 million.
This was primarily due to an 8% decline in returns from fixed and floating rate securities from MAD 711 million in 2011 to MAD 654 million in 2012.
2.4. NET gAINS ON AvAILABLE-FOR-SALE FINANCIAL ASSETS
The entry comprises:
- Dividends and other income from equities and other floating rate securities classified under “Available-for-sale financial assets”;- Capital gains and losses on disposal of fixed and floating rate securities classified under “Available-for-sale financial assets”;- Impairment provisions on floating rate securities classified under “Available-for-sale financial assets”.
30-june-13 30-june-12Fixed income securities 0 0Disposal gains and lossesEquity and other variable-income securities 166 437 137 140Dividend income 159 175 154 903Impairment provisions 51 322 -17 708Net disposal gains -44 060 -55TOTAL 166 437 137 140
(In thousand MAD)
2.5. NET INCOME FROM OTHER ACTIvITIES
30-june-13 30-june-12Income Expense Net Income Expense Net
Net income from insurance activities 0 0Net income from investment property 0 0 0 0 0 0Net income from assets held under operating leases 125 102 46 839 78 263 118 746 44 571 74 175Net income from property development activities 0 0 0 0 0 0Other banking income & expenses 200 720 97 156 103 564 147 409 95 452 51 957Other operating income 161 807 30 460 131 347 112 266 18 296 93 970Total net income from other activities 487 629 174 455 313 174 378 421 158 319 220 102
(In thousand MAD)
20
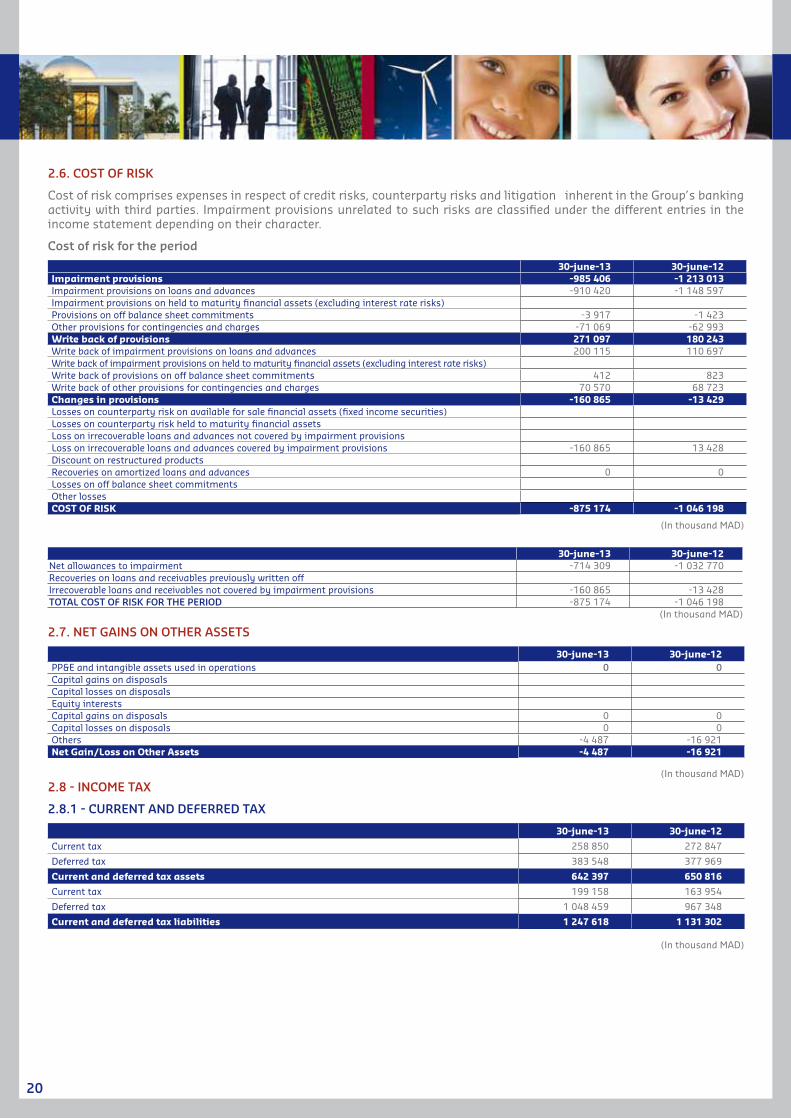
2.6. COST OF RISK
Cost of risk comprises expenses in respect of credit risks, counterparty risks and litigation inherent in the Group’s banking activity with third parties. Impairment provisions unrelated to such risks are classified under the different entries in the income statement depending on their character.
Cost of risk for the period
30-june-13 30-june-12Impairment provisions -985 406 -1 213 013Impairment provisions on loans and advances -910 420 -1 148 597Impairment provisions on held to maturity financial assets (excluding interest rate risks)Provisions on off balance sheet commitments -3 917 -1 423Other provisions for contingencies and charges -71 069 -62 993Write back of provisions 271 097 180 243Write back of impairment provisions on loans and advances 200 115 110 697Write back of impairment provisions on held to maturity financial assets (excluding interest rate risks)Write back of provisions on off balance sheet commitments 412 823Write back of other provisions for contingencies and charges 70 570 68 723Changes in provisions -160 865 -13 429Losses on counterparty risk on available for sale financial assets (fixed income securities)Losses on counterparty risk held to maturity financial assets Loss on irrecoverable loans and advances not covered by impairment provisions Loss on irrecoverable loans and advances covered by impairment provisions -160 865 13 428Discount on restructured products Recoveries on amortized loans and advances 0 0Losses on off balance sheet commitments Other lossesCOST OF RISK -875 174 -1 046 198
(In thousand MAD)
30-june-13 30-june-12Net allowances to impairment -714 309 -1 032 770Recoveries on loans and receivables previously written offIrrecoverable loans and receivables not covered by impairment provisions -160 865 -13 428TOTAL COST OF RISK FOR THE PERIOD -875 174 -1 046 198
(In thousand MAD)
2.7. NET gAINS ON OTHER ASSETS
30-june-13 30-june-12PP&E and intangible assets used in operations 0 0Capital gains on disposalsCapital losses on disposals Equity interestsCapital gains on disposals 0 0Capital losses on disposals 0 0Others -4 487 -16 921Net Gain/Loss on Other Assets -4 487 -16 921
(In thousand MAD)
2.8 - INCOME TAx
2.8.1 - CURRENT AND DEFERRED TAx
30-june-13 30-june-12
Current tax 258 850 272 847
Deferred tax 383 548 377 969
Current and deferred tax assets 642 397 650 816
Current tax 199 158 163 954
Deferred tax 1 048 459 967 348
Current and deferred tax liabilities 1 247 618 1 131 302
(In thousand MAD)
21
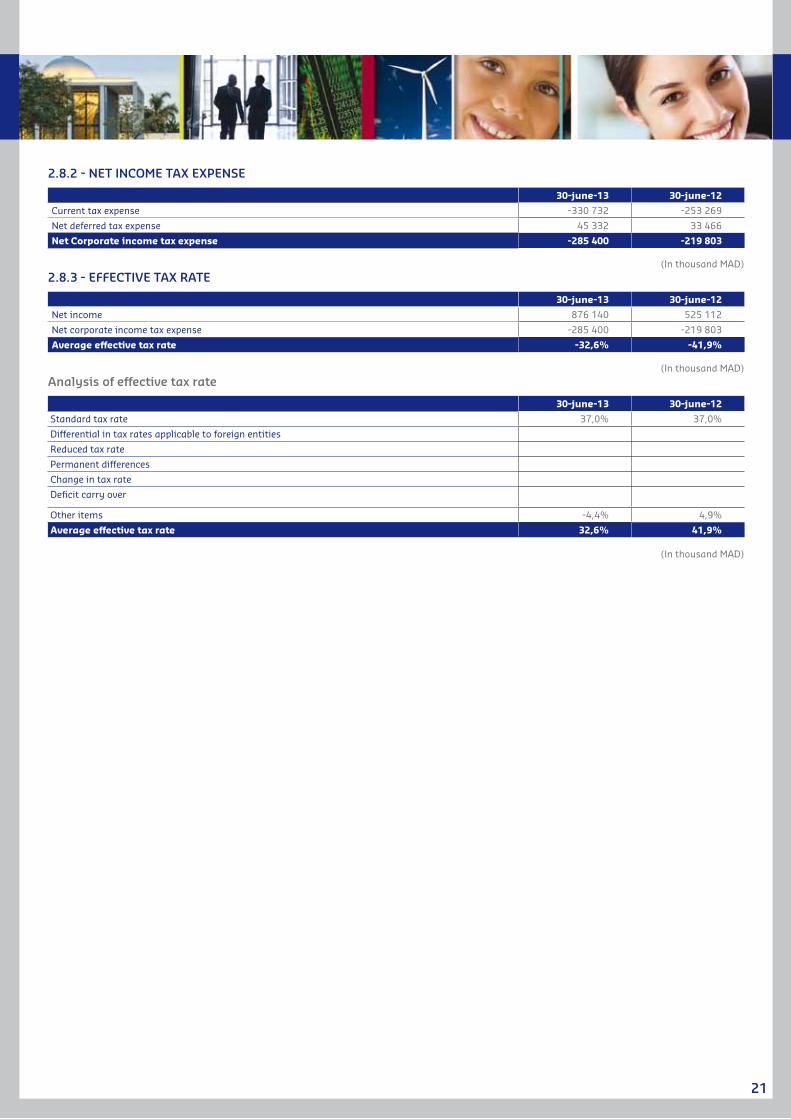
2.8.2 - NET INCOME TAx ExPENSE
30-june-13 30-june-12
Current tax expense -330 732 -253 269
Net deferred tax expense 45 332 33 466
Net Corporate income tax expense -285 400 -219 803
(In thousand MAD)
2.8.3 - EFFECTIvE TAx RATE
30-june-13 30-june-12
Net income 876 140 525 112
Net corporate income tax expense -285 400 -219 803
Average effective tax rate -32,6% -41,9%
(In thousand MAD)
Analysis of effective tax rate
30-june-13 30-june-12
Standard tax rate 37,0% 37,0%
Differential in tax rates applicable to foreign entities
Reduced tax rate
Permanent differences
Change in tax rate
Deficit carry over
Other items -4,4% 4,9%
Average effective tax rate 32,6% 41,9%
(In thousand MAD)
22
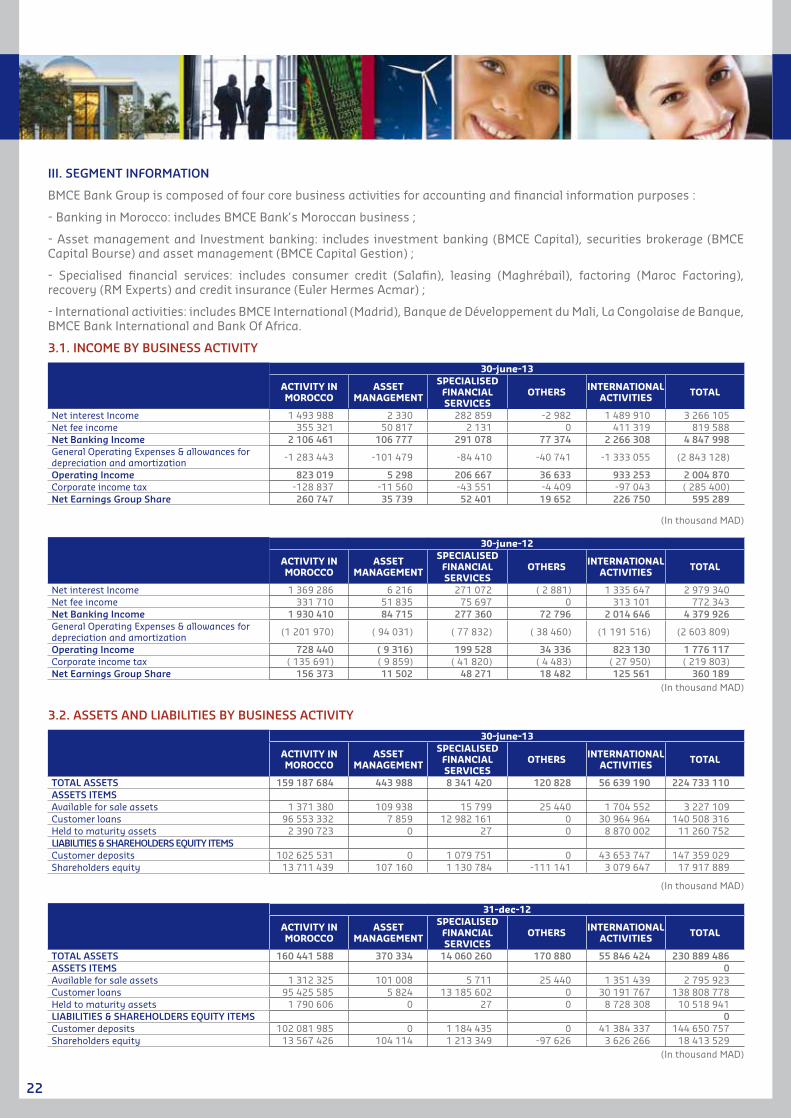
III. SEgMENT INFORMATION
BMCE Bank Group is composed of four core business activities for accounting and financial information purposes :
- Banking in Morocco: includes BMCE Bank’s Moroccan business ;
- Asset management and Investment banking: includes investment banking (BMCE Capital), securities brokerage (BMCE Capital Bourse) and asset management (BMCE Capital Gestion) ;
- Specialised financial services: includes consumer credit (Salafin), leasing (Maghrébail), factoring (Maroc Factoring), recovery (RM Experts) and credit insurance (Euler Hermes Acmar) ;
- International activities: includes BMCE International (Madrid), Banque de Développement du Mali, La Congolaise de Banque, BMCE Bank International and Bank Of Africa.
3.1. INCOME By BUSINESS ACTIvITy
30-june-13
ACTIVITY IN MOROCCO
ASSET MANAGEMENT
SPECIALISED FINANCIAL SERVICES
OTHERS INTERNATIONAL ACTIVITIES TOTAL
Net interest Income 1 493 988 2 330 282 859 -2 982 1 489 910 3 266 105Net fee income 355 321 50 817 2 131 0 411 319 819 588Net Banking Income 2 106 461 106 777 291 078 77 374 2 266 308 4 847 998General Operating Expenses & allowances for depreciation and amortization -1 283 443 -101 479 -84 410 -40 741 -1 333 055 (2 843 128)
Operating Income 823 019 5 298 206 667 36 633 933 253 2 004 870Corporate income tax -128 837 -11 560 -43 551 -4 409 -97 043 ( 285 400)Net Earnings group Share 260 747 35 739 52 401 19 652 226 750 595 289
(In thousand MAD)
30-june-12
ACTIVITY IN MOROCCO
ASSET MANAGEMENT
SPECIALISED FINANCIAL SERVICES
OTHERS INTERNATIONAL ACTIVITIES TOTAL
Net interest Income 1 369 286 6 216 271 072 ( 2 881) 1 335 647 2 979 340Net fee income 331 710 51 835 75 697 0 313 101 772 343Net Banking Income 1 930 410 84 715 277 360 72 796 2 014 646 4 379 926General Operating Expenses & allowances for depreciation and amortization (1 201 970) ( 94 031) ( 77 832) ( 38 460) (1 191 516) (2 603 809)
Operating Income 728 440 ( 9 316) 199 528 34 336 823 130 1 776 117Corporate income tax ( 135 691) ( 9 859) ( 41 820) ( 4 483) ( 27 950) ( 219 803)Net Earnings group Share 156 373 11 502 48 271 18 482 125 561 360 189
(In thousand MAD)
3.2. ASSETS AND LIABILITIES By BUSINESS ACTIvITy
30-june-13
ACTIVITY IN MOROCCO
ASSET MANAGEMENT
SPECIALISED FINANCIAL SERVICES
OTHERS INTERNATIONAL ACTIVITIES TOTAL
TOTAL ASSETS 159 187 684 443 988 8 341 420 120 828 56 639 190 224 733 110ASSETS ITEMSAvailable for sale assets 1 371 380 109 938 15 799 25 440 1 704 552 3 227 109Customer loans 96 553 332 7 859 12 982 161 0 30 964 964 140 508 316Held to maturity assets 2 390 723 0 27 0 8 870 002 11 260 752LIABILITIES & SHAREHOLDERS EqUITy ITEMSCustomer deposits 102 625 531 0 1 079 751 0 43 653 747 147 359 029Shareholders equity 13 711 439 107 160 1 130 784 -111 141 3 079 647 17 917 889
(In thousand MAD)
31-dec-12
ACTIVITY IN MOROCCO
ASSET MANAGEMENT
SPECIALISED FINANCIAL SERVICES
OTHERS INTERNATIONAL ACTIVITIES TOTAL
TOTAL ASSETS 160 441 588 370 334 14 060 260 170 880 55 846 424 230 889 486ASSETS ITEMS 0Available for sale assets 1 312 325 101 008 5 711 25 440 1 351 439 2 795 923Customer loans 95 425 585 5 824 13 185 602 0 30 191 767 138 808 778Held to maturity assets 1 790 606 0 27 0 8 728 308 10 518 941LIABILITIES & SHAREHOLDERS EqUITy ITEMS 0Customer deposits 102 081 985 0 1 184 435 0 41 384 337 144 650 757Shareholders equity 13 567 426 104 114 1 213 349 -97 626 3 626 266 18 413 529
(In thousand MAD)
23
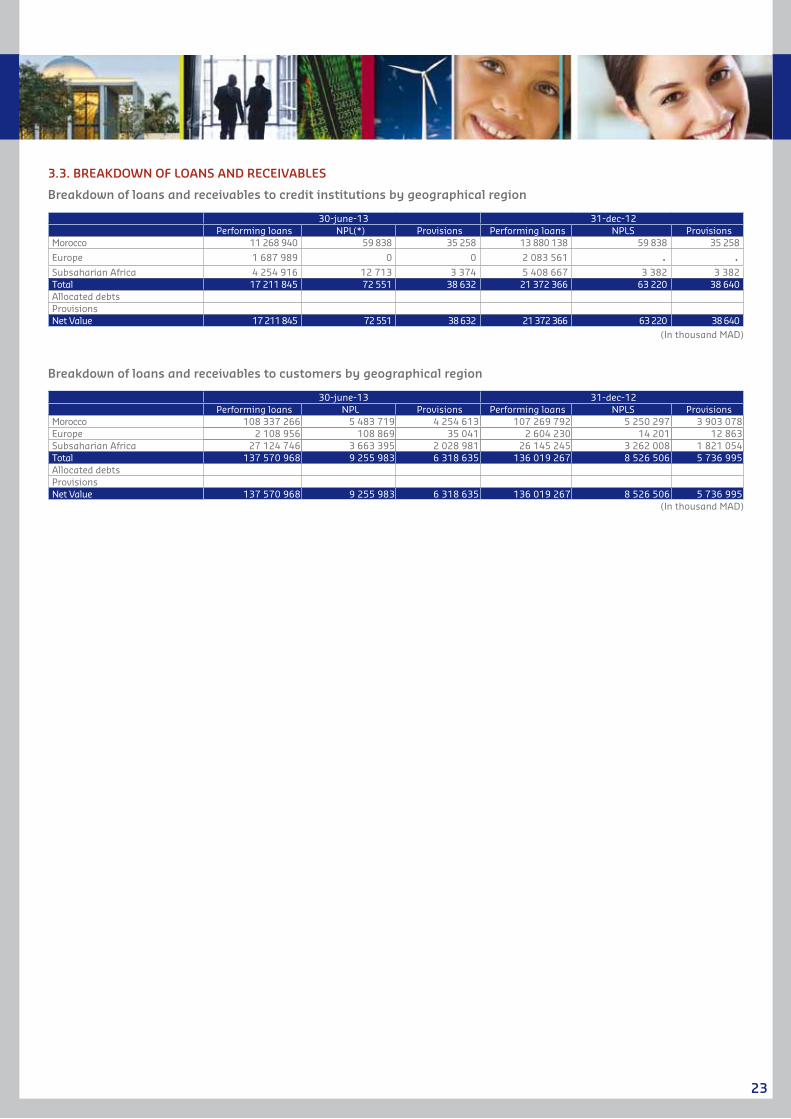
3.3. BREAKDOwN OF LOANS AND RECEIvABLES
Breakdown of loans and receivables to credit institutions by geographical region
30-june-13 31-dec-12Performing loans NPL(*) Provisions Performing loans NPLS Provisions
Morocco 11 268 940 59 838 35 258 13 880 138 59 838 35 258
Europe 1 687 989 0 0 2 083 561 0 0Subsaharian Africa 4 254 916 12 713 3 374 5 408 667 3 382 3 382Total 17 211 845 72 551 38 632 21 372 366 63 220 38 640Allocated debtsProvisionsNet Value 17 211 845 72 551 38 632 21 372 366 63 220 38 640
(In thousand MAD)
Breakdown of loans and receivables to customers by geographical region
30-june-13 31-dec-12Performing loans NPL Provisions Performing loans NPLS Provisions
Morocco 108 337 266 5 483 719 4 254 613 107 269 792 5 250 297 3 903 078Europe 2 108 956 108 869 35 041 2 604 230 14 201 12 863Subsaharian Africa 27 124 746 3 663 395 2 028 981 26 145 245 3 262 008 1 821 054Total 137 570 968 9 255 983 6 318 635 136 019 267 8 526 506 5 736 995Allocated debtsProvisionsNet Value 137 570 968 9 255 983 6 318 635 136 019 267 8 526 506 5 736 995
(In thousand MAD)
24
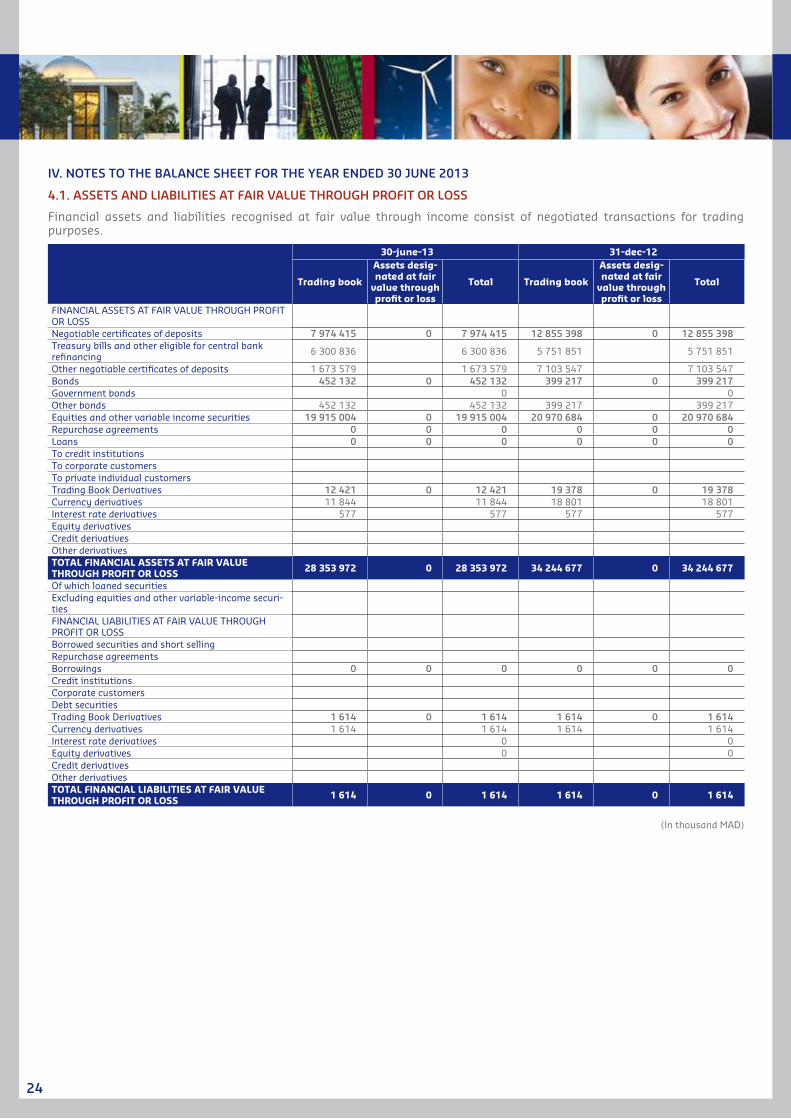
Iv. NOTES TO THE BALANCE SHEET FOR THE yEAR ENDED 30 jUNE 2013
4.1. ASSETS AND LIABILITIES AT FAIR vALUE THROUgH PROFIT OR LOSS
Financial assets and liabilities recognised at fair value through income consist of negotiated transactions for trading purposes.
30-june-13 31-dec-12
Trading book
Assets desig-nated at fair
value through profit or loss
Total Trading book
Assets desig-nated at fair
value through profit or loss
Total
FINANCIAL ASSETS AT FAIR VALUE THROUGH PROFIT OR LOSSNegotiable certificates of deposits 7 974 415 0 7 974 415 12 855 398 0 12 855 398Treasury bills and other eligible for central bank refinancing 6 300 836 6 300 836 5 751 851 5 751 851
Other negotiable certificates of deposits 1 673 579 1 673 579 7 103 547 7 103 547Bonds 452 132 0 452 132 399 217 0 399 217Government bonds 0 0Other bonds 452 132 452 132 399 217 399 217Equities and other variable income securities 19 915 004 0 19 915 004 20 970 684 0 20 970 684Repurchase agreements 0 0 0 0 0 0Loans 0 0 0 0 0 0To credit institutionsTo corporate customersTo private individual customersTrading Book Derivatives 12 421 0 12 421 19 378 0 19 378Currency derivatives 11 844 11 844 18 801 18 801Interest rate derivatives 577 577 577 577Equity derivativesCredit derivativesOther derivativesTOTAL FINANCIAL ASSETS AT FAIR VALUE THROUGH PROFIT OR LOSS 28 353 972 0 28 353 972 34 244 677 0 34 244 677
Of which loaned securitiesExcluding equities and other variable-income securi-tiesFINANCIAL LIABILITIES AT FAIR VALUE THROUGH PROFIT OR LOSSBorrowed securities and short sellingRepurchase agreementsBorrowings 0 0 0 0 0 0Credit institutionsCorporate customersDebt securitiesTrading Book Derivatives 1 614 0 1 614 1 614 0 1 614Currency derivatives 1 614 1 614 1 614 1 614Interest rate derivatives 0 0Equity derivatives 0 0Credit derivativesOther derivativesTOTAL FINANCIAL LIABILITIES AT FAIR VALUE THROUGH PROFIT OR LOSS 1 614 0 1 614 1 614 0 1 614
(In thousand MAD)
25
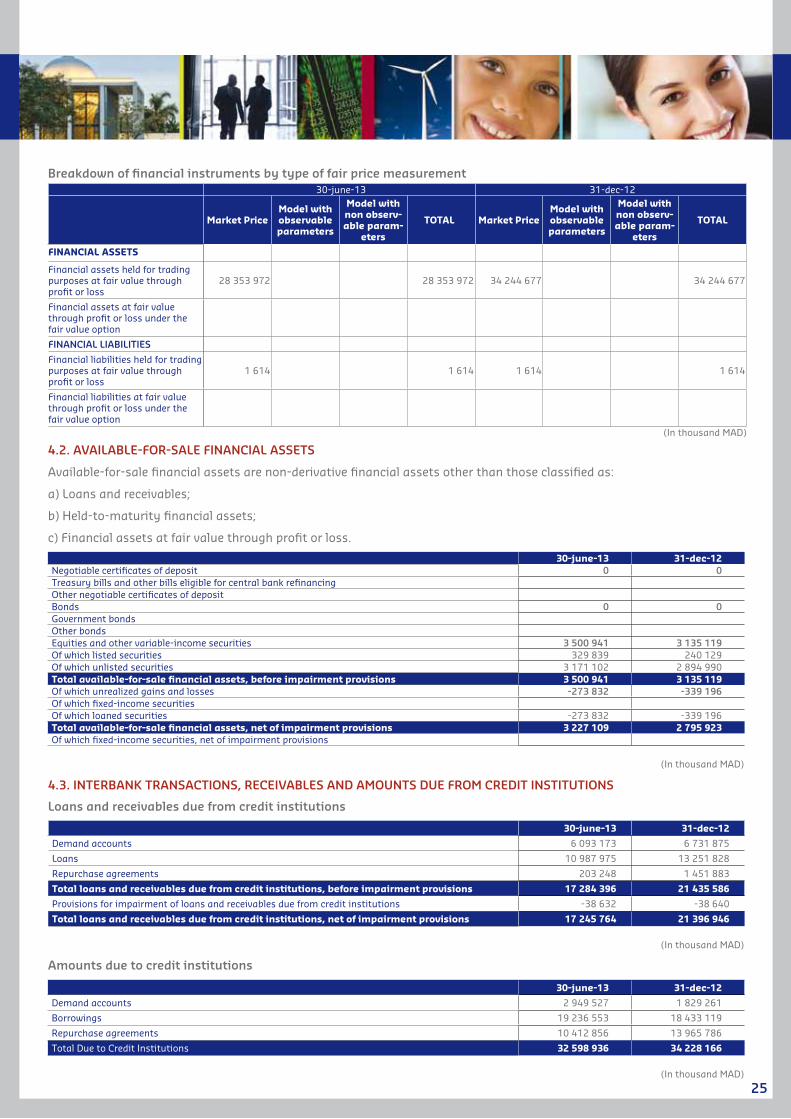
Breakdown of financial instruments by type of fair price measurement 30-june-13 31-dec-12
Market PriceModel with observable parameters
Model with non observ-able param-
eters
TOTAL Market PriceModel with observable parameters
Model with non observ-able param-
eters
TOTAL
FINANCIAL ASSETS
Financial assets held for trading purposes at fair value through profit or loss
28 353 972 28 353 972 34 244 677 34 244 677
Financial assets at fair value through profit or loss under the fair value option
FINANCIAL LIABILITIES
Financial liabilities held for trading purposes at fair value through profit or loss
1 614 1 614 1 614 1 614
Financial liabilities at fair value through profit or loss under the fair value option
(In thousand MAD)
4.2. AvAILABLE-FOR-SALE FINANCIAL ASSETS
Available-for-sale financial assets are non-derivative financial assets other than those classified as:
a) Loans and receivables;
b) Held-to-maturity financial assets;
c) Financial assets at fair value through profit or loss.
30-june-13 31-dec-12Negotiable certificates of deposit 0 0Treasury bills and other bills eligible for central bank refinancingOther negotiable certificates of depositBonds 0 0Government bondsOther bondsEquities and other variable-income securities 3 500 941 3 135 119Of which listed securities 329 839 240 129Of which unlisted securities 3 171 102 2 894 990Total available-for-sale financial assets, before impairment provisions 3 500 941 3 135 119Of which unrealized gains and losses -273 832 -339 196Of which fixed-income securitiesOf which loaned securities -273 832 -339 196Total available-for-sale financial assets, net of impairment provisions 3 227 109 2 795 923Of which fixed-income securities, net of impairment provisions
(In thousand MAD)
4.3. INTERBANK TRANSACTIONS, RECEIvABLES AND AMOUNTS DUE FROM CREDIT INSTITUTIONS
Loans and receivables due from credit institutions
30-june-13 31-dec-12
Demand accounts 6 093 173 6 731 875
Loans 10 987 975 13 251 828
Repurchase agreements 203 248 1 451 883
Total loans and receivables due from credit institutions, before impairment provisions 17 284 396 21 435 586
Provisions for impairment of loans and receivables due from credit institutions -38 632 -38 640
Total loans and receivables due from credit institutions, net of impairment provisions 17 245 764 21 396 946
(In thousand MAD)
Amounts due to credit institutions
30-june-13 31-dec-12
Demand accounts 2 949 527 1 829 261
Borrowings 19 236 553 18 433 119
Repurchase agreements 10 412 856 13 965 786
Total Due to Credit Institutions 32 598 936 34 228 166
(In thousand MAD)
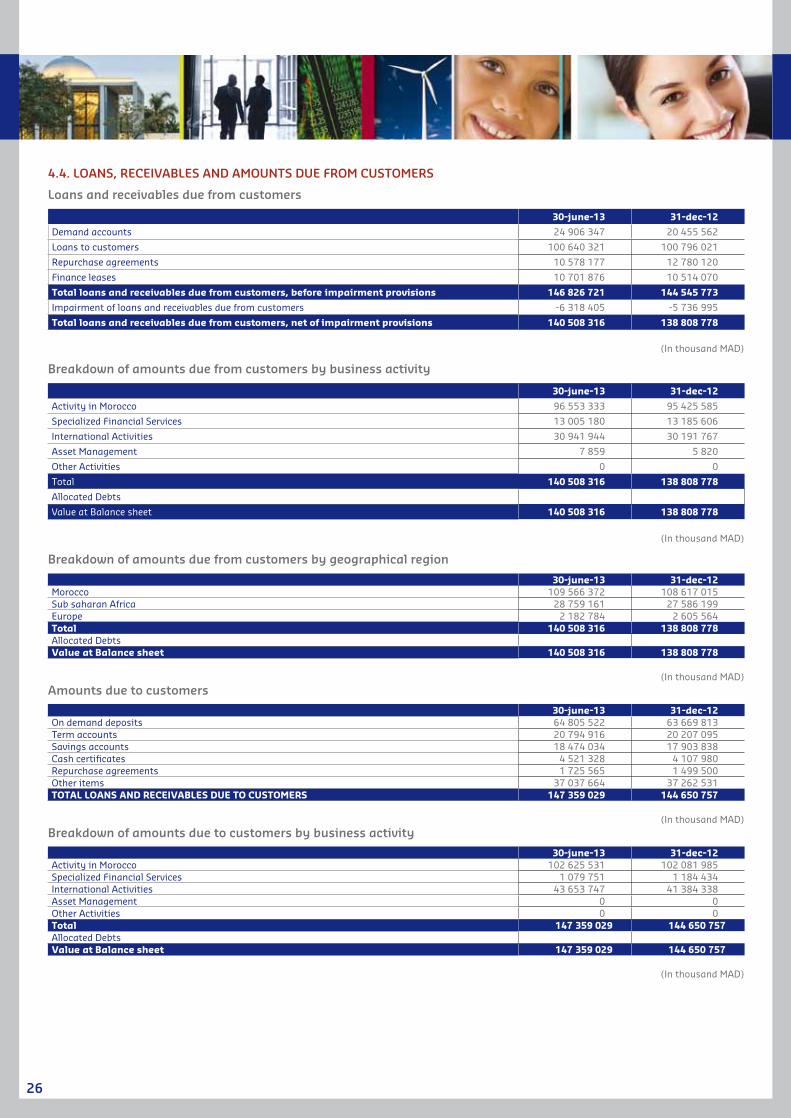
26
4.4. LOANS, RECEIvABLES AND AMOUNTS DUE FROM CUSTOMERS
Loans and receivables due from customers
30-june-13 31-dec-12
Demand accounts 24 906 347 20 455 562
Loans to customers 100 640 321 100 796 021
Repurchase agreements 10 578 177 12 780 120
Finance leases 10 701 876 10 514 070
Total loans and receivables due from customers, before impairment provisions 146 826 721 144 545 773
Impairment of loans and receivables due from customers -6 318 405 -5 736 995
Total loans and receivables due from customers, net of impairment provisions 140 508 316 138 808 778
(In thousand MAD)
Breakdown of amounts due from customers by business activity
30-june-13 31-dec-12
Activity in Morocco 96 553 333 95 425 585
Specialized Financial Services 13 005 180 13 185 606
International Activities 30 941 944 30 191 767
Asset Management 7 859 5 820
Other Activities 0 0
Total 140 508 316 138 808 778
Allocated Debts
Value at Balance sheet 140 508 316 138 808 778
(In thousand MAD)
Breakdown of amounts due from customers by geographical region
30-june-13 31-dec-12Morocco 109 566 372 108 617 015Sub saharan Africa 28 759 161 27 586 199Europe 2 182 784 2 605 564Total 140 508 316 138 808 778Allocated DebtsValue at Balance sheet 140 508 316 138 808 778
(In thousand MAD)
Amounts due to customers
30-june-13 31-dec-12On demand deposits 64 805 522 63 669 813Term accounts 20 794 916 20 207 095Savings accounts 18 474 034 17 903 838Cash certificates 4 521 328 4 107 980Repurchase agreements 1 725 565 1 499 500Other items 37 037 664 37 262 531TOTAL LOANS AND RECEIVABLES DUE TO CUSTOMERS 147 359 029 144 650 757
(In thousand MAD)
Breakdown of amounts due to customers by business activity
30-june-13 31-dec-12Activity in Morocco 102 625 531 102 081 985Specialized Financial Services 1 079 751 1 184 434International Activities 43 653 747 41 384 338Asset Management 0 0Other Activities 0 0Total 147 359 029 144 650 757Allocated DebtsValue at Balance sheet 147 359 029 144 650 757
(In thousand MAD)
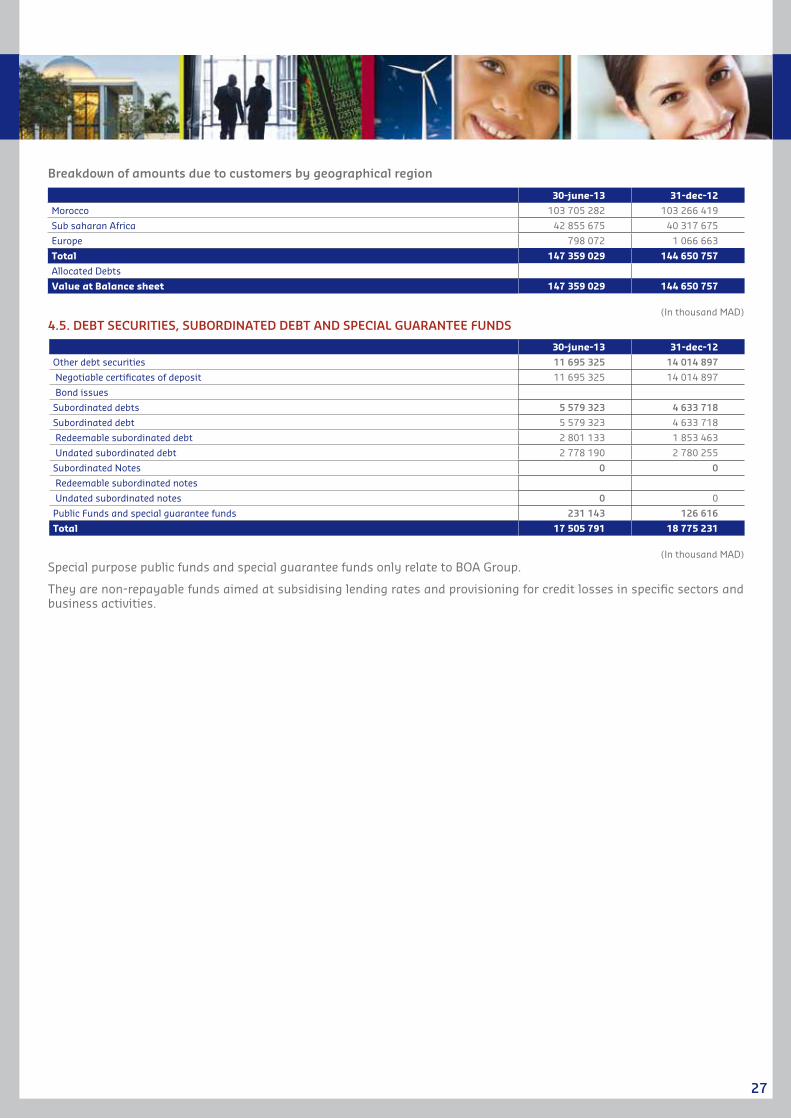
27
Breakdown of amounts due to customers by geographical region
30-june-13 31-dec-12
Morocco 103 705 282 103 266 419
Sub saharan Africa 42 855 675 40 317 675
Europe 798 072 1 066 663
Total 147 359 029 144 650 757
Allocated Debts
Value at Balance sheet 147 359 029 144 650 757
(In thousand MAD)
4.5. DEBT SECURITIES, SUBORDINATED DEBT AND SPECIAL gUARANTEE FUNDS
30-june-13 31-dec-12
Other debt securities 11 695 325 14 014 897
Negotiable certificates of deposit 11 695 325 14 014 897
Bond issues
Subordinated debts 5 579 323 4 633 718
Subordinated debt 5 579 323 4 633 718
Redeemable subordinated debt 2 801 133 1 853 463
Undated subordinated debt 2 778 190 2 780 255
Subordinated Notes 0 0
Redeemable subordinated notes
Undated subordinated notes 0 0
Public Funds and special guarantee funds 231 143 126 616
Total 17 505 791 18 775 231
(In thousand MAD)Special purpose public funds and special guarantee funds only relate to BOA Group.
They are non-repayable funds aimed at subsidising lending rates and provisioning for credit losses in specific sectors and business activities.
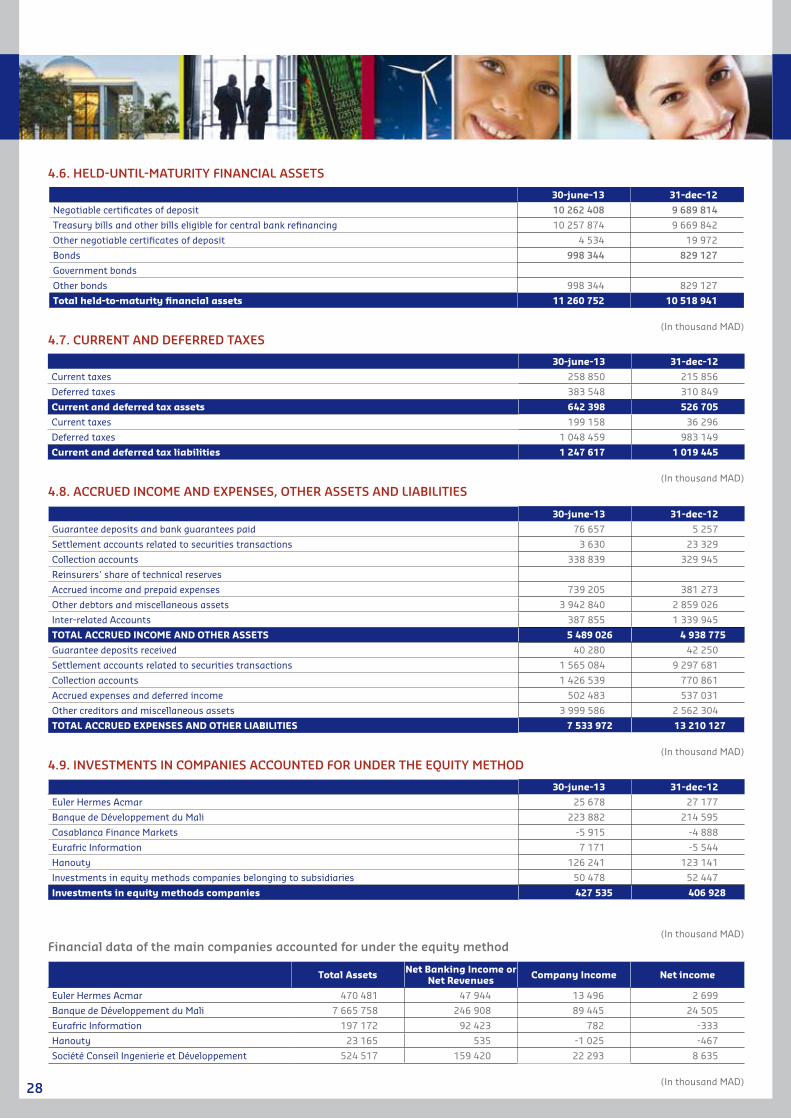
28
4.6. HELD-UNTIL-MATURITy FINANCIAL ASSETS
30-june-13 31-dec-12
Negotiable certificates of deposit 10 262 408 9 689 814
Treasury bills and other bills eligible for central bank refinancing 10 257 874 9 669 842
Other negotiable certificates of deposit 4 534 19 972
Bonds 998 344 829 127
Government bonds
Other bonds 998 344 829 127
Total held-to-maturity financial assets 11 260 752 10 518 941
(In thousand MAD)
4.7. CURRENT AND DEFERRED TAxES
30-june-13 31-dec-12
Current taxes 258 850 215 856
Deferred taxes 383 548 310 849
Current and deferred tax assets 642 398 526 705
Current taxes 199 158 36 296
Deferred taxes 1 048 459 983 149
Current and deferred tax liabilities 1 247 617 1 019 445
(In thousand MAD)
4.8. ACCRUED INCOME AND ExPENSES, OTHER ASSETS AND LIABILITIES
30-june-13 31-dec-12
Guarantee deposits and bank guarantees paid 76 657 5 257
Settlement accounts related to securities transactions 3 630 23 329
Collection accounts 338 839 329 945
Reinsurers' share of technical reserves
Accrued income and prepaid expenses 739 205 381 273
Other debtors and miscellaneous assets 3 942 840 2 859 026
Inter-related Accounts 387 855 1 339 945
TOTAL ACCRUED INCOME AND OTHER ASSETS 5 489 026 4 938 775
Guarantee deposits received 40 280 42 250
Settlement accounts related to securities transactions 1 565 084 9 297 681
Collection accounts 1 426 539 770 861
Accrued expenses and deferred income 502 483 537 031
Other creditors and miscellaneous assets 3 999 586 2 562 304
TOTAL ACCRUED ExPENSES AND OTHER LIABILITIES 7 533 972 13 210 127
(In thousand MAD)
4.9. INvESTMENTS IN COMPANIES ACCOUNTED FOR UNDER THE EqUITy METHOD
30-june-13 31-dec-12
Euler Hermes Acmar 25 678 27 177
Banque de Développement du Mali 223 882 214 595
Casablanca Finance Markets -5 915 -4 888
Eurafric Information 7 171 -5 544
Hanouty 126 241 123 141
Investments in equity methods companies belonging to subsidiaries 50 478 52 447
Investments in equity methods companies 427 535 406 928
(In thousand MAD)Financial data of the main companies accounted for under the equity method
Total Assets Net Banking Income or Net Revenues Company Income Net income
Euler Hermes Acmar 470 481 47 944 13 496 2 699
Banque de Développement du Mali 7 665 758 246 908 89 445 24 505
Eurafric Information 197 172 92 423 782 -333
Hanouty 23 165 535 -1 025 -467
Société Conseil Ingenierie et Développement 524 517 159 420 22 293 8 635
(In thousand MAD)
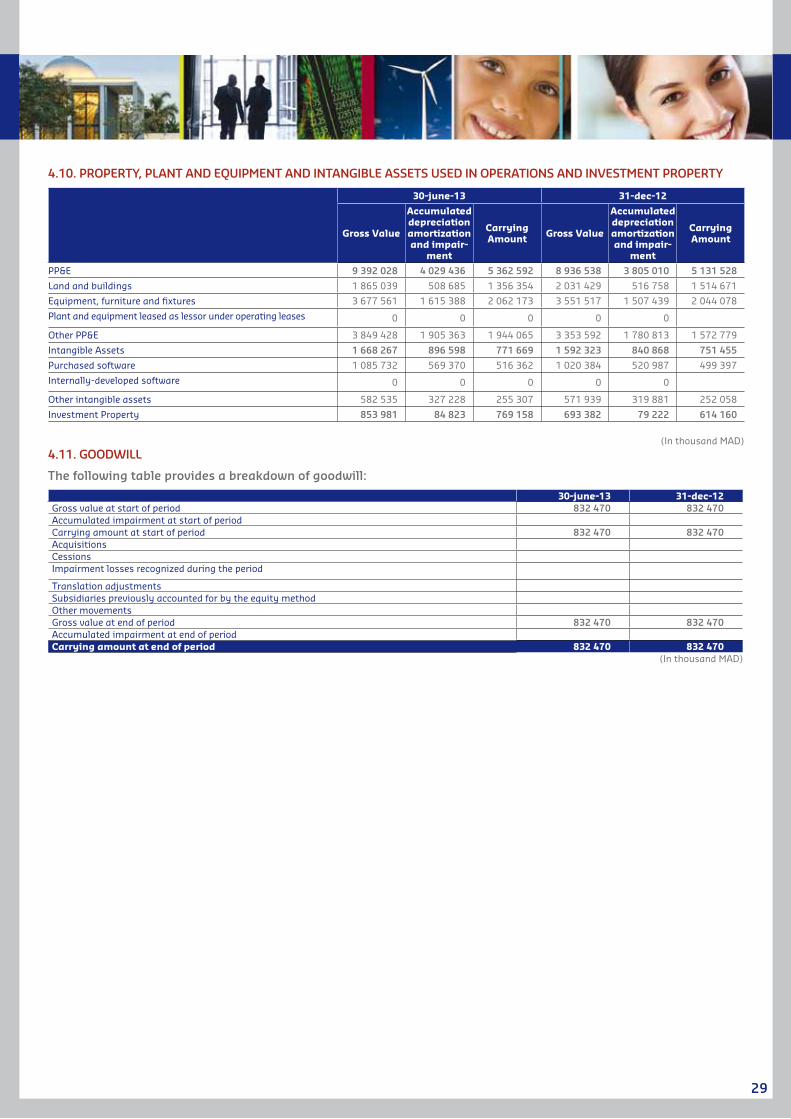
29
4.10. PROPERTy, PLANT AND EqUIPMENT AND INTANgIBLE ASSETS USED IN OPERATIONS AND INvESTMENT PROPERTy
30-june-13 31-dec-12
Gross Value
Accumulated depreciation amortization and impair-
ment
Carrying Amount Gross Value
Accumulated depreciation amortization and impair-
ment
Carrying Amount
PP&E 9 392 028 4 029 436 5 362 592 8 936 538 3 805 010 5 131 528
Land and buildings 1 865 039 508 685 1 356 354 2 031 429 516 758 1 514 671
Equipment, furniture and fixtures 3 677 561 1 615 388 2 062 173 3 551 517 1 507 439 2 044 078
Plant and equipment leased as lessor under operating leases 0 0 0 0 0
Other PP&E 3 849 428 1 905 363 1 944 065 3 353 592 1 780 813 1 572 779
Intangible Assets 1 668 267 896 598 771 669 1 592 323 840 868 751 455
Purchased software 1 085 732 569 370 516 362 1 020 384 520 987 499 397
Internally-developed software 0 0 0 0 0
Other intangible assets 582 535 327 228 255 307 571 939 319 881 252 058
Investment Property 853 981 84 823 769 158 693 382 79 222 614 160
(In thousand MAD)
4.11. gOODwILL
The following table provides a breakdown of goodwill:
30-june-13 31-dec-12Gross value at start of period 832 470 832 470Accumulated impairment at start of periodCarrying amount at start of period 832 470 832 470AcquisitionsCessionsImpairment losses recognized during the period
Translation adjustmentsSubsidiaries previously accounted for by the equity methodOther movementsGross value at end of period 832 470 832 470Accumulated impairment at end of periodCarrying amount at end of period 832 470 832 470
(In thousand MAD)
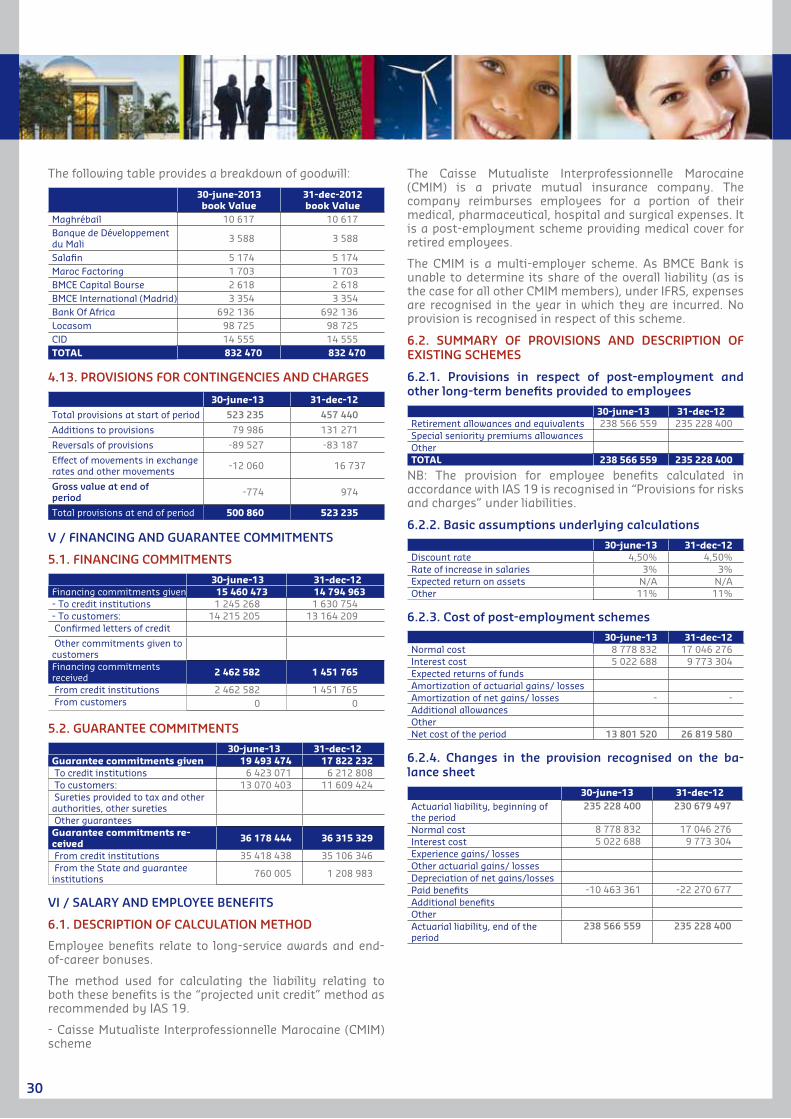
30
The following table provides a breakdown of goodwill:
30-june-2013book Value
31-dec-2012book Value
Maghrébail 10 617 10 617Banque de Développement du Mali 3 588 3 588
Salafin 5 174 5 174Maroc Factoring 1 703 1 703BMCE Capital Bourse 2 618 2 618BMCE International (Madrid) 3 354 3 354Bank Of Africa 692 136 692 136Locasom 98 725 98 725CID 14 555 14 555TOTAL 832 470 832 470
4.13. PROvISIONS FOR CONTINgENCIES AND CHARgES
30-june-13 31-dec-12
Total provisions at start of period 523 235 457 440
Additions to provisions 79 986 131 271
Reversals of provisions -89 527 -83 187
Effect of movements in exchange rates and other movements -12 060 16 737
gross value at end of period -774 974
Total provisions at end of period 500 860 523 235
v / FINANCINg AND gUARANTEE COMMITMENTS
5.1. FINANCINg COMMITMENTS
30-june-13 31-dec-12Financing commitments given 15 460 473 14 794 963 - To credit institutions 1 245 268 1 630 754- To customers: 14 215 205 13 164 209 Confirmed letters of credit
Other commitments given to customersFinancing commitments received 2 462 582 1 451 765
From credit institutions 2 462 582 1 451 765 From customers 0 0
5.2. gUARANTEE COMMITMENTS
30-june-13 31-dec-12Guarantee commitments given 19 493 474 17 822 232 To credit institutions 6 423 071 6 212 808 To customers: 13 070 403 11 609 424 Sureties provided to tax and other authorities, other sureties Other guaranteesGuarantee commitments re-ceived 36 178 444 36 315 329
From credit institutions 35 418 438 35 106 346 From the State and guarantee institutions 760 005 1 208 983
vI / SALARy AND EMPLOyEE BENEFITS
6.1. DESCRIPTION OF CALCULATION METHOD
Employee benefits relate to long-service awards and end-of-career bonuses.
The method used for calculating the liability relating to both these benefits is the “projected unit credit” method as recommended by IAS 19.
- Caisse Mutualiste Interprofessionnelle Marocaine (CMIM) scheme
The Caisse Mutualiste Interprofessionnelle Marocaine (CMIM) is a private mutual insurance company. The company reimburses employees for a portion of their medical, pharmaceutical, hospital and surgical expenses. It is a post-employment scheme providing medical cover for retired employees.
The CMIM is a multi-employer scheme. As BMCE Bank is unable to determine its share of the overall liability (as is the case for all other CMIM members), under IFRS, expenses are recognised in the year in which they are incurred. No provision is recognised in respect of this scheme.
6.2. SUMMARy OF PROvISIONS AND DESCRIPTION OF ExISTINg SCHEMES
6.2.1. Provisions in respect of post-employment and other long-term benefits provided to employees
30-june-13 31-dec-12Retirement allowances and equivalents 238 566 559 235 228 400 Special seniority premiums allowancesOtherTOTAL 238 566 559 235 228 400
NB: The provision for employee benefits calculated in accordance with IAS 19 is recognised in “Provisions for risks and charges” under liabilities.
6.2.2. Basic assumptions underlying calculations
30-june-13 31-dec-12Discount rate 4,50% 4,50%Rate of increase in salaries 3% 3%Expected return on assets N/A N/AOther 11% 11%
6.2.3. Cost of post-employment schemes
30-june-13 31-dec-12Normal cost 8 778 832 17 046 276 Interest cost 5 022 688 9 773 304 Expected returns of fundsAmortization of actuarial gains/ lossesAmortization of net gains/ losses - - Additional allowancesOtherNet cost of the period 13 801 520 26 819 580
6.2.4. Changes in the provision recognised on the ba-lance sheet
30-june-13 31-dec-12Actuarial liability, beginning of the period
235 228 400 230 679 497
Normal cost 8 778 832 17 046 276 Interest cost 5 022 688 9 773 304 Experience gains/ lossesOther actuarial gains/ lossesDepreciation of net gains/lossesPaid benefits -10 463 361 -22 270 677 Additional benefitsOtherActuarial liability, end of the period
238 566 559 235 228 400
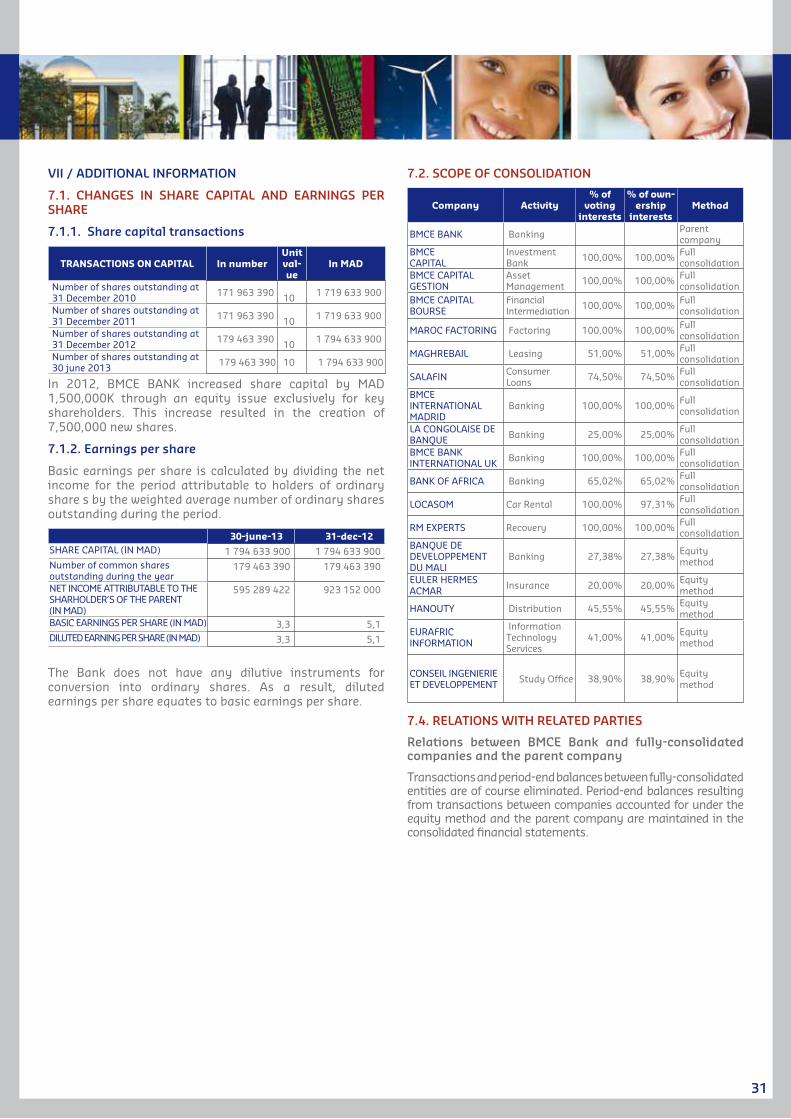
31
vII / ADDITIONAL INFORMATION
7.1. CHANgES IN SHARE CAPITAL AND EARNINgS PER SHARE
7.1.1. Share capital transactions
TRANSACTIONS ON CAPITAL In numberUnit val-ue
In MAD
Number of shares outstanding at 31 December 2010 171 963 390
10 1 719 633 900
Number of shares outstanding at 31 December 2011 171 963 390
10 1 719 633 900
Number of shares outstanding at 31 December 2012 179 463 390
10 1 794 633 900
Number of shares outstanding at 30 june 2013 179 463 390 10 1 794 633 900
In 2012, BMCE BANK increased share capital by MAD 1,500,000K through an equity issue exclusively for key shareholders. This increase resulted in the creation of 7,500,000 new shares.
7.1.2. Earnings per share
Basic earnings per share is calculated by dividing the net income for the period attributable to holders of ordinary share s by the weighted average number of ordinary shares outstanding during the period.
30-june-13 31-dec-12SHARE CAPITAL (IN MAD) 1 794 633 900 1 794 633 900 Number of common shares outstanding during the year
179 463 390 179 463 390
NET INCOME ATTRIBUTABLE TO THE SHARHOLDER’S OF THE PARENT (IN MAD)
595 289 422 923 152 000
BASIC EARNINGS PER SHARE (IN MAD) 3,3 5,1 DILUTED EARNING PER SHARE (IN MAD) 3,3 5,1
The Bank does not have any dilutive instruments for conversion into ordinary shares. As a result, diluted earnings per share equates to basic earnings per share.
7.2. SCOPE OF CONSOLIDATION
Company Activity% of
voting interests
% of own-ership
interestsMethod
BMCE BANK Banking Parent company
BMCE CAPITAL
Investment Bank 100,00% 100,00% Full
consolidationBMCE CAPITAL GESTION
Asset Management 100,00% 100,00% Full
consolidationBMCE CAPITAL BOURSE
Financial Intermediation 100,00% 100,00% Full
consolidation
MAROC FACTORING Factoring 100,00% 100,00% Full consolidation
MAGHREBAIL Leasing 51,00% 51,00% Full consolidation
SALAFIN Consumer Loans 74,50% 74,50% Full
consolidationBMCE INTERNATIONAL MADRID
Banking 100,00% 100,00% Full consolidation
LA CONGOLAISE DE BANQUE Banking 25,00% 25,00% Full
consolidationBMCE BANK INTERNATIONAL UK Banking 100,00% 100,00% Full
consolidation
BANK OF AFRICA Banking 65,02% 65,02% Full consolidation
LOCASOM Car Rental 100,00% 97,31% Full consolidation
RM EXPERTS Recovery 100,00% 100,00% Full consolidation
BANQUE DE DEVELOPPEMENT DU MALI
Banking 27,38% 27,38% Equity method
EULER HERMES ACMAR Insurance 20,00% 20,00% Equity
method
HANOUTY Distribution 45,55% 45,55% Equity method
EURAFRIC INFORMATION
Information Technology Services
41,00% 41,00% Equity method
CONSEIL INGENIERIE ET DEVELOPPEMENT Study Office 38,90% 38,90% Equity
method
7.4. RELATIONS wITH RELATED PARTIES
Relations between BMCE Bank and fully-consolidated companies and the parent company
Transactions and period-end balances between fully-consolidated entities are of course eliminated. Period-end balances resulting from transactions between companies accounted for under the equity method and the parent company are maintained in the consolidated financial statements.
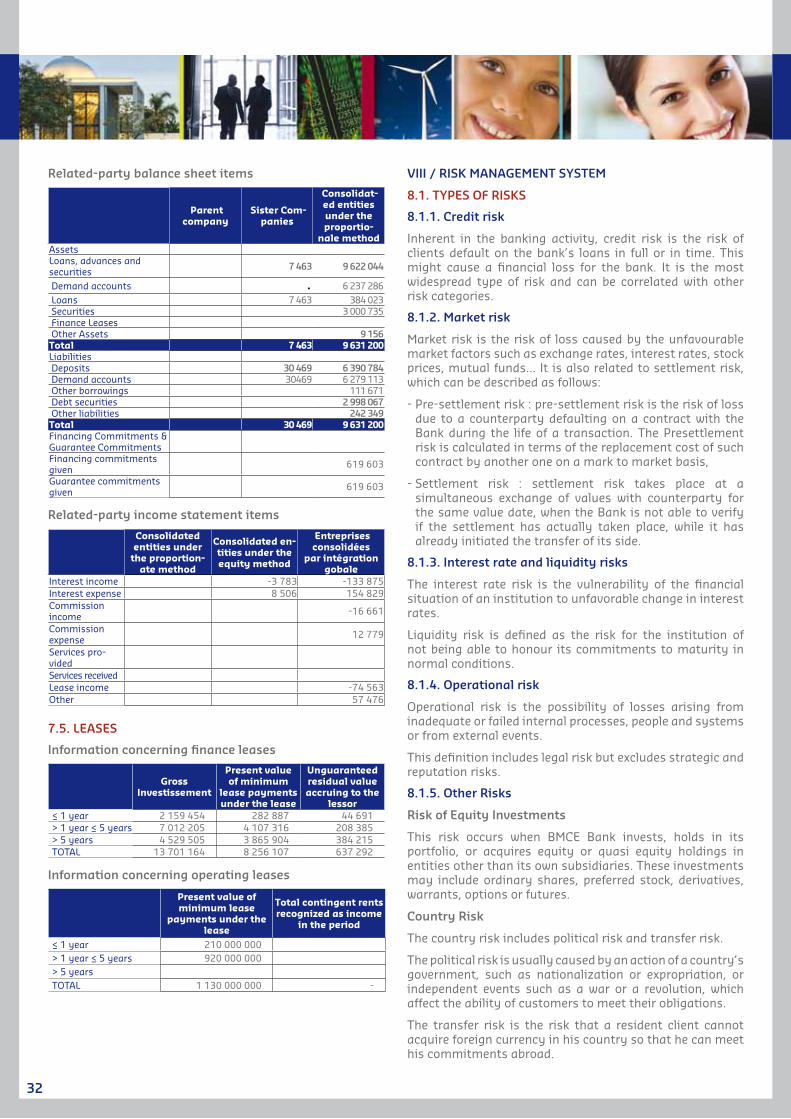
32
Related-party balance sheet items
Parentcompany
Sister Com-panies
Consolidat-ed entities under the proportio-
nale method AssetsLoans, advances and securities 7 463 9 622 044
Demand accounts 0 6 237 286 Loans 7 463 384 023 Securities 3 000 735 Finance Leases Other Assets 9 156Total 7 463 9 631 200Liabilities Deposits 30 469 6 390 784 Demand accounts 30469 6 279 113 Other borrowings 111 671 Debt securities 2 998 067 Other liabilities 242 349Total 30 469 9 631 200Financing Commitments & Guarantee CommitmentsFinancing commitments given 619 603
Guarantee commitments given 619 603
Related-party income statement items
Consolidated entities under
the proportion-ate method
Consolidated en-tities under the equity method
Entreprises consolidées
par intégration gobale
Interest income -3 783 -133 875Interest expense 8 506 154 829Commission income -16 661
Commission expense 12 779
Services pro-videdServices receivedLease income -74 563Other 57 476
7.5. LEASES
Information concerning finance leases
Gross Investissement
Present value of minimum
lease payments under the lease
Unguaranteed residual value accruing to the
lessor≤ 1 year 2 159 454 282 887 44 691 > 1 year ≤ 5 years 7 012 205 4 107 316 208 385 > 5 years 4 529 505 3 865 904 384 215 TOTAL 13 701 164 8 256 107 637 292
Information concerning operating leases
Present value of minimum lease
payments under the lease
Total contingent rents recognized as income
in the period
≤ 1 year 210 000 000 > 1 year ≤ 5 years 920 000 000 > 5 yearsTOTAL 1 130 000 000 -
vIII / RISK MANAgEMENT SySTEM
8.1. TyPES OF RISKS
8.1.1. Credit risk
Inherent in the banking activity, credit risk is the risk of clients default on the bank’s loans in full or in time. This might cause a financial loss for the bank. It is the most widespread type of risk and can be correlated with other risk categories.
8.1.2. Market risk
Market risk is the risk of loss caused by the unfavourable market factors such as exchange rates, interest rates, stock prices, mutual funds... It is also related to settlement risk, which can be described as follows:
- Pre-settlement risk : pre-settlement risk is the risk of loss due to a counterparty defaulting on a contract with the Bank during the life of a transaction. The Presettlement risk is calculated in terms of the replacement cost of such contract by another one on a mark to market basis,
- Settlement risk : settlement risk takes place at a simultaneous exchange of values with counterparty for the same value date, when the Bank is not able to verify if the settlement has actually taken place, while it has already initiated the transfer of its side.
8.1.3. Interest rate and liquidity risks
The interest rate risk is the vulnerability of the financial situation of an institution to unfavorable change in interest rates.
Liquidity risk is defined as the risk for the institution of not being able to honour its commitments to maturity in normal conditions.
8.1.4. Operational risk
Operational risk is the possibility of losses arising from inadequate or failed internal processes, people and systems or from external events.
This definition includes legal risk but excludes strategic and reputation risks.
8.1.5. Other Risks
Risk of Equity Investments
This risk occurs when BMCE Bank invests, holds in its portfolio, or acquires equity or quasi equity holdings in entities other than its own subsidiaries. These investments may include ordinary shares, preferred stock, derivatives, warrants, options or futures.
Country Risk
The country risk includes political risk and transfer risk.
The political risk is usually caused by an action of a country’s government, such as nationalization or expropriation, or independent events such as a war or a revolution, which affect the ability of customers to meet their obligations.
The transfer risk is the risk that a resident client cannot acquire foreign currency in his country so that he can meet his commitments abroad.
33
The country risk management system is based on the following axes:
• Identification of Country Risk
• Exposure Calculation and consolidation by country
• Development of internal rating and Country Profile
• Allocation of Limits by Country
• Reporting and Alerts
• Provisioning
8.2. RISK-MANAgEMENT ORgANISATION
8.2.1. general control system
At the Group level, BMCE Bank has a General Control body that is mandated to carry out inspections and audit in different operational segments both in Morocco and abroad.
8.2.3. group Risk Management
The mission of Group Risk Management is to monitor credit, market and operational risks, with an active contribution to:
• The definition of BMCE Bank’s risk policy ;
• The set up of a control system for credit, market and operational risks ;
• The definition and management of a decision-making process and monitoring of commitments.
The Group Risk Management is composed of :
• Group Risk Management Division, which is in charge of monitoring risks (credit, market and operational) for BMCE Bank Group, supported by Group entities ;
• The Credit Analysis and Management Division, which examines the lending policy for BMCE Bank clients.
8.3. gOvERNANCE BODIES
8.3.1. The Audit and Internal Control Committee
The Audit and Internal Control Committee (AICC) is a governance body established within the Bank and is directly under its Board of Directors. Its mission is to ensure a third level control through the structures of the Bank. In other words, the AICC
Assess the relevance and permanence of accounting policies.
Controls the existence, the adequacy and implementation of internal procedures and processes for control, monitoring and surveillance of banking risks and prudential ratios Examine aggregated and consolidated accounts before submission to the Board of Directors, and keep close watch on the quality of information released to shareholders.
In this regard, the Committee permanently ensures the follow up and the achievement of the objectives and missions, defined as below :
• Verification of internal operations and procedures ;
• Assessment, control and supervision of risks ;
• Verification of the reliability of collection, processing, dissemination and conservation of accounting data ;
• Effective flow of documentation and information internally and externally ;
• Assessment of coherence and adequacy of the established control systems ;
• Assessment of the pertinence of the corrective measures proposed or implemented ;
• Ensure compliance of accounting and coherence of the internal control systems at the level of each entity with a financial vocation belonging to the Group ;
• Examination of aggregated and consolidated accounts before submittal to approval by the Board of Directors ;
• Devising of the annual report on activity, earnings and internal control submitted for examination by the Board of Directors ;
• Information at least once per year, to the Board of Directors regarding the amount of nonperforming loans, the debt collection processes, as well as the outstanding amount of restructured loans and the situation of reimbursement ;
• Keep close watch on the quality of the information released to the shareholders.
Furthermore, back in July 2007, the Board of Directors set up the CACI Group –a body instituted within the Bank, its subsidiaries, as well as entities integrated into the consolidation scope.
CACI’s tasks consist of seeing the integrity of accounts and ensure full adherence to the legal and regulatory obligations across the various structures of the Bank and all the subsidiaries/branches of the Bank, both in Morocco and abroad.
The tasks of the Group CACI (or, AICC) intertwine with those of the Bank CACI, even if they are extended to cover the entities placed within the consolidation scope. More explicitly, they include: (i) reviewing proposals for the appointment or renewal of the statutory auditors for Group entities, by analyzing their intervention programmes, checking the outcomes of their verification, their recommendations, as well as the corrective measures proposed or implemented; (ii) whenever it is necessary, asks for any internal or external audit.
8.3.2. Major Risks Monitoring Committee
The Major Risks Monitoring Committee is issued from the Internal Audit and Control Committee. It consists of non-executive directors (CACI members). The meetings of the committee are held on a quarterly basis. In the framework of the prerogatives devolving to it, the Committee :
• Evaluates and makes recommendations on the quality of risks;
• Ascertains that management norms and internal procedures, as set by the competent bodies in the area of credit risks ;
• Monitors the limits of credit risks (sector-based, major risks…).
8.3.3. general Management Committee
The General Management Committee, which is chaired by the Director & Delegate General Manager to the Chairman,
34
gathers together the Director & Delegate General Manager in charge of Remedial Management; Delegate General Managers, the Adviser to the General Management, and the General Controller. Associate Members include the Chairman of the Board of BMCE Capital and the other Deputy General Managers of BMCE Bank. The meetings of the Committee are held on a weekly basis.
In the framework of the prerogatives devolving to it, the Committee is in charge of :
Steering Activities :
• Steers the drawing up of the strategic plan of BMCE Bank and affiliated entities, in tandem with the decisions taken by the Group Strategic Committee and takes care of its implementation ;
• Give impetus to the main cross-cutting projects which impact on the operation and the development of the Bank;
• Translates the strategic plan into clear budgetary objectives for the Bank’s various entities;
• Validates annual budgets and follows up on the allocation and optimisation of resources made available to the entities of the Bank;
• Monitors the effective execution of the Bank’s budgetary plan and that of each of its entities. It also sees to the implementation of corrective actions in case of gaps;
• Decides on the tariff policy relating to products and services, while ensuring that the business lines remain profitable;
• Evaluates opportunities for launching new activities, products, and services and follows up on implementation;
• Arbitrates on operational questions pertaining to the various Bank’s Divisions, and internal committees for which it also sets the objectives;
• Sees to the efficiency of organisation by undertaking all the actions necessary relating to human resources, organisation, computing, logistics, and security as would contribute to the development of the Bank.
Internal Control, Audit, and Risk Management :
• Formulates orientations in terms of the Bank’s risk policy and ascertains its alignment with the Group’s risk policy;
• On the basis of the propositions made by the entity in charge of risk management, it sets and follows the limits and levels of aggregate risks for each of the Bank’s business lines;
• Ensures observance of regulatory ratios, compliance with the regulations governing risks, and the efficiency of internal control.
Human Resources :
• Examines the policy of Bank personnel remuneration, training, mobility, and recruitment;
• Ascertains that operational priorities are in adequacy with the recruitment and training policy;
• Follows up on the career management of the Bank’s high-flyers.
Other Prerogatives :
• Sees to it that there is a coherent commercial, corporate, and financial communication;
• Arbitrates on possible conflicts of interest and all unresolved files falling within the competency of the various Bank entities and internal committees;
• Proposes the main Bank development poles to the Group Strategic Committee.
8.3.4. The Credit Committee
Senior Credit Committee
It is chaired by the Chief Executive Officer of the Bank and vice-chaired by the Director & Delegate General Manager to the Chairman. Depending on the market concerned, there are two committees: one is in charge of the Enterprise market while the other is in charge of the Private/Professionals market. The committees, which gather together the Bank’s senior managers, convene twice a week.
The Regional Credit Committee
The Regional Credit Committee is held once a week. Its dates are determined by the Regional Director of each region, provided to all members and time respected.
8.3.5. Declassification Committee
In the context of portfolio monitoring, the Declassification Committee (normal and selected) meets monthly to review the accounts anomalies.
Also, recovery committees and anomaly accounts were introduced into regions and they meet monthly.
8.3.6. group Market Risk Committee
The Group Market Risk Committee sees to the efficiency of the steering mechanism as it applies to risks related to BMCE Bank Group market operations and to ensure its adequacy and conformity with the established risk management policy.
In this respect, the Committee takes care of the following missions, among others :
• Ensures the implementation of the management policy for credit risk, market risk and operational risk across BMCE Bank Group ;
• Valid any inherent change in control of credit risk, market risk and operational risk, and in the implementation at different entities within the perimeter ;
• Becomes aware of the evolution of different indicators for assessing credit risk, market risk and operational risk ;
• Becomes aware of events since the last Committee including :
- Results from the work of regulatory and methodological standby ;
- Work done in the context of cross-organizational or IT projects inherent in managing risks.

35
8.4. CREDIT RISK
8.4.1. Decision Procedures
The procedure for granting loans at BMCE Bank is based on two approaches :
A standardised approach for products to individuals subject to ‘‘Product Programmes’’, which define, for each product, the rules of risk management for the marketing of the product. Indeed, risk policy relies on two pillars :
• The use of a fact sheet, which states the approval criteria, and based on which the assessment Risk is conducted. This fact sheet explains the credit terms and verifies compliance and the meeting of the loan standards. If the loan does not meet the standards set by all the acceptance risk criteria, the request must be rejected unless an exception is granted by the Committee ;
• A system of delegation which identifies the authority levels for loan granting. It ensures compliance of the decision making process and the integrity of the credit agent. Each loan application passes through all subordinated entities until its approval.
A customised approach based on the specific needs of clients based on three principles: (i) loan portfolio management, which allows the Senior Management to have sufficient information to assess the risk profile of the customer; (ii) the delegation of approval authority to individuals (intuitu personae) on the basis of their experience, judgment, competence, education and professional training; (iii) the balance of power, the facilities being granted based on the judgment of at least three persons « Troika ».
For certain levels of risk, approval of the Senior Credit Committee or the President of the Bank must be sought. Note also that an independent control of the credit quality and compliance with procedures is provided by the General control and external auditors. Similarly, the Group’s Risks Division independently ensures the continuity of the risk management quality and respect for rules and procedures.
Implementation of the new network reorganization by Region within BMCE Bank was accompanied by a change in the delegation system to include this new dimension, through the allocation of delegations of authority to these regional structures and the establishment of a Regional Credit Committee.
8.4.2. Diversification by Counterparty
Assessed by taking the entire loans granted to a single beneficiary, the diversification of the loan portfolio remains a major concern for the Bank’s risk policy. Possible concentrations are subject to regular review, and if the need should arise, corrective measures are taken.
8.4.3. Sector-based Diversification
Sector-based diversification of the credit portfolio, likewise, receives particular attention, sustained by prospective analysis which allows for a proactive and dynamic management of the Bank’s exposures. It relies on research and studies which express an opinion on the evolution of given sectors and identify the factors which account for the risks incurred by the main actors.
8.4.4. Monitoring
Through the entity in charge of “the Group Credit Risk Management”, the Group Risk Division takes care of the following tasks at BMCE Bank Group :
• Prevention of credit risks ;• Contribution to the overall credit policy ;• On-going monitoring of credit risk.
As a key function in risk control process, such preventive management consists in anticipating situations where risk is likely to worsen and to bring in the appropriate adjustments. In the exercise of this function, the entity is called upon to :
• Monitor the regularity of commitments: conformity of the purpose for which the loan is sought, observance of the authorised rating, examination of default in payment, review of overdue loan repayments.
• Detect debts showing persistent weakness signs, on the basis of a certain number of flashing warning signals ;
• Together with the branch network, follow up on the evolution of the main risks (non performing loans, the most important commitments/ or the most sensitive ones) ;
• Determine files that are eligible for downgrading, in view of the regulations in force governing non performing loans.
8.4.5. Non Performing Loans
With a view to identify non performing loans which are eligible for provisioning in compliance with the regulation in force, an exhaustive review of the Bank’s portfolio is undertaken on a monthly basis, with the help of a statement of risk-prone accounts, designed by means of reference to the criteria governing the classification of non performing loans instituted by Circular no. 19 issued by the Central Bank, as well as other additional security criteria adopted by the Bank.
It should be noted that the additional risk management indicators have been set up in order to spot forerunning signs of a worsening risk.
The provisioning is subject to supervision and monitoring by the General Control Group, the External Auditors and the Audit and Internal Control Committee.
8.4.6. Remedial Management
Recovery
In order to improve the efficiency of the recovery of failed debts, a revamped out-of-court recovery system was set up within the Bank. The system consists of two entities –one dedicated to the activities of the corporate network, while the other is devoted to the Private/Professional network.
The entities are tasked with the following :
• Permanently oversee the regularity and the quality of the entire Bank’s commitments ;
• Follow-up on the settlement of any insufficiency, either through the network, or directly with the customers concerned;
• Adopt a proactive approach designed to prevent any degradation of the outstanding debts.
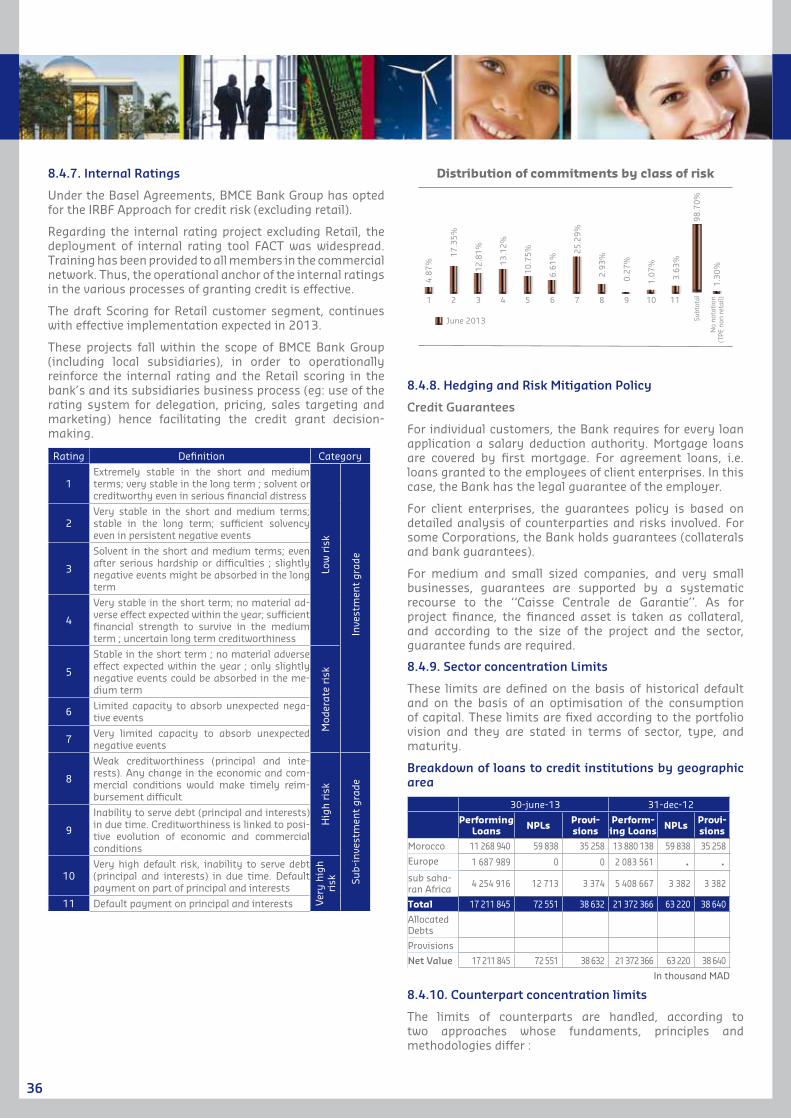
36
8.4.7. Internal Ratings
Under the Basel Agreements, BMCE Bank Group has opted for the IRBF Approach for credit risk (excluding retail).
Regarding the internal rating project excluding Retail, the deployment of internal rating tool FACT was widespread. Training has been provided to all members in the commercial network. Thus, the operational anchor of the internal ratings in the various processes of granting credit is effective.
The draft Scoring for Retail customer segment, continues with effective implementation expected in 2013.
These projects fall within the scope of BMCE Bank Group (including local subsidiaries), in order to operationally reinforce the internal rating and the Retail scoring in the bank’s and its subsidiaries business process (eg: use of the rating system for delegation, pricing, sales targeting and marketing) hence facilitating the credit grant decision-making.
Rating Definition Category
1Extremely stable in the short and medium terms; very stable in the long term ; solvent or creditworthy even in serious financial distress
Low
ris
k
Inve
stm
ent
grad
e
2Very stable in the short and medium terms; stable in the long term; sufficient solvency even in persistent negative events
3
Solvent in the short and medium terms; even after serious hardship or difficulties ; slightly negative events might be absorbed in the long term
4
Very stable in the short term; no material ad-verse effect expected within the year; sufficient financial strength to survive in the medium term ; uncertain long term creditworthiness
5
Stable in the short term ; no material adverse effect expected within the year ; only slightly negative events could be absorbed in the me-dium term
Mod
erat
e ri
sk
6 Limited capacity to absorb unexpected nega-tive events
7 Very limited capacity to absorb unexpected negative events
8
Weak creditworthiness (principal and inte-rests). Any change in the economic and com-mercial conditions would make timely reim-bursement difficult
Hig
h r
isk
Sub-
inve
stm
ent
grad
e
9
Inability to serve debt (principal and interests) in due time. Creditworthiness is linked to posi-tive evolution of economic and commercial conditions
10Very high default risk, inability to serve debt (principal and interests) in due time. Default payment on part of principal and interests
Very
hig
h
risk
11 Default payment on principal and interests
Distribution of commitments by class of risk
June 2013
1
4.8
7%
2
17
.35
%
3
12
.81
%
4
13
.12
%
5
10
.75
%
6
6.6
1%
7
25
.29
%
98
.70
%
8
2.9
3%
9
0.2
7%
10
1.0
7%
11
3.6
3%
No
nota
tion
(T
PE n
on r
etai
l)
Subt
otal
1.3
0%
8.4.8. Hedging and Risk Mitigation Policy
Credit guarantees
For individual customers, the Bank requires for every loan application a salary deduction authority. Mortgage loans are covered by first mortgage. For agreement loans, i.e. loans granted to the employees of client enterprises. In this case, the Bank has the legal guarantee of the employer.
For client enterprises, the guarantees policy is based on detailed analysis of counterparties and risks involved. For some Corporations, the Bank holds guarantees (collaterals and bank guarantees).
For medium and small sized companies, and very small businesses, guarantees are supported by a systematic recourse to the ‘‘Caisse Centrale de Garantie’’. As for project finance, the financed asset is taken as collateral, and according to the size of the project and the sector, guarantee funds are required.
8.4.9. Sector concentration Limits
These limits are defined on the basis of historical default and on the basis of an optimisation of the consumption of capital. These limits are fixed according to the portfolio vision and they are stated in terms of sector, type, and maturity.
Breakdown of loans to credit institutions by geographic area
30-june-13 31-dec-12
Performing Loans NPLs Provi-
sionsPerform-ing Loans NPLs Provi-
sions
Morocco 11 268 940 59 838 35 258 13 880 138 59 838 35 258
Europe 1 687 989 0 0 2 083 561 0 0sub saha-ran Africa 4 254 916 12 713 3 374 5 408 667 3 382 3 382
Total 17 211 845 72 551 38 632 21 372 366 63 220 38 640
Allocated Debts
Provisions
Net value 17 211 845 72 551 38 632 21 372 366 63 220 38 640
In thousand MAD
8.4.10. Counterpart concentration limits
The limits of counterparts are handled, according to two approaches whose fundaments, principles and methodologies differ :
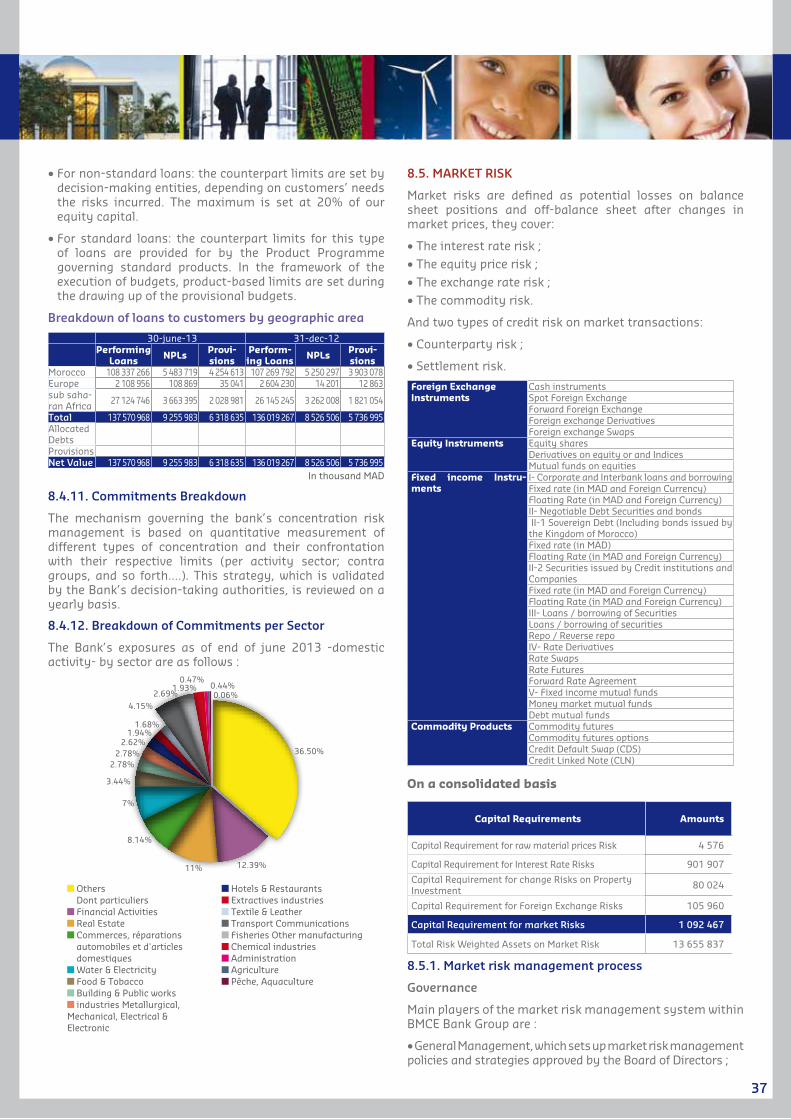
37
• For non-standard loans: the counterpart limits are set by decision-making entities, depending on customers’ needs the risks incurred. The maximum is set at 20% of our equity capital.
• For standard loans: the counterpart limits for this type of loans are provided for by the Product Programme governing standard products. In the framework of the execution of budgets, product-based limits are set during the drawing up of the provisional budgets.
Breakdown of loans to customers by geographic area
30-june-13 31-dec-12Performing
Loans NPLs Provi-sions
Perform-ing Loans NPLs Provi-
sionsMorocco 108 337 266 5 483 719 4 254 613 107 269 792 5 250 297 3 903 078Europe 2 108 956 108 869 35 041 2 604 230 14 201 12 863sub saha-ran Africa 27 124 746 3 663 395 2 028 981 26 145 245 3 262 008 1 821 054
Total 137 570 968 9 255 983 6 318 635 136 019 267 8 526 506 5 736 995Allocated DebtsProvisionsNet value 137 570 968 9 255 983 6 318 635 136 019 267 8 526 506 5 736 995
In thousand MAD
8.4.11. Commitments Breakdown
The mechanism governing the bank’s concentration risk management is based on quantitative measurement of different types of concentration and their confrontation with their respective limits (per activity sector; contra groups, and so forth….). This strategy, which is validated by the Bank’s decision-taking authorities, is reviewed on a yearly basis.
8.4.12. Breakdown of Commitments per Sector
The Bank’s exposures as of end of june 2013 -domestic activity- by sector are as follows :
Others Dont particuliers
Financial Activities Real Estate Commerces, réparations automobiles et d'articles domestiques
Water & Electricity Food & Tobacco Building & Public works industries Metallurgical,
Mechanical, Electrical & Electronic
Hotels & Restaurants Extractives industries Textile & Leather Transport Communications Fisheries Other manufacturing Chemical industries Administration Agriculture Pêche, Aquaculture
36.50%
12.39%11%
8.14%
7%
3.44%
2.78%2.78%
2.62%1.94%
1.68%
4.15%
2.69%1.93%
0.47%0.44%0.06%
8.5. MARKET RISK
Market risks are defined as potential losses on balance sheet positions and off-balance sheet after changes in market prices, they cover:
• The interest rate risk ;• The equity price risk ;• The exchange rate risk ;• The commodity risk.
And two types of credit risk on market transactions:
• Counterparty risk ;
• Settlement risk.
Foreign Exchange Instruments
Cash instruments Spot Foreign ExchangeForward Foreign ExchangeForeign exchange Derivatives Foreign exchange Swaps
Equity Instruments Equity sharesDerivatives on equity or and IndicesMutual funds on equities
Fixed income Instru-ments
I- Corporate and Interbank loans and borrowingFixed rate (in MAD and Foreign Currency) Floating Rate (in MAD and Foreign Currency)II- Negotiable Debt Securities and bonds II-1 Sovereign Debt (Including bonds issued by the Kingdom of Morocco)Fixed rate (in MAD) Floating Rate (in MAD and Foreign Currency) II-2 Securities issued by Credit institutions and CompaniesFixed rate (in MAD and Foreign Currency) Floating Rate (in MAD and Foreign Currency)III- Loans / borrowing of SecuritiesLoans / borrowing of securitiesRepo / Reverse repoIV- Rate DerivativesRate SwapsRate FuturesForward Rate AgreementV- Fixed income mutual fundsMoney market mutual fundsDebt mutual funds
Commodity Products Commodity futures Commodity futures optionsCredit Default Swap (CDS) Credit Linked Note (CLN)
On a consolidated basis
Capital Requirements Amounts
Capital Requirement for raw material prices Risk 4 576
Capital Requirement for Interest Rate Risks 901 907
Capital Requirement for change Risks on Property Investment 80 024
Capital Requirement for Foreign Exchange Risks 105 960
Capital Requirement for market Risks 1 092 467
Total Risk Weighted Assets on Market Risk 13 655 837
8.5.1. Market risk management process
governance
Main players of the market risk management system within BMCE Bank Group are :
• General Management, which sets up market risk management policies and strategies approved by the Board of Directors ;
38
• The Group Risk Committee, which ensures efficiency of the policy of market operations risk management within the BMCE Bank Group and its consistency with the Group’s risk management policy ;
• The Group’s market risk department centralizes the whole Group market risk management. BMCE Bank, as an independent function of Front Offices of the Group’s different entities, enjoys maximum objectivity in the management of market risk.
• Risk Management Units of BMCE Bank Group, which ensure market activities’ control within their entity, report to Group Risk Management.
• Internal Audit ensures the implementation of the market risk management system and the respect of procedures in force.
8.5.2. Description of the market risk management sys-tem
BMCE Bank’s market risk management system is based on :
• Limits ;• Risk Indicators ;• Capital Requirement ;
8.5.2.1. Limits
Counterparty limits on market transactions
The process of granting counterparty limits and excess in exposure limits on market transactions is governed within BMCE Bank Group via a system of delegation of powers framed by different procedures depending on the type of counterparty.
Market limits
Taken to control the market risks within the Group BMCE Bank and diversification of trading, a set of market limits was introduced, and is available as follows:
• Stop / Loss limits by business line over different time horizons ;• Exposure limits by activity ; • Exposure limits by duration for the Dirham denominated interest rate ;• Exposure limits by currency and time for the currency cash FX ;• Greeks limits for derivatives ;• Exposure limits by currency for the FX activity ;• Transaction limits
Regulatory limits
Apart from monitoring the limits put in place internally, BMCE Bank Group ensures compliance with regulatory limits set by Bank Al-Maghrib as :
• The minimum capital regulatory adequacy ratio ;
• The exposure limit on the foreign currency should not exceed 10% on Capital ;
• The limit on the aggregate foreign exchange which does not exceed 20% of Capital.
8.5.2.2. Risk indicators
Different risk indicators reflecting the level of exposure to market risk are used within the BMCE Bank Group and are as follows:
• Overall Value at Risk (VaR) and by type of asset
Value-at-Risk is a probabilistic global measure of the market risk. It summarizes the risk through the calculation of any potential loss on a time horizon and a given degree of probability. Unlike traditional indicators of risk, value at risk combines various risk factors and measures their interaction, thus taking into account the diversification of portfolios.
• Stress Testing by Risk Factor
A set of stress tests are conducted daily for each activity of trading. These stress tests are based on hypothetical scenarios set up, and reflect the exposure of the trading group’s losses in case of moderate fluctuations, averages and extremes of market risk factors.
Thus, hypothetical scenarios are based on the following stress components:
- Change in interest rates ;- Translation of the yield curve ;- Change in exchange rates ;- Change in the basket ;- Movement of currency volatility ;- Change in the price of the underlying asset ;
• Overall Sensitivity and portfolio duration or by activity for the intereset rate exposure.
• The sensitivities of type delta, gamma, vega, theta, rho for derivative exposure.
8.5.2.2. Capital Requirements
The regulatory capital requirements under the Market Risk of BMCE Bank Group can appropriately assess the exposure of the Group to various market risks.
8.6. OPERATIONAL RISK
Operational risk can be defined as the risk of loss or incident resulting from insufficient or unsuccessful internal processes, people and systems, or from external events
8.6.1. Operational Risk Management Policy
8.6.1.1. Objective of Operational Risk Management
The Operational Risk Management system seeks to achieve the following objectives :
• Assess and prevent operational risks ;
• Evaluate the control process ;
• Undertake corrective actions in the face of major risks.
8.6.1.2. Classification
Operational risks or loss may be analysed and categorised according to two principles, which need to be distinguished:
causes and consequences, in terms of impact (financial or other). They are then categorised per Basel Event type.

39
8.6.1.3. Links with credit and market risks
Operational risk management is potentially linked to the management of credit and market risks. The link is two-fold :
• At the global level, reflection on the global level of aversion to risks incurred by the Bank (and eventually the allocation of capital) calls for “trans-risk” analysis and follow up
• More specifically, certain operational risks may be linked directly to the management of market and credit risks.
8.6.2. Organisation of Operational Risk Management
The framework for the operational risk management at BMCE Bank Group is structured around three guiding principles :
• Set a target system in line with the Group’s organisation and the best practices ;
• Entrust the different Group’s business units and subsidiaries with the daily management of operational risk ;
• Ensure the separation of the functions ‘‘Audit/Control’’ and operational risk management.
The operational risks management at the Bank implies 4 major entities :
• Operational Risk Management Department ;
• BMCE Bank branch network ;
• Functional entities of BMCE Bank ;
• Subsidiaries.
Operational risks interlocutors have been appointed at the level of the aforementioned entities, namely :
• Operational Risk Correspondents (or, CRO) ;
• Operational Risk Coordinators (or, CORO) ;
• Operational Risk Relays (RRO).
The scope of operational risk management also concerns the various group subsidiaries :
8.6.3. governance of Operational Risk Management
The governance of operational risk within the BMCE is divided into three Operational Risk Committees
• The Group Operational Risk Committee ;
• The Business-line-based Operational Risk Follow-up Committee ;
• The Subsidiary Operational Risk Committee.
The task of these committees consists in the periodic review of the following :
• Evolution of exposure to operational risks and the control environment of these risks ;
• Identification of the main risk areas, in terms of activities and type of risk ;
• Definition of preventive and corrective actions to take in order to curb risk levels ;
• The amount of equity capital allocated to operational risks, the cost of preventive actions to take, and the cost of insurance to take out.
8.6.4. Fundamental Principles
The major strategic objective of the operational risk management system at BMCE Bank is twofold :
• Reduce the exposure to operational risks ;
• Optimize capital requirements for operational risks.
The internal system for measuring operational risk is closely related to the daily management of risk through :
• Collection of events ;
• Risk mapping ;
• Key risk indicators
Exposure to operational risks and incurred losses are regularly reported to the entity concerned, general management, and to the Board. The management system is properly documented, to ensure compliance with a set of formalised controls, procedures and corrective measures for non-compliance.
Internal and/or external auditors are called to periodically review the management process and systems for measuring operational risk. These reviews concern the activities of the units and the independent function of the operational risk management.
The management of BMCE Bank Group operational risks has been fully automated through the use of a dedicated tool, namely MEGA GRC. Accordingly, the gathering of data pertaining to risk events, the mapping of operational risks, as well as the key risk indicators are today handled by this tool which has been deployed at the level of the bank as well as its Morocco and Europe-based subsidiaries.
8.6.4.1. Containment and Mitigation of Operational Risks
Several types of attitudes may be considered in the management of operational risks :
• Enhancing controls ;
• Covering risks, by taking out insurance ;
• Avoiding risks, notably by the re-deployment of activities ;
• Elaborating business continuity plans.
BMCE Bank Group has a secure and very strong control system apt to considerably reduce operational risks.Nevertheless, as far as the management of operational risk via a dedicated apparatus is concerned, it reserves itself all the latitude necessary to identify on a case-per-case basis optimal behavior to adopt, depending on the different risk types which are made explicit beforehand.
Furthermore, the Group has insurance policies designed to mitigate risks attendant to damage to premises, fraud, theft of valuables, and third party liability …
8.6.5. Business Continuity Plan
Driven by a regulatory trend, the Business Continuity Plan responds to the growing importance granted to the minimisation of the effects of interruption of activities, owing to the interdependence links between them and to the resources they rely on (being human, computing, or logistical). Based on sundry crisis scenarios –including

40
situations of extreme shock—the plan consists of a set of measures and procedures aimed to keep up (albeit in a temporary and eroded fashion, if the need should arise) the provision of essential services and thereafter to ensure planned resumption of business activities.
The cross-cutting strategic principles underlying the business continuity are as follows :
• BMCE Bank has social responsibility vis-à-vis its clientele. This means that the latter should be able to avail itself of the liquidity it has entrusted with the Bank. Non compliance with this obligation in times of crisis may well have an impact on public law and order. This principle prevails above all the other principles ;
• BMCE Bank must guarantee its commitments through the interbank compensation system on the Moroccan market ;
• BMCE Bank, as a matter of priority, intends to abide by the legal and contract commitments (as they relate to the credit and commitments area) which it has already underwritten, before making any other commitments ;
• BMCE Bank intends to uphold its international credibility and guarantee its commitments vis-à-vis foreign correspondents.
• BMCE Bank customers are given priority over other beneficiaries to benefit from the Bank’s services.
• The latter are taken into account in front-to-back operations –in other words, from the branch office to the accounting service.
The year 2009 saw the deployment of the business continuity plan. Several simulations to test the reliability and performance of this plan have been carried out in several regions across the Kingdom
8.7. STRESS TESTINg
The Stress Testing analyzes different scenarios due to extreme portfolio shocks and aims to:
• Strengthen risk measurement tools to predict and anticipate potential credit risk;
• A better allocation of capital, taking into account the continuous increase of the credit portfolio.
BMCE BANK Group includes stress testing as a fundamental component of its risk management policy, as such, exercise stress tests are regularly carried in excess of the new interim reporting established by the regulator during fiscal 2012.
8.8. DESCRIPTION OF THE COUNTRy RISK
Country risk is the possibility that a given sovereign counterparty is unable or refuses country, and the other counterparts of this country will not be able to fulfill their obligations abroad for reasons of socio-political, economic or financial. Country risk can also result from limiting the free movement of capital or from other political or economic factors, this is called risk transfer. It may also result from other risks in connection with the occurrence of events affecting the value of liabilities on the country (natural disasters, external shocks).
The risk management
frameworkAllocation
and monitoring
of limits
Internal country ratings
Stress Testing
Entering into a relationship
and identification of exposures by country
Individual and
consolidated reporting
Alerts and provisioning
8.8.1. Description of the Country Risk Management
8.8.1.1. Country rating system
BMCE Bank has developed an internal country rating which is based on the combination of information gathered from various reports from the country authorities, international organizations (World Bank, IMF ...) and international rating agencies (Coface, S & P ...). The internal rating can have its own appreciation over the group risks in each country, taking into account the most relevant criteria.
8.8.1.2. Country Allocation Limits
The commitments limits are established by country considering the following:
• Assessing country risk incurred in the light of the internal rating of the country as described above;
• Allocation and portfolio diversification for each subsidiary and for the group respecting a maximum concentration by country based on a percentage of regulatory capital.
8.8.1.3. Country Risk Monitoring system
8.8.1.3.1. Identification of country exposures
The breakdown of categories of transactions by business lines are as follows:
• Credit transactions on foreign counterparties;
• Operations in foreign securities;
• Market transactions inducing risks on foreign counterparties;
• Foreign trade operations and various guarantees.
8.8.1.3.2. Reporting of exposures by country
Tracking and monitoring of BMCE Bank Group exposures on foreign counterparties are provided through a monthly rise in the form of reporting, from 36 branches to the Risk Management Group.
These reporting stand the situation at the end of the month:
• Exposures by country, geographic area, industry, risk class, type of line in the balance sheet and the off balance sheet ...

41
• Indicators of Credit Risk (NPL ratio, provisions, coverage ratio ...)
The Risk Management Group calculates exposure to country risk as well as the consolidation of the Group’s exposures in order to identify the areas and countries with high exposure.
8.9. ASSET LIABILITIy MANAgEMENT
In order to maintain a balance sheet at equilibrium, in a context of a strong growth in assets, the management of liquidity and interest rate risks system should :
• Ensure the stability of earnings against the change in interest rates, with a sustained net interest income and optimised economic value of equity ;
• Manage an adequate level of liquidity, allowing the bank to meet its obligations at any time, away of any potential crisis ;
• Ensure that the risk inherent in foreign exchange does reduce the margin of the bank ;
• Adjust the bank’s strategy so as to fully capture the growth opportunities offered by the macroeconomic environment.
• The Bank has set the ALCO Committee to monitor the achievement of these objectives, with as the main missions :
- Formulates the ALM policy
- Organize and facilitate the ALM subcommittees
- Have a thorough knowledge of the types of risks inherent in the Bank’s activities and stay informed of the evolution of these risks based on the trend of financial markets, of risk management practices, and activity of the Bank;
- Review and approve procedures to limit risks inherent in the Bank’s credit activity, investment, trading and other activities and significant products;
- Master the reporting systems that measure and daily control the main sources of risk;
- Periodically review and approve risk limits accordance with any changes in the institution’s strategy, approve new products and respond to significant changes in market conditions;
- Ensure that the various lines of business are properly managed by HR with a level of knowledge, experience and expertise consistent with the nature of supervised activities.
8.9.1. Liquidity Risk
The bank’s strategy in terms of liquidity risk management aims at adjusting the structure of its resources in phase with the development of its business activity.
Liquidity risk is defined as the inability of the Bank to meet its obligations when unexpected needs occur and that the bank’s liquid assets cannot cover them.
Such an event might be induced by other causes than liquidity, such as default of counterparts, or adverse changes in the market, resulting in potential losses.
Two major factors may generate a liquidity risk :
• The inability of the establishment to raise the necessary funds to face unexpected situations over the short term, notably in case of massive withdrawal of deposited assets and maximal drawing of off-balance-sheet commitments.
• Non backing of assets and liabilities or the financing of medium and long term assets by means of short-term liabilities
A liquidity level is deemed acceptable when it enables the Bank to finance the evolution of its assets and to meet its commitments as soon as they are due for payment, thereby shielding the Bank against any possible crisis.
In this respect, two indicators serve to assess the Bank’s liquidity profile :
• Liquidity ratio, as defined by the central bank ;
• Cumulative static gaps for a 12 months period.
Periodic or cumulative gaps in local or foreign currency measure the bank’s risk of liquidity in the short, medium and long terms. This allows estimating the net refinancing needs on different buckets and determining the appropriate coverage.
8.9.2. Interest Rate Risk
Interest rate risk is the risk of reducing the margins of the Bank due to changes in interest rates. The latter also impacts the discounted value of expected future cash flows.
The degree of the impact on the economic value of assets and liabilities depends on how sensitive the balance sheet items are to the change in interest rates.
The interest rate risk can be assessed through stress testing, based on an interest rate shock of 200 basis points, as recommended by Basel Committee.
The Bank’s strategy in terms of interest rate risk management aims at stabilizing earnings against any change in interest rates, with a sustained net interest income and optimised economic value of equity.
Changes in interest rates can have negative impact on the Bank’s net interest income, and thus cause serious deviation from initial forecasts.
To counter these discrepancies, the ALM department regularly matches uses with resources of the same nature, and defines the tolerance level for a maximum deviation in net interest income from the forecasted net banking income.
Periodic or cumulative gaps in local or foreign currency measure the bank’s risk of liquidity in the short, medium and long terms.
This allows estimating the net refinancing needs on different buckets and determining the appropriate coverage.
8.9.3. Sensitivity of the value of banking book
Interest Rate Stress Testing and Sensitivity Analysis
ALM department performs stress testing simulations in order to measure the impact of a change in interest rates on net interest income and the economic value of equity.
An interest rate shock of 200 basis points on the Net Banking Income is estimated at MAD +57 million at june 30, 2013. Likewise, an interest rate shock of 200 basis points would have an impact of MAD 183 million on the economic value of equity or 1,45% of the regulatory capital.
42
Stress Testing applied to Liquidity
In order to assess the Bank’s liquidity in a crisis situation, ALM department performs stress testing in case of a pressure on resources (massive withdrawal of deposits). These scenarios allow an assessment of the bank’s capacity to meet its obligations in situations of liquidity crisis.
Three Scenarios are defined :
• Scenario 1 : this scenario takes into account a pressure on demand deposits for 3 months, while maintaining the credit activity. The liquidity behaviour is studied thanks to liquidity gaps on the first three months. This stress test assumes the withdrawal of 30% of time deposits (10% per month) ;
• Scenario 2 : this scenario takes into account a pressure on demand deposits for 10 days, while maintaining the credit activity.
The objective of this scenario is to test the capacity of the Bank to meet its obligations, following the withdrawal of volatile time deposits, on a very short period (10 days) ;
• Scenario 3 : This is the worst case scenario, with a maximum pressure on deposits in a major crisis situation, where the bank looses the totality of demand deposits in 10 days.
At june 30, 2013, the 12-month-span liquidity gap shows a liquidity surplus of 8,7 billion MAD compared with +9.9 billion MAD to the end of December 2012. Furthermore, the liquidity ratio (1 month liquid assets to 1 month liabilities) stands at 107%.
8.10. CAPITAL COMPONENTS AND CAPITAL ADEqUACy
The Main Characteristics of the components of Capital
Share Capital
BMCE Bank has a capital of MAD 1,794,633 900, consisting of 179,463,390 ordinary shares with a nominal value of 10 MAD, fully paid. Each action usually gives a right to vote.
Subordinated debts
Total subordinated debt added up to about 5.4 billion MAD at june 30, 2013.
8.10.1. Evaluation of the Capital Adequacy
BMCE BANK Group has opted for the standard approach, as presented in the circulars issued by Bank Al-Maghrib (BAM), (or, the Central Bank of Morocco). The circulars in question are :
• Circular no. 26/G/2006 relative to regulatory requirements in equity capital for credit institutions and similar entities ;
• Circular no. B3/G/2006 relative to the methods of calculating credit risk weighted assets ;
• Circular no. 25/G/2006 relative to the minimum requirement of capital adequacy ratio for credit institutions and similar entities;
• Circular no. 24/G/2006 relative to capital.
These circulars cover all the risks taken by the Bank. In fact, the methods of calculating market risks are governed by these selfsame circulars, according to the standard approach.
Regulatory capital requirements for credit risks are applied
on an individual basis for each entity in the Group and on a consolidated basis at the level of BMCE Bank Group.
NB: In 2009, BMCE Bank Group launched an internal rating project for the purpose of preparing for advanced methods
8.10.2. Capital Components
Pursuant to the standardised approach, BMCE Bank Group capital is calculated in conformity with Circular no. 26/G/2006 relative to regulatory capital requirements for credit institutions and similar entities and to Circular no. 24/G/2006 relative to capital.
Capital Requirements by Type of Risks on a Consolidated Base
Risk weighted assets
Credit Risk 141 237 447
Market Risk 13 655 837
Operational Risk 15 383 016
Other risks (Pilier II)
Total of Weighted Risks 170 276 300
Regulatory capital adequacy ratio
amount
Tier I 15 408 008
Total of eligible equity 22 033 649
Total risk-weighted assets 170 276 300
Ratio Tier I 9,05%
Capital adequacy ratio 12,94%
43
BMCE BankCapital : 1 794 633 900 dirhamsHeadoffice : 140, avenue Hassan II, 20 000, CasablancaBP 13425 Casa PrincipaleArrêté du Ministre des Finances n° 2348-94 du 14 rabii I 1415 (23 août 1994)Trade register : casa 27.129Swift : bmce ma mcTelex : 21.931 - 24.004
GROUP GENERAL SECRETARIAT Tel. : 05 22 49 80 04Fax : 05 22 26 46 55
FINANCIAL COMMUNICATIONTel. : 05 22 49 80 03 / 05 22 46 21 97Fax : 05 22 26 49 65E-mail : [email protected]
BMCE BANK web site : www.bmcebank.maINTERNATIONAL TRADE web site : www.bmcetrade.comINVESTMENT BANK web site : www.bmcecapital.com