Embed Size (px)
Citation preview
BMC: An Efficient Methodto Evaluate Probablistic Reachability Queries
Ke Zhu, Wenjie Zhang, Gaoping Zhu, Ying Zhang, and Xuemin Lin
University of New South Wales, Sydney, NSW, Australia,kez, zhangw, gzhu, yingz, [email protected]
Abstract. Reachability query is a fundamental problem in graph databases.It answers whether or not there exists a path between a source vertex anda destination vertex and is widely used in various applications includingroad networks, social networks, world wide web and bioinformatics. Insome emerging important applications, uncertainties may be inherent inthe graphs. For instance, each edge in a graph could be associated witha probability to appear. In this paper, we study the reachability problemover such uncertain graphs in a threshold fashion, namely, to determineif a source vertex could reach a destination vertex with probabilty largerthan a user specified probability value t. Finding reachability on uncer-tain graphs has been proved to be NP-Hard. We first propose novel andeffective bounding techniques to obtain the upper bound of reachabilityprobability between the source and destination. If the upper bound failsto prune the query, efficient dynamic Monte Carlo simulation technqi-ues will be applied to answer the probabilitistic reachability query withan accuracy guarantee. Extensive experiments over real and syntheticdatasets are conducted to demonstrate the efficiency and effectiveness ofour techniques.
1 Introduction
In many real world applications, complicatedly structured data could be repre-sented by graphs. These applications include Bioinformatics, Social Networks,World Wide Web, etc. Reachability query is one of the fundamental graph prob-lems. A reachability query answers whether a vertex u could reach another vertexv in a graph. Database community has put considerable efforts into studying thereachability problem, for example, [7], [5], [1], [14], [9], [2], [8], [4], [3], etc.
All of the above works focus on the applications where edges between twovertices exist for certain. However, in many novel applications, such an assump-tion may not capture the precise semantics and thus the results produced arealso imprecise.
Example 1: In Protein-Protein interaction networks, an edge between twoproteins means they have been observed to interact with each other in someexperiments. However, not all interactions can be consistantly observed in everyexperiment. Therefore, it is more accurate to assign probabilities to edges torepresent the confidence on the relationship. In this application, biologists maywant to query whether a particular protein is related to another protein througha series of interactions.
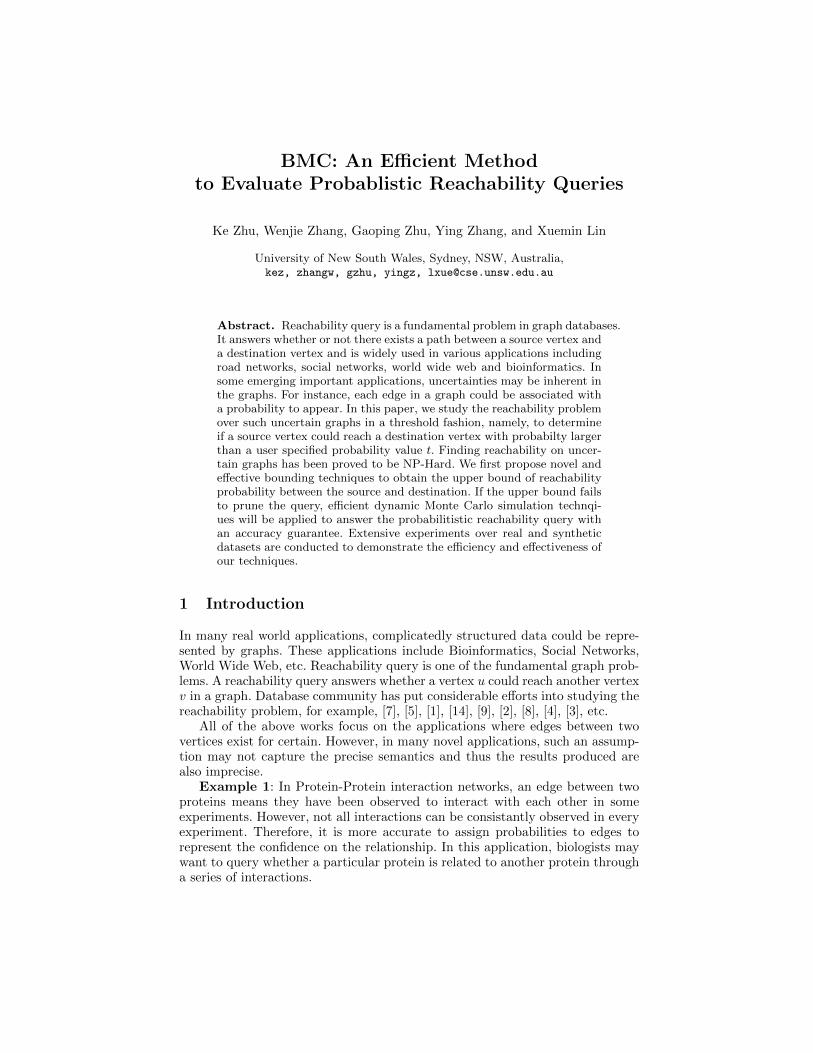
Example 2: Social Network Analysis has recently gained great researchattention with the emergence of large-scale social networks like LinkedIn, Face-book, Twitter and MySpace. In these social networks, connections between enti-ties/individuals(vertices) may not be completely precise due to various reasonsincluding errors incurred in data collection process, privacy protection, com-plexed semantics, disguised information, etc([22]).
u
w1
w2
w3
w4
w5
w6
w7
v0.8
0.8
0.8
0.8
0.8
0.8
0.8
0.8
0.8 0.8
0.8
Fig. 1. A running example
In above applications, an edge connecting two vertices is associated with aprobability value indicating the confidence of its existence. Reachability queriesover this kind of uncertain graphs are thus called Probabilistic ReachabilityQueries. The Probabilistic Reachability problem is intrinsically difficult. As arunning example in Fig 1, this graph consists of only 11 edges. To accuratelyanswer the Probablistic Reachability from u to v, we need to enumerate up to 211
possible instances of the uncertain graph. For each of these instances, we need tocheck whether u can reach v, and then aggregate the probabilities of the instancesin which u can reach v. In [10], Valiant has proved this problem is NP-Hard.
Monte Carlo simulation provides an approximate solution to this problem.A considerable number of articles([15],[16],[17],[18],[19], etc) studied how to useMonte Carlo simulation to solve the probablistic reachability problem. The focusof those studies are on utilizing different sampling plans to reduce sampling error.Due to the dramatical increase of the scale of graphs and the large number of it-erations required by Monte Carlo simulation to guarantee the accuracy, the com-putational cost of traditional Monte Carlo method is still considerably expensive.
In this paper, we propose a more efficient dynamic Monte Carlo method toapproximate the answer. This dymanic Monte Carlo method will only simulatenecessary part of the graph and will share most of the overlapping cost betweendifferent iterations. In addition to that, we also propose an index which can as-sist in calculating upper bound of probablistic reachability. Queries pruned bythe bound do no need to be approximated by the Morte Carlo method which isrelatively more expensive. The main contributions of the paper are:
1. To the best of our knowledge, we are the first to address the efficiency issuesof Probabilistic Reachability Queryby using indexing techniques. We formallydefine Probabilistic Reachability Queryusing Possible World semantics.
2. We propose an efficient dynamic Monte Carlo algorithm to calculate approx-imate result. In addition, we also give a theoretical accuracy guarantee forthe Monte Carlo method.
3. We propose an index which efficiently calculates the upper bound of Proba-bilistic Reachability Queries.
4. We perform extensive experiments on real datasets and synthetic datasets todemonstrate the efficiency of our proposed method.
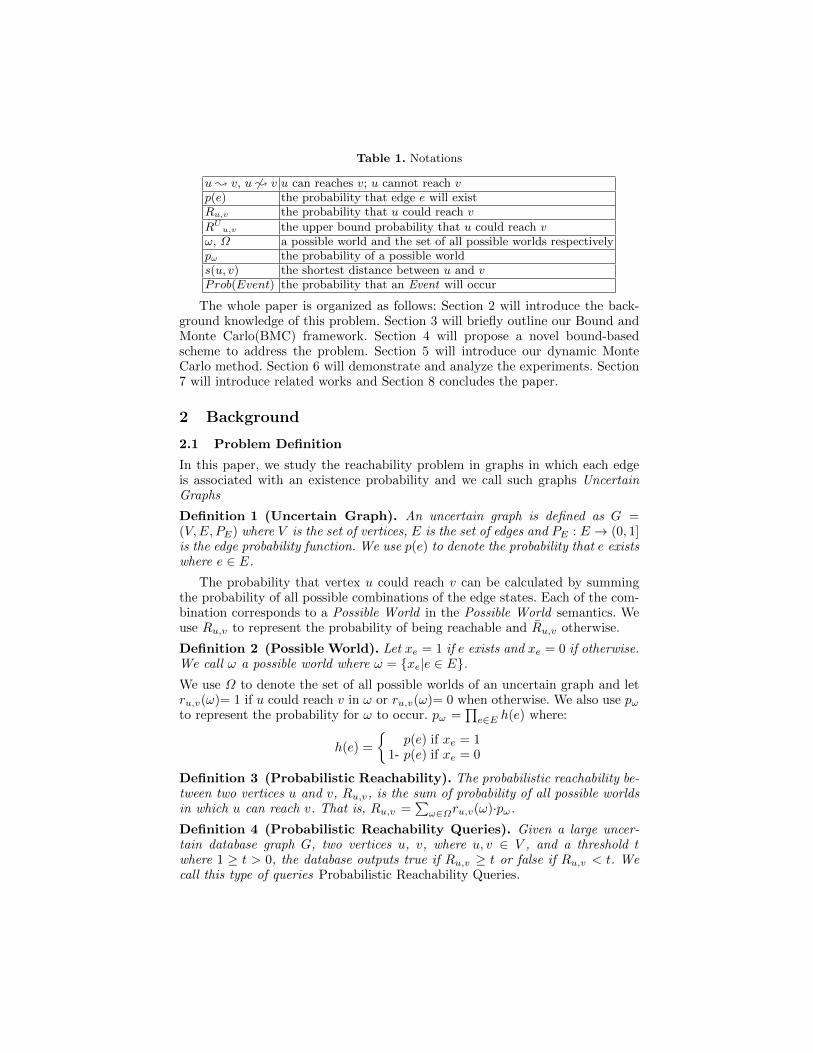
Table 1. Notations
u ; v, u 6; v u can reaches v; u cannot reach vp(e) the probability that edge e will existRu,v the probability that u could reach v
RUu,v the upper bound probability that u could reach v
ω, Ω a possible world and the set of all possible worlds respectivelypω the probability of a possible worlds(u, v) the shortest distance between u and vProb(Event) the probability that an Event will occur
The whole paper is organized as follows: Section 2 will introduce the back-ground knowledge of this problem. Section 3 will briefly outline our Bound andMonte Carlo(BMC) framework. Section 4 will propose a novel bound-basedscheme to address the problem. Section 5 will introduce our dynamic MonteCarlo method. Section 6 will demonstrate and analyze the experiments. Section7 will introduce related works and Section 8 concludes the paper.
2 Background
2.1 Problem Definition
In this paper, we study the reachability problem in graphs in which each edgeis associated with an existence probability and we call such graphs UncertainGraphs
Definition 1 (Uncertain Graph). An uncertain graph is defined as G =(V,E, PE) where V is the set of vertices, E is the set of edges and PE : E → (0, 1]is the edge probability function. We use p(e) to denote the probability that e existswhere e ∈ E.
The probability that vertex u could reach v can be calculated by summingthe probability of all possible combinations of the edge states. Each of the com-bination corresponds to a Possible World in the Possible World semantics. Weuse Ru,v to represent the probability of being reachable and Ru,v otherwise.
Definition 2 (Possible World). Let xe = 1 if e exists and xe = 0 if otherwise.We call ω a possible world where ω = xe|e ∈ E.We use Ω to denote the set of all possible worlds of an uncertain graph and letru,v(ω)= 1 if u could reach v in ω or ru,v(ω)= 0 when otherwise. We also use pωto represent the probability for ω to occur. pω =
∏e∈E h(e) where:
h(e) =
p(e) if xe = 1
1- p(e) if xe = 0
Definition 3 (Probabilistic Reachability). The probabilistic reachability be-tween two vertices u and v, Ru,v, is the sum of probability of all possible worldsin which u can reach v. That is, Ru,v =
∑ω∈Ωru,v(ω)·pω.
Definition 4 (Probabilistic Reachability Queries). Given a large uncer-tain database graph G, two vertices u, v, where u, v ∈ V , and a threshold twhere 1 ≥ t > 0, the database outputs true if Ru,v ≥ t or false if Ru,v < t. Wecall this type of queries Probabilistic Reachability Queries.
2.2 Preliminaries
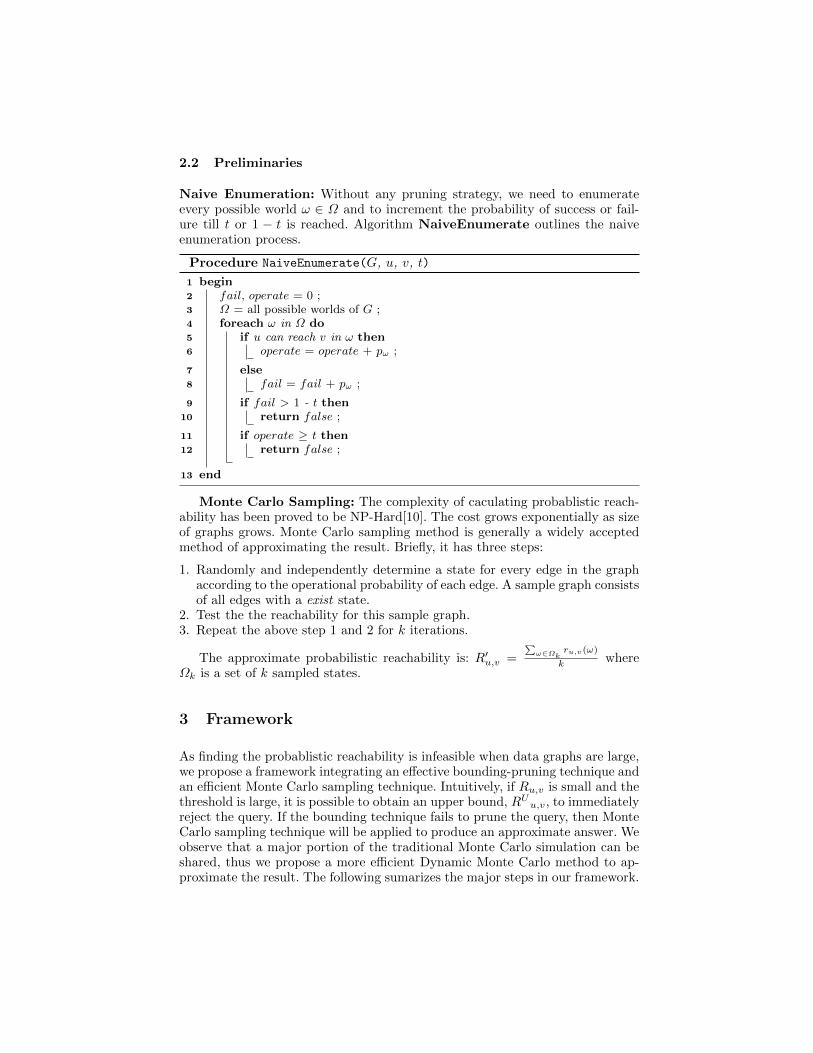
Naive Enumeration: Without any pruning strategy, we need to enumerateevery possible world ω ∈ Ω and to increment the probability of success or fail-ure till t or 1 − t is reached. Algorithm NaiveEnumerate outlines the naiveenumeration process.
Procedure NaiveEnumerate(G, u, v, t)
begin1
fail, operate = 0 ;2
Ω = all possible worlds of G ;3
foreach ω in Ω do4
if u can reach v in ω then5
operate = operate + pω ;6
else7
fail = fail + pω ;8
if fail > 1 - t then9
return false ;10
if operate ≥ t then11
return false ;12
end13
Monte Carlo Sampling: The complexity of caculating probablistic reach-ability has been proved to be NP-Hard[10]. The cost grows exponentially as sizeof graphs grows. Monte Carlo sampling method is generally a widely acceptedmethod of approximating the result. Briefly, it has three steps:
1. Randomly and independently determine a state for every edge in the graphaccording to the operational probability of each edge. A sample graph consistsof all edges with a exist state.
2. Test the the reachability for this sample graph.3. Repeat the above step 1 and 2 for k iterations.
The approximate probabilistic reachability is: R′u,v =∑ω∈Ωk
ru,v(ω)
k whereΩk is a set of k sampled states.
3 Framework
As finding the probablistic reachability is infeasible when data graphs are large,we propose a framework integrating an effective bounding-pruning technique andan efficient Monte Carlo sampling technique. Intuitively, if Ru,v is small and thethreshold is large, it is possible to obtain an upper bound, RUu,v, to immediatelyreject the query. If the bounding technique fails to prune the query, then MonteCarlo sampling technique will be applied to produce an approximate answer. Weobserve that a major portion of the traditional Monte Carlo simulation can beshared, thus we propose a more efficient Dynamic Monte Carlo method to ap-proximate the result. The following sumarizes the major steps in our framework.
1. We create an index on the database graph so that the upper bound of the ex-act reachability could be calculated efficiently. We will attempt to prune thequery by calculating the upper bound of the probablistic reachability. Thistechnique is to be detailed in Section 4.
2. If the upper bound cannot prune the query, we will sample a number of possi-ble worlds and use our proposed Dynamic Monte Carlo simulation to estimatethe reachability. This technique is to be detailed in Section 5.
4 Upper Bound Index
Naive Enumeration is impractical to answer Probabilistic Reachability Queries.However, Probabilistic Reachability Queries only need to answer whether thereachability is above a threshold t, rather than the exact probabilistic reacha-bility. With the help of indices, we can efficiently calculate an effective upperbound of the reachability between the source and the destination. If the upperbound can be used to prune the query before Monte Carlo Simulation, we canavoid the relatively more expensive sampling and reachability testing.
As mentioned previously, it is infeasible to enumerate every single possibleworld when a graph is large. The following observations inspired us to proposean efficient upper bound index:
Observation 1: Many real-world graphs are sparse and a local neighbour-hood graph surrounding a vertex is usually small in sparse graphs. It is affordableto enumerate all possible worlds in a small neighbourhood graph.
Observation 2: The local neighbourhood structure surrounding a vertexcan usually provide an upper bound of its ability to reach(or to be reached by)other vertices.
u v
l
m
outlu inm
vp′
(a) Incoming and Outgoing Probability
u
w1
w2
w3
w4
w5
w6
w7
v0.8
0.8
0.8
0.8
0.8
0.8
0.8
0.8
0.8 0.8
0.8
(b) Example
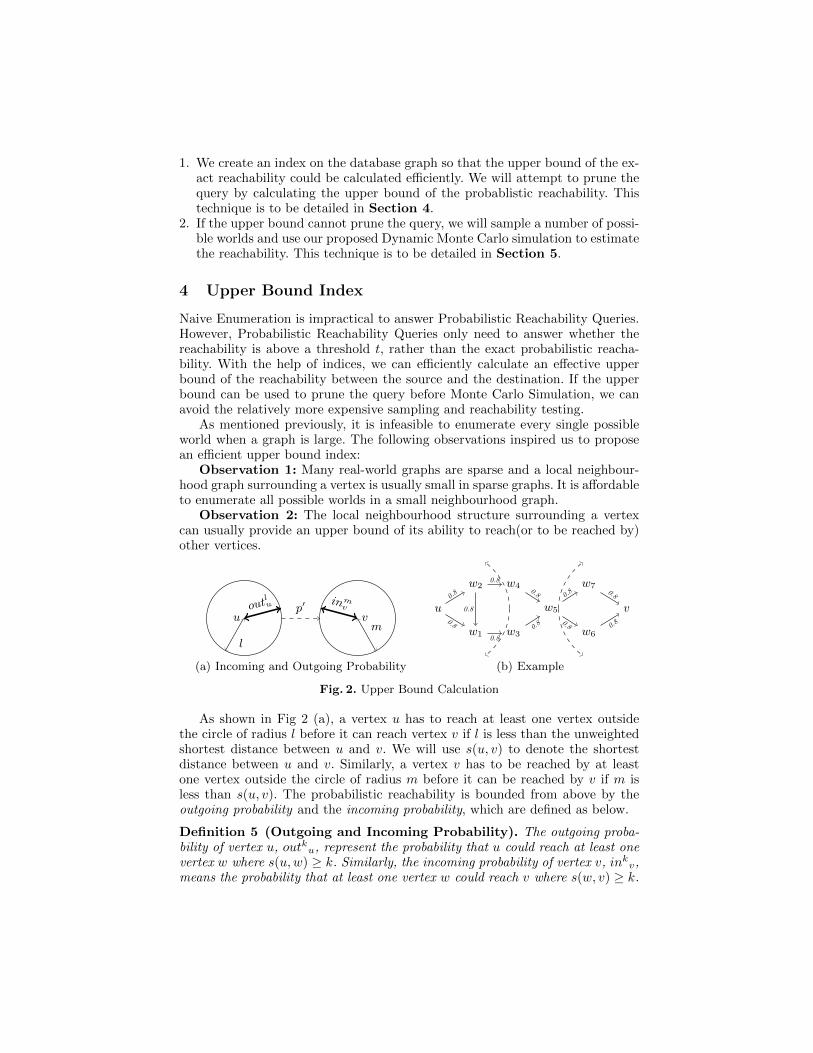
Fig. 2. Upper Bound Calculation
As shown in Fig 2 (a), a vertex u has to reach at least one vertex outsidethe circle of radius l before it can reach vertex v if l is less than the unweightedshortest distance between u and v. We will use s(u, v) to denote the shortestdistance between u and v. Similarly, a vertex v has to be reached by at leastone vertex outside the circle of radius m before it can be reached by v if m isless than s(u, v). The probabilistic reachability is bounded from above by theoutgoing probability and the incoming probability, which are defined as below.
Definition 5 (Outgoing and Incoming Probability). The outgoing proba-bility of vertex u, outku, represent the probability that u could reach at least onevertex w where s(u,w) ≥ k. Similarly, the incoming probability of vertex v, inkv,means the probability that at least one vertex w could reach v where s(w, v) ≥ k.
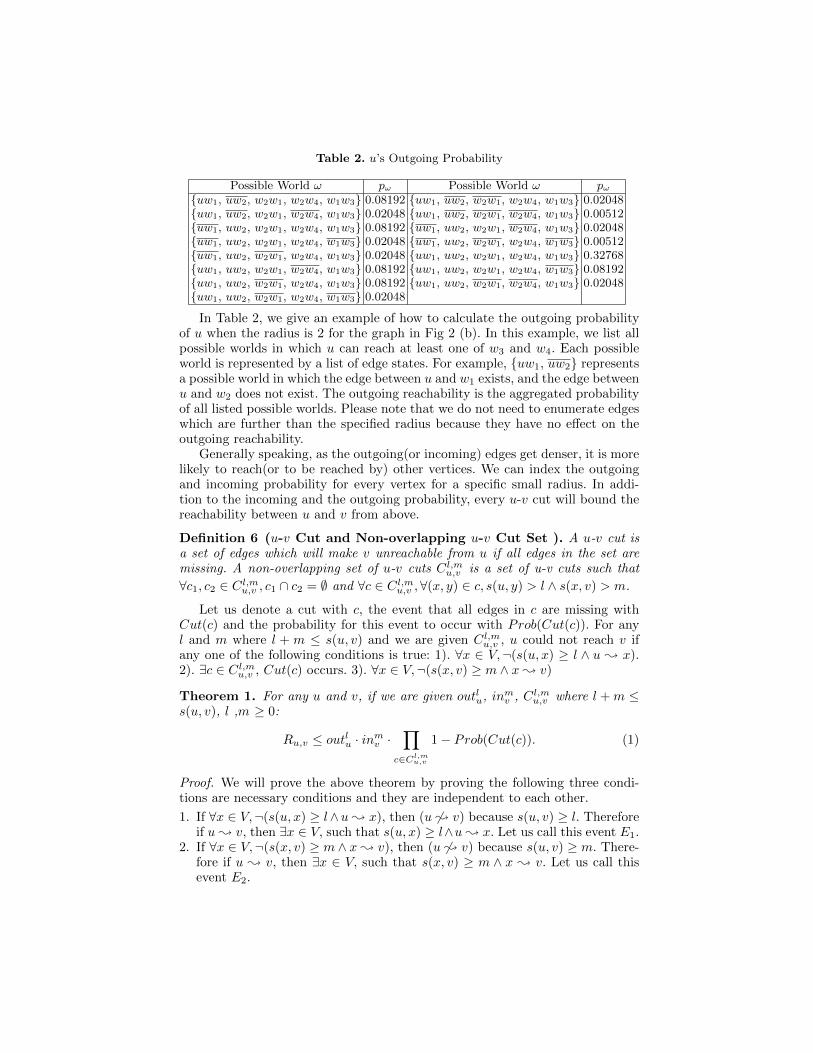
Table 2. u’s Outgoing Probability
Possible World ω pω Possible World ω pωuw1, uw2, w2w1, w2w4, w1w3 0.08192 uw1, uw2, w2w1, w2w4, w1w3 0.02048uw1, uw2, w2w1, w2w4, w1w3 0.02048 uw1, uw2, w2w1, w2w4, w1w3 0.00512uw1, uw2, w2w1, w2w4, w1w3 0.08192 uw1, uw2, w2w1, w2w4, w1w3 0.02048uw1, uw2, w2w1, w2w4, w1w3 0.02048 uw1, uw2, w2w1, w2w4, w1w3 0.00512uw1, uw2, w2w1, w2w4, w1w3 0.02048 uw1, uw2, w2w1, w2w4, w1w3 0.32768uw1, uw2, w2w1, w2w4, w1w3 0.08192 uw1, uw2, w2w1, w2w4, w1w3 0.08192uw1, uw2, w2w1, w2w4, w1w3 0.08192 uw1, uw2, w2w1, w2w4, w1w3 0.02048uw1, uw2, w2w1, w2w4, w1w3 0.02048
In Table 2, we give an example of how to calculate the outgoing probabilityof u when the radius is 2 for the graph in Fig 2 (b). In this example, we list allpossible worlds in which u can reach at least one of w3 and w4. Each possibleworld is represented by a list of edge states. For example, uw1, uw2 representsa possible world in which the edge between u and w1 exists, and the edge betweenu and w2 does not exist. The outgoing reachability is the aggregated probabilityof all listed possible worlds. Please note that we do not need to enumerate edgeswhich are further than the specified radius because they have no effect on theoutgoing reachability.
Generally speaking, as the outgoing(or incoming) edges get denser, it is morelikely to reach(or to be reached by) other vertices. We can index the outgoingand incoming probability for every vertex for a specific small radius. In addi-tion to the incoming and the outgoing probability, every u-v cut will bound thereachability between u and v from above.
Definition 6 (u-v Cut and Non-overlapping u-v Cut Set ). A u-v cut isa set of edges which will make v unreachable from u if all edges in the set aremissing. A non-overlapping set of u-v cuts Cl,mu,v is a set of u-v cuts such that
∀c1, c2 ∈ Cl,mu,v , c1 ∩ c2 = ∅ and ∀c ∈ Cl,mu,v ,∀(x, y) ∈ c, s(u, y) > l ∧ s(x, v) > m.
Let us denote a cut with c, the event that all edges in c are missing withCut(c) and the probability for this event to occur with Prob(Cut(c)). For anyl and m where l + m ≤ s(u, v) and we are given Cl,mu,v , u could not reach v ifany one of the following conditions is true: 1). ∀x ∈ V,¬(s(u, x) ≥ l ∧ u ; x).2). ∃c ∈ Cl,mu,v , Cut(c) occurs. 3). ∀x ∈ V,¬(s(x, v) ≥ m ∧ x ; v)
Theorem 1. For any u and v, if we are given outlu, inmv , Cl,mu,v where l +m ≤s(u, v), l ,m ≥ 0:
Ru,v ≤ outlu · inmv ·∏
c∈Cl,mu,v
1− Prob(Cut(c)). (1)
Proof. We will prove the above theorem by proving the following three condi-tions are necessary conditions and they are independent to each other.
1. If ∀x ∈ V,¬(s(u, x) ≥ l∧u ; x), then (u 6; v) because s(u, v) ≥ l. Thereforeif u ; v, then ∃x ∈ V, such that s(u, x) ≥ l∧u ; x. Let us call this event E1.
2. If ∀x ∈ V,¬(s(x, v) ≥ m ∧ x ; v), then (u 6; v) because s(u, v) ≥ m. There-fore if u ; v, then ∃x ∈ V, such that s(x, v) ≥ m ∧ x ; v. Let us call thisevent E2.
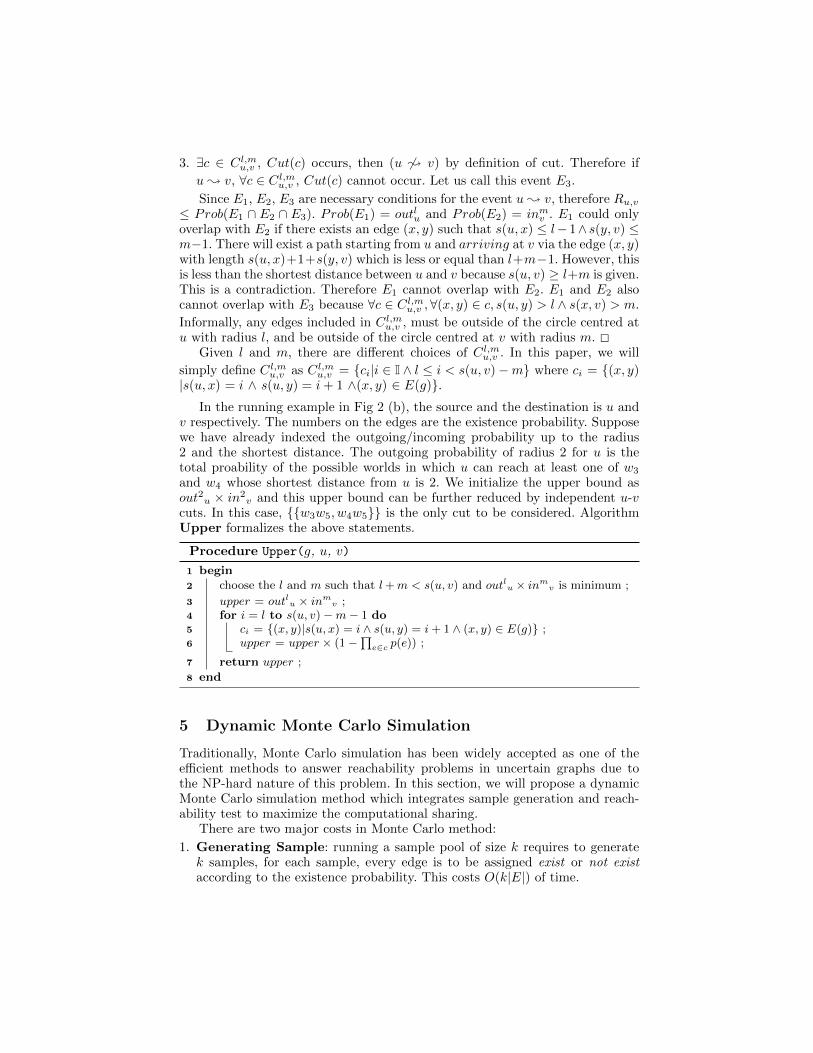
3. ∃c ∈ Cl,mu,v , Cut(c) occurs, then (u 6; v) by definition of cut. Therefore if
u ; v, ∀c ∈ Cl,mu,v , Cut(c) cannot occur. Let us call this event E3.
Since E1, E2, E3 are necessary conditions for the event u ; v, therefore Ru,v≤ Prob(E1 ∩ E2 ∩ E3). Prob(E1) = outlu and Prob(E2) = inmv . E1 could onlyoverlap with E2 if there exists an edge (x, y) such that s(u, x) ≤ l− 1∧ s(y, v) ≤m−1. There will exist a path starting from u and arriving at v via the edge (x, y)with length s(u, x)+1+s(y, v) which is less or equal than l+m−1. However, thisis less than the shortest distance between u and v because s(u, v) ≥ l+m is given.This is a contradiction. Therefore E1 cannot overlap with E2. E1 and E2 alsocannot overlap with E3 because ∀c ∈ Cl,mu,v ,∀(x, y) ∈ c, s(u, y) > l ∧ s(x, v) > m.
Informally, any edges included in Cl,mu,v , must be outside of the circle centred atu with radius l, and be outside of the circle centred at v with radius m. 2
Given l and m, there are different choices of Cl,mu,v . In this paper, we will
simply define Cl,mu,v as Cl,mu,v = ci|i ∈ I ∧ l ≤ i < s(u, v)−m where ci = (x, y)|s(u, x) = i ∧ s(u, y) = i+ 1 ∧(x, y) ∈ E(g).
In the running example in Fig 2 (b), the source and the destination is u andv respectively. The numbers on the edges are the existence probability. Supposewe have already indexed the outgoing/incoming probability up to the radius2 and the shortest distance. The outgoing probability of radius 2 for u is thetotal proability of the possible worlds in which u can reach at least one of w3
and w4 whose shortest distance from u is 2. We initialize the upper bound asout2u × in2v and this upper bound can be further reduced by independent u-vcuts. In this case, w3w5, w4w5 is the only cut to be considered. AlgorithmUpper formalizes the above statements.
Procedure Upper(g, u, v)
begin1
choose the l and m such that l+m < s(u, v) and outlu × inmv is minimum ;2
upper = outlu × inmv ;3
for i = l to s(u, v)−m− 1 do4
ci = (x, y)|s(u, x) = i ∧ s(u, y) = i+ 1 ∧ (x, y) ∈ E(g) ;5
upper = upper × (1−∏
e∈c p(e)) ;6
return upper ;7
end8
5 Dynamic Monte Carlo Simulation
Traditionally, Monte Carlo simulation has been widely accepted as one of theefficient methods to answer reachability problems in uncertain graphs due tothe NP-hard nature of this problem. In this section, we will propose a dynamicMonte Carlo simulation method which integrates sample generation and reach-ability test to maximize the computational sharing.
There are two major costs in Monte Carlo method:
1. Generating Sample: running a sample pool of size k requires to generatek samples, for each sample, every edge is to be assigned exist or not existaccording to the existence probability. This costs O(k|E|) of time.
2. Checking Sample Reachability: For each sample, we need to check thereachability between u and ve. This operation costs O(|E|) of time for eachiteration.
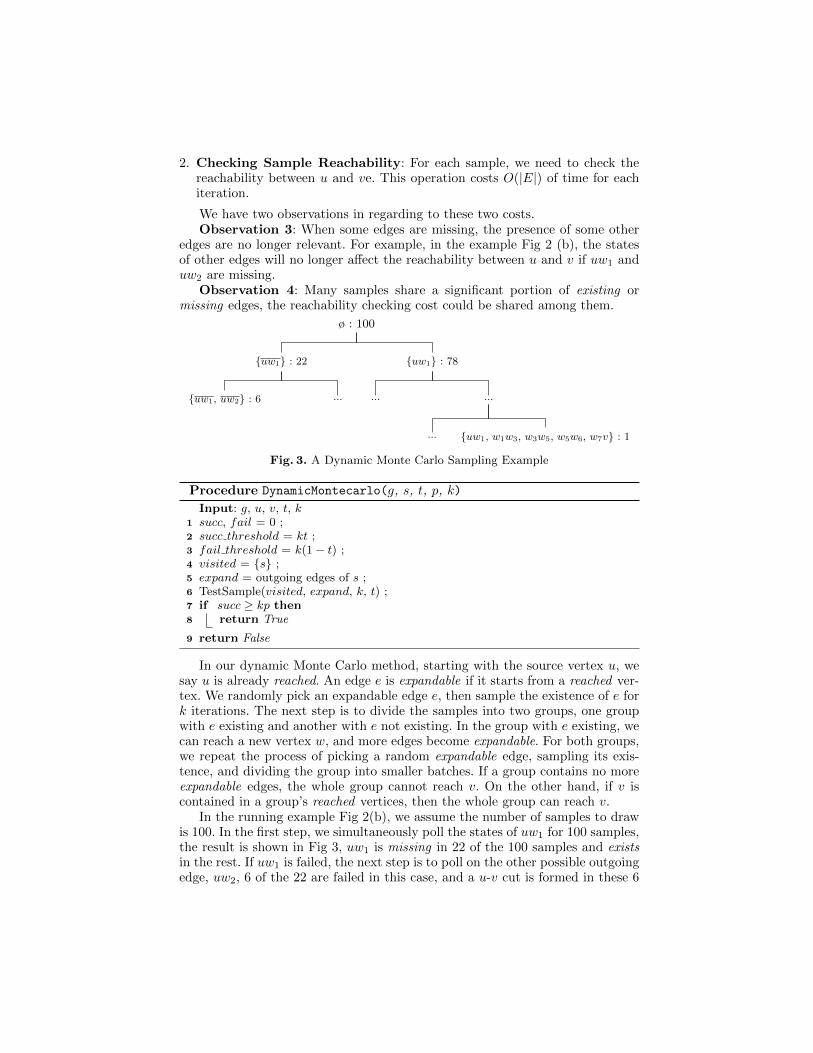
We have two observations in regarding to these two costs.Observation 3: When some edges are missing, the presence of some other
edges are no longer relevant. For example, in the example Fig 2 (b), the statesof other edges will no longer affect the reachability between u and v if uw1 anduw2 are missing.
Observation 4: Many samples share a significant portion of existing ormissing edges, the reachability checking cost could be shared among them.
ø : 100
uw1 : 22
uw1, uw2 : 6 ...
uw1 : 78
... ...
... uw1, w1w3, w3w5, w5w6, w7v : 1
Fig. 3. A Dynamic Monte Carlo Sampling Example
Procedure DynamicMontecarlo(g, s, t, p, k)
Input: g, u, v, t, ksucc, fail = 0 ;1
succ threshold = kt ;2
fail threshold = k(1− t) ;3
visited = s ;4
expand = outgoing edges of s ;5
TestSample(visited, expand, k, t) ;6
if succ ≥ kp then7
return True8
return False9
In our dynamic Monte Carlo method, starting with the source vertex u, wesay u is already reached. An edge e is expandable if it starts from a reached ver-tex. We randomly pick an expandable edge e, then sample the existence of e fork iterations. The next step is to divide the samples into two groups, one groupwith e existing and another with e not existing. In the group with e existing, wecan reach a new vertex w, and more edges become expandable. For both groups,we repeat the process of picking a random expandable edge, sampling its exis-tence, and dividing the group into smaller batches. If a group contains no moreexpandable edges, the whole group cannot reach v. On the other hand, if v iscontained in a group’s reached vertices, then the whole group can reach v.
In the running example Fig 2(b), we assume the number of samples to drawis 100. In the first step, we simultaneously poll the states of uw1 for 100 samples,the result is shown in Fig 3, uw1 is missing in 22 of the 100 samples and existsin the rest. If uw1 is failed, the next step is to poll on the other possible outgoingedge, uw2, 6 of the 22 are failed in this case, and a u-v cut is formed in these 6
Procedure TestSample(visited, expand, n, t)
Input: visited: visted vertices, expand: edgesthat can expand, n: number of samples in this group, v: destination
if expand = ∅ then1
fail = fail + n ;2
return3
if u ∈ visited then4
succ = succ+ n ;5
return6
if succ ≥ succ threshold Or fail > fail threshold then7
return8
e = expand.pop back ;9
k1, k2 = 0 ;10
visited2 = visited⋃v where v is the new vertex brought in by e;11
expand2 = expand⋃v′s outgoing edges which at least one end not in visited2;12
foreach i = 0 to n do13
r = random number from 0 to 1 ;14
if r > p(e) then15
k2 += 1 ;16
else17
k1 += 1 ;18
TestSample(visited, expand, k1, t) ;19
if succ ≥ kp Or fail > k(1− p) then20
return21
TestSample(visited2, expand2, k2, t) ;22
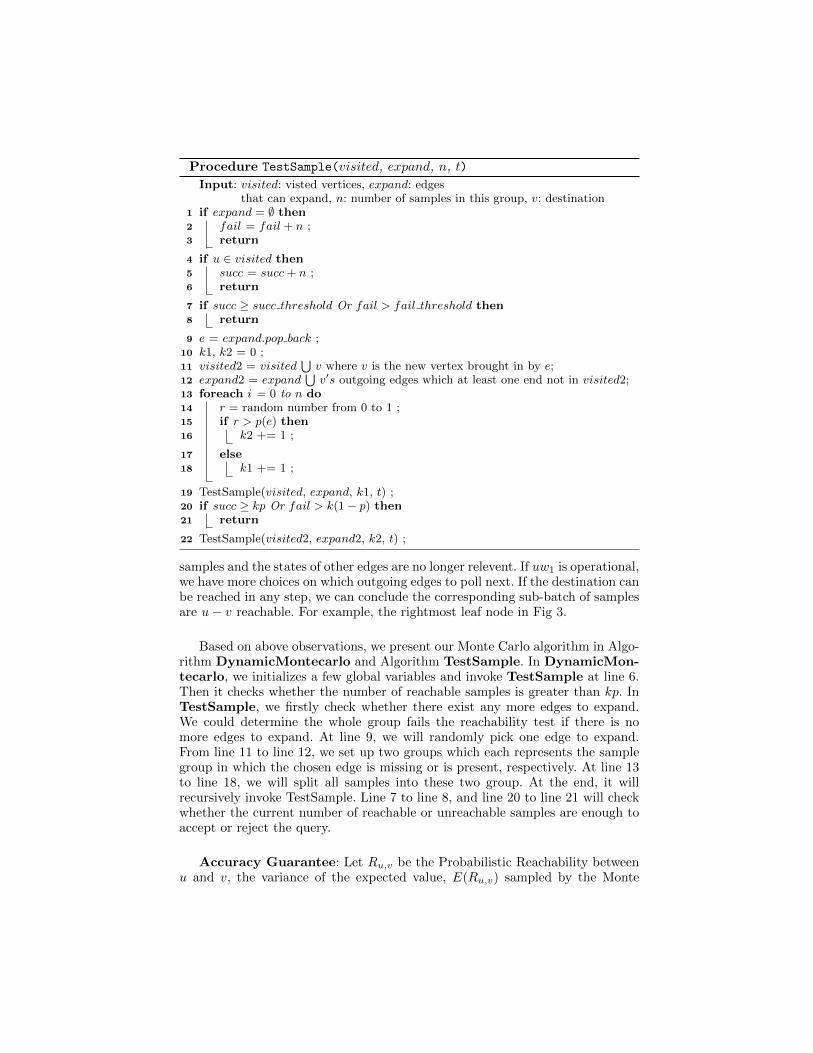
samples and the states of other edges are no longer relevent. If uw1 is operational,we have more choices on which outgoing edges to poll next. If the destination canbe reached in any step, we can conclude the corresponding sub-batch of samplesare u− v reachable. For example, the rightmost leaf node in Fig 3.
Based on above observations, we present our Monte Carlo algorithm in Algo-rithm DynamicMontecarlo and Algorithm TestSample. In DynamicMon-tecarlo, we initializes a few global variables and invoke TestSample at line 6.Then it checks whether the number of reachable samples is greater than kp. InTestSample, we firstly check whether there exist any more edges to expand.We could determine the whole group fails the reachability test if there is nomore edges to expand. At line 9, we will randomly pick one edge to expand.From line 11 to line 12, we set up two groups which each represents the samplegroup in which the chosen edge is missing or is present, respectively. At line 13to line 18, we will split all samples into these two group. At the end, it willrecursively invoke TestSample. Line 7 to line 8, and line 20 to line 21 will checkwhether the current number of reachable or unreachable samples are enough toaccept or reject the query.
Accuracy Guarantee: Let Ru,v be the Probabilistic Reachability betweenu and v, the variance of the expected value, E(Ru,v) sampled by the Monte
Carlo method is as following([16]:
σ2(E(Ru,v)) =Ru,v −Ru,v2
k(2)
As we introduce a threshold t into the Probabilistic Reachability Query, theresult approximated by the Monte Carlo is correct as long as Ru,v −E(Ru,v) ≤Ru,v − t when a query is rejected or E(Ru,v −Ru,v) ≤ t−Ru,v.
Theorem 2 (Cantelli’s Inequality [21]). Suppose that r is a random variablewith mean E(r) and variance σ2(E(r)), Prob(r − E(r) ≥ a) ≤ δ(a, σ(E(r)) forany a ≥ 0, where Prob(r − E(r) ≥ a) denotes the probability of r − E(r) ≥ a,and δ(x, y) is defined as:
δ(x, y) =
1 if x = 1 and y = 00 if x = 0 and y = 01
1+ x2
y2
else
Theorem 3. The probability that the Monte Carlo method returns a false pos-itive(or false negative) answer to a Probabilistic Reachability Query is less or
equal thanRu,v−Ru,v2
(k−1)Ru,v2−(2kt−1)Ru,v+kt2 , if we assume the exact probabilistic reach-
ability values and the threshold follow uniform distribution.
Proof. By using the Theorem 2, the probability that the Monte Carlo methodreturns a false negative answer:
Prob(Ru,v − E(Ru,v) ≥ Ru,v − t) ≤ δ(Ru,v − t, σ(E(Ru,v))
=1
1 +(Ru,v−t)2σ(E(Ru,v))
2
=Ru,v −Ru,v2
(k − 1)Ru,v2 − (2kt− 1)Ru,v + kt2
Similarly, the probability that the Monte Carlo method returns a false positiveanswer can be deduced and the details are omitted. 2
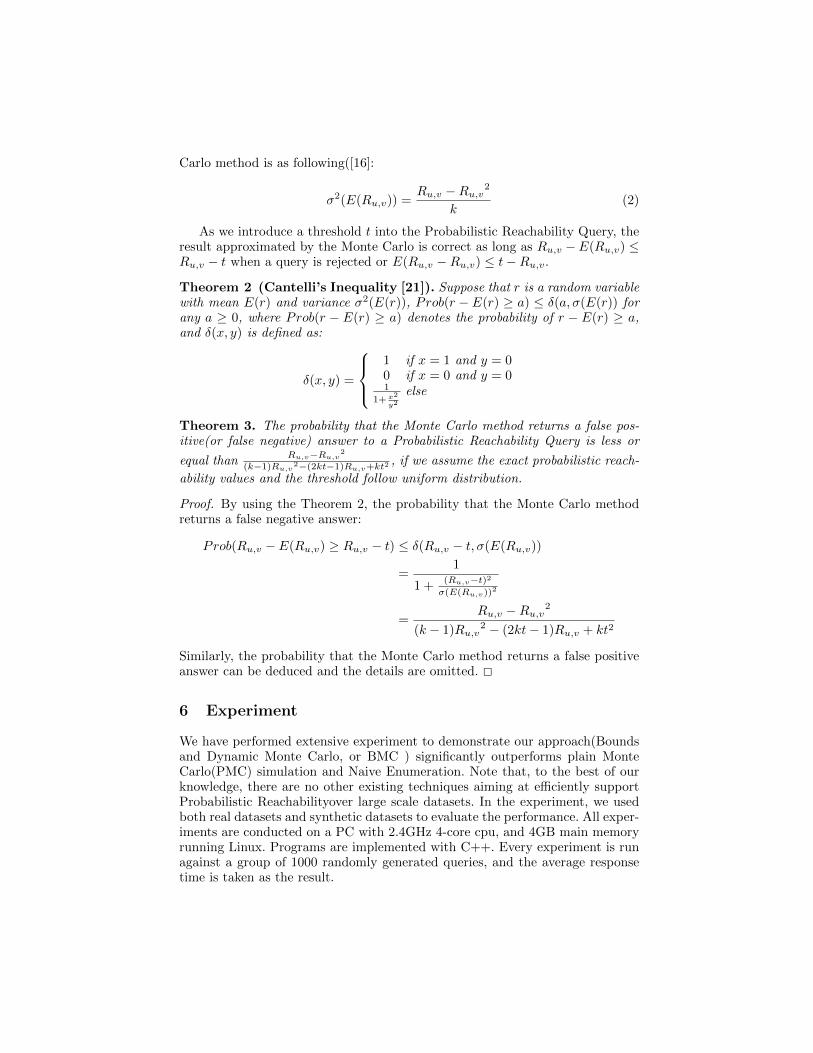
6 Experiment
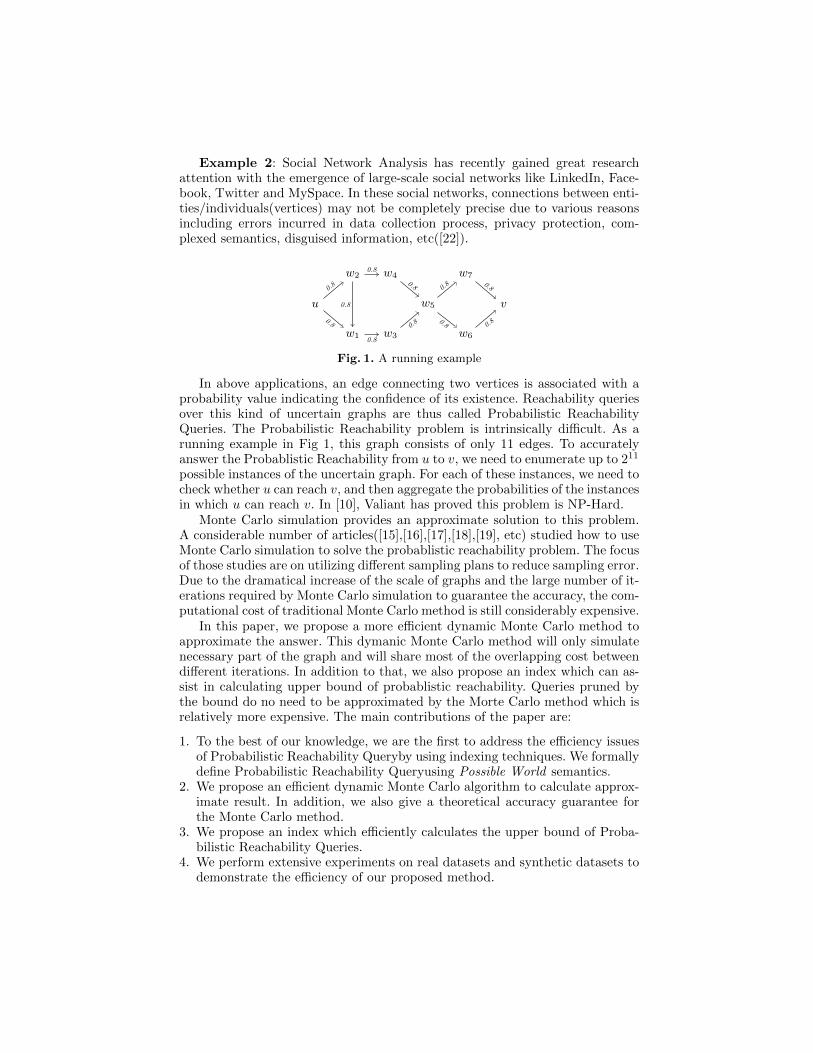
We have performed extensive experiment to demonstrate our approach(Boundsand Dynamic Monte Carlo, or BMC ) significantly outperforms plain MonteCarlo(PMC) simulation and Naive Enumeration. Note that, to the best of ourknowledge, there are no other existing techniques aiming at efficiently supportProbabilistic Reachabilityover large scale datasets. In the experiment, we usedboth real datasets and synthetic datasets to evaluate the performance. All exper-iments are conducted on a PC with 2.4GHz 4-core cpu, and 4GB main memoryrunning Linux. Programs are implemented with C++. Every experiment is runagainst a group of 1000 randomly generated queries, and the average responsetime is taken as the result.
6.1 Real Dataset
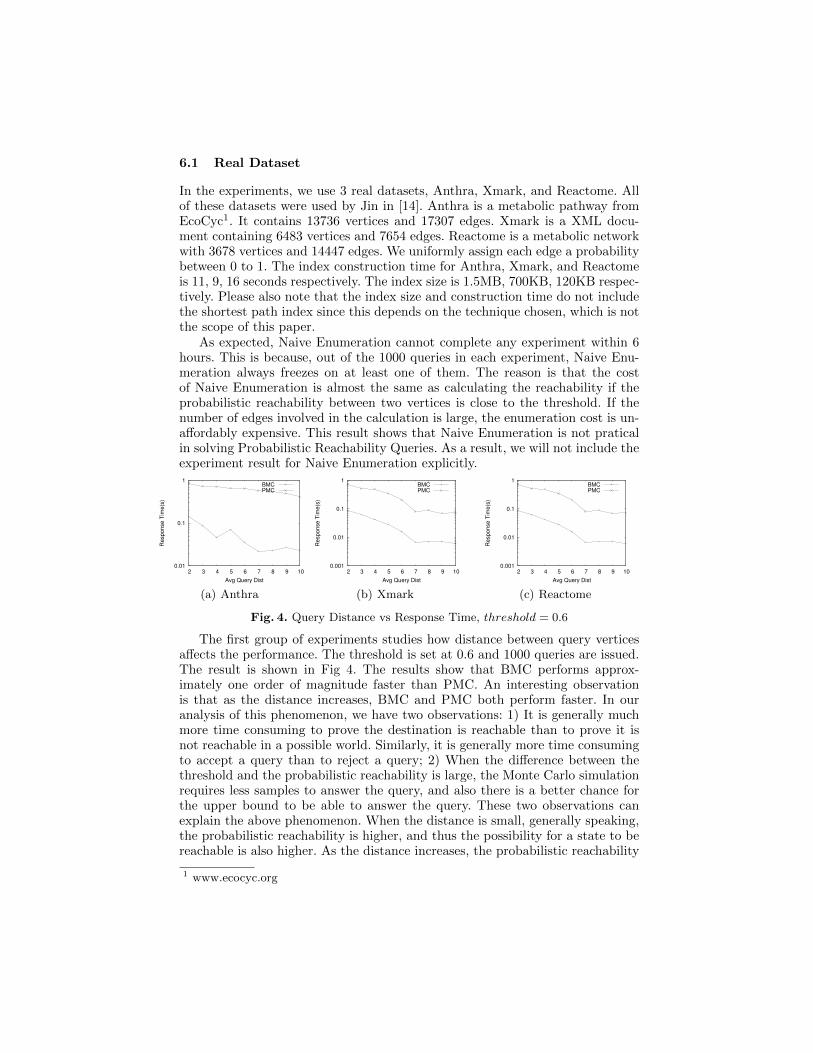
In the experiments, we use 3 real datasets, Anthra, Xmark, and Reactome. Allof these datasets were used by Jin in [14]. Anthra is a metabolic pathway fromEcoCyc1. It contains 13736 vertices and 17307 edges. Xmark is a XML docu-ment containing 6483 vertices and 7654 edges. Reactome is a metabolic networkwith 3678 vertices and 14447 edges. We uniformly assign each edge a probabilitybetween 0 to 1. The index construction time for Anthra, Xmark, and Reactomeis 11, 9, 16 seconds respectively. The index size is 1.5MB, 700KB, 120KB respec-tively. Please also note that the index size and construction time do not includethe shortest path index since this depends on the technique chosen, which is notthe scope of this paper.
As expected, Naive Enumeration cannot complete any experiment within 6hours. This is because, out of the 1000 queries in each experiment, Naive Enu-meration always freezes on at least one of them. The reason is that the costof Naive Enumeration is almost the same as calculating the reachability if theprobabilistic reachability between two vertices is close to the threshold. If thenumber of edges involved in the calculation is large, the enumeration cost is un-affordably expensive. This result shows that Naive Enumeration is not praticalin solving Probabilistic Reachability Queries. As a result, we will not include theexperiment result for Naive Enumeration explicitly.
0.01
0.1
1
2 3 4 5 6 7 8 9 10
Re
sp
on
se
Tim
e(s
)
Avg Query Dist
BMCPMC
(a) Anthra
0.001
0.01
0.1
1
2 3 4 5 6 7 8 9 10
Re
sp
on
se
Tim
e(s
)
Avg Query Dist
BMCPMC
(b) Xmark
0.001
0.01
0.1
1
2 3 4 5 6 7 8 9 10
Re
sp
on
se
Tim
e(s
)
Avg Query Dist
BMCPMC
(c) Reactome
Fig. 4. Query Distance vs Response Time, threshold = 0.6
The first group of experiments studies how distance between query verticesaffects the performance. The threshold is set at 0.6 and 1000 queries are issued.The result is shown in Fig 4. The results show that BMC performs approx-imately one order of magnitude faster than PMC. An interesting observationis that as the distance increases, BMC and PMC both perform faster. In ouranalysis of this phenomenon, we have two observations: 1) It is generally muchmore time consuming to prove the destination is reachable than to prove it isnot reachable in a possible world. Similarly, it is generally more time consumingto accept a query than to reject a query; 2) When the difference between thethreshold and the probabilistic reachability is large, the Monte Carlo simulationrequires less samples to answer the query, and also there is a better chance forthe upper bound to be able to answer the query. These two observations canexplain the above phenomenon. When the distance is small, generally speaking,the probabilistic reachability is higher, and thus the possibility for a state to bereachable is also higher. As the distance increases, the probabilistic reachability
1 www.ecocyc.org
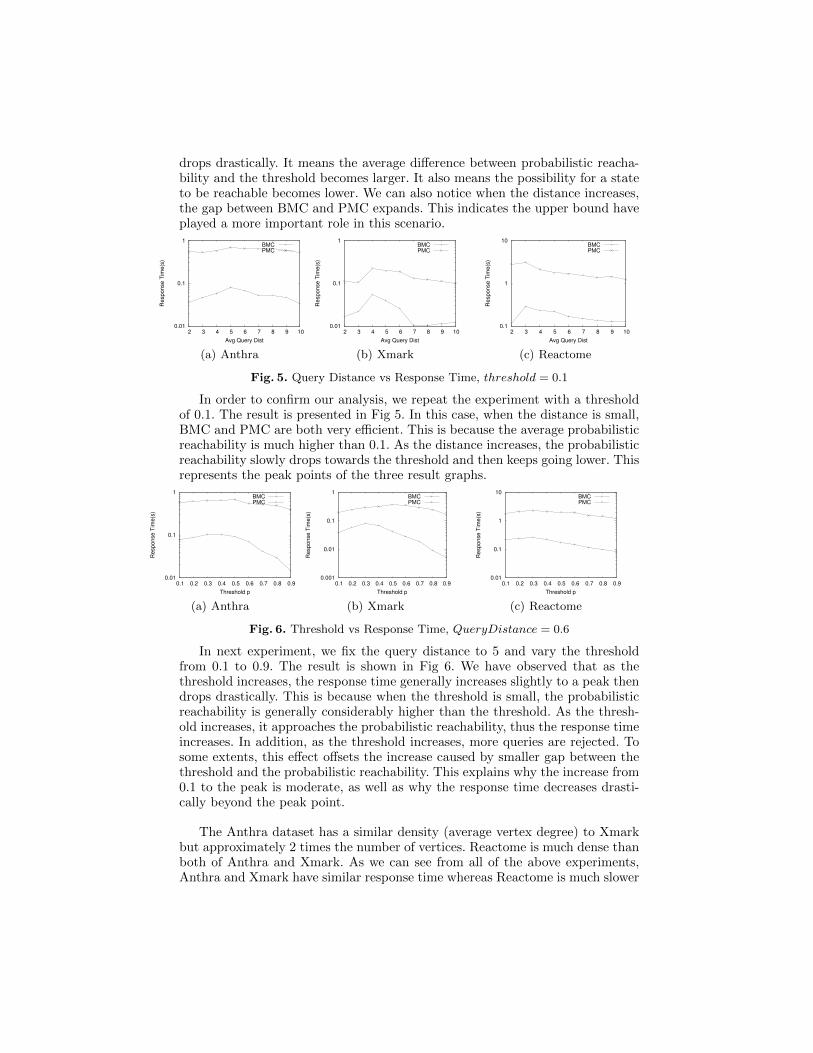
drops drastically. It means the average difference between probabilistic reacha-bility and the threshold becomes larger. It also means the possibility for a stateto be reachable becomes lower. We can also notice when the distance increases,the gap between BMC and PMC expands. This indicates the upper bound haveplayed a more important role in this scenario.
0.01
0.1
1
2 3 4 5 6 7 8 9 10
Re
sp
on
se
Tim
e(s
)
Avg Query Dist
BMCPMC
(a) Anthra
0.01
0.1
1
2 3 4 5 6 7 8 9 10
Re
sp
on
se
Tim
e(s
)
Avg Query Dist
BMCPMC
(b) Xmark
0.1
1
10
2 3 4 5 6 7 8 9 10
Re
sp
on
se
Tim
e(s
)
Avg Query Dist
BMCPMC
(c) Reactome
Fig. 5. Query Distance vs Response Time, threshold = 0.1
In order to confirm our analysis, we repeat the experiment with a thresholdof 0.1. The result is presented in Fig 5. In this case, when the distance is small,BMC and PMC are both very efficient. This is because the average probabilisticreachability is much higher than 0.1. As the distance increases, the probabilisticreachability slowly drops towards the threshold and then keeps going lower. Thisrepresents the peak points of the three result graphs.
0.01
0.1
1
0.1 0.2 0.3 0.4 0.5 0.6 0.7 0.8 0.9
Re
sp
on
se
Tim
e(s
)
Threshold p
BMCPMC
(a) Anthra
0.001
0.01
0.1
1
0.1 0.2 0.3 0.4 0.5 0.6 0.7 0.8 0.9
Re
sp
on
se
Tim
e(s
)
Threshold p
BMCPMC
(b) Xmark
0.01
0.1
1
10
0.1 0.2 0.3 0.4 0.5 0.6 0.7 0.8 0.9
Re
sp
on
se
Tim
e(s
)
Threshold p
BMCPMC
(c) Reactome
Fig. 6. Threshold vs Response Time, QueryDistance = 0.6
In next experiment, we fix the query distance to 5 and vary the thresholdfrom 0.1 to 0.9. The result is shown in Fig 6. We have observed that as thethreshold increases, the response time generally increases slightly to a peak thendrops drastically. This is because when the threshold is small, the probabilisticreachability is generally considerably higher than the threshold. As the thresh-old increases, it approaches the probabilistic reachability, thus the response timeincreases. In addition, as the threshold increases, more queries are rejected. Tosome extents, this effect offsets the increase caused by smaller gap between thethreshold and the probabilistic reachability. This explains why the increase from0.1 to the peak is moderate, as well as why the response time decreases drasti-cally beyond the peak point.
The Anthra dataset has a similar density (average vertex degree) to Xmarkbut approximately 2 times the number of vertices. Reactome is much dense thanboth of Anthra and Xmark. As we can see from all of the above experiments,Anthra and Xmark have similar response time whereas Reactome is much slower
than them. This suggests that the graph size will have limited effect on responsetime whereas the density plays a major role.
0.01
0.1
1
6 8 10 12 14
Res
pons
e Ti
me(
s)
Number of Vertex(K)
BMCPMC
(a) Graph Size Vs Response Time
0.01
0.1
1
10
1 1.5 2 2.5 3 3.5 4
Res
pons
e Ti
me(
s)
Density
BMCPMC
(b) Density Vs Response Time
65
70
75
80
85
90
95
100
1 10 50 100 500 1000
Acc
urac
y
K(Number of Iteration)
(c) Accuracy VS k
60
65
70
75
80
85
90
95
100
0.1 0.2 0.3 0.4 0.5 0.6 0.7 0.8 0.9
Acc
urac
yThreshold
(d) Accuracy VS Threshold
Fig. 7. Synthetic Data
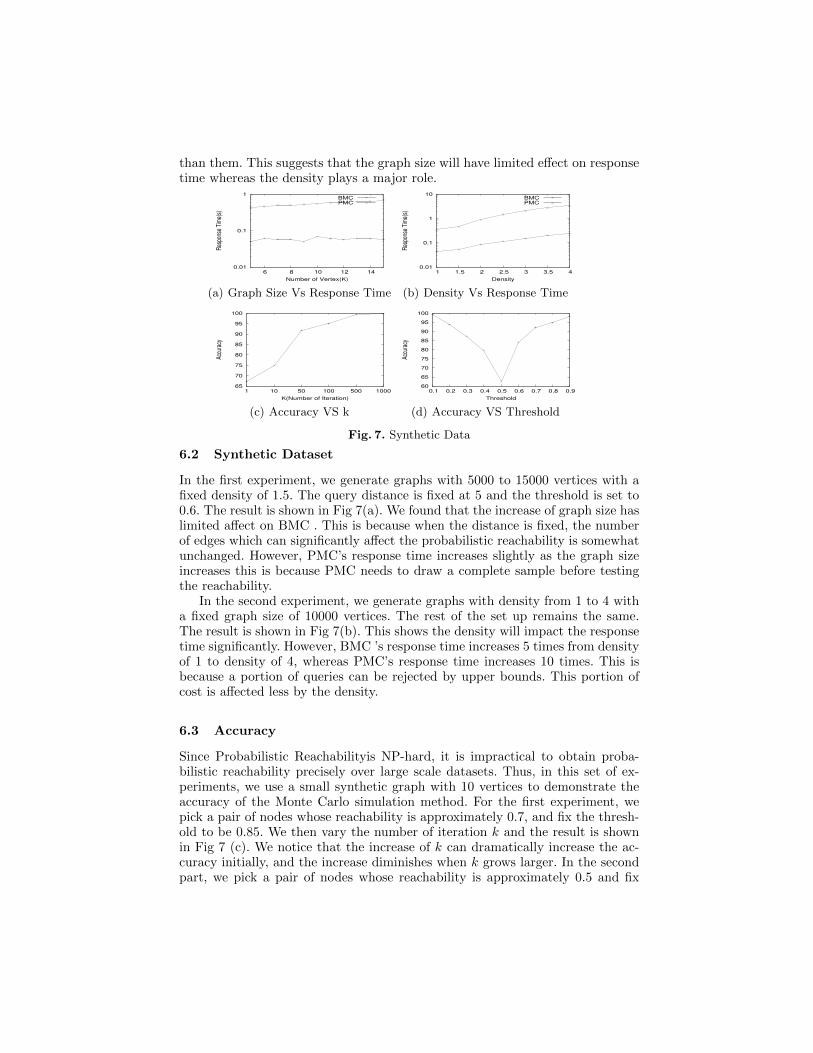
6.2 Synthetic Dataset
In the first experiment, we generate graphs with 5000 to 15000 vertices with afixed density of 1.5. The query distance is fixed at 5 and the threshold is set to0.6. The result is shown in Fig 7(a). We found that the increase of graph size haslimited affect on BMC . This is because when the distance is fixed, the numberof edges which can significantly affect the probabilistic reachability is somewhatunchanged. However, PMC’s response time increases slightly as the graph sizeincreases this is because PMC needs to draw a complete sample before testingthe reachability.
In the second experiment, we generate graphs with density from 1 to 4 witha fixed graph size of 10000 vertices. The rest of the set up remains the same.The result is shown in Fig 7(b). This shows the density will impact the responsetime significantly. However, BMC ’s response time increases 5 times from densityof 1 to density of 4, whereas PMC’s response time increases 10 times. This isbecause a portion of queries can be rejected by upper bounds. This portion ofcost is affected less by the density.
6.3 Accuracy
Since Probabilistic Reachabilityis NP-hard, it is impractical to obtain proba-bilistic reachability precisely over large scale datasets. Thus, in this set of ex-periments, we use a small synthetic graph with 10 vertices to demonstrate theaccuracy of the Monte Carlo simulation method. For the first experiment, wepick a pair of nodes whose reachability is approximately 0.7, and fix the thresh-old to be 0.85. We then vary the number of iteration k and the result is shownin Fig 7 (c). We notice that the increase of k can dramatically increase the ac-curacy initially, and the increase diminishes when k grows larger. In the secondpart, we pick a pair of nodes whose reachability is approximately 0.5 and fix
the number of iteration to be 100. We then vary the threshold from 0.1 to 0.9.The result is shown in Fig 7 (d). In this case, the accuracy drops dramaticallywhen the threshold approach 0.5 and again increases when the threshold movesfurther away from 0.5. This is because the Monte Carlo simulation will performthe worst when the threshold is very close to the probabilistic reachability.
7 Related Work
The Probabilitic Reachability problem has been studied in a number of pa-pers from the 1970s on small scaled graphs, for example, [10], [13]. Valiant([10])proved it is NP-hard in 1979. As Monte Carlo becomes the widely acceptedmethod to approximate the answer, there are many studies([15], [16], [17], [18],[19]) to propose different sampling plans to reduce the estimation error.
There has been considerable effort put on the the certain reachability prob-lem. A group of techniques([7], [5], etc) named chain decomposition, proposedto speed up online calculation of certain reachability by decomposing graphsinto chains. Agrawal et. al. shows that using trees instead of chains is moreefficient([1]). Based on the tree cover strategy, a few variants were proposed toimprove Agrawal et. al.’s work. For example, Path-Tree([14]), Dual-Labeling([9]),Label+SSPI([2]), GRIPP([8]), etc. In [4], Cohen et. al. proposed a techniquecalled 2-Hop. 2-Hop indexes each vertex with an in-set and an out-set which areused to infer the reachability between any two vertices. However, finding an op-timal 2-Hop cover requires O(n4) time complexity. In order to improve the indexbuilding process, Cheng et. al. proposed an approximation 2-Hop cover([3]).
The techniques and applications of Uncertain Graphs have been studied ina number of recent papers, including mining frequent subpatterns([24], [25]),finding top-k maximal cliques([26]), etc.
8 Conclusion
In this paper, we study the problem of Probabilistic Reachability Queriesandproposed effective and efficient techniques to solve this problem. To the best ofour knowledge, we are the first to efficiently support Probabilistic ReachabilityQueries over large scale graphs using indexing techniques. We propose an indexstructure which assists in calculation of upper bound of probabilistic reachabil-ity efficiently. Should the bounds fail to answer a query, a dynamic Monte Carlomethod is proposed to output an approximate answer. Through comprehensiveexperiments, we demonstrate that our solution is one order magnitude fasterthan the most widely accepted plain Monte Carlo simulation.
References
1. R. Agrawal, A. Borgida and H. V. Jagadish: Efficient management of transitiverelationships in large data and knowledge bases. In SIGMOD, pages 253-262, 1989.
2. L. Chen, A. Gupta, and M. E. Kurul: Stack-based algorithms for pattern matchingon dags. In VLDB, pages 493-504, 2005.
3. J. Cheng, J. X. Yu, X. Lin, H. Wang, P. S. Yu: Fast computation of reachabilitylabeling for large graphs. In EDBT, pages 961-979, 2006
4. E. Cohen, E. Halperin, H. Kaplan, and U. Zwick: Reachability and distance queriesvia 2-hop labels. In Proceedings of the 13th annual ACM-SIAM Symposium onDiscrete algorithms, pages 937-946, 2002
5. H. V. Jagadish.: A compression technique to materialize transitive closure. ACMTrans. Database Syst., Vol. 15, No. 4, pages 558-598, 1990.
6. R. Schenkel, A. Theobald, and G. Weikum: HOPI: An efficient connection indexfor complex XML document collections. In EDBT, 2004.
7. K. Simon: An improved algorithm for transitive closure on acyclic digraphs. Theor.Comput. Sci, Vol 58, No. 1-3, pages 325-346, 1988
8. S. Tribl and U. Leser.: Fast and practical indexing and querying of very largegraphs. SIGMOD ’07: Proceedings of the 2007 ACM SIGMOD internationalconference on Management of data, pages 845-846, 2007.
9. H. Wang, H. He, J. Yang, P. S. Yu, and J. X. Yu: Dual labeling: Answering graphreachability queries in constant time. ICDE, page 75, 2006.
10. L. G. Valiant: The complexity of enumeration and reliability problems. SIAM J.Compt., Vol. 8, pages 410-421, 1979
11. B. Jiang, J. Pei, X. Lin, D. W. Cheung, and J. Han: Mining preferences fromsuperior and inferior examples. KDD, pages 390-398, 2008
12. J. S. Provan and M. O. Ball: Computing Network Reliability in Time Polynomialin the Number of Cuts. Operations Research, Vol. 32, No. 3, Reliability andMaintainability pages 516-526, 1984
13. D. R. Shier and N. Liu: Bounding the Reliability of Networks. The Journal of theOperational Research Society, Vol. 43, No. 5, Mathematical Programming in Honourof Ailsa Land, pages 539-548, 1992
14. R. Jin, Y. Xiang, N. Ruan, and H. Wang: Efficiently Answering ReachabilityQueries on Very Large Directed Graphs. SIGMOD, 2008
15. M. C. Easton and C. K. Wong: Sequential Destruction Method for Monte CarloEvaluation of System Reliability. IEEE, Reliability, Vol. 29, pages 191-209, 1980
16. G. S. Fishman: A Monte Carlo Sampling Plan for Estimating Network Reliability.Operational Research, Vol. 34, No. 4, pages 581-594, 1986
17. R. Karp and M. G. Luby: A New Monte Carlo Method for Estimating the FailureProbability of An N-component System. Computer Science Division, University ofCarlifornia, Berkley, 1983
18. M. Okamoto: Some Inequalities Relating To the Partial Sum of BinomialProbabilities. Annals Inst. Statistical Mathematics, Vol 10, pages 29-35, 1958
19. G. S. Fishman: A Comparison of Four Monte Carlo Methods for Estimating theProbability of s-t Connectedness. IEEE, Trans. Reliability, Vol 35, No. 2, 1986
20. E. P. Chan and H. Lim: Optimization and Evaluation of Shortest Path Queries.VLDB Journal, Vol 16, No. 3, pages 343-369, 2007
21. R. Meester: A Natural Introduction to Probability Theory. 200422. E. Adar and C. Re: Managing Uncertainty in Social Networks. Data EngineeringBulletin, Vol 30, No. 2, 23-31, July 2007
23. Z. Zou, H. Gao, and J. Li: Discovering Frequent Subgraphs over Uncertain GraphDatabases under Probablistic Semantics. In KDD, 2010
24. Z. Zou, J. Li, H. Gao, S. Zhang: Mining Frequent Subgraph Patterns fromUncertain Graph Data. TKDE, Vol 22, No. 9, pages 1203-1218. 2010.
25. Z. Zou, H. Gao and J. Li: Discovering Frequent Subgraphs over Uncertain GraphDatabases under Probabilistic Semantics. SIGKDD, pages 633-642, 2010.
26. Z. Zou, J. Li, H. Gao, S. Zhang: Finding Top-k Maximal Cliques in an UncertainGraph ICDE, pages 649-652, 2010.