Embed Size (px)
DESCRIPTION
BLUElink Update Andreas Schiller CSIRO Marine and Atmospheric Research Hobart, Australia N. R. Smith BMRC Melbourne, Australia. Project “BLUElink”. A partnership between: CSIRO Australian Bureau of Meteorology (BoM) Royal Australian Navy (RAN). Australia!. (Nature cover). - PowerPoint PPT Presentation
Citation preview

BLUElink UpdateBLUElink UpdateAndreas SchillerAndreas Schiller
CSIRO Marine and Atmospheric ResearchCSIRO Marine and Atmospheric ResearchHobart, AustraliaHobart, Australia
N. R. Smith N. R. Smith BMRCBMRC
Melbourne, AustraliaMelbourne, Australia

Project “BLUElink”
• A partnership between:• CSIRO• Australian Bureau of
Meteorology (BoM)• Royal Australian Navy
(RAN)
Australia!
(Nature cover)

High-level objectives of BLUElink
• To develop an ocean forecasting capability in the Bureau of Meteorology
• To enable the RAN to forecast local ocean and atmospheric conditions
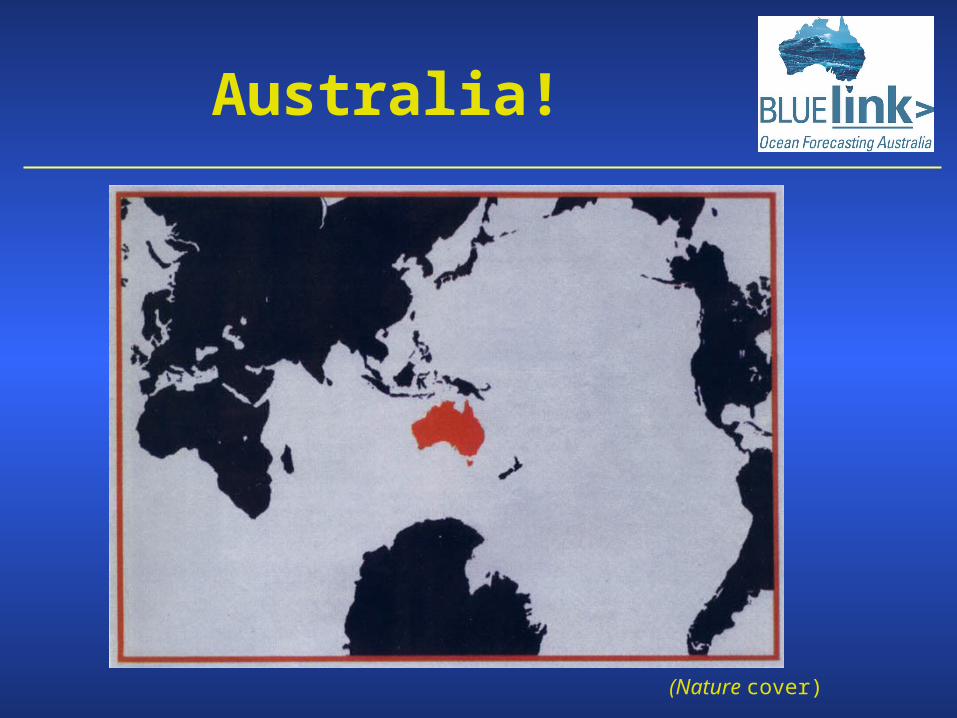
Key elements
• “Real-time” data availability (“nowcasts”)
• Archived ocean hindcasts, based on global modelling
• Ocean forecasts, based on global model
• Automated model nesting

SSH Anomaly&
Geostrophic Velocity
SST Anomaly&
Geostrophic Velocity
SST &
Geostrophic Velocity
Ocean Nowcasting
A daily-updated nowcast of the 3-d temperature, salinity and current fields for the Asian-Australian region based on in situ (Argo and XBT) and satellite (altimeter, SST) data
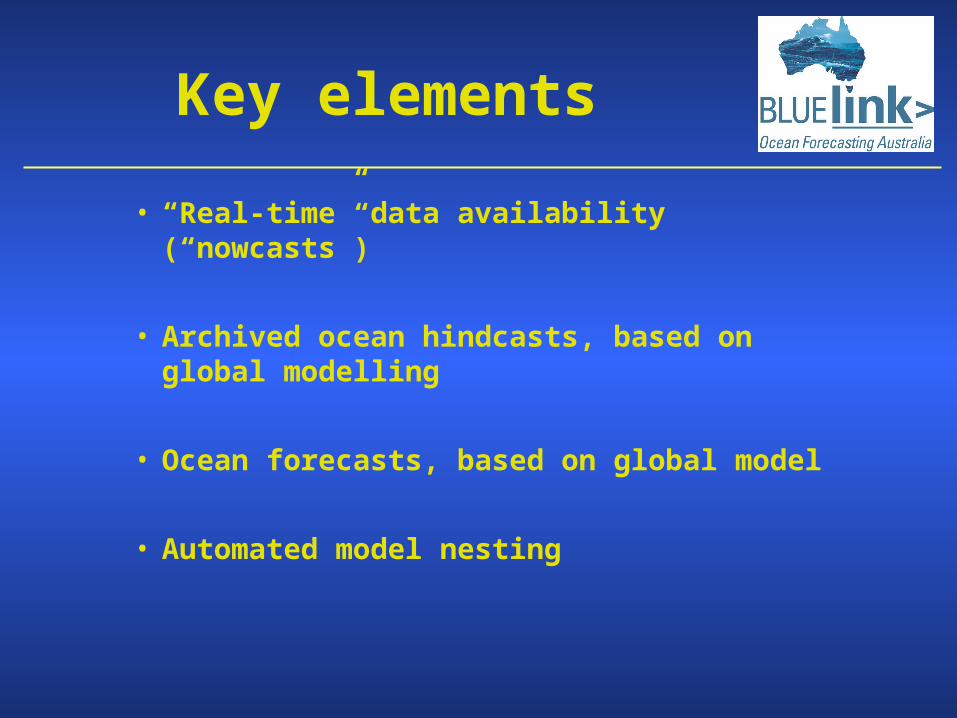
The Global Model
Ocean Forecasting Australia Model
Based on MOM4
Provides an archive (1992 on) and operational 3-10 day forecasts
See http://www.marine.csiro.au/bluelink/exproducts/index.htm

Model SummaryModel SummaryOFAM:Ocean Forecasting Australia Model
Global model with eddy resolving resolution in Asian- Australian region
MOM4 (GFDL)
- Z coord./Free Surface
- Hybrid Chen mixed-layer model
- Quicker Advection Scheme
- Smagorinsky viscosity parameter. (anisotropic)
- isopycnal mixing and GM param.(anisotropic)
- No ice model (later)
- No river runoff (later)
Eddy-resolving (1/10°) -10-11km from 75ºS to 16°N, 90ºE to 180ºE
-47 levels (35 in top 1000m)
- Relaxation to CARS and Levitus WOA (T,S) below 2000m (250 days)
-6-hourly ECMWF (ERA-40 and/or operational fields)
- Plus relaxation to SST and SSS
BODAS:Bluelink Ocean DataAssimilation System
- Ensemble Optimal Interpolation
- 11 days data window in RA mode
- Along-track SLA (T/P, ERS, GFO, Jason-1, Envisat)
- Sea-level anomaly from all Australian coastal tide gauges
- Assimilation of SST (AMSR-E, ATSR,AVHRR)
- CTD and bottle profiles from ARGO, WOCE, TAO, and other regional experiments
- XBT profiles from WOCE & IOTA
- MSSH from data (diagnostic model run with strong nudging towards Levitus WOA)

BODAS:An Ensemble-based Optimal Interpolation
System

Surface Eddy Kinetic Energy: JanuarySurface Eddy Kinetic Energy: January
Altimetry Model
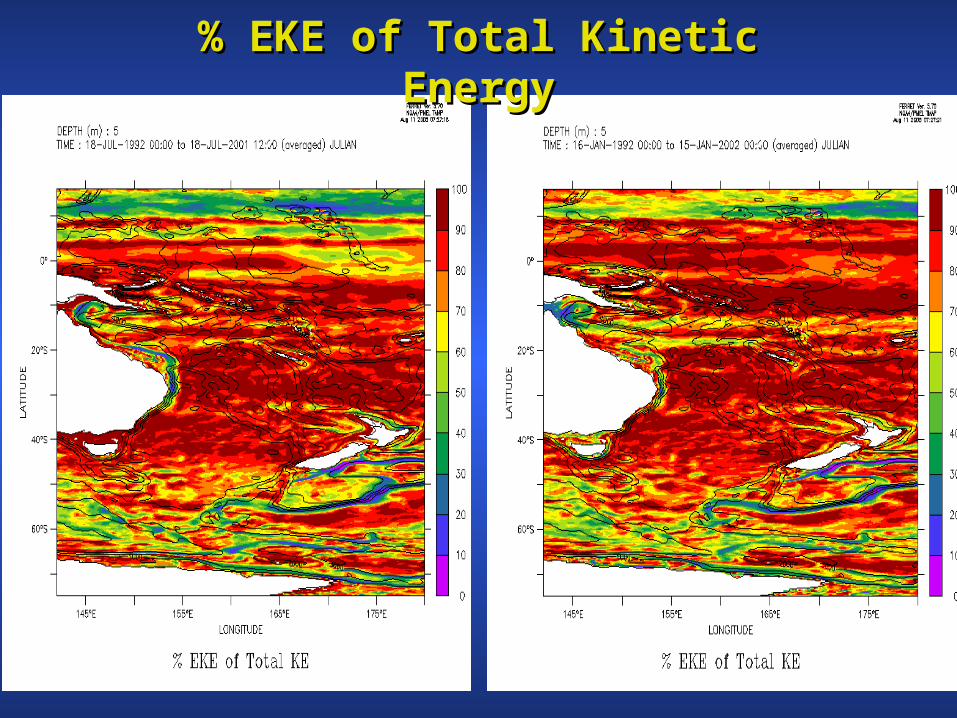
% EKE of Total Kinetic Energy% EKE of Total Kinetic Energy
January July

Surface Transports 0-100mSurface Transports 0-100m& Mean Kinetic Energy:& Mean Kinetic Energy:
JulyJanuary
Integrated Transports in 1º x 1º bins 10 Sv

IntraseasonalK
elvi
n The great 97/98 El Niño
Courtesy A.L. Gordon
Makassar Strait MooringsMakassar Strait Moorings
Courtesy A.L. GordonCourtesy A.L. Gordon

Top-Bottom Volume Transports (1992-2001)Top-Bottom Volume Transports (1992-2001)
South China Sea: -1.7 ± 3.3 Sv
Makassar Strait: -8.3 ± 4.5 Sv
Maluku Sea: +3.5 ± 5.8 Sv
Halmahera: -4.2 ± 5.5 Sv
Torres Strait: -1.0 ± 1.2 Sv
Timor Sea: -6.7 ± 4.2 Sv
Ombai Strait: -2.1 ± 2.1Sv
Lombok Strait: -3.0 ± 2.2 Sv
Sunda Strait: -0.5 ± 0.45 Sv
Malakka Strait: +0.3 ± 0.3
Total ITF (Indian Ocean) -12.9 ± 6.1Sv

(Ffield et al., 2000)
Observations Reanalysis
Makassar Strait: Temperature Section 1997/1998Makassar Strait: Temperature Section 1997/1998

Reanalysis
XBXBTT Section PX34: Geostrophic (0-2000db) Section PX34: Geostrophic (0-2000db)& Ekman Transports& Ekman Transports
Observations
Reanalysis (3-monthlyfiltered)
Reanalysis (weekly ave.)TOTAL Transport
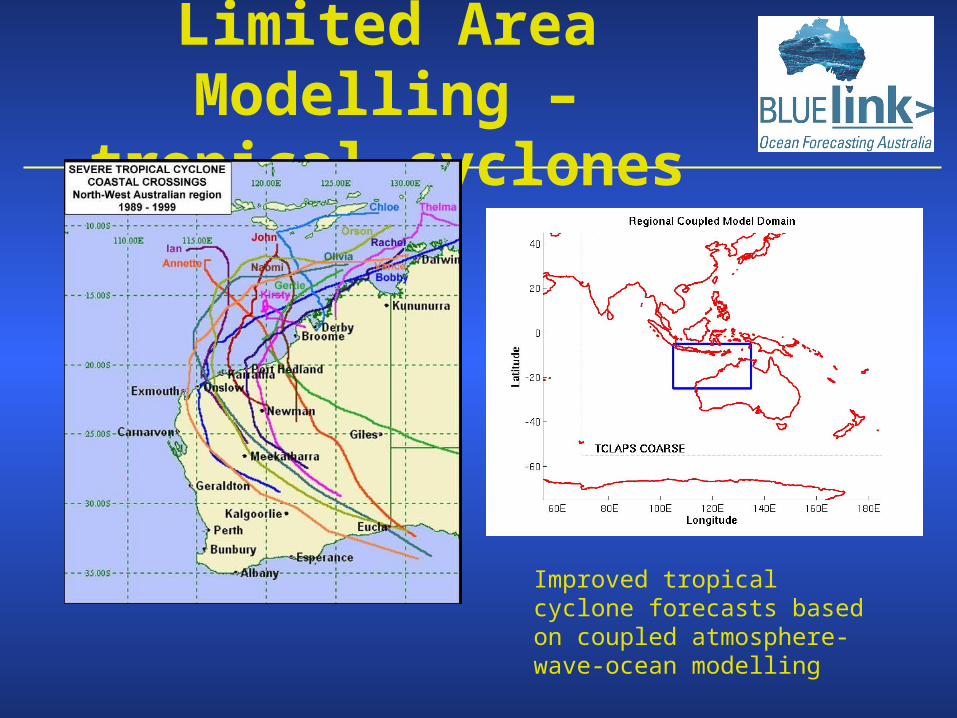
Limited Area Modelling – tropical cyclones
Improved tropical cyclone forecasts based on coupled atmosphere-wave-ocean modelling

ROAMRelocatable Ocean-Atmosphere Model
• 3-10 day model prediction of ocean and atmospheric structure
• High resolution (~2 km), limited area (~100x100 km2)
• Robust - to be run by non-experts in the Navy
• Controlled from a graphical interface
• Automatically nested inside operational global forecasts
• Output fed to sonar and radar models
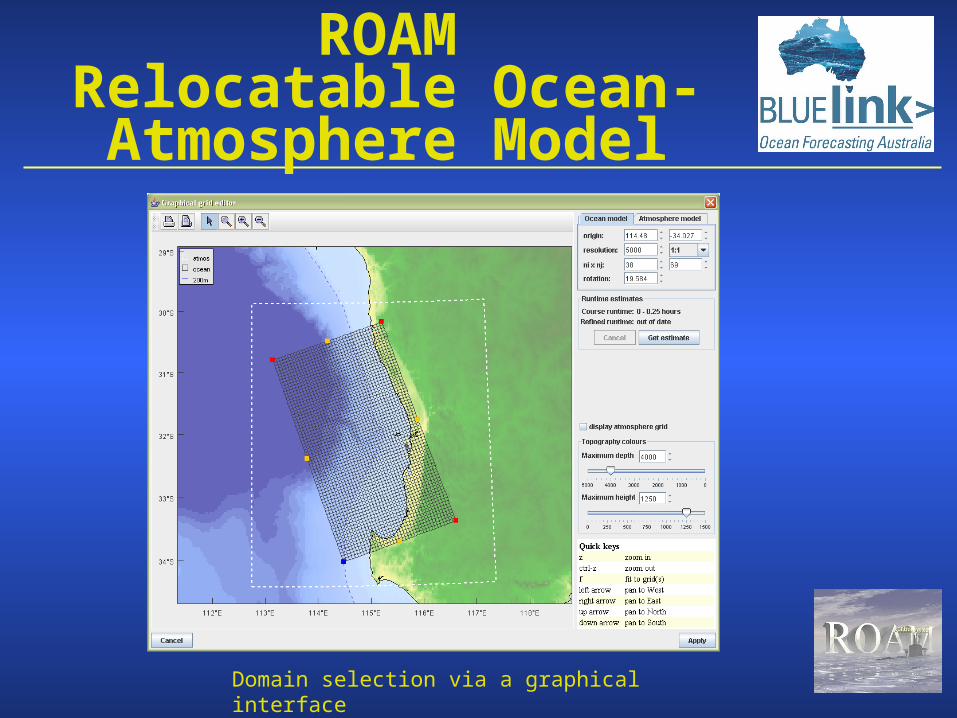
ROAMRelocatable Ocean-Atmosphere Model
Domain selection via a graphical interface

Relocatable Ocean Atmosphere Model (ROAM): GUIRelocatable Ocean Atmosphere Model (ROAM): GUI
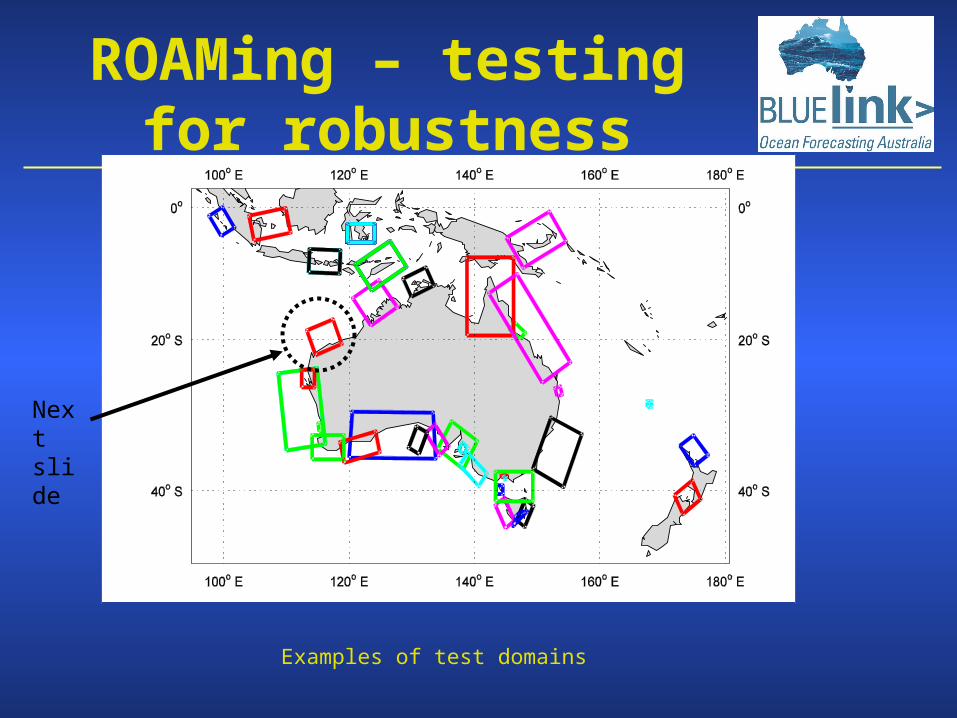
ROAMing – testing for robustness
Next slide
Examples of test domains
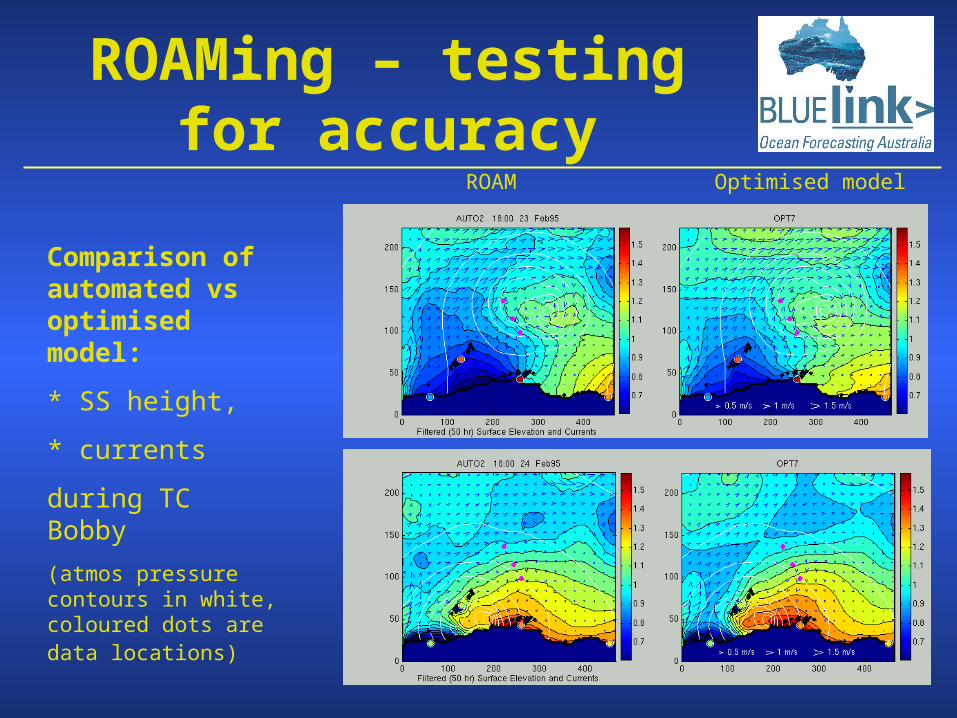
ROAMing – testing for accuracy
Comparison of automated vs optimised model:
* SS height,
* currents
during TC Bobby
(atmos pressure contours in white, coloured dots are data locations)
ROAM Optimised model

ROAM: testing for accuracy
40 m below surface
90 m below surface
(water depth 300 m)
data
model
Temperature
Feb 1995 TC Bobby

Components of the Ocean Model Components of the Ocean Model Analysis and Prediction SystemAnalysis and Prediction System
(OceanMAPS)(OceanMAPS)

Phase 1: Infrastructure Jun05-Dec05• Analysis cycle (Jun-Sep)• IT Software, Resource plan (Jun-Sep)• Implementation workshop (Sep/Oct)• Implementation Plan (Oct)• Forecast cycle (Oct-Dec)
Phase 2: Tuning Jan06-Jun06• Robust configuration• Hindcast trials• QC real-time observations• Analysis and Forecast GASP• SX6 operation configuration• Scheduling• Extended configuration
Phase 3: Monitoring Jun06-Dec06• Static configuration• Transition to operational infrastructure • Routine diagnostics• Validation/skill assessment• Documentation• Transition to NMOC
Global System: OceanMAPSGlobal System: OceanMAPS
Operational ImplementationOperational Implementation

Summary: BLUElinkSummary: BLUElink
• Integrated reanalyses of the ocean state over the last 1Integrated reanalyses of the ocean state over the last 133 years. years. Public access now available for registered users:Public access now available for registered users: http://www.cmar.csiro.au/bluelink/http://www.cmar.csiro.au/bluelink/
• Global Global Operational OOperational Outpuutputs and ts and Regional (shelf-scale) Regional (shelf-scale) Relocatable Nested SystemRelocatable Nested System (all available by 2006/07) (all available by 2006/07)::
7-28 days forecasts (global, BoM), 7-28 days forecasts (global, BoM), 3+ days (regional, RAN),3+ days (regional, RAN),
Prognostic variables: SSH; 3-D ocean temperature, Prognostic variables: SSH; 3-D ocean temperature, salinity and currentssalinity and currents

BLUElink II (2006-2010):BLUElink II (2006-2010):• Higher resolution models and improved physics:Higher resolution models and improved physics:
global global coastal coastal littoral zonelittoral zone river discharge, tidal focingriver discharge, tidal focing
• Improved global analysis and prediction system (towardsImproved global analysis and prediction system (towards Ensemble Kalman Filter): Ensemble Kalman Filter):
full SST assimilationfull SST assimilation improved anomalies, error statisticsimproved anomalies, error statistics
• Downscaling: relocatable, fully coupled regional ocean-Downscaling: relocatable, fully coupled regional ocean- atmosphere model with limited DA capability atmosphere model with limited DA capability
(1/8)(1/8)º minº min
(1/16)º

Sustainability of SatellitesQuikSCAT Microwave SST
?Altimetry
Ocean color