Embed Size (px)
Citation preview
Lawrence Livermore National Laboratory
Sequoia Update SCICOMP 2011 May 11, 2011
Tom Spelce Lawrence Livermore National Laboratory
This work performed under the auspices of the U.S. Department of Energy by Lawrence Livermore National Laboratory under Contract DE-AC52-07NA27344 LLNL-PRES-484091
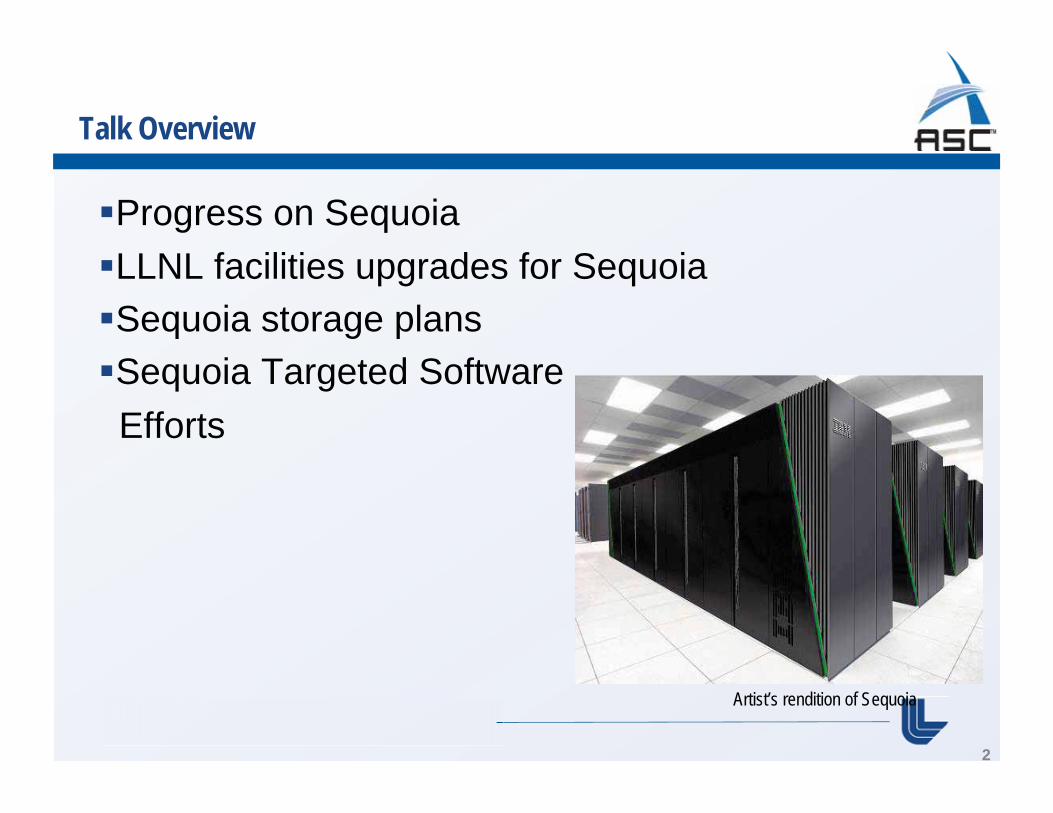
Talk Overview
Progress on Sequoia LLNL facilities upgrades for Sequoia Sequoia storage plans Sequoia Targeted Software
Efforts
2
Artist’s rendition of Sequoia
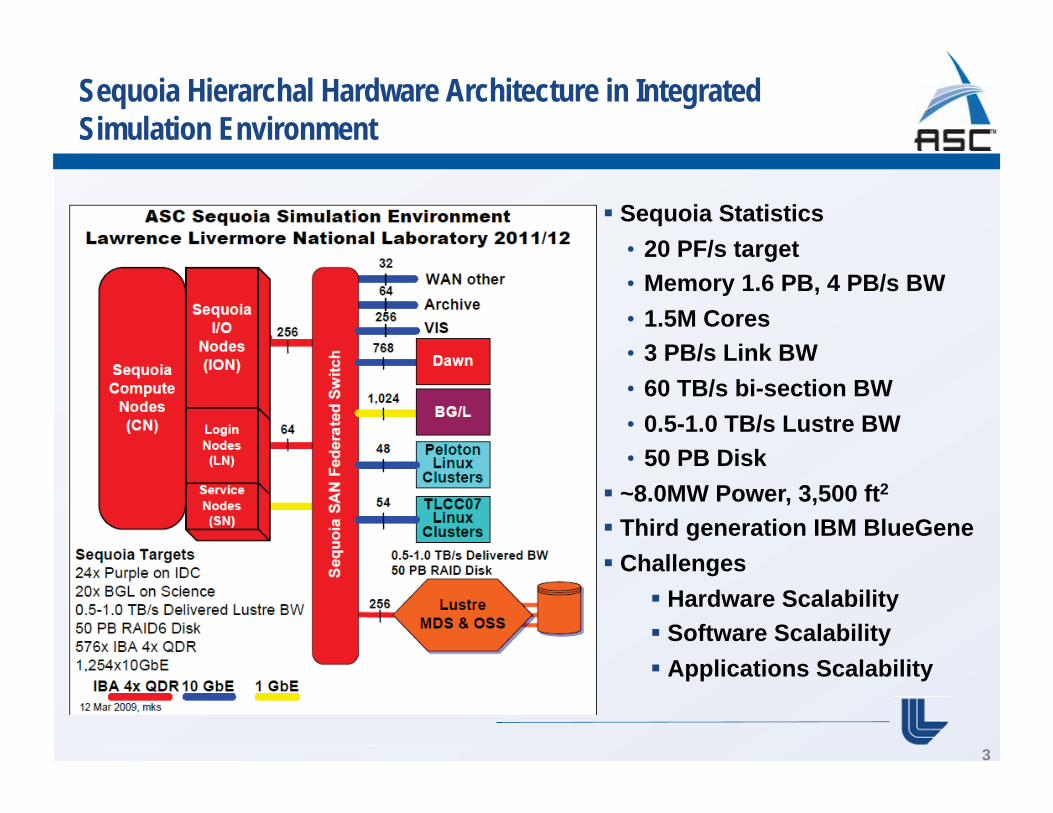
Sequoia Hierarchal Hardware Architecture in Integrated Simulation Environment
3
Sequoia Statistics • 20 PF/s target • Memory 1.6 PB, 4 PB/s BW
• 1.5M Cores• 3 PB/s Link BW
• 60 TB/s bi-section BW
• 0.5-1.0 TB/s Lustre BW• 50 PB Disk ~8.0MW Power, 3,500 ft2 Third generation IBM BlueGene Challenges
Hardware Scalability Software Scalability Applications Scalability
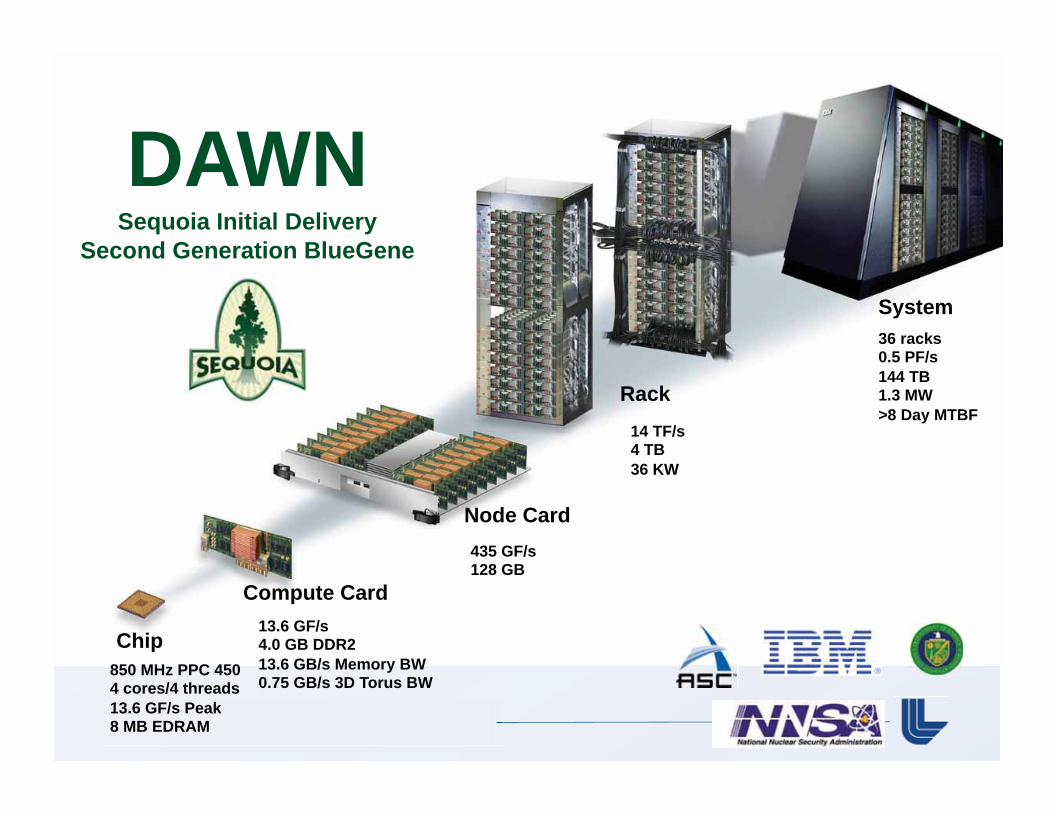
14 TF/s4 TB 36 KW
Rack
36 racks0.5 PF/s144 TB 1.3 MW>8 Day MTBF
System
13.6 GF/s4.0 GB DDR213.6 GB/s Memory BW0.75 GB/s 3D Torus BW
Compute Card
850 MHz PPC 4504 cores/4 threads13.6 GF/s Peak8 MB EDRAM
Chip
435 GF/s128 GB
Node Card
DAWNSequoia Initial Delivery
Second Generation BlueGene
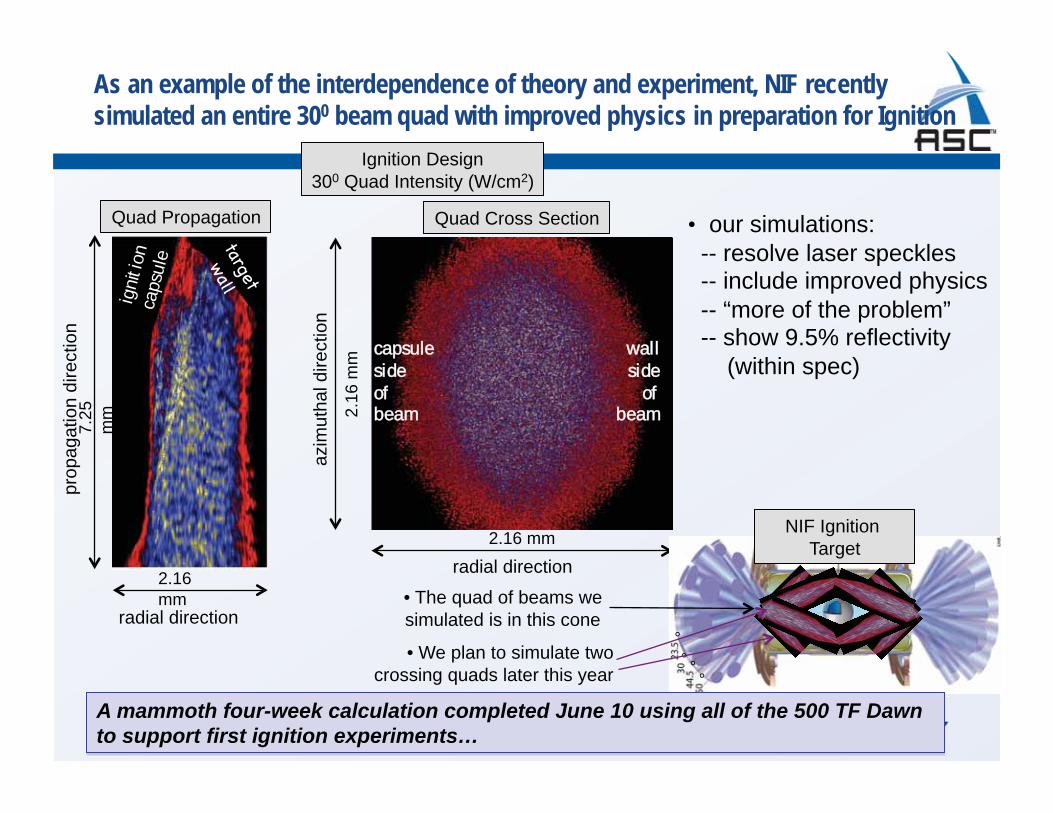
As an example of the interdependence of theory and experiment, NIF recently simulated an entire 300 beam quad with improved physics in preparation for Ignition
Ignition Design 300 Quad Intensity (W/cm2)
• our simulations: -- resolve laser speckles -- include improved physics -- “more of the problem” -- show 9.5% reflectivity (within spec)
2.16 mm
2.16
mm
Quad Cross Section
wallside
ofbeam
capsulesideofbeam
radial direction
azim
utha
l dire
ctio
n
Quad Propagation
2.16 mm
7.25
m
mign
ition
caps
ule
radial direction
prop
agat
ion
dire
ctio
n
• The quad of beams we simulated is in this cone
°°°
°
NIF Ignition Target
• We plan to simulate twocrossing quads later this year
A mammoth four-week calculation completed June 10 using all of the 500 TF Dawn to support first ignition experiments…
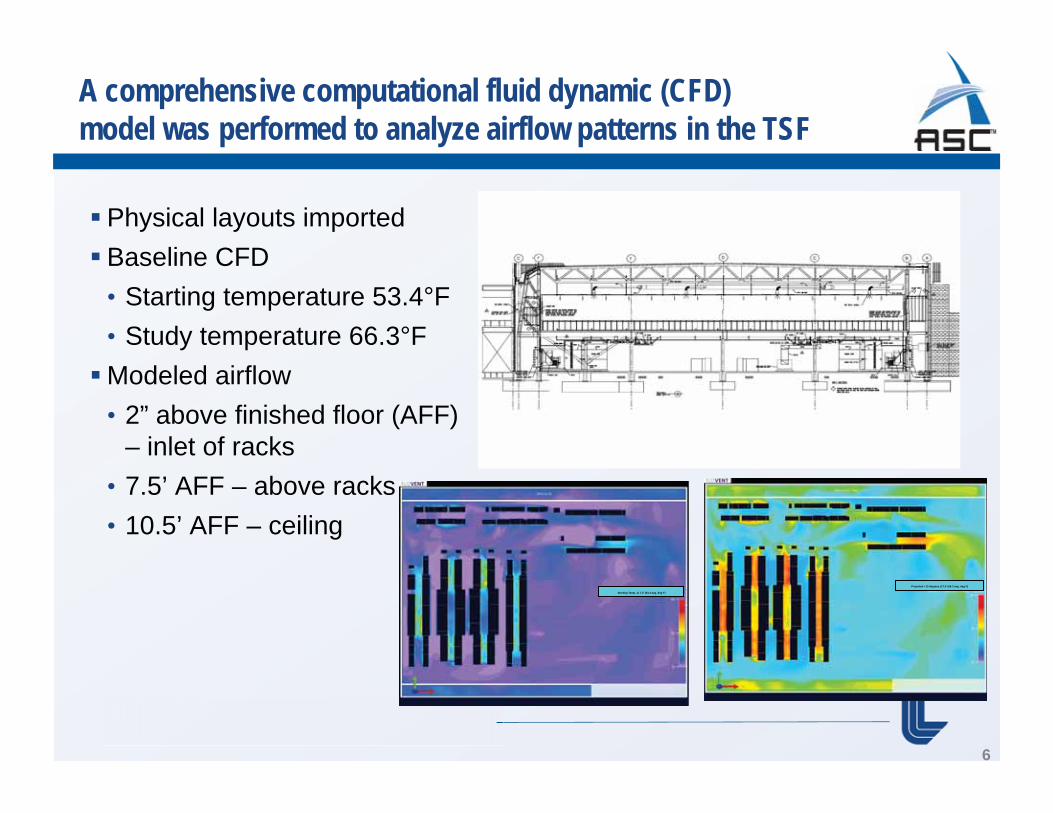
A comprehensive computational fluid dynamic (CFD) model was performed to analyze airflow patterns in the TSF
Physical layouts imported Baseline CFD • Starting temperature 53.4°F • Study temperature 66.3°F Modeled airflow • 2” above finished floor (AFF)
– inlet of racks • 7.5’ AFF – above racks • 10.5’ AFF – ceiling
6
Starting Temp. @ 7.5’ (53.4 avg. deg F)
Projected +13 degrees @7.5’ (66.3 avg. deg F)
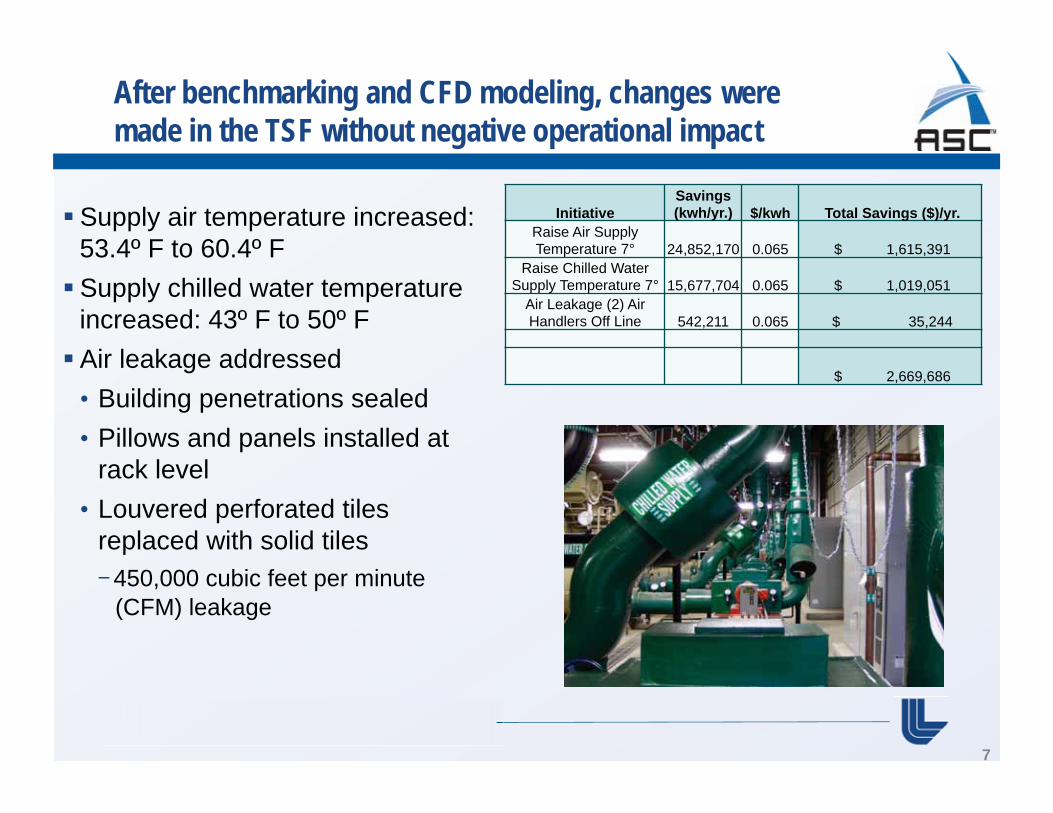
After benchmarking and CFD modeling, changes were made in the TSF without negative operational impact
Supply air temperature increased: 53.4º F to 60.4º F Supply chilled water temperature increased: 43º F to 50º F Air leakage addressed • Building penetrations sealed • Pillows and panels installed at
rack level • Louvered perforated tiles
replaced with solid tiles 450,000 cubic feet per minute (CFM) leakage
InitiativeSavings (kwh/yr.) $/kwh Total Savings ($)/yr.
Raise Air Supply Temperature 7° 24,852,170 0.065 $ 1,615,391
Raise Chilled Water Supply Temperature 7° 15,677,704 0.065 $ 1,019,051
Air Leakage (2) Air Handlers Off Line 542,211 0.065 $ 35,244
$ 2,669,686
7
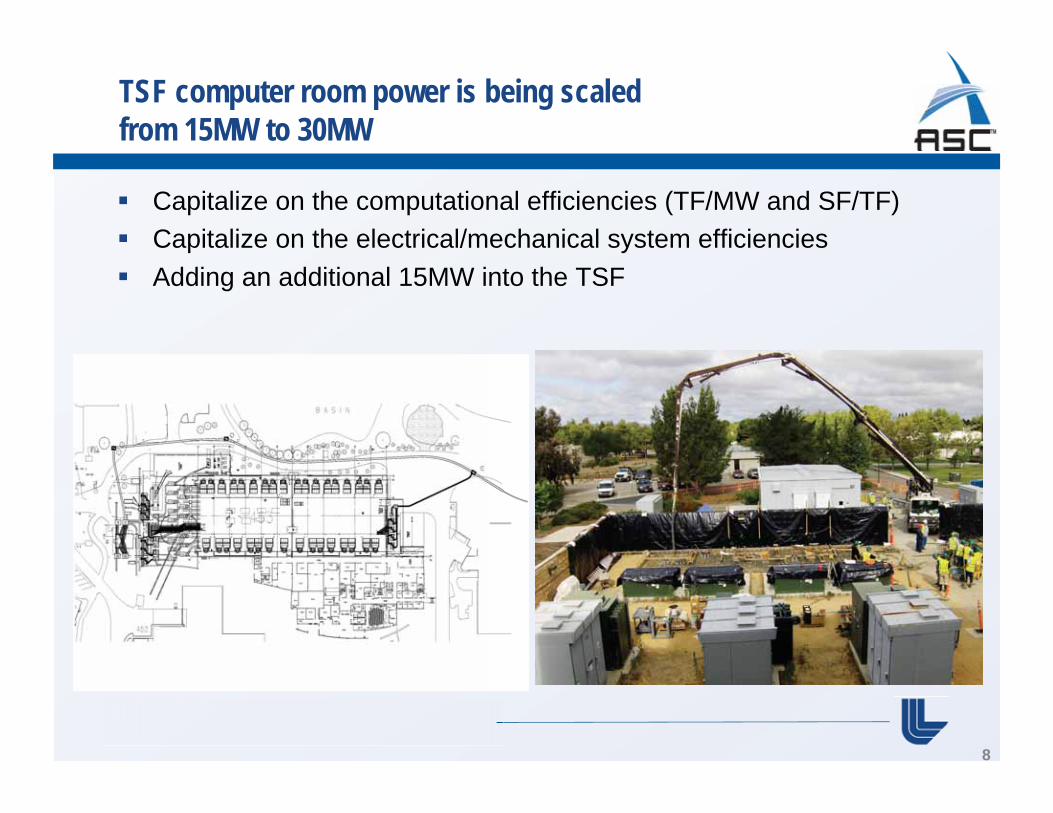
TSF computer room power is being scaled from 15MW to 30MW
Capitalize on the computational efficiencies (TF/MW and SF/TF) Capitalize on the electrical/mechanical system efficiencies Adding an additional 15MW into the TSF
8
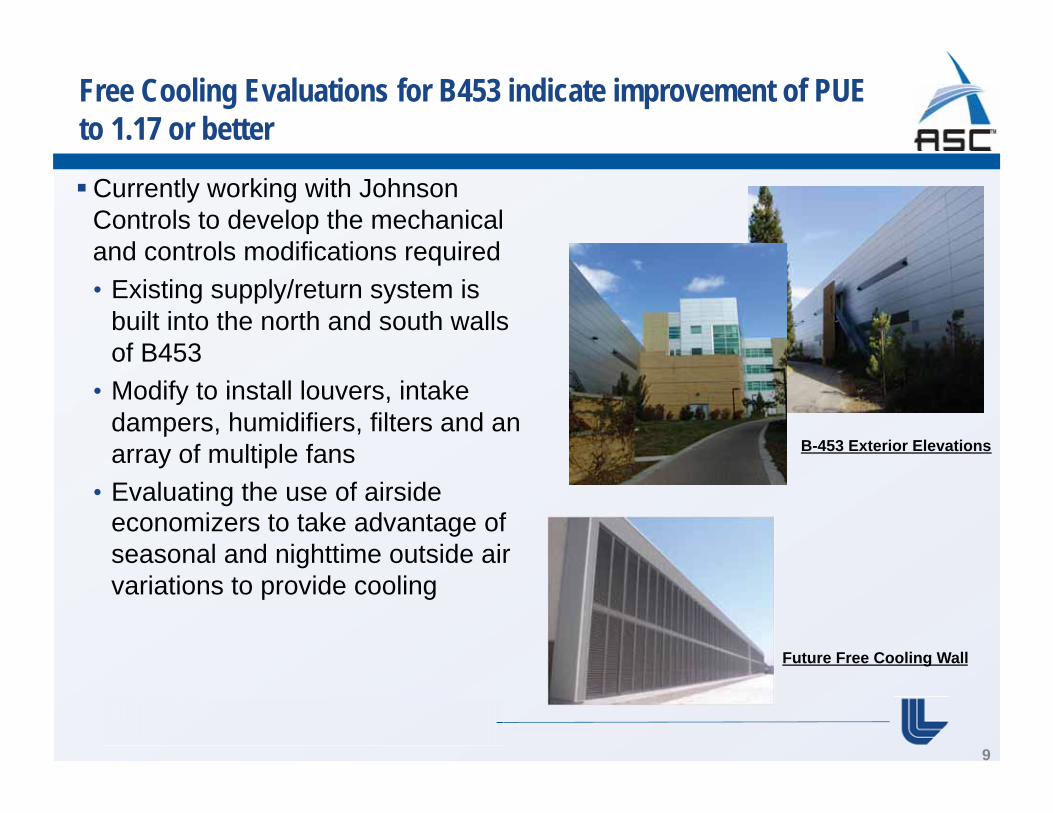
Free Cooling Evaluations for B453 indicate improvement of PUE to 1.17 or better
Currently working with Johnson Controls to develop the mechanical and controls modifications required • Existing supply/return system is
built into the north and south walls of B453
• Modify to install louvers, intake dampers, humidifiers, filters and an array of multiple fans
• Evaluating the use of airside economizers to take advantage of seasonal and nighttime outside air variations to provide cooling
B-453 Exterior Elevations
Future Free Cooling Wall
9
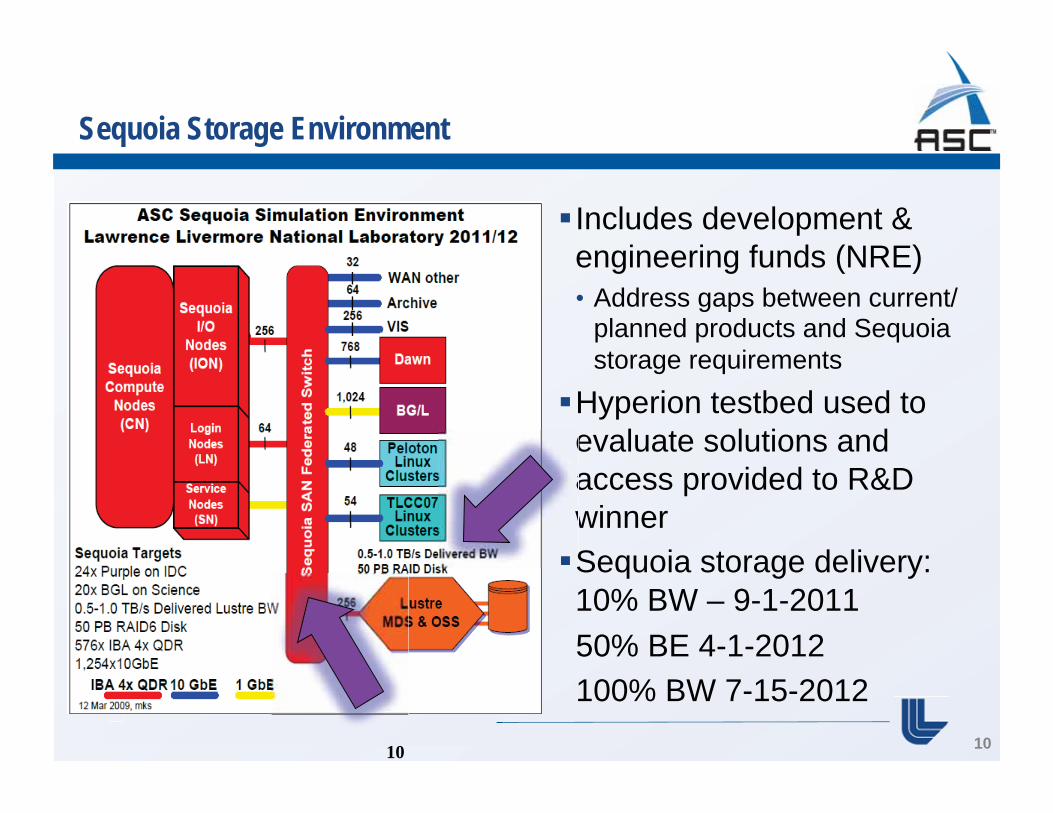
Sequoia Storage Environment
Includes development & engineering funds (NRE) • Address gaps between current/
planned products and Sequoia storage requirements
Hyperion testbed used to evaluate solutions and access provided to R&D winner Sequoia storage delivery: 10% BW – 9-1-2011
50% BE 4-1-2012 100% BW 7-15-2012
10 10
eawS

Sequoia risk reduction strategy is multifaceted and intended to provide a production multi-petaflop simulation environment
Innovative cost-shared test bed, “Hyperion” to prepare for the massive
I/O demand (1+TB/s)
Cost-sharing model supported by LLNL Industrial Partnerships
Organization (IPO)
Dawn
Purple and BG/L pedigree leveraged by
NNSA User Facility
Simulation codes transition to multicore architecture 2009-2012
IBM BG/PIBM BG/Q
11
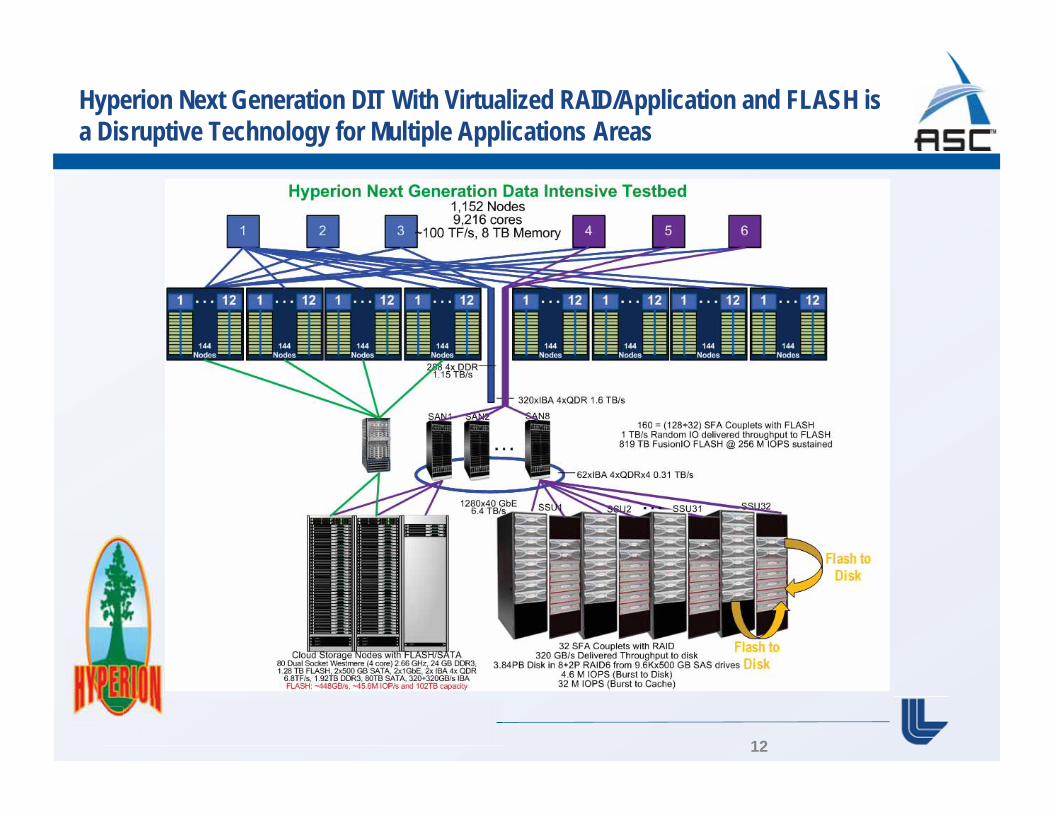
Hyperion Next Generation DIT With Virtualized RAID/Application and FLASH is a Disruptive Technology for Multiple Applications Areas
12
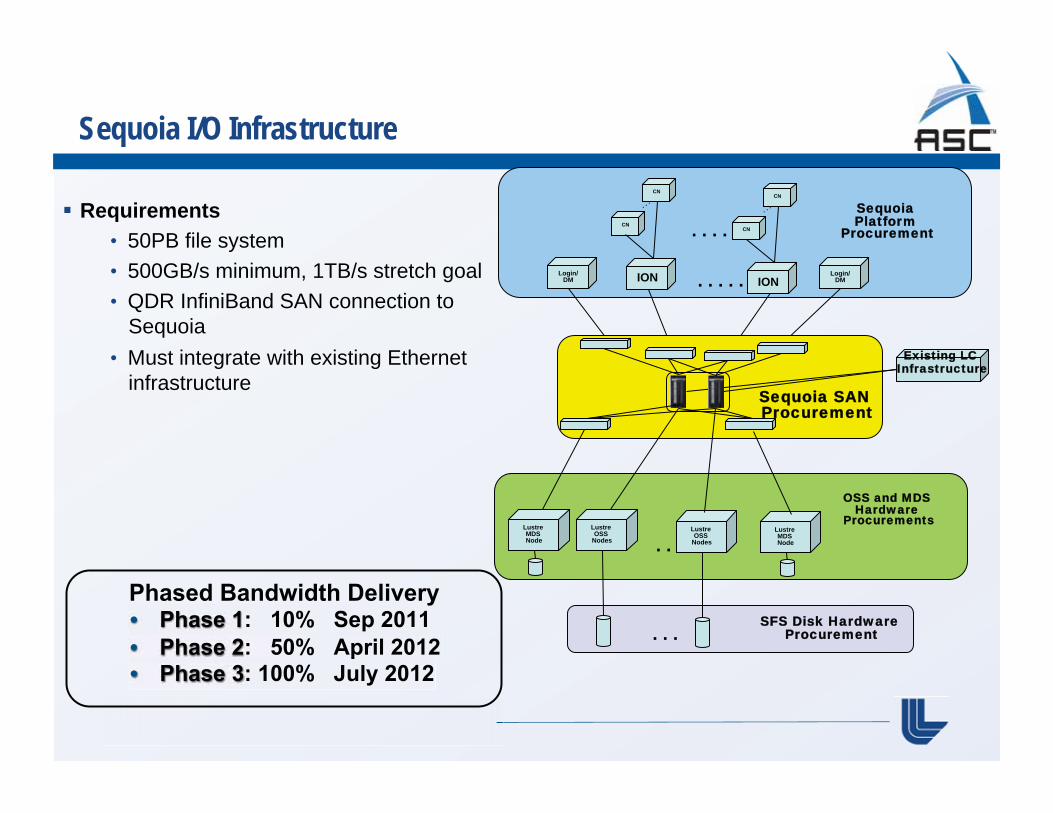
Sequoia I/O Infrastructure
Requirements • 50PB file system • 500GB/s minimum, 1TB/s stretch goal • QDR InfiniBand SAN connection to
Sequoia • Must integrate with existing Ethernet
infrastructure
ION . . . . .
. . .Lustre OSS
Nodes
Login/DM
Login/DM
Sequoia SAN Procurement
SFS Disk Hardware Procurement
Existing LC Infrastructure
OSS and MDS Hardware
Procurements
CN
CN . . . . .
ION
CN
CN
Lustre OSS
Nodes
Lustre MDS Node
Lustre MDS Node
Sequoia Platform
Procurement
. . .
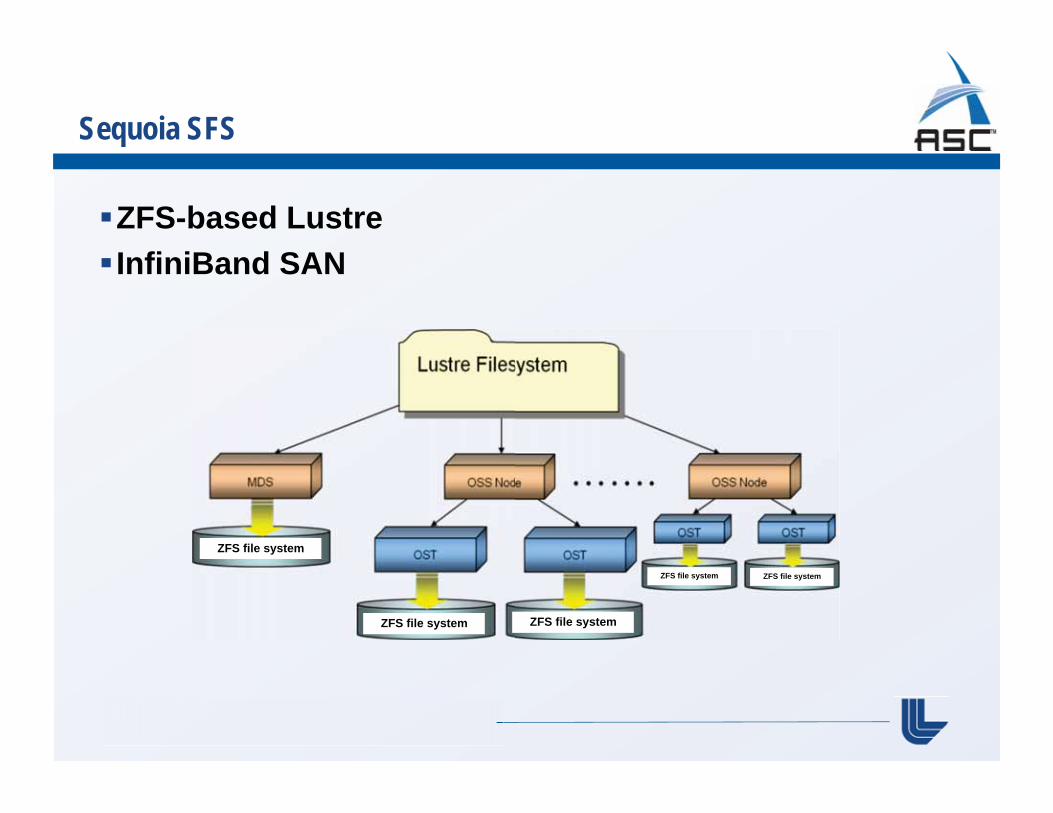
Sequoia SFS
ZFS-based Lustre InfiniBand SAN
ZFS file system
ZFS file system
ZFS file systemZFS file system
ZFS file system

Application programming requirements and challenges
Availability of 1.6M cores pushes all-MPI codes to extreme concurrency
Availability of many threads on many SMP cores encourages low-level parallelism for higher performance
Mixed MPI/SMP programming environment and possibility of heterogeneous compute distribution brings load imbalance to the fore
I/O and visualization requirements encourage innovative strategies to minimize memory and bandwidth bottlenecks
MPI Scaling
SMP Threads
I/O & Visualization
Hybrid Models
Scalable Application Preparation (SAP) Project
The Scalable Application Preparation (SAP) Project supports code teams’ preparations for Sequoia.
Mission: Pro-actively assist applications code developers in preparing for Sequoia and multi-core using Dawn
Goal: Code teams have the information and support they need to succeed in using Sequoia
Methods: Explore, Communicate (with teams and vendor), Evaluate, Document, Train, Support
16
The SAP activities are in full swing
Collaborating closely with Tri-Lab application teams Engaging third-party vendors, university research
partners, and the open source community on tools Team provides expertise in compilers, debuggers,
performance analysis and tools, I/O tuning Providing access to IBM experts, including an on-
site IBM applications analyst Leverage CS research efforts in other areas of
technology
17
Current Software Activities
IBM Simulators Application tuning Dawn I/O Improvements Open|SpeedShop STAT/Mrnet PAVE, Performance Analysis and Visualization for Exascale SCR, Scalable Checkpoint Restart VALGRIND – memory and thread checker
18
Early access to simulators is important to our preparations for new Sequoia features
IBM’s Software Transactional Memory Compiler (stmxlc) is available on LC AIX machines IBM and LLNL teams with access to the Mambo and FPGA simulators enable early performance projections on Sequoia microBenchmarks and some kernels developed to look at OpenMP, QPX, and prefetching capabilities Allows execution of user binaries and early access to runtime software (MPI & OpenMP) Utilization of the DD1 based machine at IBM Watson to verify simulator based performance projections Partners such as RogueWave get early access to begin porting efforts and influence software environment
19
0.0000
2.0000
4.0000
6.0000
8.0000
10.0000
12.0000
14.0000
16.0000
Mic
rose
cond
s pe
r zon
e-ite
ratio
n
Processors (CPUs)
Dawn (BG/P) Dawn - w/new comm
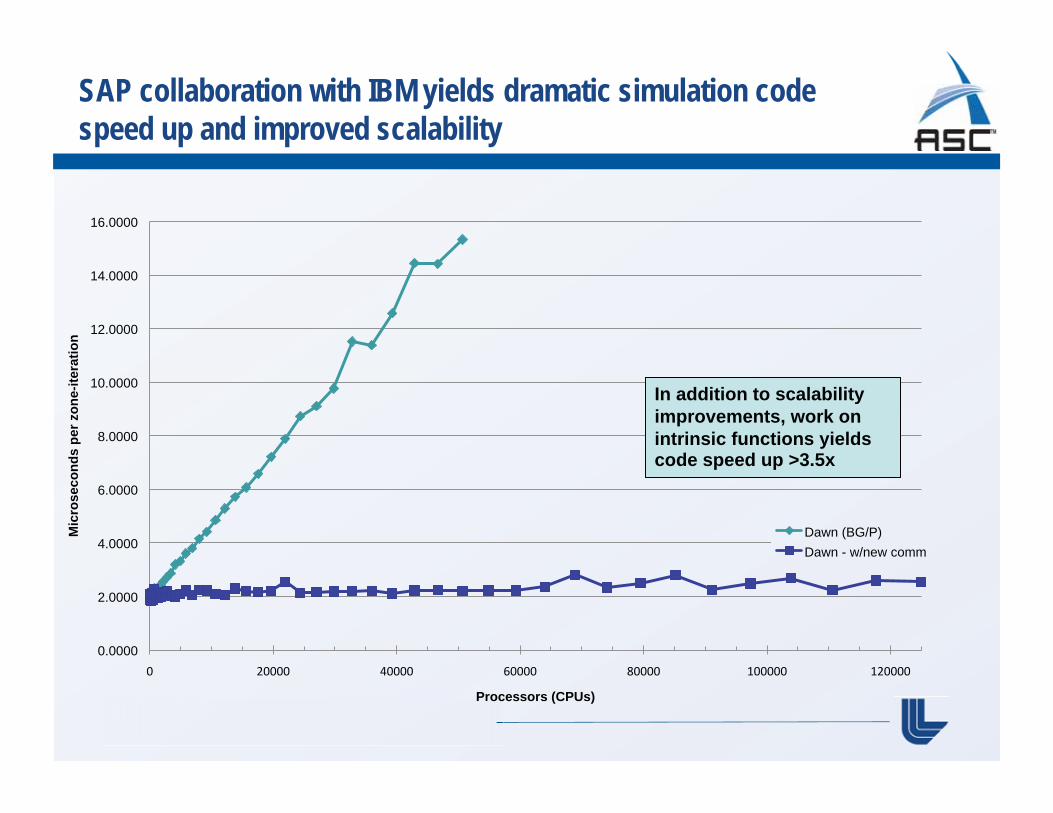
Slopes 0.000265 Dawn (BG/P) 0.000016 Dawn - w/new comm Note: 0 slope is ideal scaling
SAP collaboration with IBM yields dramatic simulation code speed up and improved scalability
In addition to scalability improvements, work on intrinsic functions yields code speed up >3.5x

0.50
1.00
2.00
4.00
8.00
16.00
32.00
64.00
128.00
256.00
512.00
1024.00
2048.00
4096.00
8192.00
Tim
e (s
ec)
Processors (CPUs)
Old Read - Dawndev New Read - Dawndev Old Read - Dawn New Read - Dawn Old Read - Purple New Read - Purple Old Read - uBGL New Read - Dawn DIO
2 hours!
3 minutes
30
SLOW
OK
4x faster!
SAP collaboration with code team yields 400x I/O improvement for simulation code on Dawn/Lustre file systems
New HDF5 file driver allows app to control buffering and deliver optimal bandwidth
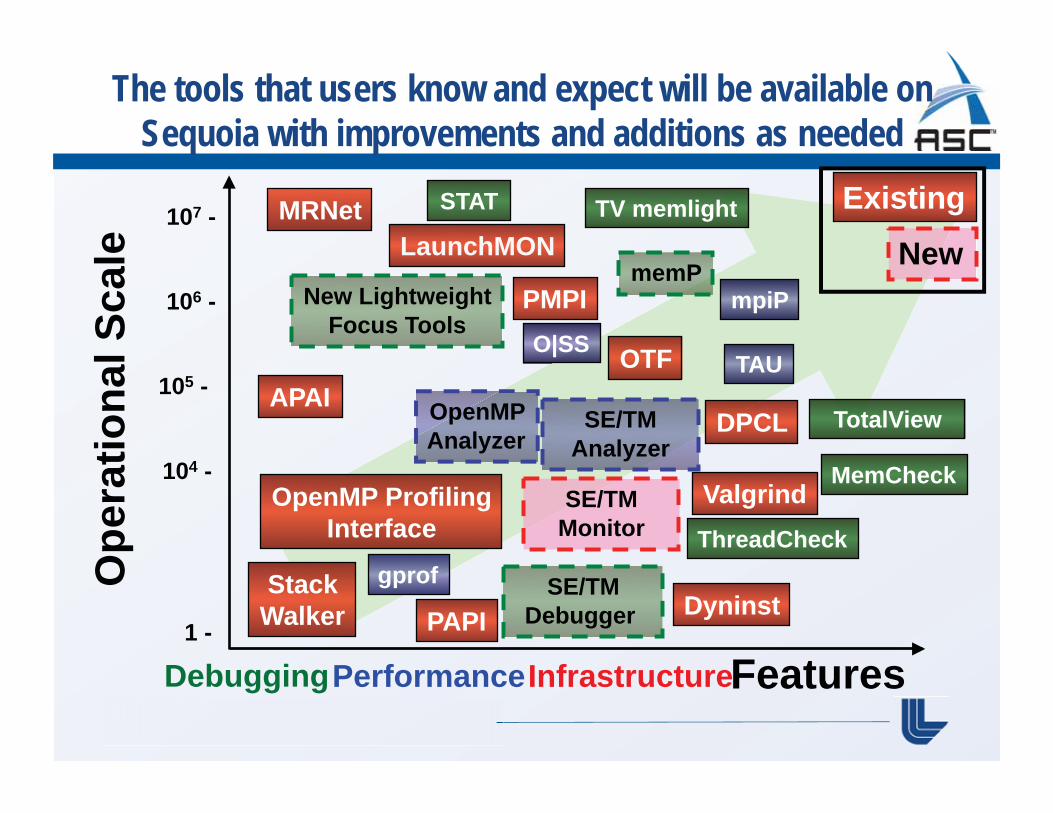
The tools that users know and expect will be available on Sequoia with improvements and additions as needed
Infrastructure Debugging Features
Ope
ratio
nal S
cale
Dyninst PAPI Stack
Walker
OpenMP Profiling Interface
MRNet
PMPI
APAI DPCL
Valgrind
OTF
SE/TM Monitor
LaunchMON
STAT TV memlight
memP
TotalView
ThreadCheck
MemCheck
SE/TM Debugger
New Lightweight Focus Tools
mpiP
TAU O|SS
OpenMP Analyzer
gprof
SE/TM Analyzer
105 -
106 -
107 -
104 -
1 -
Existing
New
Performance
Sequoia Targeted Software Development
CLOMP – “C” Livermore OpenMP benchmarks STAT/MRNET stack trace analysis tool PAVE, Performance Analysis and Visualization for Exascale Open|SpeedShop, general performance analysis tool VALGRIND, memory and thread checking tools SCR, Scalable Checkpoint Restart Totalview
23
CLOMP – OpenMP performance analysis tool
Originally designed as a tool to measure OMP kernels that represent real application workloads as opposed to the EPCC microbenchmarks Extensive data generated from runs with a wide range of workloads on DD1 and early DD2 hardware provided valuable insight to compiler developers on OMP runtime characteristics Results have been responsible for significant improvement in OMP runtime and interest in developing a runtime with relaxed OMP compliance but significant reduction in overhead resulting in much improved performance Benchmark has been extended to new Sequoia features, generating useful data resulting in improvements to runtime and feedback mechanisms available to developer
24
STAT – Stack Trace Analysis Tool
Extremely scalable stack trace analysis tool based on MRNET from Dyninst team at Wisconsin. Tools to scale up to machine sizes and scale down the information presented to the user 2 classes of tool scalability challenges: • Inefficient interactions with the environment • Structural problems within the tool STAT gathers stack traces from: • Multiple processes • Multiple samples per process STAT generates equivalence classes to aggregate tasks into common code paths
25
STAT – Stack Trace Analysis Tool
26
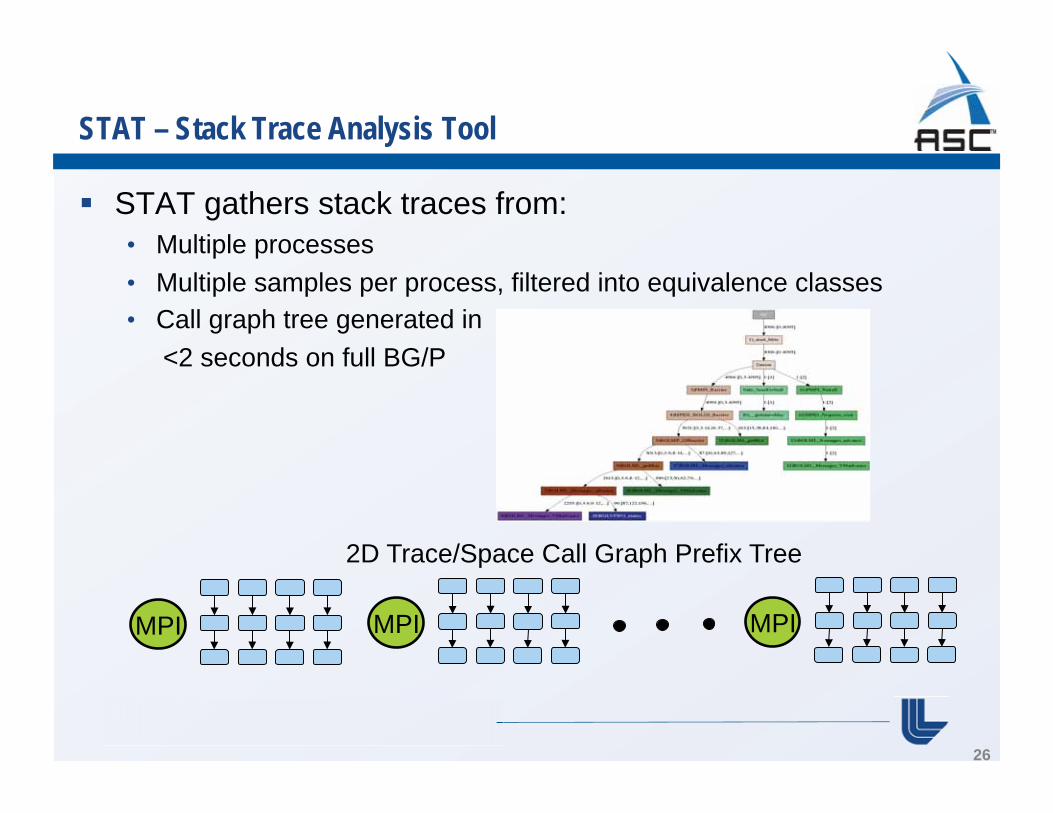
STAT gathers stack traces from: • Multiple processes • Multiple samples per process, filtered into equivalence classes • Call graph tree generated in <2 seconds on full BG/P
MPI MPI MPI
2D Trace/Space Call Graph Prefix Tree
PAVE is developing methods to organize and analyze performance data in domains familiar to scientists
• Massive parallelism has made performance a data-rich field, but tools to interpret the data are scarce• We can collect data at scale, but volume is overwhelming• Information is discrete and discontinuous• MPI process is unintuitive

Massive parallelism has made performance a data-rich field, but we lack the tools to interpret and understand the data
Collecting data at scale creates overwhelming volume of data
Information is discrete, discontinuous
• Profiles, traces
• Many Hardware Performance Counters
• Difficult to understand meanings of counters without context from the application
MPI Process ID space is often unintuitive
• Rank offers little insight into network structure
Floating Point Instruction Counts
MPI Trace Data from an AMG run with only 64 processes
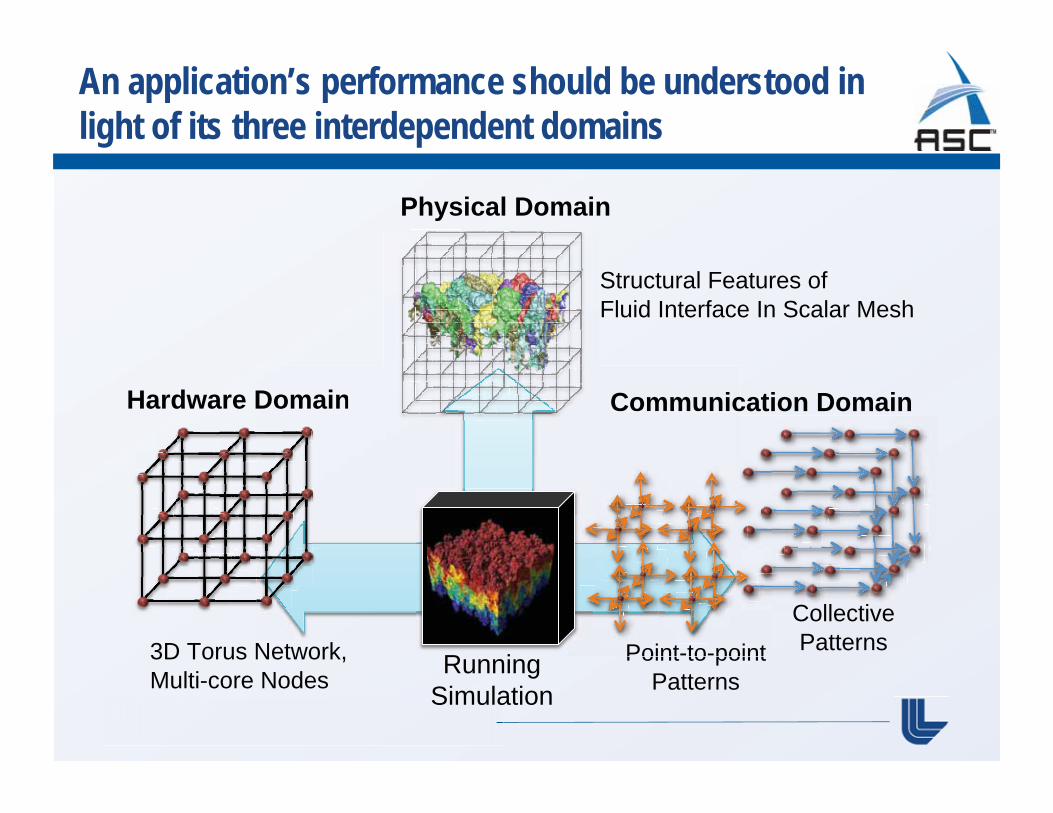
An application’s performance should be understood in light of its three interdependent domains
RunningSimulation
Structural Features of Fluid Interface In Scalar Mesh
Physical Domain
Hardware Domain Communication Domain
3D Torus Network,Multi-core Nodes
Point-to-point Patterns
CollectivePatterns
Domain Communic
CollectiveC ll i
Point-to-pointP t to
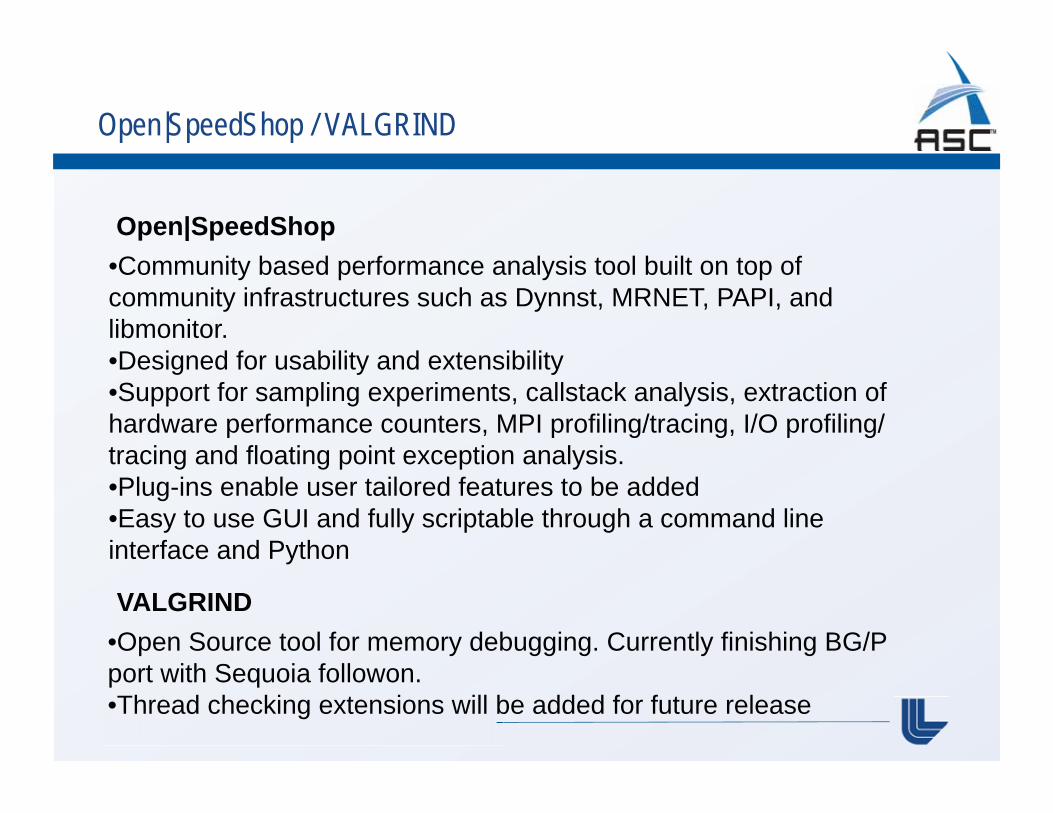
Open|SpeedShop / VALGRIND
• Community based performance analysis tool built on top of community infrastructures such as Dynnst, MRNET, PAPI, and libmonitor.• Designed for usability and extensibility• Support for sampling experiments, callstack analysis, extraction of hardware performance counters, MPI profiling/tracing, I/O profiling/tracing and floating point exception analysis.• Plug-ins enable user tailored features to be added• Easy to use GUI and fully scriptable through a command line interface and Python
Open|SpeedShop
VALGRIND
• Open Source tool for memory debugging. Currently finishing BG/P port with Sequoia followon.• Thread checking extensions will be added for future release
Scalable Checkpoint Restart
• Petascale applications which run at large scale for long times subject to high probablility of failure. • SCR provides a scalable way to retain checkpoint data and only write to file system should there be some type of failure, greatly reducing I/O traffic.• Perfectly scalable each compute node adds another storage resource – concept is for each node to on ramdisk, a piece of an adjacent nodes data.• Files persist beyond application processes, so no need to modify how MPI library deals with process failure.• Complete restart writes to parallel file system needed infrequently to prevent susceptibility to catastrophic failure• Currently, SCR is in production on Tri-Lab Linux clusters. • Work is under way to define framework to enable implementation on Sequoia
Summary
Sequoia project has made significant progress in the last year • Dawn enabled – apps preparation enabled • TSF facilities 15MW 30 MW (to the computer) upgrade nearing
completion, economical and green cooling infrastructure progressing
Storage and I/O R&D in motion SAP collaboration uncovering code bottlenecks, improving code performance and scalability Next generation tools are being developed to address extreme scale applications
32