Embed Size (px)
Citation preview


Blue Ventures Conservation Report
This publication is available electronically on the Blue Ventures website at http://blueventures.org and the Coastal Resources
Center’s website at http://www.crc.uri.edu
For more information contact: Coastal Resources Center, University of Rhode Island, Narragansett Bay Campus, South Ferry
Road, Narragansett, Rhode Island 02882, USA. Brian Crawford, Director International Programs at Email: [email protected];
Tel: 401-874-6224; Fax: 401-874-6920
Acknowledgements: This study was commissioned by the Coastal Resources Center (CRC), University of Rhode Island
through support from the United States Agency for International Development (USAID). We would like to express our
gratitude to CRC for supporting the study and our thanks also go to CRC and World Fish Center staff in Ghana for their
collaboration, in particular Mark Fenn for his instrumental advice throughout the project. Our special appreciation is
extended to the fishers in Western Ghana who participated in our work, and welcomed us into their community. Finally, our
warm regards go to Mike and Silvia and their staff at Kedas Lodge, Miemia, for sharing their local knowledge and friendly
hospitality.
Citation: Ateweberhan, M., Gough, C., Fennelly, L., and Frejaville, Y. (2012). Nearshore Rocky Reefs of Western Ghana, West
Africa: Baseline ecological research surveys. Blue Ventures Conservation, London, United Kingdom. 104 pp.
Disclaimer: This publication is made possible by the generous support of the American people through USAID/Ghana. The
contents are the responsibility of the authors as part of the Integrated Coastal and Fisheries Governance Project and do not
necessarily reflect the views of USAID/Ghana or the United States Government. Associate Cooperative Agreement No. 641-
A-00-09-00036-00 for “Integrated Coastal and Fisheries Governance (ICFG) Program for the Western Region of Ghana,”
under the Leader with Associates Award No. EPP-A-00-04-00014-00.
Cover photo: Ghanaian fisherman sorting the morning catch
Cover photo credit: Gough, C. 2012

Blue Ventures Conservation Report
1. Table of Contents
EXECUTIVE SUMMARY ..................................................................................................................................... 1
1. Introduction ............................................................................................................................................ 1
Ghana’s coastal environment and fisheries resources ............................................................................................ 1
Food Security and Economy ..................................................................................................................................... 2
Population growth, fisheries exploitation and environmental threats.................................................................... 2
Climate Change impacts ........................................................................................................................................... 5
The current project and study objectives ................................................................................................................ 5
Fish community structure and biomass ................................................................................................................................ 6
Invertebrate abundance and community structure ............................................................................................................. 6
Benthic cover and community structure .............................................................................................................................. 6
2. Methods .................................................................................................................................................. 8
Research Area .......................................................................................................................................................... 8
Environmental data .................................................................................................................................................. 9
Site characteristics ................................................................................................................................................................ 9
Biological data ........................................................................................................................................................ 11
Fish species diversity, abundance and biomass .................................................................................................................. 11
Invertebrate Belts ............................................................................................................................................................... 11
Benthic surveys ................................................................................................................................................................... 11
Fisher interviews .................................................................................................................................................... 11
Data Analysis .......................................................................................................................................................... 15
3. Results .................................................................................................................................................. 17
Fish total Abundance .............................................................................................................................................. 17
Fish family abundance ............................................................................................................................................ 18
Fish species richness .............................................................................................................................................. 25
Fish species diversity .............................................................................................................................................. 25
Fish trophic level .................................................................................................................................................... 27
Total fish biomass ................................................................................................................................................... 29
Biomass of fish families .......................................................................................................................................... 31
Fish size distributions ............................................................................................................................................. 36
Invertebrate community structure ........................................................................................................................ 39
Benthic / substrate cover ....................................................................................................................................... 44
4. Discussion ............................................................................................................................................. 52
Fish community structure and biomass ................................................................................................................. 52
Invertebrate community ........................................................................................................................................ 54

Blue Ventures Conservation Report
Benthic community ................................................................................................................................................ 56
5. Conclusions and recommendations ........................................................................................................ 57
Summary of findings .............................................................................................................................................. 57
Management implications ..................................................................................................................................... 59
The need for integration ..................................................................................................................................................... 59
6. References ............................................................................................................................................ 62
7. Appendices ............................................................................................................................................ 68
8. Supplementary Information ................................................................................................................... 81
S1. Focus group survey results ............................................................................................................................................ 81
S.2. Fishing Surveys ............................................................................................................................................................. 88
S.2.1. Catch characteristics ................................................................................................................................................. 88

Blue Ventures Conservation Report
i
EXECUTIVE SUMMARY
Ghana’s coastal region supports productive fisheries that provide a major supply of protein and significant economic support
to the nation. Over the decades poor fisheries governance and management - in large part due to the open access nature of
the fisheries, overfishing and the use of destructive fishing methods - have led to marked declines in fisheries landings.
With the majority of studies focusing on the more productive and commercially more important pelagic and deep demersal
environments, ecological information on the near shore rocky reef habitats (NSRH) of Ghana and West Africa in general is
very limited. The present study fills this knowledge gap, by investigating the general status of the NSRH and fisheries of
western Ghana, providing baseline information on the fish, invertebrate and benthic communities.
Results point towards extreme overfishing in these habitats and provide empirical evidence in support of the call for effective
fisheries management.
Fish community is characterised by low biomass and dominated by small-sized lower trophic groups
Fish abundance data shows that sites were categorised by three main groups: 1) those dominated by surgeonfish
(Acanthuridae), 2) those dominated by damselfish (Pomacentridae) and jacks (Carangidae) and 3) those dominated by wrasse
(Labridae).
Overall fish abundance was explained predominantly by the large number of small bodied pomacentrids and labrids
occurring mostly at shallow depths.
Species richness and diversity indices suggest intermediate to high levels of disturbance, with the physical removal of fish
preventing species from achieving high levels of abundance.
The average biomass observed in this study was low (399 kg ha-1) consistent with the dominance of small sized, low trophic
level fish indicating high levels of exploitation.
The highest biomass observed in this study (1000 kg ha-1
) may be indicative of the productivity potential of the area; however
69% of this biomass comprised low trophic groups, suggesting that the potential biomass could be considerably higher if
fishing pressure was reduced.
Fisheries in these NSRH are dominated by one-man unmotorised canoes deploying either hook and line, or set nets at the
transition between the rocky and soft bottom areas. Hook and line fishing is known for being very selective targeting mostly
carnivorous, and particularly piscivorous fish. Large predatory fishes were virtually absent and most predators observed
during the study were small sized groupers. As large bodied and more aggressive grouper species are removed by fishing,
competitive release may allow populations of the small sized grouper Niger hind, Cephalopholis nigri, to dominate.
The dominance of NSRH by low trophic level, small bodied fish and near absence of large sized carnivorous fish suggests that
fishing pressure plays a prominent role in structuring the community.

Blue Ventures Conservation Report
ii
Invertebrate community is dominated by few species indicating links to overfishing
The slate pencil urchin Eucidaris tribuloides var. Africana is the most abundant and most widely distributed motile
invertebrate species observed.
It’s extremely high abundance is most likely a result of trophic cascades related to overfishing of predatory fish.
Very low densities of commercially important macro-invertebrate groups, such as lobsters, shrimps and octopus were
observed. In conjunction with the reduced predation by fish related to overfishing, overharvesting of these important
predatory invertebrate species could have resulted in the release and dominance of their prey.
Dominance by sea urchins often results in ecological disturbances through excessive bioerosion (herbivorous urchins) or
predation (carnivorous urchins) suggesting that dominance by E. tribuloides in Ghana’s NSRH could have caused significant
shifts in the benthic composition.
In addition, dominance of one or few species may render an ecosystem less resilient to natural or human induced
environmental disturbances, with the removal of dominant species resulting in the release and dominance of their prey
species.
Benthic community reflects interactive effects of physical environmental parameters and human impacts
Crustose coralline algae are the most dominant feature in the benthic community of Ghana’s NSRH, followed by turf, blue-
green and fleshy algae. This pattern probably results from interactive effects between the physical environment and biotic
changes associated with overfishing and dominance (see above).
Fisheries landings comprise a high proportion of juvenile fish
Large sized fish observed in local catches are mainly herbivorous parrotfish and surgeonfish while large-sized predatory fish
(grouper and snapper) were seldom observed. The visual surveys and catch observations support fishers’ perceptions of
decreasing total catches, increasing effort, declining yield (catch per unit effort - CPUE) and decreasing fish sizes and trophic
levels.
The small mesh sizes of the set nets commonly used in western Ghana catch fish under optimal/mature size. Many fishers
continue to use nets below the approved mesh size, and in some instances these are accompanied by other illegal fishing
practices, such as use of monofilament nets, dynamite and poison fishing.
Summary and conclusions
The near shore rocky reefs of Ghana are characterised by communities typical of marine areas experiencing high levels of
overfishing and associated cascading trophic effects. The near complete removal of top predatory fish by overfishing has
resulted in the release of prey species and a shift to a lower diversity ecosystem, with fish, invertebrate and benthic
communities now dominated by a few abundant species.
This marine and coastal ecosystem and the services that it provides would benefit greatly from the introduction of integrated
coastal management.

Blue Ventures Conservation Report
iii
Many of the species targeted by local fisheries in the NSRH are reef associated resident populations and local management
could be a highly effective approach in species protection, as well as in facilitating habitat restoration and the recovery of
depleted stocks.
Given the low diversity and functional redundancy of NSRH habitats, as well as their poor benthic complexity and high
species-level dominance at every level of the ecosystem, if present levels of fishing intensity continue these ecosystems will
have little capacity to resist or recover from future acute disturbances.
Management recommendations
Effective management of these areas is likely to be critical to restoring key functional groups and safeguarding ecosystem
resilience.
An ecosystem-based management approach involving a combination of a network of small marine protected areas (MPAs)
with multiple use zoning is suggested as the best model. The network of marine protected areas (MPA) should include core
‘no-take-zones’ at their centre, surrounded by temporary closures and gear restriction zones. Core no-take-zones will allow
full recovery of populations, increasing the size and biomass of fish stocks. In the long term this will also benefit adjacent
common use areas through supply of adult fish and larvae for recruitment (spill-over effect).
Fisheries management through gear and catch restrictions will limit overfishing and habitat destruction, thereby promoting
recovery of fish biomass, restoration of habitat, enhancement of ecosystem resilience and sustainability of fisheries.
An integrated ecosystem approach should be followed as far as possible by considering spatial links and interconnections of
NSRH with other adjacent environments so that maximum management benefits can be achieved.
The rapid coastal population growth and urbanisation of western Ghana, notably through the expansion of industries such as
agriculture, oil and mineral mining, means that natural resource conservation and management will require high levels of
integration and the involvement of multiple and diverse stakeholder groups. Co-management of MPAs with primary
stakeholders such as local village councils, chief fishermen and chief fisherwomen, fish-traders, and fishmongers should be
followed to help ensure that management plans are met with high levels of compliance by local communities and other
stakeholders.
In addition to conservation of coastal biodiversity and vital resources, responsible fisheries management will provide an
opportunity for Ghana to safeguard it traditional coastal culture and fishing heritage, and achieve meeting its international
obligations of conservation and sustainable development and play a regional role of responsible participatory coastal
stewardship.

Blue Ventures Conservation Report
1
1. Introduction
Ghana’s coastal environment and fisheries resources
The Guinea Current Large Marine Ecosystem (GCLME) contains some of the most productive coastal and offshore waters in
the world (Binet and Marchal 1993; Binet 1997; Chukwuone et al. 2009). These high levels of productivity are due to the
seasonal upwellings that occur off the coast of Ghana and Cote d’Ivoire twice annually, typically with a larger/stronger
upwelling from July to September and a second weaker pulse from December to January (Koranteng 1995).
The upwelling system supports productive fisheries with two main components: a seasonal pelagic fishery and a deep sea
(demersal) fishery as well as shallow rocky and soft bottom habitats and wetlands (lagoons, estuaries and delta systems) that
support minor finfish and shellfish fisheries (Mensah 1979; Entsua-Mensah and Dankwa 1997; Entsua-Mensah et al. 2000;
Dankwa and Gordon 2002). The pelagic fishery has received the greatest research and management focus due to the high
productivity and economic benefits it provides. It is exploited by diverse fleets, from un-motorized canoes to industrial ships.
Small, schooling species (sardines, anchovies, and mackerel) make up the majority of the catch. Evidence from fisheries
landings shows that the catch of small pelagics is currently at its lowest since the 1970s (Finegold et al. 2010). Natural
variability of the stocks and overexploitation, including illegal means such as light fishing, are believed to be the main reasons
for this declining trend (Finegold et al. 2010).
Figure 1.1. Growing numbers of fishers and increasing use of destructive fishing practises lead to overexploitation.

Blue Ventures Conservation Report
2
The high productivity levels linked to the upwelling system have also been shown to extend into the deeper part of the
continental shelf (Perry and Sumaila 2007) and supports rich stocks of demersal (bottom-dwelling) fish. Many shallow near
shore rocky and soft bottom, lagoon and mangrove habitats also stretch along the coast of Ghana. However, unlike the
pelagic fishery, the smaller but yet possibly more vulnerable shallow demersal and lagoon system fisheries have been
overlooked in management and policy. Demersal fish are often closely associated with the bottom habitat and their often
sedentary nature makes them highly susceptible to overfishing and habitat damage. Heavy exploitation of demersal stocks
were noted in the 1970s (Gulland et al. 1973), with more recent fisheries research surveys reporting marked declines in the
abundance of demersal fish biomass between 0 and 30 m depth, and with predatory fish in particular facing greater impact
(Koranteng and Pauly 2004). Recent analysis of demersal fish landings in Ghana also provide evidence for sequential
overfishing with decadal shifts in the composition of fish landings (Finegold et al. 2010).
Food Security and Economy
Ghana’s marine fisheries comprise over 70% of the national catch, accounting for an estimated 374,229 mt per year (FAO
2003; Tetteh 2010). Fish constitutes an important food source, commodity and industry in Ghana. Hugely reliant on fish and
fisheries products for nutrition, estimates suggest that almost 60% of animal proteins consumed by Ghanaians are derived
from fish and 75% of total annual production is consumed locally (Sarpong et al. 2005). The annual per capita consumption is
estimated at approximately 29.6 kg, which is considerably higher than in neighbouring nations: Togo (7.0 kg), Benin (16.4 kg),
Ivory Coast (12.3 kg) and Nigeria (9.0 kg), and almost double the world average of 17.8 kg (FAO 2011).
The fisheries sector plays a vital role in Ghana’s national economy, providing 4.5% to Gross Domestic Product (GDP).
Approximately one third of landings are marketed for export to other African countries as well as destinations in the
European Union, Japan, and North America, while imports are reportedly much higher, often twice this amount and
estimated at US$121.4 million in 2009 (Finegold et al. 2010).
Fisheries and its sub-sectors (both marine and freshwater) are estimated to provide direct employment for approximately 1.5
million people (FAO 2003; Finegold et al. 2010).
Population growth, fisheries exploitation and environmental threats
Ghana has a long history as an artisanal fishing nation stretching back to the 16th
and 17th
centuries (Overa 2001) and the
Fante (or Fanti) people of western Ghana have an established reputation for being the best fishermen in West Africa. They
are thought to be responsible for introducing effective fishing techniques to other parts of Ghana, as well as other countries
in the GCLME (Haakonsen and Diaw 1991).
Ghana’s population reached 24 million in 2011, and the country has a population growth rate of 1.9% per annum (GSS 2007-
2012). The coastal population, similar to those in other developing nations, is growing faster than the national average (at
around 3%) (Creel 2003; EPA/UNOPS 2004) and the population of the western region is expected to double by 2020 (GSS
2007-2012). High levels of consumption, and rapid population growth means that the national demand for fisheries
resources is at its highest in history, around 676,052 mt pa (FAO 2011). With annual landings estimated just over 300,000 mt

Blue Ventures Conservation Report
3
pa (2009 data) and with up to 30% of landings destined for export, more than half of the fish consumed in Ghana is now
being imported from other countries (FAO 2011).
Ghana’s marine fisheries are described as fully exploited, overexploited or collapsed (UNEP/LME 2010) and a number of traits
observed in the fisheries sector correspond to symptoms of Malthusian Overfishing (Pauly et al. 1989) Many fishers use small
mesh size nets against the Fisheries Departments’ approved legal limits (Koranteng 2002), leading to observations of both
recruitment and growth overfishing; 2) Fishers use prohibited light fishing techniques, capturing fish outside of the major
fishing season, when these stocks are normally in a resting phase. It is believed that this disturbs the natural biological cycle
of the fish, and could have serious repercussions on spawning stock biomass (Bannerman and Quartey 2005); 3) Light fishing
techniques are used in conjunction with other destructive and non-selective methods such as the use of small mesh size nets,
which is also believed to have further negative consequences on the sustainability of the fishery; 4) There is illegal dynamite
and poison fishing (e.g. carbide and mosquito coils) being carried out by small groups of fishers with substantial negative
impacts on stocks and habitats as well as posing significant hazard to the fishers themselves (Box 1.1); 5) Overfishing and
habitat destruction are accompanied by other chronic anthropogenic impacts, such as sedimentation from fluvial discharge,
as well as organic enrichment and pollution of coastal waters.
Figure 1.2. Ghana's fisheries employ 1.5 million people in associated industries including a large number of women

Blue Ventures Conservation Report
4
In the western region, many communities lack appropriate waste disposal systems and wastes are discharged directly in
the nearest body of water (lagoon, lake or sea). The coastal areas have recently experienced blooms of a green seaweed
Enteromorpha clathrata locally known as “green-green” and a brown seaweed Sargassum sp. The former has been
linked to build up of organic nutrients whose source is believed to be the Abidjan area in Cote D’Ivoire (Coastal
Resource Centre 2010). The main cause of the latter is less understood but nutrient overload from terrestrial runoff and
oil pollution could be some of the main causes (McDiarmid 2012). Both algal bloom events have affected local fisheries
directly by causing damage to fishing nets.
Box 1.1. Reflections of a fisher from Miemia on dynamite fishing
Dynamite fishing is carried out across the western region but occurs most frequently between Dixcove (East)
and Cape three points (West).
Dynamite is purchased locally, and originates from one of the many mineral/gold mining operations in the
area. The dynamite comes in the form of plastic, high explosive (TNT) sticks approximately 30 cm long and 10
cm wide. These sticks are then split into 2/3 sections and secured to a floatable object (e.g. wooden sticks). A
makeshift waterproof fuse is inserted and then, when a large shoal of fish is observed below the water
surface the fuse is lit, the package thrown into the water and the charge detonates.
Due to the large number of fish lost due to sinking and the risks associated with using dynamite, skilled
professional fishermen generally engage in this practise only when it is more profitable than normal
techniques. However, during the upwelling seasons, when schools of large bodied pelagic fish such as
carangids (jack/trevally) and scombrids (mackerel and tuna) migrate close to shore and water surface it is
easy for anyone to harvest good catches from the small percentage of fish that float to the surface, and as
such non fishermen also go to sea to engage in this practise
Dynamite fishing also forms a component of illegal light fishing. As the shoals of small clupeids (sardine and
herring) are attracted to the surface by the lights, explosives are thrown in to stun them and then nets are
used to recover them to a vessel.
Lagoons often serve as sources of drinking water for many communities, as well as a source of fish, and contamination
of these water bodies poses significant health risks for people and livestock. Many lagoons are open to the sea, and
these contaminants may eventually end up in the sea affecting the natural functioning of marine systems. In addition,
high levels of organic pollutants, including plastics in the marine environment have been reported (Coastal Resource
Centre 2010). Plastic fibres, and toxic chemicals leached from plastics, build up in food webs (Mato et al. 2001;
Thompson et al. 2009), and marine birds, mammals and reptiles can become entangled in floating plastics and ghost
nets that persist long after they have been discarded in the marine environment (Cundell 1974; Azzarello and Van Vleet
1987; Gregory and Andrady 2003). Plastic consumption in these organisms can cause suffocation and starvation.

Blue Ventures Conservation Report
5
Climate Change impacts
Climate change, through ocean acidification and warming is significantly influencing physical and biological marine
processes both at global and regional scales (Harley et al. 2006; Pörtner 2008; Rosenzweig et al. 2008), and poses major
and unforeseen challenges for ecosystems and societies. Climate variables may influence fisheries through physio-
chemical effects on physiology and population dynamics, and shifts in the abundance and distribution of exploited
species and assemblages (Perry et al. 2005; Last et al. 2011). In addition to changes in trophic interactions, the
increasing intensity and frequency of extreme weather events such as storms and floods could affect fishing operations
and infrastructure (Choi and Fisher 2003; Allison et al. 2009). Many marine stocks are already suffering from the
consequences of overfishing and other environmental stresses, how climate change will interact with these other
threats is less predictable. The combined effects of a strong dependence on fisheries for national economy and food
security, high sensitivity of these fisheries to climatic variations (Binet 1997; Minta 2003) and the limited social capacity
of communities to adapt imply that Ghana, along with many other nations is placed amongst the most vulnerable to
climate change (Allison et al. 2009). There are already some indications that the decline in the pelagic fisheries is linked
to climate change effects on productivity, growth of target species and catchability (Minta 2003).
The current project and study objectives
Despite terrestrial and some small wetland areas protected by the state, there are currently no Marine Protected Areas
(MPA) in Ghana, and the fishery remains “open access”. Marine protected areas have proved successful in restoring
some level of sustainability to fisheries worldwide through the reduction of fishing pressure and preserving the larger
fecund fish within their boundaries (Claudet et al. 2006; Edgar and Stuart-Smith 2009; Stobar et al. 2009). The build-up
in the biomass of fecund fish helps in repopulating surrounding fished areas with adult fish and larvae known as the
spill-over effect. Previous research conducted in the region has concentrated on monitoring of the extraction of biomass
mainly through landings data and trawl surveys (Koranteng and Pauly 2004). Although effective in pelagic and demersal
populations in soft bottom habitats, these methods are less effective for rocky habitats with complex terrains. Landings
data have also been shown to have inherent problems associated with changes to fisheries technology causing an
underestimation of effective fishing effort (Finegold et al. 2010).
The current project is an integral component of the Coastal Resources Center’s (CRC, University of Rhode Island)
Integrated Coastal and Fisheries Governance (ICFG) initiative for the western Ghana region. The initiative, also called
Hen Mpoano, aims to establish Ghana’s first marine protected area. By obtaining baseline ecological, fisheries and
relevant socioeconomic data, the current research will complement other efforts by CRC and its counterparts.
The primary objective of this project is to quantitatively assess the current status of the marine and coastal ecosystems
of the region, putting into place the protocols and methods needed to ensure the long term monitoring of key
ecological, fisheries and socioeconomic variables to enable adaptive management and zoning of Ghana’s first MPA. It

Blue Ventures Conservation Report
6
also seeks to provide pre-requisite ecological and biological data required for identifying priority areas for protection
within the proposed MPA, as well as providing technical guidance in the establishment of long-term fisheries and
socioeconomic monitoring programmes to support MPA zoning and adaptive management.
The main focal area of the research is the near shore rocky habitats (NSRH) between Axim and Busua/Butre (Figure
2.1.), which is at the centre of the Hen Mpoano initiative. Fisheries research in Ghana has largely focused on the highly
productive pelagic and deep soft and rocky bottom demersal environments. Inland waters and coastal wetlands are also
relatively well studied. The NSRH however remains little investigated and the current research intends to fill the
information gap that exists for this important environment that probably forms a crucial link between the deep, pelagic
and intertidal and coastal wetland areas.
The standard underwater visual census (UVC) surveys involved assessment of three key ecosystem properties: a) fish
community structure and biomass, b) macro-invertebrate community structure and c) benthic community structure.
Fish community structure and biomass
Fish assemblages represent different functional guilds and influence community structure of other fish, invertebrate
and benthos and significantly affect resilience of a system to human induced and natural disturbances. Reef associated
fishes are vulnerable to natural disturbances and anthropogenic activities, particularly those that impact the physical
structure of the habitats in which they reside. Many fish species are commercially important, particularly in resource-
poor coastal regions, in addition to being a food resource for local communities. With changes in fish community
structure acting as indicators of ecosystem health, it is vital to assess fish diversity and abundance as well as
determining stock biomass of commercially important species, so that appropriate management strategies can be
implemented and their effects monitored over time.
Invertebrate abundance and community structure
Some invertebrate species, such as sea urchins and sea stars are often recognised as ‘keystone’ species due to the
ecological roles they play as grazers, bio-eroders and/or predators, while others, such as octopus and lobster, are
commercially important and play critical ecological roles as predators. Abundance of urchins and other invertebrates
and their ecological influences are controlled both by bottom up, such as the availability of food and habitat, and top-
down processes such as predation. Surveying invertebrate communities is therefore of great importance in assessing
the rate of herbivory, bio-erosion and predation, as well as providing a useful indicator of fishing intensity and general
ecosystem health.
Benthic cover and community structure
Marine ecosystems are largely dependent on the primary productivity of different macro algal species assemblages and
functional groups that form key components of the benthic community. Other benthic species form main substrate
foundation for attachment and growth of other benthos and habitat and shelter for different vertebrate and

Blue Ventures Conservation Report
7
invertebrate groups. Thus, benthic community surveys are paramount to habitat assessments not only because they
provide information on diversity and structure of the habitats themselves but also as a key indicators of the general
health and productivity of the ecosystem. Anthropogenic factors such as fishing pressure and pollution, for example,
can greatly affect competitive processes and result in ecological dominance. Depending on the susceptibility of the
dominant taxa and their effect on other ecological processes the ability of a benthic system to tolerate, resist and
recover from natural and human induced disturbances can vary.

Blue Ventures Conservation Report
8
2. Methods
Research Area
The focal point for the current study was in the centre of the Coastal Resource Center’s (CRC) Hεn Mpoano intervention
zone in the Western Region of Ghana. The research area covers the coastline that stretches from the Ankobra River on
the western side of the Nzema East District (4°53'49.47"N; 2°16'18.68"W), to the community of Butre in the Ahanta
West District (4°49'26.09"N; 1°55'2.87"W), and is inclusive of the management/conservation priority site of Cape Three
Points (Coastal Resources Center 2011 Assessment of critical habitats).
Figure 2.1. Satellite image showing locations of the 14 survey sites (See Table 2.1 for full names and habitat features of sites).
The research area was divided arbitrarily into five 10-15 km sections of coastline (quadrants), and using information
gathered from focus group interviews, habitat maps of the area and local dive guide knowledge, 3-4 survey sites were
selected in each quadrant based on habitat type (Headland, Bay, Patch and Island where they occurred). Due to
adverse weather and oceanographic conditions, the number of proposed survey sites and transects was reduced from
the initially planned 6 replicate transects each in 22 sites. Between 3 to 6 replicate transects were surveyed, with one
site having 2 replicates and another site having 8.

Blue Ventures Conservation Report
9
Environmental data
Site characteristics
In order to assess the effects of environmental characteristics sites were classified by:
Habitat Type: headland, bay, patch and island.
Exposure Level: sheltered, semi-exposed and exposed based on the openness of the site to open sea.
Wave Action: low, medium and high wave energy environments based on the amount of wave action observed at each
site.
Fishing Pressure: Fishing pressure was represented by the number of fishers in the nearest fishing villages, obtained
from the focus group interviews, and the distance of a survey site from the village. Assuming that distance is inversely
related to fishing pressure, a single composite index of fishing pressure was used by dividing the number of fishers in a
village by the distance between a survey site and a fishing village. In addition, information on the number of fishing
boats near the survey area observed during field trips was included. A semi-quantitative scale of low, medium and high
fishing pressure was used.
The degree or level of intensity of a particular environmental parameter (e.g. low, medium, high) was determined
following discussion among researchers until a consensus was achieved (Table 2.1.).
The location of each site was geo-referenced using GPS (GARMIN GPS72H), downloaded into MapSource and imported
into Google Earth. At the start of each survey the following information was noted: Date (ddmmyyyy), Time (hh:mm)
and Tide (High, Low, Falling, Rising). The following parameters were collected for each individual transect: Depth (m), in
situ water temperature (˚C). In situ visibility (m) and sea condition were measured at the end of each transect (scale of
1-5) and slope (angle degrees), % Rock, sediment size and depth (scale of 1-3) were estimated.
Rugosity is a measure of the habitat, and is a commonly used as indicator of the amount of space available for
colonisation by benthic organisms, and shelter and foraging area for mobile organisms. It was measured on each
transect by laying the transect line following the contour of the reef, pushing the tape down into holes, cracks and
crevices. On reaching the end of the tape measure (50 m) the substrate is marked, the line is pulled taut and the
difference (m) between the slack line and the taut line is taken as a measure of rugosity.

Blue Ventures Conservation Report
10
Table 2.1. Site names, codes and assigned levels for environmental variables.
Site Name Site
Code
No. Fish
Belts
No. Benthic
belts
No. Invertebrate
belts
No. Biomass
belts
Habitat
Type Exposure level
Wave
action level
Fishing
pressure
level
Abokwe Leeward ABO_L 3 3 3 3 Island Sheltered Low High
Abokwe Seaward ABO_S 3 3 3 3 Island Exposed Med High
Akitakyi Bay Big AKE_B 6 6 6 6 Bay Sheltered Low Low
Akitakyi Bay Small Left AKE_SL 2 2 3 3 Bay Semi exposed High Low
Akitakyi Bay Small Right AKE_SR 3 3 0 3 Bay Semi exposed High Low
Atwiwa ATW 3 3 2 3 Patch Sheltered Low Low
Cape Three Points C3P 3 3 0 1 Headland Exposed Med High
Miemia MIE 3 3 3 3 Bay Semi exposed High Med
Miemia Inner Patch MIEMIA INNER 5 5 6 6 Patch Semi exposed High Low
Miemia Outer Patch MIEMIA OUTER 3 3 3 3 Patch Semi exposed Med Med
Mutrakni Point MUT 6 6 6 6 Headland Exposed Med Med
Paradise Beach PAR 6 6 6 6 Bay Semi exposed Low Med
Princess Town Fort PTF 3 3 3 3 Headland Semi exposed Med Med
West Point WPT 6 8 8 8 Headland Exposed Med High

Blue Ventures Conservation Report
11
Biological data
Biological data was collected in replicate 50 m transects, laid perpendicular to the shore. The tape measure was secured at
the starting location using a short piece of metal re-bar driven into the sediment or wedged into the rock. The tape measure
was then laid by the fish surveyor. Fish surveyors always preceded other surveyors in order to avoid fish being scared by
other divers, which would add bias to the data.
Fish species diversity, abundance and biomass
Underwater Visual Census (UVC) is a widely used surveying technique for the assessment of reef fish communities. This study
employs two UVC methods:
The first technique was used for surveying fish abundance and diversity. The surveyor would swim along the 50 m transect
counting and recording fish (identified to species) 2.5 m either side of the line, covering an area of 250 m2. In order to reduce
error, fish were observed in a moving box of 5 m in front of the diver by taking care to avoid double counting of fish moving
in and out. In the second technique, fish biomass surveys were conducted by estimating individual length of fish according to
the following size categories: 3-10, 10-20, 20-30, 30-40, 40-50, 50-60, 60-70, 70-80 and >80 cm. Unlike in the diversity
transects fish were identified only to the family level.
Invertebrate Belts
Invertebrate counts were conducted along the same 50 m length biomass transects. A 2 m x 50 m corridor (100 m2 area) was
observed, and all motile marine macro epifauna recorded. All individuals were subsequently identified to the highest
possible taxonomic level.
Benthic surveys
Cover of the major substrate and benthic groups was assessed along the 50 m transects that were used in fish diversity
surveys (see above). Ten 0.5 x 0.5 m quadrats (Figure 2.2.) were placed haphazardly along each side of a transect line and
cover estimated. The following major benthic animal groups were considered: hard coral, soft coral, sea anemone, sponge,
zoanthid, gorgonian, antipatharia, tunicate and barnacle. Benthic macro algae were classified into the following five
functional groups: blue-green algal mat, fleshy algae, turf algae, articulate coralline and crustose coralline algae. Substrates
devoid of benthic organisms were recorded as bare rock, sand or mud.
Fisher interviews
In order to establish understanding of the fishing communities of the western region a number of semi structured
workshops/focus groups were undertaken in eight villages along the coast. Contact was made primarily with the chief
fisherman from each village and a small gathering of between 6 and 12 fishers, each representing different types of boat and
fishing techniques were assembled for the discussion1.
1 Results from fisher interviews are presented as Supplementary Information

Blue Ventures Conservation Report
12
The questions asked were intended to allow researchers to understand where and how they fished and included the
collection of information on the different types of fishing boats, fishing gear, where and how these fishing gears were
employed and which species they primarily targeted in different fishing areas and during different seasons. Due to the
informal nature of the meetings additional information on fishers’ perceptions of the status of the fisheries, pattern of
change in recent years, and targeting protected or endangered species was often offered by fishermen.
Figure 2.2. Divers undertake benthic surveys using quadrats.
Fishing surveys
Following focus group interviews, observations of local catches and review of national fisheries statistics, it became apparent
that a large proportion of the shallow demersal fisheries catch originates from habitats with muddy sediments adjacent to
the rocky reef, sites that were surveyed using the methods detailed above. These underwater visual survey methods are
ineffective in muddy or turbid areas, which often have low visibility. However, because of the importance of these habitats to
local fisheries, broad assessments were undertaken so as to gain knowledge on the species and establish overlap in target
species between these and the NSRH2.
In Figure 2.3, the same two nets (see Figure 2.4.) were deployed each day between 10:30 and 12:30, and retrieved the next
morning between 9:00 and 10:30. In order to reduce bias, fishing was carried out by the same fishers in all three days. Soak
time was calculated as the period of time from start of deployment to end time of retrieval of the net.
2 Results from fishing surveys are also presented as Supplementary Information

Blue Ventures Conservation Report
13
Figure 2.3. Location of fishing sites (red lines indicate location and direction of fishing nets).
During retrieval of the nets, fish were removed and placed flat on a wooden board with a tape measure. Each individual fish
was photographed and then returned to the fishermen. On returning to shore, photographs were downloaded onto the
computer and two researchers identified independently each fish to the highest taxonomic level possible and using the tape
measure present in the photograph recorded its length. Once identification was agreed, the mean length was calculated from
the two observations. Length-weight conversions were collected from http://www.fishbase.org and the estimated weight of
each fish calculated3.
Total yield (kg) was calculated from estimated fish weights and catch per unit effort (CPUE) calculated as total catch/total
soak-time (kg hr-1
).
3 Where length: weight conversions were not available, information on the closest species available was used.

Blue Ventures Conservation Report
14
Figure 2.4. Dimensions of fishing nets employed during fishing surveys.

Blue Ventures Conservation Report
15
Data Analysis
A combination of univariate and multivariate techniques were applied in analysing the data. Comparisons in abundance,
diversity, biomass and cover for selected (important taxa) by site, habitat type, exposure and wave strength were made.
Aspects of community structure were investigated with multivariate analyses. Relationships between target biotic variables
and environmental and biotic factors expected to influence their distribution were also analysed with both univariate and
multivariate techniques.
The occurrence and abundance of different fish and invertebrate species was used to calculate species richness (SpR) and
Simpson’s species diversity index (SDI). Species richness was calculated as the total number of species observed on each site,
while Simpson’s Diversity Index was calculated using the following formula:
(1-λ) = 1 - (Σpi2)
Where pi = the proportion of the total count arising from the ith
species (Magurran 1988). This index reduces the relative
importance of abundant categories, expressing diversity not only as a measure of species richness but also how evenly
individuals are distributed among the different species. An increasing SDI value corresponds with increasing diversity, while
dominance of a few or a single species lowers the SDI value.
The trophic level for each fish species was recorded using published trophic level data (Froese et al. 2000) where a trophic
level of ≤ 2 is equivalent to a herbivore, 2.1 to 3.7 is an omnivore (trophs below 2.1 - 2.9 preferentially feeding on vegetal
matter and those above 2.9 – 3.7 preferring animal foodstuffs), and 3.7 to 4.5 is a carnivorous animal feeding entirely on
other lower troph animals (3.7 - 4.0 preferring decapods and invertebrates and those above 4.0 preferring fish).
Fish weight was determined using published length-weight conversions (Froese et al. 2000), and the mid-point of each size
class was used to convert size-frequency data into biomass data. Final biomass was calculated in kg ha-1
in order to allow
comparisons with other studies.
Taxa-site associations were analysed using covariance based Principal Component Analysis (PCA) on fish community
composition and biomass, invertebrate abundance and cover of major benthic groups. PCA was also used in identifying
important taxa contributing to the observed variations in distributions. Differences in abundance, biomass, cover of taxa and
functional groups identified as important by PCA were tested using univariate analysis against a number of a-priori defined
factors: site, habitat type (bay, patch, headland or island), exposure (sheltered, semi exposed, exposed), wave energy (low,
medium or high) and fishing pressure (low, medium, high). Homogeneity and normality of data were tested using Levene’s
test of Homogeneity and Kolmogorov-Smirnov’s test respectively. Most data was not homogeneous, nor normally
distributed; therefore the non-parametric Wilcoxon’s ANOVA was used, with further paired Mann-Whitney U-tests
conducted to discern the direction of differences.
Step-wise multiple regression analysis was conducted to test relationships between targeted biotic parameters and both
biological and abiotic factors influencing distributions. Biomass of large sized carnivorous fish (proxy to predation), cover of
the important benthic groups identified by PCA (BGA-mat, CCA, fleshy Algae, turf algae and sand) and habitat variables
(depth, % rock, rugosity, complexity and wave action) and fishing pressure were included in the model. Relationships
between abundance and biomass of important fish families and habitat, environmental and benthic variables were tested.

Blue Ventures Conservation Report
16
For invertebrates, in addition to the habitat variables indicated above, biomass of fish families feeding exclusively on
invertebrates or those feeding on both invertebrate and fish (Balistidae, Dasyatidae, Ephippidae, Haemulidae, Labridae,
Lethrinidae, Lutjanidae, Serranidae) was included. In addition to habitat variables (see above), biomass of major herbivorous
fish (Acanthuridae, Scaridae, Pomacentridae) and sea urchin abundance were considered as the main biotic factors affecting
benthic distribution. The model with the lowest Aikaki Information Criterion (AIC) and the highest fit (R2) within AIC of ± 2
was selected (Burnham and Anderson 2002).

Blue Ventures Conservation Report
17
3. Results
Fish total Abundance
Over the entire survey period, 14 sites were surveyed and a total of 55 fish transects completed. A total of
7808 fish was observed on these transects, with 46 species representing 25 fish families recorded (Appendix
1).
Overall mean fish abundance was (141.96 ± 16.58 individuals transect-1
) and significantly varied across sites
(Kruskal-Wallis χ2 = 22.29; p = 0.009), ranging from the lowest average abundance at Akitakyi Small (54.66 ±
2.73) to the highest at Abokwe Seaward (350.00 ± 163.86), and Akitakyi Big (224.50 ± 63.34) to Paradise Beach
and Abokwe Leeward also exhibited low abundance (72.20 ± 11.78 and 72.33 ± 30.82 respectively) (Figure 3.1).
Site
AB
O_
L
AB
O_
S
AK
E_
B
AT
W
C3
P
MIE
MIE
_I
MU
T
PA
R
PT
F
WP
T
AK
E_
SR
AK
E_
SL
MIE
_O
Mean A
bundance (
indiv
iduals
tra
nsect-1
)
0
100
200
300
400
500
Figure 3.1. Mean total abundance of fish at each survey site.
Mean total abundance was significantly different between exposure scenarios (χ2
=7.98; p = 0.02) with higher
abundance in sheltered sites than in semi-exposed, or exposed sites (Appendix 4; Figure 3.2.). Mean

Blue Ventures Conservation Report
18
abundance did t diff b t h bit t t (2
3 68 0 30) ti (2
3 69 0 16) or fishing
pressure (χ
Multiple r
2.96; p =
0.03). Tota a positive
effect. Rug
Exposure
Exposed Semi exposed Sheltered
Mean A
bundance (
indiv
iduals
tra
nsect-1
)
0
50
100
150
200
250
300
Figure 3.2. Difference in mean fish abundance by exposure (Kruskal Wallis χ2 = 7.98; p = 0.02).
Fish family abundance
Principal Component Analysis (PCA) showed that differences in fish community composition were explained
mainly by the abundance of Pomacentridae (damselfish), Carangidae (jacks and trevally), Labridae (wrasse),
and Acanthuridae (surgeonfish) (Figure 3.3.). PC Axis 1 explained 57.5% of variation and separates sites with
high abundance of pomacentrid, carangid and labrid species from sites with high acanthurid abundance. Axis 2
explained a further 20.4% of the variation and separates sites with high abundance of pomacentrids from
those with high abundance of carangids, labrids and acanthurids. Other fish families were all located around
the centre of the PC plot, contributing less to the variation.


Blue Ventures Conservation Report
20
Figure 3.4. Contribution (%) of each fish family to total abundance.
Acanthurids were represented by a single species Acanthurus monroviae and varied significantly between sites
(χ2 = 29.92; p = 0.005) with the lowest abundance observed at Miemia Outer (1.33 ± 1.33 fish transect
-1) and
the highest at Akitakyi Small (65.50 ± 3.5) (Figure 3.5.a). Abundance of acanthurids varied significantly with
exposure (χ2 = 6.68; p = 0.04) and fishing pressure (χ
2 = 13.72; p = 0.001). It was significantly higher in semi-
exposed sites than in both exposed and sheltered sites, with no difference between sheltered and exposed
sites (Appendix 4). Abundance was lower at medium levels of fishing pressure than at both high and low levels
of fishing pressure (Appendix 6).
Acanthurid abundance had significant relationship with cover of blue-green algal mat (+ve relationship) and
crustose coralline algae (-ve relationship) among the benthic habitat variables (Table 3.1.).
Table 3.1. Multiple regression analysis results on relationships between acanthurid abundance and benthic habitat variables.
Predictor R2 F t p
Intercept 0.27 10.96 4.10 0.0001
BGA-mat
9.38 3.06 0.004
CCA
7.00 - 2.65 0.011

Blue Ventures Conservation Report
21
Three carangid species (Chloroscombrus chrysurus, Pseudocaranx dentex and Selar crumenophthalmus)
comprised 45.81%, 18.64% and 35.56% respectively of the total (11%) carangid abundance. Abundance varied
significantly between sites (χ2 = 24.19, p = 0.029). They were absent at 8 of the 14 survey sites, and had highest
abundance (150.0 ± 150.0 fish transect-1
) at Abokwe Seaward (Figure 3.5.b). There was no significant
difference in carangid abundance across the selected environmental settings (habitat, exposure, wave action
and fishing pressure). Multiple stepwise regression showed that only sand had a significant effect (+ve) on
carangid abundance (R2 = 0.06, F = 4.864; p = 0.03).
Labrid abundance varied significantly between survey sites (χ2 = 39.51; p <0.0001). Labrids had five species
observed during the current study. They were dominated by Thalassoma newtoni (80.49% of observations),
with Coris atlantica and Bodianus speciousus comprising 10.08% and 5.59% respectively. The highest
abundance of labrids was seen at Akitakyi Small (79.67 ± 13.78 individuals transect-1
) and West Point (63.17 ±
5.71), with the lowest abundance at Miemia Inner (8.00 ± 2.32) (Figure 3.5.c). There was significant difference
in labrid abundance by habitat type (χ2 = 14.64; p = 0.002) with patch sites having significantly lower
abundance than bay and headland sites, and bay sites had lower abundance than headland sites (Appendix 3).
Islands had larger variability and did not differ significantly from other habitat types.
Labrid abundance differed significantly between different levels of exposure (χ2
= 12.56; p = 0.002), with
sheltered and exposed sites having significantly higher abundance than semi exposed sites (Appendix 4).
Abundance of labrids was also significantly different between levels of fishing pressure (χ2
= 15.78, p = 0.0004),
high and low fishing pressure sites had significantly higher abundance than medium fishing pressure sites
(Appendix 6). Depth, complexity, rugosity, crustose coralline and fleshy algal cover explained 40% of the
variation in labrid abundance (Table 3.2.).
Table 3.2. Multiple regression analysis results on relationships between labrid abundance and benthic habitat variables.
Predictor R2 F t p
Intercept 0.48 10.93 1.6 <0.0001
Depth
15.15 3.89 0.0003
Complexity
15.47 - 3.93 0.0003
Rugosity
4.64 2.15 0.04
Crustose coralline
11.07 - 3.33 0.002
Fleshy Algae
8.27 2.88 0.01
Pomacentrid abundance (Figure 3.5.d) was significantly different between sites (χ2 = 27.74; p = 0.010) with
highest abundance at Abokwe Seaward (109.00 ± 15.37 individuals transect-1
) and the lowest abundance
observed at Akitakyi Small (4.00 ± 1.37). Pomacentrids were also the most specious fish family with six species
observed. Of these, Stegastes imbricatus was the dominant species comprising 58.7% of observations within

Blue Ventures Conservation Report
22
the family. Chromis multilineata was also common comprising 22.5% of observations and Abudefduf saxatilis
(15%). Other species included Abudefduf taurus, Chromis limbata, and Microspathadon frontatus.
Pomacentrid abundance varied significantly across levels of exposure and wave action (χ2
= 10.51; p = 0.005
and χ2
= 12.84; p = 0.002 respectively). Sheltered sites had a significantly higher abundance than both semi
exposed and exposed sites, which did not significantly differ from one another (Appendix 4). Sites with
medium levels of wave action had significantly higher abundance of pomacentrids than sites of low or high
levels of wave action while these last two did not differ (Appendix 5). Stepwise multiple regression did not
show a significant relationship between abundance of pomacentrids and habitat variables.
Scarid abundance did not show significant difference between sites (χ2 = 18.43; p = 0.142) despite a maximum
of 21.17 ± 7.83 fish transect-1
at Akitakyi Big and a minimum of 1.33 ± 0.42 at West Point (Figure 3.5.e).
Abundance of this group was dominated by Scarus hoefleri contributing 67.42% of observations within the
family, with Sparisoma cretense contributing a further 30.83%. Sparisoma axillare and Sparisoma rubripinne
contributed <1% of observations respectively. Scarid abundance differed significantly between different levels
of exposure (χ2 = 7.80, p = 0.02), with sheltered sites having significantly higher abundance than both semi
exposed and exposed sites (Appendix 4). Abundance of scarids also differed significantly between different
levels of fishing pressure, with sites exposed to low fishing pressure having significantly higher abundance than
sites with both medium and high levels of fishing pressure (Appendix 6). Depth and rugosity predicted 16.2%
of the variation in scarid abundance, which was negatively related to depth but positively related to rugosity
(Table 3.1).
Table 3.1. Results of multiple regression analysis on relationships between scarid abundance and benthic habitat variables.
Predictor R2 F t p
Intercept 0.16 6.22 0.53 0.004
Depth
4.96 -2.23 0.03
Rugosity
8.88 2.98 0.004
Serranid abundance differed significantly between surveys sites (χ2 = 35.28; p = 0.001) with highest abundance
observed at Abokwe Seaward (11.67 ± 1.20 fish transect-1), and lowest abundance observed at Akitakyi Bay
Small Left (0.50 ± 0.50) and Paradise Beach (0.83 ± 0.54) (Figure 3.5.f). Abundance was dominated by
Cephalopholis nigri (99.70%) while Cephalopholis taeniops and Rypticus saponaceus were rarely observed,
accounting for 0.15% each. There was significant difference between habitat types (χ2 = 20.62; p = 0.0001),
headlands had significantly higher abundance than bay and patch sites. Abundance at headland sites did not
differ significantly from island sites. Bay, patch and island sites did not differ from one another (Appendix 3).
There was a significant difference in serranid abundance by exposure (χ2 = 8.49; p = 0.01), with exposed sites
having significantly higher abundance than sheltered and semi exposed sites (Appendix 4). Abundance also
differed significantly between levels of wave exposure (χ2 = 11.07; p = 0.004) and fishing pressure (χ
2 = 8.36; p

Blue Ventures Conservation Report
23
= 0.02). Sites with both high and low levels of wave action had significantly lower abundance than sites with
medium levels of wave action (Appendix 5). Abundance was higher at sites with high levels of fishing pressure
than at sites experiencing medium and low fishing pressure (Appendix 6). Serranid abundance was significantly
related to depth (+ve) and complexity (-ve) (Table 3.4.).
Table 3.4. Results of multiple regression analysis on relationships between serranid abundance and benthic habitat variables.
Predictor R2 F t p
Intercept 0.27 10.74 2.26 0.0001
Depth
12.69 3.56 0.001
Rugosity
9.37 -3.06 0.004
Lutjanidae were composed predominantly of two main species, Lutjanus goreensis and Lutjanus agennes
(50.09% and 49.52% within the family respectively). A third species, Apsilus fuscus was rarely observed and
comprised only 0.40% of observations. Abundance of lutjanids did not vary significantly between sites (χ2 =
18.33; p = 0.145) and ranged from being absent at five of the survey sites to highest at Miemia Inner and
Atwiwa (5.40 ± 5.40 fish transect-1
and 5.33 ± 2.73 respectively). Abundance did not differ between habitat
types, levels of exposure or fishing pressure, however there was significant difference between levels of wave
action (χ2 = 10.38; p = 0.006). There was higher abundance at sites of medium wave action than at high or low
levels (Appendix 5). Approximately 9% of the observed variance in lutjanid abundance was explained by % rock
(R2 = 0.089, F = 6.28, t = -2.51, p = 0.02) and the remaining variables were excluded by the model.

Blue Ventures Conservation Report
24
(d)
0
50
100
150
200
(b)
0
50
100
150
200
250
(c)
Ab
un
da
nce
0
20
40
60
80
100
120
(e)
Site
AB
O_
L
AB
O_
S
AK
E_
B
AK
E_
SL
AK
E_
SR
AT
W
C3
P
MIE
MIE
_I
MIE
_O
MU
T
PA
R
PT
F
WP
T
Ab
un
da
nce
0
5
10
15
20
25
30
(a)A
bu
nd
ance
0
20
40
60
80
(f)
Site
AB
O_
L
AB
O_
S
AK
E_
B
AK
E_
SL
AK
E_
SR
AT
W
C3
P
MIE
MIE
_I
MIE
_O
MU
T
PA
R
PT
F
WP
T
0
2
4
6
8
10
12
14
16
Figure 3.5. Abundance (mean individuals transect-1 ± SE) by site of major fish families: (a) acanthuridae, (b) carangidae (c) labridae (d) pomacentridae (e) scaridae and (f) serranidae.

Blue Ventures Conservation Report
25
Fish species richness
Mean fish species richness and diversity were compared across all sites (Figure 3.6.) and varied significantly (χ2
= 28.18; p = 0.009). Overall species richness was 11.69 ± 0.52 species transect-1
across all sites, with the highest
number of species observed at Akitakyi Bay Big (16.17 ± 2.48 no. of species per transect) and the lowest
observed at Abokwe Seaward (7.67 ± 1.67). There was a significant difference in SpR between sites of different
exposure (χ2 = 13.44; p = 0.001) and wave action (χ
2 = 17.24; p = 0.0002). SpR was significantly higher in
sheltered sites than in both semi-exposed and exposed sites (Appendix 4), and higher in low wave action sites
than in sites with medium or high levels of wave action (Appendix 5). About 16.4% of variation in species
richness was explained by %Rock, complexity and sand, SpR having a positive relationship with both variables
(Table 3.5.).
Table 3.5. Summary of multiple regression analysis results on the relationship between species richness and benthic habitat variables.
Predictor R2 F t p
Overall 0.16 4.53 1.36 0.01
% Rock
4.72 2.17 0.03
Complexity 8.54 2.92 0.01
Sand
6.58 2.57 0.01
Fish species diversity
Simpson’s diversity (SDI) did not significantly differ between sites (χ2 = 21.35; p = 0.07). Overall SDI was 0.64 ±
0.02. The highest SDI was observed at Princess Town Fort (0.83 ± 0.03), with other sites including Miemia,
Miemia Inner, Akitakyi Small (left and right), exhibiting diversity index >8. The lowest diversity index was
observed at Miemia Outer (0.587 ± 0.03 SDI) (Figure 3.6.).


Blue Ventures Conservation Report
27
Fish trophic level
Mean trophic level across all sites was 3.02 troph ± 0.04 and varied significantly among sites (χ2 = 32.89; p =
0.002), with highest value recorded at Miemia Outer (3.36 troph ± 0.17) and the lowest at Miemia (2.51 troph
± 0.10) (Figure 3.7.). It also varied significantly between habitat types, exposure, wave action and fishing
pressure (Figure 3.8.). Headland sites had a higher trophic level than bays and patch sites, but did not differ
from island sites. Bay, patch and island sites did not differ from one another (Appendix 3). Trophic level was
significantly higher in exposed sites than in sheltered or semi-exposed sites (Appendix 4).
Site
AB
O_L
AB
O_S
AK
E_
B
AT
W
C3
P
MIE
MIE
_I
MU
T
PA
R
PT
F
WP
T
AK
E_
SR
AK
E_
SL
MIE
_O
Mean T
rophic
Level
0
1
2
3
4
Figure 3.7. Mean trophic level (TL) of fish community in the study area.
Trophic level was significantly higher in medium wave action sites than in both low and high wave action sites.
It was also higher in sites with low wave action than sites with high wave action (Appendix 5). Sites with high
fishing pressure exhibited higher trophic level than low fishing pressure sites but did not vary significantly from
sites of medium levels of fishing pressure (Appendix 6). Out of the benthic habitat variables, trophic level
showed significant relationship only with depth. It increased with depth (R2 = 0.32, F = 26.43, t = 5.14, p
<0.0001; Figure 3.9.).


Blue Ventures Conservation Report
30
Site
AB
O_L
AB
O_
S
AK
E_B
AK
E_S
L
AK
E_S
R
AT
W
C3P
MIE
MIE
_I
MIE
_O
MU
T
PA
R
PT
F
WP
T
Bio
ma
ss (
Kg h
a-1
)
0
200
400
600
800
1000
1200
1400
Figure 3.10. Distribution of total fish biomass by site.

Blue Ventures Conservation Report
31
Fishing Pressure
Low Med High
0
200
400
600
800
1000
Habitat Type
Bay Headland Patch Island
Bio
mass (
Kg h
a-1
)
0
200
400
600
800
1000
Wave Action
Low Med High
Bio
mass (
Kg h
a-1
)
0
200
400
600
800
1000
Exposure
Exposed Semi exposedSheltered
0
200
400
600
800
1000(a) X
2 = 9.84, p = 0.02 (b) X
2 = 2.49, p = 0.29
(c) X2 = 5.12, p = 0.08 (d) X
2 = 13.63, p = 0.001
Figure 3.11. Comparison of total fish biomass across (a) habitat types, (b) exposure, (c) wave action and (d) fishing pressure
Biomass of fish families
The first Principal Component (PC) axis explained 67.55% of the variation in biomass and separated high
biomass sites dominated by Acanthuridae, Scaridae and Lutjanidae from other sites that had low biomass. The
2nd
PC axis explained a further 19.58% of the variation, separating sites of high acanthurid biomass from sites
with high lutjanid biomass (Figure 3.12.).


Blue Ventures Conservation Report
33
Figure 3.13. Percentage contribution of major fish family groups to total biomass
Biomass of labrids was highest at both Miemia Inner (141.96 kg ha-1
± 82.75) and Paradise Beach (141.67 kg ha-
1 ± 40.50) while lowest at Abokwe Leeward (10.41 kg ha
-1 ± 6.33) (Figure 3.14.b). There was no significant
relationship between labrid biomass and the benthic habitat variables considered.
Lutjanids had highest biomass at Miemia Inner (269.12 kg ha-1
± 163.96), Abokwe Seaward (181.33 kg ha-1
±
181.33) and Atwiwa (159.82 kg ha-1
± 82.59). The family however was absent from transects at Abokwe
Leeward, Akitakyi Small, Cape Three Points and West Point, with low biomass also observed at Princess Town
Fort (0.07 kg ha-1
± 0.07) and Akitakyi Big (2.20 kg ha-1
± 1.59) (Figure 3.14.c). Biomass differed significantly
between habitat types (χ2 = 7.94; p = 0.05) and fishing pressure (χ
2 = 7.66; p = 0.02).

Blue Ventures Conservation Report
34
Serranidae
Site
AB
O_L
AB
O_S
AK
E_B
AK
E_S
L
AK
E_S
R
AT
W
C3P
MIE
MIE
_I
MIE
_O
MU
T
PA
R
PT
F
WP
T
0
10
20
30
40
50Scaridae
Site
AB
O_L
AB
O_S
AK
E_B
AK
E_S
L
AK
E_S
R
AT
W
C3P
MIE
MIE
_I
MIE
_O
MU
T
PA
R
PT
F
WP
T
Bio
mass (
Kg h
a-1
)
0
200
400
600
Pomacentridae
0
20
40
60
80
100Lutjanidae
Bio
mass (
Kg h
a-1
)
0
100
200
300
400
500
Labridae
0
100
200
300
400Acanthuridae
Bio
mass (
Kg h
a-1
)
0
100
200
300
400
Figure 3.14. Biomass of major fish families by survey site

Blue Ventures Conservation Report
35
It was significantly different between headland and patch sites, but there was no significant difference
between other types of habitat (Appendix 3). Sites experiencing low and medium levels of fishing pressure had
significantly higher biomass than sites exposed to high fishing pressure (Appendix 6).
Pomacentrid biomass differed significantly between sites (χ2 = 28.21; p = 0.01) with highest biomass observed
at Abokwe Seaward (55.10 kg ha-1
± 12.79) and Atwiwa (51.75 kg ha-1
± 20.16) while the lowest biomass was
observed at Princess Town Fort (1.16 kg ha-1
± 0.36) and West Point (1.37 kg ha-1
± 0.46) (Figure 3.14.d).
Biomass showed significant difference between habitat types (χ2 = 10.73; p 0.01); it was significantly lower at
headland sites than at bay and patch sites but was not different from that observed at island sites (Appendix
3).
Overall scaridae contributed the largest percentage to total biomass (28.64%) while labrids, lutjanids and
acanthurids contributed 17.38%, 15.83% and 14.74% respectively. Pomacentrids, despite their small body size,
had a relatively high biomass and contributed 6.13% to the total biomass (Figure 3.13). Scarid biomass was
highest at Miemia Inner and Atwiwa (390.73 kg ha-1
± 211.84 and 281.69 kg ha-1
± 236.24 respectively), while
they were completely absent at Cape Three Points. Biomass was low at Miemia Outer (0.11 kg ha-1
± 0.11),
Abokwe Leeward (0.24 kg ha-1
± 0.22) and West Point (3.47 kg ha-1
± 2.25) (Figure 3.14e). There was significant
difference in scarid biomass between levels of fishing pressure (χ2 = 8.30; p = 0.02), sites experiencing low
fishing pressure having significantly higher fish biomass than sites exposed to medium or high fishing pressure
(Appendix 5).
Serranid biomass significantly varied between sites (χ2 = 29.33; p = 0.006) and ranged from the lowest at
Miemia Outer (0.12 kg ha-1
± 0.06) to the highest at Princess Town Fort (35.30 kg ha-1
± 6.49)(Figure 3.14.f).
There was significant difference between habitat types (χ2 = 11.60; p = 0.009), exposure (χ
2 = 9.69; p = 0.008)
and wave action (χ2 = 8.99; p = 0.01), but not between levels of fishing pressure (χ
2 = 4.37; p = 0.11). Biomass
was significantly higher at headland sites than at bay and patch sites, which did not differ from island
locations. Bay, patch and island sites did not differ from each other (Appendix 3). It was also higher at exposed
sites than sheltered or semi-exposed sites (Appendix 44) and at sites experiencing medium levels of wave
action than sites of low or high levels of wave action (Appendix 5).

Blue Ventures Conservation Report
36
Fish size distributions
Fish body length ranged from 4 cm to 85 cm. The two smallest categories (3-5 cm and 5-10 cm) were the most
abundant with 64.85% of fish observed being <10 cm in length, and 91.32% were <20 cm (Figure 3.15.).
Figure 3.15. Size frequency distribution of fish in the study area

Blue Ventures Conservation Report
37
Site
AB
O_L
AB
O_S
AK
E_B
AK
E_S
L
AK
E_S
R
AT
W
C3P
MIE
MIE
_I
MIE
_O
MU
T
PA
R
PT
F
WP
T
frequency
0
5
10
15
20
25
30
Figure 3.16. Fish size distribution by site. Lower and upper boundaries of a box represent the interquartile range (25% to 75% values) and is divided at the median value (50%), whiskers represent 10% and 90% of observations, and values outside of this range not shown
The overall mean length of fish observed was 10.15 cm ± 0.08 SEM. Length significantly varied between sites
(χ2 = 845.65; p < 0.0001); it was highest at Akitakyi Small (12.64 cm ± 0.42 SEM) and Miemia Inner (12.58 cm ±
0.25 SEM) and smallest at Abokwe Seaward and Abokwe Leeward (6.80 cm ± 0.25 and 6.87cm ± 0.18
respectively). Eight of the 14 sites surveyed exhibited mean length of fish <10 cm (Figure 3.16.).
Fish size varied significantly between habitat types, and levels of exposure, wave action and fishing pressure (p
< 0.05; Figure 3.17.). Bay and patch sites had significantly larger fish than headland and island sites, with island
sites having the smallest size (Appendix 3). Semi-exposed sites had significantly larger fish than both sheltered
and exposed sites, with sheltered sites also having significantly larger fish than exposed sites (Appendix 4).

Blue Ventures Conservation Report
38
Wave Action
Low Med High
Siz
e (
cm
)
0
20
40
60
80
Fishing Pressure
Low Med High
Siz
e (
cm
)
0
20
40
60
80
Habitat Type
Island Bay Patch Headland
Siz
e (
cm
)
0
20
40
60
80
Exposure
ShelteredSemi Exposed Exposed
Siz
e (
cm
)
0
20
40
60
80
(a) X2 = 609.50, p < 0.0001 (b) X
2 = 259.09, p < 0.001
(c) X2 = 269.23, p < 0.0001 (d) X
2 = 4.37, p < 0.0001
Figure 3.17. Size (length) distributions of fish by (a) Habitat type, (b) exposure, (c) wave action and (d) fishing pressure. Lower and upper boundaries of a box represent the interquartile range (25% to 75% values) and is divided at the median value (50%), whiskers represent 10% and 90% of observations.
Sites with high levels of wave action had significantly larger fish than sites with low and medium levels of wave
action. Low wave action sites also exhibited larger fish size than medium wave action sites (Appendix 5). Sites
experiencing low levels of fishing pressure had significantly larger fish than sites exposed to medium and high
fishing pressure, while sites of medium fishing pressure had larger fish than sites with high levels of fishing
pressure (Appendix 6).

Blue Ventures Conservation Report
39
Invertebrate community structure
A total of 20 discrete macro faunal taxa were recorded during the course of the survey. Of these, eight (40%)
were mollusks, four were crustacean (20%), four Echinoids (20%) and there were three taxa each from three
echinoderm classes (Asteroidea, Ophiuroidea and Holothuroidea, 15%). Representatives of the Polychaeta
(fire worm) made up the remaining 1 taxon (5%). In terms of abundance the Echinoidea were the most
dominant, contributing 53.7% of the 4582 individuals recorded in total. The second and third greatest
contribution to total abundance was made by the Mollusca and Crustacea (36.5% and 9.3%, respectively). The
disproportionately high abundances of echinoids and gastropods were due to dominance of the pencil urchin
Eucidaris tribuloides var Africana and the gastropod Cerithium sp.
Table 3.6. Summary results of Principal Component Analysis (PCA) on invertebrate distribution. Eigen vector of the two most important taxa, Cerithium sp. and Eucidaris tribuloides presented. The remaining taxa had low eigenvector scores (-0.002 to 0.07 on the first PC axis and -0.04 to 0.01 on the second axis), hence not presented.
PC properties PC-Axis 1 PC-Axis 2
Eigen value 4610.30 2105.05 Cum Percent 66.67 97.11
Taxon Contribution (Eigenvector)
Cerithium sp. Gastropoda 0.93 0.37
Eucidaris tribuloides Echinoidea -0.36 0.93
These two taxa also made the highest contribution to the scores of the two main Principal Component axes,
therefore, were identified as the most important invertebrate taxa (Table 3.6.). There was a significant
difference in the distribution of both species between sites. Eucidaris tribuloides was most abundant at
Princess Town Fort followed by the seaward side of Abokwe Island (Table 3.7). Abundance was lowest at
Abokwe Island Leeward, left side of Akitakyi Small Bay and both the main bay and inner patch at Miemia.
Cerithium sp. had the highest abundance at Paradise Beach, which was followed by Abokwe Island Leeward
(Table 3.7). Akitakyi Big and Miemia Inner Patch had low abundance while Cerithium sp. was not observed in
the remaining sites. Analysis by habitat, exposure and wave energy also showed significant effects in both
species (Table 3.8). E. tribuloides had a higher abundance on headlands than on bays and patches, on exposed
sites than on sheltered and semi-exposed sites and on areas of medium wave strength than in low and high
wave action areas. Cerithium sp. had highest abundance in bays and no animals were recorded on headlands.

Blue Ventures Conservation Report
40
Table 3.7. Abundance of the two most dominant invertebrate taxa by site. Kruskal-Wallis Chi-Squared (K-W 2) and
significance level (p) presented. ND: No data.
Eucidaris tribuloides Cerithium sp. By site
K-W 2 p K-W 2 p
32.01 0.0008 27.55 0.004
Mean SEM Mean SEM
Abokwe Isl leeward 4.3 4.3 90.0 5.8 Abokwe Isl seaward 88.7 9.5 0.0 0.0
Akitakyi Big 24.3 4.8 1.7 1.7
Akitakyi Small - Left 8.7 2.6 0.0 0.0
Akitakyi Small - Right ND ND ND ND
Atwiwa 42.4 0.7 0.0 0.0
Cape Three Points ND ND ND ND
Miemia Bay 4.7 0.3 0.0 0.0
Miemia Inner Patch 5.0 1.7 6.5 4.4
Miemia Outer Patch 37.7 11.1 0.0 0.0
Mutrakni Point 42.3 16.9 0.0 0.0
Paradise Beach 17.8 7.5 216.7 101.4
Princess Town 175.0 32.4 0.0 0.0
West Point 67.8 13.2 0.0 0.0
Abundance was higher on exposed and semi-exposed sites than sheltered sites and was highest in low energy
sites while no animals were recorded in sites of medium wave energy strength. Results of step-wise multiple
regression on the relationship between abundance of E. tribuloides and Cerithium sp. and biotic and abiotic
factors are provided on Table 3.9.. Abundance of E. tribuloides was mainly explained by sponge cover and
lethrinid and serranid biomass (Table 3.9A). The relationship with sponge cover and lethrinid biomass was
positively strong while that with lethrinid biomass strongly negative. There was also a significant relationship
with barnacle (-ve) and gorgonian cover (+ve). Cerithium sp. had a positive relationship with monacanthid
biomass and fleshy algal cover and a negative relationship with pomacentrid biomass (Table 3.9.B).

Blue Ventures Conservation Report
41
Table 3.8. Abundance of the two most abundant invertebrate taxa by habitat type (A), exposure (B) and wave strength
(C). Kruskal-Wallis Chi-Squared (K-W 2) and significance level (p) indicated.
Eucidaris tribuloides Cerithium sp.
A. By habitat type
K-W 2 p K-W 2 p
11.8 0.008 8.07 0.05
Mean SEM Mean SEM
Bay 16.3 3.3 72.8 40.2
Headland 77.7 15.0 0.0 0.0
Island 46.5 19.4 45.0 20.3
Patch 20.7 6.1 3.5 2.5
B. By exposure
K-W 2 p K-W 2 p
8.24 0.02 6.34 0.04
Mean SEM Mean SEM
Exposed 62.5 9.3 0.0 0.0
Semi-exposed 34.0 12.0 55.8 30.6
Sheltered 22.2 4.9 25.5 12.6
C. By wave strength
K-W 2 p K-W 2 p
20.7 <0.0001 11.4 0.003
Mean SEM Mean SEM
Low 20.6 4.0 92.9 41.5
Medium 73.9 11.5 0.0 0.0
High 5.8 1.1 3.3 2.3
None of the taxa were universally present throughout the survey area, with 16 of the 20 taxa absent from 80%
of the sites. The most frequently recorded taxon, occurring in 50 of the 52 transects, was the pencil urchin
Eucidaris tribuloides var Africana, with a frequency of 96%, whilst the talon crab Percnon gibbesi was also
frequently encountered (75% of transects). The generally low frequencies of occurrence indicated that the
vast majority of taxa were either rare or patchily distributed throughout the survey area.
The degree of variability seen in the number of taxa was small, with between 4 and 11 taxa recorded per site
(Table 3.10.)

Blue Ventures Conservation Report
42
Table 3.9. Summary of step-wise multiple regression analysis on A) Eucidaris tribuloides and B) Cerithium sp. in western Ghana.
A. Eucidaris tribuloides var Africana
R2adj ANOVA F p
0.37 9.08 <0.0001
Term Estimate F Ratio p
Ephippidae -0.14 4.68 0.04
Depth 7.65 8.27 0.007
Gorgonia 77.62 10.85 0.002
B. Cerithium sp.
R2adj ANOVA F p
0.26 5.19 <0.0001
Term Estimate F Ratio p
Percent rock -1.81 14.72 0.0004
Rugosity 4.55 0.51 0.48
Labridae 0.04 3.86 0.06
Lutjanidae -0.01 5.61 0.02

Blue Ventures Conservation Report
43
Table 3.10. Diversity of invertebrates by site
Site Numb
er
of
Taxa
[S]
Species
richness
[DMG]
Pielou’s
equitability
[J']
Simpson’s
dominance
D [1-λ]
Shannon-
Wiener diversity
[H']
Abokwe
Leeward
5 0.806 0.536 0.863 0.507
Abokwe
Seaward
11 2.167 0.256 0.615 0.229
Akitakyi Big 8 1.956 0.465 0.968 0.502
Akitakyi Small
Left
7 2.415 0.533 1.038 0.502
Atwiwa 11 2.432 0.490 1.174 0.505
Miemia 4 0.921 0.469 0.650 0.370
Miemia Inner 6 1.610 0.820 1.470 0.793
Miemia Outer 4 0.731 0.705 0.977 0.555
Mutrakni Point 8 1.638 0.255 0.530 0.235
Paradise Beach 10 1.622 0.292 0.673 0.284
Princess Town 4 0.580 0.053 0.073 0.023
West Point 10 2.103 0.144 0.331 0.121
Mean 7 1.582 0.418 0.780 0.385
SD 2.74 0.67 0.23 0.38 0.22


Blue Ventures Conservation Report
45
Figure 3.19. Mean cover (SEM) of major benthic groups.
Four distinct site groups were identified based on PCA (Figure 3.20,Table 3.11.). The leeward side of Abokwe
Island and Miemia Outer Patch form separate clusters. The remaining sites are classified into two distinct
groups. Abokwe leeward side had the highest cover of sand and fleshy algae. Although coralline cover was
relatively higher than the other benthic/substrate groups in most sites, it was particularly high at Miemia
Outer Patch, making the site a distinct cluster of its own. Sites in cluster 2 had the highest cover of turf and
blue-green algae. Sites in cluster 3 did not associate with a specific benthic/substrate group but had relatively
high cover of corallines, turf and blue-green algae.
Substrate/benthos
Anem
one
Antipath
aria
Blu
e-g
reens
Barn
acle
CC
A
Gorg
onia
Sand
Sponge
Art
icula
te c
ora
llines
Fle
shy a
lgae
Hard
cora
l
Tunic
ate
Turf
alg
ae
Zoanth
id
Cover
(%)
0
10
20
30
40
50


Blue Ventures Conservation Report
47
Table 3.11. Composition of the major benthic/substrate groups by site clusters identified by Principal Component Analysis (PCA)
Crustose
corallines Turf algae Fleshy algae
Blue-green
algae Sand
Group Mean SEM Mean SEM Mean SEM Mean SEM Mean SEM
1 27.5 9.7 7.4 8.1 21.7 5.7 0.0 0.0 40.9 7.6
2 18.2 4.1 39.4 3.4 10.6 2.4 12.7 3.3 12.1 3.2
3 51.4 2.9 17.8 2.4 8.2 1.7 6.7 2.3 11.4 2.3
4 88.0 9.7 0.0 0.0 0.0 0.0 1.5 7.7 9.3 7.6
There was significant variation between sites in all the main five substrate/benthic groups identified by PCA
(Table 3.11.). Crustose coralline cover was highest at Miemia Outer Patch and lowest at Akitakyi Small. Sites
with low coralline cover generally had high cover of turf algae with the exception of the exposed site at
Abokwe Island. At this site and the left side of Akitakyi Small, sand and blue green algae were the respective
dominant benthic groups. Mutrakni Point and the right side of Akitakyi Small had a relatively high cover of blue
green algae.
We also analysed the variation in benthic/substrate groups among bays, headlands, patch and islands (Table
3.13.A). Significant variation was detected in corallines, blue-green and fleshy algae. Turf algae and sand did
not reveal any significant difference. Blue-green cover was higher in bay and headland than in island and patch
while corallines and fleshy algae had opposite patterns, corallines having higher cover in headland and patch
than in bays and islands.

Blue Ventures Conservation Report
48
Figure 3.21. Percentage cover proportions of the main benthic/substrate groups in the study area. The vertical line in the middle separates the six sites with low coralline cover to the left from the eight high coralline cover sites (right).
The distribution of crustose corallines, fleshy algae and sand was significantly influenced by exposure,
corallines and fleshy algae showing the strongest response (Table 3.13.B). Corallines had higher cover on
exposed and semi-exposed sites than on sheltered sites while both fleshy algae and sand were higher on
sheltered and semi-exposed areas. Turf and blue-green algae didn’t respond to variations in exposure.
Benthic/substrate group
Ab
okw
e Isl E
xp
Ab
okw
e Isl S
he
lt
Ake
takyi B
ig
Ake
takyi S
ma
ll -
L
Ake
takyi S
ma
ll -
R
Atw
iwa
Ca
pe
Th
ree
Po
ints
Mie
mia
Ba
y
Mie
mia
In
ner
Pa
tch
Mie
mia
Ou
ter
Pa
tch
Mu
tra
kin
i P
oin
t
Pa
rad
ise B
ea
ch
Prin
ce
s T
ow
n
We
st P
oin
t
Co
ve
r (%
)
0
20
40
60
80
100
Crustose corallines
Turf algae
Fleshy algae
Blue-green algae
Sand
Other

Blue Ventures Conservation Report
49
Table 3.13. Composition of major benthic groups on near shore rocky reefs of Western Ghana. Kruskal-Wallis (K-W) 2 and probability (p) provided.
Crustose
corallines Turf algae Fleshy algae
Blue-green
algae Sand
K-W 2 p K-W 2 p K-W 2 p K-W 2 p K-W 2 p
36.47 0.0005 29.91 0.005 40.34 0.0001 35.18 0.0008 34.18 0.001
Site Mean SEM Mean SEM Mean SEM Mean SEM Mean SEM
Abokwe Isl Exposed 27.5 9.7 7.4 7.9 21.7 3.8 0.0 5.8 40.9 6.5
Abokwe Isl Sheltered 21.9 9.7 54.5 7.9 3.7 3.8 4.3 5.8 9.0 6.5
Akitakyi Big 23.5 6.9 31.0 5.6 11.2 2.7 9.4 4.1 20.4 4.6
Akitakyi Small - Left 7.6 11.9 27.8 9.7 9.6 4.6 46.2 7.1 8.5 8.0
Akitakyi Small - Right 10.1 9.7 44.7 7.9 23.6 3.8 18.2 5.8 0.2 6.5
Atwiwa 19.3 9.7 43.4 7.9 3.9 3.8 0.0 5.8 13.1 6.5
Cape Three Points 56.3 9.7 30.5 7.9 2.1 3.8 0.3 5.8 5.2 6.5
Miemia Bay 52.6 9.7 13.7 7.9 28.3 3.8 2.0 5.8 3.3 6.5
Miemia Inner Patch 59.5 7.5 14.6 6.1 13.7 2.9 0.0 4.5 11.7 5.1
Miemia Outer Patch 88.0 9.7 0.0 7.9 0.0 3.8 1.5 5.8 9.3 6.5
Mutrakni Point 57.0 6.9 16.8 5.6 0.1 2.7 21.8 4.1 2.3 4.6
Paradise Beach 45.6 6.9 11.7 5.6 15.6 2.7 0.0 4.1 27.1 4.6
Princess Town 63.7 9.7 25.5 7.9 1.1 3.8 7.2 5.8 0.2 6.5
West Point 39.5 5.9 19.2 4.8 2.6 2.3 8.8 3.6 16.0 4.0

Blue Ventures Conservation Report
50
Table 3.13. Distribution of major benthic groups on near shore rocky reefs of Western Ghana by habitat type (A), exposure (B) and wave
strength (C). Kruskal-Wallis (K-W) 2 and probability (p) provided.
Crustose
corallines Turf algae Fleshy algae Blue-green algae Sand
A. By habitat type
K-W
2 p
K-W
2 p
K-W
2 p
K-W
2 p
K-W
2 p
11.3 0 13.2 0.004 5.4 0.2 23.3 <0.0001 1.9 0.6
Habitat type Mean SEM Mean SEM Mean SEM Mean SEM Mean SEM
Bay 30.9 5 24.3 4.1 16.8 1.8 10.5 2.9 15.6 3.1
Headland 50.9 5 21.1 4.1 1.5 1.8 11.2 2.9 7.9 3.1
Island 24.7 9.1 30.9 7.4 12.7 3.4 2.1 5.4 24.9 5.7
Patch 56.3 6.8 18.5 5.5 7.3 2.5 0.4 4 11.4 4.2
B. By exposure
K-W
2 p
K-W
2 p
K-W
2 p
K-W
2 p
K-W
2 p
8.1 0.02 3.21 0.2 13.41 0.001 2.65 0.27 11.14 0.004
Exposure
level Mean SEM Mean SEM Mean SEM Mean SEM Mean SEM
Exposed 44.6 5.2 25.5 4 1.9 2.0098 10.7 3 9.2 3
Semi-exposed 49.2 4.6 18 3.6 13.6 1.7976 7.2 2.7 11.1 2.7
Sheltered 23.4 6.7 28.2 5.2 12 2.5946 4.7 3.9 23.7 3.9
C. By wave strength
K-W
2 p
K-W
2 p
K-W
2 p
K-W
2 p
K-W
2 p
7.8 0.02 0.2 0.9 29.7 <0.0001 5.6 0.06 18.1 0.0001
Wave
strength Mean
Std
Error Mean
Std
Error Mean
Std
Error Mean
Std
Error Mean
Std
Error
Low 30.8 5.5 22.7 4.3 13.2 1.8 3.1 3.1 24.9 2.9
Medium 51.8 4.6 22.5 3.6 1.6 1.5 9.3 2.6 8.2 2.4
High 38.5 6.5 23.4 5.1 18.7 2.1 11.8 3.7 6.6 3.4

Blue Ventures Conservation Report
51
Wave strength had significant effects on coralline, fleshy algal and sand distributions, with strongest effect on fleshy algae
and sand (Table 3.13.C). Fleshy algae had higher cover on both low and high wave action areas, corallines in areas with
medium wave action while sand associated mainly with low wave action areas. Wave action had only marginal effect on blue-
green algal distribution, areas with medium and high wave action having higher cover than those with low wave action. Wave
action had no effect on turf algal distribution.
Multiple regression results showed that acanthurid biomass was the main variable influencing blue-green algal and coralline
distribution (Table 3.14.). Blue green algal cover increased while coralline cover decreased with acanthurid biomass. Cover of
turf algae was mainly influenced by wave action showing a negative relationship. Distribution in cover of sand was mainly
explained by wave action, cover decreased as wave action increased. Fleshy algal distribution was explained by several
variables with depth, rugosity and pomacentrid biomass having negative effects whereas exposure, acanthurid, scarid and
chaetodontid biomass all had positive effects.
Table 3.14. Summary of multiple regression results on the relationship between benthic/substrate and environmental and biotic variables.
Dependent R2adj ANOVA F p Main explanatory factor Relationship
Corallines 0.62 4.62 0.032 Acanthuridae -ve
Turf algae 0.21 4.35 0.06 Wave action -ve
Fleshy algae 0.99 502.52 0.0001 Depth -ve
Exposure +ve
Rugosity -ve
Acanthuridae +ve
Chaetodontidae +ve
Pomacentridae -ve
Scaridae +ve
Blue-greens 0.88 16.65 0.0008 Acanthuridae +ve
Sand 0.71 8.53 0.004 Urchin abundance -ve

Blue Ventures Conservation Report
52
4. Discussion
This study investigated the general status of the marine habitat and fisheries of the shallow near shore rocky reefs of western
Ghana. It followed a holistic approach that included key ecological variables and indicators of ecosystem health and provides
baseline information on the fish, invertebrate and benthic communities of this less studied environment. Although it
represents only a small proportion of Ghana’s coastal area (2%) (Berncsek 1986; Armah and Amlalo 1998) and probably
contributes less to the local fisheries, notably dominated by pelagic and to some extent soft bottom fish stocks, it could play
a significant role in contributing to the productivity and marine biodiversity of the area. Situated at the interface between the
terrestrial environment, intertidal zone and the deep sea, it is thought to play a critical ecological role in linking these
different environments and it also supports a small artisanal fishing community. This study provides insight into the impact
fishing has had within this habitat, drawing a parallel with the well documented declining status of Ghana’s pelagic and
demersal fisheries.
Fish community structure and biomass
Fish community structure and biomass varied by site in relation to fishing and physical environmental parameters. The
dominance of low trophic level and small bodied fish and near absence of large sized carnivorous fishes suggests that fishing
pressure plays a prominent role in structuring the community. Because all the study sites are open to fishing, including illegal
and destructive fishing, and there is lack of baseline ecological data, the effects of fishing are difficult to detect. The measure
of fishing pressure used in this study probably doesn’t reflect historical fishing and therefore results should be interpreted
with caution.
In the absence of large sized fish belonging to higher trophic levels (see above) the sites are categorised into three groups by
PCA: 1) those dominated by large numbers of Acanthuridae, 2) those dominated by Pomacentridae and Carangidae and 3)
those dominated by Labridae Figure 3.3.). The lack of correspondence between biomass and abundance has been reported in
other ecosystems and even becomes reversed in areas where top predatory fish dominate the biomass (Newman et al.
2006). All low biomass sites had a lower contribution by one of the larger bodied fish families of scaridae, lutjanidae or
acanthuridae.
The two dominant families were represented mainly by a single species each (Pomacentridae: Stegastes imbricates; Labridae:
Thalassoma newtonii). This dominance by small sized fishes belonging to lower trophic groups reflects the patterns in size
frequency distribution and trophic composition (Figure 3.15. and Error! Reference source not found.). The positive
elationship between trophic level and depth is probably linked with the distribution of the grouper, Cephalopholis nigri
(Figure 3.9). The opposite pattern may be explained by the abundance of low trophic level acanthurid and pomacentrid
species in shallow sites (Figure 3.5.).
The significant positive relationship between species richness and Simpson’s Diversity indicates that evenness increases
(dominance decreases) with number of species. This may be due to simple correlation but may also reflect that high diversity
sites were those experiencing intermediate levels of disturbance (Connell 1978). As disturbance increases, diversity
decreases and dominance increases. There were probably no low disturbance areas represented in the study to show full
scale of the diversity-disturbance unimodal relationship.

Blue Ventures Conservation Report
53
The low contribution to the total biomass by top predators indicates that most of the reefs are far from being in a pristine
state. On coral reefs, where fish and benthic community structure is well investigated, fish biomass is considered as an
indicator reef health and high biomass correlated with biomass of large-sized apex predators (Newman et al. 2006; Williams
et al. 2011). On healthy pristine environments up to 80% of the biomass is composed of top predators, including sharks,
barracudas, snappers and groupers (Williams et al. 2011). As these top predators are selectively removed by fishing, small
sized predators, planktivorous and herbivorous fish increase in numbers and make greater contributions to the total biomass
– a characteristic of severely fished reefs. The highest biomass observed in this study (1000 kg ha-1
) can be indicative of the
potential of the area. However it is notable that 69% of this maximum biomass is contributed by lower trophic groups, and so
potential biomass could be much higher.
The opposite relationship with depth of abundance and biomass is explained predominantly by the small sized pomacentrids
and labrids that dominate abundance and occur mostly at shallower depths while larger grazers and predatory fish that
contribute significantly to biomass are mainly present in deeper areas.
The three dominant carangids were all semi-pelagic planktivorous juveniles, and the positive relationship between
abundance and sand cover is probably related to the occurrence of sand in more wave-swept high energy shallow areas.
Figure 4.1. Cephalopholis nigri whose population may be growing rapidly following the removal of other larger grouper species
Most of the fisheries in these areas are dominated by one-man unmotorised canoes using hook and line or deploying set nets
at the transition between the rocky and soft bottom habitats. Hook and line fishing is known for being very selective

Blue Ventures Conservation Report
54
targeting mostly carnivorous, and piscivorous fish. Large predatory fishes were virtually absent and most of the piscivore
fishes encountered in the underwater visual surveys and observations of catch by local fishers were small sized groupers. The
rock hind Cephalopholis nigri (Serranidae) was the only commercially important species observed in significantly high
numbers. This is a small sized fish (Max size = 30 cm) in comparison to other targeted species but is commonly targeted by
the one-man unmotorised canoes (authors’ observations). Without long term time series abundance data it is difficult to
establish whether the current dominance of C.nigri existed before or is a new observation. The high abundance of this
species, in both catches and ecological surveys, probably indicates a high turn-over rate related to its size and its low
vulnerability to fishing pressure. Many predatory species including groupers are known to have significant dietary overlap
and shifts can occur with changes in the composition of prey species or ontogenetic changes of predatory species (Brule and
Canche 1993; Renones et al. 2002). It is likely that the high abundance of C.nigri is a recent occurrence related to
competitive release as other larger grouper species declined.
Box 4.1. Fishers’ perception about the fisheries
Out of the fishers interviewed on their view on the fisheries, 100% believed that the total catch has significantly
declined over time. About 66.7% believed that average size of fish caught has decreased, while the remaining
33.3% were of the opinion that size remained the same. Not a single fisher was of the view that the fish caught at
present are larger than a decade before. All fishers interviewed (100%) believed that they travelled farther and
spent more time out at sea and all agree that fishers with motorised boats, who can travel longer distances in a
day, catch more and catch larger sized fish.
Invertebrate community
Eucidaris tribuloides var. Africana was the most abundant and most widely distributed marine invertebrate species in the
study area. Due to lack of information, it cannot be ascertained if this high abundance is natural to the area or a recent
occurrence associated with environmental changes. Observations in other parts of the world, both tropical and temperate,
indicate that sea urchin populations show large fluctuations in response to changes in predatory fish abundance and are
thought to be important ecological indicators. Sea urchins are voracious feeders and large urchin biomass is known to bring
about significant changes in benthic community structure through grazing of algae and bioerosion of calcified substrate
(Glynn et al. 1983; McClanahan and Muthiga 1989; McClanahan and Shafir 1990). In recent decades, many herbivorous sea
urchin species have exhibited dominance and population explosions in both tropical and temperate waters (Lessios et al.
1984; Lessios 1988; Carpenter 1990). This increase is mainly associated with reduction in predation by carnivorous
invertebrates (e.g. lobsters) and fish (e.g. triggerfish, wrasses, pufferfish) (Glynn et al. 1979; McClanahan 2000).
Cidaroid urchins are mostly omnivorous although E. tribuloides is believed to feed mainly on sessile invertebrates, such as
corals, sponges and gorgonians (McPherson 1968; McClintock et al. 1982). The strong positive relationship of E. Tribuloides
abundance with gorgonian cover and weak negative relationship with the biomass of Spadefish (Ephippidae) (Table 3.9.A)
suggests that these two factors probably interact in controlling its abundance. Our data indicates that many of the sites are
overfished and lack sufficient biomass of predators to control overgrowth of prey populations. This consistently low biomass
of predatory fish across all sites limits the ability to detect variation in abundance of prey species.

Blue Ventures Conservation Report
55
The extremely high abundance of E. tribuloides is most likely a result of trophic cascades related to overfishing of predatory
fish. The largest invertivorous fish observed in the study area was the black-bar hogfish (Bodianus speciosus). It is not known
if populations of this wrasse have undergone cycles in abundance in relation to fishing pressure as observed in the grey
triggerfish (Balistes capriscus) in the adjacent deep demersal environment. For nearly 20 years from the early 1970s to late
1970s, this triggerfish dominated the deep ecosystem displacing the big-eye grunt (Brachydeuterus auritus) as the most
abundant fish (Koranteng 1998, 2001b). The decline of triggerfish was followed by increases in the landings of ray, sole and
cuttlefish. These cycles were associated with shifts in trophic and competitive relationships related to fishing (Koranteng
2001a; Koranteng and Pauly 2004). It is possible that the NSRH have experienced similar cycles in the composition of
predatory fish over different periods.
Our investigation of the marine invertebrate community also included assessment of commercially important groups, such as
lobsters, shrimps and octopus. The results indicate very low densities of these groups. Lobsters are well known for being
effective sea urchin predators, particularly juvenile urchins (Tegner and Levin 1983; Lafferty 2004). In conjunction with the
reduced predation by fish related to overfishing, overharvesting of commercially important predatory invertebrate species
could have significant effects on prey species.
In both temperate and tropical areas urchin population explosions tend to be followed by epidemics (Lessios et al. 1984;
Scheibling and Stephenson 1984; Carpenter 1990) with those of greater proportion occurring in fished habitats rather than in
reserves (Lafferty 2004). For the temperate herbivorous sea urchin, Stronglocentrus droebachiensis (Echinoidea), epidemic
levels are reached at 74 individuals per m2, the threshold density for the same species is believed to be 3.72 individuals m
2.
Similarly, the well-publicised population explosion and subsequent collapse of the white spine sea urchin (Diadema
antillarum) population in the Caribbean in the early 1980s was associated with overfishing. In the absence of herbivorous
fish, the demise of D. antillarum resulted in the overgrowth and dominance of fleshy algae. E. tribuloides and other sea
urchin species were not affected during the Caribbean wide Diadema mass mortality. Isolated mass mortality of E. tribuloides
was reported in Puerto Rico in the winter of 1984-1985 but its cause was not identified (Williams 1986).
Figure 4.2. Low biomass of invertivorous fish such as Lutjanids has significant impacts on populations of prey species
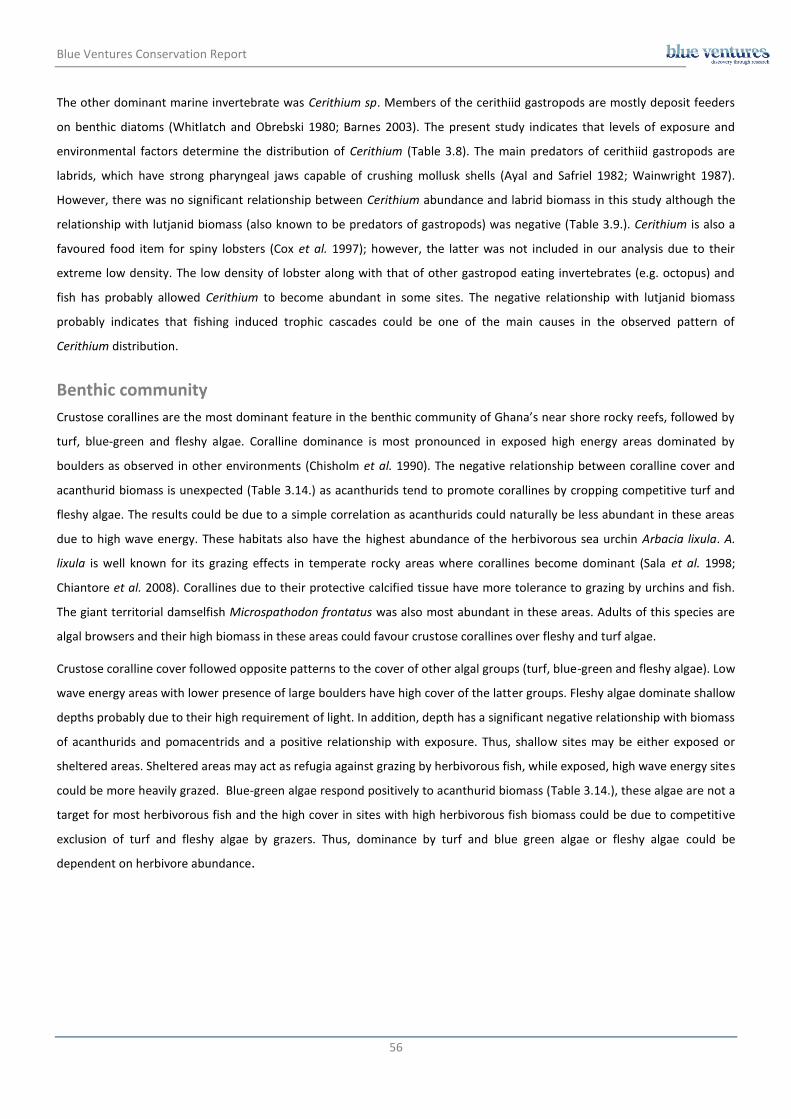
Blue Ventures Conservation Report
56
The other dominant marine invertebrate was Cerithium sp. Members of the cerithiid gastropods are mostly deposit feeders
on benthic diatoms (Whitlatch and Obrebski 1980; Barnes 2003). The present study indicates that levels of exposure and
environmental factors determine the distribution of Cerithium (Table 3.8). The main predators of cerithiid gastropods are
labrids, which have strong pharyngeal jaws capable of crushing mollusk shells (Ayal and Safriel 1982; Wainwright 1987).
However, there was no significant relationship between Cerithium abundance and labrid biomass in this study although the
relationship with lutjanid biomass (also known to be predators of gastropods) was negative (Table 3.9.). Cerithium is also a
favoured food item for spiny lobsters (Cox et al. 1997); however, the latter was not included in our analysis due to their
extreme low density. The low density of lobster along with that of other gastropod eating invertebrates (e.g. octopus) and
fish has probably allowed Cerithium to become abundant in some sites. The negative relationship with lutjanid biomass
probably indicates that fishing induced trophic cascades could be one of the main causes in the observed pattern of
Cerithium distribution.
Benthic community
Crustose corallines are the most dominant feature in the benthic community of Ghana’s near shore rocky reefs, followed by
turf, blue-green and fleshy algae. Coralline dominance is most pronounced in exposed high energy areas dominated by
boulders as observed in other environments (Chisholm et al. 1990). The negative relationship between coralline cover and
acanthurid biomass is unexpected (Table 3.14.) as acanthurids tend to promote corallines by cropping competitive turf and
fleshy algae. The results could be due to a simple correlation as acanthurids could naturally be less abundant in these areas
due to high wave energy. These habitats also have the highest abundance of the herbivorous sea urchin Arbacia lixula. A.
lixula is well known for its grazing effects in temperate rocky areas where corallines become dominant (Sala et al. 1998;
Chiantore et al. 2008). Corallines due to their protective calcified tissue have more tolerance to grazing by urchins and fish.
The giant territorial damselfish Microspathodon frontatus was also most abundant in these areas. Adults of this species are
algal browsers and their high biomass in these areas could favour crustose corallines over fleshy and turf algae.
Crustose coralline cover followed opposite patterns to the cover of other algal groups (turf, blue-green and fleshy algae). Low
wave energy areas with lower presence of large boulders have high cover of the latter groups. Fleshy algae dominate shallow
depths probably due to their high requirement of light. In addition, depth has a significant negative relationship with biomass
of acanthurids and pomacentrids and a positive relationship with exposure. Thus, shallow sites may be either exposed or
sheltered areas. Sheltered areas may act as refugia against grazing by herbivorous fish, while exposed, high wave energy sites
could be more heavily grazed. Blue-green algae respond positively to acanthurid biomass (Table 3.14.), these algae are not a
target for most herbivorous fish and the high cover in sites with high herbivorous fish biomass could be due to competitive
exclusion of turf and fleshy algae by grazers. Thus, dominance by turf and blue green algae or fleshy algae could be
dependent on herbivore abundance.

Blue Ventures Conservation Report
57
5. Conclusions and recommendations
Summary of findings
The near shore rocky reefs of Ghana are characterised by communities typical of areas with high levels of overfishing and
associated cascading trophic effects. The near complete removal of top predatory fish by overfishing has resulted in the
release of prey species and high dominance of a few abundant species observed in the fish, invertebrate and benthic
communities. The average biomass of about 398 kg ha-1 found in this study is considered very low taking into account the
family, size and trophic composition of the community, which is dominated mostly by small to medium sized and low-trophic
groups belonging to the families Acanthuridae, Labridae, Pomacentridae and Scaridae.
This is consistent with the small catches of local fishers, also dominated by small-sized fish (often groupers). Large sized fish
in the catches are mainly herbivorous parrotfish and surgeonfish while large-sized predatory fish (grouper and snapper) were
seldom observed. The visual surveys and catch observations support the perceptions by fisher communities on decreasing
total catches, increasing effort, declining catch per unit effort (CPUE) and decreasing fish sizes and trophic levels. In addition,
the limited amount of data from experimental fishing on adjacent soft bottom habitats is in agreement with these
observations. About 23% of all fish caught were below the size of maturity, none of the small sized species (Atlantic Bumper
and African Threadfin) was below maturity size and 33% of the medium-sized Cassava Croaker (33 cm) was below the size of
maturation (Figure 5.1.).
Figure 5.1. Cassava fish (Pseudotolithus senegalensis) can reach over 1m in length; 33% of the fish caught in the experimental fishing were below length at maturity (Lmat).
These findings indicate that the mesh sizes of the set nets being used are below the minimum size required at least for some
species. We observed that many of the fishers employ illegal monofilament nets and nets below the approved mesh size

Blue Ventures Conservation Report
58
(Ghana Fisheries-Commission 2010). In some instances these are accompanied by other illegal practices, such as dynamite
and poison fishing (personal observations and focus group interviews). These observations are consistent with findings across
the globe that declining fisheries lead towards desperate measures of destructive fishing (Pauly et al. 2002; Agnew et al.
2009; Worm et al. 2009). The high rarity in commercially important invertebrate species (lobster and octopus) in the visual
surveys could also suggest that the proportion of these species in the catch has significantly declined over the years.
Dominance by corallines probably renders the reefs less productive with regard to the transfer of carbon to higher trophic
levels as they only provide food to organisms with powerful jaws, e.g. sea urchins and parrotfish (Steneck 1997). The
majorities of the corallines observed formed very thin encrusting layers and probably contribute little to reef formation.
Dominance by sea urchins often results in ecological disturbances through excessive bioerosion (herbivorous urchins)
(Carpenter 1990; McClanahan and Shafir 1990) or predation (carnivorous urchins). Large invertebrate densities might result
in disease epidemics (Carpenter 1990; Scheibling and Hennigar 1997) resulting in release and dominance of prey species
(Carpenter 1990; Scheibling and Hennigar 1997). The dominance by E. tribuloides in Ghana’s NSRH probably has caused
significant shifts in the benthic composition and may continue to do so if the population is not controlled.
In addition, dominance of one or few species may render an ecosystem less resilient to natural or human induced
environmental disturbances, such as climate change. For example, overfished Caribbean coral reefs with high nutrient and
sediment input have become dominated by fleshy algae and suffered more from the effects of coral bleaching and diseases
and have shown low post bleaching and post disease recovery (Gardner et al. 2003; Côté et al. 2005; Schutte et al. 2010).
Dominance by the sea urchin Diadema antillarum resulted in mass mortality promoting a further increase and dominance of
fleshy algae over corals – phase shift.
Ecological dominance by a few taxa and reduction in the number of large-sized charismatic megafauna (e.g. sharks, turtles
and marine mammals) could also have significant negative effects on the aesthetic and cultural values of the ecosystem with
significant socio-economic implications.
Ecological information on near shore rocky reefs of Ghana and generally in West Africa is very limited as most studies focus
on the very productive and commercially important pelagic and deep demersal fish populations (Pezennec and Koranteng
1998; Bianchi et al. 2000; Koranteng 2001b, 2001a; Koranteng and Pauly 2004). The coastal lagoons and estuaries are also
relatively well investigated (Mensah 1979; Ntiamoa-Baidu 1991; Entsua-Mensah and Dankwa 1997; Lae 1997; Entsua-
Mensah et al. 2000). The current study fills a knowledge gap concerning Ghana’s coastal and marine environment with the
findings of the present study pointing towards extreme overfishing in near shore rocky reefs of western Ghana.
Despite total fisheries catches remaining constant or showing a tendency towards decline in the pelagic and demersal
fisheries, there has been significant change in catch per unit effort (CPUE), species, trophic and size composition of the
fisheries landings (Koranteng and Pauly 2004; FAO 2010; Finegold et al. 2010). In spite of these reported declines, these two
fisheries still provide large catches of top predators, such as tuna, jacks, bream and snapper (pers. obs.). The near absence of
commercially targeted large-sized fishes (especially those belonging to Serranidae and Lutjanidae) in the near shore rocky
reefs of Ghana suggests that these habitats may even be more overfished than the above two.

Blue Ventures Conservation Report
59
Management implications
This study is an important component of the ecological, fisheries and socio-economic assessment of the coastal and marine
environment of western Ghana and intended to lead to integrated coastal management, including Ghana’s first marine
protected area (MPA). It complements other recent socio-economic and ecological studies conducted by the Coastal
Resources Conservation (CRC), University of Rhode Island, in collaboration with the Fisheries Commission, the World Fish
Center and other local and international institutes.
As described above, the near shore rocky areas of western Ghana are characterised by dominance of some groups linked to
overfishing and the ecosystem and the services that it provides will significantly benefit from the introduction of integrated
management. Some of the expected results of management would be:
Preservation of representative samples of biological diversity.
Recovery of fish populations, including that of commercially and ecologically important top predators along with
changes in fish, invertebrate and benthic community structure.
Recovery of rare species, particularly those vulnerable to fishing.
Protection of pristine habitats in order to maximize their resilience potential.
Provision of adult and larval spill-over to fished stocks in adjacent areas.
Reduction in ecological dominance.
Increase in primary and secondary productivity.
Increased catch for fishers and associated protein supply and income for local communities.
Increased aesthetic and cultural value of the ecosystem.
Reduced habitat destruction.
Promotion for the mitigation of pollution.
Provision of focal points for education about ecosystems and human interactions including control and reference
sites serving as a baseline for scientific research and ecological evaluation of changes and impacts.
The need for integration
Ghana’s coastal area lies at the centre of the Gulf of Guinea Large Coastal Ecosystem (GCLME) and any management strategy
aiming to protect a full range of life forms and populations within the GCLME will require an internationally coordinated
effort among regional countries and beyond. For example, large sized migratory fish populations such as sharks, tunas and
small pelagics will benefit less from local management because of the trans-boundary nature of stocks.
Management of pelagic fish is especially complex. With the incentive for each successive nation to fish as much as they can
while shoals are within their waters, these stocks are successively overfished as they pass through country borders. For
example, the shoals of small and large pelagic fish that rely on the seasonal upwellings within the GCLME are successively
fished by 16 different countries with Ghana accounting for approximately 21% of the catches (Perry and Sumaila 2007).
Management and enforcement strategies for these stocks cannot be developed at a local or country level but need to involve
regional, international regulation and enforcement.
Unlike pelagic and highly migratory species, many of the species in the NSRH and other demersal habitats, are expected to
have more localised distributions and substrate association, and are considered to be more responsive to local management
efforts such as MPAs. An ecosystem-based management approach involving a combination of a network of small MPAs with
multiple use zoning is believed to be the best model for the NSRH. The network of MPAs should include core ‘no take zones’

Blue Ventures Conservation Report
60
at their centres, surrounded by temporary closures and gear restriction zones. These core no-take-zones will allow full
recovery of populations, increasing size and biomass of fish stocks and will in the long term benefit adjacent common use
areas through supply of adult fish and larvae (spill-over effect).
The NSRH are spatially linked to other marine and coastal environments by currents, river discharges and larval and adult
migrations. Ecosystem-based management strategies should include spatial integration that considers the biological and
ecological connections at all scales ensuring sustainable exploitation does not compromise the resilience capacity of the
ecosystem. Empirical data regarding the ecological interconnections between the NSRH and the adjacent shallow and deep
sea habitats, the pelagic system and the lagoons and wetlands are scanty. Brief snorkelling surveys in some of the wetlands
indicate that many of the species found here were the same as those observed in the underwater visual surveys. Some of the
commercially important species observed in the underwater visual surveys (e.g. Lutjanus agennes) are the same as those
reported from catches in deep demersal rocky bottom demersal fisheries (Koranteng 1998). In addition, several of the
commercially important demersal (Bothidae, Elopidae, Haemulidae, Mugilidae, Sciaenidae, Sparidae) and pelagic species
(Clupeidae) are known to enter rivers and estuaries at some stage of their life cycle (Whitehead 1985; Quéro et al. 1990). The
pelagic upwelling in the offshore and inshore locations is believed to have a rippling effect on the fishery of the near shore
area and other adjoining habitats. Management of NSRH will benefit these and pelagic populations that come close to the
shore during the upwelling season as a result of their shoaling behaviour. For example, the Cape Three Points shoal is
considered an important spawning ground for Sardinellas during the upwelling season (Roy 1998).
Ghana’s west coast, the focus of the Hen Mpoano Initiative, supports some of the most biodiverse areas in the country. It is
also one of the densely populated areas with major industrial, agricultural, mining, subsistence farming and fisheries
activities. The beaches, cliffs, lagoons, wildlife, cultural and historical sites and coastal landscape provide great potential for
tourism development. This rich coastal area is also facing several environmental challenges including overfishing, coastal
deforestation, coastal erosion, pollution and rapid population growth. It is expected that MPA management will face
competition with other claims on the coastal area. MPAs will need to be designed systematically, integrating the
management priorities (sustainable fisheries and species conservation) with multiple stakeholder needs arising from coastal
activities and services (Villa et al. 2002; Moffett and Sarkar 2006). MPA management should also be integrated with other
existing conservation efforts, e.g. coastal forests, wetlands and wildlife, including five Ramsar sites as this will minimise costs
and maximise benefits through sharing of experience and resources.

Blue Ventures Conservation Report
61
Figure 5.2. Mangrove and lagoon habitats are known to be important nursery ground for many marine fish species

Blue Ventures Conservation Report
62
6. References
Agnew, D.J., Pearce, J., Pramod, G., Peatman, T., Watson, R., Beddington, J.R., Pitcher, T.J. (2009) Estimating the worldwide extent of illegal fishing. PLoS One 4:e4570
Allison, E.H., Perry, A.L., Badjeck, M.C., Neil Adger, W., Brown, K., Conway, D., Halls, A.S., Pilling, G.M., Reynolds, J.D., Andrew, N.L. (2009) Vulnerability of national economies to the impacts of climate change on fisheries. Fish and Fisheries 10 (2): 173-196
Ayal, Y., Safriel, U.N. (1982) Role of competition and predation in determining habitat occupancy of Cerithiidae (Gastropoda: Prosobranchia) on the rocky, intertidal, Red Sea coasts of Sinai. Marine Biology 70: 305-316
Azzarello, M.Y Van Vleet, E.S. (1987) Marine birds and plastic pollution. Marine Ecology Progress Series 37: 295-303
Bannerman, P., Quartey, R. (2005) Report on the observations on the commercial light fishing operation in Ghana. Ghana Marine Research Division (MFRD), Tema. 8 pp
Barnes, R,S,K. (2003) Interactions between benthic mollusks in a Sulawesi mangal, Indonesia: the cerithiid mud-creeper Cerithium coralium and potamidid mud-whelks, Terebralia spp. Journal of the Marine Biological Association of the UK 83: 483-487
Bianchi, G., Gislason, H., Graham, K., Hil,l L., Jin, X., Koranteng, K., Manickchand-Heileman, S., Paya, I., Sainsbury, K., Sanchez, F. (2000) Impact of fishing on size composition and diversity of demersal fish communities. ICES Journal of Marine Science 57: 558-571
Binet, D. (1997) Climate and pelagic fisheries in the Canary and Guinea currents 1964-1993: The role of trade winds and the southern oscillation. Montreuil, France, Gauthier-Villars. Oceanologica Acta 20: 177-190
Binet, D., Marchal, E. (1993) The large marine ecosystem of shelf areas in the Gulf of Guinea: long-term variability induced by climatic changes. In: Large marine ecosystems: stress, mitigation and sustainability. American Association for the Advancement of Science, Washington, DC (USA) 104-118 pp.
Brule, T., Canche, L.R.G. (1993) Food habits of juvenile red groupers, Epinephelus morio (Valenciennes, 1828), from Campeche Bank, Yucatan, Mexico. Bulletin of Marine Science 52: 772-779
Burnham, K.P., Anderson, D.R. (2002) Model selection and multimodel inference: a practical information-theoretic approach. Springer Verlag, 2
nd ed 485 pp
Carpenter, R.C. (1990) Mass mortality of Diadema antillarum. I. Long-term effects on sea urchin population-dynamics and coral reef algal communities. Marine biology 104: 67-77
Chiantore, M., Vielmini, I., Privitera, D., Mangialajo, L., Cattaneo-Vietti, R. (2008) Habitat effects on the population structure of Paracentrotus lividus and Arbacia lixula. Chemistry and Ecology 24: 145-157
Chisholm, J.R.M., Collingwood, J.C., Gill, E.F. (1990) A novel in situ respirometer for investigating photosynthesis and calcification in crustose coralline algae. Journal of Experimental Marine Biology and Ecology 141: 15-29
Choi, O., Fisher, A. (2003) The impacts of socioeconomic development and climate change on severe weather catastrophe losses: Mid-Atlantic Region (MAR) and the US. Climatic Change 58: 149-170

Blue Ventures Conservation Report
63
Chukwuone, N.A., Ukwe, C.N., Onugu, A., Ibe, C.A. (2009) Valuing the Guinea current large marine ecosystem: Estimates of direct output impact of relevant marine activities. Ocean and Coastal Management 52: 189-196
Claudet, J., Pelletier, D., Jouvenel, J.Y., Bachet, F., Galzin, R. (2006) Assessing the effects of marine protected area (MPA) on a reef fish assemblage in a northwestern Mediterranean marine reserve: Identifying community-based indicators. Biological Conservation 130: 349-369
Connell, J.H. (1978) Diversity in tropical rain forests and coral reefs. Science 199: 1302-1310
Côté, I.M., Gill, J.A., Gardner, T.A., Watkinson, A.R. (2005) Measuring coral reef decline through meta-analyses. Philosophical Transactions 360: 385-395
Cox, C., Hunt, J.H., Lyons, W.G., Davis, G.E. (1997) Nocturnal foraging of the Caribbean spiny lobster (Panulirus argus) on offshore reefs of Florida, USA. Marine and Freshwater Research 48: 671-680
Creel L (2003) Ripple effects: population and coastal regions. Population Reference Bureau Measure Communication, Washington. 8 pp
Cundell, A.M. (1974) Plastics in the marine environment. Environmental Conservation 1: 63-68
Dankwa, H.R., Gordon, C. (2002) The fish and fisheries of the lower Volta mangrove swamps in Ghana. African Journal of Science and Technology 3: 25-32
Edgar, G.J., Stuart-Smith, R.D. (2009) Ecological effects of marine protected areas on rocky reef communities - a continental-scale analysis. Marine Ecology Progress Series 388: 51-62
Entsua-Mensah, M., Dankwa, H. (1997) Traditional knowledge and management of lagoon fisheries in Ghana. Water Research Resources Institute , CSIR. Report no. 160, 31 pp
Entsua-Mensah, M., Ofori-Danson, P.K., Koranteng, K.A. (2000) Management issues for the sustainable use of lagoon fish resources. Proceedings of the International Workshop on Biodiversity and Sustainable Use of Fish in the Coastal Zone 24-27 pp
EPA/UNOPS (2004) Environmental Sensitivity Map for Coastal Areas of Ghana, Vol 2: Coastal Environment
World Resources Institute (WRI) (2003) Earth trends; country profiles: Ghana (http://earthtrends.wri.org/country profiles/index.php?theme=8)
FAO (2011) FAO Yearbook 2009 - Fishery and aquaculture statistics. FAO, Rome 107 pp FAO (2010) FishStat Plus - www.fao.org/fishery/statistics/en
Finegold, C., Gordon, A., Mills, D., Curtis, L., Pulis, A. (2010) Western Region Fisheries Sector Review, WorldFish Center
Fisheries-Commission (2010) Fisheries regulations 2010. Ghana Fisheries Commission, Accra, Ghana.
Froese, R., Pauly, D., 2000. FishBase: a global information system on fishes (http://www.fishbase.org)
Gardner, T.A., Côté, I.M., Gill, J.A., Grant, A., Watkinson, A.R. (2003) Long-term region-wide declines in Caribbean corals. Science 301: 958-960
Glynn, P.W., Wellington, G.M., Birkeland, C. (1979) Coral reef growth in the Galapagos: limitation by sea urchins. Science 203: 47-49

Blue Ventures Conservation Report
64
Glynn, P.W., Wellington, G.M., Wells, J.W. (1983) Corals and coral reefs of the Galapagos Islands. University of California Press, 330 pp
Gregory, M.R., Andrady, A.L. (2003) Plastics in the marine environment. In: Andrady AL (ed.), Plastics and the Environment. John Wiley and Sons, New Jersey pp 379-401
GSS (Ghana Statistical Service) (2007-2012) Marine fish production (http://www.statsghana.gov.gh.MFP.html)
Gulland, J., Troadec, J.P., Bayagbona, E.O. (1973) Management and development of fisheries in the eastern central Atlantic. Journal of the Fisheries Research Board of Canada 30: 2264–2275
Haakonsen, J.M., Diaw, M.C. (1991) Fishermen's migrations in West Africa. FAO (http://www.fao.org/library)
Harley, C.D.G., Randall-Hughes, A., Hultgren, K.M., Miner, B.G., Sorte, C.J.B., Thornber, C.S., Rodriguez, L.F., Tomanek, L., Williams, S.L. (2006) The impacts of climate change in coastal marine systems. Ecology letters 9: 228-241
Koranteng, K.A. (2002) Biophysical study of marine and fishery resources at Moree. Marine Fisheries, Ecosystems and Societies in West Africa: half a century change. Senegal, Dakar.
Koranteng, K.A. (2001a) Seasonal and long-term changes in the distribution and abundance of demersal fishery resources in continental shelf waters off Ghana, West Africa (http://www.oceandocs.net)
Koranteng, K.A. (2001b) Structure and dynamics of demersal assemblages on the continental shelf and upper slope off Ghana, West Africa. Marine Ecology Progress Series 20: 1-12
Koranteng, K.A. (1998) Study of the structure and dynamics of demersal fish assemblages on the continental shelf and upper slop off Ghana, West Africa (http://www.oceandocs.net)
Koranteng, K.A. (1995) The western gulf of guinea coastal upwelling-peculiarities changes, and fisheries implications: a review. Intergovernmental Oceanographic Commission (of UNESCO) Koranteng, K.A., Pauly, D. (2004) Long-term trends in demersal fishery resources of Ghana in response to fishing pressure. West African marine ecosystems: models and fisheries impacts. Fisheries Centre Research Reports 12: 75-80
Lae, R. (1997) Does overfishing lead to a decrease in catches and yields? An example of two West African coastal lagoons. Fisheries Management and Ecology 4: 149-164
Lafferty, K.D. (2004) Fishing for lobsters indirectly increases epidemics in sea urchins. Ecological Applications 14: 1566-1573
Last, P.R., White, W.T., Gledhill, D.C., Hobday, A.J., Brown, R., Edgar, G.J., Pecl, G. (2011) Longterm shifts in abundance and distribution of a temperate fish fauna: a response to climate change and fishing practices. Global Ecology and Biogeography 20: 58-72
Lessios, H.A. (1988) Mass mortality of Diadema antillarum in the Caribbean: what have we learned? Annual Review of Ecology and Systematics 19:371-393
Lessios, H.A., Robertson, D.R., Cubit, J.D. (1984) Spread of Diadema mass mortality through the Caribbean. Science 226: 335-337
Magurran, A.E., (1988) Ecological diversity and its measurement. Princeton university press Princeton, NJ, 192 pp

Blue Ventures Conservation Report
65
Mato, Y., Isobe, T., Takada, H., Kanehiro, H., Ohtake, C., Kaminuma, T. (2001) Plastic resin pellets as a transport medium for toxic chemicals in the marine environment. Environmental Science and Technology 35: 318-324
McClanahan, T.R. (2000) Recovery of a coral reef keystone predator, Balistapus undulatus, in East African marine parks. Biological Conservation 94: 191-198
McClanahan, T.R., Muthiga, N.A. (1989) Patterns of predation on a sea urchin, Echinometra mathaei (de Blainville), on Kenyan coral reefs. Journal of Experimental Marine Biology and Ecology 126: 77-94
McClanahan, T.R., Shafir, S.H. (1990) Causes and consequences of sea urchin abundance and diversity in Kenyan coral reef lagoons. Oecologia 83: 362-370
McClintock, J.B., Klinger, T.S., Lawrence, J.M. (1982) Feeding preferences of echinoids for plant and animal food models. Bulletin of Marine Science 32: 365-369
McDiarmid, J. (2012) Western Ghana’s Fisherfolk Starve Amid Algae Infestation. Inter Press Service http://ipsnews.net/news.asp?idnews=107479 McPherson, B.F. (1968) Feeding and oxygen uptake of the tropical sea urchin Eucidaris tribuloides (Lamarck). Biological Bulletin 135: 308-321
Mensah, M. (1979) The hydrology and fisheries of the lagoons and estuaries of Ghana. The coastal ecosystems of West Africa: coastal lagoons, estuaries and mangroves. A Workshop Report, UNESCO, Dakar: 58-69
Minta, S.O. (2003) An assessment of the vulnerability of Ghana's coastal artisanal fishery to climate change. MSc Thesis, Universitetet of Tromsø, 83 pp
Moffett, A., Sarkar, S. (2006) Incorporating multiple criteria into the design of conservation area networks: a mini review with recommendations. Diversity and Distributions 12: 125-137
Newman, M.J.H., Paredes, G.A., Sala, E., Jackson, J.B.C. (2006) Structure of Caribbean coral reef communities across a large gradient of fish biomass. Ecology letters 9: 1216-1227
Ntiamoa-Baidu, Y. (1991) Conservation of coastal lagoons in Ghana: the traditional approach. Landscape and Urban Planning 20: 41-46
Overa, R. (2001) Institutions, mobility and resilience in the Fante migratory fisheries of West Africa. Chr. Michelsen Institute of Development Studies and Human Rights 43 pp
Pörtner, H.O. (2008) Ecosystem effects of ocean acidification in times of ocean warming: a physiologist's view. Marine Ecology Progress Series 373: 203-217
Pauly, D., Christensen, V., Guénette, S., Pitcher, T.J., Sumaila, U.R., Walters, C.J., Watson, R., Zeller, D. (2002) Towards sustainability in world fisheries. Nature 418:689-695
Pauly, D., Silvestre, G., Smith, I.R. (1989) On development, fisheries and dynamite: a brief review of tropical fisheries management. Natural Resources Modelling 3: 307-329
Perry, A.L., Low, P.J., Ellis, J.R., Reynolds, J.D. (2005) Climate change and distribution shifts in marine fishes. Science 308: 1912-1915

Blue Ventures Conservation Report
66
Perry, R.I., Sumaila, U.R. (2007) Marine ecosystem variability and human community responses: The example of Ghana, West Africa. Marine Policy 31: 125-134
Pezennec, O., Koranteng, K.A. (1998) Changes in the dynamics and biology of small pelagic fisheries off Cote d'Ivoire and Ghana: an ecological puzzle. In: Durand, M.H., Mendelssohn, R., Cury, P., Roy, C., Pauly, D. Global versus local changes in upwelling systems. ORSTOM, Paris, pp 329-343
Quéro, J.C., Hureau, J.C., Karrer, C., Post, A., Saldanha, L. (1990) Check-list of the fishes of the eastern tropical Atlantic (CLOFETA). JNICT (Lisbon), SEI. Paris, UNESCO (Paris) 1: 1-1492
Renones, O., Polunin, N.V.C., Goni, R. (2002) Size related dietary shifts of Epinephelus marginatus in a western Mediterranean littoral ecosystem: an isotope and stomach content analysis. Journal of Fish Biology 61:122-137
Rosenzweig, C., Karoly, D., Vicarelli, M., Neofotis, P., Wu, Q., Casassa, G., Menzel, A., Root, T.L., Estrella, N., Seguin, B. (2008) Attributing physical and biological impacts to anthropogenic climate change. Nature 453: 353-357
Roy, C. (1998) An upwelling induced retention area off Senegal: A mechanism to link upwelling and retention processes. South African Journal of Marine Science 19: 89-98 Sala, E., Ribes, M., Hereu, B., Zabala, M., Alvã, V., Coma, R., Garrabou, J. (1998) Temporal variability in abundance of the sea urchins Paracentrotus lividus and Arbacia lixula in the northwestern Mediterranean: comparison between a marine reserve and an unprotected area. Marine Ecology Progress Series 168: 135-145
Sarpong, D.B., Quaatey, S.N.K., Harvey, S.K. (2005) The economic and social contribution of fisheries to gross domestic product and rural development in Ghana. Final Report. Accra, Ghana
Scheibling, R.E., Hennigar, A.W. (1997) Recurrent outbreaks of disease in sea urchins Strongylocentrotus droebachiensis in Nova Scotia: evidence for a link with large-scale meteorologic and oceanographic events. Marine Ecology Progress Series 152: 155-165
Scheibling, R.E., Stephenson, R.L. (1984) Mass mortality of Strongylocentrotus droebachiensis (Echinodermata: Echinoidea) off Nova Scotia, Canada. Marine Biology 78: 153-164
Schutte, V.G.W., Selig, E.R., Bruno, J.F. (2010) Regional spatio-temporal trends in Caribbean coral reef benthic communities. Marine Ecology Progress Series 402: 115-122
Steneck, R.S. (1997) Crustose corallines, other algal functional groups, herbivores and sediments: complex interactions along reef productivity gradients. Proceedings of the 8th International Coral Reef Symposium, Smithsonian Tropical Research Institute, Panama. 1:695-700.
Stobar, B., Warwick, R.M., González, C., Mallol, S., Díaz, D., Reñones, O., Goñi, R. (2009) Long-term and spillover effects of a marine protected area on an exploited fish community. Marine Ecology Progress Series 384: 47-60
Tegner, M.J., Levin, L.A. (1983) Spiny lobsters and sea urchins: analysis of a predator-prey interaction. Journal of Experimental Marine Biology and Ecology 73: 125-150
Tetteh, A.S. (2010) Profit motive and natural resource overexploitation: misperception of the bioeconomic dynamics; the case of a fishery. MSc Thesis, University of Bergen, 94 pp
Thompson, R.C., Moore, C.J., Vom Saal, F.S., Swan, S.H. (2009) Plastics, the environment and human health: current consensus and future trends. Philosophical Transactions of the Royal Society B 364: 2153-2166

Blue Ventures Conservation Report
67
UNEP/LME (2010) http://www.lme.noaa.gov/index.php?option=com content&view=article&id=178:unep-lme-report&catid=39:reports&Itemid
Villa, F., Tunesi, L., Agardy, T. (2002) Zoning Marine Protected Areas through Spatial Multiple Criteria Analysis: the Case of the Asinara Island National Marine Reserve of Italy. Conservation Biology 16: 515-526
Wainwright, P.C. (1987) Biomechanical limits to ecological performance: mollusc crushing by the Caribbean hogfish, Lachnolaimus maximus (Labridae). Journal of Zoology 213: 283-297
Whitehead, P.J.P. (1985) FAO Species Catalogue: Vol. 7: Clupeoid Fishes of the World (suborder Clupeoidei): an Annotated and Illustrated Catalogue of the Herrings, Sardines, Pilchards, Sprats, Shads, Anchovies and Wolf-herrings: Part 1: Chirocentridae, Clupeidae and Pristigasteridae. FAO Fish. Synop. 7:303
Whitlatch, R.B., Obrebski, S. (1980) Feeding selectivity and coexistence in two deposit-feeding gastropods. Marine Biology 58: 219-225
Williams, L.B., Williams, E., Bunkley, A.G. (1986) Isolated mortalities of the sea urchins Astropyga magnifica and Eucidaris tribuloides in Puerto Rico. Bulletin of Marine Science 38: 391-393
Williams, I.D., Richards, B.L., Sandin, S.A., Baum, J.K., Schroeder, R.E., Nadon, M.O., Zgliczynski, B., Craig, P., McIlwain, J.L., Brainard, R.E. (2011) Differences in reef fish assemblages between populated and remote reefs spanning multiple archipelagos across the central and western Pacific. Journal of Marine Biology 2011: 1-14
Worm, B., Hilborn, R., Baum, J.K., Branch, T.A., Collie, J.S., Costello, C., Fogarty, M.J., Fulton, E.A., Hutchings, J.A., Jennings, S. (2009) Rebuilding global fisheries. Science 325: 578-585

Blue Ventures Conservation Report
68
7. Appendices
Appendix 1 List of fish species and sites of occurrence (survey sites labeled by code as per Table 2.1.)
Family Scientific name ABO_L ABO_S AKE_B AKE_SL AKE_SR ATW C3P MIE MIE_I MIE_O MUT PAR PTF WPT
Acanthuridae Acanthurus monroviae x x x x x x x x x x x x x x
Apogonidae Apogon imberbis
x
Balistidae Balistes punctatus x x x x x x x
x x x x x x
Blennidae Ophioblennius atlanticus
x x
x
x x x
x x x
Carangidae Chloroscombrus chrysurus
x x
x
x
Carangidae Pseudocaranx dentex
x
Carangidae Selar crumenophthalmus
x
x
Chaetodontidae Chaetodon marcellae
x
Chaetodontidae Chaetodon robustus
x
x
x
Cirrhitidae Amblycirrhitus pinos
x
Cirrhitidae Cirrhitus atlanticus
x
x
x
Dasyatidae Dasyatis pastinaca
x
Ephippidae Ephippus goreensis
x x
x
Haemulidae Parapristipoma humile
x
x
x
Haemulidae Plectorhinchus mediterraneus
x
Holocentridae Sargocentron hastatum
x
Kyphosidae Kyphosus sectatrix
x x
Labridae Bodianus speciosus x x x x x x x
x x x x x x
Labridae Coris atlantica x x x x x x x x
x x x x x
Labridae Coris Julis
x
x
Labridae Symphodus roissali
x x
x
Labridae Thalassoma newtoni x x x x x x x x x x x x x x

Blue Ventures Conservation Report
69
Labrisomidae Labrisomus nuchipinnis x
x
x
Lethrinidae Lethrinus atlanticus
x
Lutjanidae Apsilus fuscus
x
Lutjanidae Lutjanus agennes
x x
x
x x x x
Lutjanidae Lutjanus goreensis
x x
x x x x x
Monacanthidae Cantherhines pullus
x x
x x
x x x x
Mullidae Pseudupeneus prayensis x x x x x x x
x x x x x x
Pomacanthidae Holacanthus africanus
x
x x
x x x
Pomacentridae Abudefduf saxatilis x x x x x x x x x x x x x
Pomacentridae Abudefduf taurus
x
x x
x
Pomacentridae Chromis limbata
x
Pomacentridae Chromis multilineata
x x
x x
x x x
Pomacentridae Microspathodon frontatus x
x x
x
x x
x
Pomacentridae Stegastes imbricatus x x x x x x x x x x x x x x
Scaridae Scarus hoefleri
x x x x x x x x x x x x
Scaridae Sparisoma axillare
x
Scaridae Sparisoma cretense x x x x x x x x x x x x x x
Scaridae Sparisoma rubripinne
x x
Sciaenidae Umbrina steindachneri
x
Serranidae Cephalopholis nigri x x x x x x x x x x x x x x
Serranidae Cephalopholis taeniops
x
Serranidae Rypticus saponaceus
x
Sparidae Dentex maroccanus
x x x
x x
x x
x x
Tetraodontidae Canthigaster supramacula
x x
x x
x x x x

Blue Ventures Conservation Report
70
Appendix 2 List of species identified during experimental fishing at three fishing sites
Family Scientific name Miemia Princess
Cape3points
Acanthuridae Acanthurus monroviae
x
Bothidae Bothus sp
x
Bothidae Scyacium micrurum x x
Calappidae Calappa rubroguttata
x x
Carangidae Chloroscombrus chrysurus
x
Carangidae Selene dorsalis x x x
Cynoglossidae Cynoglossus senegalensis x x x
Drepaneidae Drepane africana
x x
Elopidae Elops lacerta x x
Haemulidae Pomadasys jubelini
x
Lethrinidae Lethrinus atlanticus x
Majidae Maja squinado x
Muraenidae Enchelycore anatina
x
Panuliridae Panulira homarus x
Penaeidae Penaeus kerathurus
x x
Polynemidae Galeoides decadactylus x x x
Portunidae Portunus validus
x x
Scaridae Scarus hoefleri x
Sciaenidae Pseudotolithus senegalensis x x x
Sciaenidae Psuedotolithus sp
x
Sciaenidae Umbrina canariensis x
Sciaenidae Umbrina steindachneri
x
Scorpaenidae Scorpaena cf. scrofa
x
Scorpaenidae Scorpaena maderensis x
x
Sparidae Dentex maroccanus
x x
Synodontidae Synodus saurus x
x

Blue Ventures Conservation Report
71
Appendix 3 Mann-Whitney pairwise comparisons of fish ecological variables between habitat types. Significant effects indicated in red.
Habitat
Biomass
Paired comparison (p)
Mean SEM Bay Headland Island Patch
Labridae
Bay 31.10 5.68 - 0.03 0.19 0.03
Headland 42.67 4.74 0.03 - 0.69 0.00
Island 43.33 9.19 0.19 0.69 - 0.06
Patch 16.09 4.95 0.03 0.00 0.06 -
Serranidae
Bay 380.50 19.03 - <0.0001 0.21 0.62
Headland 735.00 40.83 <0.0001 - 0.74 0.0004
Island 192.00 32.00 0.21 0.74 - 0.38
Patch 232.50 21.14 0.62 0.0004 0.38 -
Trophic Level
Bay 2.89 0.05 - <0.0001 0.08 0.92
Headland 3.18 0.03 <0.0001 - 0.30 0.02
Island 3.12 0.11 0.08 0.30 - 0.39

Blue Ventures Conservation Report
72
Patch 2.93 0.11 0.92 0.02 0.39 -
Total Biomass
Bay 433.97 69.07 - 0.01 0.12 0.81
Headland 172.70 38.80 0.01 - 0.91 0.02
Island 242.92 131.94 0.12 0.91 - 0.15
Patch 717.27 234.82 0.81 0.02 0.15 -
Lutjanid Biomass
Bay 587.50 27.98 - 0.25 0.36 0.06
Headland 369.50 23.09 0.25 - 0.71 0.01
Island 133.00 22.17 0.36 0.71 - 0.12
Patch 450.00 37.50 0.06 0.01 0.12 -
Pomacentrid
Biomass
Bay 23.44 5.56 - 0.03 0.62 0.34
Headland 3.74 1.12 0.03 - 0.22 0.0004
Island 37.39 13.15 0.62 0.22 - 0.96
Patch 29.37 8.08 0.34 0.0004 0.96 -

Blue Ventures Conservation Report
73
Serranid Biomass
Bay 5.81 1.56 - 0.01 0.53 0.39
Headland 15.82 3.44 0.01 - 0.29 0.001
Island 9.13 3.74 0.53 0.29 - 0.32
Patch 3.42 1.44 0.39 0.001 0.32 -
Size/Length
Bay 10.76 0.12 - <0.0001 <0.0001 0.60
Headland 9.51 0.15 <0.0001 - <0.0001 <0.0001
Island 6.86 0.15 <0.0001 <0.0001 - <0.0001
Patch 11.56 0.19 0.60 <0.0001 <0.0001 -

Blue Ventures Conservation Report
74
Appendix 4 Mann-Whitney pairwise comparisons of fish ecological variables between exposure groups. Significant effects indicated in red.
Exposure Abundance Paired comparison (p)
Mean SEM Sheltered
Semi
exposed Exposed
Total
Abundance
Sheltered
237.67
51.73 -
0.01
0.03
Semi
exposed
103.96
11.53
0.01
-
0.47
Exposed
130.94
27.75
0.03
0.47 -
Acanthurid
Sheltered 11.75 2.7 - 0.04 0.78
Semi
exposed 10.68 3.93 0.04 - 0.03
Exposed 10.22 1.88 0.78 0.03 -
Labridae
Sheltered
37.83
6.00 -
0.03
0.47
Semi
exposed
23.64
4.71
0.03
-
0.0008
Exposed
43.44
4.93
0.47
0.0008 -
Pomacentridae
Sheltered
87.83
16.22 -
0.01
0.01
Semi
exposed
40.04
8.13
0.01
-
0.08
Exposed
47.50
25.30
0.01
0.08 -
Scaridae Sheltered
13.42
4.47 -
0.03
0.01
Semi

Blue Ventures Conservation Report
75
exposed 5.08 1.29 0.03 - 0.61
Exposed
3.11
0.72
0.01
0.61 -
Serranidae
Sheltered
4.58
1.40 -
0.28
0.31
Semi
exposed
2.40
0.57
0.28
-
0.003
Exposed
6.06
1.00
0.31
0.003 -
Species
Richness
Sheltered
15.58
1.32 -
0.001
0.002
Semi
exposed
10.68
0.54
0.001
-
0.66
Exposed
10.50
0.73
0.002
0.66 -
Trophic level
Sheltered
2.98
0.05 -
0.69
0.01
Semi
exposed
2.93
0.07
0.69
-
0.01
Exposed
3.16
0.04
0.01
0.01 -
Serranid
biomass
Sheltered
4.19
2.23 -
0.12
0.005
Semi
exposed
8.23
2.22
0.12
-
0.03
Exposed
12.40
2.32
0.005
0.03 -
Size (cm) Sheltered
10.29
0.14 -
0.03
<0.0001

Blue Ventures Conservation Report
76
Semi
exposed
11.14
0.13
0.03
-
<0.0001
Exposed
8.44
0.12 <0.0001 <0.0001 -

Blue Ventures Conservation Report
77
Appendix 5 Mann-Whitney pairwise comparisons of fish ecological variables between levels of wave action. Significant effects indicated in
red.
Wave Action
Abundance Paired comparison (p)
Mean SEM Low Med High
Pomacentridae
Low
49.31
10.50
-
0.002
0.27
Med
74.28
13.66
0.002
-
0.01
High
38.83
19.13
0.27
0.01
-
Scaridae
Low
11.95
3.14
-
0.03
0.02
Med
3.71
0.71
0.03
-
0.36
High
2.60
0.64
0.02
0.36
-
Serranidae
Low
3.33
1.03
- 0.0224 0.7265
Med
5.83
0.81 0.0224
- 0.0014
High
1.85
0.68
0.73
0.001
-
Lutjanidae
Low
2.62
2.07
-
0.002
0.10
Med
3.22
0.94
0.002
-
0.37
High
0.38
0.22
0.10
0.37
-
SpR Low
14.61
0.95
-
0.0004
0.0005
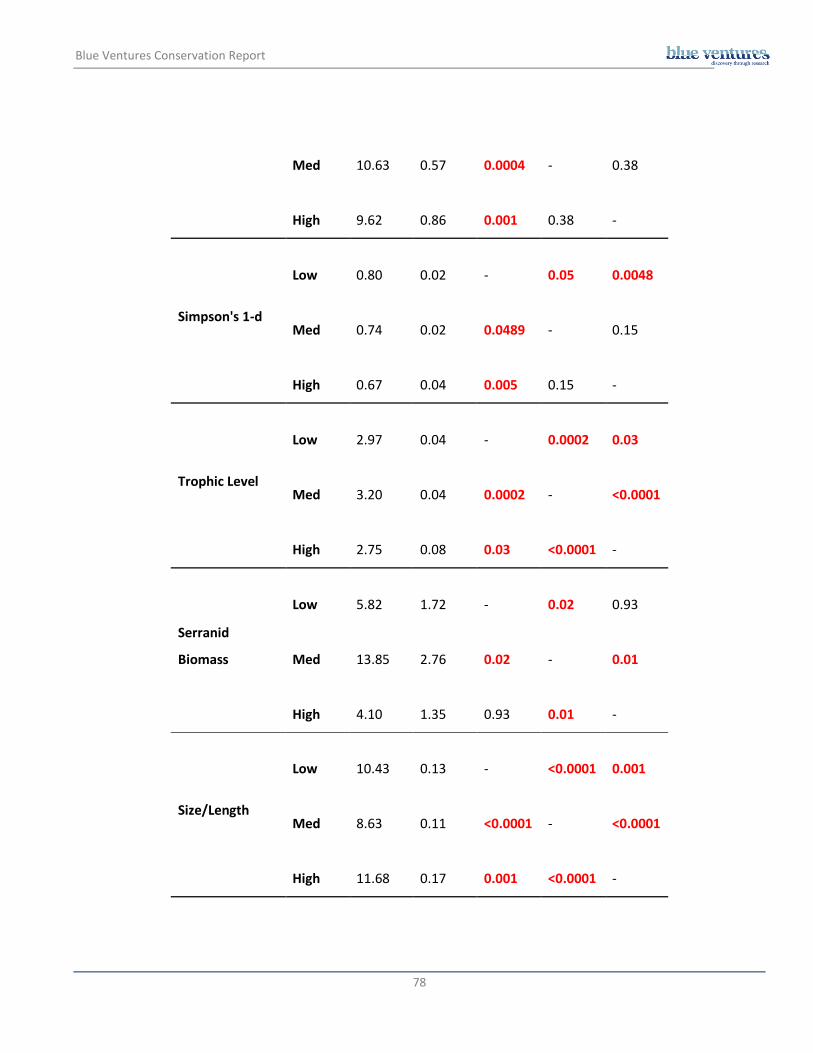
Blue Ventures Conservation Report
78
Med
10.63
0.57
0.0004
-
0.38
High
9.62
0.86
0.001
0.38
-
Simpson's 1-d
Low
0.80
0.02
-
0.05
0.0048
Med
0.74
0.02
0.0489
-
0.15
High
0.67
0.04
0.005
0.15
-
Trophic Level
Low
2.97
0.04
-
0.0002
0.03
Med
3.20
0.04 0.0002
-
<0.0001
High
2.75
0.08
0.03
<0.0001
-
Serranid
Biomass
Low
5.82
1.72
-
0.02
0.93
Med
13.85
2.76
0.02
-
0.01
High
4.10
1.35
0.93
0.01
-
Size/Length
Low
10.43
0.13
- <0.0001 0.001
Med
8.63
0.11 <0.0001
- <0.0001
High
11.68
0.17
0.001
<0.0001
-

Blue Ventures Conservation Report
79
Appendix 6 Mann-Whitney pairwise comparisons of ecological variables between levels of fishing pressure. Significant effects indicated in
red.
Fishing pressure
Abundance Paired comparison (p)
Mean SEM Low Med High
Acanthurid
Low 16.6316 4.7611
-
0.01
0.55
Med 4.2381 1.6632
0.01
-
0.0003
High 12.4667 1.9877
0.55
0.0003
-
Labridae
Low
32.58
6.36
-
0.29
0.02
Med
20.00
1.72
0.29
-
<0.0001
High
52.53
5.15
0.02
<0.0001
-
Serranidae
Low
2.05
0.57
-
0.06
0.01
Med
4.24
0.82
0.06
-
0.20
High
6.40
1.29
0.01
0.20
-
Trophic Level
Low
2.88
0.05
-
0.05
0.0004
Med
3.03
0.07
0.05
-
0.15
High
3.17
0.05
0.0004
0.15
-
Total Biomass Low
653.99
141.83
-
0.04
0.001

Blue Ventures Conservation Report
80
Med
296.22
46.75
0.04
-
0.02
High
152.83
63.61
0.001
0.02
-
Scarid Biomass
Low
226.86
76.93
-
0.22
0.01
Med
68.32
16.67
0.22
-
0.06
High
19.91
11.53
0.01
0.06
-
Lutjanid Biomass
Low
101.52
52.17
-
0.43
0.05
Med
43.04
19.73
0.43
-
0.004
High
41.84
41.84
0.05
0.004
-
Acanthurid
Biomass
Low
120.22
44.21
-
0.002
0.01
Med
18.18
6.61
0.002
-
0.68
High
9.71
6.53
0.01
0.68
-
Size/Length
Low
11.26
0.12
- 0.0052 <0.0001
Med
10.50
0.15 0.0052
- <0.0001
High
7.47
0.11
<0.0001
<0.0001
-

Blue Ventures Conservation Report
81
8. Supplementary Information
S1. Focus group survey results
Set net (36.6%) and purse seine net (34.2%) were the most commonly used fishing gear types, hook and line was
used by 21.9% of the fishers while the remaining few used drift net (4.9%) and trolling line (2.4%) (Figure S1-1A).
There were about 2140 boats in the eight villages where focus group interviews were conducted. The boats were
categorized into three groups: boats without engine (38.1%), 8-25 hp engine boats (16.6%) and 25-50 hp engine
boats (45.3%) (Figure S1-1B).
Most large nets (77.5%) were made of several pieces of net of different lengths and mesh sizes and joined to form
a single net (Figure S1-1C). Of these, 82% were made of three or more nets while the remaining 18% were made
of two pieces. The 25-50 hp boats used purse seine nets as the main fishing gear with small proportions of drift
net, set net and trolling lines also used. No hook and line was used on these boats (Figure S1-1D). Set net was the
main gear type in the 8-25 hp boats with a few boats using hook and line and purse seine net. Boats without
engines used mainly hook and line (46.7%) and set net (53.3%).

Blue Ventures Conservation Report
82
Figure S1-1. A. Distribution of gear types, B. Distribution of boat types, C. Number of nets spliced into a single net by boat type, D. Gear type by boat type.
Gear type
Drift N
et
Ho
ok a
nd
Lin
e
Pu
rse
Se
ine
Se
t N
et
Tro
llin
g L
ine
Pe
rce
nt
0
10
20
30
40
No
en
gin
e
8-2
5 h
p
25
-50
hp
0
10
20
30
40
50
No
en
gin
e
8-2
5 h
p
25
-50
hp
Pe
rce
nt
0
20
40
60
80
100
one net
two nets
> two netsN
o e
ng
ine
8-2
5 h
p
25
-50
hp
20
40
60
80
100Drift net
Hook and line
Purse seine
Set net
Trolling line
No. of nets forming a single net
Net type
A B
C D

Blue Ventures Conservation Report
83
Figure S1-2. Number of boats by type and fishing village
The boats in Dixcove, the town with the largest number of boats, were predominantly composed of the 25-50 hp
category while those in nearby Busua were all with 8-25 hp engines (Figure S1-2). At Cape Three Points, the boats
used were predominantly without engines. In Miemia and Princess Town/Akitakyi, 57% of the boats did not have
engines while the remaining were of the 25-50 hp, with a small proportion with 8-25 hp (2.9%). In Akwidae, Axim
and Butre, all three boat types were represented in significant proportions, boats without engine composing the
largest numbers.
No
of b
oa
ts
0
200
400
600
Akw
ida
e
Axim
Bu
su
a
Bu
tre
Ca
pe
Th
ree
Po
ints
Dix
Co
ve
Mie
mia
Prin
ce
ss-A
kita
kyi
Pe
rce
nt
0
20
40
60
80
100No engine
8-25 hp
25-50 hp

Blue Ventures Conservation Report
84
Figure S1-3. A. Number of fishers per boat, B. Seasonality in fishing, C. Fishing grounds by boat type
Almost 87% of the boats without engines were one- man canoes (locally known as dukuwas) with a few carrying
2-5 crew (Figure S1-3A). Most of the boats with 25-50 hp engine carried >10 fishers while the boats with 8-25 hp
engine had between 2-5 (56%) and 5-10 (44%) fishers. Most of the canoes without engines operated all year
around while those with 25-50 hp engines operated predominantly during the upwelling season, targeting pelagic
species (Figure S1-3B). A higher proportion of the boats with 8-25 hp engines (71%) operated all year around; the
remaining 29% being active during the upwelling season only. Boats with 8-25 hp and 25-50 hp engines fished
mostly on muddy habitats (89 and 100% respectively) (Figure S1-3C). A few of the former fished on a mixed
bottom of sand and mud (11%). Canoes without engines fished mostly on rocky bottoms (40%) or both rocky and
Perc
en
t
0
20
40
60
80
1001
2-5
5-10
>10
Perc
en
t
0
20
40
60
80
100all year
upwelling
No of fishers per boat
Main fishing season
Boat type
no engine 0-25 hp 25-50 hp
Perc
en
t
0
20
40
60
80
100mud
rock
rock/mud
sand/mud
Main fishing habitat
A
B
C

Blue Ventures Conservation Report
85
muddy bottoms (33%) while the remaining (27%) fished in equal proportions either on muddy or a mix of both
sandy and muddy bottoms.
Figure S1-4. Type of fish caught by boat type
A mix of fish types was caught by the small one man dukuwas: soft bottom demersal (26.7%), rocky bottom
demersal (20.0%) and a mix between rocky bottom demersal and pelagic (20%) (Figure S1-4). Most of the fish
caught by fishers using boats with 8-25 hp engines were soft bottom demersal species (56%) with pelagic species
also comprising a large proportion of catches (22%).
The majority of boats operated between 10 and 50 m deep (Figure S1-5A). Those that operated in shallow depths
(0-10 m) were all without engine while boats fishing in waters >50 m depth were larger boats with engines of 25-
50 hp (Figure S1-5B). Those with small horse power engines (8-25 hp) operated in intermediate depths of 10-50
m.
Boat type
no engine 0-25 hp 25-50 hp
Perc
ent
0
20
40
60
80
100 soft bottom demersal
rocky bottom demersal
pelagic
mixed: mixed demersal
mixed: demersal/pelagic
mixed: rocky/pelagic
mixed: all types
Fish type caught

Blue Ventures Conservation Report
86
Figure S1-5. Distribution of fishing boat types by water depth
Most fishers used three nets of different mesh sizes and spliced together (Figure S1-6). Both single nets and those
made of three nets were made of small (1-2 in) or small-medium (2-4 in) nets. Those made of two nets were
mostly composed of small-medium or medium-large (4-10 in) nets. Nets with large mesh size made up only 13%
of those made of three nets and none of these were made of single or two nets.
Depth (m)
0-10 10-30 30-50 >50
Perc
en
t
0
10
20
30
40
50
Depth (m)
0-10 10-30 30-50 >50
Perc
en
t
0
20
40
60
80
100 no engine
8-25 hp
25-50 hp
A
B

Blue Ventures Conservation Report
87
Figure S1-6. Mesh size of nets by the number of nets making a single net
single net two nets three nets
Pe
rce
nt
0
10
20
30
40
50
60
70
Number of nets connected to make a single net
single net two nets three nets
Pe
rce
nt
0
20
40
60
80
100 1-2 in
2-4 in
4-10 in
>10 in

Blue Ventures Conservation Report
88
S.2. Fishing Surveys
Fishing surveys conducted over the three days caught a total of 50.49 kg of fish. Twenty-one fish species
representing 15 families and five crustacean families: crabs (Calappidae, Majidae, and Portunidae), Lobster
(Panuliridae), and Prawn (Paeneidae) were recorded
MIE PTF C3P
So
ak tim
e (
hrs
)
0
5
10
15
20
25
MIE PTF C3P
To
tal yie
ld (
kg
)
0
5
10
15
20
25
30
Fishing site
MIE PTF C3P
CP
UE
(kg
hr-1
)
0.0
0.2
0.4
0.6
0.8
1.0
1.2
1.4
Figure S2-1. Fishing survey results by fishing site: (a) total yield (kg), (b) soak time (hrs), and (c) catch per unit
effort (CPUE, kg hr-1)
S.2.1. Catch characteristics
Total yield was highest at Cape Three Points where 28.35 kg was caught compared to 9.20 kg at Princess Town
and 5.67 kg at Miemia (Figure S2-1a). Soak time varied between 21 hours in Miemia and 23 hours at both Cape

Blue Ventures Conservation Report
89
Three Points and Princess town (Figure S2-1b). Mean CPUE was 0.63 kg hr-1
± 0.3 ranging from the highest at Cape
Three Points (1.23 kg hr-1
) and lowest at Miemia (0.26 kg hr-1
) (Figure S2-11c).
The trophic level of species caught varied between a minimum of 2.0 (Herbivore) and 4.5 (Piscivore). Along with
the highest yield, Cape Three Points also had the highest mean trophic level (3.71 ± 0.03) and Miemia had the
lowest (3.29 ± 0.13) (Figure S2-2), which is equivalent to omnivorous species feeding on invertebrates, decapods
and fish.
Fishing site
Princess town Miemia Cape3points
Tro
phic
level
0
1
2
3
4
5
Figure S2-2. Trophic level (TL) of catches at each fishing site

Blue Ventures Conservation Report
90
Catches comprised mainly of Sciaenidae (55.67%) with three species caught: Pseudotolithus senegalensis
(89.23%), Umbrina canariensis (9.23) and Umbrina steindachneri (1.54%). One species of the Polynemidae
(Galeoides decadactylus) comprised 21.95%. The remaining 22.4% was made of 17 fish species belonging to 13
different families (Figure S-3).
The average standard length (SL) of fish caught at each site varied from 19.60 ± 1.6 cm in Miemia to 31.54 ± 1.23
cm in Cape Three Points (Figure S-4). The smallest landed fish were Dentex maroccanus and Scorpaena
maderensis both at 11cm SL, while the largest fish caught was a 1 m (100 cm) fangtooth moray eel (Enchelycore
anatine).
Figure S2-3. Percentage composition of fish landings by fish family.


Blue Ventures Conservation Report
92
Figure S2-5. Percentage composition of mature and juvenile fish from fisheries landing

Blue Ventures Conservation Report
93
Figure S2-6. Length frequency distribution of fish. (a) Pseudotolithus senegalensis, (b) Galeoides decadactylus and (c) Chloroscombrus chrysurus. Vertical red line denotes length at maturity (cm).