Embed Size (px)
Citation preview
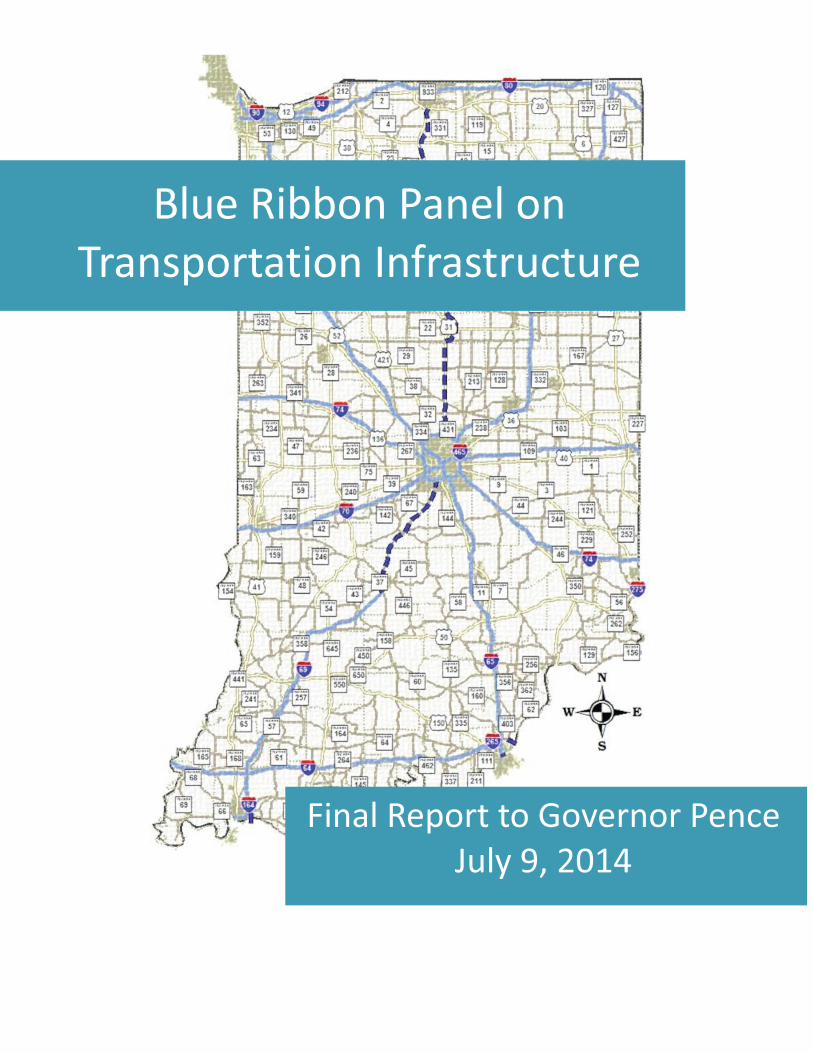
Blue�Ribbon�Panel�on�Transportation�Infrastructure�
�
��� ����� ������������������������������
Final�Report�to�Governor�PenceJuly�9,�2014�
� �
2��
Members�of�the�Governor’s�Blue�Ribbon�Panel�on�Transportation�Infrastructure�
�Lt.�Governor�Sue�Ellspermann,�Co�Chair�
Cathy�Langham,�Langham�Logistics,�Co�Chair��
Mike�Cline,�Purdue�University�Rick�Conner,�American�Structurepoint�
Mike�Daigle,�St.�Joseph�County�Airport�Authority�Mark�DeFabis,�Integrated�Distribution�Services,�Inc.�
Chip�Edgington,�OSP�Group�Dennis�Faulkenberg,�APPIAN,�Inc.�
Andrew�Fox,�Chicago�South�Shore�&�South�Bend�Railroad�Mayor�Karen�Freeman�Wilson,�City�of�Gary�
Pete�Georgeon,�ArcelorMittal�Mayor�Tom�Henry,�City�of�Fort�Wayne�
Mark�Holden,�A�&�R�Logistics�Douglas�Joest,�Evansville�Vanderburgh�Airport�Authority�
Chris�Matney,�Indianapolis�Airport�Authority�Hank�Menke,�OFS�Brands�
Don�W.�Miller,�Jr.,�TPG�Marine�Enterprises�Don�Sansone,�Red�Gold,�Inc.�JR�Saylor,�Brightpoint,�Inc.�
Noah�Sodrel,�Sodrel�Truck�Lines,�Inc.�Mark�St.�Clair,�Consolidated�Grain�&�Barge,�Co.�
Phil�Terry,�Monarch�Beverage�Company�Mayor�Lloyd�Winnecke,�City�of�Evansville�
��
With�special�thanks�to�our�presenters�and�facilitators,��
David�Holt,�Conexus�Lawrence�D.�Burns,�Ph.D.�
Dan�Brassard,�Indiana�Department�of�Transportation�Kendra�York,�Indiana�Finance�Authority�
�and�the�following�members�of�state�government�who�supported�the�Panel’s�work:�
�Dan�Schmidt,�Governor’s�Office�
Adarsh�Mantravadi,�Governor’s�Office�Mark�Rusthoven,�Governor’s�Office�
Jay�Wasson,�INDOT� � � � � � ������������������������������Gloria�Downham,�OMB�Roy�Nunnally,�INDOT� � � � � � ����������������������������������Shannon�Bibby,�OMB�Rich�Cooper,�Ports�Commission� � � � � ������������������������������������������Leah�Raider,�SBA�Jody�Peacock,�Ports�Commission� � � � �������������������������������������Sola�Egunyomi,�SBA�Chad�Pittman,�IEDC� � � � � � �����������������������������������������Ron�Sobecki,�SBA�Eric�Shields,�IEDC�
� �
3��
BLUE�RIBBON�PANEL�ON�TRANSPORTATION�INFRASTRUCTURE�
�July�9,�2014��Governor�Michael�R.�Pence�State�House�–�Room�206�Indianapolis,�Indiana�46204��Re:��Blue�Ribbon�Panel�Report��Dear�Governor�Pence:��
� Our�work�is�complete!��You� tasked� the� Blue� Ribbon� Panel� on� Transportation� Infrastructure� to� recommend� a� set� of� priority�projects�for�the�shorter�term�and�to�provide�a�vision�of�transportation�in�Indiana�for�the�longer�term.��In�response,�the�Panel�engaged�in�an�eight�month�journey,�culminating�with�the�presentation�to�you�of�this�Report.��Within�its�pages,�this�Report�will�guide�you�on�that�same�journey,�and�we�are�confident�you�will�arrive� at� the� same� underlying� conclusion� reached� by� the� Panel:� � transportation� is� ripe� for�transformation.�
�The�Panel�has� identified� the�priority�projects�and� initiatives� that�will�enhance� Indiana’s� transportation�system,�across�all�modes�of�transportation,�for�both�freight�and�passengers.��The�Panel�offers�regulatory�and�financial�policy�recommendations�to�complement�and�support�the�asphalt�and�steel�projects�on�its�priority�list.��Laying�over�all�of�these�items�is�the�recognition�that�technological�innovation�is�on�the�cusp�of�reality.��As�the�Crossroads�of�America,�Indiana�is�uniquely�positioned�to�lead�this�transformation�for�the�entire�nation.��The�future�is�now.��Indiana�must�get�ready.�
�On� behalf� of� the� Panel,� thank� you� for� the� opportunity� to� serve� our� state� through� this� unique� and�important�project.��Sincerely,��
� � � � � ��Lt.�Governor�Sue�Ellspermann� � � � � Cathy�Langham�Co�Chair� � � � � � � Co�Chair�����
� �
4��
TABLE�OF�CONTENTS��Recommendations………………………………………………………………………………………………………………………………….5�Planning�Process…………………………………………………………………………………………………………………………………..22�Background�Information……………………………………………………………………………………………………………………….23�Transportation�Innovation…………………………………………………………………………………………………………………….43�Transportation�Funding…………………………………………………………………………………………………………………………49�Project�Performance�Metrics……………………………………………………………………………………………………………….54�Project�Evaluations………………………………………………………………………………………………………………………………..63�Resource�List…………………………………………………………………………………………………………………………………………65�Glossary…………………………………………………………………………………………………………………………………………………73�Appendix……………………………………………………………………………………………………………………………………………….74�
� Project�Summaries�(by�project�number)��
��������������������
� �
5��
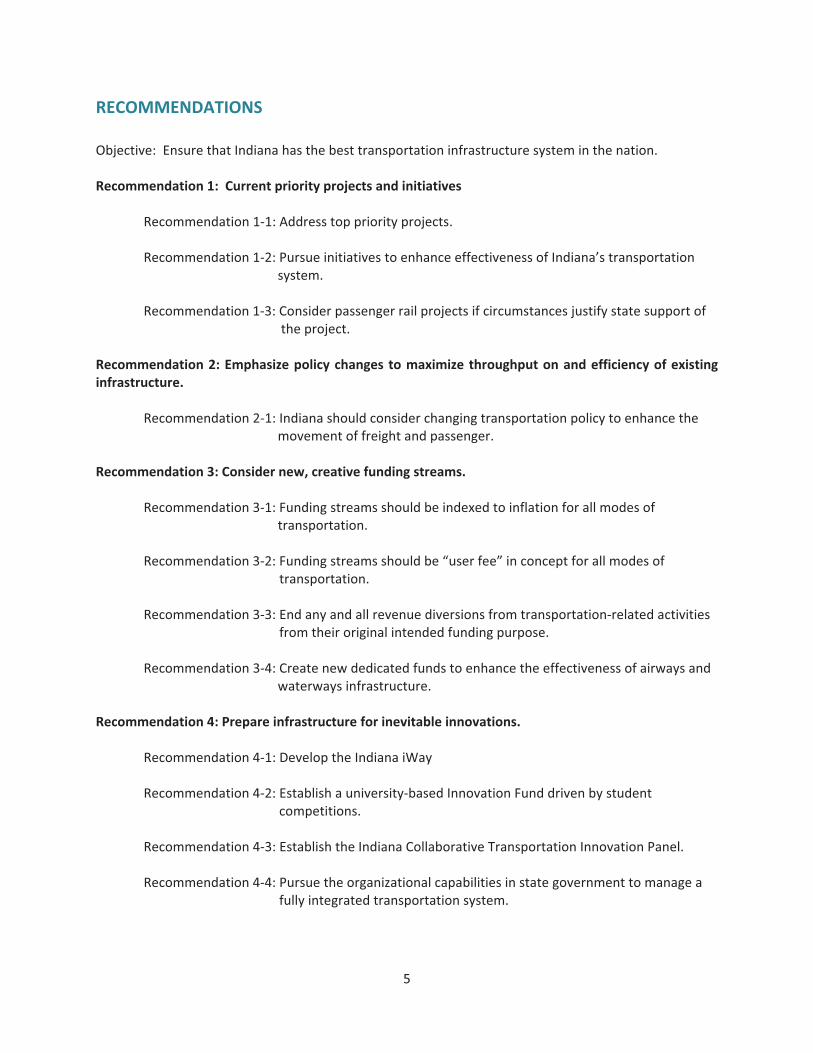
RECOMMENDATIONS��Objective:��Ensure�that�Indiana�has�the�best�transportation�infrastructure�system�in�the�nation.��Recommendation�1:��Current�priority�projects�and�initiatives��� Recommendation�1�1:�Address�top�priority�projects.��� Recommendation�1�2:�Pursue�initiatives�to�enhance�effectiveness�of�Indiana’s�transportation���������������������������������������������������������system.��� Recommendation�1�3:�Consider�passenger�rail�projects�if�circumstances�justify�state�support�of����������������������������������������������������������the�project.��Recommendation�2:�Emphasize�policy�changes�to�maximize�throughput�on�and�efficiency�of�existing�infrastructure.��� Recommendation�2�1:�Indiana�should�consider�changing�transportation�policy�to�enhance�the���������������������������������������������������������movement�of�freight�and�passenger.��Recommendation�3:�Consider�new,�creative�funding�streams.��� Recommendation�3�1:�Funding�streams�should�be�indexed�to�inflation�for�all�modes�of���������������������������������������������������������transportation.��� Recommendation�3�2:�Funding�streams�should�be�“user�fee”�in�concept�for�all�modes�of��
�����������������������������������������transportation.��� Recommendation�3�3:�End�any�and�all�revenue�diversions�from�transportation�related�activities��
�����������������������������������������from�their�original�intended�funding�purpose.��� Recommendation�3�4:�Create�new�dedicated�funds�to�enhance�the�effectiveness�of�airways�and���������������������������������������������������������waterways�infrastructure.��Recommendation�4:�Prepare�infrastructure�for�inevitable�innovations.��
Recommendation�4�1:�Develop�the�Indiana�iWay��� Recommendation�4�2:�Establish�a�university�based�Innovation�Fund�driven�by�student��
�����������������������������������������competitions.��
Recommendation�4�3:�Establish�the�Indiana�Collaborative�Transportation�Innovation�Panel.��� Recommendation�4�4:�Pursue�the�organizational�capabilities�in�state�government�to�manage�a��
�����������������������������������������fully�integrated�transportation�system.��
1. 2. 3.
� �
7��
�
�
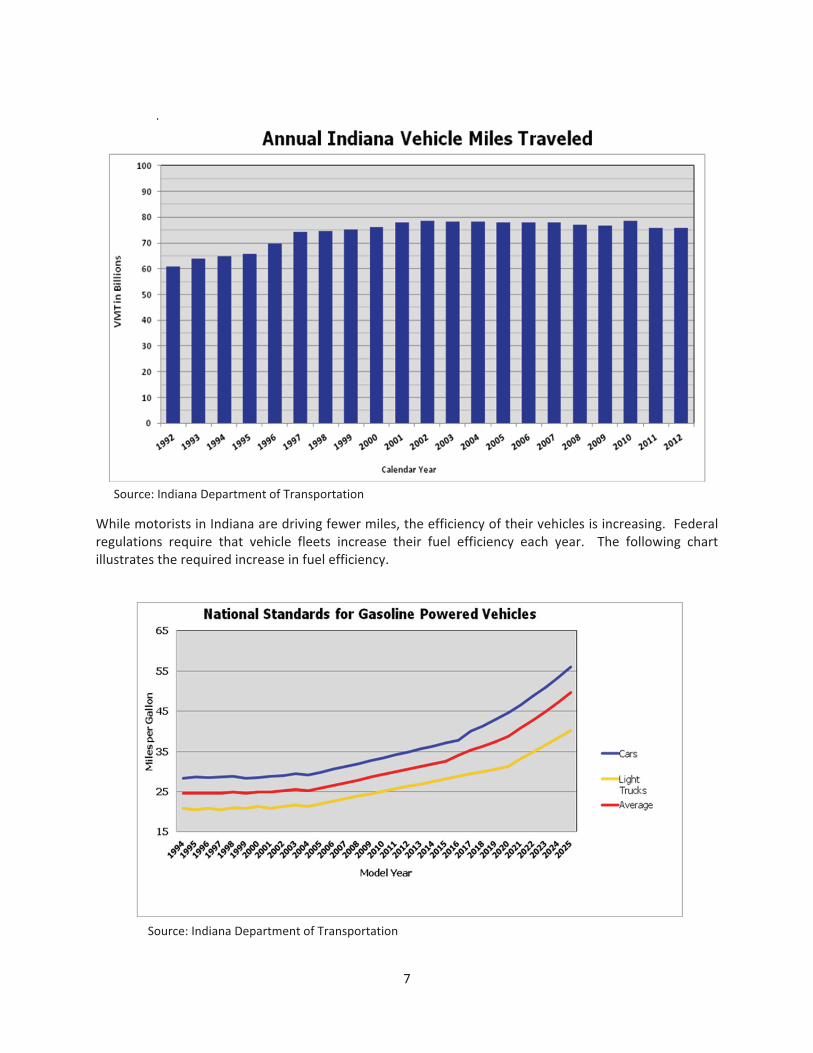
While�motorists�in�Indiana�are�driving�fewer�miles,�the�efficiency�of�their�vehicles�is�increasing.��Federal�regulations� require� that� vehicle� fleets� increase� their� fuel� efficiency� each� year.� � The� following� chart�illustrates�the�required�increase�in�fuel�efficiency.������������������
Source:�Indiana�Department�of�Transportation
Source:�Indiana�Department�of�Transportation
� �
8��
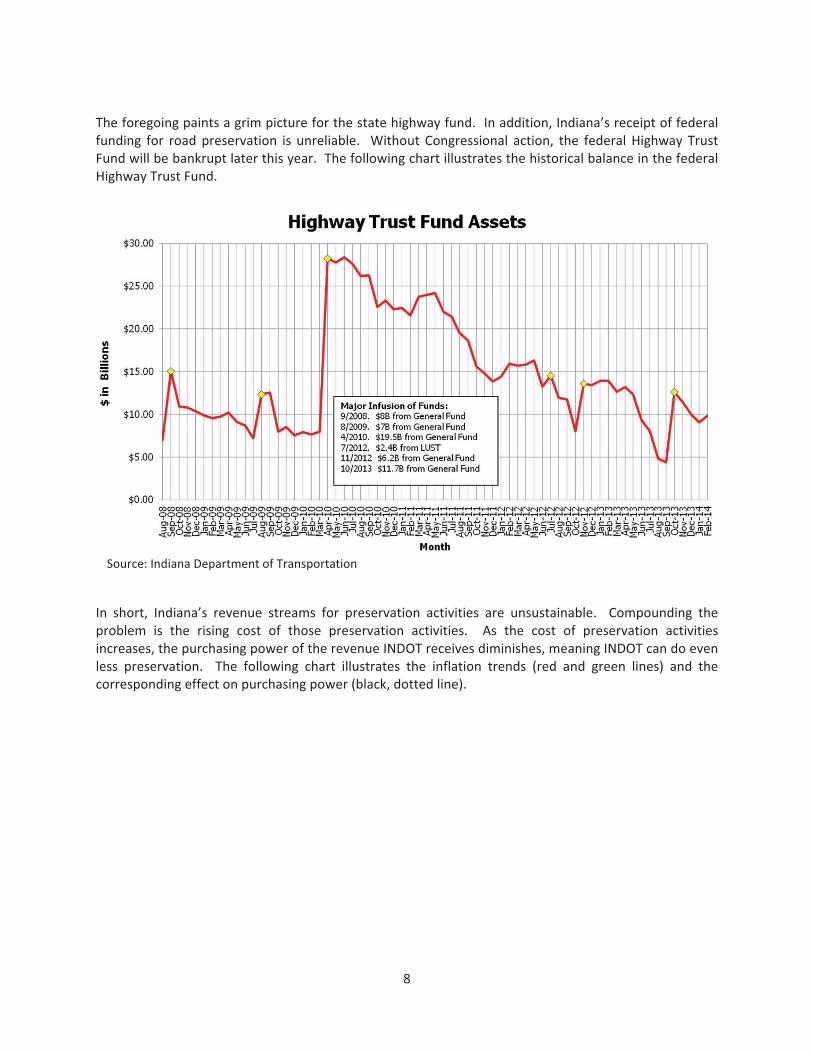
�The�foregoing�paints�a�grim�picture�for�the�state�highway�fund.��In�addition,�Indiana’s�receipt�of�federal�funding� for� road�preservation� is� unreliable.� �Without� Congressional� action,� the� federal�Highway� Trust�Fund�will�be�bankrupt�later�this�year.��The�following�chart�illustrates�the�historical�balance�in�the�federal�Highway�Trust�Fund.��
��
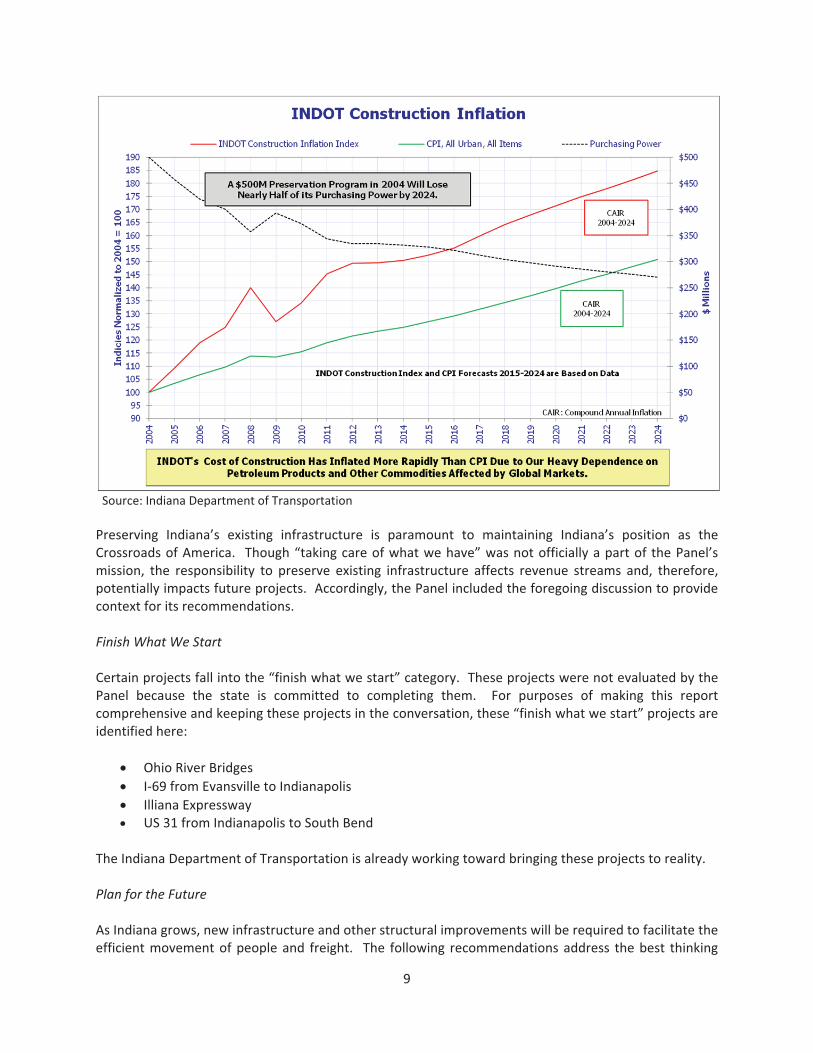
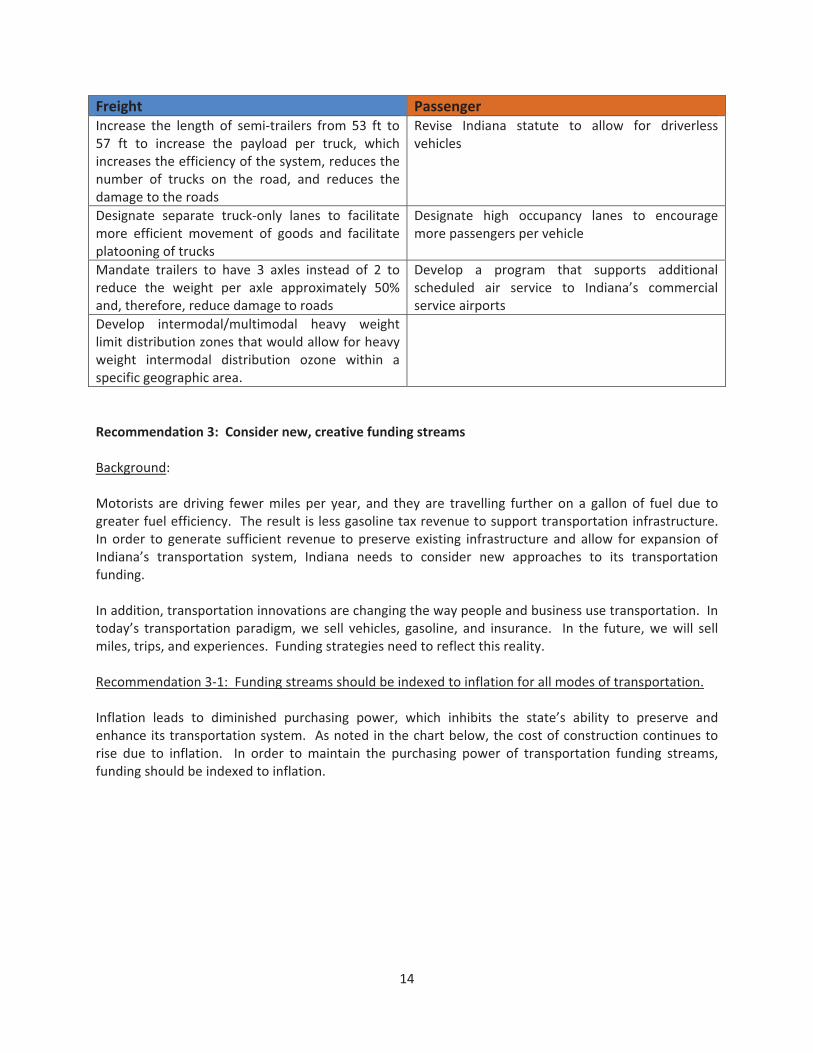
In� short,� Indiana’s� revenue� streams� for� preservation� activities� are� unsustainable.� � Compounding� the�problem� is� the� rising� cost� of� those� preservation� activities.� � As� the� cost� of� preservation� activities�increases,�the�purchasing�power�of�the�revenue�INDOT�receives�diminishes,�meaning�INDOT�can�do�even�less� preservation.� � The� following� chart� illustrates� the� inflation� trends� (red� and� green� lines)� and� the�corresponding�effect�on�purchasing�power�(black,�dotted�line).����������
Source:�Indiana�Department�of�Transportation
� �
9��
�
�Preserving� Indiana’s� existing� infrastructure� is� paramount� to� maintaining� Indiana’s� position� as� the�Crossroads�of�America.� �Though�“taking�care�of�what�we�have”�was�not�officially�a�part�of� the�Panel’s�mission,� the� responsibility� to� preserve� existing� infrastructure� affects� revenue� streams� and,� therefore,�potentially�impacts�future�projects.��Accordingly,�the�Panel�included�the�foregoing�discussion�to�provide�context�for�its�recommendations.��Finish�What�We�Start��Certain�projects�fall�into�the�“finish�what�we�start”�category.��These�projects�were�not�evaluated�by�the�Panel� because� the� state� is� committed� to� completing� them.� � For� purposes� of� making� this� report�comprehensive�and�keeping�these�projects�in�the�conversation,�these�“finish�what�we�start”�projects�are�identified�here:�
�� Ohio�River�Bridges�� I�69�from�Evansville�to�Indianapolis�� Illiana�Expressway�� US�31�from�Indianapolis�to�South�Bend�
�The�Indiana�Department�of�Transportation�is�already�working�toward�bringing�these�projects�to�reality.�
�Plan�for�the�Future��As�Indiana�grows,�new�infrastructure�and�other�structural�improvements�will�be�required�to�facilitate�the�efficient�movement�of�people�and� freight.� � The� following� recommendations�address� the�best� thinking�
Source:�Indiana�Department�of�Transportation
� �
10��
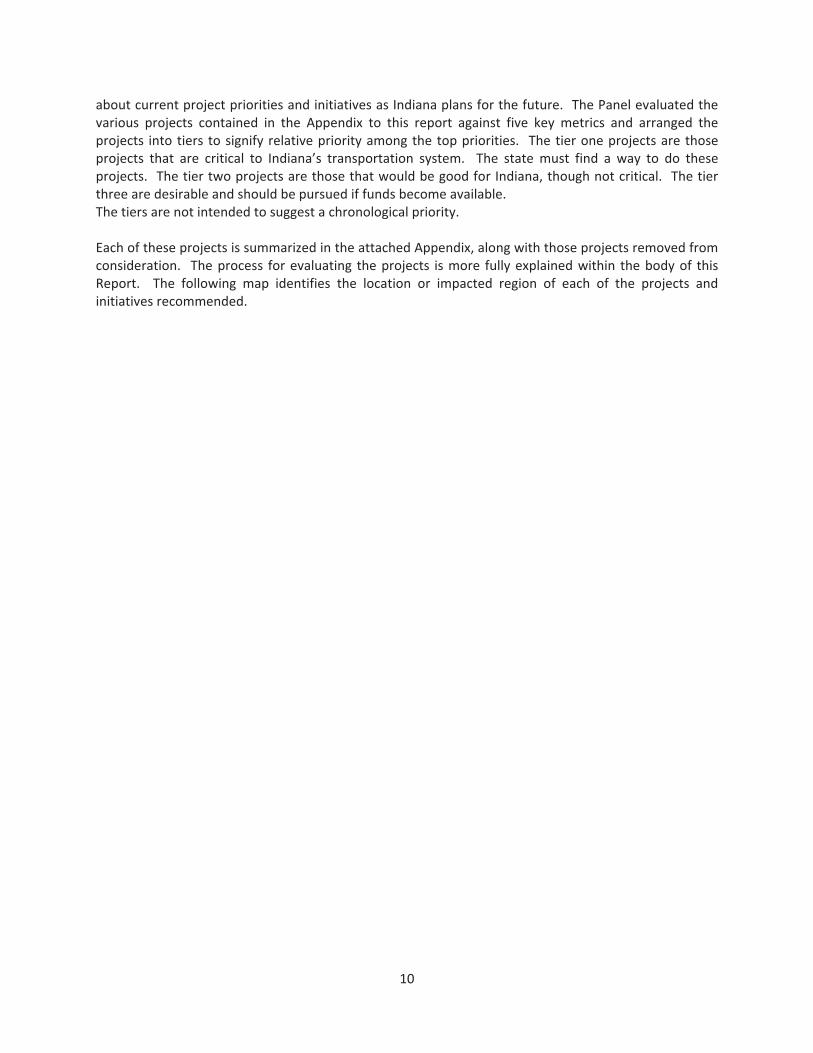
about�current�project�priorities�and�initiatives�as�Indiana�plans�for�the�future.��The�Panel�evaluated�the�various� projects� contained� in� the� Appendix� to� this� report� against� five� key� metrics� and� arranged� the�projects� into�tiers� to�signify�relative�priority�among�the�top�priorities.� �The�tier�one�projects�are�those�projects� that� are� critical� to� Indiana’s� transportation� system.� � The� state�must� find� a� way� to� do� these�projects.� �The�tier�two�projects�are�those�that�would�be�good�for�Indiana,�though�not�critical.� �The�tier�three�are�desirable�and�should�be�pursued�if�funds�become�available.���The�tiers�are�not�intended�to�suggest�a�chronological�priority.�
�Each�of�these�projects�is�summarized�in�the�attached�Appendix,�along�with�those�projects�removed�from�consideration.� �The�process� for�evaluating� the�projects� is�more� fully�explained�within� the�body�of� this�Report.� � The� following� map� identifies� the� location� or� impacted� region� of� each� of� the� projects� and�initiatives�recommended.�� �
� �
11��
�
��
� �
12��
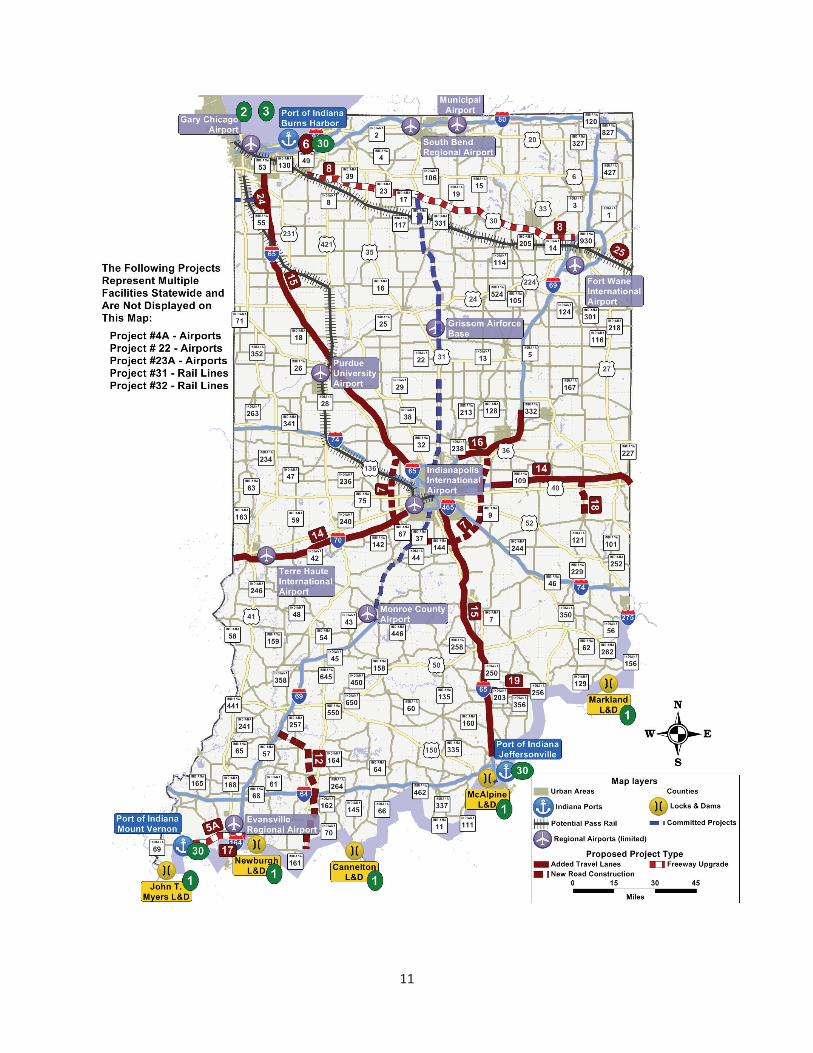
���Recommendation�1�1:��Address�top�priority�projects.��The�following�chart�identifies�those�projects�with�the�greatest�statewide�significance�for�Indiana.�
�
�
Of�all�the�recommended�projects,�the�Commerce�Connector�has�drawn�particularly�heavy�scrutiny�due�to� its� potential� impact� on� Indianapolis.� � The� City� of� Indianapolis� is� concerned� that� the� Commerce�Connector�will�encourage�growth�outside�of�Marion�County�along�the�Connector’s�corridor,�which�the�City�believes�will�contribute�to�additional�and�continuing�blight�within� the�City’s�south�side.�The�Panel�recognizes�that�the�City�of�Indianapolis�does�not�support�the�Commerce�Connector�and�appreciates�its�concerns.��However,�the�Panel�believes�that�the�Commerce�Connector�is�a�high�priority,�critical�project�because� of� its� ability� to� facilitate� the� movement� of� freight� and� passenger� traffic� into� and� around�Indianapolis,� particularly� at� bottleneck� locations� such� as� the� intersection� of� I�69� and� I�465� on� the�northeast�side�of�Indianapolis.�
�Recommendation�1�2:��Pursue�initiatives�to�enhance�effectiveness�of�Indiana’s�transportation�system.�
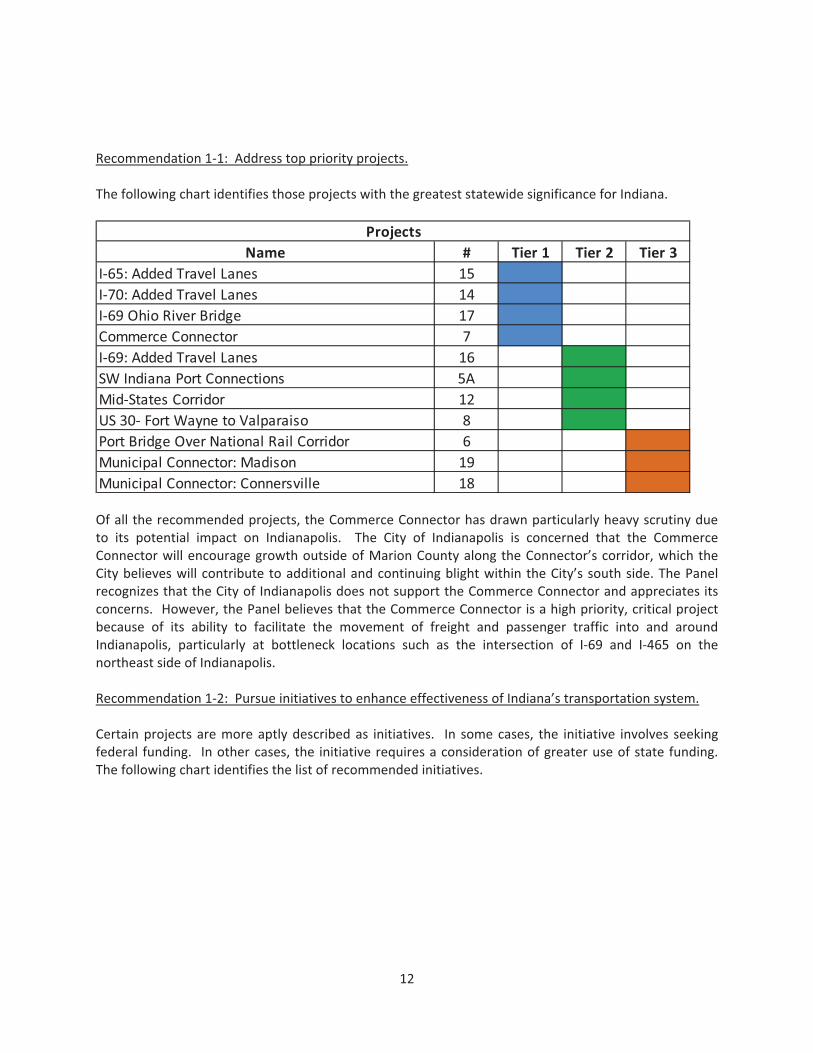
�Certain�projects�are�more�aptly�described�as� initiatives.� � In� some�cases,� the� initiative� involves� seeking�federal� funding.� � In�other�cases,�the� initiative�requires�a�consideration�of�greater�use�of�state�funding.��The�following�chart�identifies�the�list�of�recommended�initiatives.�
�
Name # Tier�1 Tier�2 Tier�3I�65:�Added�Travel�Lanes 15I�70:�Added�Travel�Lanes 14I�69�Ohio�River�Bridge 17Commerce�Connector 7I�69:�Added�Travel�Lanes 16SW�Indiana�Port�Connections 5AMid�States�Corridor 12US�30��Fort�Wayne�to�Valparaiso 8Port�Bridge�Over�National�Rail�Corridor 6Municipal�Connector:�Madison 19Municipal�Connector:�Connersville 18
Projects
� �
13��
��Recommendation�1�3:��Consider�passenger�rail�projects�if�circumstances�justify�state��support�of�the�project.�
�Passenger� rail�may�have� a� role� in� Indiana’s� transportation� infrastructure� future,� but� historically� these�projects�have�required�significant�assistance�and�support�from�the�state.� �Passenger�rail�projects�must�increase�their�value�through�enhanced�performance�before�the�state�justifies�providing�assistance.��The�following�chart�identifies�two�passenger�rail�projects�with�potential�statewide�significance.�
�
�
�Recommendation�2:��Emphasize�policy�changes�to�maximize�throughput�on�and�efficiency�of�existing�infrastructure.�
�Background:�
�Indiana� can� make� changes� to� its� transportation� policy� that� will� maximize� the� efficiency� of� existing�infrastructure.� �Policy�changes�do�not�require�asphalt,�concrete,�or�steel,�and�they�can�better� leverage�existing�infrastructure�without�increasing�preservation�requirements.��In�some�cases,�policy�changes�can�reduce� the� cost� of� preserving� the� system.� � Policy� changes� can� also� prepare� Indiana’s� transportation�system�for�the�inevitable�innovations.�
�Recommendation� 2�1:� � Indiana� should� consider� changing� transportation� policy� to� enhance� the�movement�of�freight�and�passenger.�
�The�following�chart�identifies�transportation�policy�changes�that�Indiana�could�consider.��This�list�is�not�intended�to�be�exhaustive.��The�chart�captures�policy�changes�that�are�“top�of�mind”�for�the�Panel.�
���
Name # Tier�1 Tier�2 Tier�3Inland�Waterways�Infrastructure�(Olmstead�Locks) 1Seaway�Locks�(Soo�Locks) 3Lake�Michigan�Harbor�Dredging 2Improved�Intermodal�Rail�Service 32Leverage�Excess�Air�Freight�Capacity 4/4AImproved�Rail�Service�to�Indiana's�Ports 30Non�Stop/Direct�Commercial�Flights 23/23ARegional�Airport�Development 22Light�Density�Branch�Lines 31
Initiatives
Name #Northeast�IN�Passenger�Rail�Line 25Hoosier�State�Rail�Passenger�Line 24
Projects
� �
14��
Freight� Passenger�Increase� the� length� of� semi�trailers� from� 53� ft� to�57� ft� to� increase� the� payload� per� truck,� which�increases�the�efficiency�of�the�system,�reduces�the�number� of� trucks� on� the� road,� and� reduces� the�damage�to�the�roads�
Revise� Indiana� statute� to� allow� for� driverless�vehicles�
Designate� separate� truck�only� lanes� to� facilitate�more� efficient� movement� of� goods� and� facilitate�platooning�of�trucks�
Designate� high� occupancy� lanes� to� encourage�more�passengers�per�vehicle�
Mandate� trailers� to� have� 3� axles� instead� of� 2� to�reduce� the� weight� per� axle� approximately� 50%�and,�therefore,�reduce�damage�to�roads�
Develop� a� program� that� supports� additional�scheduled� air� service� to� Indiana’s� commercial�service�airports�
Develop� intermodal/multimodal� heavy� weight�limit�distribution�zones�that�would�allow�for�heavy�weight� intermodal� distribution� ozone� within� a�specific�geographic�area.�
�
��Recommendation�3:��Consider�new,�creative�funding�streams�
�Background:�
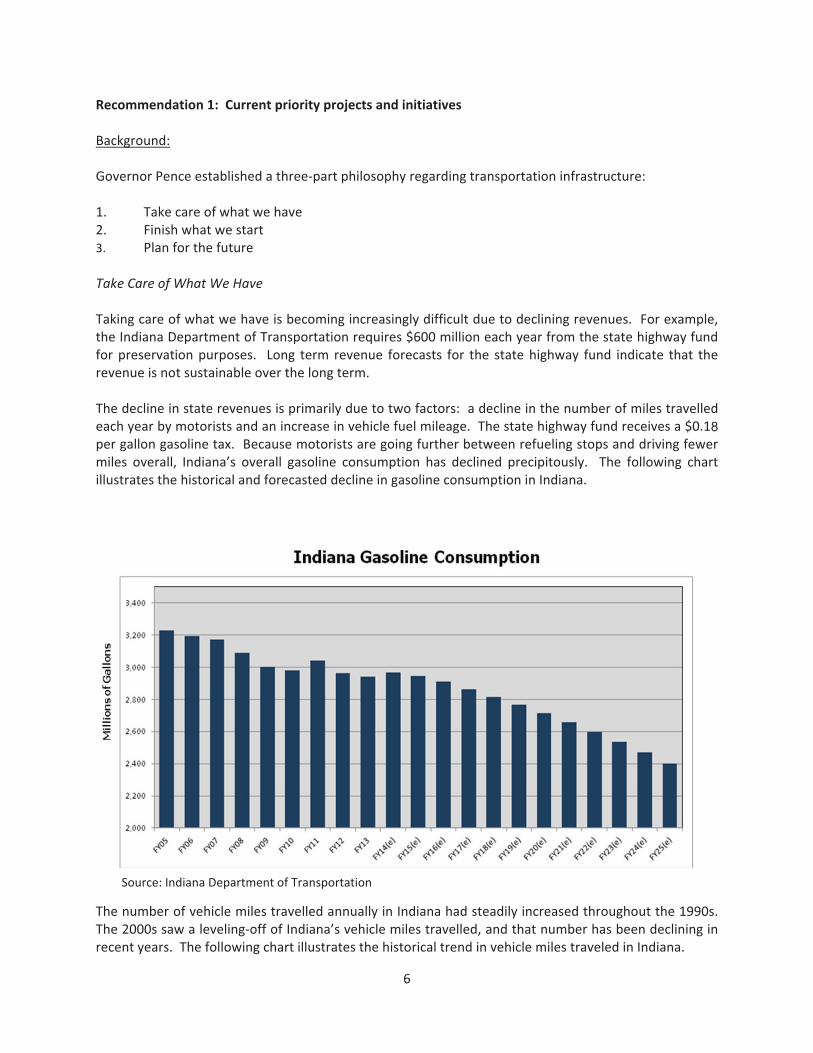
�Motorists� are� driving� fewer�miles� per� year,� and� they� are� travelling� further� on� a� gallon� of� fuel� due� to�greater�fuel�efficiency.��The�result�is�less�gasoline�tax�revenue�to�support�transportation�infrastructure.��In�order� to� generate� sufficient� revenue� to�preserve�existing� infrastructure� and�allow� for� expansion�of�Indiana’s� transportation� system,� Indiana� needs� to� consider� new� approaches� to� its� transportation�funding.�
�In�addition,�transportation�innovations�are�changing�the�way�people�and�business�use�transportation.��In�today’s� transportation�paradigm,�we� sell� vehicles,� gasoline,� and� insurance.� � In� the� future,�we�will� sell�miles,�trips,�and�experiences.��Funding�strategies�need�to�reflect�this�reality.�
�Recommendation�3�1:��Funding�streams�should�be�indexed�to�inflation�for�all�modes�of�transportation.�
�Inflation� leads� to� diminished� purchasing� power,� which� inhibits� the� state’s� ability� to� preserve� and�enhance�its�transportation�system.� �As�noted�in�the�chart�below,�the�cost�of�construction�continues�to�rise� due� to� inflation.� � In� order� to�maintain� the� purchasing� power� of� transportation� funding� streams,�funding�should�be�indexed�to�inflation.��
� �
15��
�
��Recommendation�3�2:��Funding�streams�should�be�“user�fee”�in�concept�for�all�modes�of�transportation.�
�User� fees� tie� the� use� of� transportation� infrastructure� to� the� responsibility� for� preserving� the�infrastructure.��Examples�of�possible�user�fees�are:�
�1. Possible�vehicle�mileage�fee�for�road�funding;�would�replace�traditional�gas�tax�2. User� fee� for� alternative� fuel� vehicles,� either� based� on� fuel� equivalency� or� relative� impact� on�
infrastructure�3. Vehicle�registration�fee�4. Dedicate�aircraft� license�excise� tax�or�sales�tax�on�aviation�related�activities� to�a�new�Aviation�
Account�that�would�fund�improvements�to�Indiana’s�airports�5. Dedicate�state� funds�generated�from�natural� resources� fees�or�sales�tax�on�waterways�related�
activities� on� the� Ohio� River� and/or� Great� Lakes� collected� by� the� state� to� a� newly� created�Waterways� Account� that� would� funding� dredging,� dredge� material� disposal,� and� breakwater�maintenance�
6. User� fees� for� pleasure� craft� on�Ohio� River� and�Great� Lakes� dedicated� to�maintenance� of� our�locks,�dams,�dredging,�dredge�material�disposal,�and�breakwater�maintenance.��
The� foregoing� list� identifies� examples� of� possible�user� fees.� The�Panel� is� not� endorsing� a� specific� fee.��Rather,� these� possible� fees� are� identified� to� illustrate� the� user� fee� concept� recommendation.� � The�federal�government�is�also�considering�user�fees�to�fill�its�funding�gap.�
��
Source:�Indiana�Department�of�Transportation
� �
16��
��Recommendation�3�3:� � End�any�and�all� revenue�diversions� from�transportation� related�activities� from�their�original�intended�funding�purpose.��Ending�diversion�will�protect� the� integrity�of� the�programs�established�by� federal�and�state� legislators�and� ensure� that� the� user� fees� collected� are� used� for� their� intended� purpose.� � Examples� of� such�diversions�include:�
�1. Federal�and�State�Highway�funds�no�longer�used�for�mass�transit.�2. Federal� fuel� tax,� vehicle� mileage� fee� and� other� highway� fund� user� fees� flow� directly� to� the�
Highway�Trust�Fund,�not�the�General�Revenue�Fund.�3. State�fuel�tax,�vehicle�mileage�fee,�state�sales�tax�on�gasoline�and�vehicle�registration�fee�flow�
directly�to�the�State�Motor�Vehicle�Highway�Account.�4. Federal� and� State�Highway� Funds� should� not� pay� for� transit,� enhancement,� safety,� and� other�
non�road�programs.�5. Federal�aviation�taxes�and�user�fees�flow�directly�to�the�Airport�and�Airways�Trust�Fund�and�not�
into�the�General�Revenue�Fund.�6. Federal� barge� fuel� tax� and� harbor� maintenance� tax� dedicated� specifically� for� locks,� dams,�
dredging,�dredge�material�disposal,�and�breakwater�maintenance.��Recommendation� 3�4:� � Create� new� dedicated� funds� to� enhance� the� effectiveness� of� airways� and�waterways�infrastructure.��Existing�user�fees�should�be�directed�to�funds�dedicated�to�improving�the�infrastructure�related�to�the�fees,� thereby� providing� a� funding� stream� to� preserve� and� improve� the� infrastructure.� � State� aircraft�license� excise� tax� or� sales� tax� on� aviation�related� activities� flow� into� a� newly� created� State� Aviation�Account� that� would� fund� improvements� to� the� state’s� airports.� � State� funds� generated� from� natural�resources� fees� or� sales� tax� on� waterways�related� activities� on� the� Ohio� River� and/or� Great� Lakes�collected�by�the�state�to�a�newly�created�Waterways�Account�that�would�fund�dredging,�dredge�material�disposal,�and�breakwater�maintenance.���Recommendation�4:��Prepare�infrastructure�for�inevitable�innovations.�
�Background:����Transportation� is� ripe� for� transformation.� � The� last� time� transportation� stood� on� a� precipice� of� this�magnitude� may� have� been� 1886� when� Karl� Benz� obtained� a� patent� for� the� first� gasoline� powered�automobile,� allowing� a� switch� from� horses� to� horsepower.� � Since� that� time,� innovations� and�advancements�have�centered�around�improving�or�supporting�the�use�of�the�automobile�as�a�means�of�transportation.� � Innovations� like� steering�wheels,� speedometers,� automatic� starters,� air� conditioning,�turn�signals,�and�airbags�made�our�automobiles�safer�and�more�convenient�to�use,�while�paved�roads,�gas�stations,�and�drive�thru�restaurants�made�automobiles�the�organizing�tool� for� transporting�people�and�commerce.�
�
� �
17��
Now,�new�tools�are�on�the�horizon,�shaped�by�forces�never�before�seen.��Digital�technology�now�allows�for� methods� of� transporting� people� and� goods� that� are� connected,� coordinated,� shared,� driverless,�tailored,�and�electrical.��
���������������������������������������������������������������������������������� �� � �� � � ���������Source:��Google,�Inc.���
� ��Source:��General�Motors�Corporation��
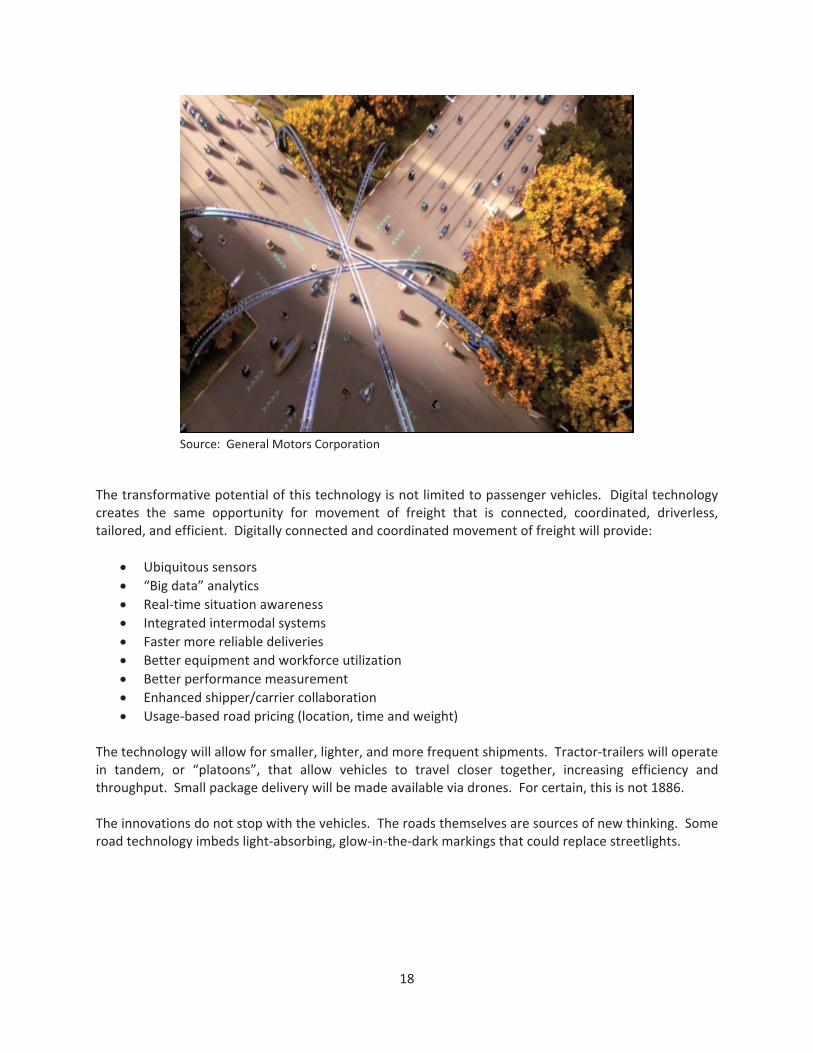
The� following� graphic� illustrates� an� intersection� full� of� these� vehicles.� � Note� the� absence� of� a� traffic�signal.��The�signal�is�not�needed.��The�vehicles�coordinate�their�movement�to�avoid�collisions.��
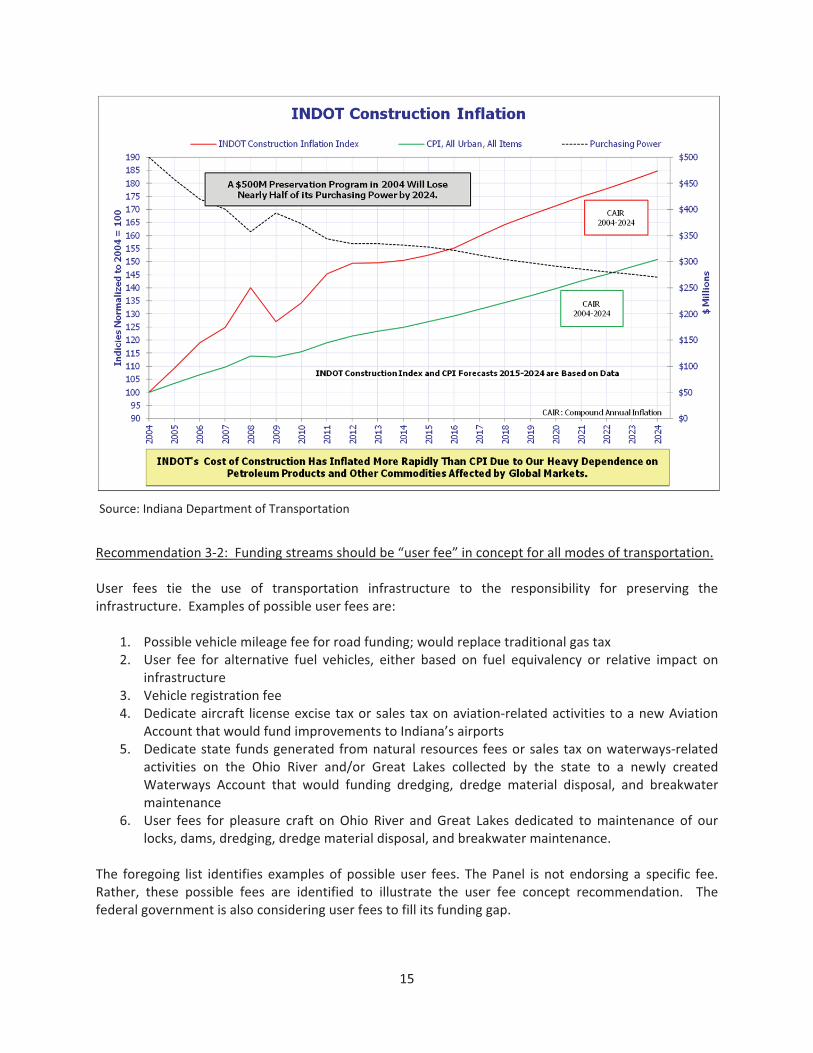
Digital� connectivity�will� enable� automobiles� to�communicate�with�one�another�and�coordinate�movement.� � The� image� on� the� right� is� a�driverless� vehicle� under� development� at�Google,�Inc.��This�self�driving�vehicle�has�logged�over� 700,000� miles� and� is� expected� to� be�commercially�available�by�2017.� �The�box�atop�the�vehicle�houses�a� laser�that�spins�at�a�rapid�rate,� feeding� information� about� the� vehicle’s�surroundings�to�its�control�system,�enabling�the�vehicle� to� evade� collisions� while� allowing� its�passengers�to�read,�work,�or�take�a�nap.
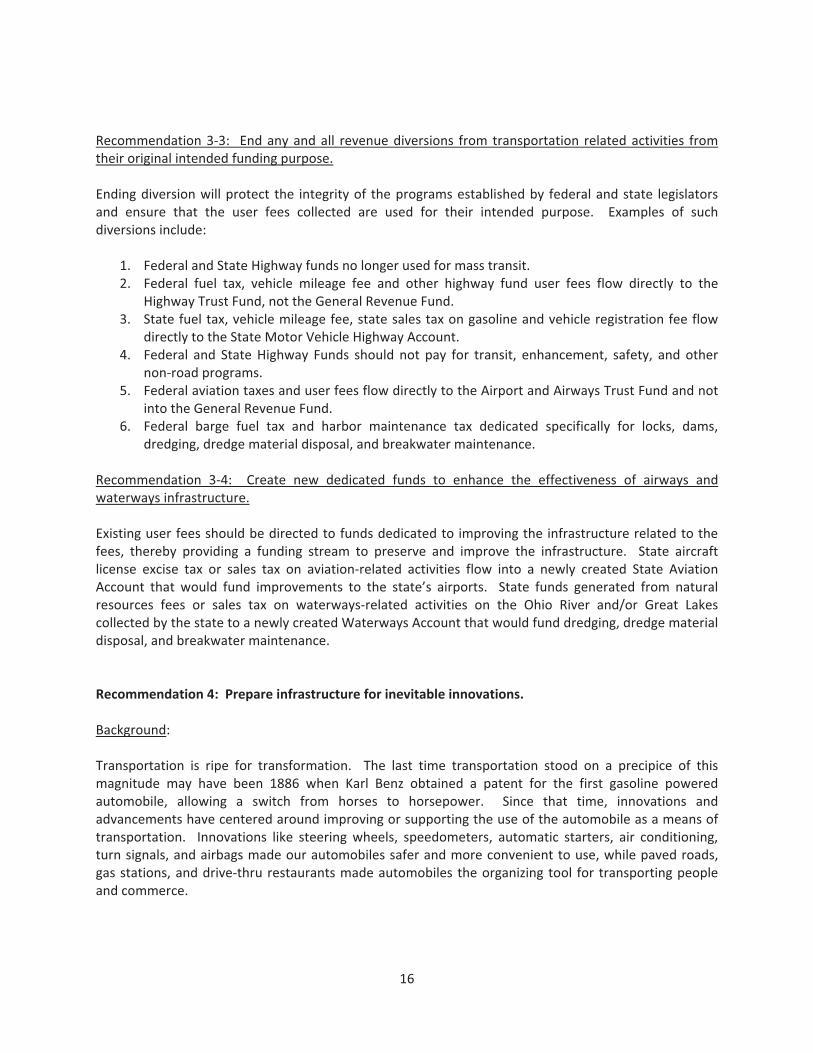
The� concept� car� on� the� left� takes� connectivity� and�coordinated�movement�to�an�entirely�different� level.��This� is� a� two� passenger� vehicle� built� on� a� self�balancing,� two�wheel� system.� � The� vehicle’s� sensors�can� detect� the� location� and� movement� of� other�vehicles,� which,� like� the� Google� self�driving� vehicle,�allows�for�greater�passenger�productivity�and�greater�
� �
18��
�� ������������Source:��General�Motors�Corporation�
�The�transformative�potential�of�this�technology�is�not�limited�to�passenger�vehicles.��Digital�technology�creates� the� same� opportunity� for� movement� of� freight� that� is� connected,� coordinated,� driverless,�tailored,�and�efficient.��Digitally�connected�and�coordinated�movement�of�freight�will�provide:�
�� Ubiquitous�sensors�� “Big�data”�analytics�� Real�time�situation�awareness�� Integrated�intermodal�systems�� Faster�more�reliable�deliveries�� Better�equipment�and�workforce�utilization�� Better�performance�measurement�� Enhanced�shipper/carrier�collaboration�� Usage�based�road�pricing�(location,�time�and�weight)�
�The�technology�will�allow�for�smaller,�lighter,�and�more�frequent�shipments.��Tractor�trailers�will�operate�in� tandem,� or� “platoons”,� that� allow� vehicles� to� travel� closer� together,� increasing� efficiency� and�throughput.��Small�package�delivery�will�be�made�available�via�drones.��For�certain,�this�is�not�1886.�
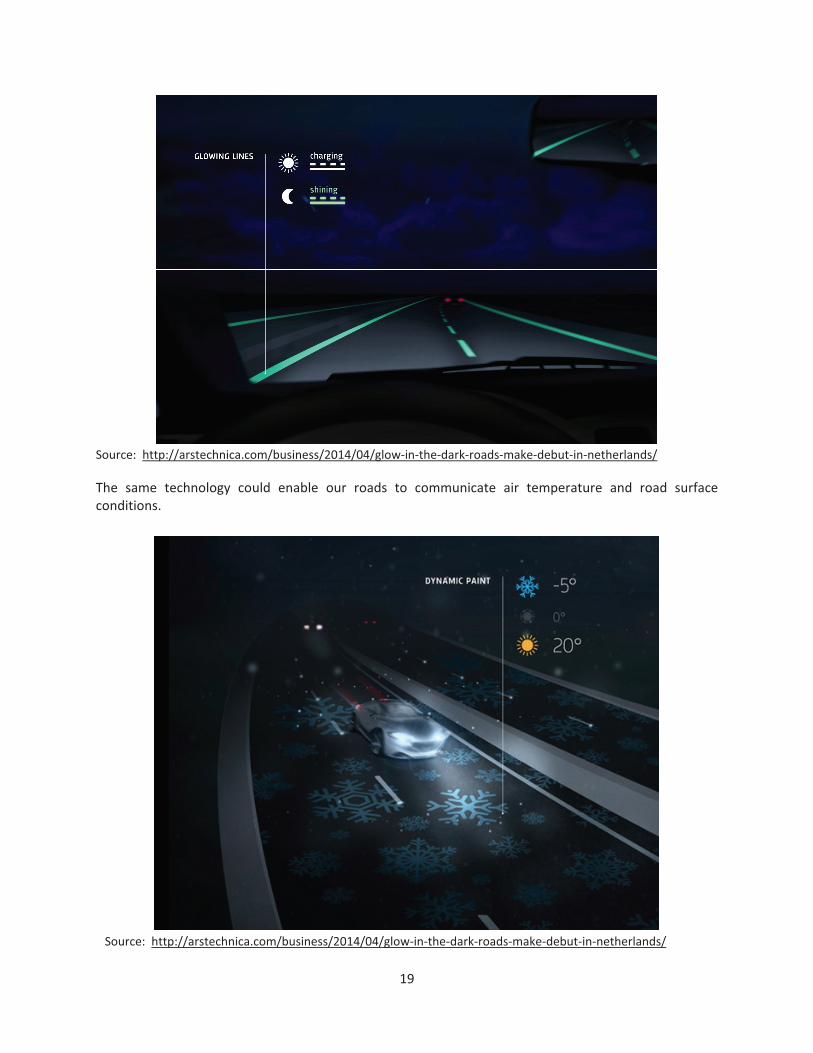
�The�innovations�do�not�stop�with�the�vehicles.��The�roads�themselves�are�sources�of�new�thinking.��Some�road�technology�imbeds�light�absorbing,�glow�in�the�dark�markings�that�could�replace�streetlights.��
� �
19��
�Source:��http://arstechnica.com/business/2014/04/glow�in�the�dark�roads�make�debut�in�netherlands/�
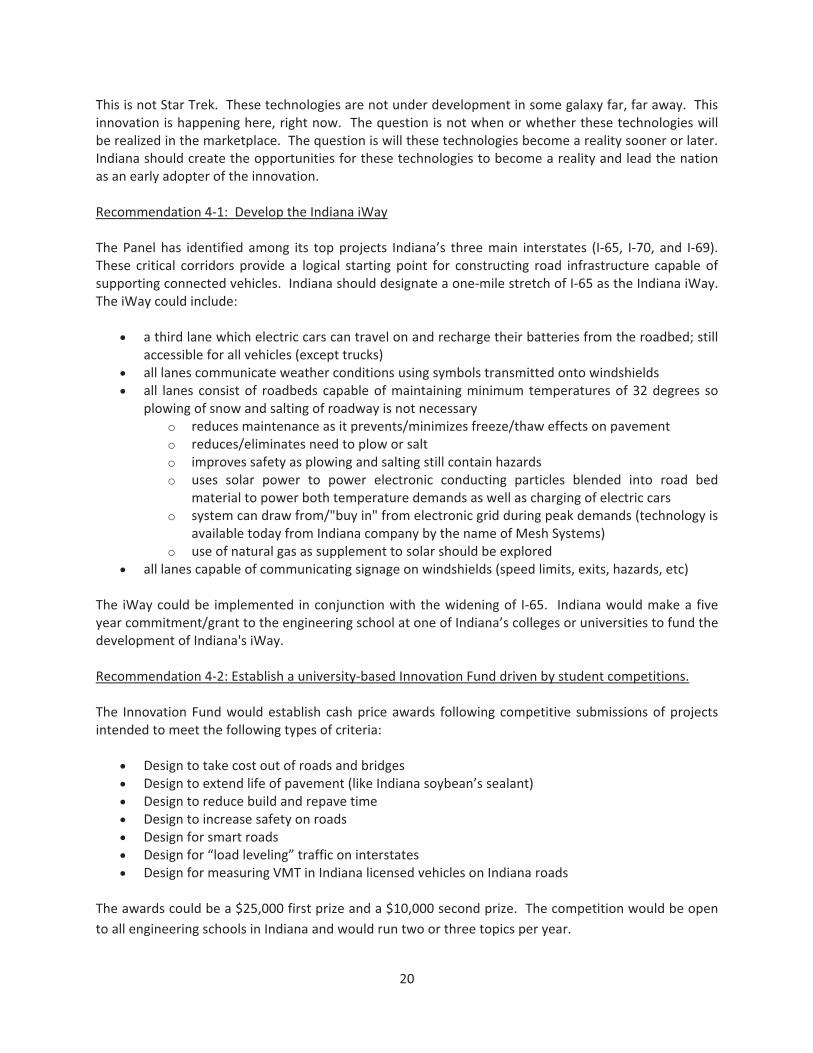
The� same� technology� could� enable� our� roads� to� communicate� air� temperature� and� road� surface�conditions.��
����Source:��http://arstechnica.com/business/2014/04/glow�in�the�dark�roads�make�debut�in�netherlands/�
� �
20��
This�is�not�Star�Trek.��These�technologies�are�not�under�development�in�some�galaxy�far,�far�away.��This�innovation�is�happening�here,�right�now.��The�question�is�not�when�or�whether�these�technologies�will�be�realized�in�the�marketplace.��The�question�is�will�these�technologies�become�a�reality�sooner�or�later.��Indiana�should�create�the�opportunities�for�these�technologies�to�become�a�reality�and�lead�the�nation�as�an�early�adopter�of�the�innovation.�
�Recommendation�4�1:��Develop�the�Indiana�iWay�
�The�Panel� has� identified� among� its� top�projects� Indiana’s� three�main� interstates� (I�65,� I�70,� and� I�69).��These� critical� corridors� provide� a� logical� starting� point� for� constructing� road� infrastructure� capable� of�supporting�connected�vehicles.��Indiana�should�designate�a�one�mile�stretch�of�I�65�as�the�Indiana�iWay.��The�iWay�could�include:�
�� a�third�lane�which�electric�cars�can�travel�on�and�recharge�their�batteries�from�the�roadbed;�still�
accessible�for�all�vehicles�(except�trucks)�� all�lanes�communicate�weather�conditions�using�symbols�transmitted�onto�windshields�� all� lanes� consist�of� roadbeds� capable�of�maintaining�minimum� temperatures�of�32�degrees� so�
plowing�of�snow�and�salting�of�roadway�is�not�necessary�o reduces�maintenance�as�it�prevents/minimizes�freeze/thaw�effects�on�pavement�o reduces/eliminates�need�to�plow�or�salt�o improves�safety�as�plowing�and�salting�still�contain�hazards�o uses� solar� power� to� power� electronic� conducting� particles� blended� into� road� bed�
material�to�power�both�temperature�demands�as�well�as�charging�of�electric�cars�o system�can�draw�from/"buy�in"�from�electronic�grid�during�peak�demands�(technology�is�
available�today�from�Indiana�company�by�the�name�of�Mesh�Systems)�o use�of�natural�gas�as�supplement�to�solar�should�be�explored�
� all�lanes�capable�of�communicating�signage�on�windshields�(speed�limits,�exits,�hazards,�etc)��
The� iWay�could�be� implemented� in�conjunction�with�the�widening�of� I�65.� � Indiana�would�make�a� five�year�commitment/grant�to�the�engineering�school�at�one�of�Indiana’s�colleges�or�universities�to�fund�the�development�of�Indiana's�iWay.�
�Recommendation�4�2:�Establish�a�university�based�Innovation�Fund�driven�by�student�competitions.�
�The� Innovation�Fund�would�establish� cash�price�awards� following�competitive� submissions�of�projects�intended�to�meet�the�following�types�of�criteria:�
�� Design�to�take�cost�out�of�roads�and�bridges��� Design�to�extend�life�of�pavement�(like�Indiana�soybean’s�sealant)�� Design�to�reduce�build�and�repave�time�� Design�to�increase�safety�on�roads�� Design�for�smart�roads�� Design�for�“load�leveling”�traffic�on�interstates�� Design�for�measuring�VMT�in�Indiana�licensed�vehicles�on�Indiana�roads�
�The�awards�could�be�a�$25,000�first�prize�and�a�$10,000�second�prize.��The�competition�would�be�open�to�all�engineering�schools�in�Indiana�and�would�run�two�or�three�topics�per�year.�
� �
21��
Recommendation�4�3:��Establish�the�Indiana�Collaborative�Transportation�Innovation�Panel.��
Indiana� should�establish�a�mechanism� for� the�ongoing� collaboration�and�exploration�of�best�practices�and� leading� technologies� in� transportation� equipment� and� infrastructure.� � The� Indiana� Collaborative�Transportation�Innovation�Panel�(“ICTIP”)�would�be�that�mechanism.��Indiana�would�establish�the�ICTIP�as�a�“think�tank”�with�the�representatives�from�across�all�modes�and�sectors�of�Indiana’s�transportation�industry,� including� auto,� rail,� air,� barge,� truck,� mass� transit,� manufacturers� (trucks,� trailers,� barges,�engines,�auto�and�auto�suppliers,�etc).� �The� ICTIP�would�meet�periodically� to� share� ideas� for� Indiana’s�future� transportation� infrastructure.� � The� state�would�commit� sufficient� resources� to�provide� staff� for�the� ICTIP.� � Conexus� could� organize,� conduct� and� report� the� results� of� the� meetings� directly� to� the�Governor�and/or�Lt.�Governor�as�a�means�for�not�only�the�results�of�this�Blue�Ribbon�Panel�to�carry�on�but�as�a�conduit�for�new�ideas�in�the�future.�
�Recommendation� 4�4:� � Pursue� the� organizational� capabilities� in� state� government� to�manage� a� fully�integrated�transportation�system.�
�The� transformative� change� in� transportation� will� create� a� seamless,� fully�integrated� transportation�system.� �Managing� that�system�and�all�of� its�moving�parts�will� require�simultaneously�choreographing�the�movement�of�people�and�goods�from�origins�to�destinations�across�all�modes�of�transportation.��The�state�will�have�to�be�able�to�learn�and�react�quickly�to�evolving�system�needs�if�the�state�is�to�be�on�the�leading�edge�of�transportation�innovation.��State�government�may�not�be�currently�organized�in�a�way�that�facilitates�the�quick�action�required.�
�At�present,�the�Indiana�Department�of�Transportation�focuses�almost�exclusively�on�roads�and�bridges.��The�Department� is�a�“project�mill”,� specializing� in� the�planning,�design,�and�procurement�of� road�and�bridge�projects.� �The�Department�has�small�divisions�assigned�to�rail,�air,�and�intermodal�facilities,�but�those� divisions� primarily� serve� as� administrators� for� federal� funds.� � Those� divisions� do� not� have� a�significant�system�management�function.�
�The�Indiana�Ports�Commission�manages�Indiana’s�port�system,�which�includes�the�land�around�the�port�facilities.��In�effect,�the�Ports�Commission�serves�as�a�landlord�for�tenants�at�the�Ports’�property.�
�Aside� from� the� minor� divisions� at� INDOT,� state� government� has� historically� played� a� small� role� in�coordinating�the�activities�at�rail,�air,�and�intermodal�facilities.��That�will�have�to�change�as�infrastructure�becomes�connected�and�coordinated.�
�Indiana’s�future�transportation�infrastructure�will�require�the�state�to�serve�as�an�“air�traffic�controller”�of� sorts,� managing� the� fully�integrated� transportation� system.� � The� infrastructure� will� require� state�policymakers�and�regulators�to�act�as�information�technology�specialists�while�also�serving�as�landlords�and�project�managers.� �The�fully�integrated�system�will� require�a�greater�emphasis�on�coordination�of�air,� rail,� and� intermodal� activities� along�with�water�and� roads.� � The� state�needs� to�determine�how� to�most� effectively� organize� the� structure� of� its� state� agencies� to� plan� for,� implement,� and�manage� the�connected,� coordinated� transportation� systems� brought� to� Indiana� by� inevitable� transformative�innovations.�
��
�
Introduction:
five

� �
23��
BACKGROUND�INFORMATION��The�following�presents�a�series�of�maps,�charts,�and�other�data�compilations�the�Blue�Ribbon�Panel�used�to�formulate�the�context�for�identifying�the�next�generation�of�transportation�infrastructure.��
� �
24��
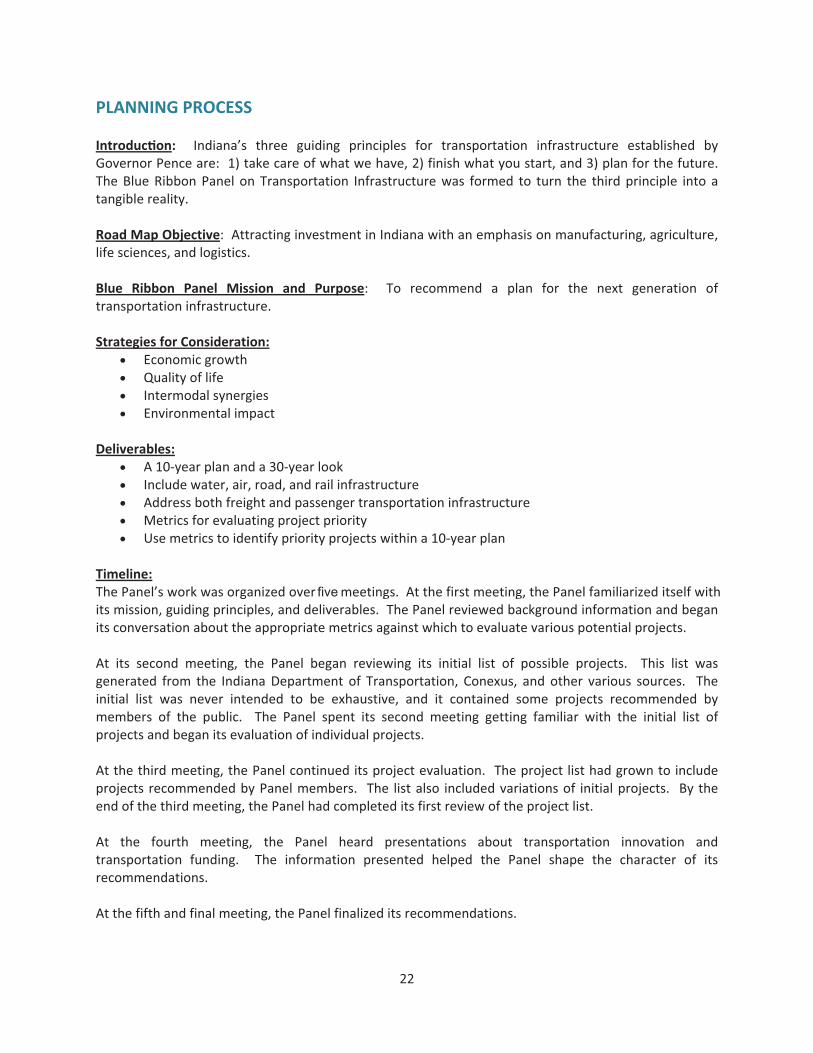
A. Projected�Rate�of�Population�Growth�–�2010�2050�
Heavy�population�growth�is�projected�in�Marion�County�and�surrounding�counties.��Moderate�growth�is�projected� in� the� southeast,� northeast,� and� northwest.� � Population� decline� is� projected� for� ring�surrounding�Indianapolis�metro�area.�
�
�
Source:�US�Census�Bureau
� �
25��
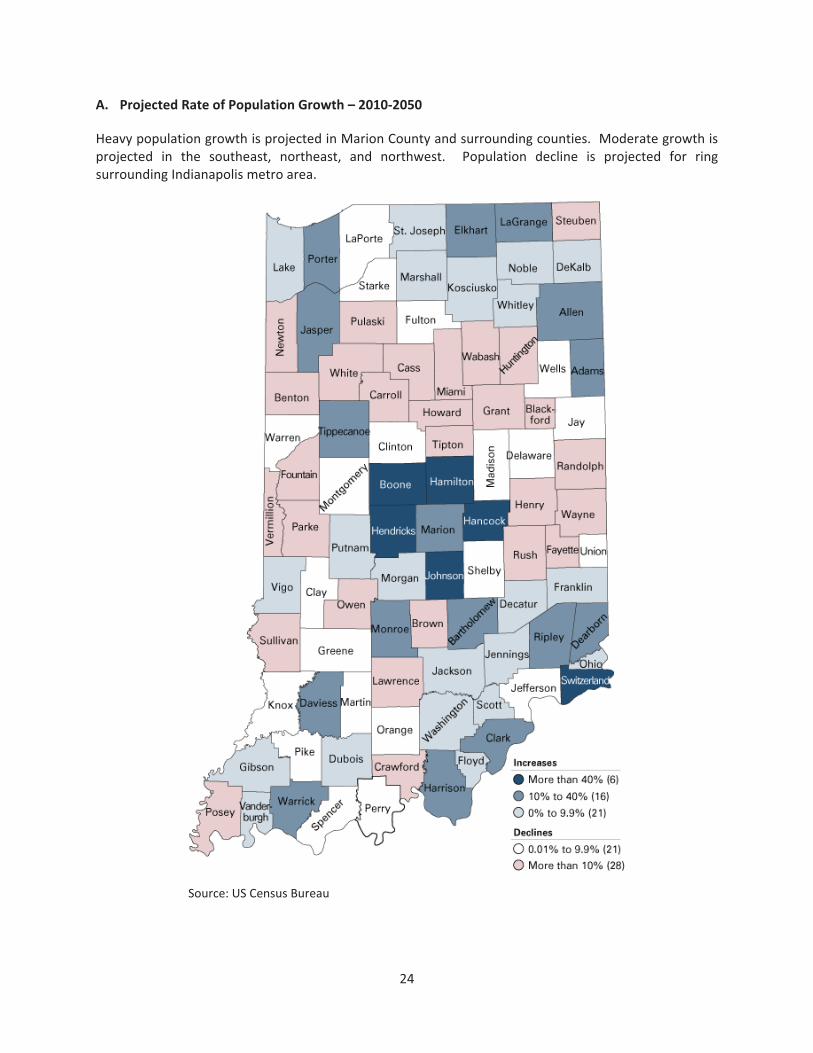
B. Existing�Port�Infrastructure�
Indiana� has� three� ports:� � Burns� Harbor,� Mount� Vernon,� and� Jeffersonville.� � Burns� Harbor� is� able� to�accommodate� seagoing� ships,� while� Mount� Vernon� and� Jeffersonville� provide� access� to� the� Gulf� of�Mexico� via� the� Inland� Waterway� System� (Ohio� and� Mississippi� Rivers).� � Indiana� has� 400� miles� of�navigable�waterways.����
��
� Source:�Indiana�Department�of�Transportation
� �
26��
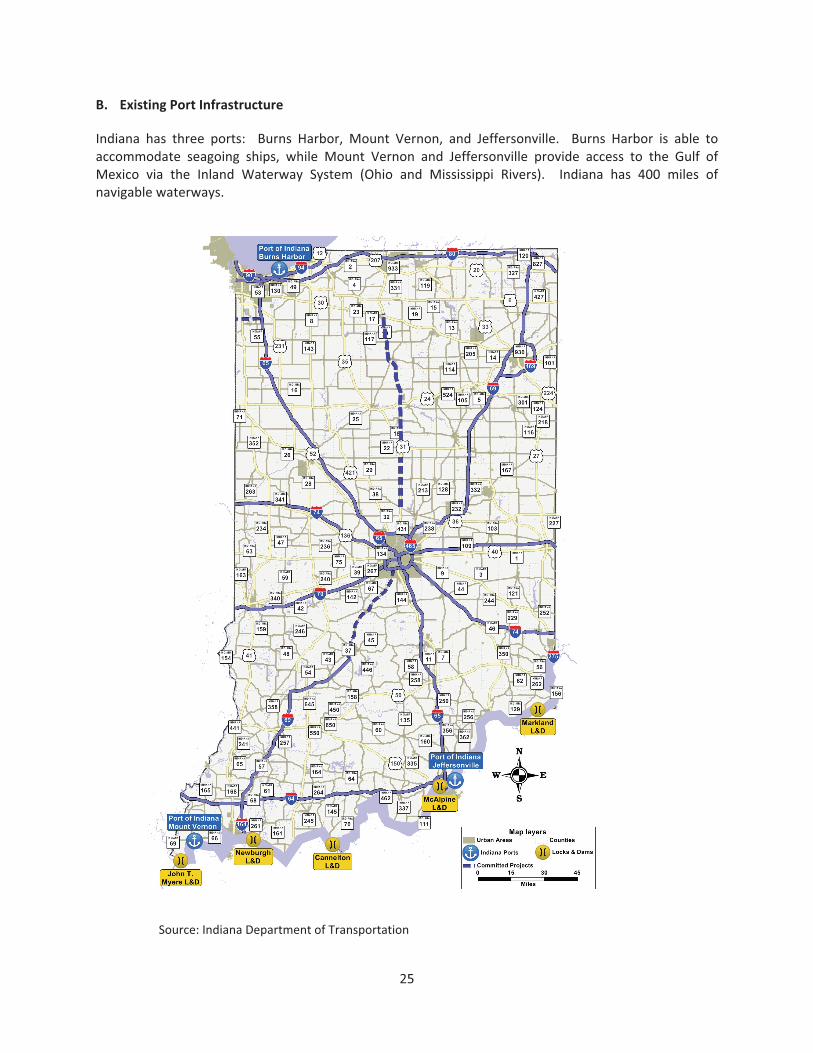
C. Existing�Airport�Infrastructure�
Indiana�has�112�airport�facilities�available�for�use�by�the�public.��Of�those�facilities,�69�are�a�part�of�the�Indiana�State�Aviation�System�Plan.�
�
�
�
�
Source:�Indiana�Department�of�Transportation
� �
27��
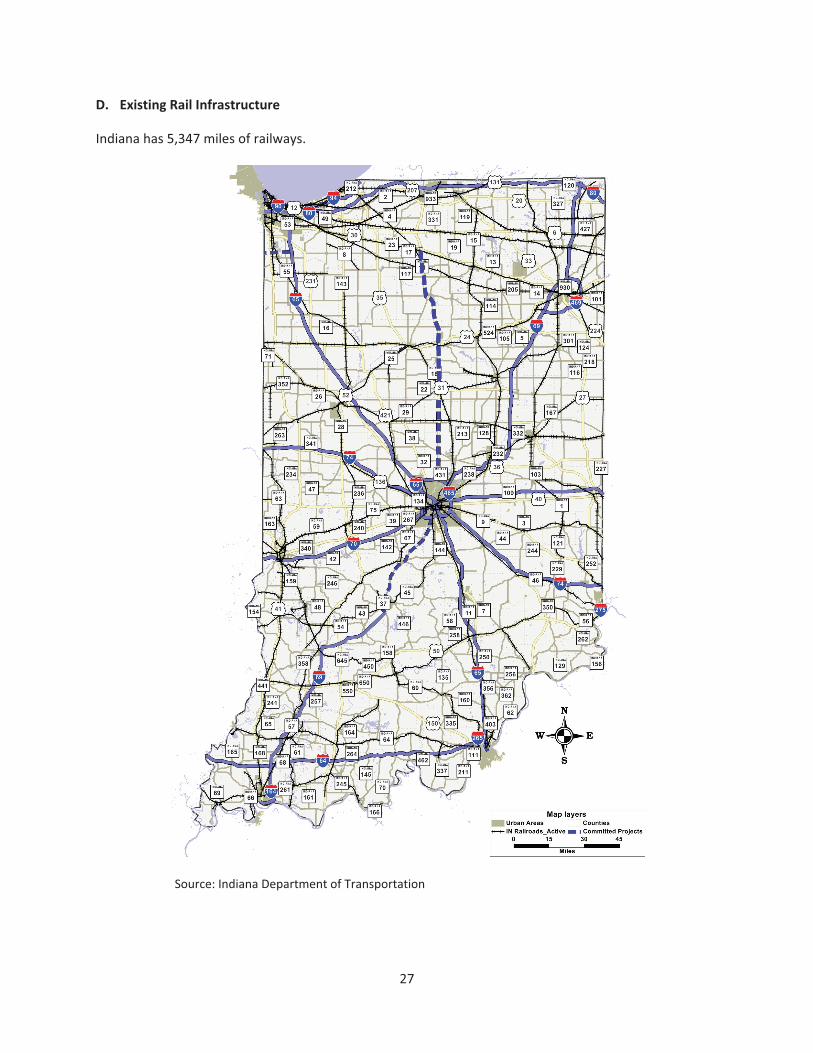
D. Existing�Rail�Infrastructure�
Indiana�has�5,347�miles�of�railways.��
�
�
�
Source:�Indiana�Department�of�Transportation
� �
28��
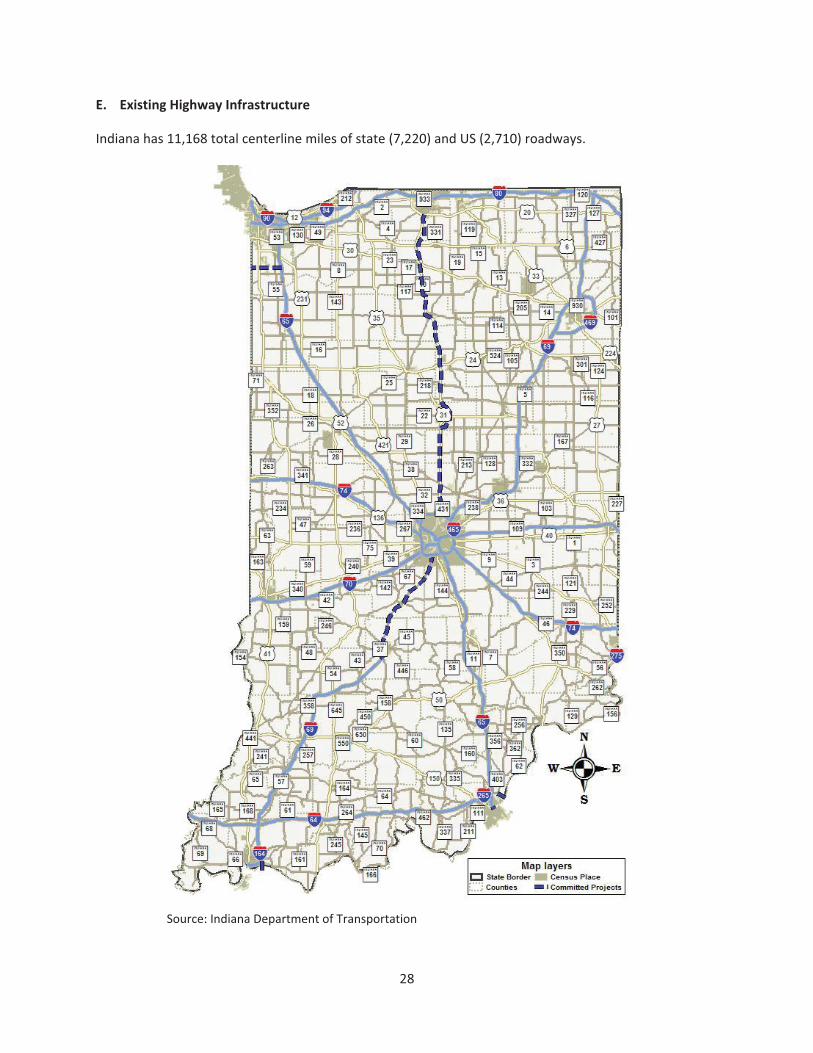
E. Existing�Highway�Infrastructure�
Indiana�has�11,168�total�centerline�miles�of�state�(7,220)�and�US�(2,710)�roadways.���
�
�
Source:�Indiana�Department�of�Transportation
� �
29��
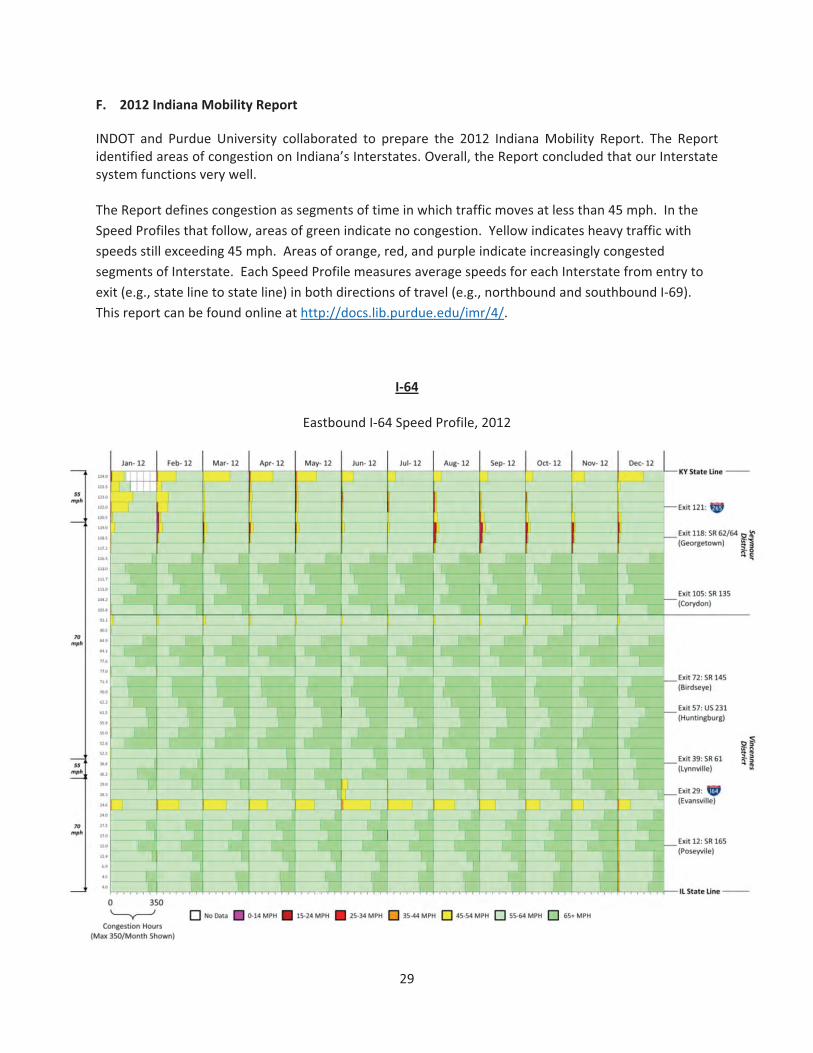
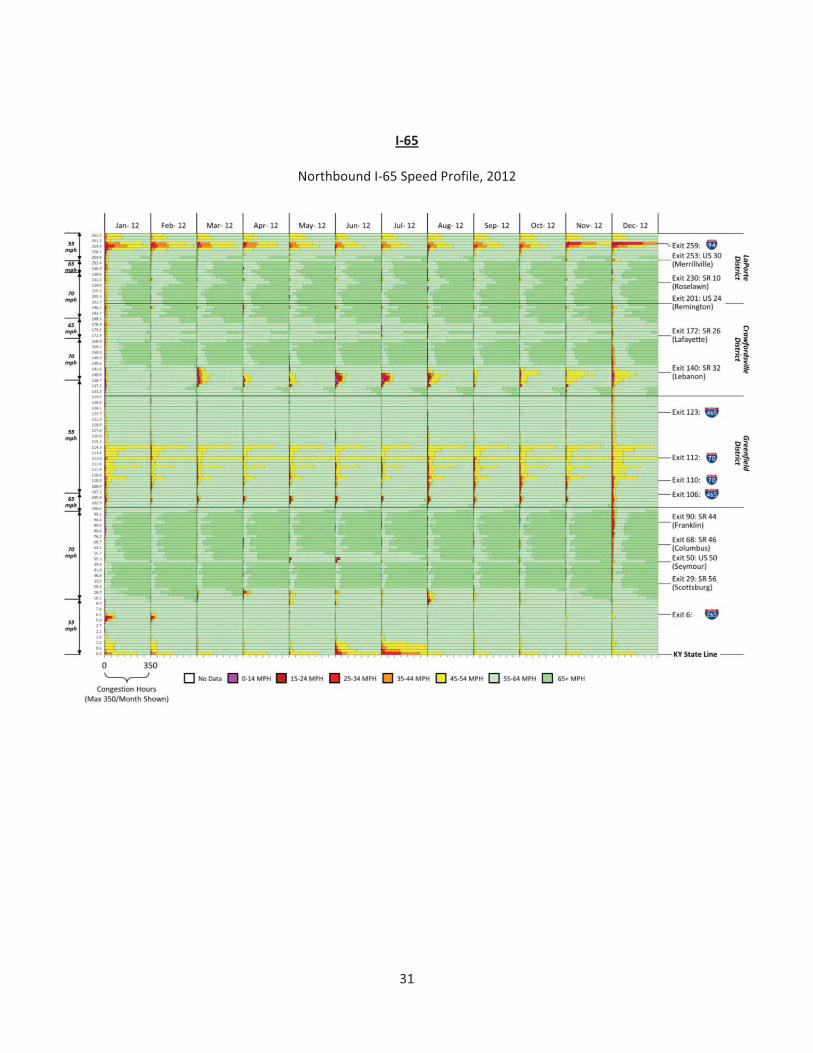
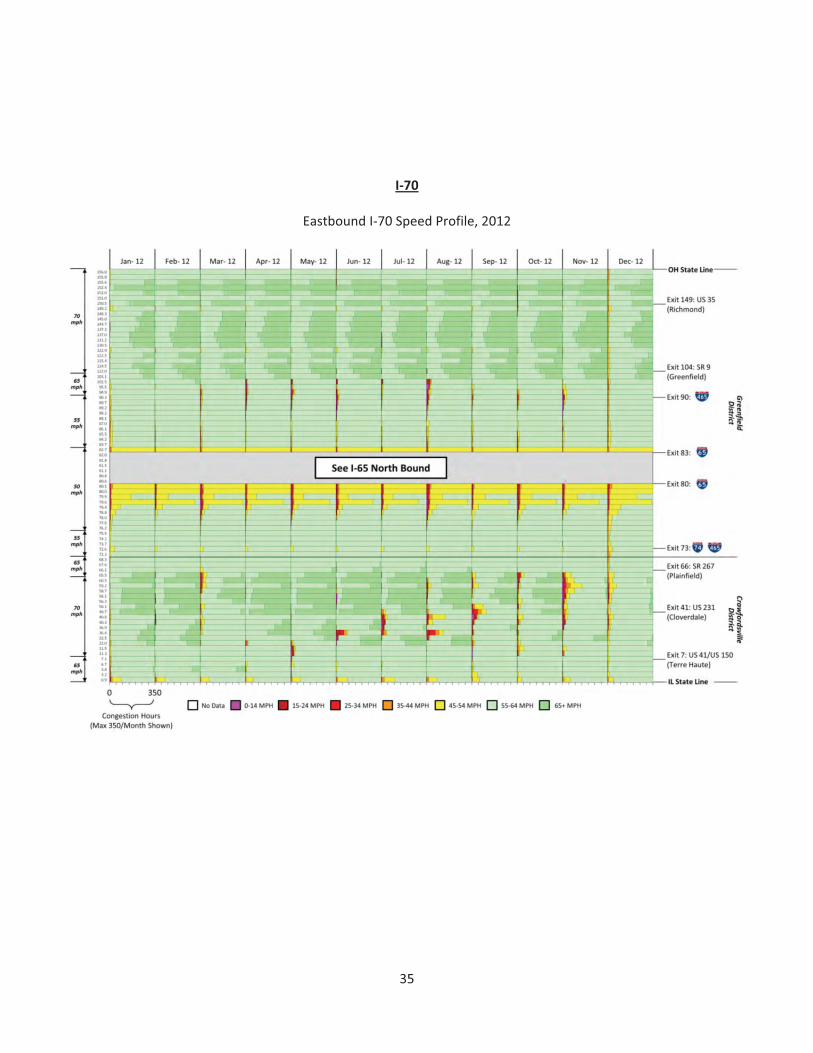
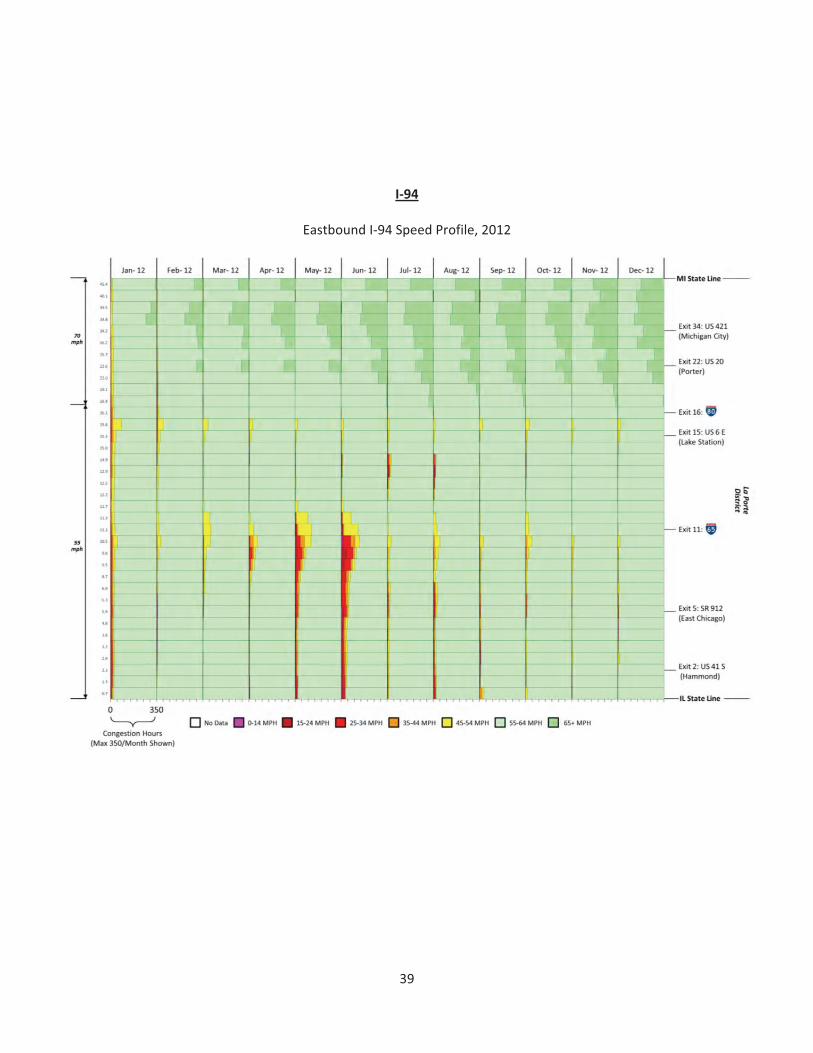
F. 2012�Indiana�Mobility�Report�
INDOT� and� Purdue� University� collaborated� to� prepare� the� 2012� Indiana�Mobility� Report.� The� Report�identified�areas�of�congestion�on�Indiana’s�Interstates.�Overall,�the�Report�concluded�that�our�Interstate�system�functions�very�well.�
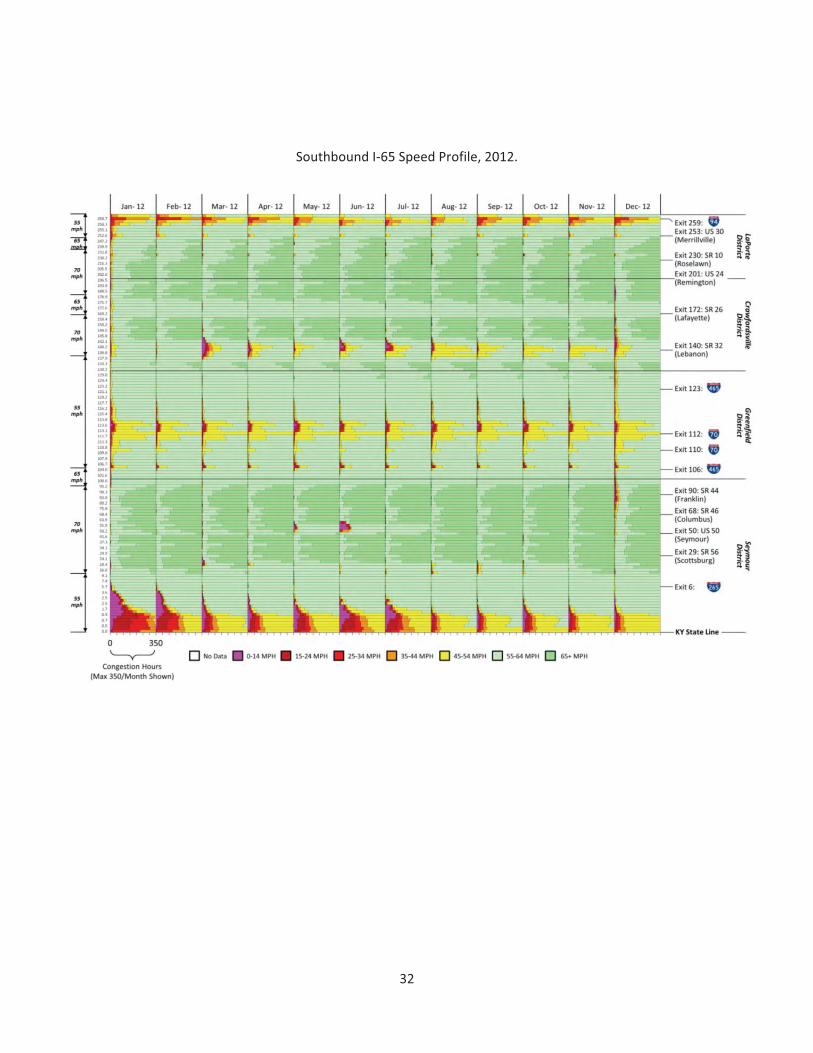
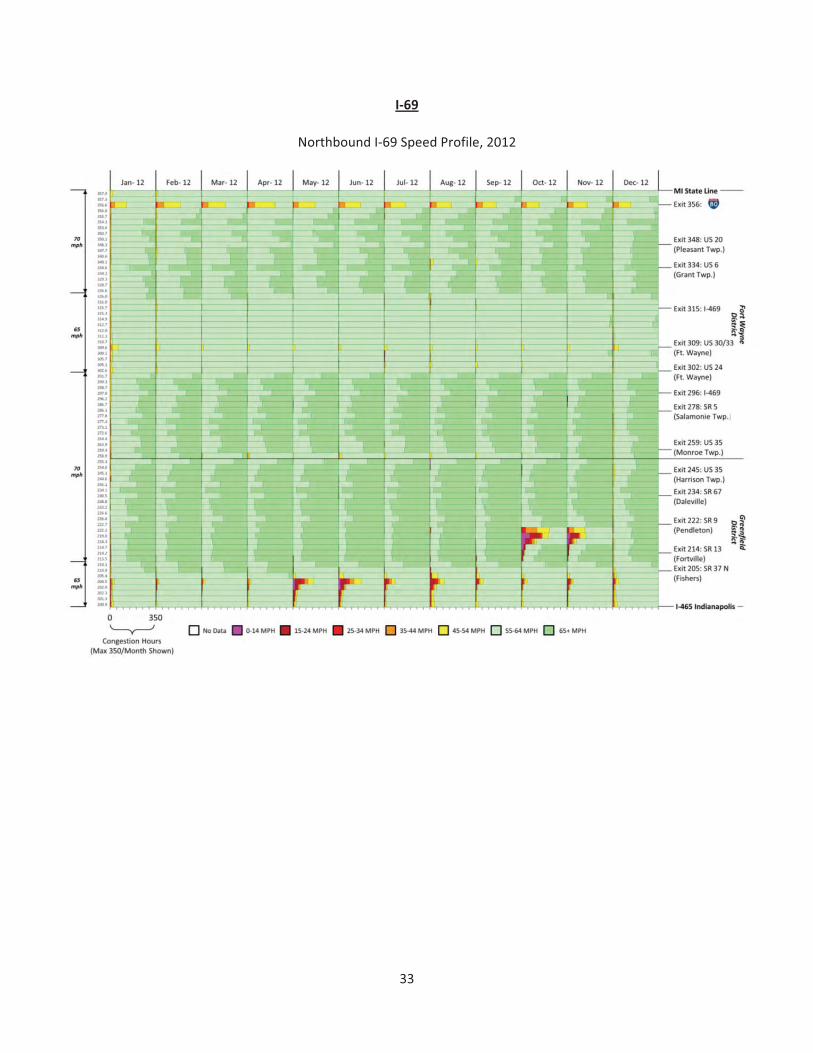
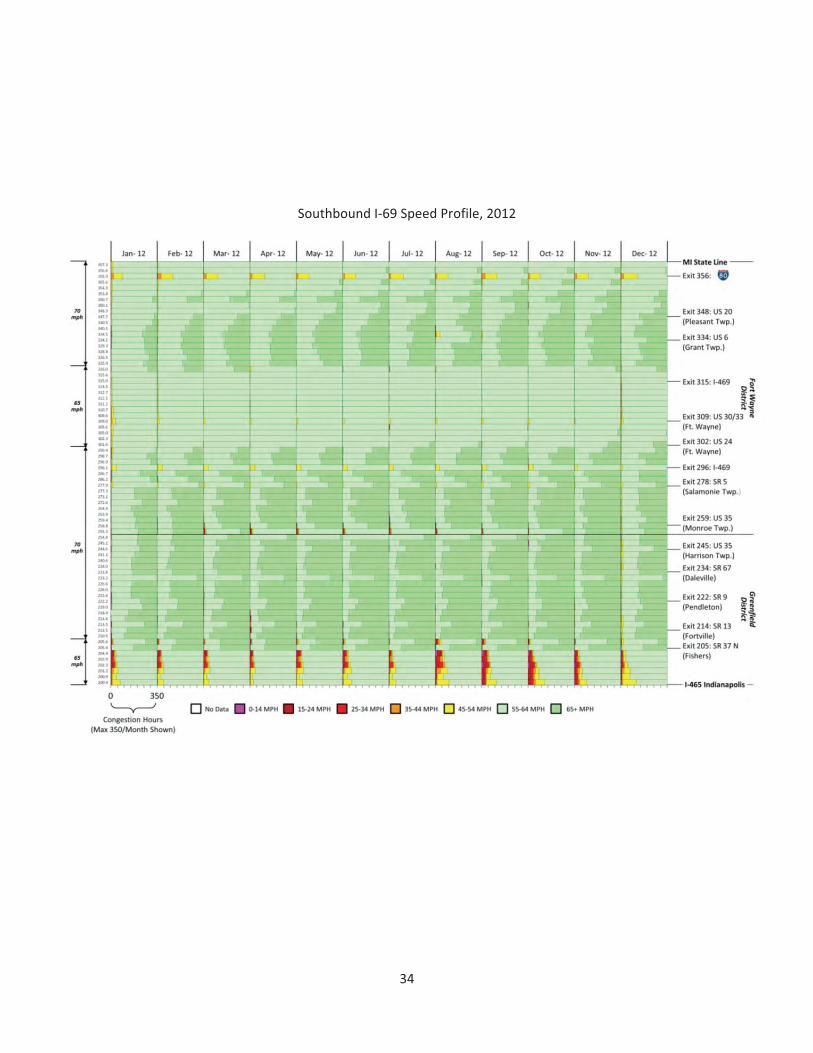
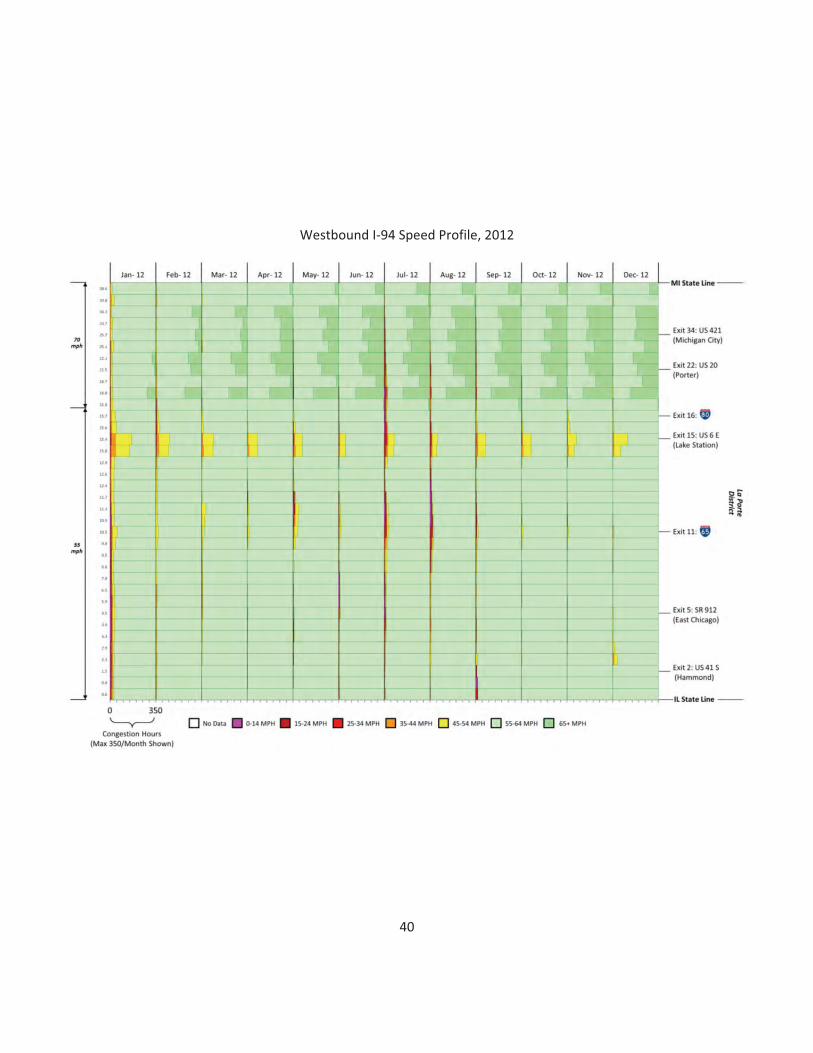
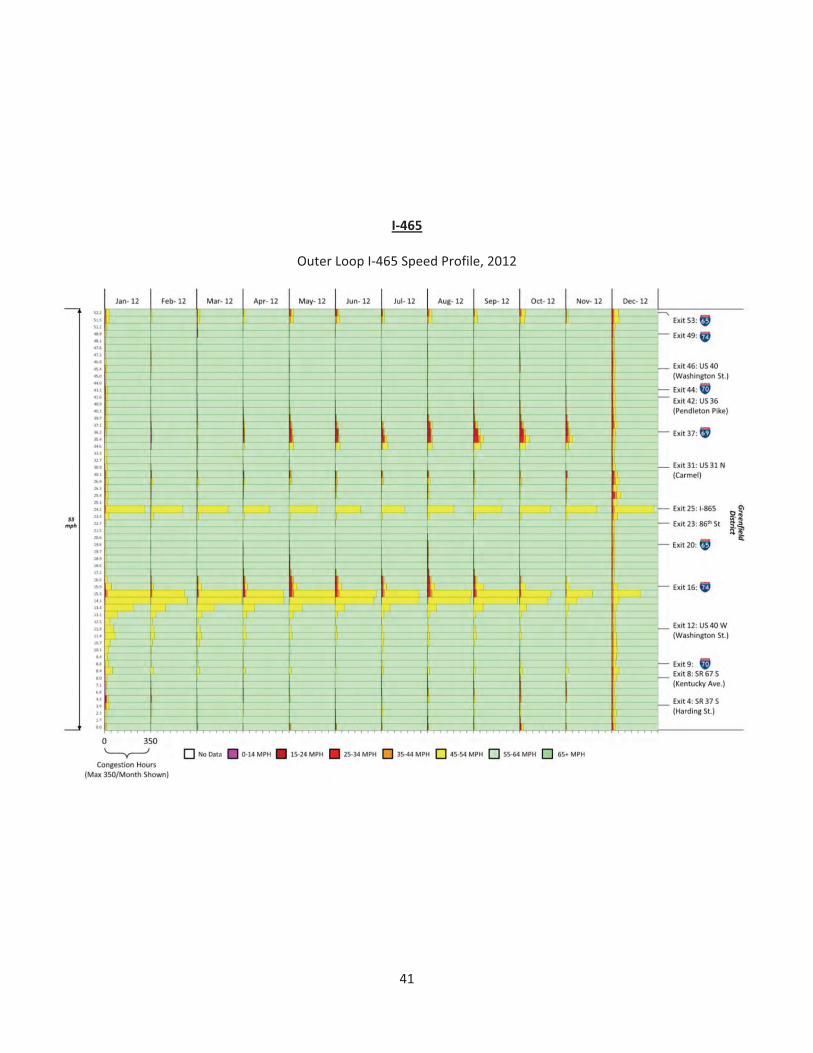
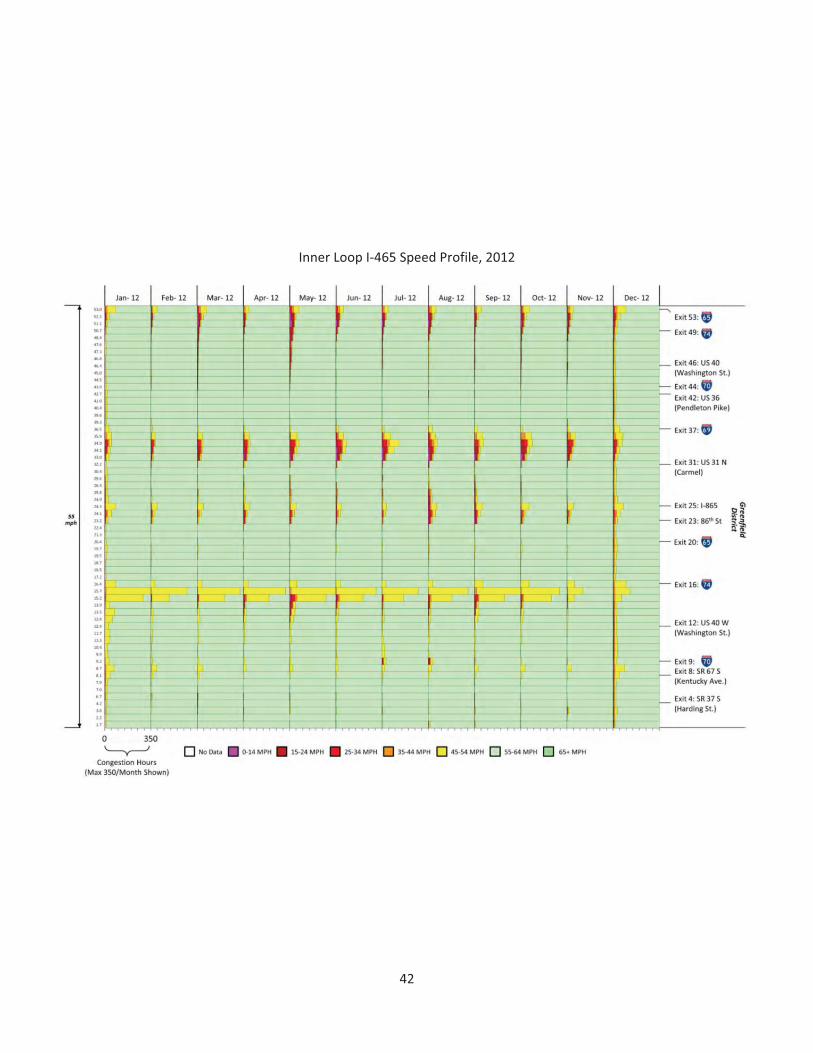
�The�Report�defines�congestion�as�segments�of�time�in�which�traffic�moves�at�less�than�45�mph.��In�the�Speed�Profiles�that�follow,�areas�of�green�indicate�no�congestion.��Yellow�indicates�heavy�traffic�with�speeds�still�exceeding�45�mph.��Areas�of�orange,�red,�and�purple�indicate�increasingly�congested�segments�of�Interstate.��Each�Speed�Profile�measures�average�speeds�for�each�Interstate�from�entry�to�exit�(e.g.,�state�line�to�state�line)�in�both�directions�of�travel�(e.g.,�northbound�and�southbound�I�69).�This�report�can�be�found�online�at�http://docs.lib.purdue.edu/imr/4/. ���
I�64��
Eastbound�I�64�Speed�Profile,�2012��
� �
30��
�
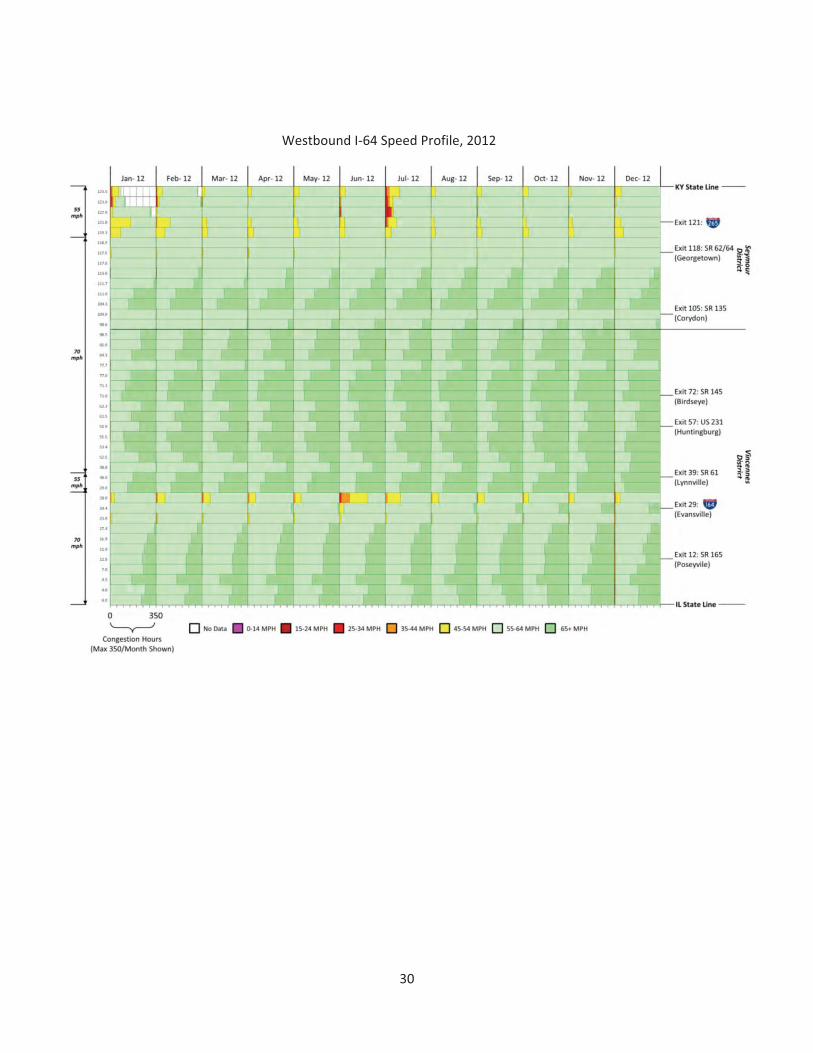
Westbound�I�64�Speed�Profile,�2012�
�
�
�
�
�
�
�
�
�
� �
31��
�
I�65��
Northbound�I�65�Speed�Profile,�2012�
����������
� �
32��
��
Southbound�I�65�Speed�Profile,�2012.�
�
�
�
�
�
�
�
� �
33��
I�69��
Northbound�I�69�Speed�Profile,�2012��
� �
34��
Southbound�I�69�Speed�Profile,�2012��
�
�
�
�
�
�
� �
35��
�
��
I�70��
Eastbound�I�70�Speed�Profile,�2012��
�
�
�
�
�
�
� �
36��
�
�
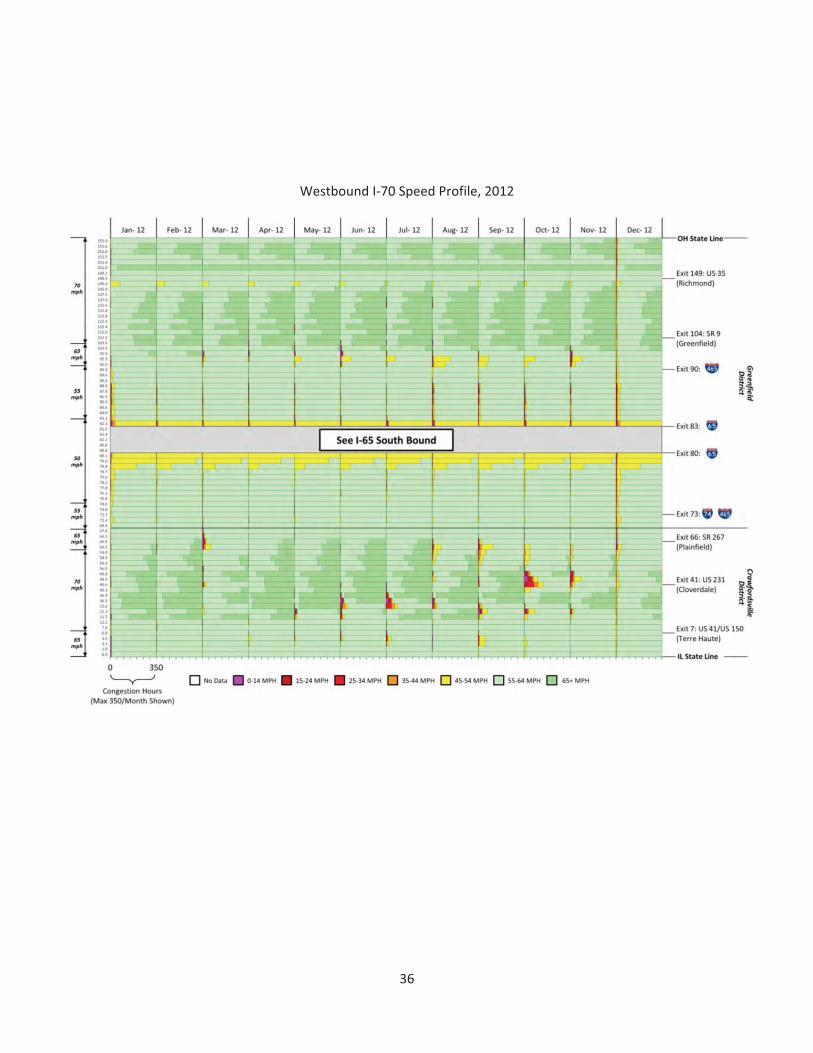
Westbound�I�70�Speed�Profile,�2012��
�
�
�
�
�
�
�
� �
37��
�
�
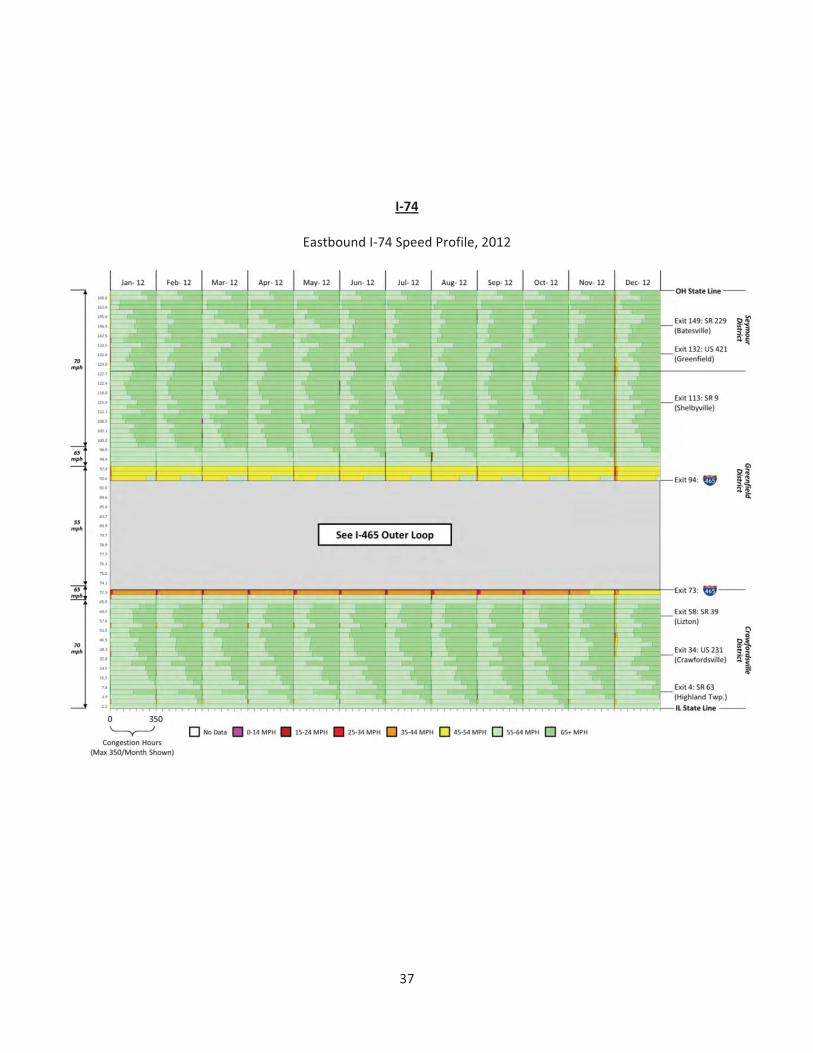
�I�74�
�Eastbound�I�74�Speed�Profile,�2012�
�
�
�
�
�
�
�
� �
38��
�
�
�
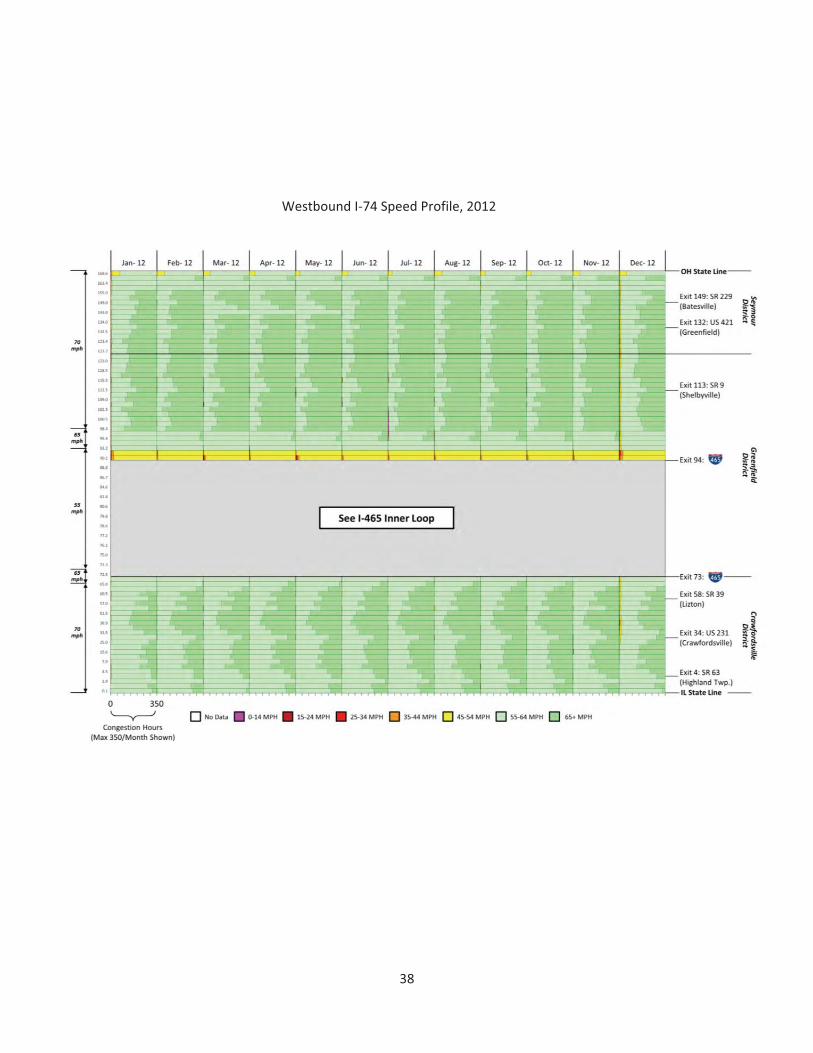
Westbound�I�74�Speed�Profile,�2012�
�
�
�����������
� �
39��
�����
I�94��
Eastbound�I�94�Speed�Profile,�2012��
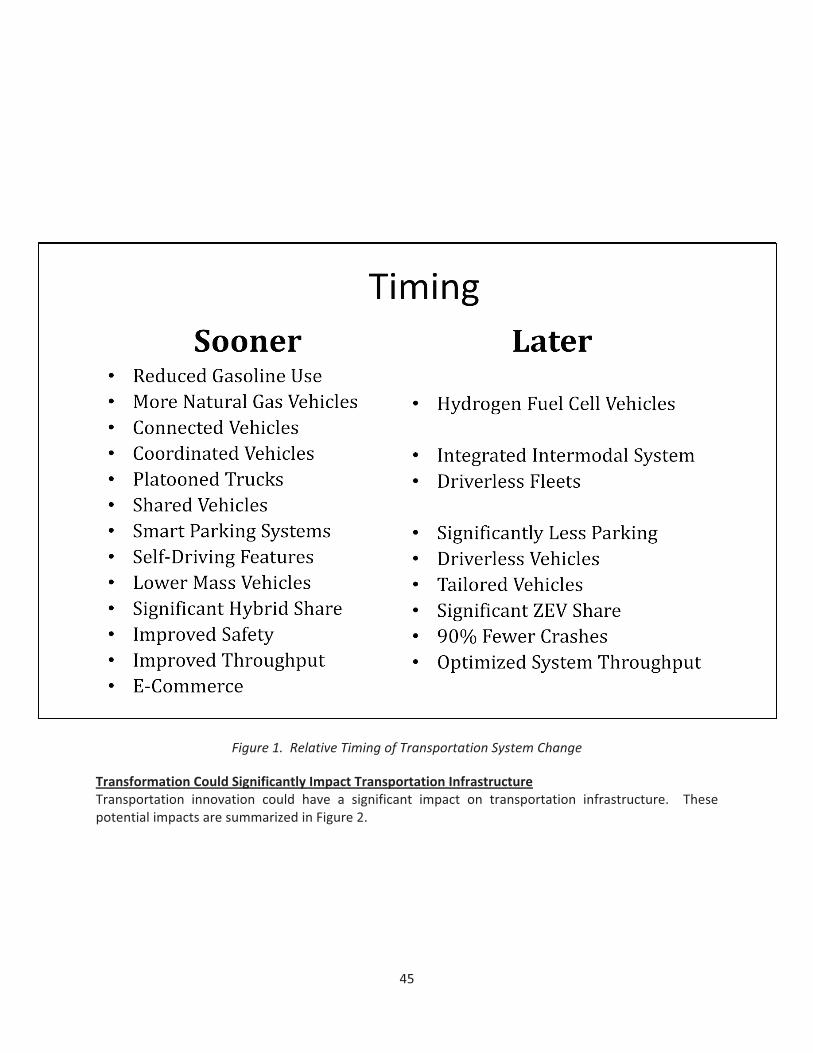
when
� �
46��
�
�
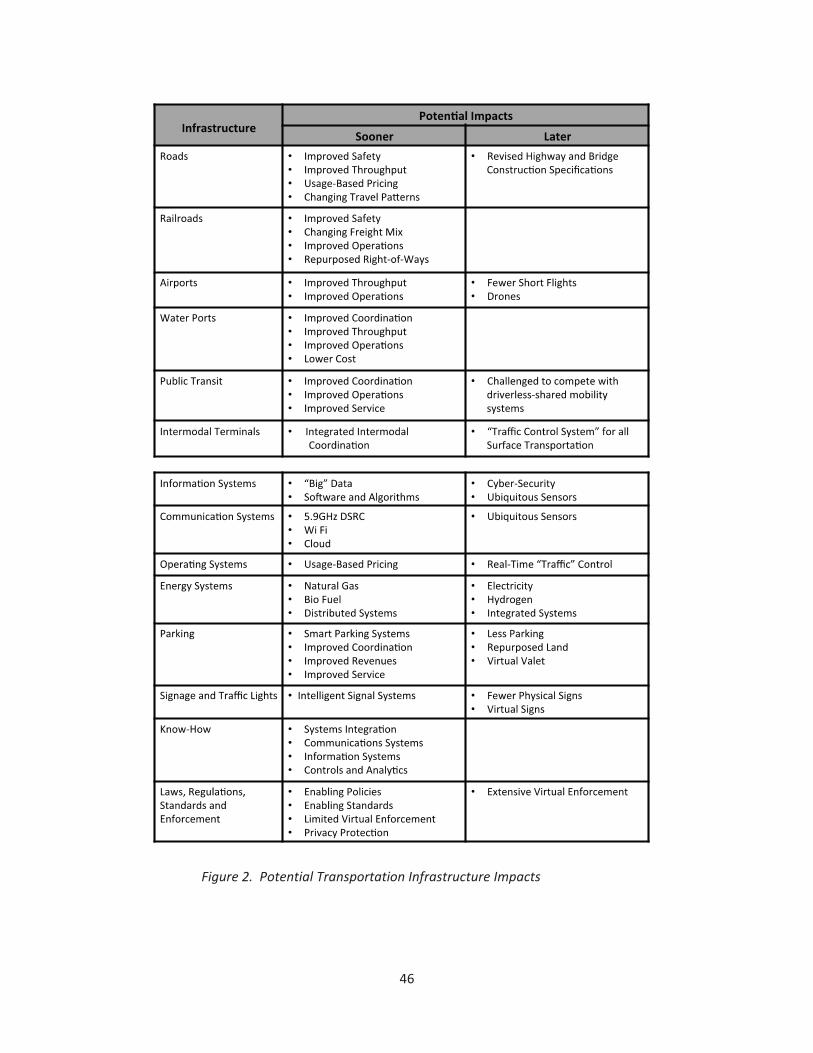
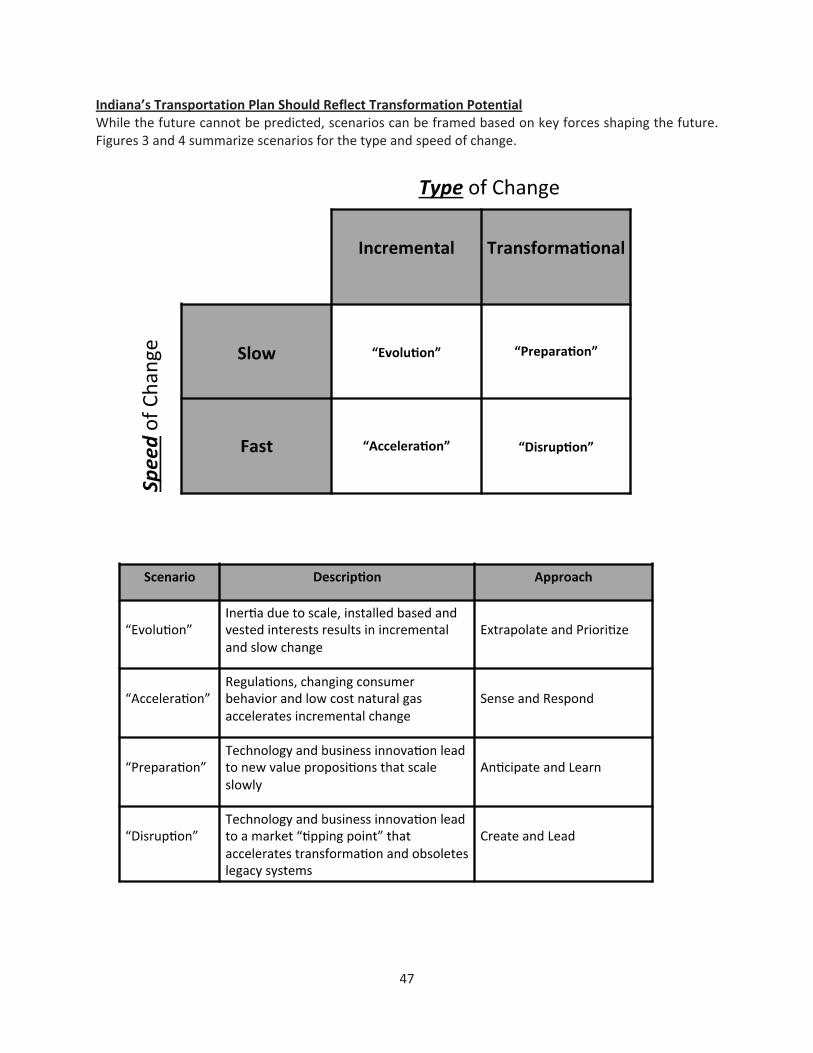
���� ���Figure�2.��Potential�Transportation�Infrastructure�Impacts�����
� �
48��
The�range�of�possible�futures�implies�Indiana�must�simultaneously�sustain�its�existing�infrastructure�and�prepare�for�the�possibility�of�transformational�change.��Declining�revenue�for�infrastructure�makes�this�an�especially�difficult�challenge.��
�Leadership�will� require� purposeful� decisions� on� new� approaches� to� roadway� infrastructure� financing,�enabling� policy� for� transportation� innovation� and� projects� that� “get� in� front� of� the� inevitable.”� � In�addition,� Indiana� should� pursue� infrastructure� throughput� and� productivity� improvements� to� make�better�use�of�existing� infrastructure�and� free�up�resources� to�prepare� for�change.� �Finally,� recognizing�that�infrastructure�is�more�than�a�prioritized�list�of�projects,�Indiana�should�plan�transportation�as�one�totally� integrated� system.� � This� will� enhance� competitiveness� vs.� other� States� and� simultaneously�improve�performance�and�reduce�cost.�
�Specific�suggestions�include:�
�1. Focus�on�throughput�improvement�in�addition�to�preserving�existing�infrastructure��
� Create�a�system�throughput�improvement�process�and�test�opportunities�� Aim� to� double� the� throughput� of� Indiana’s� logistics� corridors� using� connected� and�
autonomous�vehicle�technology�and�intermodal�coordination�2. Think�big,�start�small,�and�learn�fast�relative�to�transportation�innovation�
� Comprehend�what�is�possible�� Be�sure�know�how�exists�in�Indiana�� Consider� a� community� like� Bloomington� as� a� first�mover� for� connected� and� autonomous�
vehicles�� Position�for�new�approaches�to�financing�transportation�infrastructure�� Develop�an�intermodal�logistics�coordination�system�� Consider�making�Indiana�a�test�bed�(and�incubator)�for�logistics�systems�technology�
3. Consider�infrastructure�for�all�modes�simultaneously�as�one�totally�integrated�system�� Integrated�information�systems�� Integrated�communications�systems�� Enhanced�robustness�based�on�better�capacity�utilization�and�infrastructure�pricing�
4. Integrate�transportation,�energy�and�environmental�policies�� Align�policy�objectives�and�remove�disconnects�
��
�
���������
� �
49��
TRANSPORTATION�FUNDING��The�following�summaries�were�prepared�by�Dan�Brassard�and�Kendra�York.�
�������������������������������������������
� �
50��
Indiana’s�Transportation�Financial�Outlook������������������������������������������������������������������������������������������������������������������������������Dan�Brassard���������������������������������������������������������������������������� ���������������������������������������������������������������������������������������������������������������������Chief�Financial�Officer,�INDOT������������������������������������������������������������������������������������������������������������������������������������������������������April�25,�2014�
�In� the� post�Major� Moves� era,� INDOT� has� adopted� Preservation� as� its� first� priority.� � Consistent� with�Governor�Pence’s�motto�toward�transportation,�“Take�care�of�what�you�have,�Finish�what�you�start,�and�Plan�for�the�future”,�INDOT�is�working�hard�to�accomplish�all�three�facets.��Given�INDOT’s�annual�use�of�funds�(currently�at�~$1.5B)�driven�largely�by�motor�fuel�taxes,�BMV�fees�and�a�small�slice�of�State�sales�tax,� there� is� little�opportunity� to�economically�balance�both�preservation�and�added�capacity�when� it�comes�to�transportation�infrastructure.�
�Today,� approximately� 85%� of� INDOT’s� budget� is� consumed�with� Operating� Expense,� Debt� Service� on�previous�bond�issuances,�and�Preservation�investment.��The�other�15%�is�consumed�with�finalizing�some�Major� Moves� projects� as� well� as� providing� up�front� equity� investments� in� select� public�private�partnership�projects�(I69�Section�5,�Ohio�River�Bridge,�and�Illiana�Expressway).�
�The�vast�majority�of�INDOT�funding�comes�from�Federal�and�State�sources.��Motor�fuel�taxes�represent�virtually�all�of�the�Federal�funds�while�68%�of�the�State�funds�are�sourced�from�motor�fuel�taxes.��Vehicle�registrations,� licenses,� and� title� fees�make� up� the� next� largest� source� of� state� transportation� funding�(22%).��
�In�FY2013,�HB1001�provided�a�significant�increase�(~$100M)�in�State�revenue�starting�in�FY2014.��While�providing�needed�resources�for�matching�Federal�funds�and�fulfilling�Preservation�investment�needs,�it�did�not�address�the�long�term�outlook�of�declining�revenues�associated�with�fuel�taxes.�
�One�of�the�biggest�obstacles�from�a�planning�perspective�is�the�lack�of�certainty�around�Federal�funding�–� INDOT’s� largest� single� funding� source� (~$700M� annually).� � There� has� not� been� a� long� term�transportation� funding� bill� passed� in� Washington� since� the� expiration� of� the� previous� bill� in� 2009.��Contributing�to�the�uncertainty�is�the�looming�insolvency�of�the�Federal�Highway�Trust�Fund,�projected�to�hit�critically�low�levels�in�July,�2014�unless�more�subsidy�funds�are�found�to�maintain�payments�to�the�States�for�road�and�bridge�projects.�
�In�2005/2006,�INDOT�was�the�beneficiary�of�proceeds�resulting�from�the�lease�of�the�Indiana�Toll�Road.��At�the�end�of�FY2013,�nearly�96%�of�those�funds�have�been�obligated�on�major�projects�across�the�entire�state.� � For� FY2016� and� every� 5� years� thereafter,� INDOT� shall� receive� the� interest� from� the� Next�Generation�Trust�Fund�($500M)�that�was�established�as�a�result�of�the�lease�mentioned�above.� �Based�on� current� investments� and� the� applicable� market� rates,� this� source� of� funds� is� projected� to� equal�$124M�and�is�currently�being�planned�for�additional�preservation�work.�
�Due�to�declining�revenues�(largely�driven�by�fewer�fuel�tax�dollars),�INDOT’s�projected�5�year�spending�plan� reflects�more� investment� in�Preservation�and� less�directed� to� large� capacity�projects.� �Operating�expense�remains�relatively�flat�across�all�years.� �Comparing�2003�to�2019,� INDOT�is�expected�to�spend�only�$200M�more�in�FY2019.��Yet,�when�adjusted�for�construction�inflation,�INDOT�should�be�spending�$1.2B�more�than�2003.��Revenues�are�not�there�to�support�the�needs�nor�can�they�maintain�the�rate�of�inflation�which�is�projected�to�grow�at�nearly�60%�faster�than�the�CPI�(consumer�price� index)�over�the�next�10�years.�
�
� �
51��
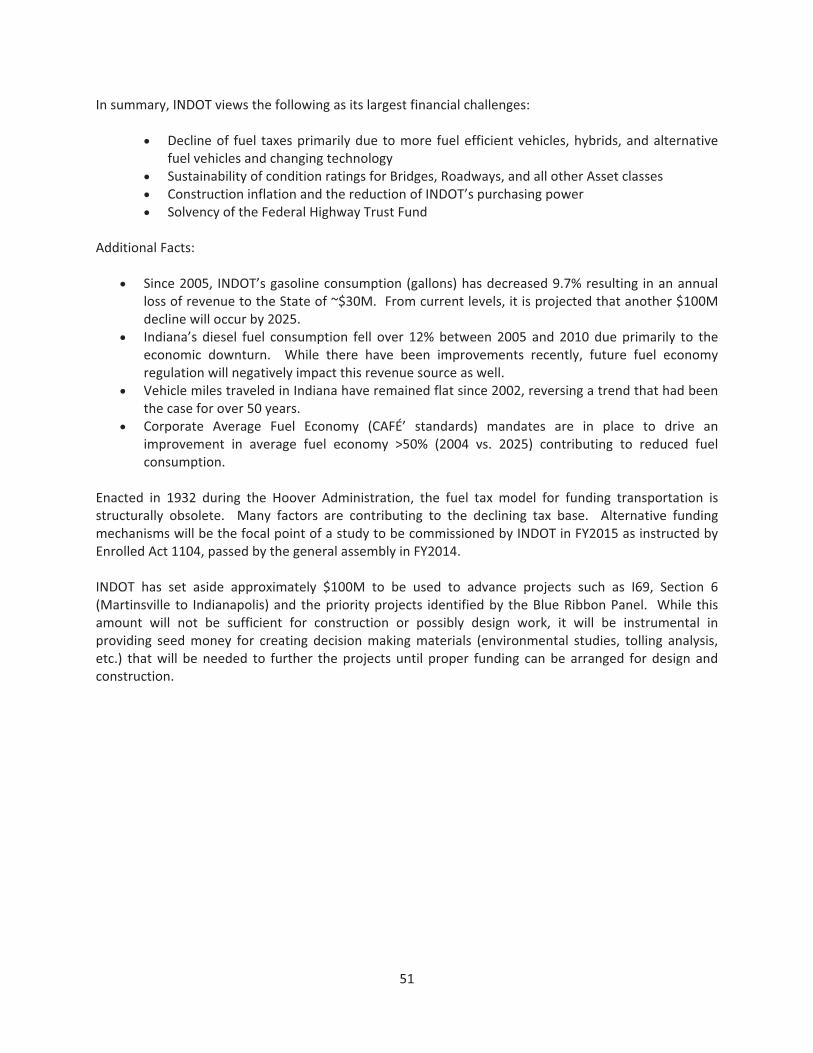
In�summary,�INDOT�views�the�following�as�its�largest�financial�challenges:��� Decline�of� fuel� taxes�primarily�due�to�more� fuel�efficient�vehicles,�hybrids,�and�alternative�
fuel�vehicles�and�changing�technology�� Sustainability�of�condition�ratings�for�Bridges,�Roadways,�and�all�other�Asset�classes�� Construction�inflation�and�the�reduction�of�INDOT’s�purchasing�power�� Solvency�of�the�Federal�Highway�Trust�Fund��
Additional�Facts:��
� Since�2005,� INDOT’s�gasoline�consumption�(gallons)�has�decreased�9.7%�resulting� in�an�annual�loss�of�revenue�to�the�State�of�~$30M.��From�current�levels,�it�is�projected�that�another�$100M�decline�will�occur�by�2025.��
� Indiana’s� diesel� fuel� consumption� fell� over� 12%�between�2005� and�2010�due�primarily� to� the�economic� downturn.� � While� there� have� been� improvements� recently,� future� fuel� economy�regulation�will�negatively�impact�this�revenue�source�as�well.�
� Vehicle�miles�traveled�in�Indiana�have�remained�flat�since�2002,�reversing�a�trend�that�had�been�the�case�for�over�50�years.�
� Corporate� Average� Fuel� Economy� (CAFɒ� standards)� mandates� are� in� place� to� drive� an�improvement� in� average� fuel� economy� >50%� (2004� vs.� 2025)� contributing� to� reduced� fuel�consumption.��
Enacted� in� 1932� during� the� Hoover� Administration,� the� fuel� tax� model� for� funding� transportation� is�structurally� obsolete.� � Many� factors� are� contributing� to� the� declining� tax� base.� � Alternative� funding�mechanisms�will�be�the�focal�point�of�a�study�to�be�commissioned�by�INDOT�in�FY2015�as�instructed�by�Enrolled�Act�1104,�passed�by�the�general�assembly�in�FY2014.�
�INDOT� has� set� aside� approximately� $100M� to� be� used� to� advance� projects� such� as� I69,� Section� 6�(Martinsville� to� Indianapolis)�and� the�priority�projects� identified�by� the�Blue�Ribbon�Panel.� �While� this�amount� will� not� be� sufficient� for� construction� or� possibly� design� work,� it� will� be� instrumental� in�providing� seed�money� for� creating� decision�making�materials� (environmental� studies,� tolling� analysis,�etc.)� that�will� be� needed� to� further� the�projects�until� proper� funding� can�be�arranged� for�design� and�construction.��
�
�
�
�
�
�
�
• • • • • •
• •
1
• • •
1
• •
� �
54��
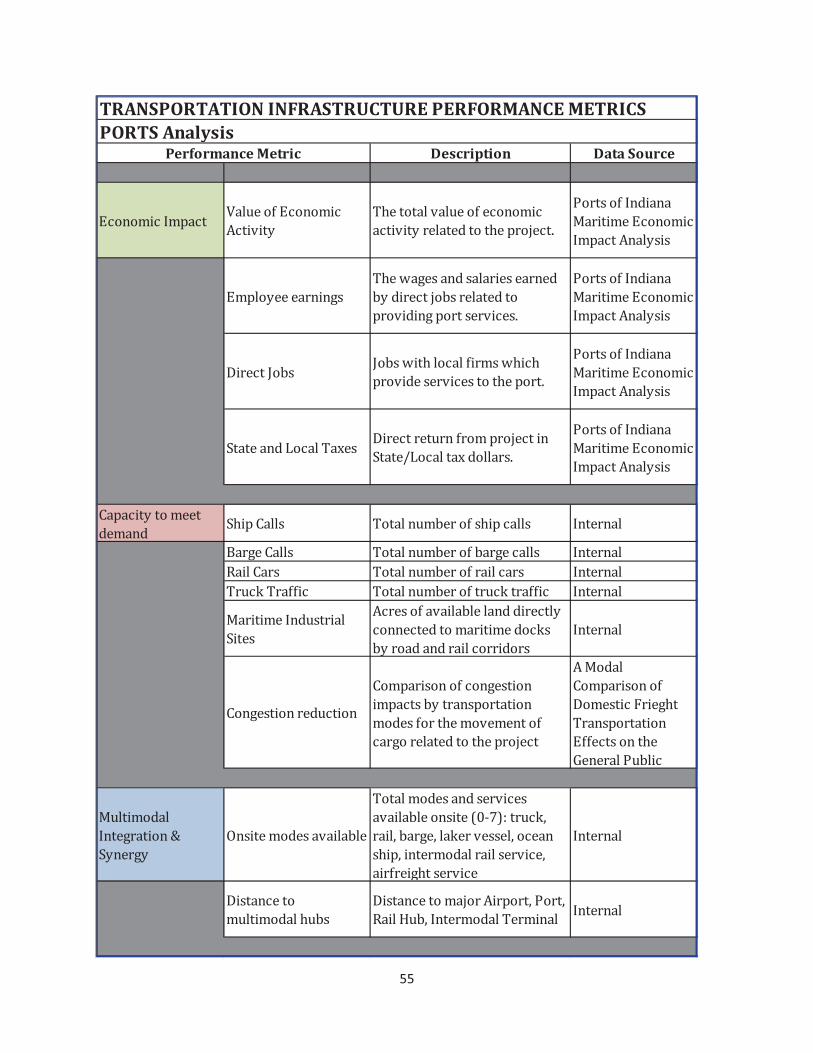
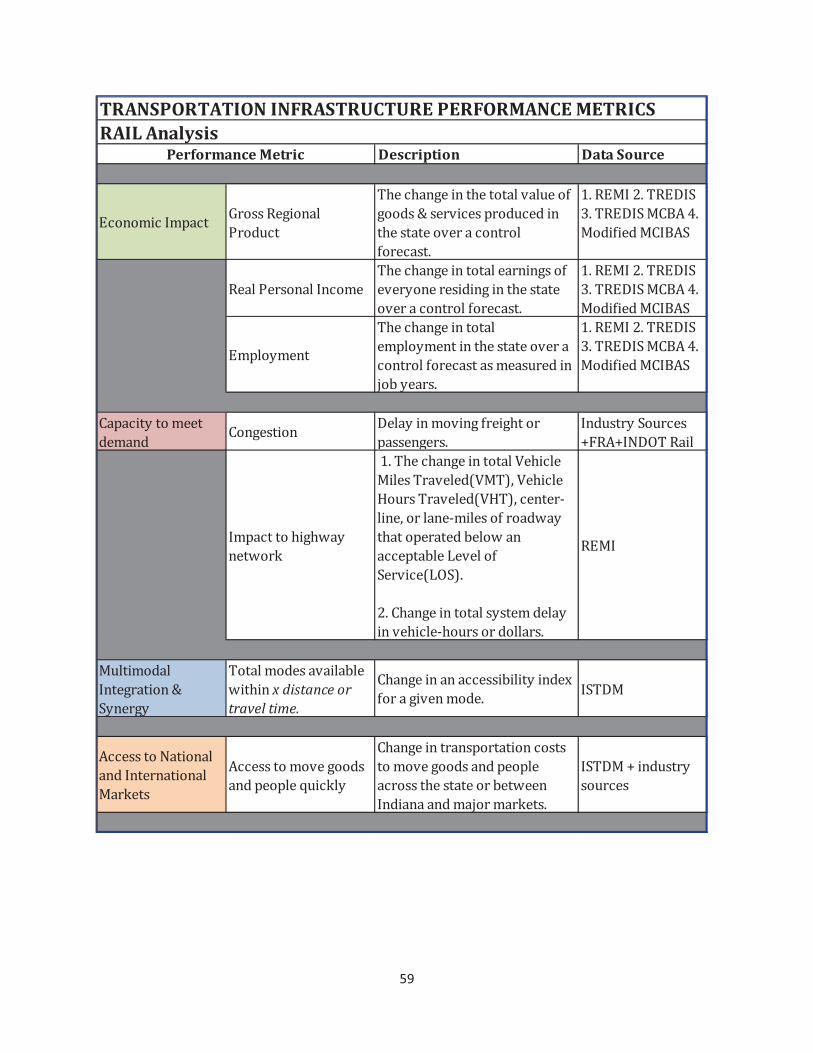
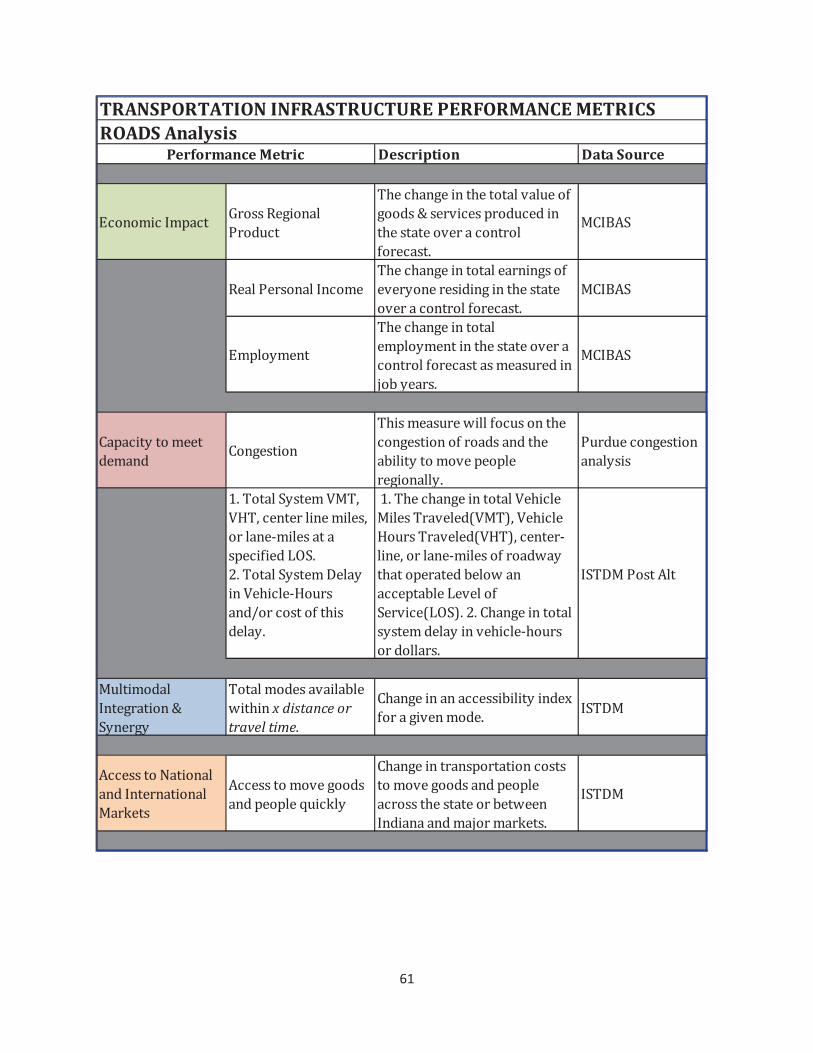
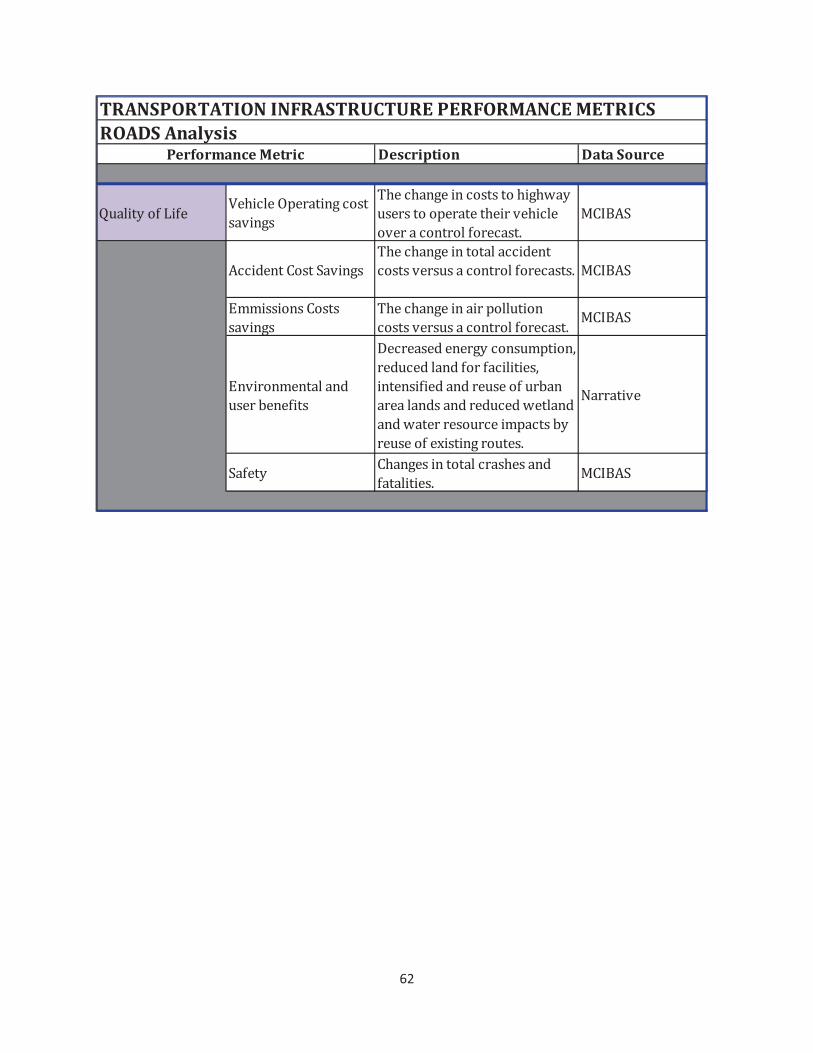
PROJECT�PERFORMANCE�METRICS��
The�Plan� for� the�next� generation�of� transportation� infrastructure�will� identify�priority�projects� for� the�next�10�years�based�on�a�set�of�recommended�metrics.�The�following�metrics�are�offered�as�a�starting�point�for�the�Blue�Ribbon�Panel’s�discussion.�
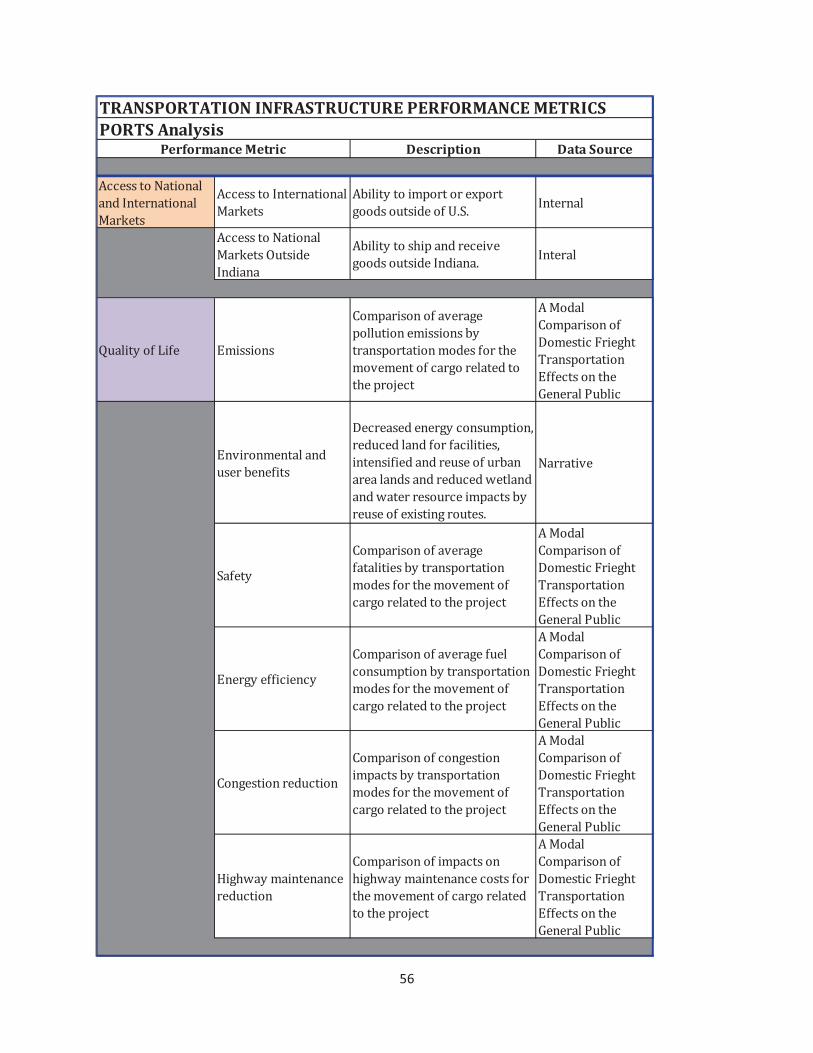
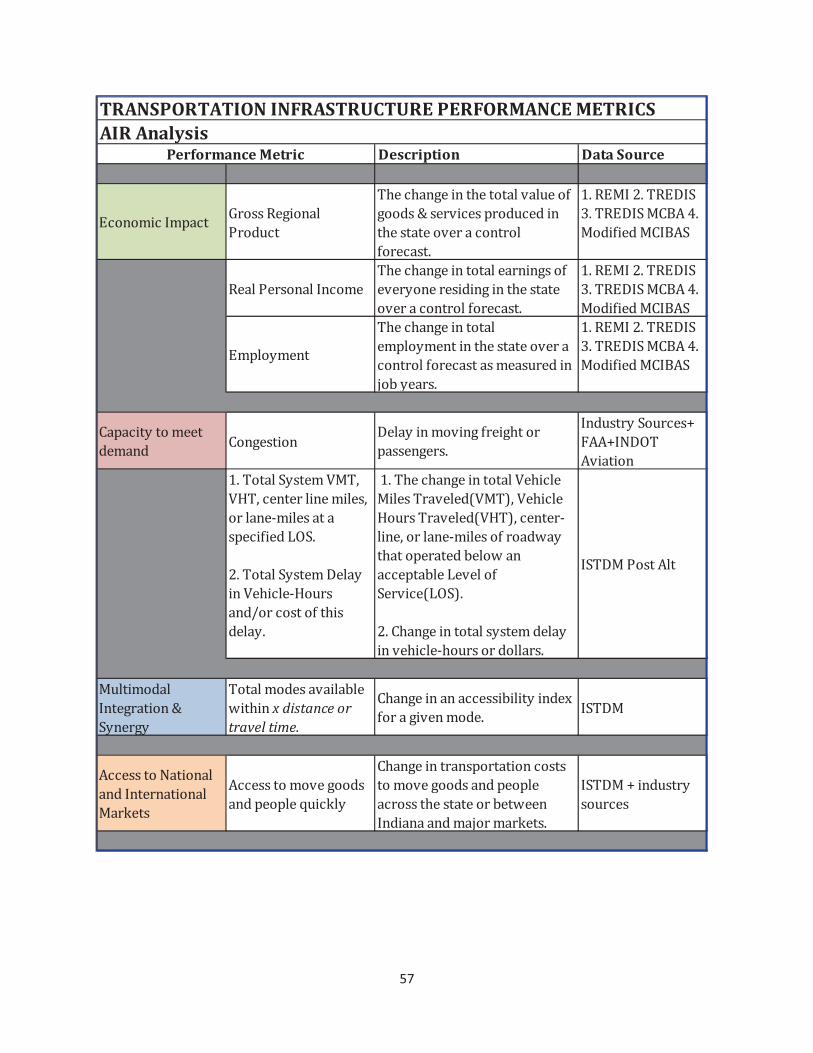
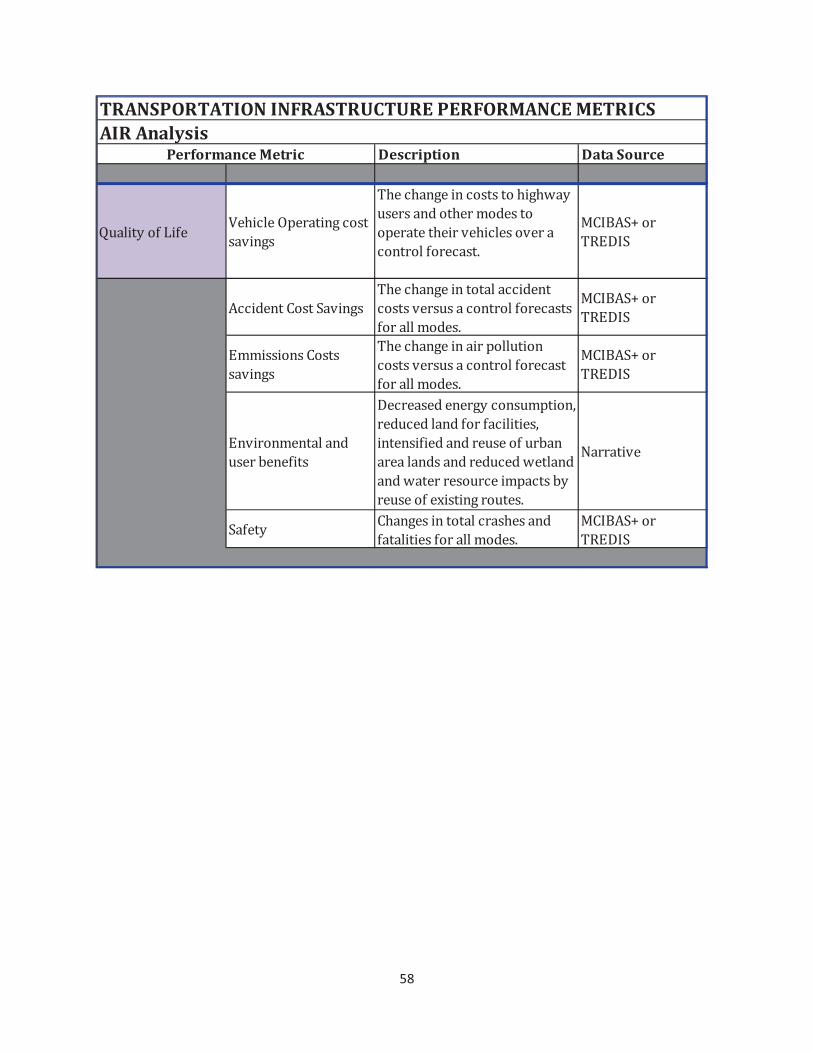
�� Economic�Impact�� Capacity�to�Meet�Demand�� Multimodal�Integration�&�Synergy�� Access�to�National�and�International�Markets�� Quality�of�Life�
�The�Blue�Ribbon�Panel�will�assign�each�project�a�score�from�1�5�for�each�metric,�with�1�being�a�low�score�and�5�being� the�highest�or�best� score.� The� score� represents� the� strength�or�weakness�of� a�particular�project�as�evaluated�by�the�metrics.�The�Panel�may�conclude�that�a�different�scale�is�preferable.�A�1�5�scale�is�a�suggested�starting�point.�
�The�underlying�data�for�each�metric�may�be�different�for�each�transportation�mode.�The�following�pages�explain� the� proposed�metrics� and� identify� possible� data� to� support� a� determination� for� each�metric.�While� the� score� assigned� under� a� metric� for� a� particular� project� may� ultimately� rely� on� an� intuitive�judgment,�these�metrics�and�the�following�data�seek�to�make�the�determination�as�objective�as�possible.�
� �
55��
�
Description Data�Source
������������� �����������������
��������
����������������������������
��������������������������������
����������������
������������������
�������������
����������������
������������������������������
����������� �������������
�����������������������
����������������
������������������
�������������
!������"� �"� �������������������������
����������������������������
����������������
������������������
�������������
#���������$�������%��!����������������������������
#����&$�������%����������
����������������
������������������
�������������
'���������������
������#���'���� ��������� ��������������� �������
(�����'���� ��������� ������ ���������� �������
)����'��� ��������� ��������������� �������
����*�������� ��������� ����������*�������� �������
�������������������
#����
��������������� �����������������
�������������������������*��
�������������������������
�������
'�������������������
'�����������������������
������� ����������������
��������������������������
���������������������������
��������
'������������
!��������+�������
��������������
���������������
,��������� ���
�����������
�����������-�
#������
.������������������ ��
�������������������������
������ ����������/01234�����*5�
����5� ����5���*���������5�������
���5������������������������5�
������������������
�������
!�����������
������������� �
!�����������������������5�����5�
)����6� 5��������������������������
TRANSPORTATION�INFRASTRUCTURE�PERFORMANCE�METRICSPORTS�Analysis
Performance�Metric
� �
56��
�
Description Data�Source
����������7��������
�����������������
���*���
�����������������������
���*���
� �������������������%����
�����������������8�#��������
����������7��������
���*����.�������
������
� �������������������������
����������������������������
9����������$��� ���������
'��������������������
������������������� ��
����������������������������
�����������������������������
����������
��������
'������������
!��������+�������
��������������
���������������
,��������� ���
������������������
����� �������
!��������������������������5�
���������������������������5�
��������������������������� ���
�������������������������������
�������������������������� ��
����������%���������������
7��������
#�����
'��������������������
����������� ����������������
��������������������������
���������������������������
��������
'������������
!��������+�������
��������������
���������������
,��������� ���
������������������
'�������������������������
����������� ����������������
��������������������������
���������������������������
��������
'������������
!��������+�������
��������������
���������������
,��������� ���
'�������������������
'�����������������������
������� ����������������
��������������������������
���������������������������
��������
'������������
!��������+�������
��������������
���������������
,��������� ���
6�������������������
���������
'����������������������
������������������������������
������������������������������
�������������
��������
'������������
!��������+�������
��������������
���������������
,��������� ���
TRANSPORTATION�INFRASTRUCTURE�PERFORMANCE�METRICSPORTS�Analysis
Performance�Metric
� �
57��
�
�
�
�
Description Data�Source
�������������,�����)��������
�������
���������������������������������
������-���������������������
�������������������������
���������
:��)���;���)�!#�
<���)�!#��'(��=��
����������'(�#
)������������������
��������������������������������
�������������������������������
������������������������
:��)���;���)�!#�
<���)�!#��'(��=��
����������'(�#
���������
��������������������
������������������������������
��������������������������������
�� �������
:��)���;���)�!#�
<���)�!#��'(��=��
����������'(�#
'���������������
������'���������
!��������������������������
����������
��������#������>�
+��>7!.��
��������
:��������#������ ��5�
6�5������������������5�
�������1�����������
���������$.#���������������������
;��������#������!�����
��� ������16�����
���&����������������
������
�:���������������������� �������
��������������/ ��35� �������
6�������������/ 6�35�������1
����5��������1�����������������
������������� ��������
������ ���$��������
#������/$.#3��
;��'����������������������������
����������1�����������������
#�!����������
�����������
�����������-�
#������
������������������ ���
�������x�distance�or�travel�time.
'������������������� ����������%�
�����������������#�!�
����������7��������
�����������������
���*���
���������������������
���������?���*��
'�����������������������������
�����������������������
�������������������� �������
��������������������*����
#�!��>����������
�������
TRANSPORTATION�INFRASTRUCTURE�PERFORMANCE�METRICSAIR�Analysis
Performance�Metric
� �
58��
�
Description Data�Source
9����������$��� �������.�������������
�������
�������������������������������
�������������������������
�����������������������������
�����������������
�'(�#>����
�)�!#
���������'����#������
�����������������������������
���������������������������������
��������������
�'(�#>����
�)�!#
�����������'�����
�������
���������������������������
��������������������������������
��������������
�'(�#>����
�)�!#
������������������
����� �������
!��������������������������5�
���������������������������5�
��������������������������� ���
�������������������������������
�������������������������� ��
����������%���������������
7��������
#�����'����������������������������
�������������������������
�'(�#>����
�)�!#
TRANSPORTATION�INFRASTRUCTURE�PERFORMANCE�METRICSAIR�Analysis
Performance�Metric
� �
59��
�
�
�
�
Description Data�Source
�������������,�����)��������
�������
���������������������������������
������-���������������������
�������������������������
���������
:��)���;���)�!#�
<���)�!#��'(��=��
����������'(�#
)������������������
��������������������������������
�������������������������������
������������������������
:��)���;���)�!#�
<���)�!#��'(��=��
����������'(�#
���������
��������������������
������������������������������
��������������������������������
�� �������
:��)���;���)�!#�
<���)�!#��'(��=��
����������'(�#
'���������������
������'���������
!��������������������������
����������
��������#�������
>+)�>7!.��)���
����������������
������*
�:���������������������� �������
��������������/ ��35� �������
6�������������/ 6�35�������1
����5��������1�����������������
������������� ��������
������ ���$��������
#������/$.#3��
;��'����������������������������
����������1�����������������
)��
�����������
�����������-�
#������
������������������ ���
�������x�distance�or�travel�time.
'������������������� ����������%�
�����������������#�!�
����������7��������
�����������������
���*���
���������������������
���������?���*��
'�����������������������������
�����������������������
�������������������� �������
��������������������*����
#�!��>����������
�������
TRANSPORTATION�INFRASTRUCTURE�PERFORMANCE�METRICSRAIL�Analysis
Performance�Metric

� �
60��
�
Description Data�Source
9����������$��� �������.�������������
�������
�������������������������������
�������������������������
�����������������������������
�����������������
�'(�#>����
�)�!#
���������'����#������
�����������������������������
���������������������������������
��������������
�'(�#>����
�)�!#
�����������'�����
�������
���������������������������
��������������������������������
��������������
�'(�#>����
�)�!#
������������������
����� �������
!��������������������������5�
���������������������������5�
��������������������������� ���
�������������������������������
�������������������������� ��
����������%���������������
7��������
#�����'����������������������������
�������������������������
�'(�#>����
�)�!#
TRANSPORTATION�INFRASTRUCTURE�PERFORMANCE�METRICSRAIL�Analysis
Performance�Metric
� �
61��
�
�
Description Data�Source
�������������,�����)��������
�������
���������������������������������
������-���������������������
�������������������������
���������
�'(�#
)������������������
��������������������������������
�������������������������������
������������������������
�'(�#
���������
��������������������
������������������������������
��������������������������������
�� �������
�'(�#
'���������������
������'���������
�������������������������������
����������������������������
� �������������������
������������
������������������
��������
:��������#������ ��5�
6�5������������������5�
�������1�����������
���������$.#���������������������
;��������#������!�����
��� ������16�����
���&����������������
������
�:���������������������� �������
��������������/ ��35� �������
6�������������/ 6�35�������1
����5��������1�����������������
������������� ��������
������ ���$��������
#������/$.#3��;��'���������������
�����������������������1������
�����������
#�!����������
�����������
�����������-�
#������
������������������ ���
�������x�distance�or�travel�time.
'������������������� ����������%�
�����������������#�!�
����������7��������
�����������������
���*���
���������������������
���������?���*��
'�����������������������������
�����������������������
�������������������� �������
��������������������*����
#�!�
Performance�Metric
TRANSPORTATION�INFRASTRUCTURE�PERFORMANCE�METRICSROADS�Analysis
� �
62��
�
�����������
Description Data�Source
9����������$��� �������.�������������
�������
�������������������������������
������������������������������
������������������������
�'(�#
���������'����#������
�����������������������������
��������������������������������� �'(�#
�����������'�����
�������
���������������������������
���������������������������������'(�#
������������������
����� �������
!��������������������������5�
���������������������������5�
��������������������������� ���
�������������������������������
�������������������������� ��
����������%���������������
7��������
#�����'����������������������������
������������'(�#
Performance�Metric
TRANSPORTATION�INFRASTRUCTURE�PERFORMANCE�METRICSROADS�Analysis
� �
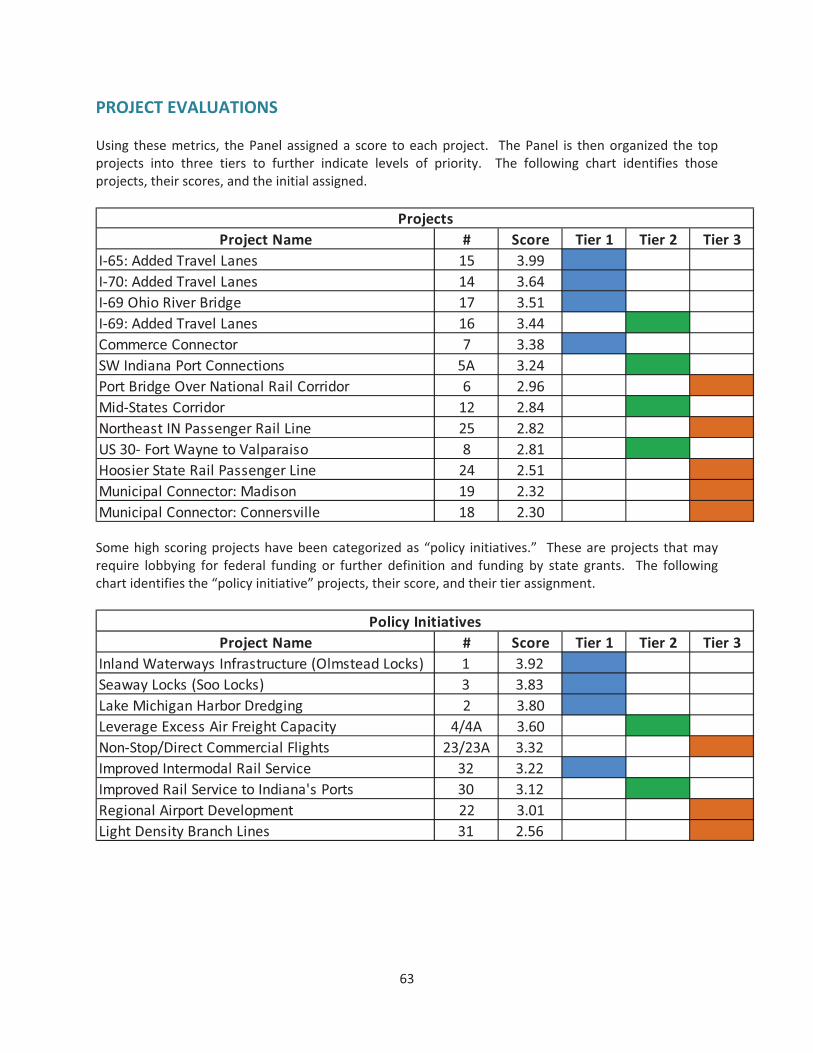
63��
PROJECT�EVALUATIONS��Using� these�metrics,� the�Panel�assigned�a� score� to�each�project.� � The�Panel� is� then�organized� the� top�projects� into� three� tiers� to� further� indicate� levels� of� priority.� � The� following� chart� identifies� those�projects,�their�scores,�and�the�initial�assigned.�
�
�
Some�high�scoring�projects�have�been�categorized�as�“policy� initiatives.”� �These�are�projects� that�may�require� lobbying� for� federal� funding� or� further� definition� and� funding� by� state� grants.� � The� following�chart�identifies�the�“policy�initiative”�projects,�their�score,�and�their�tier�assignment.�
�
�
�����
Project�Name # Score Tier�1 Tier�2 Tier�3I�65:�Added�Travel�Lanes 15 3.99I�70:�Added�Travel�Lanes 14 3.64I�69�Ohio�River�Bridge 17 3.51I�69:�Added�Travel�Lanes 16 3.44Commerce�Connector 7 3.38SW�Indiana�Port�Connections 5A 3.24Port�Bridge�Over�National�Rail�Corridor 6 2.96Mid�States�Corridor 12 2.84Northeast�IN�Passenger�Rail�Line 25 2.82US�30��Fort�Wayne�to�Valparaiso 8 2.81Hoosier�State�Rail�Passenger�Line 24 2.51Municipal�Connector:�Madison 19 2.32Municipal�Connector:�Connersville 18 2.30
Projects
Project�Name # Score Tier�1 Tier�2 Tier�3Inland�Waterways�Infrastructure�(Olmstead�Locks) 1 3.92Seaway�Locks�(Soo�Locks) 3 3.83Lake�Michigan�Harbor�Dredging 2 3.80Leverage�Excess�Air�Freight�Capacity 4/4A 3.60Non�Stop/Direct�Commercial�Flights 23/23A 3.32Improved�Intermodal�Rail�Service 32 3.22Improved�Rail�Service�to�Indiana's�Ports 30 3.12Regional�Airport�Development 22 3.01Light�Density�Branch�Lines 31 2.56
Policy�Initiatives
� �
64��
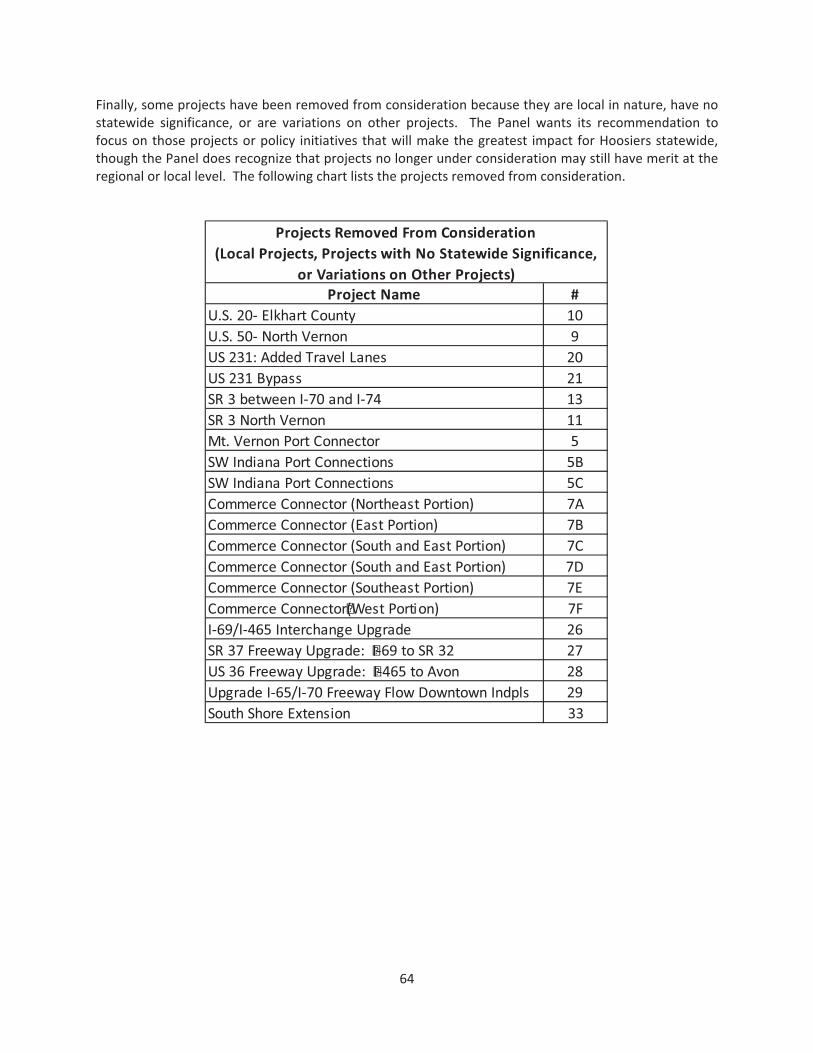
Finally,�some�projects�have�been�removed�from�consideration�because�they�are�local�in�nature,�have�no�statewide� significance,� or� are� variations� on� other� projects.� � The� Panel� wants� its� recommendation� to�focus�on�those�projects�or�policy� initiatives�that�will�make�the�greatest� impact�for�Hoosiers�statewide,�though�the�Panel�does�recognize�that�projects�no�longer�under�consideration�may�still�have�merit�at�the�regional�or�local�level.��The�following�chart�lists�the�projects�removed�from�consideration.���
�
Project�Name #U.S.�20��Elkhart�County 10U.S.�50��North�Vernon 9US�231:�Added�Travel�Lanes 20US�231�Bypass� 21SR�3�between�I�70�and�I�74 13SR�3�North�Vernon 11Mt.�Vernon�Port�Connector 5SW�Indiana�Port�Connections 5BSW�Indiana�Port�Connections 5CCommerce�Connector�(Northeast�Portion) 7ACommerce�Connector�(East�Portion) 7BCommerce�Connector�(South�and�East�Portion) 7CCommerce�Connector�(South�and�East�Portion) 7DCommerce�Connector�(Southeast�Portion) 7ECommerce�Connector�(West�Portion) 7FI�69/I�465�Interchange�Upgrade 26SR�37�Freeway�Upgrade:���I�69�to�SR�32 27US�36�Freeway�Upgrade:���I�465�to�Avon 28Upgrade�I�65/I�70�Freeway�Flow�Downtown�Indpls 29South�Shore�Extension 33
Projects�Removed�From�Consideration(Local�Projects,�Projects�with�No�Statewide�Significance,�
or�Variations�on�Other�Projects)
� �
65��
RESOURCE�LIST�
1.�Waterways�Work�for�Indiana:�Fact�Sheet;�U.S.�Chamber�of�Commerce��http://www.uschamber.com/sites/default/files/lra/docs/Indiana_USChamb_Waterway_StateFactSheet_071513a.pdf��
2.�A�MODAL�COMPARISON�OF�DOMESTIC�FREIGHT�TRANSPORTATION�EFFECTS�ON�THE�GENERAL�PUBLIC:��2001–2009;�Texas�Transportation�Institute/Center�for�Ports�and�Waterways;�Prepared�
for�the�National�Waterways�Foundation;�February�2012�http://www.portsofindinaa.com/newsroom/publications/pdfs/FinalReportTTI.pdf�
�3.�2011�Ports�of�Indiana�Economic�Impact�Study;�Martin�Associates;�May�2012�
http://www.portsofindiana.com/newsroom/press_releases/2011%20Ports%20of%20Indiana%20Economic%20Impact%20Study%20�%20Executive%20Summary%20�%205�30�1....pdf�
�4.� The�Economic� Impacts�of� the�Great� Lakes�St.� Lawrence�Seaway�System;�Martin�Associates�October�2011�
http://www.marinedelivers.com/sites/default/files/documents/Econ%20Study%20�%20Full%20Report%20Final.pdf��
5.� Environmental� and� Social� Impacts� of� Marine� Transport� in� the� Great� Lakes�St.� Lawrence� Seaway�System;�Research�and�Traffic�Group;�January�2013�
http://www.marinedelivers.com/mwg�internal/de5fs23hu73ds/progress?id=iYHwaGERDd��6.�World�Air�Cargo�Forecast:�2012�2013;�Boeing;�2012�
http://www.boeing.com/mwg�internal/de5fs23hu73ds/progress?id=3EyY3RVCal��
7.�Phase�1:�A�Plan�for�Indiana’s�Logistics�Future;�Conexus�Indiana;�March�2010�http://mpcms.blob.core.windows.net/6864e884�8313�4d1f�97b8�696c824cfd60/docs/0100b922�6047�4fca�ad14�96287cfc273f/logisticsreport_022311.pdf��
8.�Executive�Summary:�Indiana�Airports’�Economic�Impact�Study;�Conexus�Indiana/Aviation�Association�of�Indiana;�2012�
http://cdn2.content.compendiumblog.com/uploads/user/aea49b94�232c�4063�9c6a�f375249089e7/fc1cc263�80cc�44f2�b3bc�5ab083b25e81/File/b8f4ff68af8fb7fb3d12143e0b7ee688/aai_economic_impact_study_final.pdf��
9.�An�Evaluation�of�the�Kansas�Affordable�Airfares�Program;�Arthur�P.�Hall,�PhD.;�February�2013��http://www.business.ku.edu/sites/business.drupal.ku.edu/files/images/galleries/An%20Evaluation%20of%20the%20Kansas%20Affordable%20Airfares%20Program.pdf��
10.�Hoosier�State�Rail�Service�Cost�Benefit�Analysis;�CDM�Smith;�September�2013;��http://www.in.gov/indot/files/Amtrak_CostBenefitAnalysis_2013.pdf���
� �
66��
11.�Northern�Indiana/Ohio�Passenger�Rail�Corridor�Feasibility�Study�and�Business�Plan�Summary;�TEMS:�Transportation� and� Economic�Management� Systems,� Inc.;� Prepared� for�Northeast� Indiana� Passenger�Rail�Association;�January�2013�
http://niprarail.org/wp�content/uploads/2013/06/Executive�Summary�for�Press�Release_62813_Final.pdf��
12.�Conceptual�Financing�Plan�for� I�69�Corridor:�Henderson,�Kentucky�and�Evansville,� Indiana;�URS/Citi�Group;�Prepared�for�Kentucky�Transportation�Cabinet;�May�2008;��
http://transportation.ky.gov/planning/planning%20studies%20and%20reports/i�69�interstate080519.final.kentucky%20financing%20plan%20report.pdf��
13.� Department� of� Transportation� Average� Daily� Traffic� and� Commercial� Vehicles� Interactive� Map;�Indiana�Department�of�Transportation�
http://dotmaps.indot.in.gov/apps/trafficcounts/�
14.�Indiana�Statewide�Travel�Demand�Model�(ISTDM)�INDOT’s�Asset�Planning�&�Management�Division�uses� state�of�the�art� analysis� tools� to� support� critical�transportation�planning�and�major�capital�investments�decision�making.��Transportation�models,�to�the�most�extent�possible,�are�used�to�replicate�the�“real�world”�in�terms�of�environmental�impacts;�system�performance;�and�agency�operation�impacts.�Transportation�models�are�also�used�to�predict�changes�in�travel� patterns� and� the� utilization� of� the� transportation� system� in� response� to� changes� in� regional�development,� demographics,� and� transportation� supply.� Transportation� modeling� is� required� for�rational�planning�and�evaluation�of�transportation�systems.��
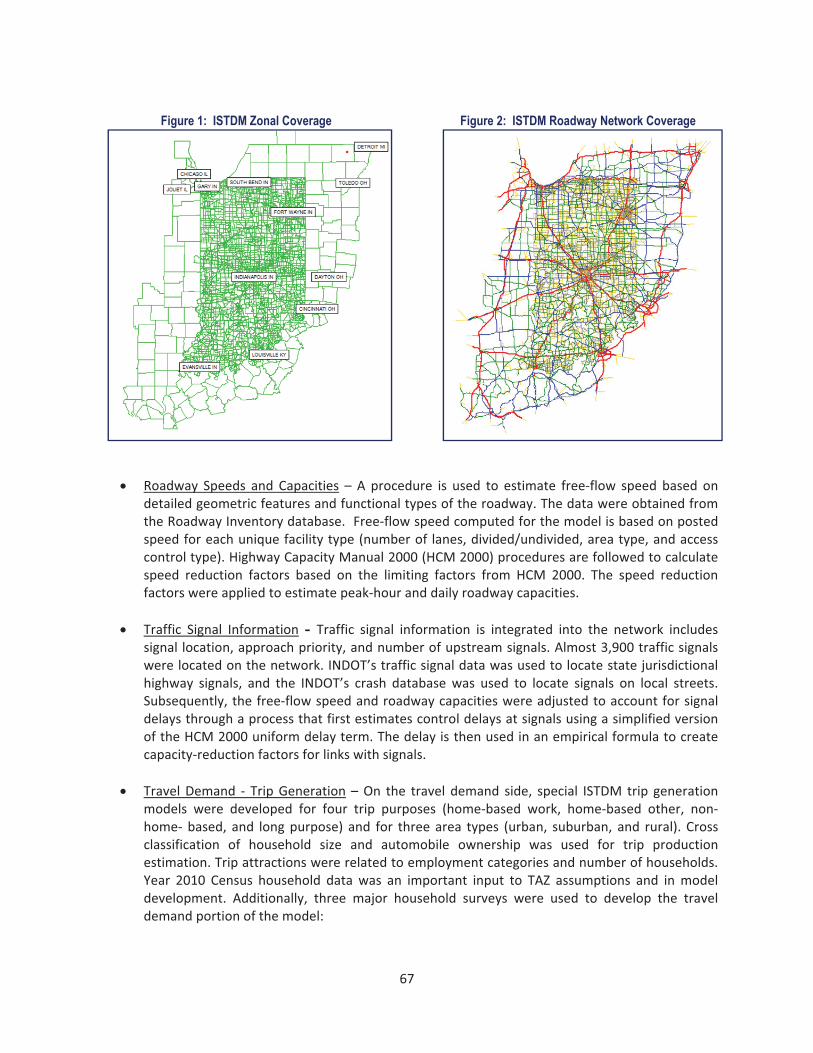
�INDOT’s�Statewide�Travel�Demand�Model�(ISTDM)�is�used�to�predict�changes�in�travel�patterns�and�the�utilization�of� the� transportation� system� in� response� to� changes� in� regional�developments� (new/widen�roads,�new�buildings,� shopping�malls,� large� industries);�changes� in� the� land�use� (e.g.,�more�residential�developments,� a� new� industrial� site,� etc.);� changing� demographics� (more� or� less� people� in� a� specific�area,�access� to�a�vehicle,�etc.)�and� transportation�supply.�The� ISTDM�covers�all�92�counties� in� Indiana�and�parts�of�adjacent� states.�A�detailed�network�was�developed� for�areas�within� the�state�of� Indiana,�including� all� state� jurisdictional� highways� (more� than� 19,500� links)� and� additional� local� streets� (more�than� 11,500� links)�Figure� 1.� A� less� detailed� network�was� used� for� areas� outside� Indiana,� as� shown� in�Figure�2.�Data�from�INDOT’s�Road�Inventory�Data�were�incorporated�into�the�network�including�number�of�lanes,�shoulder�widths,�medians,�access�control�types,�and�functional�classifications.�A�total�of�4,720�traffic� analysis� zones� TAZs�were� created�with� external� stations� representing� the� areas� in� neighboring�states.�The�TAZ�structure�was�developed�to�generally�conform�to�the�roadway�network�and�previously�developed�TAZs�from�older�versions�of�the�model.��ISTDM�components�include�the�following:�
� �
67��
�� Roadway� Speeds� and� Capacities� –� A� procedure� is� used� to� estimate� free�flow� speed� based� on�
detailed�geometric�features�and�functional�types�of�the�roadway.�The�data�were�obtained�from�the�Roadway�Inventory�database.��Free�flow�speed�computed�for�the�model�is�based�on�posted�speed�for�each�unique�facility�type�(number�of� lanes,�divided/undivided,�area�type,�and�access�control�type).�Highway�Capacity�Manual�2000�(HCM�2000)�procedures�are�followed�to�calculate�speed� reduction� factors� based� on� the� limiting� factors� from� HCM� 2000.� The� speed� reduction�factors�were�applied�to�estimate�peak�hour�and�daily�roadway�capacities.���
� Traffic� Signal� Information - Traffic� signal� information� is� integrated� into� the� network� includes�signal�location,�approach�priority,�and�number�of�upstream�signals.�Almost�3,900�traffic�signals�were�located�on�the�network.�INDOT’s�traffic�signal�data�was�used�to�locate�state�jurisdictional�highway� signals,� and� the� INDOT’s� crash� database�was� used� to� locate� signals� on� local� streets.�Subsequently,�the�free�flow�speed�and�roadway�capacities�were�adjusted�to�account�for�signal�delays�through�a�process�that�first�estimates�control�delays�at�signals�using�a�simplified�version�of�the�HCM�2000�uniform�delay�term.�The�delay�is�then�used�in�an�empirical�formula�to�create�capacity�reduction�factors�for�links�with�signals.���
� Travel�Demand� �� Trip�Generation�–�On� the� travel� demand� side,� special� ISTDM� trip� generation�models� were� developed� for� four� trip� purposes� (home�based� work,� home�based� other,� non�home��based,� and� long�purpose)� and� for� three�area� types� (urban,� suburban,� and� rural).� Cross�classification� of� household� size� and� automobile� ownership� was� used� for� trip� production�estimation.�Trip�attractions�were�related�to�employment�categories�and�number�of�households.�Year� 2010� Census� household� data�was� an� important� input� to� TAZ� assumptions� and� in�model�development.� Additionally,� three� major� household� surveys� were� used� to� develop� the� travel�demand�portion�of�the�model:���
Figure 1: ISTDM Zonal Coverage Figure 2: ISTDM Roadway Network Coverage
� � �
� �
68��
1. 2009�National�Household�Travel�Survey�(NHTS)�data�(which�included�a��special�add�on�sample�of�thousands�of�Indiana�households)��
2. 2009�Central�Indiana�Household�Survey�(Indianapolis�MPO)�3. 2009�Chicago�Area�Household�Survey�(covers�the�Chicago�MPO�and�NW�Indiana)�
�Stratification�curves�were�developed�to�breakout�the�households� into�categorical� income�groupings�to�apply�the�cross�classification�trip�rates.��
�Travel�Demand�and�Trip�Distribution�–�Gravity�expressions�were�used� for� ISTDM�trip�distribution.�The�friction�factors�were�calibrated�by�trip�purposes�using�real�world�trips�reported�by�Indiana�residents�as�reported�in�the�three�household�survey�datasets.��
�Travel�Demand�and�Mode’s�Used�and�Auto�Occupancy�–�The�model�also�predicts�which�mode�will�be�used� (Auto� vs.� Transit),� and� auto� occupancy,� for� a� given� trip.� Mode� shares� were� derived� from� trips�reported� in�the�household�surveys.�Automobile�occupancy�rates�were�also�obtained�from�the�surveys.�For�the�long�trip�purpose,�a�methodology�was�adapted�from�the�California�High�Speed�Rail�Study�Model�and� then� recalibrated� for� the� ISTDM� for� a� division�of� trips� between� automobile� and� the� South� Shore�intercity�commuter�rail.��
�Travel� Demand� and� Commercial� Vehicle� Flows� –� Freight� and� non�freight� trucks� were� estimated�separately.�For�freight�trucks,�base�year�2007�truck�trip�tables�from�the�Indiana�Commodity�Flow�Model�were�factored�up�to�year�2010�levels�by�commodity�group.�Non�freight�truck�trip�tables�were�estimated�from�truck�ground�counts�after�first�removing�freight�trucks.�
�Traffic�Flow�over�the�Highway�Network�–�The�ISTDM�used�a�multi�class�assignment�approach�for�traffic�assignment,�with� truck� trips� and� automobile� trips� loaded� to� the� network� at� the� same� time.� Two� trip�tables� were� developed� for� truck� trips:� freight� truck� trips� and� non�freight� truck� trips.� The� traffic�assignment�procedure�was�run�twice�by�including�a�feedback�loop�to�trip�distribution�so�that�the�gravity�expression� could� use� travel� times� based� on� the� initially� assigned� roadway� volumes.� Travel� time� and�volume�delay�curves,�which�predict� travel� times�depending�on�the� level�of�demand,�were�specified�by�functional�classification.��
�ISTDM�Validation�The� ISTDM� model� was� validated� by� comparing� the� 2010� observed� daily� traffic� counts� to� the� model�estimates�for�the�same�year.�Overall,�the�ISTDM�shows�base�year�2010�forecasted�volume�as�being�close�to�actual�volumes.�The�ISTDM�also�includes�a�post�processor�that�uses�the�output�of�the�travel�model�to�estimate� speeds,� levels� of� service,� crashes,� and� other� measures� of� effectiveness.� The� performance�measurement� post�processor� was� used� extensively� in� the� development� of� corridor� statistics� for� this�study.�
�Growth�Forecasts�Socio�economic�forecasts�are�key�inputs�to�modeling�traffic�growth.��Development�efforts�of�the�ISTDM�paid� particular� attention� to� its� socioeconomic� forecasts,� which� underlie� the� traffic� forecasts.� Zonal�population�forecasts�were�developed�by�first�establishing�county�control�totals�and�then�distributing�the�totals� to� TAZs� using� an� accessibility�based� regression� model.� Historical� data� from� Woods� &� Poole�economics�forecasts,�Indiana�State�Data�Center�forecasts�by�county,�and�the�Regional�Economics�Model�Inc.� (REMI)� forecast� for� the� state� of� Indiana� were� examined� to� produce� county�level� population.�Independent�variables�in�the�regression�model�included�existing�population,�households,��
� �
69��
population�density,�workers,�average�household�income,�and�several�accessibility�terms.��Then�the�model�was�used�to�produce�population�changes�from�year�2010�to�2035�in�terms�of��changes� in� zonal� shares� of� county� totals.� The� same� approach� for� forecasting� population�was� used� to�forecast�zonal�employment.��
�The�year�2035�forecast�estimates�are�checked�for�reasonableness�for�the�within�the�state�of�Indiana�as�well� as� the� entire� modeled� area.� Person� trips� and� vehicle� trips� by� trip� purpose� are� evaluated� for�consistent�growth�with�socio�economic�data.��
�15.�Economic�Modeling�The� interface�between� transportation� investment�and�economic�development�has�broad� ramifications�that�go�beyond�transportation’s�basic�purpose�of�moving�goods�and�people�from�one�place�to�another.�An�efficient� transportation�system�can� improve�the�productivity�of� the�economy�and�helps�businesses�contain�final�costs�to�customers�and�makes�them�more�competitive� in�the�global�market.� INDOT�using�economic�models�to�assess�the�impacts�of�providing�access�to�regional�industrial,�manufacturing,�freight�distribution,�and�multimodal�facilities.�
�Major�Corridor�Investment�Benefit�Analysis�System�(MCIBAS)�INDOT�uses� the�Major�Corridor� Investment�Benefit�Analysis� System� (MCIBAS)� tool�which� assesses� the�relative� costs� and� benefits� of� proposed�major� transportation� corridor� improvements.� It� consists� of� a�traffic� impact� simulation� model,� a� user� benefit�cost� analysis� processor� and� an� integrated� economic�impact�analysis�system.����
�The�MCIBAS�tool�processes�economic�impact�analysis�in�5�basic�steps:�
� Conduct� transportation� network� comparison� analysis.� Two� networks� are� compared;� one�assuming�the� improvements�are� implemented� (build)�and�another�assumes� improvements�are�not�implemented�(no�build).��Changes�such�as�traffic�volume,�travel�times,�and�congested�hours�of�travel�are�calculated�outputs.�
� Estimate�user�benefits.�Network�changes�are�used�to�calculate�the�costs�associated�with�changes�in�travel�time,�safety,�and�vehicle�operation�in�the�corridor.��
� Calculate�direct�economic�benefits.�A�system�of�linked�economic�models�is�applied�to�monetize�the�user�and�direct�economic�benefits�for�businesses.�The�portion�of�user�benefits�that�accrue�to�businesses�is�estimated�in�terms�of�its�impact�on�business�costs�and�productivity.�The�changes�in�customer�and�labor�market�size�are�estimated�based�on�the�travel�time�changes,�and�applied�in�a�business�location�model�to�identify�the�types�of�industries�that�may�be�attracted�to�the�study�area� as� a� result� of� the� highway� improvements,� and� a� projected� number� of� additional� jobs� in�each�industry.�Direct�tourist�impacts�are�estimated�based�on�changes�in�travel�time�from�major�tourist�origin�markets.��
� Improvement� secondary�economic�benefits.�A� regional� economic� simulation�model�developed�by�Regional�Economic�Models,�Inc.�is�applied�to�forecast�the�indirect�and�induced�impacts�of�the�direct�economic�benefits.�This�model�generates�estimates�of�changes� in�regional�employment,�income,�and�output.�
� Conduct�total�benefit/cost�analysis.�These�direct,�indirect,�and�induced�impacts�are�aggregated,�discounted�over�time,�and�compared�to�the�stream�of�capital�and�operating�costs�to�determine�an�overall�project�benefit/cost�ratio.�
��
� �
70��
�Types�of�Benefits�Measured�in�MCIBAS�Highway�User�Benefits�–�User�benefits�are�measures�of�the�travel�time,�cost�and�safety� improvements�experienced�by�highway�users.���Economic�Benefits�–�Economic�benefits�are�benefits�felt�beyond�the�direct�highway�users�and�extend�to�the�wider�State�or�regional�economy.��Ultimately,�increased�efficiency�and�reduced�business�costs�lead�to� a� flow� of� dollars� through� the� State’s� economy� and� into� the� pockets� of� Indiana� residents.� This�important�measure�of�project�impact�is�produced�by�economic�models.���Societal� Benefits� –� Societal� benefits� are� the� value�of� all� project�benefits,� irrespective�of� our� ability� to�measure� them� in�monetary� terms.� They� include�both� income�benefits� to� Indiana�households�and�any�quality�of�life�benefits�that�do�not�affect�personal�incomes.�In�practice,�this�is�only�partially�represented�in�benefit�cost�analysis�because�of�the�lack�of�full�valuation�of�environmental�and�social�factors.���
�Types�of�Impacts�For�highway�infrastructure�investments,�there�are�four�categories�of�economic�impacts:�Economic�Impact�of�Construction�Activity�–�These�impacts�are�derived�from�short�term�economic�effects�of� construction� spending� (materials� and� labor� for� road� construction).� Construction� impacts� are� not�included�in�MCIBAS�due�to�the�short�duration�of�the�construction�activity.��Business�Expansion�–�Impacts�related�to�long�term�effects�of�reducing�travel�related�costs�for�businesses�and�for�individuals.�Business�cost�savings�can�improve�the�cost�competitiveness�of�businesses.�Any�cost�savings� for� individual� motorists� can� also� release� household� financial� resources� for� spending� on� non�transportation�items.���Business� Attraction� –� Refers� to� long� lasting� effects� on� commercial� operations� beyond� those� directly�associated� with� travel� costs� savings.� These� can� include� more� efficient� inventory� and� logistics,�implementation�of�just�in�time�production�processes,�customer�market�expansion�and�associated�scale�economies,�and�access�to�a�broader�(and�more�competitively�priced)�set�of�suppliers.��Tourism� Effects� –� These� are�mainly� geographic� effects� on� tourism� patterns� due� to� expanded�market�access.��
�Differences�between�Economic�Impacts�and�User�Benefits�Within� the�MCIBAS� environment,� the� value�of� economic� benefits� is� different� than� the� value�of� direct�user� benefits.� Direct� user� benefits� accrue� only� to� those� vehicles� operated� by� private� individuals� and�businesses� that� are�directly� affected�by�highway� corridor� improvements.� Economic�benefits� are�much�more�wide�ranging�in�that�they�may�accrue�to�anyone�receiving�additional�income�from�business�growth�caused�by�the�highway.�Economic�benefits�can�be�derived�from�business�generated�in�two�ways:�
� Indirect�effects����growth�of�markets�or�suppliers�to�the�directly�benefiting�businesses��� Induced,� or� secondary� effects� –� involves� growth� of� other� sectors� due� to� increased� consumer�
spending��
User� benefits� cover� all� vehicles� experiencing� improved� travel� conditions,� including� through� trips� that�have� no� stop� inside� Indiana.� As� opposed� to� economic� benefits,� which� are� counted� only� for�households/businesses�located�in�Indiana.�Economic�benefits�accruing�to�out�of�state�residents�are�not�counted�in�MCIBAS.�In�MCIBAS,�direct�user�benefits�cover�all�safety,�time�savings,�and�
� �
71��
cost�savings.�Economic�benefits�are�only�counted�for�business�users�(94%�of�this�is�due�to��trucking�cost�reductions).��These�business�benefits�are�realized�because�of�reduced�costs,�or��increased�sales.�For�personal�travel,�including�commuting�to�work,�the�time�savings�and�safety�benefits�due�to�increased�highway�capacity�will�not�generate�additional�activity�in�the�economy.���16.�Transportation�Economic�Development�Impact�System���(TREDIS)�INDOT� uses� the� TREDIS� Multimodal� Benefit�Cost� Analysis� (MBCA)� tool,� which� is� a� free,� web�based�calculation�system�for�comparing�the�costs�and�user�benefits�of�individual�transportation�projects.�MBCA�is�unique�in�that�it�covers�both�passenger�and�freight�transportation�spanning�all�modes�–�road,�rail,�air�and�marine� –� and� it� also� includes� pedestrian� and� bicycle�modes.� It� is� designed� to� be� consistent�with�USDOT�guidelines,�making�it�useful�for�multimodal�project�assessment,�grant�applications�and�education�programs.�MBCA�is�set�up�with�standard�US�values�for�user�benefit,�which�are�not�tied�to�any�specific�study�area.�It�is�provided�as�a�free�public�service�by�TREDIS�Software.��
�BCA� is� implemented� as� a� comparison� of� project� costs� and� user� benefits,� and� is� the� first� stage� in� a�broader� process� of� economic� assessment.� � It� is� sometimes� referred� to� as� engineering�based� analysis�because�all�of�its�elements:�construction�cost,�traffic�flow,�safety�and�emissions,�can�be�directly�observed�or� estimated.� The� results� is� a� benefit/cost� ratio� and� net� benefit� value,� calculated� based� on� the�assignment�of�monetary�valuation�factors�for�transportation�related�improvements.�
�TREDIS�builds�upon�economic�data� from�the�US�Bureau�of�Economic�Analysis�and�US�Bureau�of�Labor�Statistics,� demographic� data� from� the� US� Census,� interregional� network� impedances� from�Oak� Ridge�National�Laboratories,�domestic�trade�flows�from�MIG,�international�trade�flows�from�WiserTrade,�traffic�and� commodity� flows� from� the� Federal� Highway� Administration,� baseline� forecasts� from� Moody's�Analytics�and�spatial�market�data�from�ESRI.��
�17.� I�67� Corridor� Feasibility� Study;� Cambridge� Systematics,� Inc.;� Prepared� for� I�67� Development�Corporation;�October�2,�2012�
http://www.in.gov/indot/3218.htm��
18.�Indiana�Vision�2025:�A�plan�for�Hoosier�Prosperity;�Driver�Number�3�Superior�Infrastructure;�Indiana�Chamber�of�Commerce;�December,�2011��
http://www.indianachamber.com/images/media/2025/SuperiorInfrastructure.pdf��
19.�Air� Service� Economic� Impact� Scenarios:�West�Coast�Air� Service,� Europe�Air� Service,�Asia�Air� Cargo�Service,�Commuter�and�Low�Cost�Carrier�Air�Hub�Analysis;�Wilbur�Smith�Associates;�July�2,�2010
www.cdmsmith.com��
20.�Developing�Financial� Support:�Building�Community�Backed�Air� Service;�Sixel�Consulting�Group;� July�2009�
http://www.sixelconsulting.com/FinSupport7�09.pdf���
21.� Airline� Origin� and� Destination� Survey� (DB1B);� U.S.� Department� of� Transportation:� Research� and�Innovative�Technology�Administration�(RITA);�2013�
http://www.transtats.bts.gov/DatabaseInfo.asp?DB_ID=125&DB_Name=Airline%20Origin%20and%20Destination%20Survey%20(DB1B)���
� �
72��
22.�U.S.�Traveler�Answer�Sheet:�Facts�about�leading�an�American�Industry�that’s�more�than��just�fun;�US�Travel�Association;�March�2013;��
http://www.ustravel.org/sites/default/files/page/2009/11/US_Travel_Answer_Sheet_March_2013.pdf��
23.�See�Source�19��24.�Indianapolis�Traveler�Profile�Analysis;�Sabre�Airline�Solutions;�August�2009;��
http://www.sabreairlinesolutions.com/home/software_solutions/airports/��
25.�The�Indiana�International�Issues�Task�Force�–�Air�Transportation:�Then�&�Now;�Global�Indy;�August�16,�2013�
http://spea.provocate.org/archives/11153��
26.�2012�Indiana�Mobility�Report:�Full�Version;�Purdue�University;�August�9,�2013;��http://docs.lib.purdue.edu/cgi/viewcontent.cgi?article=1004&context=imr��
27.�Ports�of�Indiana�Intermodal�Rail�Studies��
28.�Freight�Railroads�in�Indiana:�Rail�Fast�Facts�for�2011;�Association�of�American�Railroads;�June�2013;��https://www.aar.org/keyissues/Documents/Railroads�States/Indiana�2010.pdf��
29.�IANA�|�The�Intermodal�Association�of�North�America;��http://www.intermodal.org/��
30.�Load�Match;�http://www.loadmatch.com/��
31.� Economic� Impact� Analysis� for� CenterPoint� Intermodal� Center� Joliet� Preliminary� Assessment� final�report�prepared�for�CenterPoint�Properties;�Cambridge�Systematics,�Inc.;�May�14,�2008;��
http://www.docstoc.com/docs/46805103/Economic�Impact�Analysis�for�CenterPoint�Intermodal�Center�Joliet�Preliminary�Assessment�final�report�prepared�for�CenterPoint�Properties�pr��
32.� USDOT� FHWA� Freight� Analysis� Framework;� U.S.� Department� of� Transportation:� Federal� Highway�Administration;��
http://www.ops.fhwa.dot.gov/freight/freight_analysis/faf/index.htm��33.�South�Shore�proponents�lay�tracks�for�expansion;�January�18,�2014;��
http://www.nwitimes.com/business/local/south�shore�proponents�lay�tracks�for�expansion/article_a43e1704�bc0a�5a12�8fe3�03ed48d7a860.html��
34.�South�Shore�Rail�Extension��The�Time�is�Now;�Representative�Pete�Visclosky;��http://www.youtube.com/watch?v=4HTI�ouGRYQ&feature=youtu.be�
�35.�Economy;�World�Business�Chicago;��� http://www.worldbusinesschicago.com/data/economy��
���
� �
73��
GLOSSARY��Barge�Calls�–�The�total�number�of�instances�where�barges�utilize�the�port�facilities.��The�number�counts�each�time�a�barge�utilizes�the�port�facilities.��A�particular�individual�barge�could�have�multiple�“calls.”��HCM�–�Highway�Capacity�Manual��INDOT�–�Indiana�Department�of�Transportation���ISTDM���Indiana�Statewide�Travel�Demand�Model��LOS�–�Level�of�Service��MBCA�–�Multimodal�Benefit�Cost�Analysis���MCIBAS���Major�Corridor�Investment�Benefit�Analysis�System��MPO�–�Metropolitan�Planning�Organization��NHTS�–�National�Household�Travel�Survey��REMI�–�Regional�Economic�Modeling�Inc.��Ship�Calls� –� The� total� number�of� instances�where� ships�utilize� the�port� facilities.� � The�number� counts�each�time�a�ship�utilizes�the�port�facilities.��A�particular�individual�ship�could�have�multiple�“calls.”��TAZ�–�Traffic�Analysis�Zone��TREDIS����Transportation�Economic�Development�Impact�System��VHT�–�Vehicle�Hours�Traveled��VMT�–�Vehicle�Miles�Traveled�
���
�
�
�
�

� �
74��
APPENDIX�–�Project�Summaries�
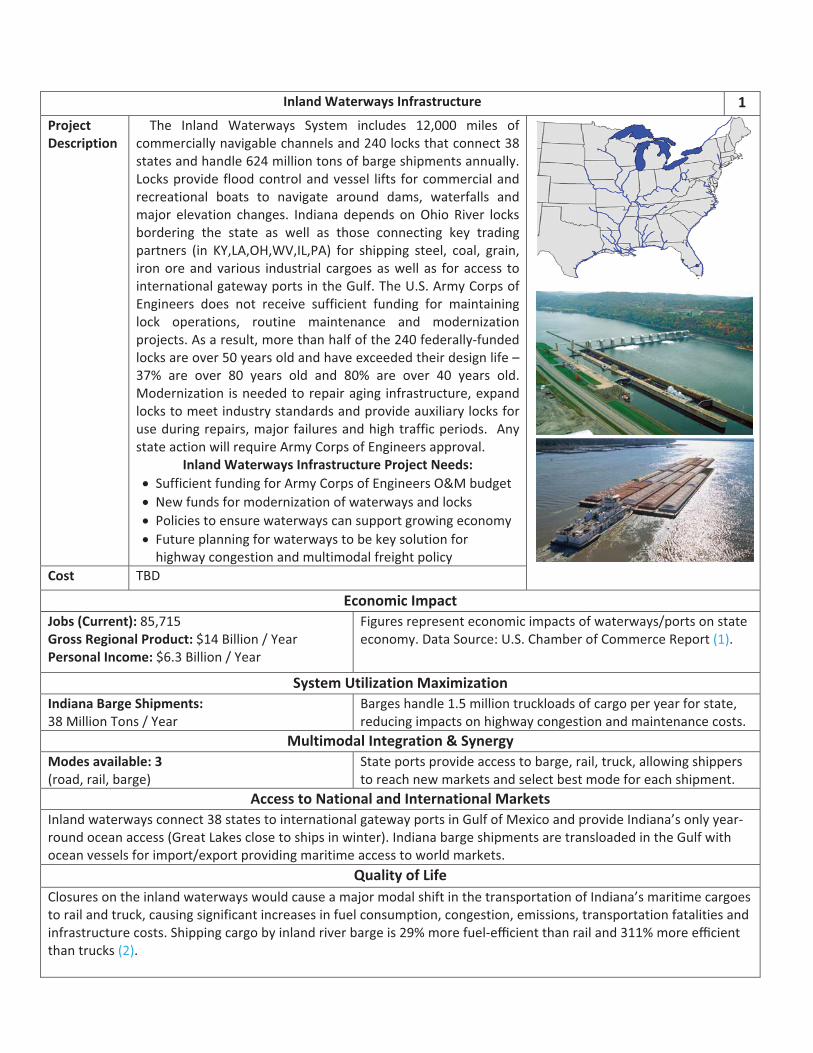
�
�
Inland�Waterways�Infrastructure� 1�Project�Description�
The� Inland� Waterways� System� includes� 12,000� miles� of�commercially�navigable�channels�and�240�locks�that�connect�38�states�and�handle�624�million�tons�of�barge�shipments�annually.�Locks�provide�flood�control�and�vessel� lifts� for�commercial�and�recreational� boats� to� navigate� around� dams,� waterfalls� and�major� elevation� changes.� Indiana� depends� on�Ohio� River� locks�bordering� the� state� as� well� as� those� connecting� key� trading�partners� (in� KY,LA,OH,WV,IL,PA)� for� shipping� steel,� coal,� grain,�iron�ore�and�various� industrial� cargoes�as�well� as� for�access� to�international�gateway�ports�in�the�Gulf.�The�U.S.�Army�Corps�of�Engineers� does� not� receive� sufficient� funding� for� maintaining�lock� operations,� routine� maintenance� and� modernization�projects.�As�a�result,�more�than�half�of�the�240�federally�funded�locks�are�over�50�years�old�and�have�exceeded�their�design�life�–�37%� are� over� 80� years� old� and� 80%� are� over� 40� years� old.�Modernization� is�needed�to�repair�aging� infrastructure,�expand�locks�to�meet�industry�standards�and�provide�auxiliary�locks�for�use�during�repairs,�major�failures�and�high�traffic�periods.� �Any�state�action�will�require�Army�Corps�of�Engineers�approval.�
Inland�Waterways�Infrastructure�Project�Needs:�� Sufficient�funding�for�Army�Corps�of�Engineers�O&M�budget�� New�funds�for�modernization�of�waterways�and�locks��� Policies�to�ensure�waterways�can�support�growing�economy�� Future�planning�for�waterways�to�be�key�solution�for�highway�congestion�and�multimodal�freight�policy��
�
�
Cost� TBD�
Economic�Impact�Jobs�(Current):�85,715�Gross�Regional�Product:�$14�Billion�/�Year�Personal�Income:�$6.3�Billion�/�Year�
Figures�represent�economic�impacts�of�waterways/ports�on�state�economy.�Data�Source:�U.S.�Chamber�of�Commerce�Report�(1).��
System�Utilization�Maximization�Indiana�Barge�Shipments:�38�Million�Tons�/�Year�
Barges�handle�1.5�million�truckloads�of�cargo�per�year�for�state,�reducing�impacts�on�highway�congestion�and�maintenance�costs.�
Multimodal�Integration�&�Synergy�Modes�available:�3��(road,�rail,�barge)�
State�ports�provide�access�to�barge,�rail,�truck,�allowing�shippers�to�reach�new�markets�and�select�best�mode�for�each�shipment.�
Access�to�National�and�International�Markets�Inland�waterways�connect�38�states�to�international�gateway�ports�in�Gulf�of�Mexico�and�provide�Indiana’s�only�year�round�ocean�access�(Great�Lakes�close�to�ships�in�winter).�Indiana�barge�shipments�are�transloaded�in�the�Gulf�with�ocean�vessels�for�import/export�providing�maritime�access�to�world�markets.��
Quality�of�Life�Closures�on�the�inland�waterways�would�cause�a�major�modal�shift�in�the�transportation�of�Indiana’s�maritime�cargoes�to�rail�and�truck,�causing�significant�increases�in�fuel�consumption,�congestion,�emissions,�transportation�fatalities�and�infrastructure�costs.�Shipping�cargo�by�inland�river�barge�is�29%�more�fuel�e�cient�than�rail�and�311%�more�e�cient�than�trucks�(2).���
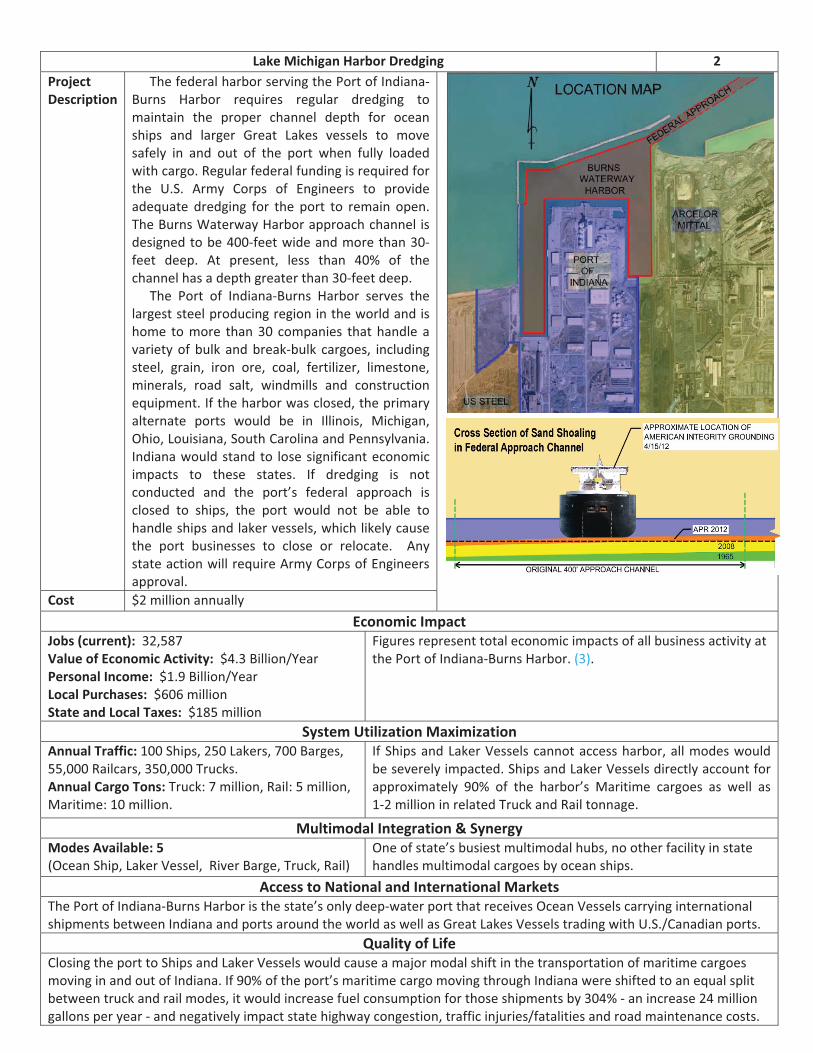
��
Lake�Michigan�Harbor�Dredging� 2�Project�Description�
The�federal�harbor�serving�the�Port�of�Indiana�Burns� Harbor� requires� regular� dredging� to�maintain� the� proper� channel� depth� for� ocean�ships� and� larger� Great� Lakes� vessels� to� move�safely� in� and� out� of� the� port� when� fully� loaded�with�cargo.�Regular�federal�funding�is�required�for�the� U.S.� Army� Corps� of� Engineers� to� provide�adequate� dredging� for� the� port� to� remain� open.�The�Burns�Waterway�Harbor�approach�channel�is�designed�to�be�400�feet�wide�and�more�than�30�feet� deep.� At� present,� less� than� 40%� of� the�channel�has�a�depth�greater�than�30�feet�deep.��
The� Port� of� Indiana�Burns� Harbor� serves� the�largest�steel�producing�region�in�the�world�and�is�home� to�more� than�30� companies� that�handle�a�variety�of�bulk�and�break�bulk� cargoes,� including�steel,� grain,� iron� ore,� coal,� fertilizer,� limestone,�minerals,� road� salt,� windmills� and� construction�equipment.�If�the�harbor�was�closed,�the�primary�alternate� ports� would� be� in� Illinois,� Michigan,�Ohio,�Louisiana,�South�Carolina�and�Pennsylvania.�Indiana�would�stand�to� lose�significant�economic�impacts� to� these� states.� If� dredging� is� not�conducted� and� the� port’s� federal� approach� is�closed� to� ships,� the� port� would� not� be� able� to�handle�ships�and�laker�vessels,�which�likely�cause�the� port� businesses� to� close� or� relocate.� � Any�state�action�will�require�Army�Corps�of�Engineers�approval.�
�
Cost� $2�million�annually�Economic�Impact�
Jobs�(current):��32,587��Value�of�Economic�Activity:��$4.3�Billion/Year�Personal�Income:��$1.9�Billion/Year�Local�Purchases:��$606�million�State�and�Local�Taxes:��$185�million�
Figures�represent�total�economic�impacts�of�all�business�activity�at�the�Port�of�Indiana�Burns�Harbor.�(3).��
System�Utilization�Maximization�Annual�Traffic:�100�Ships,�250�Lakers,�700�Barges,�55,000�Railcars,�350,000�Trucks.�Annual�Cargo�Tons:�Truck:�7�million,�Rail:�5�million,�Maritime:�10�million.��
If�Ships�and�Laker�Vessels�cannot�access�harbor,�all�modes�would�be�severely�impacted.�Ships�and�Laker�Vessels�directly�account�for�approximately� 90%� of� the� harbor’s� Maritime� cargoes� as� well� as���1�2�million�in�related�Truck�and�Rail�tonnage.��
Multimodal�Integration�&�Synergy�Modes�Available:�5��(Ocean�Ship,�Laker�Vessel,��River�Barge,�Truck,�Rail)�
One�of�state’s�busiest�multimodal�hubs,�no�other�facility�in�state�handles�multimodal�cargoes�by�ocean�ships.�
Access�to�National�and�International�Markets�The�Port�of�Indiana�Burns�Harbor�is�the�state’s�only�deep�water�port�that�receives�Ocean�Vessels�carrying�international�shipments�between�Indiana�and�ports�around�the�world�as�well�as�Great�Lakes�Vessels�trading�with�U.S./Canadian�ports.�
Quality�of�Life�Closing�the�port�to�Ships�and�Laker�Vessels�would�cause�a�major�modal�shift�in�the�transportation�of�maritime�cargoes�moving�in�and�out�of�Indiana.�If�90%�of�the�port’s�maritime�cargo�moving�through�Indiana�were�shifted�to�an�equal�split�between�truck�and�rail�modes,�it�would�increase�fuel�consumption�for�those�shipments�by�304%���an�increase�24�million�gallons�per�year���and�negatively�impact�state�highway�congestion,�traffic�injuries/fatalities�and�road�maintenance�costs.�
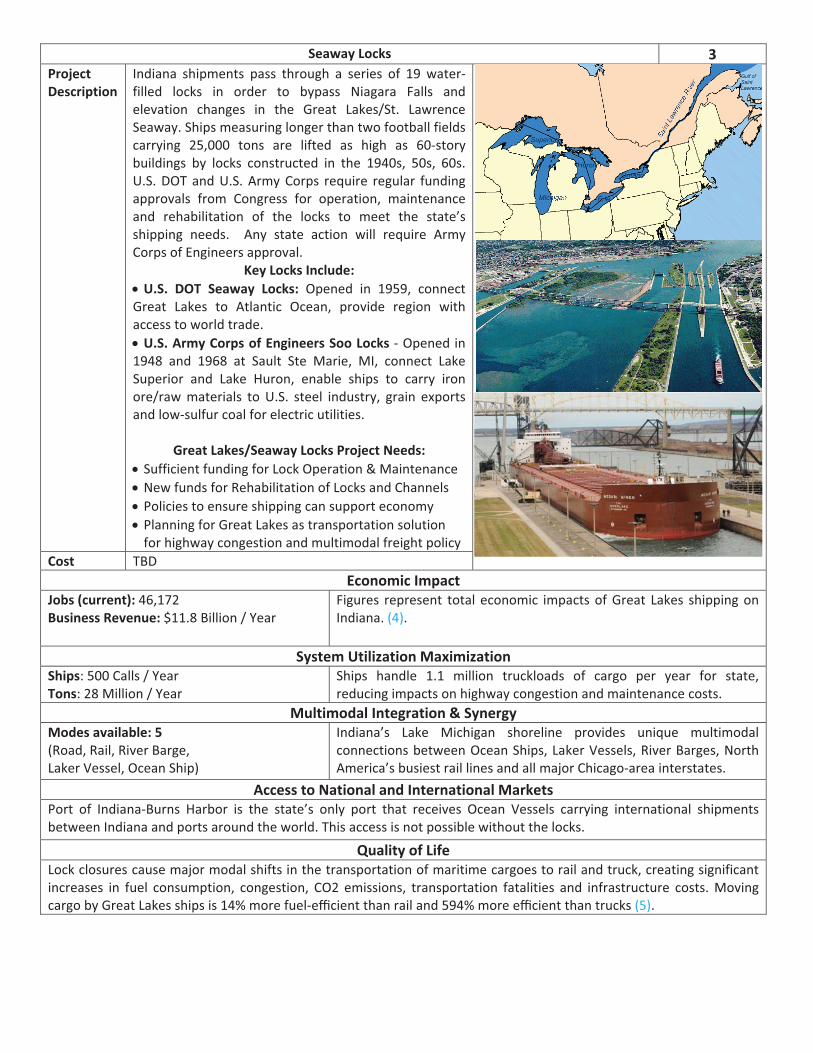
�
Seaway�Locks� 3�Project�Description�
Indiana� shipments� pass� through� a� series� of� 19� water�filled� locks� in� order� to� bypass� Niagara� Falls� and�elevation� changes� in� the� Great� Lakes/St.� Lawrence�Seaway.�Ships�measuring�longer�than�two�football�fields�carrying� 25,000� tons� are� lifted� as� high� as� 60�story�buildings� by� locks� constructed� in� the� 1940s,� 50s,� 60s.��U.S.�DOT�and�U.S.�Army�Corps� require� regular� funding�approvals� from� Congress� for� operation,� maintenance�and� rehabilitation� of� the� locks� to� meet� the� state’s�shipping� needs.� � Any� state� action� will� require� Army�Corps�of�Engineers�approval.�
Key�Locks�Include:�� U.S.� DOT� Seaway� Locks:� Opened� in� 1959,� connect�Great� Lakes� to� Atlantic� Ocean,� provide� region� with�access�to�world�trade.��� U.S.�Army�Corps�of�Engineers�Soo�Locks� ��Opened�in�1948� and� 1968� at� Sault� Ste� Marie,� MI,� connect� Lake�Superior� and� Lake� Huron,� enable� ships� to� carry� iron�ore/raw�materials� to�U.S.� steel� industry,� grain� exports�and�low�sulfur�coal�for�electric�utilities.���
Great�Lakes/Seaway�Locks�Project�Needs:�� Sufficient�funding�for�Lock�Operation�&�Maintenance��� New�funds�for�Rehabilitation�of�Locks�and�Channels��� Policies�to�ensure�shipping�can�support�economy�� Planning�for�Great�Lakes�as�transportation�solution�for�highway�congestion�and�multimodal�freight�policy�
Cost� TBD�Economic�Impact�
Jobs�(current):�46,172�Business�Revenue:�$11.8�Billion�/�Year��
Figures� represent� total� economic� impacts�of�Great� Lakes� shipping�on�Indiana.�(4).��
System�Utilization�Maximization�Ships:�500�Calls�/�Year��Tons:�28�Million�/�Year�
Ships� handle� 1.1� million� truckloads� of� cargo� per� year� for� state,�reducing�impacts�on�highway�congestion�and�maintenance�costs.�
Multimodal�Integration�&�Synergy�Modes�available:�5��(Road,�Rail,�River�Barge,��Laker�Vessel,�Ocean�Ship)�
Indiana’s� Lake� Michigan� shoreline� provides� unique� multimodal�connections�between�Ocean�Ships,�Laker�Vessels,�River�Barges,�North�America’s�busiest�rail�lines�and�all�major�Chicago�area�interstates.��
Access�to�National�and�International�Markets�Port� of� Indiana�Burns� Harbor� is� the� state’s� only� port� that� receives� Ocean� Vessels� carrying� international� shipments�between�Indiana�and�ports�around�the�world.�This�access�is�not�possible�without�the�locks.�
Quality�of�Life�Lock�closures�cause�major�modal�shifts�in�the�transportation�of�maritime�cargoes�to�rail�and�truck,�creating�significant�increases� in� fuel� consumption,� congestion,� CO2� emissions,� transportation� fatalities� and� infrastructure� costs.�Moving�cargo�by�Great�Lakes�ships�is�14%�more�fuel�e�cient�than�rail�and�594%�more�e�cient�than�trucks�(5).���
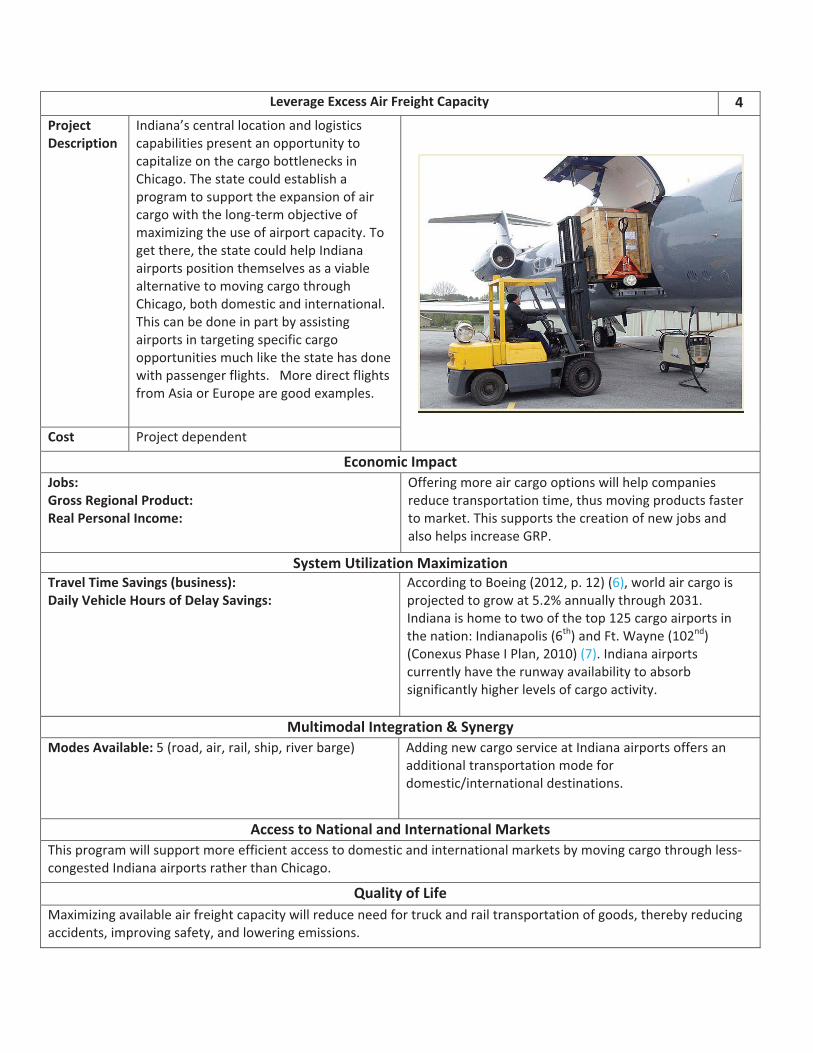
�
��
Leverage�Excess�Air�Freight�Capacity� 4�Project�Description�
Indiana’s�central�location�and�logistics�capabilities�present�an�opportunity�to�capitalize�on�the�cargo�bottlenecks�in�Chicago.�The�state�could�establish�a�program�to�support�the�expansion�of�air�cargo�with�the�long�term�objective�of�maximizing�the�use�of�airport�capacity.�To�get�there,�the�state�could�help�Indiana�airports�position�themselves�as�a�viable�alternative�to�moving�cargo�through�Chicago,�both�domestic�and�international.��This�can�be�done�in�part�by�assisting�airports�in�targeting�specific�cargo�opportunities�much�like�the�state�has�done�with�passenger�flights.���More�direct�flights�from�Asia�or�Europe�are�good�examples.�
�
Cost� Project�dependent�
Economic�Impact�Jobs:��Gross�Regional�Product:��Real�Personal�Income:���
Offering�more�air�cargo�options�will�help�companies�reduce�transportation�time,�thus�moving�products�faster�to�market.�This�supports�the�creation�of�new�jobs�and�also�helps�increase�GRP.�
System�Utilization�Maximization�Travel�Time�Savings�(business):��Daily�Vehicle�Hours�of�Delay�Savings:��
According�to�Boeing�(2012,�p.�12)�(6),�world�air�cargo�is�projected�to�grow�at�5.2%�annually�through�2031.��Indiana�is�home�to�two�of�the�top�125�cargo�airports�in�the�nation:�Indianapolis�(6th)�and�Ft.�Wayne�(102nd)�(Conexus�Phase�I�Plan,�2010)�(7).�Indiana�airports�currently�have�the�runway�availability�to�absorb�significantly�higher�levels�of�cargo�activity.��
Multimodal�Integration�&�Synergy�Modes�Available:�5�(road,�air,�rail,�ship,�river�barge)�� Adding�new�cargo�service�at�Indiana�airports�offers�an�
additional�transportation�mode�for�domestic/international�destinations.�
Access�to�National�and�International�Markets�This�program�will�support�more�efficient�access�to�domestic�and�international�markets�by�moving�cargo�through�less�congested�Indiana�airports�rather�than�Chicago.���
Quality�of�Life�Maximizing�available�air�freight�capacity�will�reduce�need�for�truck�and�rail�transportation�of�goods,�thereby�reducing�accidents,�improving�safety,�and�lowering�emissions.���
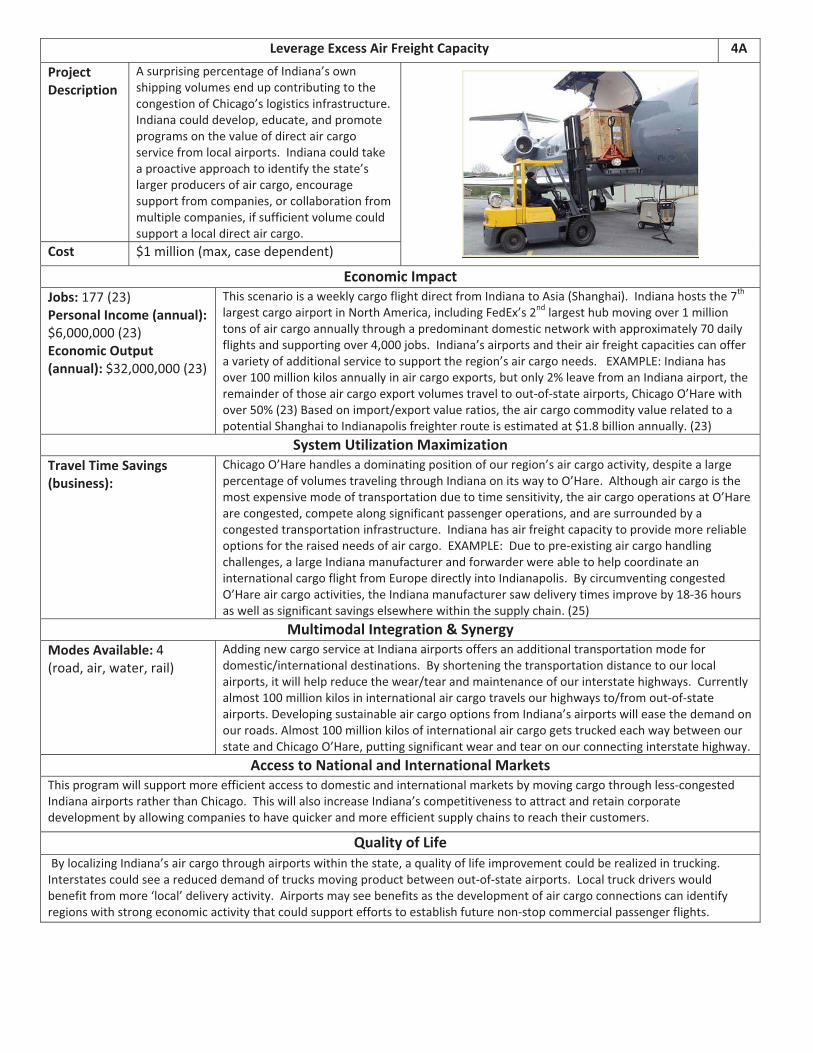
�
�
Leverage�Excess�Air�Freight�Capacity� 4A�
Project�Description�
A�surprising�percentage�of�Indiana’s�own�shipping�volumes�end�up�contributing�to�the�congestion�of�Chicago’s�logistics�infrastructure.���Indiana�could�develop,�educate,�and�promote�programs�on�the�value�of�direct�air�cargo�service�from�local�airports.��Indiana�could�take�a�proactive�approach�to�identify�the�state’s�larger�producers�of�air�cargo,�encourage�support�from�companies,�or�collaboration�from�multiple�companies,�if�sufficient�volume�could�support�a�local�direct�air�cargo.�
�Cost� $1�million�(max,�case�dependent)�
Economic�Impact�Jobs:�177�(23)�Personal�Income�(annual):�$6,000,000�(23)�Economic�Output�(annual):�$32,000,000�(23)��
This�scenario�is�a�weekly�cargo�flight�direct�from�Indiana�to�Asia�(Shanghai).��Indiana�hosts�the�7th
largest�cargo�airport�in�North�America,�including�FedEx’s�2nd�largest�hub�moving�over�1�million�tons�of�air�cargo�annually�through�a�predominant�domestic�network�with�approximately�70�daily�flights�and�supporting�over�4,000�jobs.��Indiana’s�airports�and�their�air�freight�capacities�can�offer�a�variety�of�additional�service�to�support�the�region’s�air�cargo�needs.���EXAMPLE:�Indiana�has�over�100�million�kilos�annually�in�air�cargo�exports,�but�only�2%�leave�from�an�Indiana�airport,�the�remainder�of�those�air�cargo�export�volumes�travel�to�out�of�state�airports,�Chicago�O’Hare�with�over�50%�(23)�Based�on�import/export�value�ratios,�the�air�cargo�commodity�value�related�to�a�potential�Shanghai�to�Indianapolis�freighter�route�is�estimated�at�$1.8�billion�annually.�(23)�
System�Utilization�Maximization�Travel�Time�Savings�(business):���
Chicago�O’Hare�handles�a�dominating�position�of�our�region’s�air�cargo�activity,�despite�a�large�percentage�of�volumes�traveling�through�Indiana�on�its�way�to�O’Hare.��Although�air�cargo�is�the�most�expensive�mode�of�transportation�due�to�time�sensitivity,�the�air�cargo�operations�at�O’Hare�are�congested,�compete�along�significant�passenger�operations,�and�are�surrounded�by�a�congested�transportation�infrastructure.��Indiana�has�air�freight�capacity�to�provide�more�reliable�options�for�the�raised�needs�of�air�cargo.��EXAMPLE:��Due�to�pre�existing�air�cargo�handling�challenges,�a�large�Indiana�manufacturer�and�forwarder�were�able�to�help�coordinate�an�international�cargo�flight�from�Europe�directly�into�Indianapolis.��By�circumventing�congested�O’Hare�air�cargo�activities,�the�Indiana�manufacturer�saw�delivery�times�improve�by�18�36�hours�as�well�as�significant�savings�elsewhere�within�the�supply�chain.�(25)�
Multimodal�Integration�&�Synergy�Modes�Available:�4��(road,�air,�water,�rail)��
Adding�new�cargo�service�at�Indiana�airports�offers�an�additional�transportation�mode�for�domestic/international�destinations.��By�shortening�the�transportation�distance�to�our�local�airports,�it�will�help�reduce�the�wear/tear�and�maintenance�of�our�interstate�highways.��Currently�almost�100�million�kilos�in�international�air�cargo�travels�our�highways�to/from�out�of�state�airports.�Developing�sustainable�air�cargo�options�from�Indiana’s�airports�will�ease�the�demand�on�our�roads.�Almost�100�million�kilos�of�international�air�cargo�gets�trucked�each�way�between�our�state�and�Chicago�O’Hare,�putting�significant�wear�and�tear�on�our�connecting�interstate�highway.�
Access�to�National�and�International�Markets�This�program�will�support�more�efficient�access�to�domestic�and�international�markets�by�moving�cargo�through�less�congested�Indiana�airports�rather�than�Chicago.��This�will�also�increase�Indiana’s�competitiveness�to�attract�and�retain�corporate�development�by�allowing�companies�to�have�quicker�and�more�efficient�supply�chains�to�reach�their�customers.�
Quality�of�Life��By�localizing�Indiana’s�air�cargo�through�airports�within�the�state,�a�quality�of�life�improvement�could�be�realized�in�trucking.��Interstates�could�see�a�reduced�demand�of�trucks�moving�product�between�out�of�state�airports.��Local�truck�drivers�would�benefit�from�more�‘local’�delivery�activity.��Airports�may�see�benefits�as�the�development�of�air�cargo�connections�can�identify�regions�with�strong�economic�activity�that�could�support�efforts�to�establish�future�non�stop�commercial�passenger�flights.�
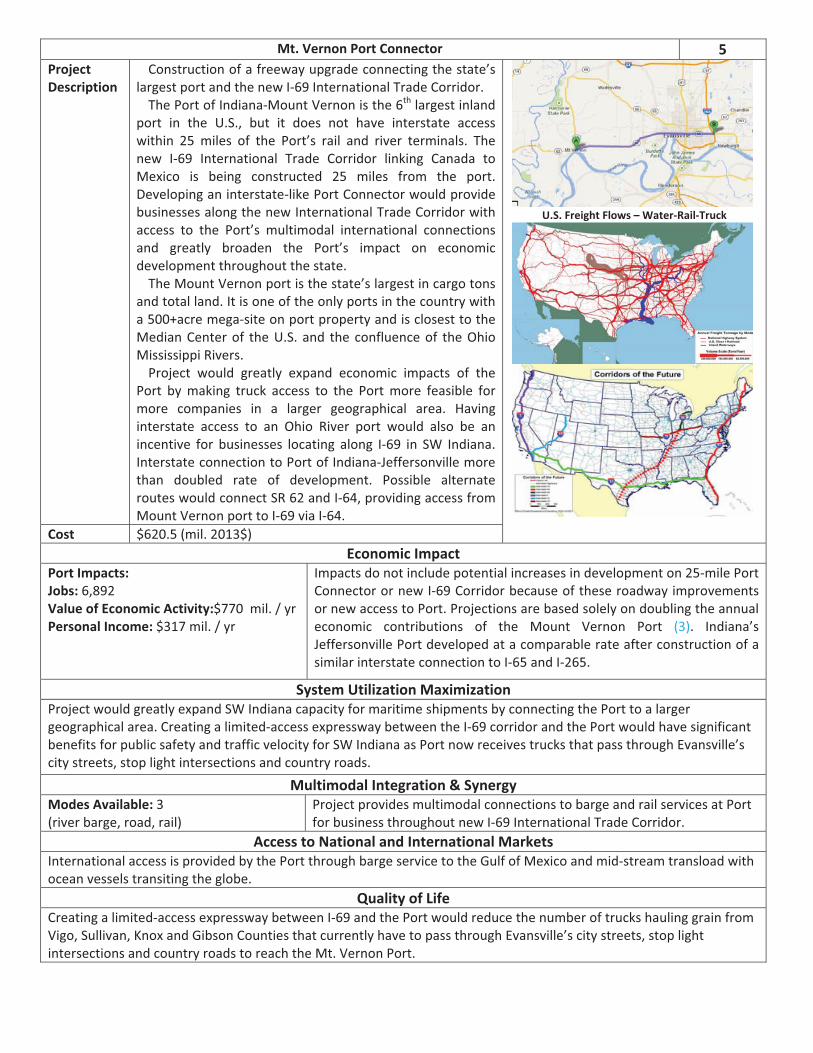
�
Mt.�Vernon�Port�Connector� 5�Project�Description�
Construction�of�a�freeway�upgrade�connecting�the�state’s�largest�port�and�the�new�I�69�International�Trade�Corridor.�The�Port�of�Indiana�Mount�Vernon�is�the�6th�largest�inland�
port� in� the� U.S.,� but� it� does� not� have� interstate� access�within� 25� miles� of� the� Port’s� rail� and� river� terminals.� The�new� I�69� International� Trade� Corridor� linking� Canada� to�Mexico� is� being� constructed� 25� miles� from� the� port.�Developing�an�interstate�like�Port�Connector�would�provide�businesses�along�the�new�International�Trade�Corridor�with�access� to� the� Port’s� multimodal� international� connections�and� greatly� broaden� the� Port’s� impact� on� economic�development�throughout�the�state.�The�Mount�Vernon�port�is�the�state’s�largest�in�cargo�tons�
and�total�land.�It�is�one�of�the�only�ports�in�the�country�with�a�500+acre�mega�site�on�port�property�and�is�closest�to�the�Median�Center�of� the�U.S.�and� the� confluence�of� the�Ohio�Mississippi�Rivers.�Project� would� greatly� expand� economic� impacts� of� the�
Port� by�making� truck� access� to� the� Port�more� feasible� for�more� companies� in� a� larger� geographical� area.� Having�interstate� access� to� an� Ohio� River� port� would� also� be� an�incentive� for� businesses� locating� along� I�69� in� SW� Indiana.�Interstate�connection�to�Port�of�Indiana�Jeffersonville�more�than� doubled� rate� of� development.� Possible� alternate�routes�would�connect�SR�62�and�I�64,�providing�access�from�Mount�Vernon�port�to�I�69�via�I�64.��
�U.S.�Freight�Flows�–�Water�Rail�Truck�
�
�Cost� $620.5�(mil.�2013$)�
Economic�Impact�Port�Impacts:��Jobs:�6,892�Value�of�Economic�Activity:$770��mil.�/�yr�Personal�Income:�$317�mil.�/�yr��
Impacts�do�not�include�potential�increases�in�development�on�25�mile�Port�Connector�or�new�I�69�Corridor�because�of�these�roadway�improvements�or�new�access�to�Port.�Projections�are�based�solely�on�doubling�the�annual�economic� contributions� of� the� Mount� Vernon� Port� (3).� Indiana’s�Jeffersonville�Port�developed�at�a�comparable�rate�after�construction�of�a�similar�interstate�connection�to�I�65�and�I�265.��
System�Utilization�Maximization�Project�would�greatly�expand�SW�Indiana�capacity�for�maritime�shipments�by�connecting�the�Port�to�a�larger�geographical�area.�Creating�a�limited�access�expressway�between�the�I�69�corridor�and�the�Port�would�have�significant�benefits�for�public�safety�and�traffic�velocity�for�SW�Indiana�as�Port�now�receives�trucks�that�pass�through�Evansville’s�city�streets,�stop�light�intersections�and�country�roads.��
Multimodal�Integration�&�Synergy�Modes�Available:�3��(river�barge,�road,�rail)�
Project�provides�multimodal�connections�to�barge�and�rail�services�at�Port�for�business�throughout�new�I�69�International�Trade�Corridor.��
Access�to�National�and�International�Markets�International�access�is�provided�by�the�Port�through�barge�service�to�the�Gulf�of�Mexico�and�mid�stream�transload�with�ocean�vessels�transiting�the�globe.�
Quality�of�Life�Creating�a�limited�access�expressway�between�I�69�and�the�Port�would�reduce�the�number�of�trucks�hauling�grain�from�Vigo,�Sullivan,�Knox�and�Gibson�Counties�that�currently�have�to�pass�through�Evansville’s�city�streets,�stop�light�intersections�and�country�roads�to�reach�the�Mt.�Vernon�Port.�
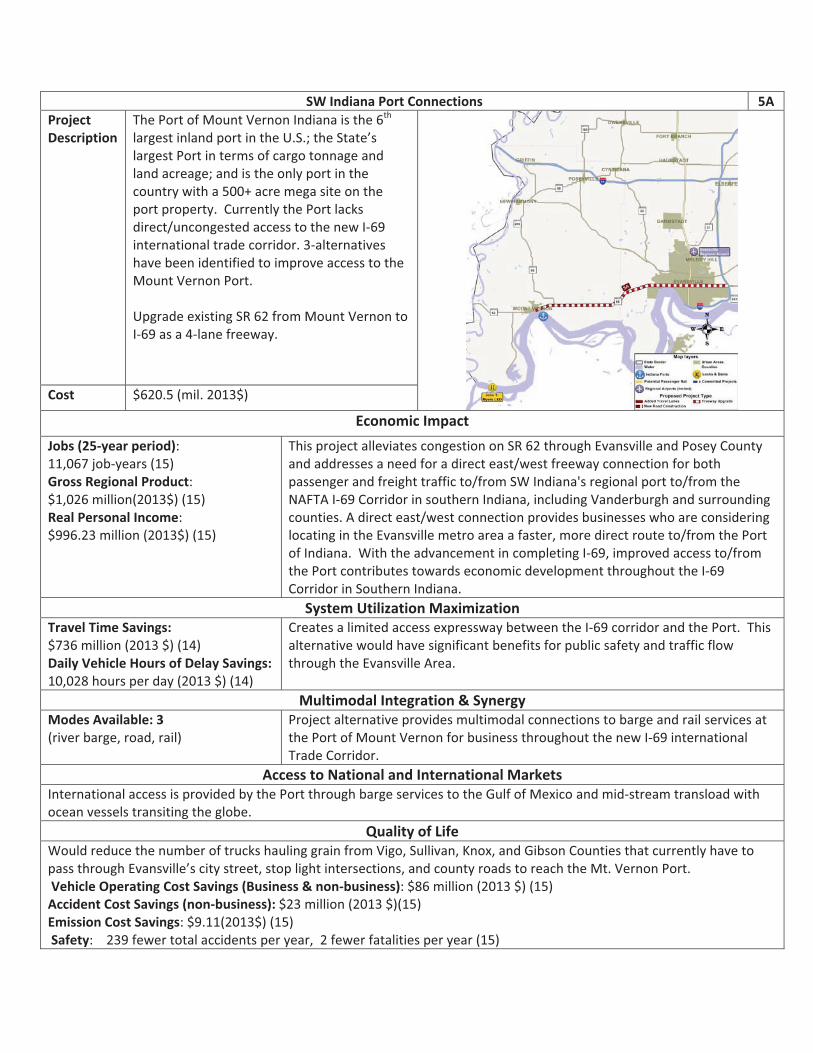
�
�
SW�Indiana�Port�Connections� 5A�Project�Description�
The�Port�of�Mount�Vernon�Indiana�is�the�6th�largest�inland�port�in�the�U.S.;�the�State’s�largest�Port�in�terms�of�cargo�tonnage�and�land�acreage;�and�is�the�only�port�in�the�country�with�a�500+�acre�mega�site�on�the�port�property.��Currently�the�Port�lacks�direct/uncongested�access�to�the�new�I�69�international�trade�corridor.�3�alternatives�have�been�identified�to�improve�access�to�the�Mount�Vernon�Port.������Upgrade�existing�SR�62�from�Mount�Vernon�to�I�69�as�a�4�lane�freeway.�
Cost� $620.5�(mil.�2013$)�
Economic�Impact�Jobs�(25�year�period):���11,067�job�years�(15)�Gross�Regional�Product:��$1,026�million(2013$)�(15)�Real�Personal�Income:��$996.23�million�(2013$)�(15)�
�
This�project�alleviates�congestion�on�SR�62�through�Evansville�and�Posey�County�and�addresses�a�need�for�a�direct�east/west�freeway�connection�for�both�passenger�and�freight�traffic�to/from�SW�Indiana's�regional�port�to/from�the�NAFTA�I�69�Corridor�in�southern�Indiana,�including�Vanderburgh�and�surrounding�counties.�A�direct�east/west�connection�provides�businesses�who�are�considering�locating�in�the�Evansville�metro�area�a�faster,�more�direct�route�to/from�the�Port�of�Indiana.��With�the�advancement�in�completing�I�69,�improved�access�to/from�the�Port�contributes�towards�economic�development�throughout�the�I�69�Corridor�in�Southern�Indiana.�������
System�Utilization�Maximization�Travel�Time�Savings:��$736�million�(2013�$)�(14)�Daily�Vehicle�Hours�of�Delay�Savings:�10,028�hours�per�day�(2013�$)�(14)�
Creates�a�limited�access�expressway�between�the�I�69�corridor�and�the�Port.��This�alternative�would�have�significant�benefits�for�public�safety�and�traffic�flow�through�the�Evansville�Area.���Multimodal�Integration�&�Synergy�
Modes�Available:�3�(river�barge,�road,�rail)�
Project�alternative�provides�multimodal�connections�to�barge�and�rail�services�at�the�Port�of�Mount�Vernon�for�business�throughout�the�new�I�69�international�Trade�Corridor.��
Access�to�National�and�International�Markets�International�access�is�provided�by�the�Port�through�barge�services�to�the�Gulf�of�Mexico�and�mid�stream�transload�with�ocean�vessels�transiting�the�globe.��
Quality�of�Life�Would�reduce�the�number�of�trucks�hauling�grain�from�Vigo,�Sullivan,�Knox,�and�Gibson�Counties�that�currently�have�to�pass�through�Evansville’s�city�street,�stop�light�intersections,�and�county�roads�to�reach�the�Mt.�Vernon�Port.���Vehicle�Operating�Cost�Savings�(Business�&�non�business):�$86�million�(2013�$)�(15)�Accident�Cost�Savings�(non�business):�$23�million�(2013�$)(15)�Emission�Cost�Savings:�$9.11(2013$)�(15)��Safety:����239�fewer�total�accidents�per�year,��2�fewer�fatalities�per�year�(15)�
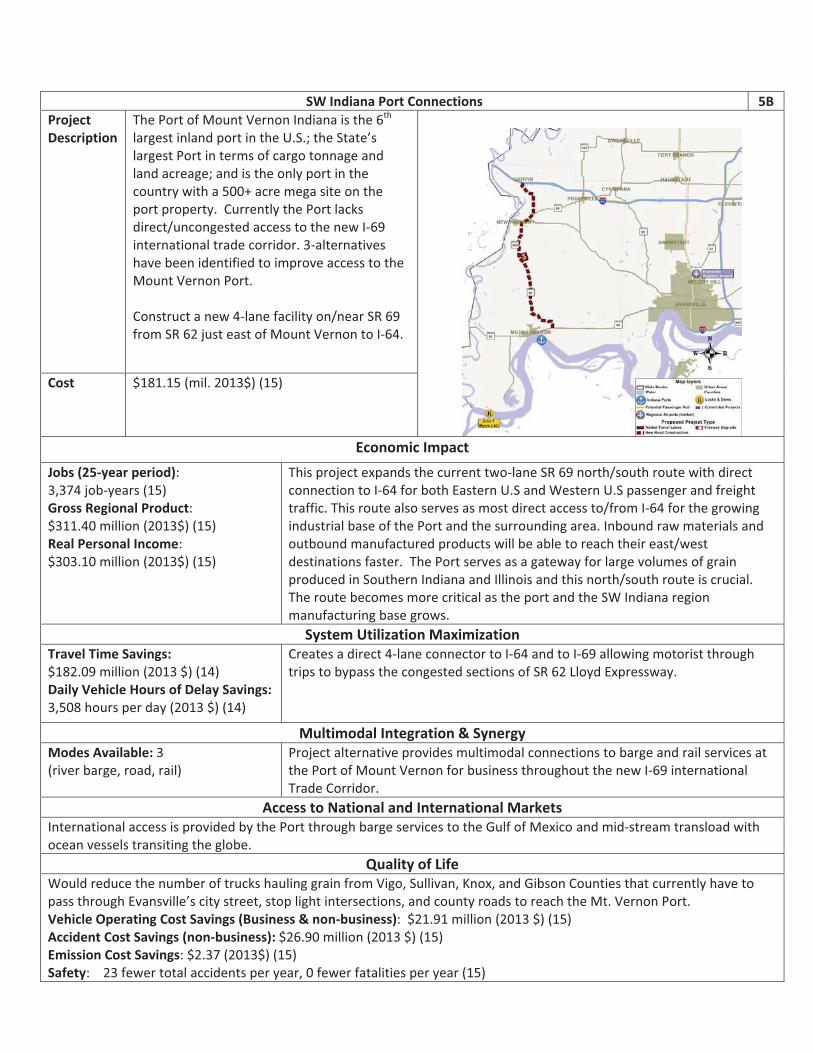
�
�
SW�Indiana�Port�Connections� 5B�Project�Description�
The�Port�of�Mount�Vernon�Indiana�is�the�6th�largest�inland�port�in�the�U.S.;�the�State’s�largest�Port�in�terms�of�cargo�tonnage�and�land�acreage;�and�is�the�only�port�in�the�country�with�a�500+�acre�mega�site�on�the�port�property.��Currently�the�Port�lacks�direct/uncongested�access�to�the�new�I�69�international�trade�corridor.�3�alternatives�have�been�identified�to�improve�access�to�the�Mount�Vernon�Port.������Construct�a�new�4�lane�facility�on/near�SR�69�from�SR�62�just�east�of�Mount�Vernon�to�I�64.��
�
�
Cost� $181.15�(mil.�2013$)�(15)�
Economic�Impact�Jobs�(25�year�period):���3,374�job�years�(15)�Gross�Regional�Product:��$311.40�million�(2013$)�(15)�Real�Personal�Income:��$303.10�million�(2013$)�(15)�
This�project�expands�the�current�two�lane�SR�69�north/south�route�with�direct�connection�to�I�64�for�both�Eastern�U.S�and�Western�U.S�passenger�and�freight�traffic.�This�route�also�serves�as�most�direct�access�to/from�I�64�for�the�growing�industrial�base�of�the�Port�and�the�surrounding�area.�Inbound�raw�materials�and�outbound�manufactured�products�will�be�able�to�reach�their�east/west�destinations�faster.��The�Port�serves�as�a�gateway�for�large�volumes�of�grain�produced�in�Southern�Indiana�and�Illinois�and�this�north/south�route�is�crucial.�The�route�becomes�more�critical�as�the�port�and�the�SW�Indiana�region�manufacturing�base�grows.�
System�Utilization�Maximization�Travel�Time�Savings:��$182.09�million�(2013�$)�(14)�Daily�Vehicle�Hours�of�Delay�Savings:�3,508�hours�per�day�(2013�$)�(14)�
Creates�a�direct�4�lane�connector�to�I�64�and�to�I�69�allowing�motorist�through�trips�to�bypass�the�congested�sections�of�SR�62�Lloyd�Expressway.��
Multimodal�Integration�&�Synergy�Modes�Available:�3�(river�barge,�road,�rail)�
Project�alternative�provides�multimodal�connections�to�barge�and�rail�services�at�the�Port�of�Mount�Vernon�for�business�throughout�the�new�I�69�international�Trade�Corridor.��
Access�to�National�and�International�Markets�International�access�is�provided�by�the�Port�through�barge�services�to�the�Gulf�of�Mexico�and�mid�stream�transload�with�ocean�vessels�transiting�the�globe.��
Quality�of�Life�Would�reduce�the�number�of�trucks�hauling�grain�from�Vigo,�Sullivan,�Knox,�and�Gibson�Counties�that�currently�have�to�pass�through�Evansville’s�city�street,�stop�light�intersections,�and�county�roads�to�reach�the�Mt.�Vernon�Port.�Vehicle�Operating�Cost�Savings�(Business�&�non�business):��$21.91�million�(2013�$)�(15)�Accident�Cost�Savings�(non�business):�$26.90�million�(2013�$)�(15)�Emission�Cost�Savings:�$2.37�(2013$)�(15)�Safety:����23�fewer�total�accidents�per�year,�0�fewer�fatalities�per�year�(15)�
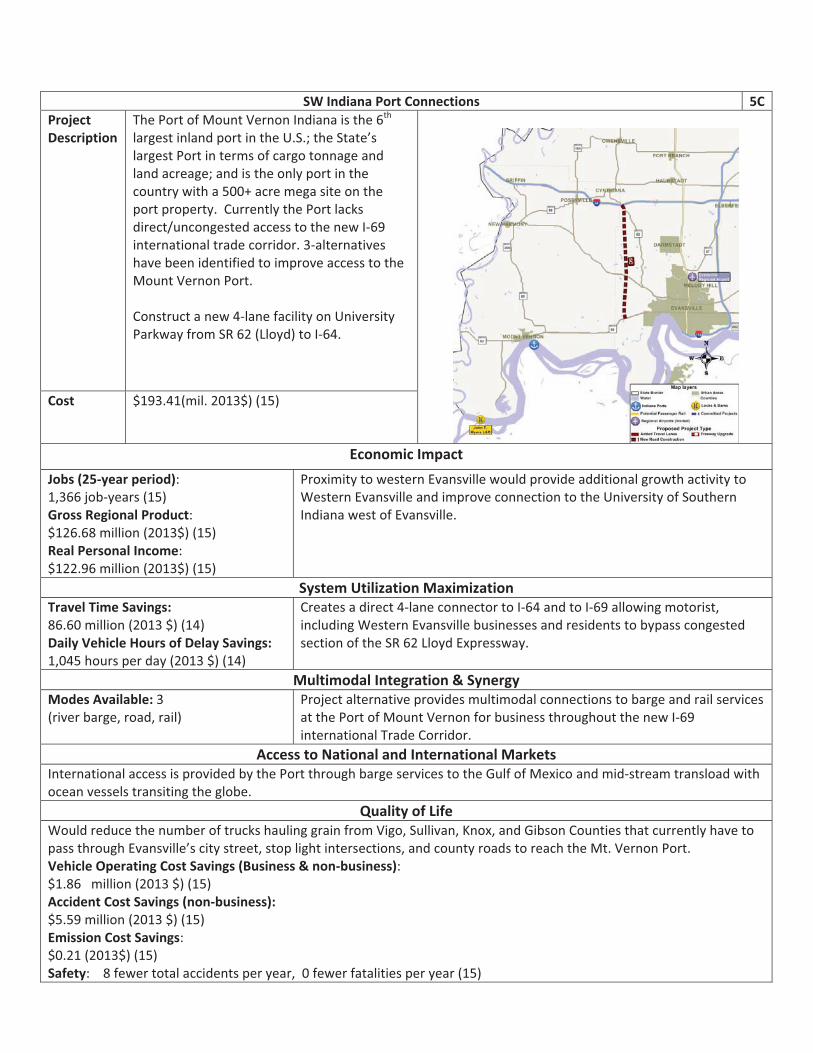
�
�
SW�Indiana�Port�Connections� 5CProject�Description�
The�Port�of�Mount�Vernon�Indiana�is�the�6th�largest�inland�port�in�the�U.S.;�the�State’s�largest�Port�in�terms�of�cargo�tonnage�and�land�acreage;�and�is�the�only�port�in�the�country�with�a�500+�acre�mega�site�on�the�port�property.��Currently�the�Port�lacks�direct/uncongested�access�to�the�new�I�69�international�trade�corridor.�3�alternatives�have�been�identified�to�improve�access�to�the�Mount�Vernon�Port.������Construct�a�new�4�lane�facility�on�University�Parkway�from�SR�62�(Lloyd)�to�I�64.�
�
Cost� $193.41(mil.�2013$)�(15)�
Economic�Impact�Jobs�(25�year�period):���1,366�job�years�(15)�Gross�Regional�Product:��$126.68�million�(2013$)�(15)�Real�Personal�Income:��$122.96�million�(2013$)�(15)�
Proximity�to�western�Evansville�would�provide�additional�growth�activity�to�Western�Evansville�and�improve�connection�to�the�University�of�Southern�Indiana�west�of�Evansville.���
System�Utilization�Maximization�Travel�Time�Savings:��86.60�million�(2013�$)�(14)�Daily�Vehicle�Hours�of�Delay�Savings:��1,045�hours�per�day�(2013�$)�(14)�
Creates�a�direct�4�lane�connector�to�I�64�and�to�I�69�allowing�motorist,�including�Western�Evansville�businesses�and�residents�to�bypass�congested�section�of�the�SR�62�Lloyd�Expressway.���
Multimodal�Integration�&�Synergy�Modes�Available:�3�(river�barge,�road,�rail)�
Project�alternative�provides�multimodal�connections�to�barge�and�rail�services�at�the�Port�of�Mount�Vernon�for�business�throughout�the�new�I�69�international�Trade�Corridor.��
Access�to�National�and�International�Markets�International�access�is�provided�by�the�Port�through�barge�services�to�the�Gulf�of�Mexico�and�mid�stream�transload�with�ocean�vessels�transiting�the�globe.��
Quality�of�Life�Would�reduce�the�number�of�trucks�hauling�grain�from�Vigo,�Sullivan,�Knox,�and�Gibson�Counties�that�currently�have�to�pass�through�Evansville’s�city�street,�stop�light�intersections,�and�county�roads�to�reach�the�Mt.�Vernon�Port.����Vehicle�Operating�Cost�Savings�(Business�&�non�business):��$1.86���million�(2013�$)�(15)�Accident�Cost�Savings�(non�business):��$5.59�million�(2013�$)�(15)�Emission�Cost�Savings:��$0.21�(2013$)�(15)�Safety:����8�fewer�total�accidents�per�year,��0�fewer�fatalities�per�year�(15)�
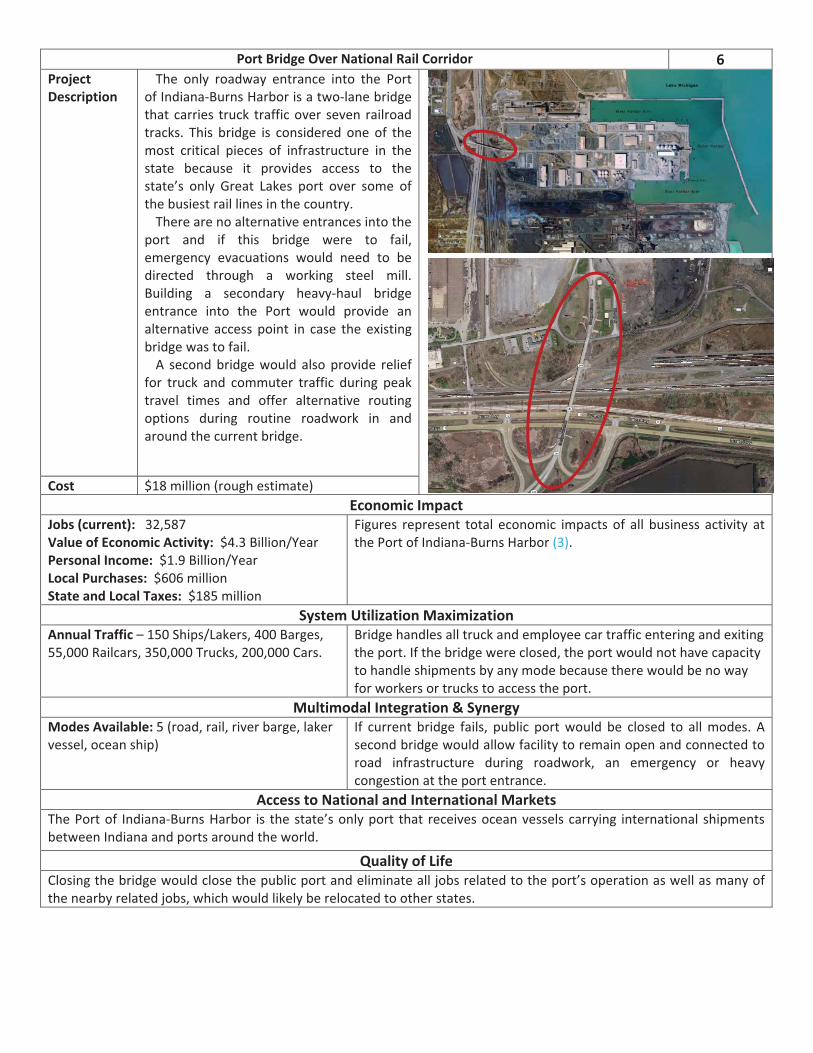
��
Port�Bridge�Over�National�Rail�Corridor� 6�Project�Description�
The� only� roadway� entrance� into� the� Port�of�Indiana�Burns�Harbor�is�a�two�lane�bridge�that� carries� truck� traffic�over� seven� railroad�tracks.� This� bridge� is� considered� one� of� the�most� critical� pieces� of� infrastructure� in� the�state� because� it� provides� access� to� the�state’s� only� Great� Lakes� port� over� some� of�the�busiest�rail�lines�in�the�country.��There�are�no�alternative�entrances�into�the�
port� and� if� this� bridge� were� to� fail,�emergency� evacuations� would� need� to� be�directed� through� a� working� steel� mill.�Building� a� secondary� heavy�haul� bridge�entrance� into� the� Port� would� provide� an�alternative� access�point� in� case� the�existing�bridge�was�to�fail.���A� second�bridge�would� also�provide� relief�
for� truck� and� commuter� traffic� during� peak�travel� times� and� offer� alternative� routing�options� during� routine� roadwork� in� and�around�the�current�bridge.��
�
Cost� $18�million�(rough�estimate)�Economic�Impact�
Jobs�(current):���32,587�Value�of�Economic�Activity:��$4.3�Billion/Year�Personal�Income:��$1.9�Billion/Year�Local�Purchases:��$606�million�State�and�Local�Taxes:��$185�million�
Figures� represent� total� economic� impacts�of� all� business� activity� at�the�Port�of�Indiana�Burns�Harbor�(3).��
System�Utilization�Maximization�Annual�Traffic�–�150�Ships/Lakers,�400�Barges,�55,000�Railcars,�350,000�Trucks,�200,000�Cars.��
Bridge�handles�all�truck�and�employee�car�traffic�entering�and�exiting�the�port.�If�the�bridge�were�closed,�the�port�would�not�have�capacity�to�handle�shipments�by�any�mode�because�there�would�be�no�way�for�workers�or�trucks�to�access�the�port.�
Multimodal�Integration�&�Synergy�Modes�Available:�5�(road,�rail,�river�barge,�laker�vessel,�ocean�ship)�
If� current� bridge� fails,� public� port�would� be� closed� to� all�modes.� A�second�bridge�would�allow�facility�to�remain�open�and�connected�to�road� infrastructure� during� roadwork,� an� emergency� or� heavy�congestion�at�the�port�entrance.�
Access�to�National�and�International�Markets�The�Port�of� Indiana�Burns�Harbor� is� the�state’s�only�port� that� receives�ocean�vessels�carrying� international�shipments�between�Indiana�and�ports�around�the�world.�
Quality�of�Life�Closing�the�bridge�would�close�the�public�port�and�eliminate�all�jobs�related�to�the�port’s�operation�as�well�as�many�of�the�nearby�related�jobs,�which�would�likely�be�relocated�to�other�states.��
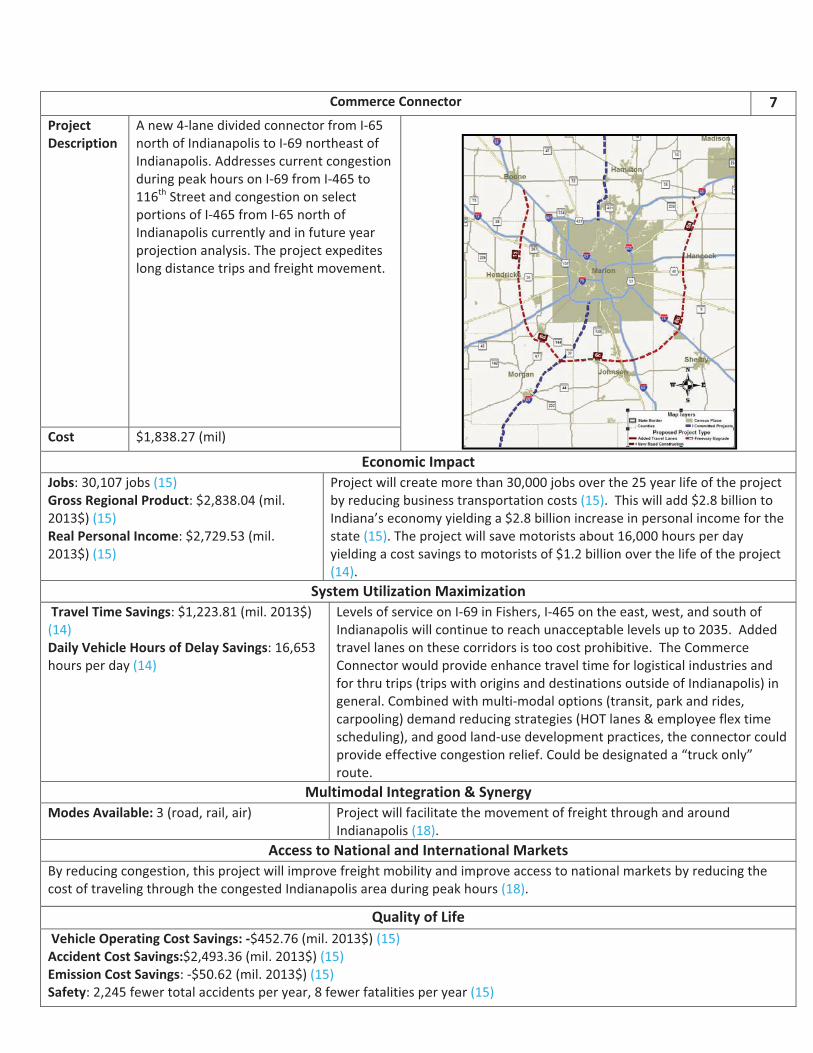
�
Commerce�Connector� 7�Project�Description�
A�new�4�lane�divided�connector�from�I�65�north�of�Indianapolis�to�I�69�northeast�of�Indianapolis.�Addresses�current�congestion�during�peak�hours�on�I�69�from�I�465�to�116th�Street�and�congestion�on�select�portions�of�I�465�from�I�65�north�of�Indianapolis�currently�and�in�future�year�projection�analysis.�The�project�expedites�long�distance�trips�and�freight�movement.�
�
Cost� $1,838.27�(mil)�
Economic�Impact�Jobs:�30,107�jobs�(15)�Gross�Regional�Product:�$2,838.04�(mil.�2013$)�(15)�Real�Personal�Income:�$2,729.53�(mil.�2013$)�(15)��
Project�will�create�more�than�30,000�jobs�over�the�25�year�life�of�the�project�by�reducing�business�transportation�costs�(15).��This�will�add�$2.8�billion�to�Indiana’s�economy�yielding�a�$2.8�billion�increase�in�personal�income�for�the�state�(15).�The�project�will�save�motorists�about�16,000�hours�per�day�yielding�a�cost�savings�to�motorists�of�$1.2�billion�over�the�life�of�the�project�(14).��
System�Utilization�Maximization��Travel�Time�Savings:�$1,223.81�(mil.�2013$)�(14)��Daily�Vehicle�Hours�of�Delay�Savings:�16,653�hours�per�day�(14)�
Levels�of�service�on�I�69�in�Fishers,�I�465�on�the�east,�west,�and�south�of�Indianapolis�will�continue�to�reach�unacceptable�levels�up�to�2035.��Added�travel�lanes�on�these�corridors�is�too�cost�prohibitive.��The�Commerce�Connector�would�provide�enhance�travel�time�for�logistical�industries�and�for�thru�trips�(trips�with�origins�and�destinations�outside�of�Indianapolis)�in�general.�Combined�with�multi�modal�options�(transit,�park�and�rides,�carpooling)�demand�reducing�strategies�(HOT�lanes�&�employee�flex�time�scheduling),�and�good�land�use�development�practices,�the�connector�could�provide�effective�congestion�relief.�Could�be�designated�a�“truck�only”�route.�
Multimodal�Integration�&�Synergy�Modes�Available:�3�(road,�rail,�air)�� Project�will�facilitate�the�movement�of�freight�through�and�around�
Indianapolis�(18).�Access�to�National�and�International�Markets�
By�reducing�congestion,�this�project�will�improve�freight�mobility�and�improve�access�to�national�markets�by�reducing�the�cost�of�traveling�through�the�congested�Indianapolis�area�during�peak�hours�(18).�
Quality�of�Life��Vehicle�Operating�Cost�Savings:��$452.76�(mil.�2013$)�(15)�Accident�Cost�Savings:$2,493.36�(mil.�2013$)�(15)�Emission�Cost�Savings:��$50.62�(mil.�2013$)�(15)�Safety:�2,245�fewer�total�accidents�per�year,�8�fewer�fatalities�per�year�(15)�
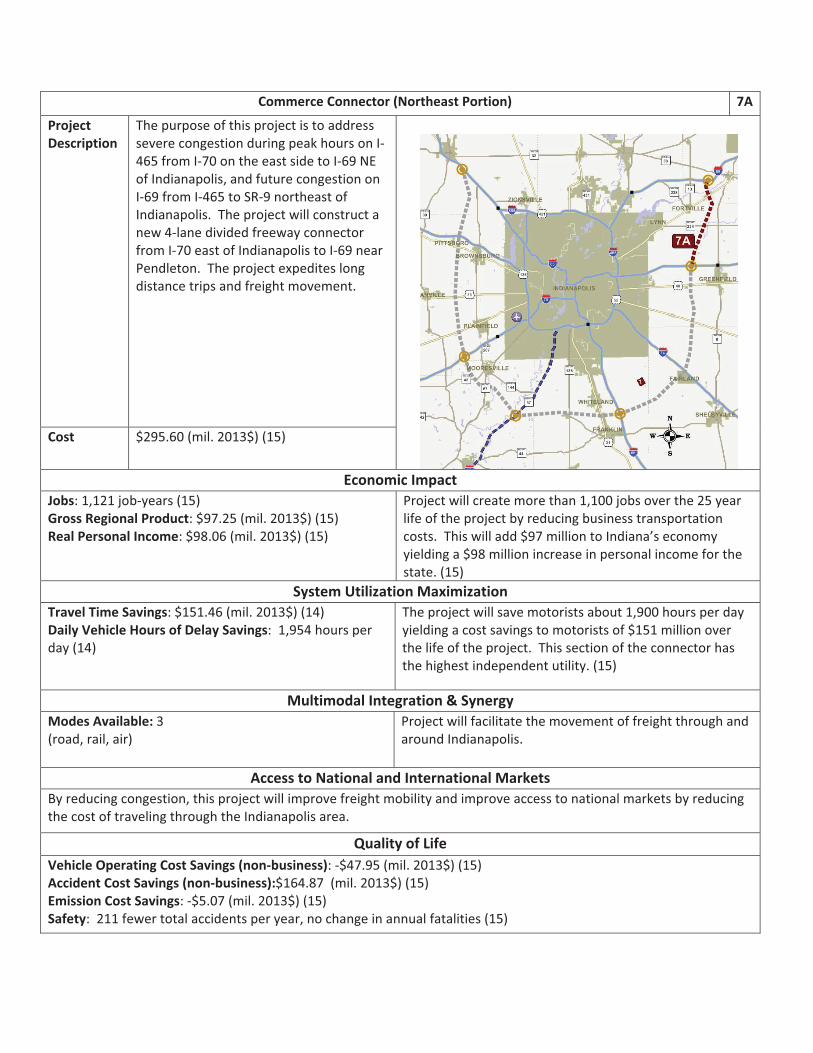
�
�
Commerce�Connector�(Northeast�Portion)�� 7A
Project�Description�
The�purpose�of�this�project�is�to�address�severe�congestion�during�peak�hours�on�I�465�from�I�70�on�the�east�side�to�I�69�NE�of�Indianapolis,�and�future�congestion�on�I�69�from�I�465�to�SR�9�northeast�of�Indianapolis.��The�project�will�construct�a�new�4�lane�divided�freeway�connector�from�I�70�east�of�Indianapolis�to�I�69�near�Pendleton.��The�project�expedites�long�distance�trips�and�freight�movement.��
�
Cost� $295.60�(mil.�2013$)�(15)�
Economic�Impact�Jobs:�1,121�job�years�(15)�Gross�Regional�Product:�$97.25�(mil.�2013$)�(15)�Real�Personal�Income:�$98.06�(mil.�2013$)�(15)��
Project�will�create�more�than�1,100�jobs�over�the�25�year�life�of�the�project�by�reducing�business�transportation�costs.��This�will�add�$97�million�to�Indiana’s�economy�yielding�a�$98�million�increase�in�personal�income�for�the�state.�(15)�
System�Utilization�Maximization�Travel�Time�Savings:�$151.46�(mil.�2013$)�(14)�Daily�Vehicle�Hours�of�Delay�Savings:��1,954�hours�per�day�(14)�
The�project�will�save�motorists�about�1,900�hours�per�day�yielding�a�cost�savings�to�motorists�of�$151�million�over�the�life�of�the�project.��This�section�of�the�connector�has�the�highest�independent�utility.�(15)�
Multimodal�Integration�&�Synergy�Modes�Available:�3��(road,�rail,�air)�
Project�will�facilitate�the�movement�of�freight�through�and�around�Indianapolis.�
Access�to�National�and�International�Markets�By�reducing�congestion,�this�project�will�improve�freight�mobility�and�improve�access�to�national�markets�by�reducing�the�cost�of�traveling�through�the�Indianapolis�area.�
Quality�of�Life�Vehicle�Operating�Cost�Savings�(non�business):��$47.95�(mil.�2013$)�(15)�Accident�Cost�Savings�(non�business):$164.87��(mil.�2013$)�(15)�Emission�Cost�Savings:��$5.07�(mil.�2013$)�(15)�Safety:��211�fewer�total�accidents�per�year,�no�change�in�annual�fatalities�(15)�
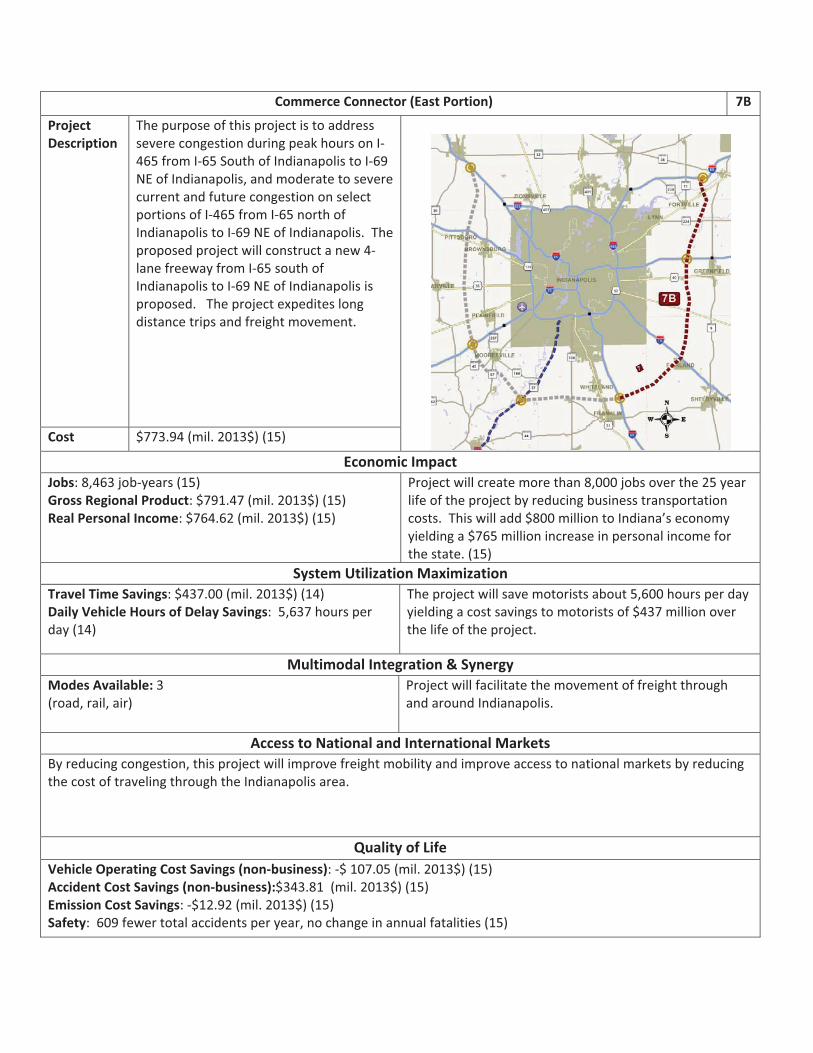
�
�
Commerce�Connector�(East�Portion)�� 7B�
Project�Description�
The�purpose�of�this�project�is�to�address�severe�congestion�during�peak�hours�on�I�465�from�I�65�South�of�Indianapolis�to�I�69�NE�of�Indianapolis,�and�moderate�to�severe�current�and�future�congestion�on�select�portions�of�I�465�from�I�65�north�of�Indianapolis�to�I�69�NE�of�Indianapolis.��The�proposed�project�will�construct�a�new�4�lane�freeway�from�I�65�south�of�Indianapolis�to�I�69�NE�of�Indianapolis�is�proposed.���The�project�expedites�long�distance�trips�and�freight�movement.��
�
Cost� $773.94�(mil.�2013$)�(15)�
Economic�Impact�Jobs:�8,463�job�years�(15)�Gross�Regional�Product:�$791.47�(mil.�2013$)�(15)�Real�Personal�Income:�$764.62�(mil.�2013$)�(15)��
Project�will�create�more�than�8,000�jobs�over�the�25�year�life�of�the�project�by�reducing�business�transportation�costs.��This�will�add�$800�million�to�Indiana’s�economy�yielding�a�$765�million�increase�in�personal�income�for�the�state.�(15)�
System�Utilization�Maximization�Travel�Time�Savings:�$437.00�(mil.�2013$)�(14)�Daily�Vehicle�Hours�of�Delay�Savings:��5,637�hours�per�day�(14)�
The�project�will�save�motorists�about�5,600�hours�per�day�yielding�a�cost�savings�to�motorists�of�$437�million�over�the�life�of�the�project.��
Multimodal�Integration�&�Synergy�Modes�Available:�3��(road,�rail,�air)�
Project�will�facilitate�the�movement�of�freight�through�and�around�Indianapolis.�
Access�to�National�and�International�Markets�By�reducing�congestion,�this�project�will�improve�freight�mobility�and�improve�access�to�national�markets�by�reducing�the�cost�of�traveling�through�the�Indianapolis�area.�
Quality�of�Life�Vehicle�Operating�Cost�Savings�(non�business):��$�107.05�(mil.�2013$)�(15)�Accident�Cost�Savings�(non�business):$343.81��(mil.�2013$)�(15)�Emission�Cost�Savings:��$12.92�(mil.�2013$)�(15)�Safety:��609�fewer�total�accidents�per�year,�no�change�in�annual�fatalities�(15)�
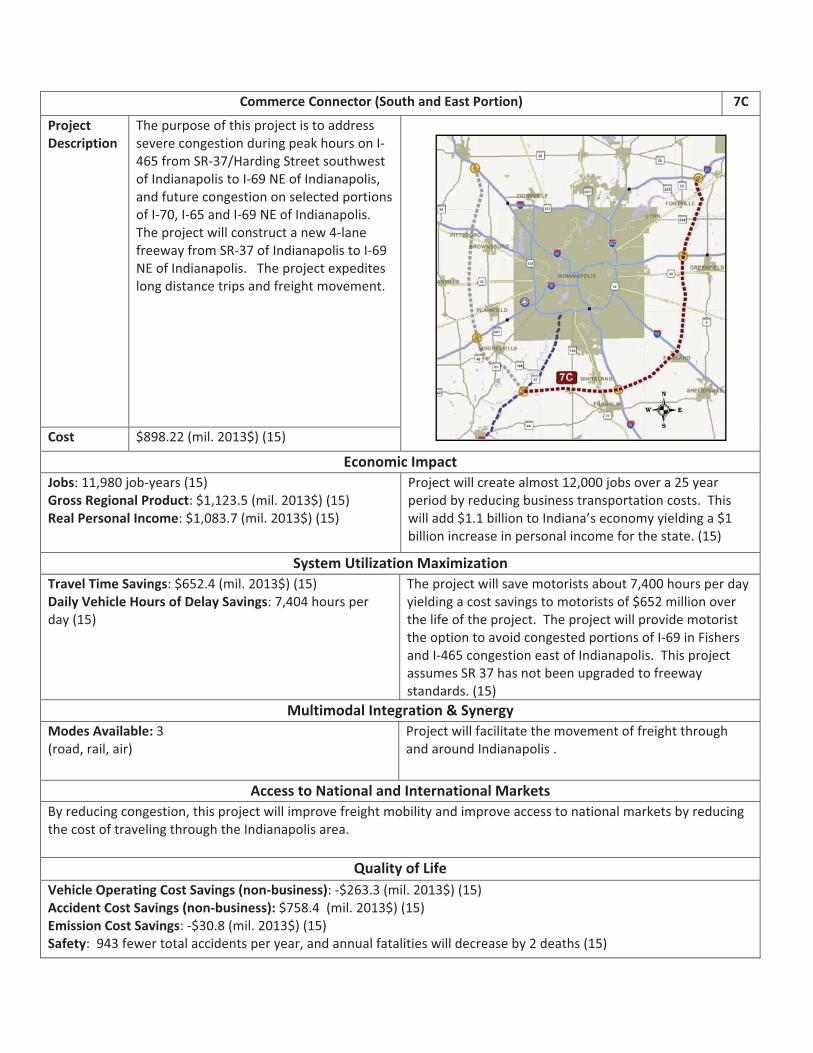
�
�
Commerce�Connector�(South�and�East�Portion)�� 7C�
Project�Description�
The�purpose�of�this�project�is�to�address�severe�congestion�during�peak�hours�on�I�465�from�SR�37/Harding�Street�southwest�of�Indianapolis�to�I�69�NE�of�Indianapolis,�and�future�congestion�on�selected�portions�of�I�70,�I�65�and�I�69�NE�of�Indianapolis.��The�project�will�construct�a�new�4�lane�freeway�from�SR�37�of�Indianapolis�to�I�69�NE�of�Indianapolis.���The�project�expedites�long�distance�trips�and�freight�movement.��
�
�Cost� $898.22�(mil.�2013$)�(15)�
Economic�Impact�Jobs:�11,980�job�years�(15)�Gross�Regional�Product:�$1,123.5�(mil.�2013$)�(15)�Real�Personal�Income:�$1,083.7�(mil.�2013$)�(15)��
Project�will�create�almost�12,000�jobs�over�a�25�year�period�by�reducing�business�transportation�costs.��This�will�add�$1.1�billion�to�Indiana’s�economy�yielding�a�$1�billion�increase�in�personal�income�for�the�state.�(15)�
System�Utilization�Maximization�Travel�Time�Savings:�$652.4�(mil.�2013$)�(15)�Daily�Vehicle�Hours�of�Delay�Savings:�7,404�hours�per�day�(15)�
The�project�will�save�motorists�about�7,400�hours�per�day�yielding�a�cost�savings�to�motorists�of�$652�million�over�the�life�of�the�project.��The�project�will�provide�motorist�the�option�to�avoid�congested�portions�of�I�69�in�Fishers�and�I�465�congestion�east�of�Indianapolis.��This�project�assumes�SR�37�has�not�been�upgraded�to�freeway�standards.�(15)�
Multimodal�Integration�&�Synergy�Modes�Available:�3���(road,�rail,�air)�
Project�will�facilitate�the�movement�of�freight�through�and�around�Indianapolis�.�
Access�to�National�and�International�Markets�By�reducing�congestion,�this�project�will�improve�freight�mobility�and�improve�access�to�national�markets�by�reducing�the�cost�of�traveling�through�the�Indianapolis�area.�
Quality�of�Life�Vehicle�Operating�Cost�Savings�(non�business):��$263.3�(mil.�2013$)�(15)�Accident�Cost�Savings�(non�business):�$758.4��(mil.�2013$)�(15)�Emission�Cost�Savings:��$30.8�(mil.�2013$)�(15)�Safety:��943�fewer�total�accidents�per�year,�and�annual�fatalities�will�decrease�by�2�deaths�(15)�
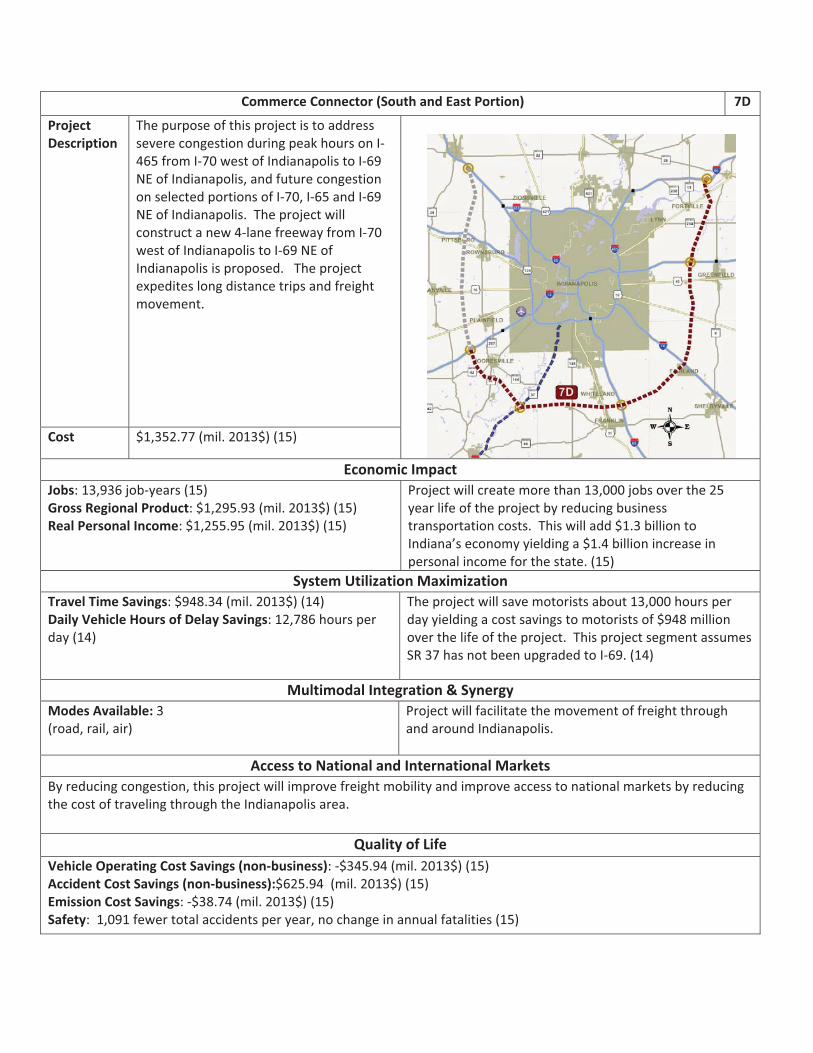
�
�
Commerce�Connector�(South�and�East�Portion)�� 7D�
Project�Description�
The�purpose�of�this�project�is�to�address�severe�congestion�during�peak�hours�on�I�465�from�I�70�west�of�Indianapolis�to�I�69�NE�of�Indianapolis,�and�future�congestion�on�selected�portions�of�I�70,�I�65�and�I�69�NE�of�Indianapolis.��The�project�will�construct�a�new�4�lane�freeway�from�I�70�west�of�Indianapolis�to�I�69�NE�of�Indianapolis�is�proposed.���The�project�expedites�long�distance�trips�and�freight�movement.��
�
Cost� $1,352.77�(mil.�2013$)�(15)�
Economic�Impact�Jobs:�13,936�job�years�(15)�Gross�Regional�Product:�$1,295.93�(mil.�2013$)�(15)�Real�Personal�Income:�$1,255.95�(mil.�2013$)�(15)��
Project�will�create�more�than�13,000�jobs�over�the�25�year�life�of�the�project�by�reducing�business�transportation�costs.��This�will�add�$1.3�billion�to�Indiana’s�economy�yielding�a�$1.4�billion�increase�in�personal�income�for�the�state.�(15)�
System�Utilization�Maximization�Travel�Time�Savings:�$948.34�(mil.�2013$)�(14)�Daily�Vehicle�Hours�of�Delay�Savings:�12,786�hours�per�day�(14)�
The�project�will�save�motorists�about�13,000�hours�per�day�yielding�a�cost�savings�to�motorists�of�$948�million�over�the�life�of�the�project.��This�project�segment�assumes�SR�37�has�not�been�upgraded�to�I�69.�(14)�
Multimodal�Integration�&�Synergy�Modes�Available:�3��(road,�rail,�air)�
Project�will�facilitate�the�movement�of�freight�through�and�around�Indianapolis.�
Access�to�National�and�International�Markets�By�reducing�congestion,�this�project�will�improve�freight�mobility�and�improve�access�to�national�markets�by�reducing�the�cost�of�traveling�through�the�Indianapolis�area.�
Quality�of�Life�Vehicle�Operating�Cost�Savings�(non�business):��$345.94�(mil.�2013$)�(15)�Accident�Cost�Savings�(non�business):$625.94��(mil.�2013$)�(15)�Emission�Cost�Savings:��$38.74�(mil.�2013$)�(15)�Safety:��1,091�fewer�total�accidents�per�year,�no�change�in�annual�fatalities�(15)�
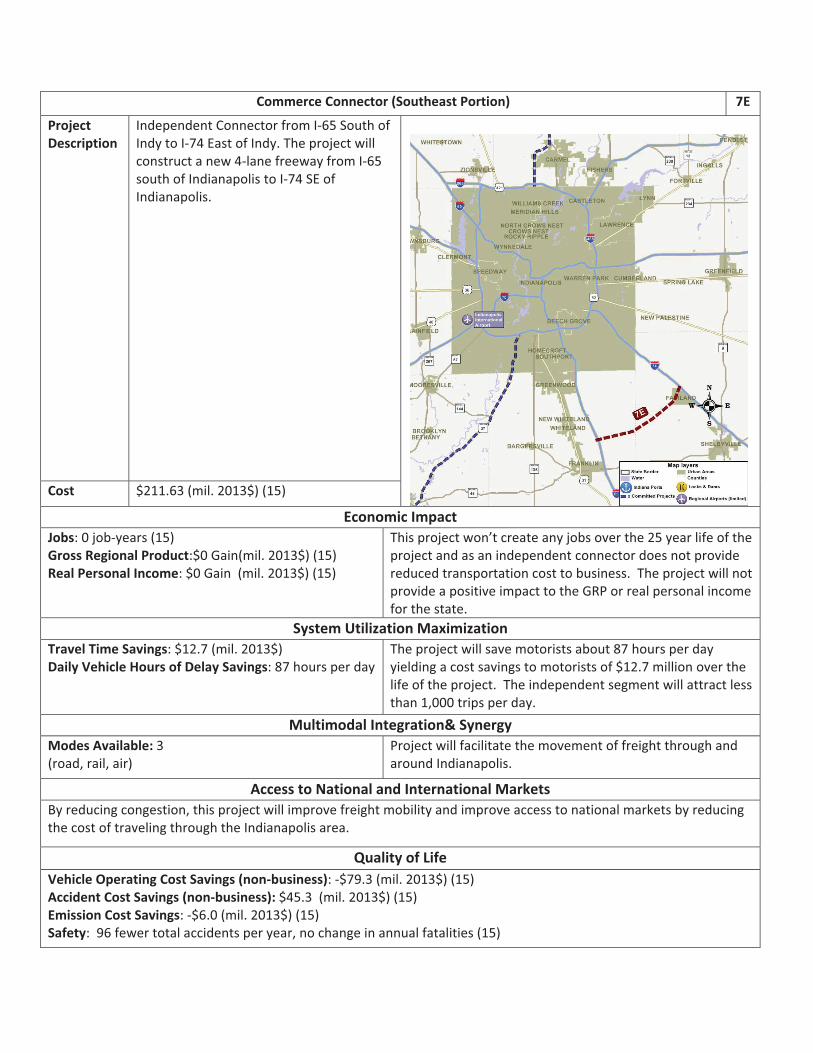
�
�
Commerce�Connector�(Southeast�Portion)�� 7E�
Project�Description�
Independent�Connector�from�I�65�South�of�Indy�to�I�74�East�of�Indy.�The�project�will�construct�a�new�4�lane�freeway�from�I�65�south�of�Indianapolis�to�I�74�SE�of�Indianapolis.����
�
Cost� $211.63�(mil.�2013$)�(15)�
Economic�Impact�Jobs:�0�job�years�(15)�Gross�Regional�Product:$0�Gain(mil.�2013$)�(15)�Real�Personal�Income:�$0�Gain��(mil.�2013$)�(15)��
This�project�won’t�create�any�jobs�over�the�25�year�life�of�the�project�and�as�an�independent�connector�does�not�provide�reduced�transportation�cost�to�business.��The�project�will�not�provide�a�positive�impact�to�the�GRP�or�real�personal�income�for�the�state.���
System�Utilization�Maximization�Travel�Time�Savings:�$12.7�(mil.�2013$)��Daily�Vehicle�Hours�of�Delay�Savings:�87�hours�per�day�
The�project�will�save�motorists�about�87�hours�per�day�yielding�a�cost�savings�to�motorists�of�$12.7�million�over�the�life�of�the�project.��The�independent�segment�will�attract�less�than�1,000�trips�per�day.��
Multimodal�Integration&�Synergy�Modes�Available:�3��(road,�rail,�air)�
Project�will�facilitate�the�movement�of�freight�through�and�around�Indianapolis.�
Access�to�National�and�International�Markets�By�reducing�congestion,�this�project�will�improve�freight�mobility�and�improve�access�to�national�markets�by�reducing�the�cost�of�traveling�through�the�Indianapolis�area.�
Quality�of�Life�Vehicle�Operating�Cost�Savings�(non�business):��$79.3�(mil.�2013$)�(15)�Accident�Cost�Savings�(non�business):�$45.3��(mil.�2013$)�(15)�Emission�Cost�Savings:��$6.0�(mil.�2013$)�(15)�Safety:��96�fewer�total�accidents�per�year,�no�change�in�annual�fatalities�(15)�
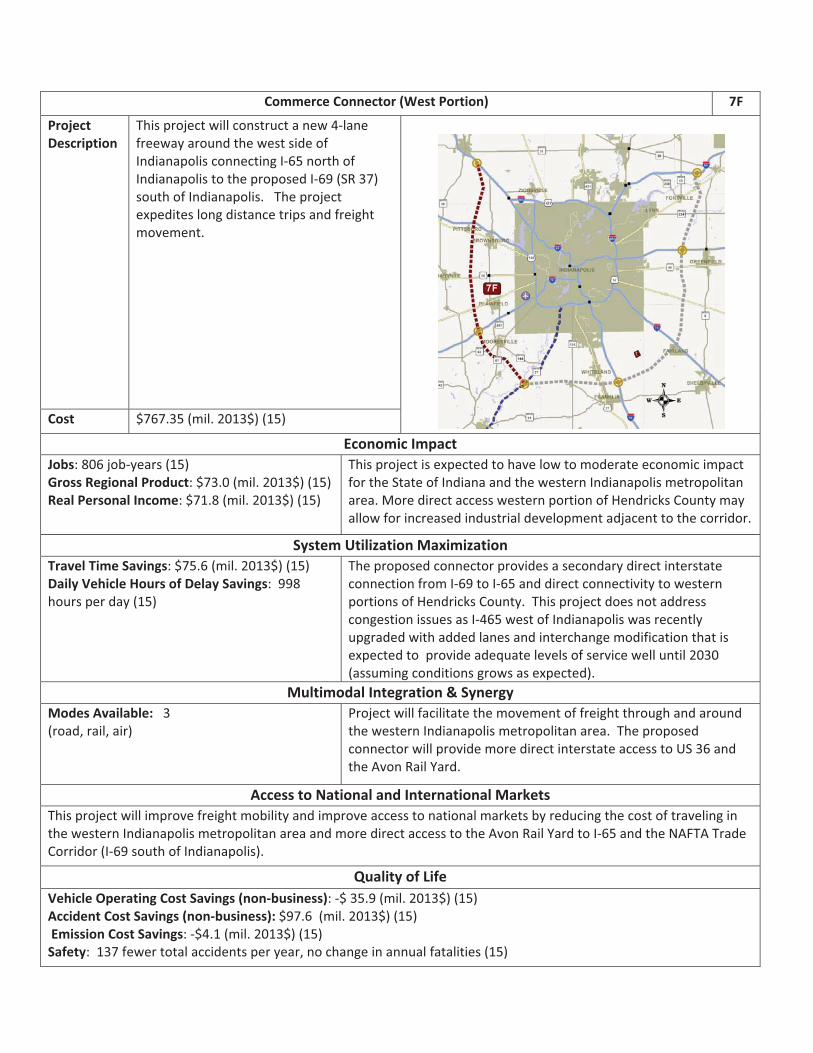
�
�
Commerce�Connector�(West�Portion)�� 7F�
Project�Description�
This�project�will�construct�a�new�4�lane�freeway�around�the�west�side�of�Indianapolis�connecting�I�65�north�of�Indianapolis�to�the�proposed�I�69�(SR�37)�south�of�Indianapolis.���The�project�expedites�long�distance�trips�and�freight�movement.��
�
Cost� $767.35�(mil.�2013$)�(15)�
Economic�Impact�Jobs:�806�job�years�(15)�Gross�Regional�Product:�$73.0�(mil.�2013$)�(15)�Real�Personal�Income:�$71.8�(mil.�2013$)�(15)�
This�project�is�expected�to�have�low�to�moderate�economic�impact�for�the�State�of�Indiana�and�the�western�Indianapolis�metropolitan�area.�More�direct�access�western�portion�of�Hendricks�County�may�allow�for�increased�industrial�development�adjacent�to�the�corridor.���
System�Utilization�Maximization�Travel�Time�Savings:�$75.6�(mil.�2013$)�(15)�Daily�Vehicle�Hours�of�Delay�Savings:��998�hours�per�day�(15)�
The�proposed�connector�provides�a�secondary�direct�interstate�connection�from�I�69�to�I�65�and�direct�connectivity�to�western�portions�of�Hendricks�County.��This�project�does�not�address�congestion�issues�as�I�465�west�of�Indianapolis�was�recently�upgraded�with�added�lanes�and�interchange�modification�that�is�expected�to��provide�adequate�levels�of�service�well�until�2030�(assuming�conditions�grows�as�expected).����
Multimodal�Integration�&�Synergy�Modes�Available:���3�(road,�rail,�air)�
Project�will�facilitate�the�movement�of�freight�through�and�around�the�western�Indianapolis�metropolitan�area.��The�proposed�connector�will�provide�more�direct�interstate�access�to�US�36�and�the�Avon�Rail�Yard.�
Access�to�National�and�International�Markets�This�project�will�improve�freight�mobility�and�improve�access�to�national�markets�by�reducing�the�cost�of�traveling�in�the�western�Indianapolis�metropolitan�area�and�more�direct�access�to�the�Avon�Rail�Yard�to�I�65�and�the�NAFTA�Trade�Corridor�(I�69�south�of�Indianapolis).��
Quality�of�Life�Vehicle�Operating�Cost�Savings�(non�business):��$�35.9�(mil.�2013$)�(15)�Accident�Cost�Savings�(non�business):�$97.6��(mil.�2013$)�(15)��Emission�Cost�Savings:��$4.1�(mil.�2013$)�(15)�Safety:��137�fewer�total�accidents�per�year,�no�change�in�annual�fatalities�(15)�
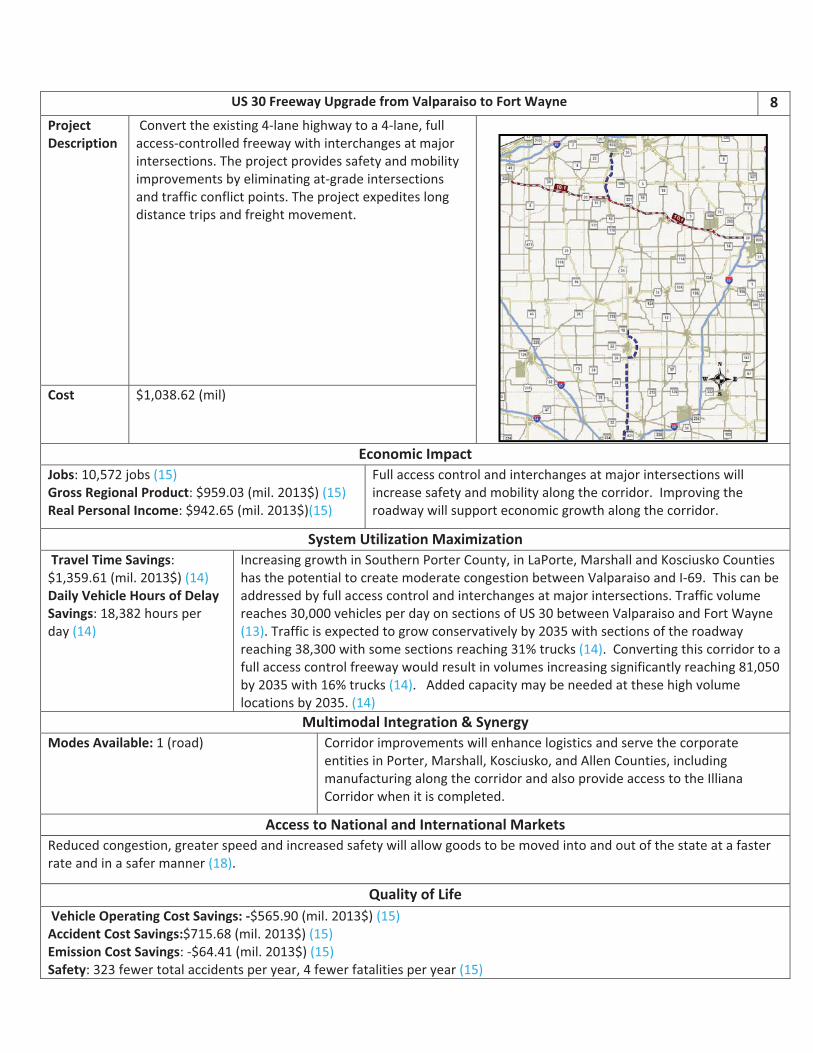
�
�
US�30�Freeway�Upgrade�from�Valparaiso�to�Fort�Wayne� 8�Project�Description�
�Convert�the�existing�4�lane�highway�to�a�4�lane,�full�access�controlled�freeway�with�interchanges�at�major�intersections.�The�project�provides�safety�and�mobility�improvements�by�eliminating�at�grade�intersections�and�traffic�conflict�points.�The�project�expedites�long�distance�trips�and�freight�movement.��
�
Cost� $1,038.62�(mil)�
Economic�Impact�Jobs:�10,572�jobs�(15)�Gross�Regional�Product:�$959.03�(mil.�2013$)�(15)�Real�Personal�Income:�$942.65�(mil.�2013$)(15)�
Full�access�control�and�interchanges�at�major�intersections�will�increase�safety�and�mobility�along�the�corridor.��Improving�the�roadway�will�support�economic�growth�along�the�corridor.�
System�Utilization�Maximization��Travel�Time�Savings:�$1,359.61�(mil.�2013$)�(14)���Daily�Vehicle�Hours�of�Delay�Savings:�18,382�hours�per�day�(14)�
Increasing�growth�in�Southern�Porter�County,�in�LaPorte,�Marshall�and�Kosciusko�Counties�has�the�potential�to�create�moderate�congestion�between�Valparaiso�and�I�69.��This�can�be�addressed�by�full�access�control�and�interchanges�at�major�intersections.�Traffic�volume�reaches�30,000�vehicles�per�day�on�sections�of�US�30�between�Valparaiso�and�Fort�Wayne�(13).�Traffic�is�expected�to�grow�conservatively�by�2035�with�sections�of�the�roadway�reaching�38,300�with�some�sections�reaching�31%�trucks�(14).��Converting�this�corridor�to�a�full�access�control�freeway�would�result�in�volumes�increasing�significantly�reaching�81,050�by�2035�with�16%�trucks�(14).���Added�capacity�may�be�needed�at�these�high�volume�locations�by�2035.�(14)�
Multimodal�Integration�&�Synergy�Modes�Available:�1�(road)�� Corridor�improvements�will�enhance�logistics�and�serve�the�corporate�
entities�in�Porter,�Marshall,�Kosciusko,�and�Allen�Counties,�including�manufacturing�along�the�corridor�and�also�provide�access�to�the�Illiana�Corridor�when�it�is�completed.�
Access�to�National�and�International�Markets�Reduced�congestion,�greater�speed�and�increased�safety�will�allow�goods�to�be�moved�into�and�out�of�the�state�at�a�faster�rate�and�in�a�safer�manner�(18).�
Quality�of�Life��Vehicle�Operating�Cost�Savings:��$565.90�(mil.�2013$)�(15)�Accident�Cost�Savings:$715.68�(mil.�2013$)�(15)�Emission�Cost�Savings:��$64.41�(mil.�2013$)�(15)�Safety:�323�fewer�total�accidents�per�year,�4�fewer�fatalities�per�year�(15)�
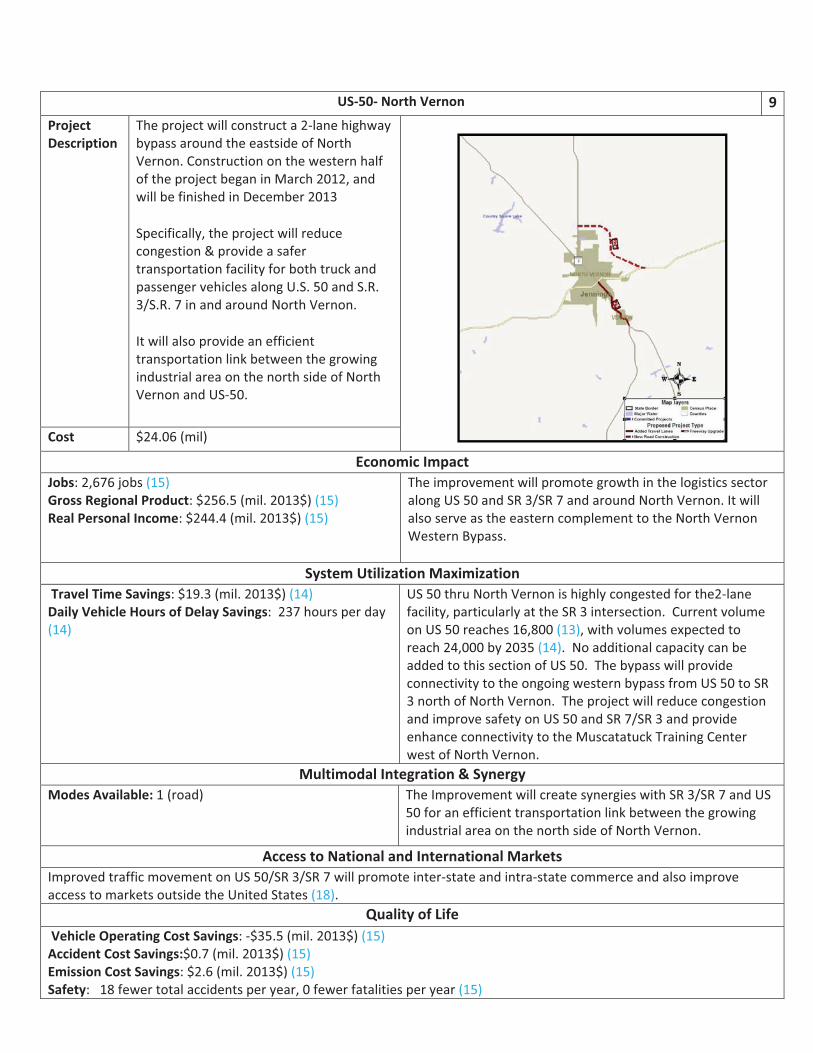
�
US�50��North�Vernon� 9Project�Description�
The�project�will�construct�a�2�lane�highway�bypass�around�the�eastside�of�North�Vernon.�Construction�on�the�western�half�of�the�project�began�in�March�2012,�and�will�be�finished�in�December�2013�
Specifically,�the�project�will�reduce�congestion�&�provide�a�safer�transportation�facility�for�both�truck�and�passenger�vehicles�along�U.S.�50�and�S.R.�3/S.R.�7�in�and�around�North�Vernon.�
It�will�also�provide�an�efficient�transportation�link�between�the�growing�industrial�area�on�the�north�side�of�North�Vernon�and�US�50.�
�
�Cost� $24.06�(mil)�
Economic�Impact�Jobs:�2,676�jobs�(15)�Gross�Regional�Product:�$256.5�(mil.�2013$)�(15)�Real�Personal�Income:�$244.4�(mil.�2013$)�(15)��
The�improvement�will�promote�growth�in�the�logistics�sector�along�US�50�and�SR�3/SR�7�and�around�North�Vernon.�It�will�also�serve�as�the�eastern�complement�to�the�North�Vernon�Western�Bypass.��
System�Utilization�Maximization��Travel�Time�Savings:�$19.3�(mil.�2013$)�(14)�Daily�Vehicle�Hours�of�Delay�Savings:��237�hours�per�day�(14)��
US�50�thru�North�Vernon�is�highly�congested�for�the2�lane�facility,�particularly�at�the�SR�3�intersection.��Current�volume�on�US�50�reaches�16,800�(13),�with�volumes�expected�to�reach�24,000�by�2035�(14).��No�additional�capacity�can�be�added�to�this�section�of�US�50.��The�bypass�will�provide�connectivity�to�the�ongoing�western�bypass�from�US�50�to�SR�3�north�of�North�Vernon.��The�project�will�reduce�congestion�and�improve�safety�on�US�50�and�SR�7/SR�3�and�provide�enhance�connectivity�to�the�Muscatatuck�Training�Center�west�of�North�Vernon.��
Multimodal�Integration�&�Synergy�Modes�Available:�1�(road)� The�Improvement�will�create�synergies�with�SR�3/SR�7�and�US�
50�for�an�efficient�transportation�link�between�the�growing�industrial�area�on�the�north�side�of�North�Vernon.�
Access�to�National�and�International�Markets�Improved�traffic�movement�on�US�50/SR�3/SR�7�will�promote�inter�state�and�intra�state�commerce�and�also�improve�access�to�markets�outside�the�United�States�(18).�
Quality�of�Life��Vehicle�Operating�Cost�Savings:��$35.5�(mil.�2013$)�(15)�Accident�Cost�Savings:$0.7�(mil.�2013$)�(15)�Emission�Cost�Savings:�$2.6�(mil.�2013$)�(15)�Safety:���18�fewer�total�accidents�per�year,�0�fewer�fatalities�per�year�(15)�
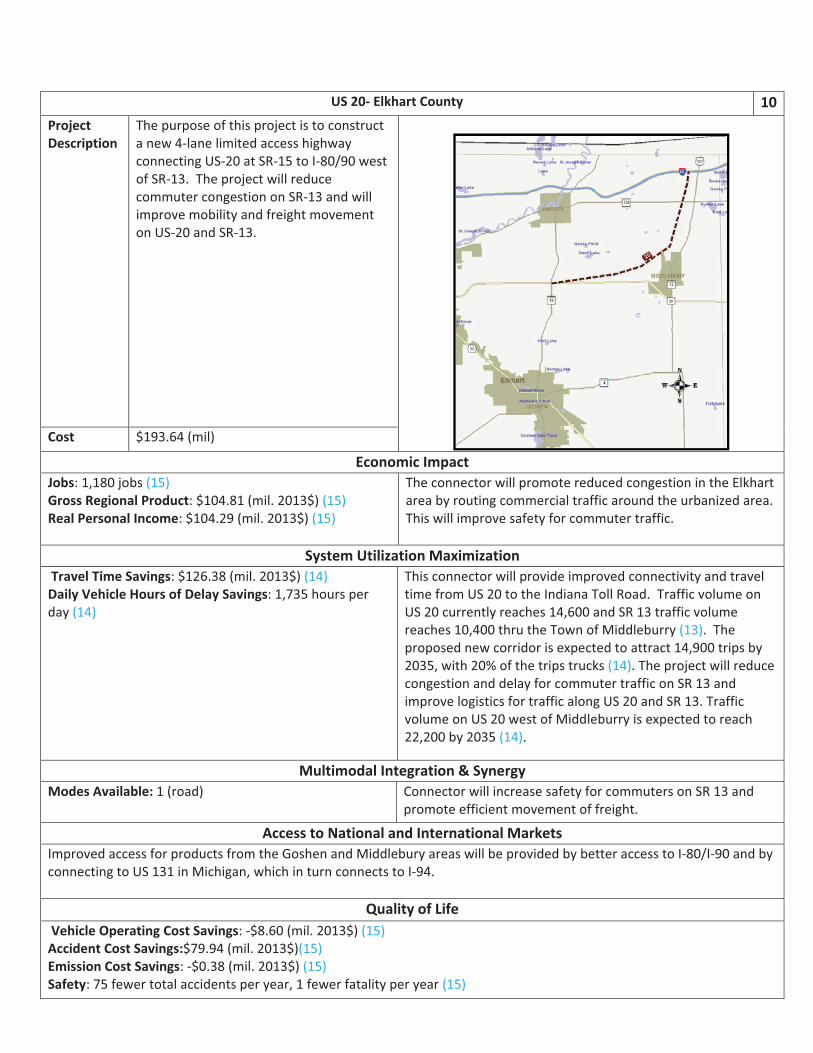
�
US�20��Elkhart�County� 10Project�Description�
The�purpose�of�this�project�is�to�construct�a�new�4�lane�limited�access�highway�connecting�US�20�at�SR�15�to�I�80/90�west�of�SR�13.��The�project�will�reduce�commuter�congestion�on�SR�13�and�will�improve�mobility�and�freight�movement�on�US�20�and�SR�13.���
�
Cost� $193.64�(mil)�
Economic�Impact�Jobs:�1,180�jobs�(15)�Gross�Regional�Product:�$104.81�(mil.�2013$)�(15)�Real�Personal�Income:�$104.29�(mil.�2013$)�(15)��
The�connector�will�promote�reduced�congestion�in�the�Elkhart�area�by�routing�commercial�traffic�around�the�urbanized�area.��This�will�improve�safety�for�commuter�traffic.��
System�Utilization�Maximization��Travel�Time�Savings:�$126.38�(mil.�2013$)�(14)�Daily�Vehicle�Hours�of�Delay�Savings:�1,735�hours�per�day�(14)�
This�connector�will�provide�improved�connectivity�and�travel�time�from�US�20�to�the�Indiana�Toll�Road.��Traffic�volume�on�US�20�currently�reaches�14,600�and�SR�13�traffic�volume�reaches�10,400�thru�the�Town�of�Middleburry�(13).��The�proposed�new�corridor�is�expected�to�attract�14,900�trips�by�2035,�with�20%�of�the�trips�trucks�(14).�The�project�will�reduce�congestion�and�delay�for�commuter�traffic�on�SR�13�and�improve�logistics�for�traffic�along�US�20�and�SR�13.�Traffic�volume�on�US�20�west�of�Middleburry�is�expected�to�reach�22,200�by�2035�(14).��
Multimodal�Integration�&�Synergy�Modes�Available:�1�(road)�� Connector�will�increase�safety�for�commuters�on�SR�13�and�
promote�efficient�movement�of�freight.�
Access�to�National�and�International�Markets�Improved�access�for�products�from�the�Goshen�and�Middlebury�areas�will�be�provided�by�better�access�to�I�80/I�90�and�by�connecting�to�US�131�in�Michigan,�which�in�turn�connects�to�I�94.���
Quality�of�Life��Vehicle�Operating�Cost�Savings:��$8.60�(mil.�2013$)�(15)�Accident�Cost�Savings:$79.94�(mil.�2013$)(15)�Emission�Cost�Savings:��$0.38�(mil.�2013$)�(15)�Safety:�75�fewer�total�accidents�per�year,�1�fewer�fatality�per�year�(15)�
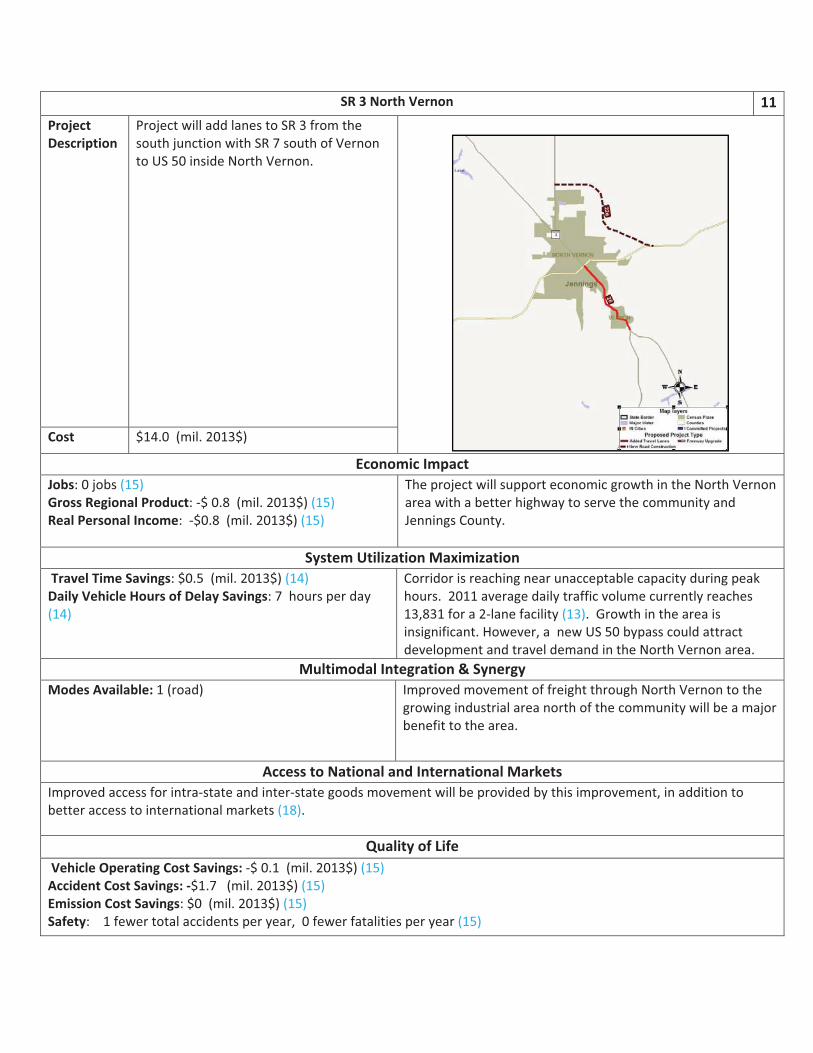
�
�
SR�3�North�Vernon� 11Project�Description�
Project�will�add�lanes�to�SR�3�from�the�south�junction�with�SR�7�south�of�Vernon�to�US�50�inside�North�Vernon.�
�
Cost� $14.0��(mil.�2013$)�
Economic�Impact�Jobs:�0�jobs�(15)�Gross�Regional�Product:��$�0.8��(mil.�2013$)�(15)�Real�Personal�Income:���$0.8��(mil.�2013$)�(15)��
The�project�will�support�economic�growth�in�the�North�Vernon�area�with�a�better�highway�to�serve�the�community�and�Jennings�County.�
System�Utilization�Maximization��Travel�Time�Savings:�$0.5��(mil.�2013$)�(14)�Daily�Vehicle�Hours�of�Delay�Savings:�7��hours�per�day�(14)�
Corridor�is�reaching�near�unacceptable�capacity�during�peak�hours.��2011�average�daily�traffic�volume�currently�reaches�13,831�for�a�2�lane�facility�(13).��Growth�in�the�area�is�insignificant.�However,�a��new�US�50�bypass�could�attract�development�and�travel�demand�in�the�North�Vernon�area.��
Multimodal�Integration�&�Synergy�Modes�Available:�1�(road)�� Improved�movement�of�freight�through�North�Vernon�to�the�
growing�industrial�area�north�of�the�community�will�be�a�major�benefit�to�the�area.���
Access�to�National�and�International�Markets�Improved�access�for�intra�state�and�inter�state�goods�movement�will�be�provided�by�this�improvement,�in�addition�to�better�access�to�international�markets�(18).��
Quality�of�Life��Vehicle�Operating�Cost�Savings:��$�0.1��(mil.�2013$)�(15)�Accident�Cost�Savings:��$1.7���(mil.�2013$)�(15)�Emission�Cost�Savings:�$0��(mil.�2013$)�(15)�Safety:����1�fewer�total�accidents�per�year,��0�fewer�fatalities�per�year�(15)�
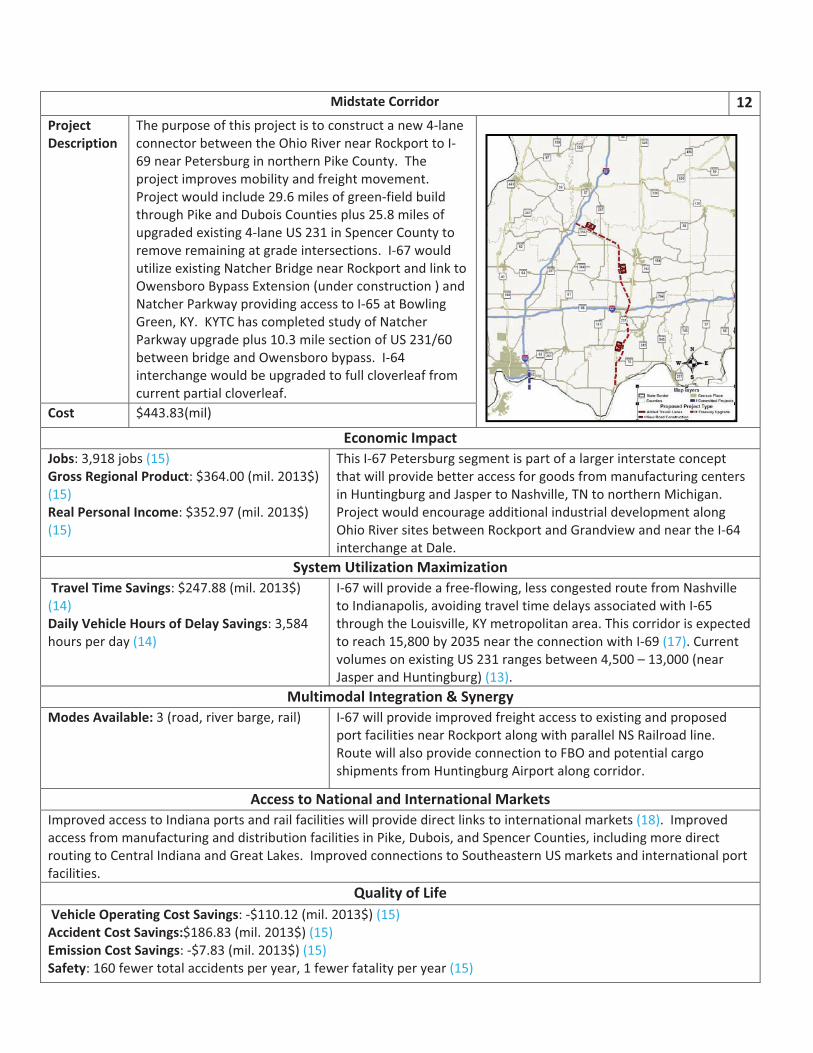
�
�
Midstate�Corridor� 12Project�Description�
The�purpose�of�this�project�is�to�construct�a�new�4�lane�connector�between�the�Ohio�River�near�Rockport�to�I�69�near�Petersburg�in�northern�Pike�County.��The�project�improves�mobility�and�freight�movement.��Project�would�include�29.6�miles�of�green�field�build�through�Pike�and�Dubois�Counties�plus�25.8�miles�of�upgraded�existing�4�lane�US�231�in�Spencer�County�to�remove�remaining�at�grade�intersections.��I�67�would�utilize�existing�Natcher�Bridge�near�Rockport�and�link�to�Owensboro�Bypass�Extension�(under�construction�)�and�Natcher�Parkway�providing�access�to�I�65�at�Bowling�Green,�KY.��KYTC�has�completed�study�of�Natcher�Parkway�upgrade�plus�10.3�mile�section�of�US�231/60�between�bridge�and�Owensboro�bypass.��I�64�interchange�would�be�upgraded�to�full�cloverleaf�from�current�partial�cloverleaf.�
�
Cost� $443.83(mil)�
Economic�Impact�Jobs:�3,918�jobs�(15)�Gross�Regional�Product:�$364.00�(mil.�2013$)�(15)�Real�Personal�Income:�$352.97�(mil.�2013$)�(15)�
This�I�67�Petersburg�segment�is�part�of�a�larger�interstate�concept�that�will�provide�better�access�for�goods�from�manufacturing�centers�in�Huntingburg�and�Jasper�to�Nashville,�TN�to�northern�Michigan.��Project�would�encourage�additional�industrial�development�along�Ohio�River�sites�between�Rockport�and�Grandview�and�near�the�I�64�interchange�at�Dale.�
System�Utilization�Maximization���Travel�Time�Savings:�$247.88�(mil.�2013$)�(14)��Daily�Vehicle�Hours�of�Delay�Savings:�3,584�hours�per�day�(14)�
I�67�will�provide�a�free�flowing,�less�congested�route�from�Nashville�to�Indianapolis,�avoiding�travel�time�delays�associated�with�I�65�through�the�Louisville,�KY�metropolitan�area.�This�corridor�is�expected�to�reach�15,800�by�2035�near�the�connection�with�I�69�(17).�Current�volumes�on�existing�US�231�ranges�between�4,500�–�13,000�(near�Jasper�and�Huntingburg)�(13).��
Multimodal�Integration�&�Synergy�Modes�Available:�3�(road,�river�barge,�rail)� I�67�will�provide�improved�freight�access�to�existing�and�proposed�
port�facilities�near�Rockport�along�with�parallel�NS�Railroad�line.��Route�will�also�provide�connection�to�FBO�and�potential�cargo�shipments�from�Huntingburg�Airport�along�corridor.�
Access�to�National�and�International�Markets�Improved�access�to�Indiana�ports�and�rail�facilities�will�provide�direct�links�to�international�markets�(18).��Improved�access�from�manufacturing�and�distribution�facilities�in�Pike,�Dubois,�and�Spencer�Counties,�including�more�direct�routing�to�Central�Indiana�and�Great�Lakes.��Improved�connections�to�Southeastern�US�markets�and�international�port�facilities.�
Quality�of�Life��Vehicle�Operating�Cost�Savings:��$110.12�(mil.�2013$)�(15)�Accident�Cost�Savings:$186.83�(mil.�2013$)�(15)�Emission�Cost�Savings:��$7.83�(mil.�2013$)�(15)�Safety:�160�fewer�total�accidents�per�year,�1�fewer�fatality�per�year�(15)�
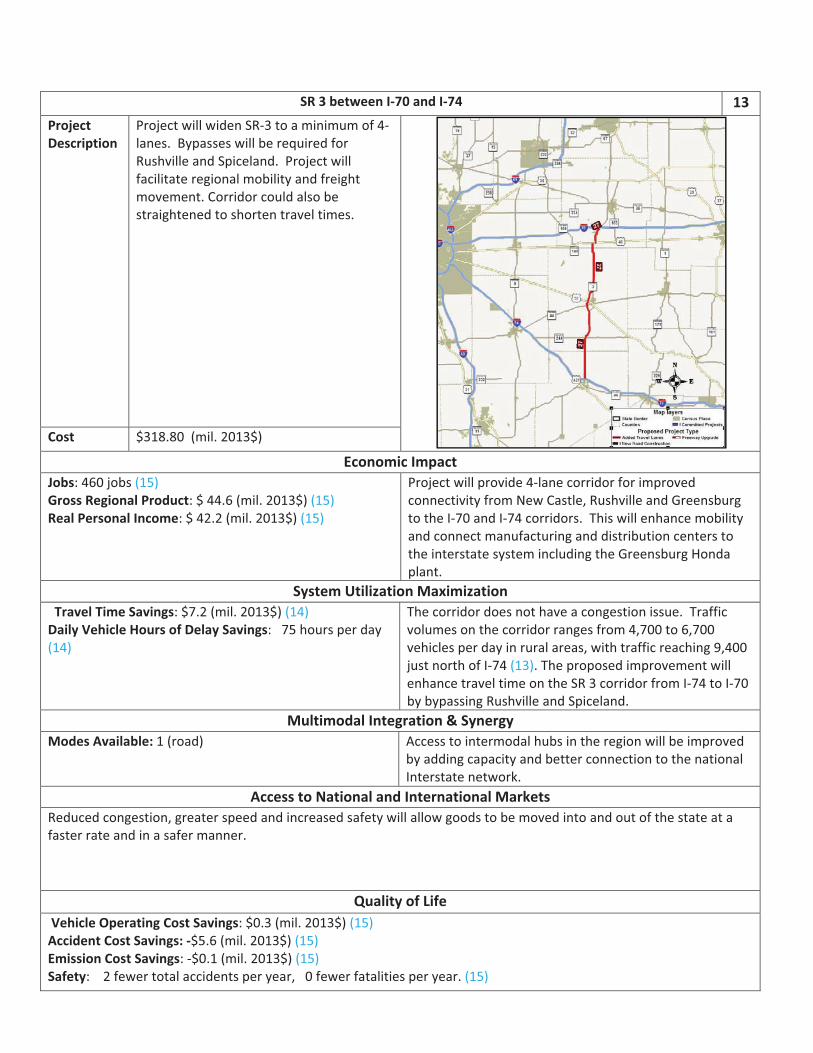
�
SR�3�between�I�70�and�I�74� 13�Project�Description�
Project�will�widen�SR�3�to�a�minimum�of�4�lanes.��Bypasses�will�be�required�for�Rushville�and�Spiceland.��Project�will�facilitate�regional�mobility�and�freight�movement.�Corridor�could�also�be�straightened�to�shorten�travel�times.��
Cost� $318.80��(mil.�2013$)�
Economic�Impact�Jobs:�460�jobs�(15)�Gross�Regional�Product:�$�44.6�(mil.�2013$)�(15)�Real�Personal�Income:�$�42.2�(mil.�2013$)�(15)�
Project�will�provide�4�lane�corridor�for�improved�connectivity�from�New�Castle,�Rushville�and�Greensburg�to�the�I�70�and�I�74�corridors.��This�will�enhance�mobility�and�connect�manufacturing�and�distribution�centers�to�the�interstate�system�including�the�Greensburg�Honda�plant.���
System�Utilization�Maximization���Travel�Time�Savings:�$7.2�(mil.�2013$)�(14)�Daily�Vehicle�Hours�of�Delay�Savings:���75�hours�per�day�(14)�
The�corridor�does�not�have�a�congestion�issue.��Traffic�volumes�on�the�corridor�ranges�from�4,700�to�6,700�vehicles�per�day�in�rural�areas,�with�traffic�reaching�9,400�just�north�of�I�74�(13).�The�proposed�improvement�will�enhance�travel�time�on�the�SR�3�corridor�from�I�74�to�I�70�by�bypassing�Rushville�and�Spiceland.����
Multimodal�Integration�&�Synergy�Modes�Available:�1�(road)�� Access�to�intermodal�hubs�in�the�region�will�be�improved�
by�adding�capacity�and�better�connection�to�the�national�Interstate�network.�
Access�to�National�and�International�Markets�Reduced�congestion,�greater�speed�and�increased�safety�will�allow�goods�to�be�moved�into�and�out�of�the�state�at�a�faster�rate�and�in�a�safer�manner.�
Quality�of�Life��Vehicle�Operating�Cost�Savings:�$0.3�(mil.�2013$)�(15)�Accident�Cost�Savings:��$5.6�(mil.�2013$)�(15)�Emission�Cost�Savings:��$0.1�(mil.�2013$)�(15)�Safety:����2�fewer�total�accidents�per�year,���0�fewer�fatalities�per�year.�(15)�
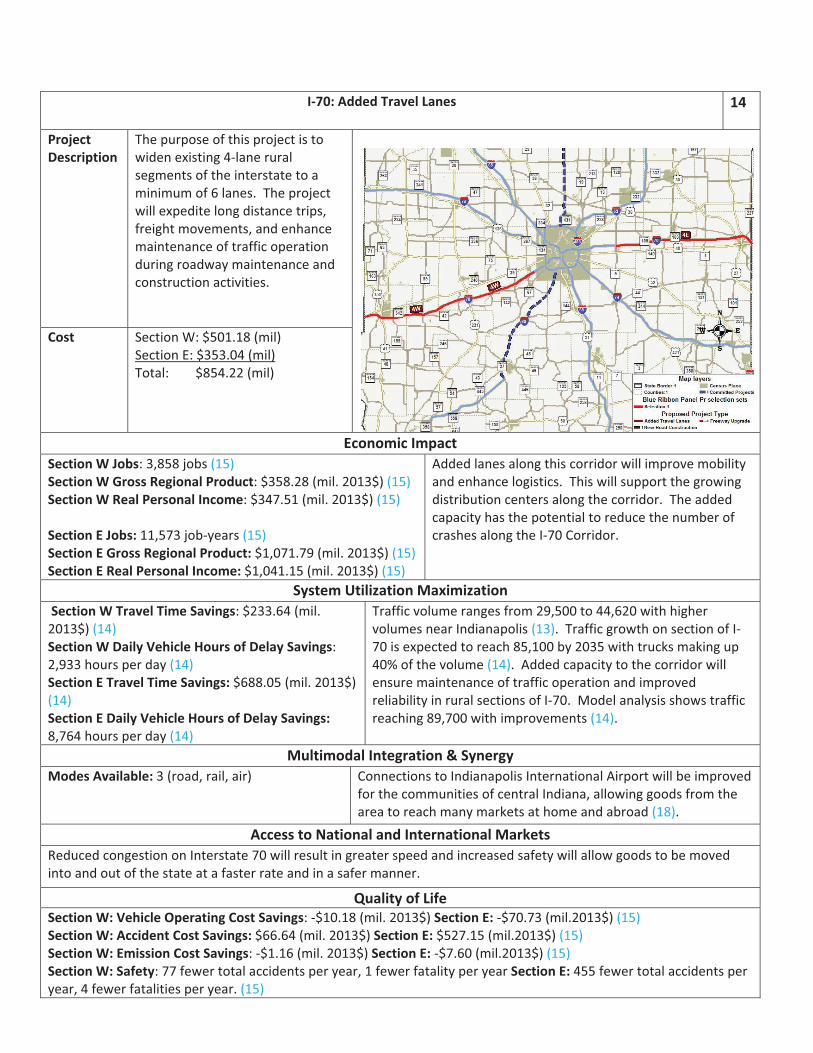
�
I�70:�Added�Travel�Lanes� 14��
Project�Description�
The�purpose�of�this�project�is�to�widen�existing�4�lane�rural�segments�of�the�interstate�to�a�minimum�of�6�lanes.��The�project�will�expedite�long�distance�trips,�freight�movements,�and�enhance�maintenance�of�traffic�operation�during�roadway�maintenance�and�construction�activities.��
�
Cost� Section�W:�$501.18�(mil)�Section�E:�$353.04�(mil)�Total:��������$854.22�(mil)�
Economic�Impact�Section�W�Jobs:�3,858�jobs�(15)�Section�W�Gross�Regional�Product:�$358.28�(mil.�2013$)�(15)�Section�W�Real�Personal�Income:�$347.51�(mil.�2013$)�(15)��Section�E�Jobs:�11,573�job�years�(15)�Section�E�Gross�Regional�Product:�$1,071.79�(mil.�2013$)�(15)�Section�E�Real�Personal�Income:�$1,041.15�(mil.�2013$)�(15)�
Added�lanes�along�this�corridor�will�improve�mobility�and�enhance�logistics.��This�will�support�the�growing�distribution�centers�along�the�corridor.��The�added�capacity�has�the�potential�to�reduce�the�number�of�crashes�along�the�I�70�Corridor.��
System�Utilization�Maximization��Section�W�Travel�Time�Savings:�$233.64�(mil.�2013$)�(14)�Section�W�Daily�Vehicle�Hours�of�Delay�Savings:�2,933�hours�per�day�(14)�Section�E�Travel�Time�Savings:�$688.05�(mil.�2013$)�(14)�Section�E�Daily�Vehicle�Hours�of�Delay�Savings:�8,764�hours�per�day�(14)�
Traffic�volume�ranges�from�29,500�to�44,620�with�higher�volumes�near�Indianapolis�(13).��Traffic�growth�on�section�of�I�70�is�expected�to�reach�85,100�by�2035�with�trucks�making�up�40%�of�the�volume�(14).��Added�capacity�to�the�corridor�will�ensure�maintenance�of�traffic�operation�and�improved�reliability�in�rural�sections�of�I�70.��Model�analysis�shows�traffic�reaching�89,700�with�improvements�(14).���
Multimodal�Integration�&�Synergy�Modes�Available:�3�(road,�rail,�air)�� Connections�to�Indianapolis�International�Airport�will�be�improved�
for�the�communities�of�central�Indiana,�allowing�goods�from�the�area�to�reach�many�markets�at�home�and�abroad�(18).�
Access�to�National�and�International�Markets�Reduced�congestion�on�Interstate�70�will�result�in�greater�speed�and�increased�safety�will�allow�goods�to�be�moved�into�and�out�of�the�state�at�a�faster�rate�and�in�a�safer�manner.�
Quality�of�Life�Section�W:�Vehicle�Operating�Cost�Savings:��$10.18�(mil.�2013$)�Section�E:��$70.73�(mil.2013$)�(15)�Section�W:�Accident�Cost�Savings:�$66.64�(mil.�2013$)�Section�E:�$527.15�(mil.2013$)�(15)�Section�W:�Emission�Cost�Savings:��$1.16�(mil.�2013$)�Section�E:��$7.60�(mil.2013$)�(15)�Section�W:�Safety:�77�fewer�total�accidents�per�year,�1�fewer�fatality�per�year�Section�E:�455�fewer�total�accidents�per�year,�4�fewer�fatalities�per�year.�(15)�
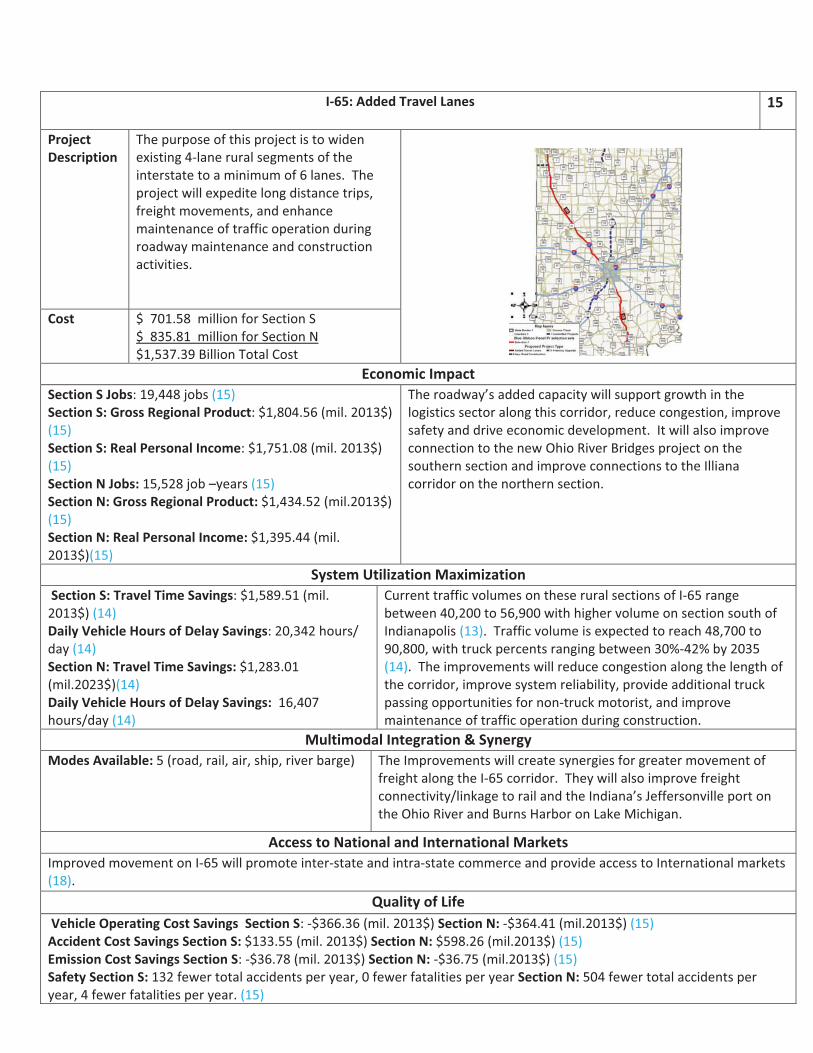
�
I�65:�Added�Travel�Lanes��
15��
Project�Description�
The�purpose�of�this�project�is�to�widen�existing�4�lane�rural�segments�of�the�interstate�to�a�minimum�of�6�lanes.��The�project�will�expedite�long�distance�trips,�freight�movements,�and�enhance�maintenance�of�traffic�operation�during�roadway�maintenance�and�construction�activities.���
�
�
Cost� $��701.58��million�for�Section�S�$��835.81��million�for�Section�N�$1,537.39�Billion�Total�Cost��
Economic�Impact�Section�S�Jobs:�19,448�jobs�(15)�Section�S:�Gross�Regional�Product:�$1,804.56�(mil.�2013$)�(15)�Section�S:�Real�Personal�Income:�$1,751.08�(mil.�2013$)�(15)�Section�N�Jobs:�15,528�job�–years�(15)�Section�N:�Gross�Regional�Product:�$1,434.52�(mil.2013$)�(15)�Section�N:�Real�Personal�Income:�$1,395.44�(mil.�2013$)(15)�
The�roadway’s�added�capacity�will�support�growth�in�the�logistics�sector�along�this�corridor,�reduce�congestion,�improve�safety�and�drive�economic�development.��It�will�also�improve�connection�to�the�new�Ohio�River�Bridges�project�on�the�southern�section�and�improve�connections�to�the�Illiana�corridor�on�the�northern�section.�
System�Utilization�Maximization��Section�S:�Travel�Time�Savings:�$1,589.51�(mil.�2013$)�(14)�Daily�Vehicle�Hours�of�Delay�Savings:�20,342�hours/�day�(14)�Section�N:�Travel�Time�Savings:�$1,283.01�(mil.2023$)(14)�Daily�Vehicle�Hours�of�Delay�Savings:��16,407�hours/day�(14)�
Current�traffic�volumes�on�these�rural�sections�of�I�65�range�between�40,200�to�56,900�with�higher�volume�on�section�south�of�Indianapolis�(13).��Traffic�volume�is�expected�to�reach�48,700�to�90,800,�with�truck�percents�ranging�between�30%�42%�by�2035�(14).��The�improvements�will�reduce�congestion�along�the�length�of�the�corridor,�improve�system�reliability,�provide�additional�truck�passing�opportunities�for�non�truck�motorist,�and�improve�maintenance�of�traffic�operation�during�construction.���
Multimodal�Integration�&�Synergy�Modes�Available:�5�(road,�rail,�air,�ship,�river�barge)�� The�Improvements�will�create�synergies�for�greater�movement�of�
freight�along�the�I�65�corridor.��They�will�also�improve�freight�connectivity/linkage�to�rail�and�the�Indiana’s�Jeffersonville�port�on�the�Ohio�River�and�Burns�Harbor�on�Lake�Michigan.�
Access�to�National�and�International�Markets�Improved�movement�on�I�65�will�promote�inter�state�and�intra�state�commerce�and�provide�access�to�International�markets�(18).�
Quality�of�Life��Vehicle�Operating�Cost�Savings��Section�S:��$366.36�(mil.�2013$)�Section�N:��$364.41�(mil.2013$)�(15)�Accident�Cost�Savings�Section�S:�$133.55�(mil.�2013$)�Section�N:�$598.26�(mil.2013$)�(15)�Emission�Cost�Savings�Section�S:��$36.78�(mil.�2013$)�Section�N:��$36.75�(mil.2013$)�(15)�Safety�Section�S:�132�fewer�total�accidents�per�year,�0�fewer�fatalities�per�year�Section�N:�504�fewer�total�accidents�per�year,�4�fewer�fatalities�per�year.�(15)�
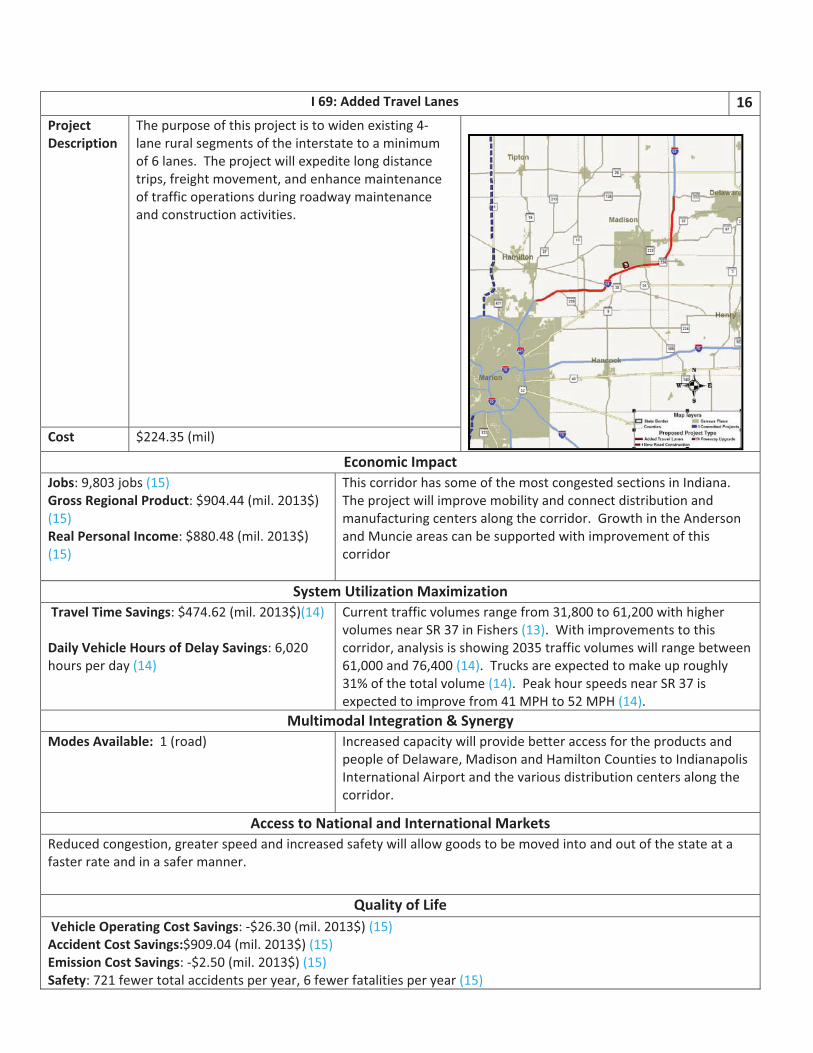
�
I�69:�Added�Travel�Lanes�� 16Project�Description�
The�purpose�of�this�project�is�to�widen�existing�4�lane�rural�segments�of�the�interstate�to�a�minimum�of�6�lanes.��The�project�will�expedite�long�distance�trips,�freight�movement,�and�enhance�maintenance�of�traffic�operations�during�roadway�maintenance�and�construction�activities.��
�
Cost� $224.35�(mil)�
Economic�Impact�Jobs:�9,803�jobs�(15)�Gross�Regional�Product:�$904.44�(mil.�2013$)�(15)�Real�Personal�Income:�$880.48�(mil.�2013$)�(15)��
This�corridor�has�some�of�the�most�congested�sections�in�Indiana.��The�project�will�improve�mobility�and�connect�distribution�and�manufacturing�centers�along�the�corridor.��Growth�in�the�Anderson�and�Muncie�areas�can�be�supported�with�improvement�of�this�corridor��
System�Utilization�Maximization��Travel�Time�Savings:�$474.62�(mil.�2013$)(14)��Daily�Vehicle�Hours�of�Delay�Savings:�6,020�hours�per�day�(14)�
Current�traffic�volumes�range�from�31,800�to�61,200�with�higher�volumes�near�SR�37�in�Fishers�(13).��With�improvements�to�this�corridor,�analysis�is�showing�2035�traffic�volumes�will�range�between�61,000�and�76,400�(14).��Trucks�are�expected�to�make�up�roughly�31%�of�the�total�volume�(14).��Peak�hour�speeds�near�SR�37�is�expected�to�improve�from�41�MPH�to�52�MPH�(14).��
Multimodal�Integration�&�Synergy�Modes�Available:��1�(road)� Increased�capacity�will�provide�better�access�for�the�products�and�
people�of�Delaware,�Madison�and�Hamilton�Counties�to�Indianapolis�International�Airport�and�the�various�distribution�centers�along�the�corridor.�
Access�to�National�and�International�Markets�Reduced�congestion,�greater�speed�and�increased�safety�will�allow�goods�to�be�moved�into�and�out�of�the�state�at�a�faster�rate�and�in�a�safer�manner.�
Quality�of�Life��Vehicle�Operating�Cost�Savings:��$26.30�(mil.�2013$)�(15)�Accident�Cost�Savings:$909.04�(mil.�2013$)�(15)�Emission�Cost�Savings:��$2.50�(mil.�2013$)�(15)�Safety:�721�fewer�total�accidents�per�year,�6�fewer�fatalities�per�year�(15)�
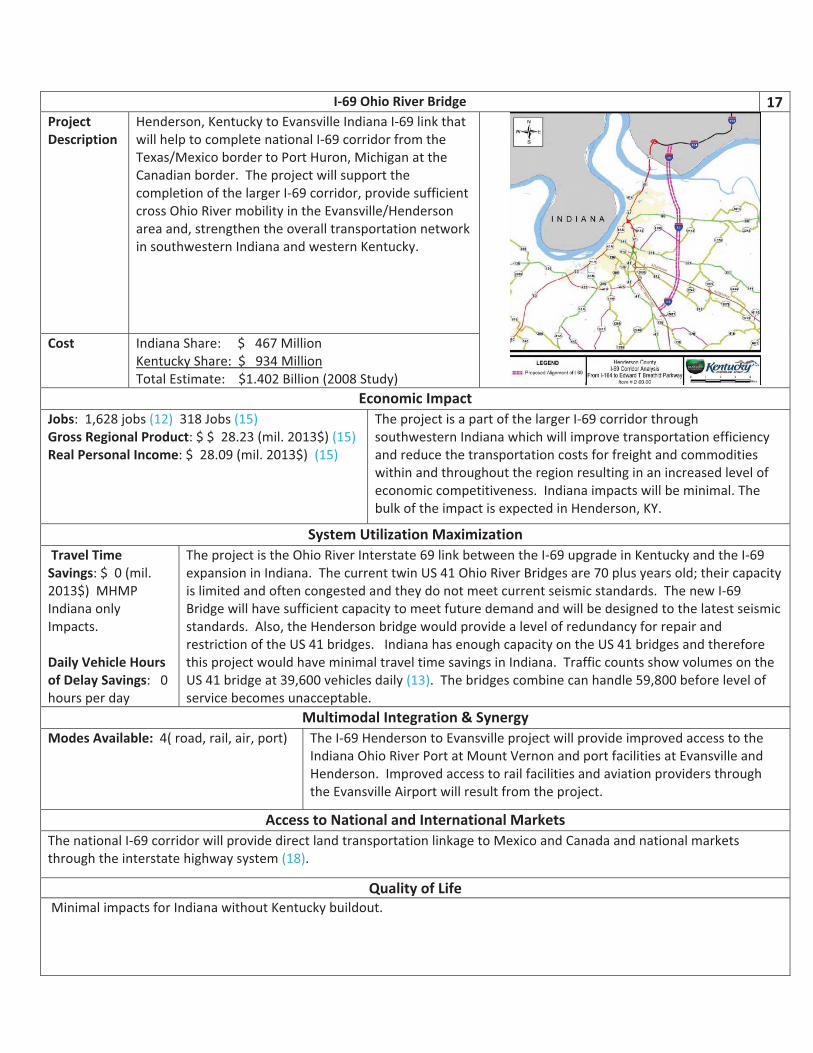
�
�
I�69�Ohio�River�Bridge� 17Project�Description�
Henderson,�Kentucky�to�Evansville�Indiana�I�69�link�that�will�help�to�complete�national�I�69�corridor�from�the�Texas/Mexico�border�to�Port�Huron,�Michigan�at�the�Canadian�border.��The�project�will�support�the�completion�of�the�larger�I�69�corridor,�provide�sufficient�cross�Ohio�River�mobility�in�the�Evansville/Henderson�area�and,�strengthen�the�overall�transportation�network�in�southwestern�Indiana�and�western�Kentucky.�
Cost� Indiana�Share:�����$���467�Million�Kentucky�Share:��$���934�Million�Total�Estimate:����$1.402�Billion�(2008�Study)�
Economic�Impact�Jobs:��1,628�jobs�(12)��318�Jobs�(15)�Gross�Regional�Product:�$�$��28.23�(mil.�2013$)�(15)�Real�Personal�Income:�$��28.09�(mil.�2013$)��(15)��
The�project�is�a�part�of�the�larger�I�69�corridor�through�southwestern�Indiana�which�will�improve�transportation�efficiency�and�reduce�the�transportation�costs�for�freight�and�commodities�within�and�throughout�the�region�resulting�in�an�increased�level�of�economic�competitiveness.��Indiana�impacts�will�be�minimal.�The�bulk�of�the�impact�is�expected�in�Henderson,�KY.��
System�Utilization�Maximization��Travel�Time�Savings:�$��0�(mil.�2013$)��MHMP�Indiana�only�Impacts.����Daily�Vehicle�Hours�of�Delay�Savings:���0�hours�per�day�
The�project�is�the�Ohio�River�Interstate�69�link�between�the�I�69�upgrade�in�Kentucky�and�the�I�69�expansion�in�Indiana.��The�current�twin�US�41�Ohio�River�Bridges�are�70�plus�years�old;�their�capacity�is�limited�and�often�congested�and�they�do�not�meet�current�seismic�standards.��The�new�I�69�Bridge�will�have�sufficient�capacity�to�meet�future�demand�and�will�be�designed�to�the�latest�seismic�standards.��Also,�the�Henderson�bridge�would�provide�a�level�of�redundancy�for�repair�and�restriction�of�the�US�41�bridges.���Indiana�has�enough�capacity�on�the�US�41�bridges�and�therefore�this�project�would�have�minimal�travel�time�savings�in�Indiana.��Traffic�counts�show�volumes�on�the�US�41�bridge�at�39,600�vehicles�daily�(13).��The�bridges�combine�can�handle�59,800�before�level�of�service�becomes�unacceptable.��
Multimodal�Integration�&�Synergy�Modes�Available:��4(�road,�rail,�air,�port)� The�I�69�Henderson�to�Evansville�project�will�provide�improved�access�to�the�
Indiana�Ohio�River�Port�at�Mount�Vernon�and�port�facilities�at�Evansville�and�Henderson.��Improved�access�to�rail�facilities�and�aviation�providers�through�the�Evansville�Airport�will�result�from�the�project.�
Access�to�National�and�International�Markets�The�national�I�69�corridor�will�provide�direct�land�transportation�linkage�to�Mexico�and�Canada�and�national�markets�through�the�interstate�highway�system�(18).�
Quality�of�Life��Minimal�impacts�for�Indiana�without�Kentucky�buildout.��
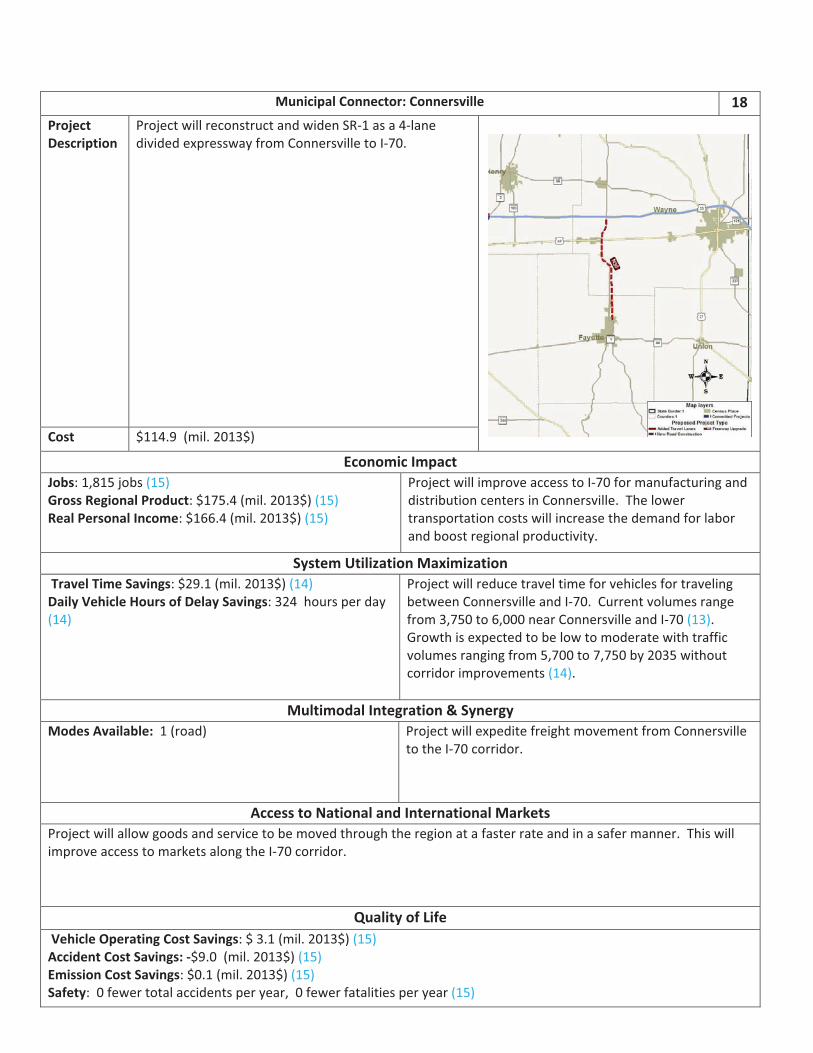
�
Municipal�Connector:�Connersville� 18�Project�Description�
Project�will�reconstruct�and�widen�SR�1�as�a�4�lane�divided�expressway�from�Connersville�to�I�70.�
�
Cost� $114.9��(mil.�2013$)�
Economic�Impact�Jobs:�1,815�jobs�(15)�Gross�Regional�Product:�$175.4�(mil.�2013$)�(15)�Real�Personal�Income:�$166.4�(mil.�2013$)�(15)��
Project�will�improve�access�to�I�70�for�manufacturing�and�distribution�centers�in�Connersville.��The�lower�transportation�costs�will�increase�the�demand�for�labor�and�boost�regional�productivity.�
System�Utilization�Maximization��Travel�Time�Savings:�$29.1�(mil.�2013$)�(14)��Daily�Vehicle�Hours�of�Delay�Savings:�324��hours�per�day�(14)�
Project�will�reduce�travel�time�for�vehicles�for�traveling�between�Connersville�and�I�70.��Current�volumes�range�from�3,750�to�6,000�near�Connersville�and�I�70�(13).��Growth�is�expected�to�be�low�to�moderate�with�traffic�volumes�ranging�from�5,700�to�7,750�by�2035�without�corridor�improvements�(14).����
Multimodal�Integration�&�Synergy�Modes�Available:��1�(road)� Project�will�expedite�freight�movement�from�Connersville�
to�the�I�70�corridor.�
Access�to�National�and�International�Markets�Project�will�allow�goods�and�service�to�be�moved�through�the�region�at�a�faster�rate�and�in�a�safer�manner.��This�will�improve�access�to�markets�along�the�I�70�corridor.�
Quality�of�Life��Vehicle�Operating�Cost�Savings:�$�3.1�(mil.�2013$)�(15)�Accident�Cost�Savings:��$9.0��(mil.�2013$)�(15)�Emission�Cost�Savings:�$0.1�(mil.�2013$)�(15)�Safety:��0�fewer�total�accidents�per�year,��0�fewer�fatalities�per�year�(15)�
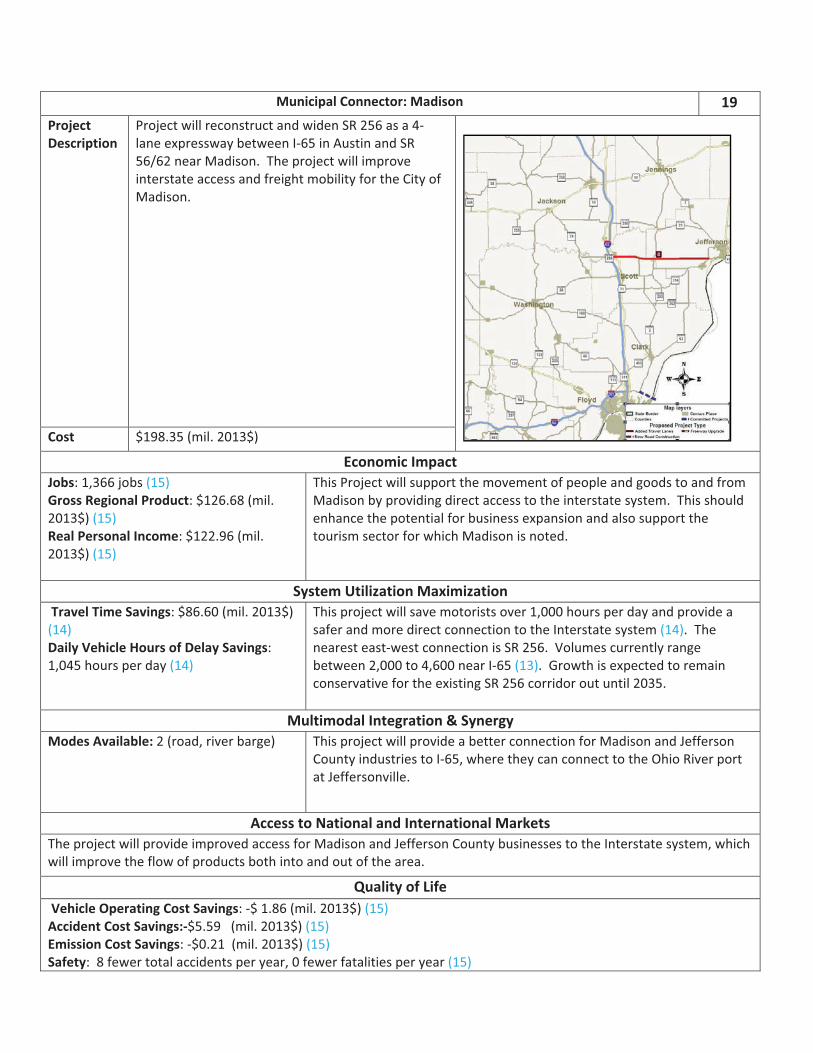
�
�
Municipal�Connector:�Madison� 19�Project�Description�
Project�will�reconstruct�and�widen�SR�256�as�a�4�lane�expressway�between�I�65�in�Austin�and�SR�56/62�near�Madison.��The�project�will�improve�interstate�access�and�freight�mobility�for�the�City�of�Madison.�
�
�Cost� $198.35�(mil.�2013$)�
Economic�Impact�Jobs:�1,366�jobs�(15)�Gross�Regional�Product:�$126.68�(mil.�2013$)�(15)�Real�Personal�Income:�$122.96�(mil.�2013$)�(15)��
This�Project�will�support�the�movement�of�people�and�goods�to�and�from�Madison�by�providing�direct�access�to�the�interstate�system.��This�should�enhance�the�potential�for�business�expansion�and�also�support�the�tourism�sector�for�which�Madison�is�noted.�
System�Utilization�Maximization��Travel�Time�Savings:�$86.60�(mil.�2013$)�(14)��Daily�Vehicle�Hours�of�Delay�Savings:�1,045�hours�per�day�(14)�
This�project�will�save�motorists�over�1,000�hours�per�day�and�provide�a�safer�and�more�direct�connection�to�the�Interstate�system�(14).��The�nearest�east�west�connection�is�SR�256.��Volumes�currently�range�between�2,000�to�4,600�near�I�65�(13).��Growth�is�expected�to�remain�conservative�for�the�existing�SR�256�corridor�out�until�2035.���
Multimodal�Integration�&�Synergy�Modes�Available:�2�(road,�river�barge)�� This�project�will�provide�a�better�connection�for�Madison�and�Jefferson�
County�industries�to�I�65,�where�they�can�connect�to�the�Ohio�River�port�at�Jeffersonville.��
Access�to�National�and�International�Markets�The�project�will�provide�improved�access�for�Madison�and�Jefferson�County�businesses�to�the�Interstate�system,�which�will�improve�the�flow�of�products�both�into�and�out�of�the�area.��
Quality�of�Life��Vehicle�Operating�Cost�Savings:��$�1.86�(mil.�2013$)�(15)�Accident�Cost�Savings:�$5.59���(mil.�2013$)�(15)�Emission�Cost�Savings:��$0.21��(mil.�2013$)�(15)�Safety:��8�fewer�total�accidents�per�year,�0�fewer�fatalities�per�year�(15)�
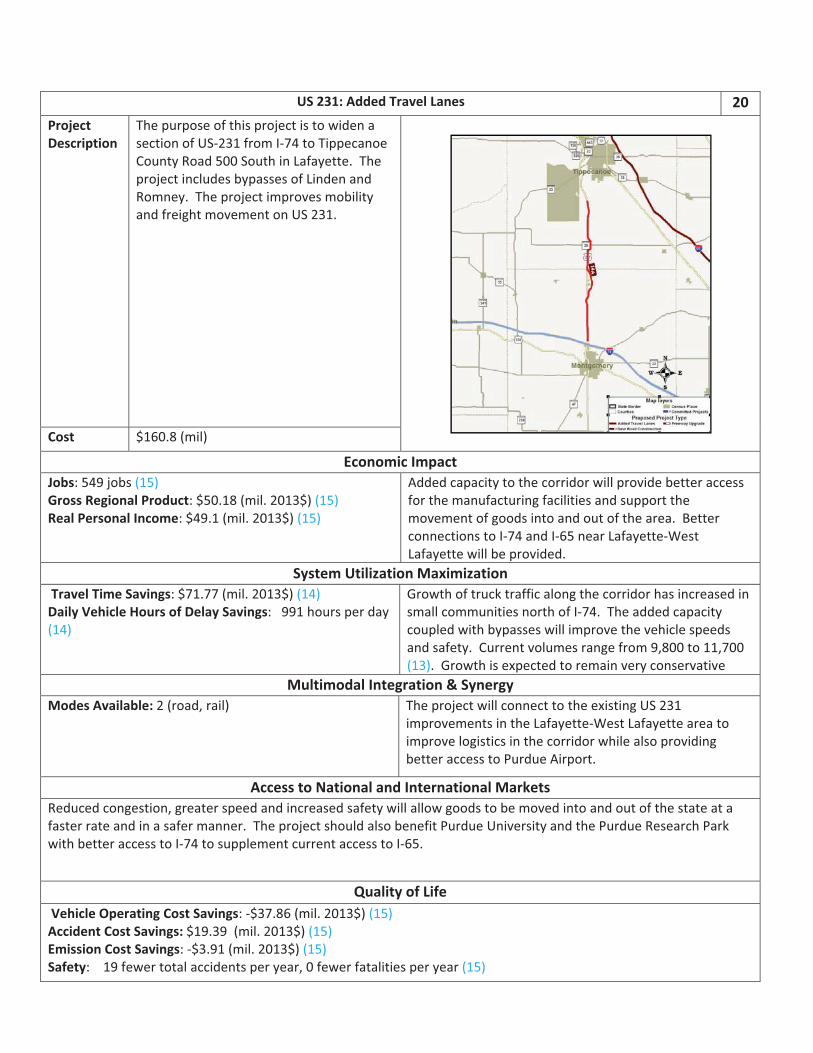
�
�
US�231:�Added�Travel�Lanes�� 20�Project�Description�
The�purpose�of�this�project�is�to�widen�a�section�of�US�231�from�I�74�to�Tippecanoe�County�Road�500�South�in�Lafayette.��The�project�includes�bypasses�of�Linden�and�Romney.��The�project�improves�mobility�and�freight�movement�on�US�231.�
�
�Cost� $160.8�(mil)�
Economic�Impact�Jobs:�549�jobs�(15)�Gross�Regional�Product:�$50.18�(mil.�2013$)�(15)��Real�Personal�Income:�$49.1�(mil.�2013$)�(15)��
Added�capacity�to�the�corridor�will�provide�better�access�for�the�manufacturing�facilities�and�support�the�movement�of�goods�into�and�out�of�the�area.��Better�connections�to�I�74�and�I�65�near�Lafayette�West�Lafayette�will�be�provided.���
System�Utilization�Maximization��Travel�Time�Savings:�$71.77�(mil.�2013$)�(14)�Daily�Vehicle�Hours�of�Delay�Savings:���991�hours�per�day�(14)�
Growth�of�truck�traffic�along�the�corridor�has�increased�in�small�communities�north�of�I�74.��The�added�capacity�coupled�with�bypasses�will�improve�the�vehicle�speeds�and�safety.��Current�volumes�range�from�9,800�to�11,700�(13).��Growth�is�expected�to�remain�very�conservative��
Multimodal�Integration�&�Synergy�Modes�Available:�2�(road,�rail)�� The�project�will�connect�to�the�existing�US�231�
improvements�in�the�Lafayette�West�Lafayette�area�to�improve�logistics�in�the�corridor�while�also�providing�better�access�to�Purdue�Airport.�
Access�to�National�and�International�Markets�Reduced�congestion,�greater�speed�and�increased�safety�will�allow�goods�to�be�moved�into�and�out�of�the�state�at�a�faster�rate�and�in�a�safer�manner.��The�project�should�also�benefit�Purdue�University�and�the�Purdue�Research�Park�with�better�access�to�I�74�to�supplement�current�access�to�I�65.�
Quality�of�Life��Vehicle�Operating�Cost�Savings:��$37.86�(mil.�2013$)�(15)�Accident�Cost�Savings:�$19.39��(mil.�2013$)�(15)�Emission�Cost�Savings:��$3.91�(mil.�2013$)�(15)�Safety:����19�fewer�total�accidents�per�year,�0�fewer�fatalities�per�year�(15)�
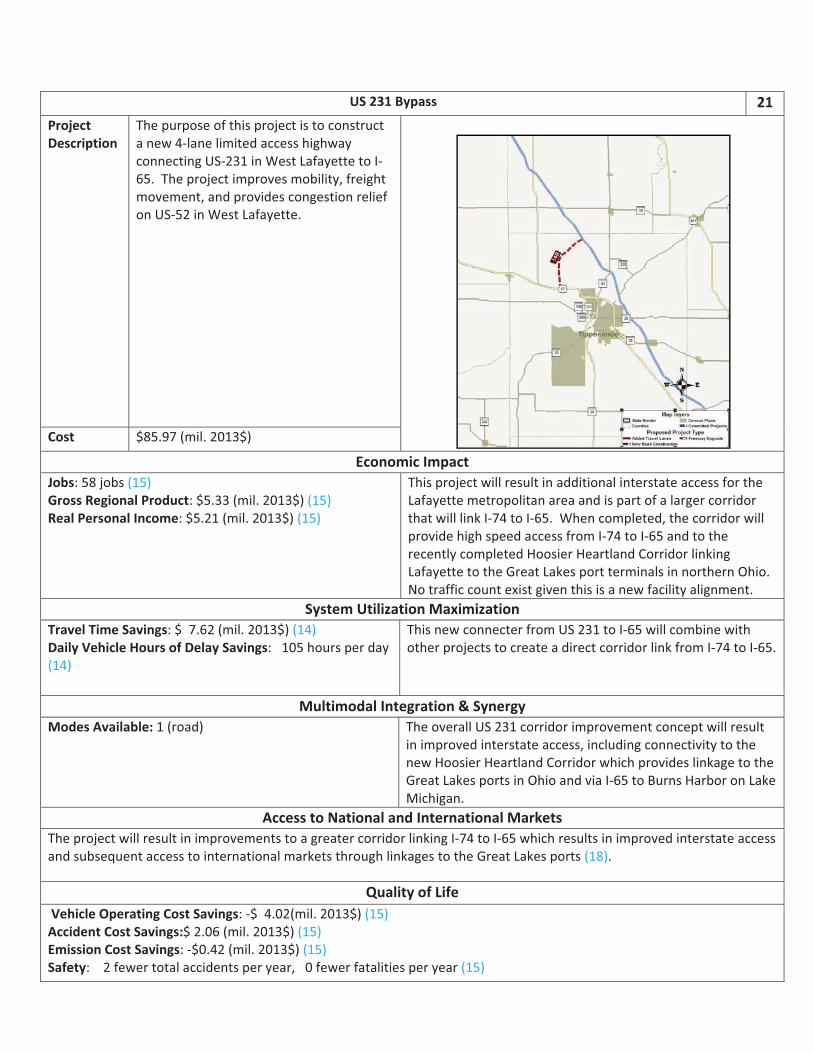
�
�
US�231�Bypass�� 21�Project�Description�
The�purpose�of�this�project�is�to�construct�a�new�4�lane�limited�access�highway�connecting�US�231�in�West�Lafayette�to�I�65.��The�project�improves�mobility,�freight�movement,�and�provides�congestion�relief�on�US�52�in�West�Lafayette.�
�
Cost� $85.97�(mil.�2013$)�
Economic�Impact�Jobs:�58�jobs�(15)�Gross�Regional�Product:�$5.33�(mil.�2013$)�(15)�Real�Personal�Income:�$5.21�(mil.�2013$)�(15)�
This�project�will�result�in�additional�interstate�access�for�the�Lafayette�metropolitan�area�and�is�part�of�a�larger�corridor�that�will�link�I�74�to�I�65.��When�completed,�the�corridor�will�provide�high�speed�access�from�I�74�to�I�65�and�to�the�recently�completed�Hoosier�Heartland�Corridor�linking�Lafayette�to�the�Great�Lakes�port�terminals�in�northern�Ohio.�No�traffic�count�exist�given�this�is�a�new�facility�alignment.�
System�Utilization�Maximization��Travel�Time�Savings:�$��7.62�(mil.�2013$)�(14)�Daily�Vehicle�Hours�of�Delay�Savings:���105�hours�per�day�(14)�
This�new�connecter�from�US�231�to�I�65�will�combine�with�other�projects�to�create�a�direct�corridor�link�from�I�74�to�I�65.�
Multimodal�Integration�&�Synergy�Modes�Available:�1�(road)�� The�overall�US�231�corridor�improvement�concept�will�result�
in�improved�interstate�access,�including�connectivity�to�the�new�Hoosier�Heartland�Corridor�which�provides�linkage�to�the�Great�Lakes�ports�in�Ohio�and�via�I�65�to�Burns�Harbor�on�Lake�Michigan.��
Access�to�National�and�International�Markets�The�project�will�result�in�improvements�to�a�greater�corridor�linking�I�74�to�I�65�which�results�in�improved�interstate�access�and�subsequent�access�to�international�markets�through�linkages�to�the�Great�Lakes�ports�(18).�
Quality�of�Life��Vehicle�Operating�Cost�Savings:��$��4.02(mil.�2013$)�(15)�Accident�Cost�Savings:$�2.06�(mil.�2013$)�(15)�Emission�Cost�Savings:��$0.42�(mil.�2013$)�(15)�Safety:����2�fewer�total�accidents�per�year,���0�fewer�fatalities�per�year�(15)�
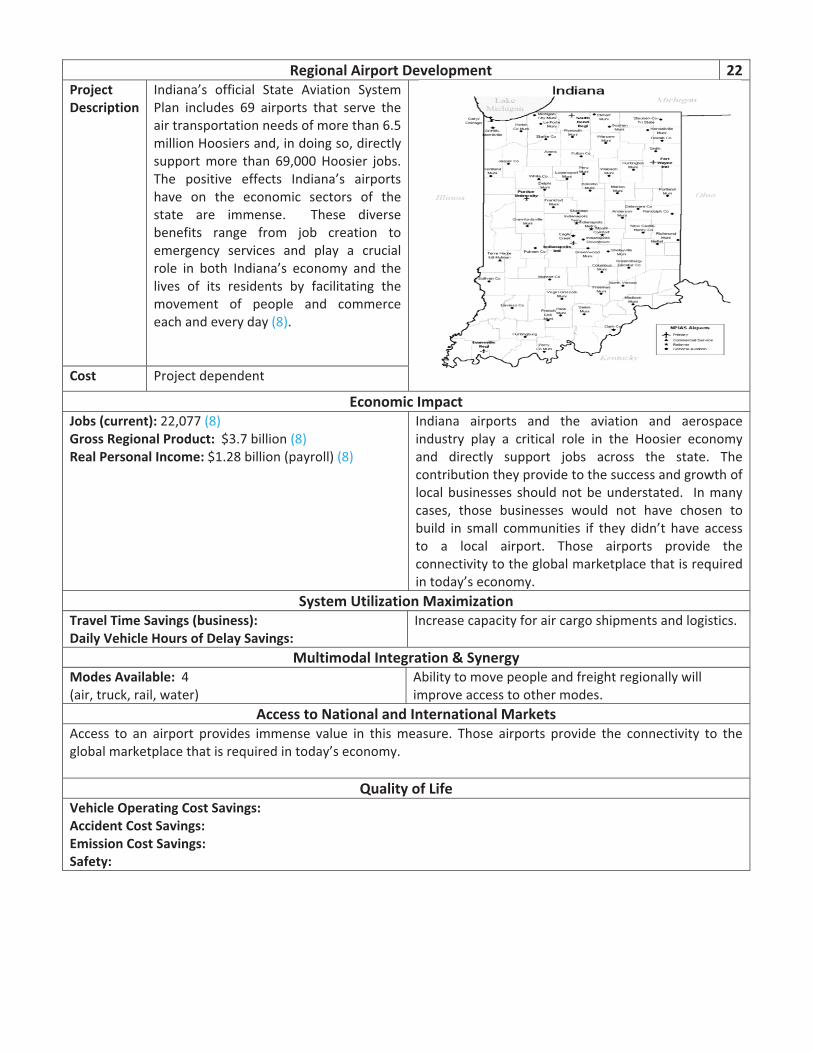
�
�
Regional�Airport�Development� 22Project�Description�
Indiana’s� official� State� Aviation� System�Plan� includes� 69� airports� that� serve� the�air�transportation�needs�of�more�than�6.5�million�Hoosiers�and,�in�doing�so,�directly�support�more� than� 69,000�Hoosier� jobs.��The� positive� effects� Indiana’s� airports�have� on� the� economic� sectors� of� the�state� are� immense.� � These� diverse�benefits� range� from� job� creation� to�emergency� services� and� play� a� crucial�role� in� both� Indiana’s� economy� and� the�lives� of� its� residents� by� facilitating� the�movement� of� people� and� commerce�each�and�every�day�(8).�
Cost� Project�dependent�
Economic�Impact�Jobs�(current):�22,077�(8)�Gross�Regional�Product:��$3.7�billion�(8)�Real�Personal�Income:�$1.28�billion�(payroll)�(8)��
Indiana� airports� and� the� aviation� and� aerospace�industry� play� a� critical� role� in� the� Hoosier� economy�and� directly� support� jobs� across� the� state.� The�contribution�they�provide�to�the�success�and�growth�of�local�businesses� should�not�be�understated.� � In�many�cases,� those� businesses� would� not� have� chosen� to�build� in� small� communities� if� they� didn’t� have� access�to� a� local� airport.� Those� airports� provide� the�connectivity�to�the�global�marketplace�that�is�required�in�today’s�economy.�
System�Utilization�Maximization��Travel�Time�Savings�(business):��Daily�Vehicle�Hours�of�Delay�Savings:��
Increase�capacity�for�air�cargo�shipments�and�logistics.�
Multimodal�Integration�&�Synergy�Modes�Available:��4�(air,�truck,�rail,�water)��
Ability�to�move�people�and�freight�regionally�will�improve�access�to�other�modes.�
Access�to�National�and�International�Markets�Access� to� an� airport� provides� immense� value� in� this�measure.� Those� airports� provide� the� connectivity� to� the�global�marketplace�that�is�required�in�today’s�economy.�
�Quality�of�Life�
Vehicle�Operating�Cost�Savings:��Accident�Cost�Savings:��Emission�Cost�Savings:��Safety:��
�
Direct�Commercial�Flights� 23�Project�Description�
Efficient�connectivity�of�Indiana�businesses�and�residents�to�external�markets�is�critical�to�moving�our�state�forward�both�in�terms�of�attracting�talent�and�capital.�Two�key�non�stop�routes�to�the�West�Coast�were�announced�recently�from�IND:�Los�Angeles�and�San�Francisco.�Other�destinations�may�be�identified�for�IND�or�other�airports�that�increase�the�efficiency�of�travel�and�support�commerce.�Indiana�should�consider�establishing�a�program�modeled�after�the�Kansas�Affordable�Airfares�Program�(KAAP)�(9),�but�with�the�primary�goal�instead�being�expanding�the�connectivity�to�new�markets/destinations.��
������
Cost� Project�dependent�Economic�Impact�
Jobs:��Gross�Regional�Product:��Real�Personal�Income:���
The�impact�of�Indiana’s�four�commercial�service�airports�(Indianapolis,�Evansville,�Ft.�Wayne,�and�South�Bend)�is�significant�to�the�local�and�regional�economies�in�terms�of�jobs,�payroll,�and�economic�output.�Together�they�support�37,018�jobs,�generate�$2.35�Billion�in�payroll,�and�produce�$8.2�Billion�in�economic�output�(8).�Nonstop�flights�will�enable�corporate�headquarters�to�locate�in�Indiana�but�have�easy�access�to�investors�and�manufacturing�facilities�around�the�world.��
System�Utilization�and�Maximization��Travel�Time�Savings�(business):��Daily�Vehicle�Hours�of�Delay�Savings:��
Increase�the�available�flight�alternatives�connecting�to�key�destinations.�
Multimodal�Integration�&�Synergy�Modes�Available:�1�(air)�
Minimal�integration�with�other�modes�
Access�to�National�and�International�Markets�Non�stop/direct�flights�can�help�connect�to�new�destinations�and�allows�Indiana�individuals�and�businesses�to�spend�more�time�conducting�business�in�national�and�international�markets�(and�vice�versa).��
Quality�of�Life�Vehicle�Operating�Cost�Savings:��Accident�Cost�Savings:��Emission�Cost�Savings:��Safety:��
����
Non�Stop/Direct�Commercial�Flights� 23A�Project�Description�
Passenger�flight�connectivity�is�an�increasingly�important�component�as�regions�compete�for�growth�and�retention�of�their�corporate�presence.��Indiana�is�falling�behind�in�its�ability�to�provide�direct�flight�connections�that�meet�corporate�needs�and�also�contribute�to�a�better�quality�of�living.��Benchmarking�similar�state�supported�initiatives�arranged�with�airlines,�those�funds�could�remain�untapped�if�the�new�flight�performs�to�negotiated�levels�established�by�community�and�airline.�
�Cost� $5�million�(max�annual,�case�dependent)�
Economic�Impact�Jobs:�37,017�(8)�Personal�Income:�$2.3�Billion�(8)�Economic�Output:�$8.2�Billion�(8)��
Indiana’s�Commercial�Service�Airports�����������(EVV)�Evansville�Regional�Airport�����������(FWA)�Fort�Wayne�International�Airport�����������(GYY)�Gary/Chicago�International�Airport�����������(IND)�Indianapolis�International�Airport������������(SBN)�South�Bend�Airport�
Commercial�air�service�expands�the�range�for�Indiana’s�corporations�to�support�and�expand�their�customer�base.��Commercial�air�service�can�establish�strategic�links�to�cities/regions�with�potential�synergies.�EXAMPLES:��*�Study�for�potential�IND�to�San�Francisco�flight�projected�annual�economic�impact�of�417�jobs,�$11�million�in�payroll,�and�over�$26�million�in�economic�output.�(19)�*�State�of�Wisconsin�study�shows�each�new�regional�airport�flight�has�~$4�million�local�annual�impact.�(20)���
System�Utilization�Maximization�Travel�Time�Savings�(business):��(21,�22,�23)�IN�business�travelers�waste�$147�Million/yr�on�connections:�2012�IN�Commercial�Airport�Passengers�=�8.4�million�2012�IN�Passengers�that�had�to�connect�=�4.8�million�(57%)��2012�U.S.�travel�mix�=�28%�business�(1.34�million)�Average�passenger�connect�time:�2�hours�18�minutes��Business�passenger�‘per�hour’�value=�$47.80/hour�����
For�Indiana’s�business�travelers,�and�their�visiting�customers,�non�stop�market�access�is�a�key�component�to�a�company’s�productivity.��One,�or�multiple,�stop�connections�will�often�burn�up�an�entire�work�day�just�for�travel.�Improving�a�community’s�connectivity�with�strategic�non�stop�flights�will�allow�companies�and�economic�regions�to�have�more�efficient�and�productive�relationships�with�those�key�markets.�
Multimodal�Integration�&�Synergy�Modes�Available:��2�(road,air)�~16%�of�Indiana’s�passengers�travel�to/from�out�of�state�airports�for�their�commercial�flights�(~1,344,000/yr)�(24)�
Adding�commercial�flights�into�new�markets�will�help�reduce‘catchment�leakage’�where�travelers�drive�to�other�airports�to�catch�non�stop�flights,�eliminating�additional�wear�and�tear�on�the�state’s�roadway�system.�
Access�to�National�and�International�Markets�Non�stop/direct�flights�can�help�connect�to�new�destinations�and�allows Indiana individuals�and�businesses�to�spend�more�time�conducting�business�in�national�and�international�markets�(and�vice�versa).���Corporate�development�values�better�and�more�efficient�access�to�its�network�and�customers.��Indiana�will�improve�its�competitiveness�in�this�valued�criterion�by�focusing�more�efforts�to�help�establish�strategic�flight�connections�throughout�the�state.�
Quality�of�Life�The�benefits�for�improving�non�stop�connectivity�around�Indiana’s�airports�range�from�improving�economic�development�competiveness,�which�brings�jobs�and�capital�investment�into�our�state,�to�improved�tourism�and�convention�through�easier�access�to�other�markets.��Individuals�will�also�benefit�from�wasted�time�and�increased�risks/frustrations�due�to�flight�connections�that�go�through�our�nation’s�congested�hubs.��
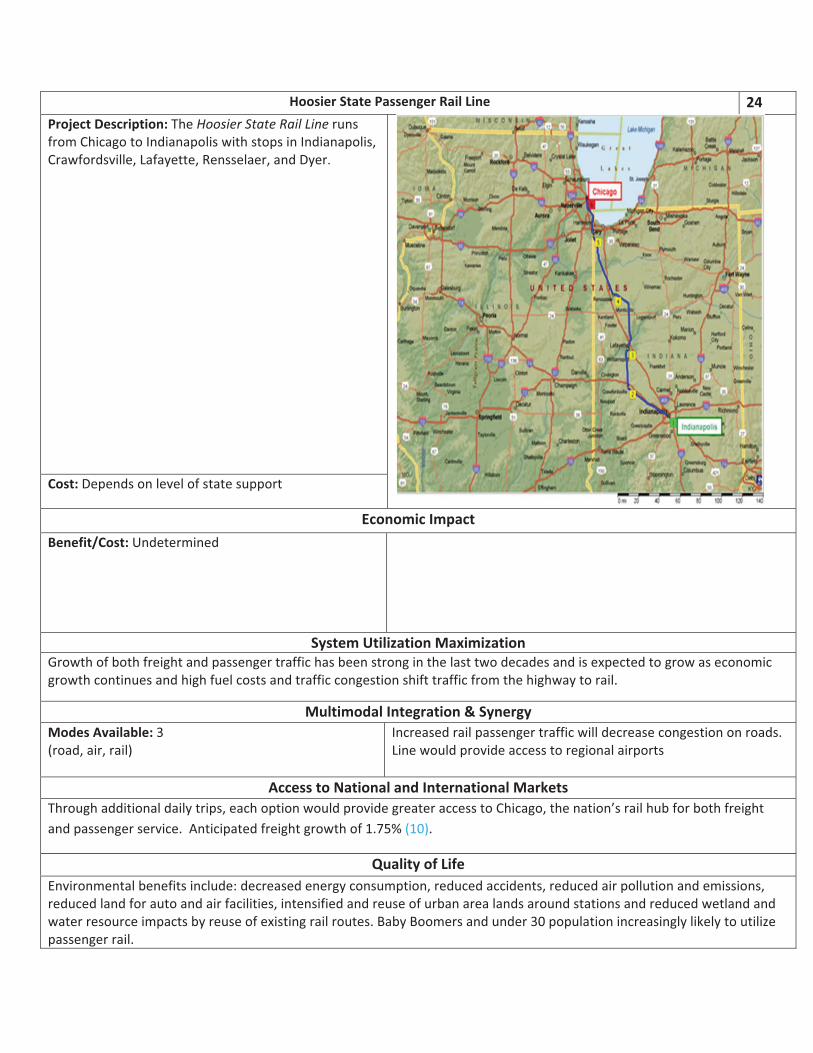
�
�
Hoosier�State�Passenger�Rail�Line� 24�Project�Description:�The�Hoosier�State�Rail�Line�runs�from�Chicago�to�Indianapolis�with�stops�in�Indianapolis,�Crawfordsville,�Lafayette,�Rensselaer,�and�Dyer.��
Cost:�Depends�on�level�of�state�support�
Economic�Impact�Benefit/Cost:�Undetermined��
�
System�Utilization�Maximization��Growth�of�both�freight�and�passenger�traffic�has�been�strong�in�the�last�two�decades�and�is�expected�to�grow�as�economic�growth�continues�and�high�fuel�costs�and�traffic�congestion�shift�traffic�from�the�highway�to�rail.�
Multimodal�Integration�&�Synergy�Modes�Available:�3�(road,�air,�rail)�
Increased�rail�passenger�traffic�will�decrease�congestion�on�roads.�Line�would�provide�access�to�regional�airports��
Access�to�National�and�International�Markets�Through�additional�daily�trips,�each�option�would�provide�greater�access�to�Chicago,�the�nation’s�rail�hub�for�both�freight�and�passenger�service.��Anticipated�freight�growth�of�1.75%�(10).�
Quality�of�Life�Environmental�benefits�include:�decreased�energy�consumption,�reduced�accidents,�reduced�air�pollution�and�emissions,�reduced�land�for�auto�and�air�facilities,�intensified�and�reuse�of�urban�area�lands�around�stations�and�reduced�wetland�and�water�resource�impacts�by�reuse�of�existing�rail�routes.�Baby�Boomers�and�under�30�population�increasingly�likely�to�utilize�passenger�rail.��
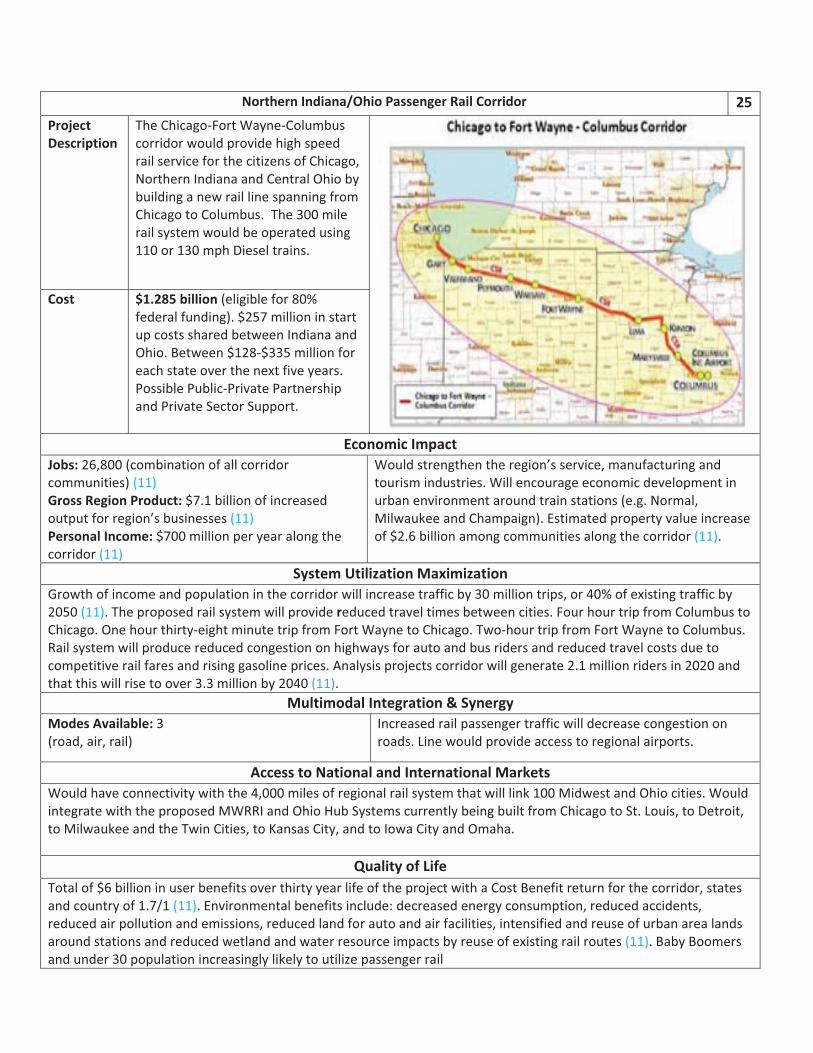
�
�
Northern�Indiana/Ohio�Passenger�Rail�Corridor� 25Project�Description�
The�Chicago�Fort�Wayne�Columbus�corridor�would�provide�high�speed�rail�service�for�the�citizens�of�Chicago,�Northern�Indiana�and�Central�Ohio�by�building�a�new�rail�line�spanning�from�Chicago�to�Columbus.��The�300�mile�rail�system�would�be�operated�using�110�or�130�mph�Diesel�trains.��
Cost� $1.285�billion�(eligible�for�80%�federal�funding).�$257�million�in�start�up�costs�shared�between�Indiana�and�Ohio.�Between�$128�$335�million�for�each�state�over�the�next�five�years.��Possible�Public�Private�Partnership�and�Private�Sector�Support.��
Economic�Impact�Jobs:�26,800�(combination�of�all�corridor�communities)�(11)�Gross�Region�Product:�$7.1�billion�of�increased�output�for�region’s�businesses�(11)�Personal�Income:�$700�million�per�year�along�the�corridor�(11)�
Would�strengthen�the�region’s�service,�manufacturing�and�tourism�industries.�Will�encourage�economic�development�in�urban�environment�around�train�stations�(e.g.�Normal,�Milwaukee�and�Champaign).�Estimated�property�value�increase�of�$2.6�billion�among�communities�along�the�corridor�(11).��
System�Utilization�Maximization�Growth�of�income�and�population�in�the�corridor�will�increase�traffic�by�30�million�trips,�or�40%�of�existing�traffic�by�2050�(11).�The�proposed�rail�system�will�provide�reduced�travel�times�between�cities.�Four�hour�trip�from�Columbus�to�Chicago.�One�hour�thirty�eight�minute�trip�from�Fort�Wayne�to�Chicago.�Two�hour�trip�from�Fort�Wayne�to�Columbus.�Rail�system�will�produce�reduced�congestion�on�highways�for�auto�and�bus�riders�and�reduced�travel�costs�due�to�competitive�rail�fares�and�rising�gasoline�prices.�Analysis�projects�corridor�will�generate�2.1�million�riders�in�2020�and�that�this�will�rise�to�over�3.3�million�by�2040�(11).��
Multimodal�Integration�&�Synergy�Modes�Available:�3��(road,�air,�rail)�
Increased�rail�passenger�traffic�will�decrease�congestion�on�roads.�Line�would�provide�access�to�regional�airports.�
Access�to�National�and�International�Markets�Would�have�connectivity�with�the�4,000�miles�of�regional�rail�system�that�will�link�100�Midwest�and�Ohio�cities.�Would�integrate�with�the�proposed�MWRRI�and�Ohio�Hub�Systems�currently�being�built�from�Chicago�to�St.�Louis,�to�Detroit,�to�Milwaukee�and�the�Twin�Cities,�to�Kansas�City,�and�to�Iowa�City�and�Omaha.����
Quality�of�Life�Total�of�$6�billion�in�user�benefits�over�thirty�year�life�of�the�project�with�a�Cost�Benefit�return�for�the�corridor,�states�and�country�of�1.7/1�(11).�Environmental�benefits�include:�decreased�energy�consumption,�reduced�accidents,�reduced�air�pollution�and�emissions,�reduced�land�for�auto�and�air�facilities,�intensified�and�reuse�of�urban�area�lands�around�stations�and�reduced�wetland�and�water�resource�impacts�by�reuse�of�existing�rail�routes�(11).�Baby�Boomers�and�under�30�population�increasingly�likely�to�utilize�passenger�rail�
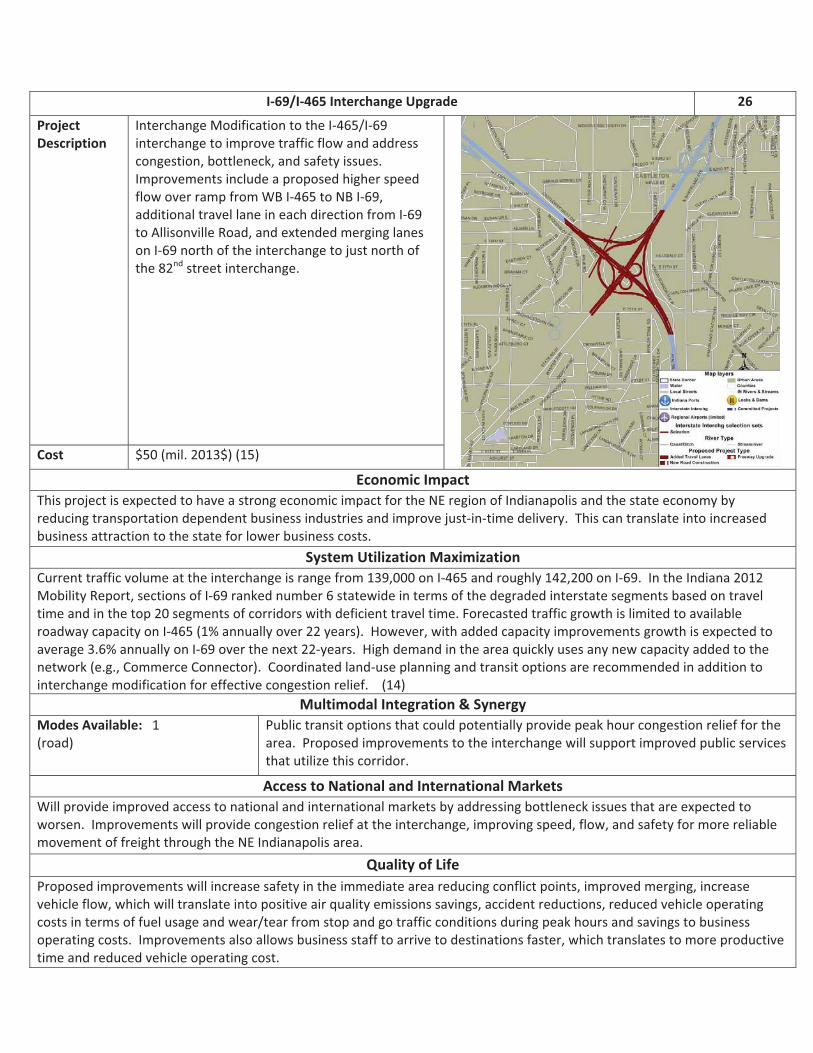
�
�
I�69/I�465�Interchange�Upgrade� 26�
Project�Description�
Interchange�Modification�to�the�I�465/I�69�interchange�to�improve�traffic�flow�and�address�congestion,�bottleneck,�and�safety�issues.�Improvements�include�a�proposed�higher�speed�flow�over�ramp�from�WB�I�465�to�NB�I�69,�additional�travel�lane�in�each�direction�from�I�69�to�Allisonville�Road,�and�extended�merging�lanes�on�I�69�north�of�the�interchange�to�just�north�of�the�82nd�street�interchange.�
�
Cost� $50�(mil.�2013$)�(15)�
Economic�Impact�This�project�is�expected�to�have�a�strong�economic�impact�for�the�NE�region�of�Indianapolis�and�the�state�economy�by�reducing�transportation�dependent�business�industries�and�improve�just�in�time�delivery.��This�can�translate�into�increased�business�attraction�to�the�state�for�lower�business�costs.��
System�Utilization�Maximization�Current�traffic�volume�at�the�interchange�is�range�from�139,000�on�I�465�and�roughly�142,200�on�I�69.��In�the�Indiana�2012�Mobility�Report,�sections�of�I�69�ranked�number�6�statewide�in�terms�of�the�degraded�interstate�segments�based�on�travel�time�and�in�the�top�20�segments�of�corridors�with�deficient�travel�time.�Forecasted�traffic�growth�is�limited�to�available�roadway�capacity�on�I�465�(1%�annually�over�22�years).��However,�with�added�capacity�improvements�growth�is�expected�to�average�3.6%�annually�on�I�69�over�the�next�22�years.��High�demand�in�the�area�quickly�uses�any�new�capacity�added�to�the�network�(e.g.,�Commerce�Connector).��Coordinated�land�use�planning�and�transit�options�are�recommended�in�addition�to�interchange�modification�for�effective�congestion�relief.����(14)�
Multimodal�Integration�&�Synergy�Modes�Available:���1�(road)�
Public�transit�options�that�could�potentially�provide�peak�hour�congestion�relief�for�the�area.��Proposed�improvements�to�the�interchange�will�support�improved�public�services�that�utilize�this�corridor.��
Access�to�National�and�International�Markets�Will�provide�improved�access�to�national�and�international�markets�by�addressing�bottleneck�issues�that�are�expected�to�worsen.��Improvements�will�provide�congestion�relief�at�the�interchange,�improving�speed,�flow,�and�safety�for�more�reliable�movement�of�freight�through�the�NE�Indianapolis�area.��
Quality�of�Life�Proposed�improvements�will�increase�safety�in�the�immediate�area�reducing�conflict�points,�improved�merging,�increase�vehicle�flow,�which�will�translate�into�positive�air�quality�emissions�savings,�accident�reductions,�reduced�vehicle�operating�costs�in�terms�of�fuel�usage�and�wear/tear�from�stop�and�go�traffic�conditions�during�peak�hours�and�savings�to�business�operating�costs.��Improvements�also�allows�business�staff�to�arrive�to�destinations�faster,�which�translates�to�more�productive�time�and�reduced�vehicle�operating�cost.��
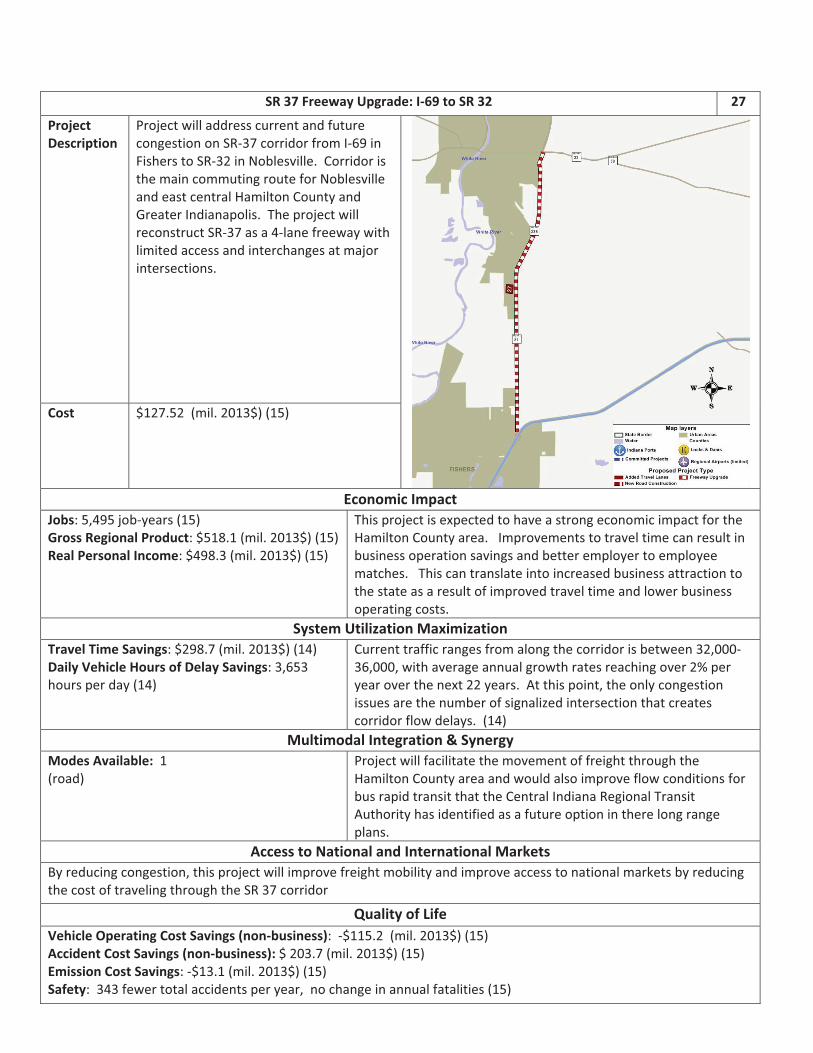
�
SR�37�Freeway�Upgrade:�I�69�to�SR�32� 27�
Project�Description�
Project�will�address�current�and�future�congestion�on�SR�37�corridor�from�I�69�in�Fishers�to�SR�32�in�Noblesville.��Corridor�is�the�main�commuting�route�for�Noblesville�and�east�central�Hamilton�County�and�Greater�Indianapolis.��The�project�will�reconstruct�SR�37�as�a�4�lane�freeway�with�limited�access�and�interchanges�at�major�intersections.��
Cost� $127.52��(mil.�2013$)�(15)�
Economic�Impact�Jobs:�5,495�job�years�(15)�Gross�Regional�Product:�$518.1�(mil.�2013$)�(15)Real�Personal�Income:�$498.3�(mil.�2013$)�(15)��
This�project�is�expected�to�have�a�strong�economic�impact�for�the�Hamilton�County�area.���Improvements�to�travel�time�can�result�in�business�operation�savings�and�better�employer�to�employee�matches.���This�can�translate�into�increased�business�attraction�to�the�state�as�a�result�of�improved�travel�time�and�lower�business�operating�costs.���
System�Utilization�Maximization��Travel�Time�Savings:�$298.7�(mil.�2013$)�(14)�Daily�Vehicle�Hours�of�Delay�Savings:�3,653�hours�per�day�(14)�
Current�traffic�ranges�from�along�the�corridor�is�between�32,000�36,000,�with�average�annual�growth�rates�reaching�over�2%�per�year�over�the�next�22�years.��At�this�point,�the�only�congestion�issues�are�the�number�of�signalized�intersection�that�creates�corridor�flow�delays.��(14)�
Multimodal�Integration�&�Synergy�Modes�Available:��1�(road)�
Project�will�facilitate�the�movement�of�freight�through�the�Hamilton�County�area�and�would�also�improve�flow�conditions�for�bus�rapid�transit�that�the�Central�Indiana�Regional�Transit�Authority�has�identified�as�a�future�option�in�there�long�range�plans.��
Access�to�National�and�International�Markets�By�reducing�congestion,�this�project�will�improve�freight�mobility�and�improve�access�to�national�markets�by�reducing�the�cost�of�traveling�through�the�SR�37�corridor�
Quality�of�Life�Vehicle�Operating�Cost�Savings�(non�business):���$115.2��(mil.�2013$)�(15)�Accident�Cost�Savings�(non�business):�$�203.7�(mil.�2013$)�(15)�Emission�Cost�Savings:��$13.1�(mil.�2013$)�(15)�Safety:��343�fewer�total�accidents�per�year,��no�change�in�annual�fatalities�(15)�
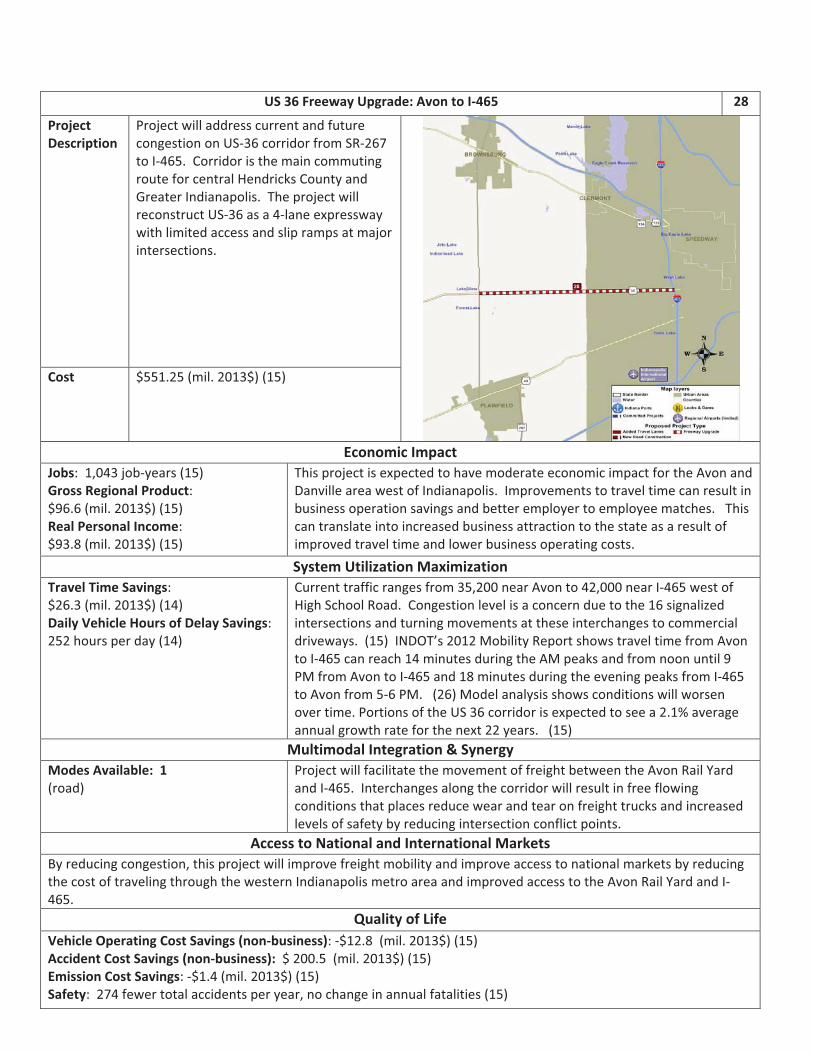
�
US�36�Freeway�Upgrade:�Avon�to�I�465� 28�
Project�Description�
Project�will�address�current�and�future�congestion�on�US�36�corridor�from�SR�267�to�I�465.��Corridor�is�the�main�commuting�route�for�central�Hendricks�County�and�Greater�Indianapolis.��The�project�will�reconstruct�US�36�as�a�4�lane�expressway�with�limited�access�and�slip�ramps�at�major�intersections.��
Cost� $551.25�(mil.�2013$)�(15)�
Economic�Impact�Jobs:��1,043�job�years�(15)�Gross�Regional�Product:��$96.6�(mil.�2013$)�(15)�Real�Personal�Income:��$93.8�(mil.�2013$)�(15)�
This�project�is�expected�to�have�moderate�economic�impact�for�the�Avon�and�Danville�area�west�of�Indianapolis.��Improvements�to�travel�time�can�result�in�business�operation�savings�and�better�employer�to�employee�matches.���This�can�translate�into�increased�business�attraction�to�the�state�as�a�result�of�improved�travel�time�and�lower�business�operating�costs.���System�Utilization�Maximization�
Travel�Time�Savings:��$26.3�(mil.�2013$)�(14)�Daily�Vehicle�Hours�of�Delay�Savings:�252�hours�per�day�(14)�
Current�traffic�ranges�from�35,200�near�Avon�to�42,000�near�I�465�west�of�High�School�Road.��Congestion�level�is�a�concern�due�to�the�16�signalized�intersections�and�turning�movements�at�these�interchanges�to�commercial�driveways.��(15)��INDOT’s�2012�Mobility�Report�shows�travel�time�from�Avon�to�I�465�can�reach�14�minutes�during�the�AM�peaks�and�from�noon�until�9�PM�from�Avon�to�I�465�and�18�minutes�during�the�evening�peaks�from�I�465�to�Avon�from�5�6�PM.���(26)�Model�analysis�shows�conditions�will�worsen�over�time.�Portions�of�the�US�36�corridor�is�expected�to�see�a�2.1%�average�annual�growth�rate�for�the�next�22�years.���(15)�Multimodal�Integration�&�Synergy�
Modes�Available:��1�(road)�
Project�will�facilitate�the�movement�of�freight�between�the�Avon�Rail�Yard�and�I�465.��Interchanges�along�the�corridor�will�result�in�free�flowing�conditions�that�places�reduce�wear�and�tear�on�freight�trucks�and�increased�levels�of�safety�by�reducing�intersection�conflict�points.��
Access�to�National�and�International�Markets�By�reducing�congestion,�this�project�will�improve�freight�mobility�and�improve�access�to�national�markets�by�reducing�the�cost�of�traveling�through�the�western�Indianapolis�metro�area�and�improved�access�to�the�Avon�Rail�Yard�and�I�465.�
Quality�of�Life�Vehicle�Operating�Cost�Savings�(non�business):��$12.8��(mil.�2013$)�(15)�Accident�Cost�Savings�(non�business):��$�200.5��(mil.�2013$)�(15)�Emission�Cost�Savings:��$1.4�(mil.�2013$)�(15)�Safety:��274�fewer�total�accidents�per�year,�no�change�in�annual�fatalities�(15)�
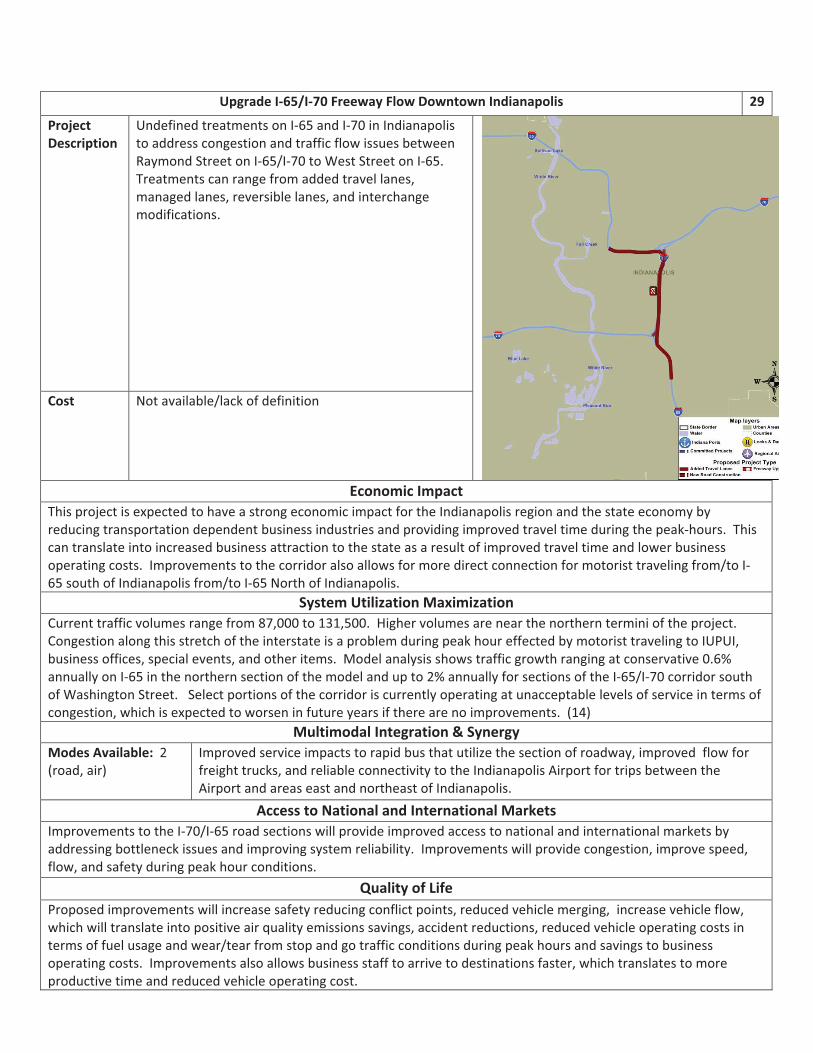
�
Upgrade�I�65/I�70�Freeway�Flow�Downtown�Indianapolis� 29�
Project�Description�
Undefined�treatments�on�I�65�and�I�70�in�Indianapolis�to�address�congestion�and�traffic�flow�issues�between�Raymond�Street�on�I�65/I�70�to�West�Street�on�I�65.��Treatments�can�range�from�added�travel�lanes,�managed�lanes,�reversible�lanes,�and�interchange�modifications.�
Cost� Not�available/lack�of�definition�
Economic�Impact�This�project�is�expected�to�have�a�strong�economic�impact�for�the�Indianapolis�region�and�the�state�economy�by�reducing�transportation�dependent�business�industries�and�providing�improved�travel�time�during�the�peak�hours.��This�can�translate�into�increased�business�attraction�to�the�state�as�a�result�of�improved�travel�time�and�lower�business�operating�costs.��Improvements�to�the�corridor�also�allows�for�more�direct�connection�for�motorist�traveling�from/to�I�65�south�of�Indianapolis�from/to�I�65�North�of�Indianapolis.��
System�Utilization�Maximization�Current�traffic�volumes�range�from�87,000�to�131,500.��Higher�volumes�are�near�the�northern�termini�of�the�project.��Congestion�along�this�stretch�of�the�interstate�is�a�problem�during�peak�hour�effected�by�motorist�traveling�to�IUPUI,�business�offices,�special�events,�and�other�items.��Model�analysis�shows�traffic�growth�ranging�at�conservative�0.6%�annually�on�I�65�in�the�northern�section�of�the�model�and�up�to�2%�annually�for�sections�of�the�I�65/I�70�corridor�south�of�Washington�Street.���Select�portions�of�the�corridor�is�currently�operating�at�unacceptable�levels�of�service�in�terms�of�congestion,�which�is�expected�to�worsen�in�future�years�if�there�are�no�improvements.��(14)�
Multimodal�Integration�&�Synergy�Modes�Available:��2�(road,�air)�
Improved�service�impacts�to�rapid�bus�that�utilize�the�section�of�roadway,�improved��flow�for�freight�trucks,�and�reliable�connectivity�to�the�Indianapolis�Airport�for�trips�between�the�Airport�and�areas�east�and�northeast�of�Indianapolis.��
Access�to�National�and�International�Markets�Improvements�to�the�I�70/I�65�road�sections�will�provide�improved�access�to�national�and�international�markets�by�addressing�bottleneck�issues�and�improving�system�reliability.��Improvements�will�provide�congestion,�improve�speed,�flow,�and�safety�during�peak�hour�conditions.��
Quality�of�Life�Proposed�improvements�will�increase�safety�reducing�conflict�points,�reduced�vehicle�merging,��increase�vehicle�flow,�which�will�translate�into�positive�air�quality�emissions�savings,�accident�reductions,�reduced�vehicle�operating�costs�in�terms�of�fuel�usage�and�wear/tear�from�stop�and�go�traffic�conditions�during�peak�hours�and�savings�to�business�operating�costs.��Improvements�also�allows�business�staff�to�arrive�to�destinations�faster,�which�translates�to�more�productive�time�and�reduced�vehicle�operating�cost.��
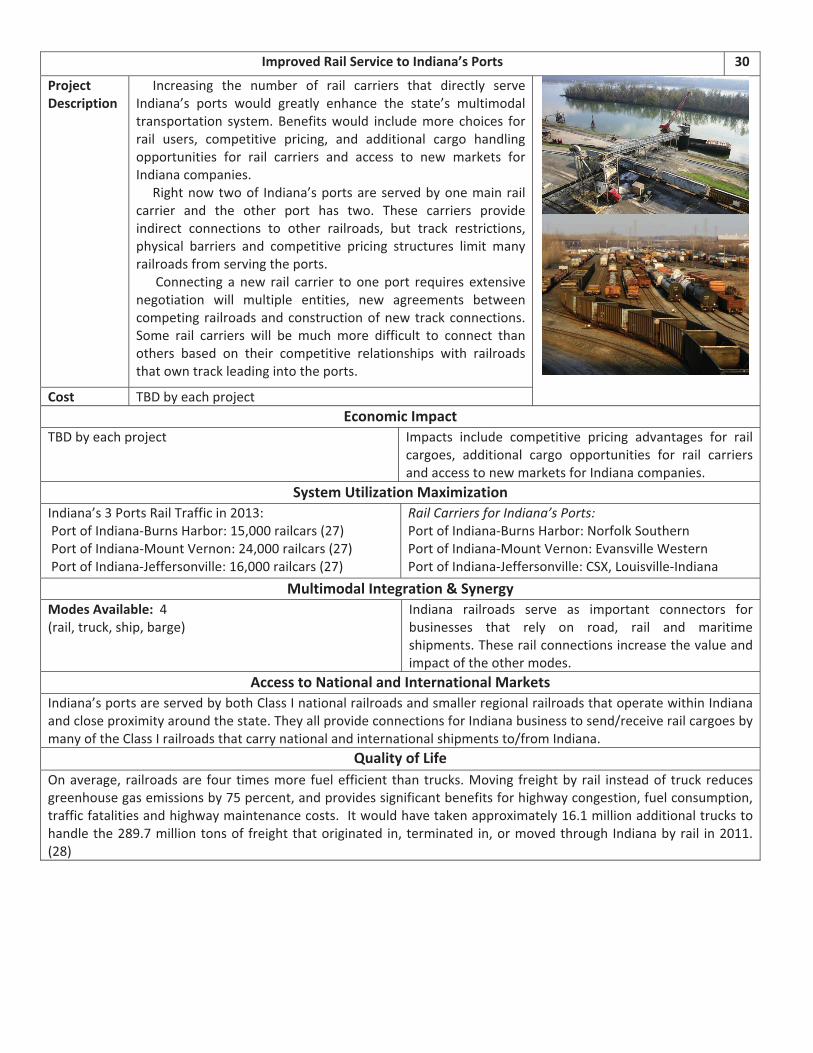
�
Improved�Rail�Service�to�Indiana’s�Ports� 30�
Project�Description�
�����Increasing� the� number� of� rail� carriers� that� directly� serve�Indiana’s� ports� would� greatly� enhance� the� state’s� multimodal�transportation� system.�Benefits�would� include�more� choices� for�rail� users,� competitive� pricing,� and� additional� cargo� handling�opportunities� for� rail� carriers� and� access� to� new� markets� for�Indiana�companies.������Right�now�two�of� Indiana’s�ports�are�served�by�one�main�rail�carrier� and� the� other� port� has� two.� These� carriers� provide�indirect� connections� to� other� railroads,� but� track� restrictions,�physical� barriers� and� competitive� pricing� structures� limit� many�railroads�from�serving�the�ports.��
Connecting� a�new� rail� carrier� to�one�port� requires� extensive�negotiation� will� multiple� entities,� new� agreements� between�competing�railroads�and�construction�of�new�track�connections.�Some� rail� carriers� will� be� much� more� difficult� to� connect� than�others� based� on� their� competitive� relationships� with� railroads�that�own�track�leading�into�the�ports.��
�
�
Cost� TBD�by�each�project�Economic�Impact�
TBD�by�each�project��
Impacts� include� competitive� pricing� advantages� for� rail�cargoes,� additional� cargo� opportunities� for� rail� carriers�and�access�to�new�markets�for�Indiana�companies.�
System�Utilization�Maximization�Indiana’s�3�Ports�Rail�Traffic�in�2013:���Port�of�Indiana�Burns�Harbor:�15,000�railcars�(27)��Port�of�Indiana�Mount�Vernon:�24,000�railcars�(27)��Port�of�Indiana�Jeffersonville:�16,000�railcars�(27)�
Rail�Carriers�for�Indiana’s�Ports:�Port�of�Indiana�Burns�Harbor:�Norfolk�Southern�Port�of�Indiana�Mount�Vernon:�Evansville�Western�Port�of�Indiana�Jeffersonville:�CSX,�Louisville�Indiana�
Multimodal�Integration�&�Synergy�Modes�Available:��4��(rail,�truck,�ship,�barge)�
Indiana� railroads� serve� as� important� connectors� for�businesses� that� rely� on� road,� rail� and� maritime�shipments.�These�rail�connections�increase�the�value�and�impact�of�the�other�modes.�
Access�to�National�and�International�Markets�Indiana’s�ports�are�served�by�both�Class�I�national�railroads�and�smaller�regional�railroads�that�operate�within�Indiana�and�close�proximity�around�the�state.�They�all�provide�connections�for�Indiana�business�to�send/receive�rail�cargoes�by�many�of�the�Class�I�railroads�that�carry�national�and�international�shipments�to/from�Indiana.�
Quality�of�Life�On�average,� railroads�are� four� times�more� fuel�efficient� than�trucks.�Moving� freight�by� rail� instead�of� truck�reduces�greenhouse�gas�emissions�by�75�percent,�and�provides�significant�benefits�for�highway�congestion,�fuel�consumption,�traffic�fatalities�and�highway�maintenance�costs.��It�would�have�taken�approximately�16.1�million�additional�trucks�to�handle�the�289.7�million�tons�of� freight�that�originated� in,�terminated� in,�or�moved�through�Indiana�by�rail� in�2011.��(28)�
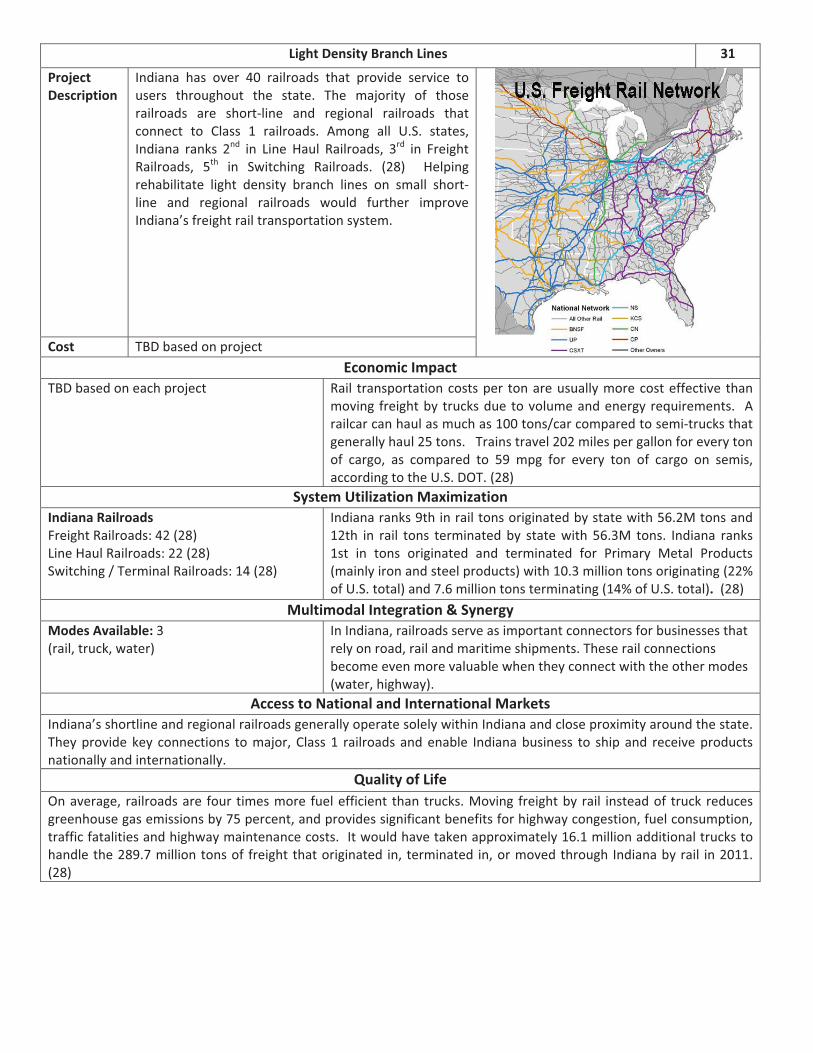
�
Light�Density�Branch�Lines� 31�
Project�Description�
Indiana� has� over� 40� railroads� that� provide� service� to�users� throughout� the� state.� The� majority� of� those�railroads� are� short�line� and� regional� railroads� that�connect� to� Class� 1� railroads.� Among� all� U.S.� states,�Indiana� ranks� 2nd� in� Line� Haul� Railroads,� 3rd� in� Freight�Railroads,� 5th� in� Switching� Railroads.� (28)� � Helping�rehabilitate� light� density� branch� lines� on� small� short�line� and� regional� railroads� would� further� improve�Indiana’s�freight�rail�transportation�system.�
Cost� TBD�based�on�project�Economic�Impact�
TBD�based�on�each�project� Rail� transportation�costs�per� ton�are�usually�more�cost�effective� than�moving� freight�by� trucks�due�to�volume�and�energy�requirements.� �A�railcar�can�haul�as�much�as�100�tons/car�compared�to�semi�trucks�that�generally�haul�25�tons.���Trains�travel�202�miles�per�gallon�for�every�ton�of� cargo,� as� compared� to� 59� mpg� for� every� ton� of� cargo� on� semis,�according�to�the�U.S.�DOT.�(28)�
System�Utilization�Maximization�Indiana�Railroads�Freight�Railroads:�42�(28)�Line�Haul�Railroads:�22�(28)�Switching�/�Terminal�Railroads:�14�(28)�
Indiana�ranks�9th�in�rail�tons�originated�by�state�with�56.2M�tons�and�12th� in� rail� tons� terminated�by� state�with� 56.3M� tons.� Indiana� ranks�1st� in� tons� originated� and� terminated� for� Primary� Metal� Products�(mainly�iron�and�steel�products)�with�10.3�million�tons�originating�(22%�of�U.S.�total)�and�7.6�million�tons�terminating�(14%�of�U.S.�total).��(28)�
Multimodal�Integration�&�Synergy�Modes�Available:�3��(rail,�truck,�water)�
In�Indiana,�railroads�serve�as�important�connectors�for�businesses�that�rely�on�road,�rail�and�maritime�shipments.�These�rail�connections�become�even�more�valuable�when�they�connect�with�the�other�modes�(water,�highway).�
Access�to�National�and�International�Markets�Indiana’s�shortline�and�regional�railroads�generally�operate�solely�within�Indiana�and�close�proximity�around�the�state.�They�provide�key� connections� to�major,�Class�1� railroads�and�enable� Indiana�business� to� ship�and� receive�products�nationally�and�internationally.�
Quality�of�Life�On�average,� railroads�are� four� times�more� fuel�efficient� than�trucks.�Moving� freight�by� rail� instead�of� truck�reduces�greenhouse�gas�emissions�by�75�percent,�and�provides�significant�benefits�for�highway�congestion,�fuel�consumption,�traffic�fatalities�and�highway�maintenance�costs.��It�would�have�taken�approximately�16.1�million�additional�trucks�to�handle�the�289.7�million�tons�of� freight�that�originated� in,�terminated� in,�or�moved�through�Indiana�by�rail� in�2011.�(28)�
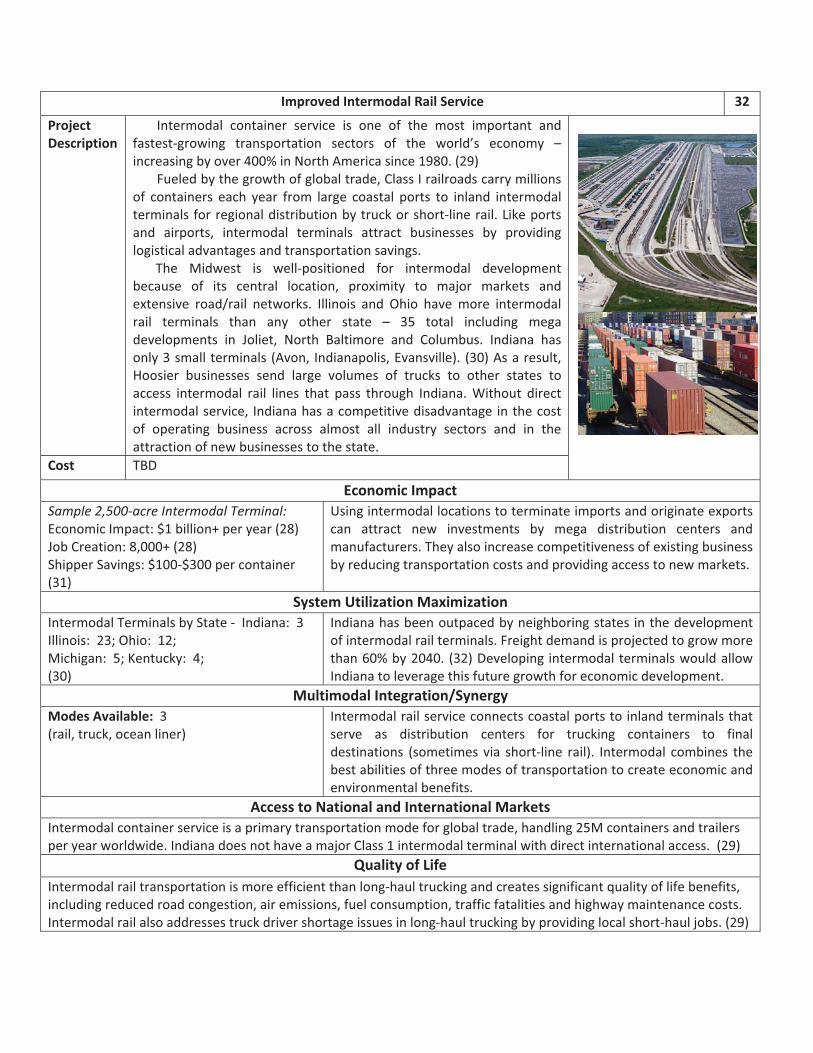
�
�
Improved�Intermodal�Rail�Service� 32�
Project�Description�
Intermodal� container� service� is� one� of� the� most� important� and�fastest�growing� transportation� sectors� of� the� world’s� economy� –�increasing�by�over�400%�in�North�America�since�1980.�(29)��
Fueled�by�the�growth�of�global�trade,�Class�I�railroads�carry�millions�of� containers� each� year� from� large� coastal� ports� to� inland� intermodal�terminals�for�regional�distribution�by�truck�or�short�line�rail.�Like�ports�and� airports,� intermodal� terminals� attract� businesses� by� providing�logistical�advantages�and�transportation�savings.��
The� Midwest� is� well�positioned� for� intermodal� development�because� of� its� central� location,� proximity� to� major� markets� and�extensive� road/rail� networks.� Illinois� and� Ohio� have�more� intermodal�rail� terminals� than� any� other� state� –� 35� total� including� mega�developments� in� Joliet,� North� Baltimore� and� Columbus.� Indiana� has�only�3�small�terminals� (Avon,� Indianapolis,�Evansville).� (30)�As�a�result,�Hoosier� businesses� send� large� volumes� of� trucks� to� other� states� to�access� intermodal� rail� lines� that� pass� through� Indiana.�Without� direct�intermodal�service,� Indiana�has�a�competitive�disadvantage�in�the�cost�of� operating� business� across� almost� all� industry� sectors� and� in� the�attraction�of�new�businesses�to�the�state.��
�
Cost� TBD�
Economic�Impact�Sample�2,500�acre�Intermodal�Terminal:�Economic�Impact:�$1�billion+�per�year�(28)�Job�Creation:�8,000+�(28)�Shipper�Savings:�$100�$300�per�container�(31)�
Using�intermodal�locations�to�terminate�imports�and�originate�exports�can� attract� new� investments� by� mega� distribution� centers� and�manufacturers.�They�also�increase�competitiveness�of�existing�business�by�reducing�transportation�costs�and�providing�access�to�new�markets.�
System�Utilization�Maximization�Intermodal�Terminals�by�State����Indiana:��3�Illinois:��23;�Ohio:��12;��Michigan:��5;�Kentucky:��4;�(30)�
Indiana�has�been�outpaced�by�neighboring�states� in�the�development�of�intermodal�rail�terminals.�Freight�demand�is�projected�to�grow�more�than�60%�by�2040.�(32)�Developing� intermodal�terminals�would�allow�Indiana�to�leverage�this�future�growth�for�economic�development.�
Multimodal�Integration/Synergy�Modes�Available:��3��(rail,�truck,�ocean�liner)�
Intermodal�rail�service�connects�coastal�ports�to�inland�terminals�that�serve� as� distribution� centers� for� trucking� containers� to� final�destinations� (sometimes�via� short�line� rail).� Intermodal� combines� the�best�abilities�of�three�modes�of�transportation�to�create�economic�and�environmental�benefits.�
Access�to�National�and�International�Markets�Intermodal�container�service�is�a�primary�transportation�mode�for�global�trade,�handling�25M�containers�and�trailers�per�year�worldwide.�Indiana�does�not�have�a�major�Class�1�intermodal�terminal�with�direct�international�access.��(29)�
Quality�of�Life�Intermodal�rail�transportation�is�more�efficient�than�long�haul�trucking�and�creates�significant�quality�of�life�benefits,�including�reduced�road�congestion,�air�emissions,�fuel�consumption,�traffic�fatalities�and�highway�maintenance�costs.�Intermodal�rail�also�addresses�truck�driver�shortage�issues�in�long�haul�trucking�by�providing�local�short�haul�jobs.�(29)�
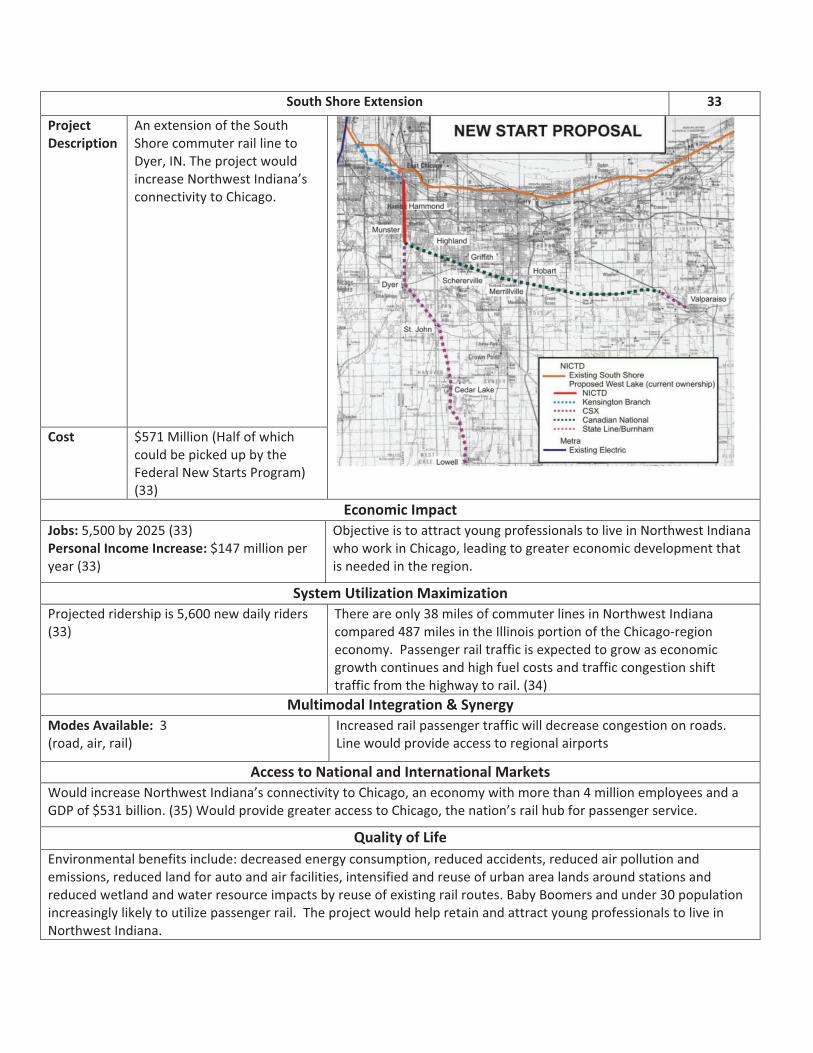
�
�
South�Shore�Extension� 33�
Project�Description�
An�extension�of�the�South�Shore�commuter�rail�line�to�Dyer,�IN.�The�project�would�increase�Northwest�Indiana’s�connectivity�to�Chicago.�
�
Cost� $571�Million�(Half�of�which�could�be�picked�up�by�the�Federal�New�Starts�Program)�(33)�
Economic�Impact�Jobs:�5,500�by�2025�(33)�Personal�Income�Increase:�$147�million�per�year�(33)�
Objective�is�to�attract�young�professionals�to�live�in�Northwest�Indiana�who�work�in�Chicago,�leading�to�greater�economic�development�that�is�needed�in�the�region.��
System�Utilization�Maximization�Projected�ridership�is�5,600�new�daily�riders�(33)�
There�are�only�38�miles�of�commuter�lines�in�Northwest�Indiana�compared�487�miles�in�the�Illinois�portion�of�the�Chicago�region�economy.��Passenger�rail�traffic�is�expected�to�grow�as�economic�growth�continues�and�high�fuel�costs�and�traffic�congestion�shift�traffic�from�the�highway�to�rail.�(34)�
Multimodal�Integration�&�Synergy�Modes�Available:��3�(road,�air,�rail)���
Increased�rail�passenger�traffic�will�decrease�congestion�on�roads.�Line�would�provide�access�to�regional�airports�
Access�to�National�and�International�Markets�Would�increase�Northwest�Indiana’s�connectivity�to�Chicago,�an�economy�with�more�than�4�million�employees�and�a�GDP�of�$531�billion.�(35)�Would�provide�greater�access�to�Chicago,�the�nation’s�rail�hub�for�passenger�service.��
Quality�of�Life�Environmental�benefits�include:�decreased�energy�consumption,�reduced�accidents,�reduced�air�pollution�and�emissions,�reduced�land�for�auto�and�air�facilities,�intensified�and�reuse�of�urban�area�lands�around�stations�and�reduced�wetland�and�water�resource�impacts�by�reuse�of�existing�rail�routes.�Baby�Boomers�and�under�30�population�increasingly�likely�to�utilize�passenger�rail.��The�project�would�help�retain�and�attract�young�professionals�to�live�in�Northwest�Indiana.�