Embed Size (px)
Citation preview

Blue Green SolutionsA Systems Approach to Sustainable, Resilient and Cost-Efficient Urban Development

2 3Blue Green Solutions Guide
Credits
Mr Ranko Bozovic, EnPlus consultancyContributed to all chapters using his expertise in the field of Blue Green planning methodology and BG solutions optimisation processes.
Prof. Cedo Maksimovic, Imperial College LondonThe founder and leader of the Climate-KIC Blue Green Dream project, Cedo provided strategic oversight and contributed to the BG Systems im-plementation framework both for this guide and in practice.
Dr Ana Mijic, Imperial College LondonAna’s expertise is in urban water management and modelling of integrated urban water systems (groundwater, land surface, drainage and green infrastructure) for climate change resilience. She contributed to chapters two and four.
Dr Karl M. Smith, London Southbank UniversityKarl managed the Blue Green Dream project be-tween 2013 and 2014 and has an established track record in environmental engineering re-search. He has provided copy writing/editing in-put to the guide.
Mr Ivo Suter, Imperial College LondonIvo is currently conducting a doctorate on simu-lating the effect of green roofs on the urban mi-cro-climate. He contributed to the Imperial Col-lege Case study.
This guide was funded by Climate-KIC. We wish to thank Sean Lockie, Aled Thomas and Gina Lovett from Climate-KIC for their strong support and their astute and insightful feedback on the guide’s content and presentation. We would like to acknowledge all project partners of the Climate KIC Innovation project The Blue Green Dream (BGD), which ran from 2012 to 2015.
Dr Maarten van Reeuwijk, Imperial College LondonMaarten specialises in the modelling of wind, air quality and heat transfer in the built environment. He contributed to all chapters and was the editor for the guide.
Graphics: MikserCreative direction: Maja LalicGraphic design: Jovan PavlovicIllustrations: Natalia Zwickwww.mikser.rs
Contributors
Acknowledgements

4 5Blue Green Solutions Guide
Contents
Credits ...................................................................................................................................................................................... 2
Foreword ................................................................................................................................................................................. 3
1 Introduction ....................................................................................................................................................................... 6
2 Blue Green Solutions for Urban Transition ......................................................................................................... 9
3 Integrated Design and Pre-planning ....................................................................................................................20
4 Quantification of the Benefits of BG Solutions ...............................................................................................27
5 Case Studies .....................................................................................................................................................................34
Case study 1: Zagreb University Campus .................................................................................................35
Case study 2: London Decoy Brook ............................................................................................................37
Case study 3: Budapest City Park (Varos Liget) ...................................................................................42
Case study 4: Marlowe road, London ........................................................................................................44
Case study 5: City of Šabac .............................................................................................................................47
Case study 6: Imperial College London .....................................................................................................50
6 Outlook ...............................................................................................................................................................................53
References ...........................................................................................................................................................................56

6 7Blue Green Solutions Guide
1 Introduction
Between 1950 and 2014, the global urban population underwent a five-fold increase, rising from 0.75 billion to 3.9 billion. Increased urbanisation brings with it a host of problems: increased pressure on essential resources such as food and water; increased air pollution due to transportation; loss of biodiversity; and increased risk of ill health (Figure 1).
The challenge posed by urbanisation is, however, magnified when coupled with climate change. Climate change is expected to lead to more extreme weather events in the form of severe floods, droughts and heat waves1-6. Such events can spell disaster for a city, especially when it is already dealing with the challenges that increasing urbanisation presents.
Urban pressures1
Flood Risk
Water Pollution
Drought
Air Pollution
Urban Heat Island
Health & Comfort
Noise
Crime
ResourceInefficiency
$

8 9Blue Green Solutions Guide
Urban planners and local governments are working to address these challenges. Many recognise that bringing Nature Based Solutions into the city is a powerful remedy for alleviating urban pressures and achieving resiliencetoclimate change.
Proven benefits of Nature Based Solutions7-12 include reduction of surface flooding risk, water and air pollution, mitigation of flood risk and urban heat islands, increased resource efficiency, as well as provision of areas for recreation /amenity and urban agriculture. A key advantage is that being vegetation based, their construction and operation has a low carbon and materials footprint. Other benefits include adding financial and aesthetic value to property, job creation, reducing building running costs and improving health and insurance premiums.
However, at present we are not getting the best out of Nature Based Solutions (NBS), neither for new developments, nor retrofits. NBS are often used in a mono-functional way, e.g. to provide shading or detain stormwater runoff, or simply for their aesthetic value. Moreover, they are usually valued only in terms of their benefits to the developer/principal stakeholder(s).
In fact, a key advantage of NBS is that they can provide multiple benefits to multiple stakeholders. Many of these co-benefits only arise when NBS are planned so as to utilise their beneficial interactions (synergies) with the local urban environment. The challenge therefore, both for new developments and for retrofits, is to enable current urban planning practice to map and exploit the synergistic benefits of NBS.
The Climate-KIC Innovation project Blue Green Dream (2012-2015), led by Imperial College London, initiated a step-change in how we map and exploit the potential benefits of NBS. A key focus was the use of NBS to achieve urban sustainability and climate change resilience. What
really set the Blue Green Dream project apart from other NBS (especially, green infrastructure) projects were two key innovations:
Its holistic, integrated planning methodology, which entails engaging with a wide panel of stakeholders across the whole planning process.
The concept of modelling, quantifying and optimising potential synergies between NBS, local water resources, the local built environment and climate, innovations in urban design and architecture, etc., to achieve lower life-cycle costs and enhanced benefits.
The Blue Green Dream project was awarded the Business Green Technology Award for Research and Development Programme of the Year13.
This guide presents the integrated planning methodology developed from the Blue Green Dream Project, referred to hereafter as the Blue-Green (BG) Systems approach.
We showcase several case studies, each demonstrating a different element of our approach. The case studies show that through applying this holistic, quantitative approach to their planning and design, NBS can be highly cost-effective. Not only do they increase the value of developments, but they deliver substantial savings in operational costs.
This guide contributes to Climate-KIC’s ‘urban transitions’ work, demonstrating its novel approaches to creating low carbon and resilient cities.
2 Blue Green Solutions for Urban Transition
Increasing urbanisation, climate change and extreme weather conditions are resulting in increased urban stresses. These include water and air pollution and resource scarcity, all of which are reducing urban liveability. Adaptation to, and mitigation of these pressures is a major concern at EU and international levels.
Initially, Nature Based Solutions (NBS)14, 15 such as green roofs and walls, rain gardens, swales, etc., were conceived as a means of both locally managing rainfall (surface) runoff and improving amenities. Such interventions are commonly termed Sustainable Urban Drainage Systems (SUDS) 16. More recently, macro-scale concepts such as Water Sensitive Urban Design (WSUD) 17, have enhanced and broadened the SUDS concept by recognising the role that NBS can play in holistically managing urban water resources.
The Blue Green Dream (BGD) project 18,19 built upon and expanded the SUDS and WSUD
Historical development of Blue Green Solutions (BG-S) via SUDS and WSUD 2
concept (Figure 2) to produce a systematic22 quantitative framework for utilising the full range of ecosystem services that NBS provide, yielding Blue Green (BG) Solutions. Within the urban context ecosystem services provide a means of mitigating not only for water related problems, but also for urban development pressures such as heat islands, air pollution, resource scarcity etc. (Figure 3).
A range of successful examples of the implementation of associated aspects of the NBS concept exist worldwide. These include: the Gardens by the Bay, Singapore20; the High Line Park, New York21; the Blue Green Wave, Paris 22; City Park, Budapest23 ; the Village Nature Resort, Paris24; the Multifunctional Urban Water System in Lindenhof in Berlin-Lichtenberg; Curitiba city, Brazil25; the Multifunctional roof garden and campus, Yuntou Co, China; the Wild West End project, London26; and the Smart Sustainable Districts development, Utrecht27.
WaterSupply City
SeweredCity
DrainedCity
WaterwayCity
Water CycleCity
Water SensitiveCity
Blue GreenDream
SUDS WSUD BG-S
2000 20121990

10 11Blue Green Solutions Guide
NBS-related ecosystem servicesAugustenborg, Malmö, Sweden.
The Augustenborg development in Malmö is designed to be a socially, economically and environmentally sustainable neighbourhood. It is one of Sweden s largest urban sustainability projects, was supported by the government s Local Investment Programme and also financed by key local partners within Malmö City and the MKB housing company.The project’s results indicate that Augustenborg has become an attractive, multicultural neighbourhood in which the turnover of tenancies has decreased by almost 20 per cent and adverse environmental impacts have decreased to a similar degree.
Blue Green Wave, Paris, France.
The Blue Green Wave [28] is a one hectare green roof (the largest in the Paris region) located at Cite Descartes, at the École des Ponts ParisTech campus. Initially designed to deliver only amenity/aesthetic related functions, it has been transformed into a research-oriented demo site. Completed in 2014, it is equipped with monitoring equipment to understand the roof’s hydrological behaviour and with sensors collecting data on rainfall, soil water content, temperature and run-off. The ultimate objective is to understand the interactions between water and green infrastructure and hence, optimise the use of such assets for storm water management and urban cooling.
3
Resources efficiency
Air quality
UHI mitigation
Well-being
Noise reductionFlood mitigation
Biodiversity
Water quality
Aesthetics
NBS-relatedEcosystem Services

12 13Blue Green Solutions Guide
Wild West End, London, UK.
Gardens by the Bay, Singapore.
This project in London’s West End will ultimately create an extensive network of green corridors which form connections between large areas of parkland in London in order to enhance biodiversity and improve ecological connectivity. One of the unique features of the project is that it involves a collaboration between several land owners: The Crown Estate, Grosvenor Britain & Ireland, Shaftesbury, the Howard de Walden Estate and The Portman Estate. Each partner has committed to setting green infrastructure objectives for their portfolios and working together to share information and data on green infrastructure projects across their estates.
The “super trees” act as a tourist attraction, provide recreational areas for locals and encourage biodiversity. As well as supporting many different species of plants, some are also equipped with photovoltaics and/or act as air intake and exhaust vents (for the neighbouring cooled conservatory complex) to make them more sustainable. With the Gardens by the Bay project, Singapore benefits from a large recreational area with many environmentally advantageous functions: e.g. water run-off from the gardens is filtered by reed systems and lakes before being discharged into the sea. Additionally, all the cooling energy needs and circa 80 per cent of the conservatory complex’s energy consumption is created on site.
The large-scale implementation of NBS has faced various barriers. Traditionally, cities have tried to achieve various sustainability targets using planners’/ architects’/ designers’ perception of sustainability and their knowledge and experience. These individual targets include improvement of vegetation/green space coverage and energy efficiency, creation of “green corridors” for enhanced biodiversity, etc. However, while these solutions have been successful from the perspective of achieving individual sustainability targets, they leave much of the potential of NBS untapped: their multi-functional nature.
In order to achieve a successful transition to a sustainable, resilient and cost-effective city, it is necessary to integrate NBS systematically and more efficiently with other urban components (e.g. streets, roofs, façades, infrastructure etc.; see Figure 4). This requires consideration of the city and its functions at the systems level. In doing
so, the performance of the NBS in terms of all ecosystem services it provides can be quantified, both in terms of tangible (e.g. flood risk reduction) and non-tangible (e.g. health and well-being) benefits and costs.
Examples of urban components4
BG Systems Approach
Interactions-Based Planning
The Blue Green (BG) Systems approach for innovative urban planning produces optimised urban solutions, hereafter referred to as Blue-Green (BG) solutions. These harness the synergy benefits between urban components and ecosystem services, resulting in significantly more efficient and cost-effective, multifunctional urban solutions (Figure 5).
The BG Systems approach is applicable to all climates (with the possible exception of the Polar Regions) and socio-economic conditions. Moreover, it is applicable at different scales: from an individual building to an entire city. It can also be
1
1 Building
2
2 Street
3
3 Trees 4 Solar water heating
4
5 Multifunctional green wall
5
6 Multi-functional roof garden
6
7 Storm water harvesting and recycling 8 Food production
8
9 Ground water aquifer 10 Constructed wetland Pocket park
9
11 Urban streams and ponds 12
11
12
10
7

14 15Blue Green Solutions Guide
used to help corporations and public institutions achieve stringent sustainability targets. Figure 6 gives an illustration of the multiple interactions and the resulting benefits for a “multifunctional” tree. In addition to the tree’s aesthetic value, its benefits include urban
heat island mitigation (via both shading and evaporative cooling), storm water flood risk reduction, noise and air pollution reduction and acting as a wind barrier. These functions interact with the urban microclimate, building massing, indoor comfort, energy consumption and outdoor environment quality.
In many cases, the tree’s functions can be enhanced/maintained without excessive use of potable water: for example, by irrigation with harvested roof and street rainfall runoff and recycled grey water. If integrated adequately, many synergy benefits will result29. Under the BG Systems approach these interactions are modelled and quantified to inform the choice and positioning of tree(s) for the area. This includes careful selection of the tree species based on their characteristics and the specific requirements they will need to fulfil.
BG Solutions concept5
Stakeholder Benefits
The holistic nature of the BG Systems approach ensures benefits for all stakeholders. Key stakeholders, listed in order of their potential influence for enabling change, are presented in Figure 7. For example, Figure 7 shows that if policy makers introduced BG Systems compliant planning standards, then benefits would be created at the Systems, Project and User levels. It is envisaged that existing development certification schemes, such as BREEAM and LEED, will need to be augmented with BG Systems concepts and criteria. Engagement of policy makers will be key to achieving this shift.
Discipline Integrators: the BG Team
The BG Systems approach differs substantially from current planning practice. Its full effectiveness will therefore be achieved only if a transition in operations occurs to safeguard compliance with the systematic methodology presented in this guide. The success of the approach is founded upon centralised coordination of and communication between multidisciplinary teams.
The BG Systems approach adds a new participatory group to the urban planning process: The BG team. The BG team’s prime responsibility is to work with and coordinate the different disciplines (Figure 8). The experts in the BG team will be fully familiar with BG Systems approach.
The shading of four trees can save 25 per cent of the energy needed for cooling a building. In doing so, they offset about 3-5 times more carbon than a tree in a forest30.
The multi-functional interactions and benefits of a tree6
7 Benefits of the BG Systems approach for stakeholders involved in urban planning.
EcosystemServices
BG SystemApproach
UrbanComponents
BGSOLUTIONS
PedestrianShading
Heat IslandShading
BuildingShading
AdiabaticCooling
Evapo-transpiration
Flood RiskReduction
INTERACTING WITH
TREE FUNCTIONS
RESULTING SYNERGY BENEFITS
WindBarrier
MicroClimate
BuildingMassing
IndoorComfort
EnergyConsumption
OutdoorEnvironmentQuality
Urban heat island effect reduced
Outdoor air evaporative cooling
Buildings more comfortable
Buildings using less energy
Building envelope cheaper
Surface flood risk reduction
Higher property value
Humans healthier
Reduced noise and air pollution
Better conditions for pedestrians
Socialising more intensive
Water management more effective
Reduction ofLife Cycle Costs
MaximisedSystem
PerformanceHigher Level
of Sustainability& Environmental
Quality
More EfficientDesign Process
Market Leadership
Corporate Prestige
New Construction Standards
Increased Profitability
Reduced Resource Usage
Increased Resiliance
ImprovedQuality of Life
and ReducedLiving CostsSt
akeh
older
Ben
efits
Policy and Law Makers
Strategic Planners
Developers
Consultancies
Asset Owners
Users
Enabling Change
System Level
Project Level
User Level

16 17Blue Green Solutions Guide
3 Integrated Design and Pre-planning
The development of a design brief is one of the most important phases in the design process. This especially applies for the BG Systems approach as it determines the overall quality and sustainability of the project. A standard design brief outlines the client requirements. However, it does not necessarily represent the needs of all stakeholders. It therefore does not guarantee a solution that meets everyone’s needs. We advocate a Blue-Green (BG) Design Brief, which presents detailed requirements from all stakeholders, together with a selection of optimised concept solutions. This guarantees higher quality design for the city and helps the developer to come to informed, compliant and robust project decisions. The project will not only be more sustainable but will also deliver significant savings, especially with respect to operational costs. In this section we outline the differences between a standard design brief and the BG Design Brief. We discuss the systematic approach in which the BG Design Brief is developed through a new, BG-specific planning tool: the Goal Driven Planning Matrix (GDPM).
Stakeholder Involvement
The production of a Design Brief will involve the following stakeholders:
Project Strategy Planners (PSPs). In the case of city planning, they are normally
part of the city management group and define the requirements that lead directly to a Design Brief.
Project developers. They have the same role as PSPs but act within private or private-public partnership (PPP) projects.
Project planners. These are involved in all planning stages.
Evaluator community. They are responsible for financial quantification of different parts of the project. This usually happens during the viability study (without parametric analysis of the effects of interactions) and the design development phase.
Potential project users. These are the people that will occupy and use the developments. Asset managers. They run the assets once the development has been completed.
City / project approval bodies. These stakeholders check the design’s compliance with regulations and standards and issue permits.
The degree of involvement of the stakeholders in the production of the BG Design brief, as opposed to a standard design brief, is shown in Table 1.
8 Shifting from silos to integrated systems: the BG Systems approach
LandscapeArchitect
ArchitectClimateSpecialist
EnergyPlanner
EnvironmentalEngineer
WaterEngineer
UrbanPlanner
BS SYSTEMS APPROACH
18 19Blue Green Solutions Guide
Challenges of the Standard Design Process
The standard design process ensures that all the basic client requirements set out in the Design Brief are met. However, when BG solutions are proposed, this process inhibits the delivery of optimal solutions for the following reasons:
Information gap. City management and developers often don’t have access to the latest knowledge and expertise to realise the potential of BG solutions.
Silo solutions. BG solutions are often used to provide solutions to specific aspects of a problem (e.g. utilising a tree for aesthetic reasons or SUDS for flood prevention only), but the full scope of the interactive functions of an NBS (shading, evaporative cooling, flood risk reduction, air quality
improvement etc.) is often overlooked. This results in “silo” solutions, in which opportunities to exploit the wider benefits of a NBS are missed.
Problem solving vs problem pre-emption. The standard design methodology is oriented towards mono-functional problem solving, rather than a holistic, horizon scanning approach to pre-empting problems that uses single interventions to tackle multiple issues. For example, in the “silo” approach an intervention will be applied to tackle a single identified issue. Under the BG Systems approach, the holistic perspective will involve assessing how the intervention could be used to tackle the bulk of, or even all of, the potential problems (urban heating island, surface water flooding) in the area and thus create multiple benefits with lower costs.
Fragmented design. Conventionally, different branches of the same design team will often meet only out of necessity. The design process is therefore fragmented – solutions do not take advantage of synergies that can occur when different urban components are integrated or different expert disciplines work together.
BG Systems Approach
The BG Systems approach deviates from the standard approach in that it places a strong emphasis on having a highly analytical pre-planning phase. During this pre-planning phase, optimised concept solutions are produced that become part of the BG Design Brief.
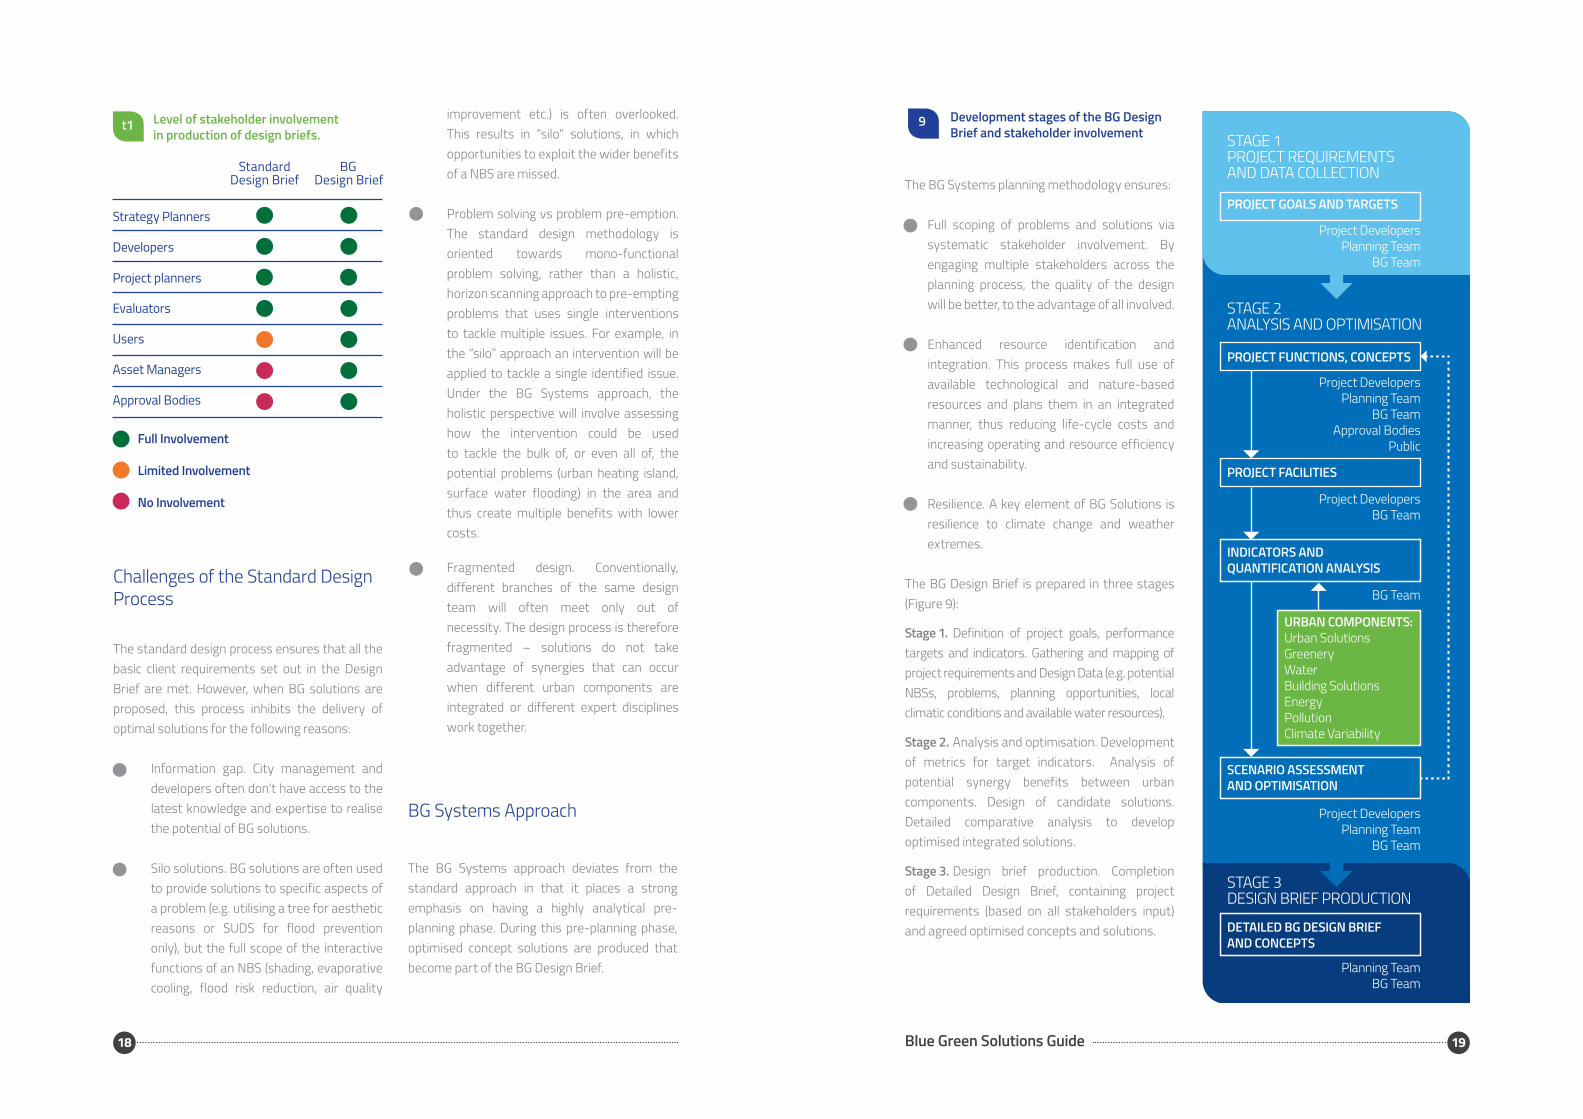
The BG Systems planning methodology ensures:
Full scoping of problems and solutions via systematic stakeholder involvement. By engaging multiple stakeholders across the planning process, the quality of the design will be better, to the advantage of all involved.
Enhanced resource identification and integration. This process makes full use of available technological and nature-based resources and plans them in an integrated manner, thus reducing life-cycle costs and increasing operating and resource efficiency and sustainability.
Resilience. A key element of BG Solutions is resilience to climate change and weather extremes.
The BG Design Brief is prepared in three stages (Figure 9):
Stage 1. Definition of project goals, performance targets and indicators. Gathering and mapping of project requirements and Design Data (e.g. potential NBSs, problems, planning opportunities, local climatic conditions and available water resources).
Stage 2. Analysis and optimisation. Development of metrics for target indicators. Analysis of potential synergy benefits between urban components. Design of candidate solutions. Detailed comparative analysis to develop optimised integrated solutions.
Stage 3. Design brief production. Completion of Detailed Design Brief, containing project requirements (based on all stakeholders input) and agreed optimised concepts and solutions.
9Level of stakeholder involvement in production of design briefs.
Development stages of the BG Design Brief and stakeholder involvementt1
StandardDesign Brief
BGDesign Brief
Strategy Planners
Developers
Evaluators
Users
Asset Managers
Approval Bodies
Full Involvement
Limited Involvement
No Involvement
Project planners
STAGE 2ANALYSIS AND OPTIMISATION
PROJECT FUNCTIONS, CONCEPTS
STAGE 3DESIGN BRIEF PRODUCTION
DETAILED BG DESIGN BRIEFAND CONCEPTS
PROJECT FACILITIES
INDICATORS ANDQUANTIFICATION ANALYSIS
SCENARIO ASSESSMENTAND OPTIMISATION
STAGE 1PROJECT REQUIREMENTSAND DATA COLLECTION
PROJECT GOALS AND TARGETS
Project DevelopersPlanning Team
BG TeamApproval Bodies
Public
Project DevelopersBG Team
BG Team
Project DevelopersPlanning Team
BG Team
Planning TeamBG Team
Project DevelopersPlanning Team
BG Team
URBAN COMPONENTS:Urban SolutionsGreeneryWater Building SolutionsEnergyPollutionClimate Variability

20 21Blue Green Solutions Guide
Metrics for indicators. The BG Team will determine what metrics are required for the indicators and which type of analysis is required to obtain these metrics - both for the existing area and for candidate concept solutions for the site, in order that quantitative comparisons can be made. Included in this analysis are consultations with Quantity Surveyors on costs/economics.
Solution optimisation and selection. Using the outputs from step 5, the planning team and city management, with the BG Team’s assistance, will select optimal solutions to produce a detailed design brief. The optimisation process is based on a matrix of interactions between urban components, which will be discussed in the next chapter.
Excerpts from a sample Goal-Driven Planning Matrix 10The Goal Driven Planning Matrix
The BG System approach facilitates the systematic participation of all key stakeholders in the formulation of the client requirements/project design brief. Active stakeholder involvement in the preparation of the Brief is achieved through their role in completing the Goal Driven Planning Matrix (GDPM). This includes a systematic process for defining the developer’s requirements, consulting with approval bodies and holding consultative workshops with the public. Through this process, we make sure that the needs of all stakeholders are represented to deliver a solution of maximum stakeholder benefit.
The GDPM has been developed to ensure a systematic analysis of the developer’s goals, the available resources, and full participation of all relevant stakeholders. The GDPM (an example of which is shown in Figure 10) is populated during the aforementioned stages through the following six activities (Figure 9):
Definition. These are the strategic project / city goals as determined by strategy planners/makers.Target identification. To reach each goal, a number of targets have to be developed. The BG team work with the strategy makers and planners to define these targets.
Definition of indicators to meet targets. The BG Team will define quantifiable indicators for each target.
Project functions and concepts. Project planners, together with members of the project/city management team, personnel from the city approval bodies and members of the wider public, work with the BG Team to specify required project functions and potential conceptual solutions designed to meet each target.
GOALS TARGETSFUNCTIONS& CONCEPTS/ INDICATORS
CITY FACILITIES / BG ANALYSIS
1. EU POLICY COMPLIANCE
......................................
Cheaper to buy
......................................
Value for money
Profiling of market
Tourist attractions
Promotion of culture
5. CLIMATE CHANGE RESILIENCE
3. SUSTAINABILITY
4. ..............................
6. ..............................
7. PROFITABILITY
8. ..............................
9. INTERNATIONAL PROFILE
Lower running costs
Integration of localcommunity
Enhanced indoorcomfort
Sustainability andurban resilience
1. Outdoor Environmental Quality appraisal for all comfort indicators
3. Analysis of project enhancements delivered against standard (business as usual) conditions
......................................
......................................
......................................
......................................
......................................
......................................
Improved outdoor comfort
OEQ* Indicators for each comfort category: Thermal comfort; Auditory comfort; Visual comfort *OEQ = Outdoor Environmental Quality
......................................
......................................
......................................
2. MARKETING
Other influences: Street Urban (street) canyon effect; Wind direction; Building orientation; Ratiobuilding height/widthSecondary side street effects; Combination with temperatures

22 23Blue Green Solutions Guide
4 Quantification of the Benefits of BG Solutions
A central feature of the BG Systems, planning methodology is quantification of the key project interactions and their effects on project quality and life-cycle costs. Practically, this is achieved by systematic implementation of three specifically designed tools, namely:
Interaction matrix. Maps all possible interactions between urban components.
Cost dependency matrix. Maps possible capital cost reductions utilising synergy benefits identified by the interaction matrix.
Climate resilience matrix. Applies all possible climate change scenarios to the interaction and cost dependency matrices and quantifies resilience indicators.
The Interaction Matrix
The central tool for identifying all relevant interactions between urban components, including BG solutions, is the matrix of interactions. Within the matrix, urban components are categorised as follows (Figure 11):
Urban Solutions. Building orientation and massing. Street orientation and shapes. Topography and urban amenities. Infrastructure services (e.g. sewers).
Greenery. Grass, gardens, meadows, shrubs, trees and other vegetated areas including those on roofs and facades. Combinations with other materials.
Water Management (potentially integrated) of rainfall, drinking wastewater and treated effluent, ground (sub-surface) and surface water bodies.
Building Solutions. Efficient building envelopes, energy systems, indoor water services.
Energy. Locally available renewable energy, conventional energy and waste (heat) energy.
Pollution. Thermal pollution, air pollution (quality), sound pollution and visual pollution etc.
Climate Variability. Weather extremes: heat and cold waves, droughts, extreme rain, snow and storms.
Urban components interact with each other and some interactions produce synergies that can be exploited for the benefit of the project. All interactions are therefore systematically mapped, modelled and quantified to enable the design team to make a decision using quantified performance indicators.

24 25Blue Green Solutions Guide
The city is comprised of urban components, which collectively act to create “Living Environment Quality”: an aggregate of all factors (indicators) influencing the quality of our living environment. The ultimate aim of the BG Systems approach is to achieve the highest level of Living Environment Quality, at close to optimal cost. This is achieved by optimising the interaction between urban components, including BG solutions.Under the standard planning/design approach, a landscape architect would typically plan greenery to have an aesthetic effect and possibly, provide adequate shading for buildings’ thermal comfort and heat island reduction. Selection for other functions such as evaporative cooling and phytoremediation (i.e. soil and water decontamination) would often not be considered. The BG Systems approach eliminates the possibility of these opportunities being missed.
Interactions between different urban components
Synergy Examples
The interactions between urban components are modelled in order to quantify and optimise the beneficial effects of their synergies, e.g.:
Reduce flood risks. To reduce flood risk, one may create a swale or other Sustainable Urban Drainage Systems (SUDS) element such as retention ponds or a multifunctional roof garden (Figure 12 a). These interventions involve interactions between Urban Solutions (topography), Water, Greenery and Climate Extremes. The model would quantify how much of the flood risk is being mitigated by this urban solution for a given return period
11
(e.g. 50 years). The type of greenery and the scale of the BG solution would influence its interactions and effects. The stored water will be used for irrigation of greenery, which will enhance biodiversity, urban agriculture and create natural noise barriers etc.
Maximise the value of a tree. When planting trees in front of the south-facing
Examples of BG synergies and their benefits
façade of a building, key interactions to map are those between Greenery (i.e. the tree and other vegetation on the site), Energy (building energy consumption) and Building Solutions (façade etc.). It is therefore vital to analyse the interactions and benefits of each species to determine how to achieve best performance against the set of prescribed functions (Figure 12)
12
Water Greenery
ClimateVariability
LivingEnvironment
Quality
UrbanSolutions
Energy
Pollution
BuildingSoulutions
$
Interaction of Individual BG Solutions
Benefits for healthier, more sustainable cities and developments
Using harvested storm waterto support greenery
Biodiversity
Living Environment QualityJob Creation
Using recycled water forenergy efficiency and building solutions
Improved Urban Environment

26 27Blue Green Solutions Guide
Optimisation Process
The optimisation starts with the definition of a number of promising scenarios with different combinations of possible BG solutions. Simulations are then used to carry out a comparative analysis. A systematic optimisation is then carried out to rank the BG solutions and the optimal scenario is selected based on the criteria agreed with the client. Optimised solutions will be accepted if they offer lower life-cycle Costs, a higher level of efficiency, resilience and an enhanced Living Environment Quality.
Cost-effectiveness of BG Solutions
A key advantage of the BG Systems approach is that it yields plans that are more cost-effective in terms of their Life-cycle Costs. Thus, the BG Systems approach offers a win-win situation: the developer will be interested because of increased client satisfaction (through intensive stakeholder involvement), higher Return on Investment (ROI), better sustainability, resilience and (green) credentials, whilst the city and local stakeholders benefit from a more sustainable, climate change resilient and greener cityscape.
The quantification of the life-cycle Costs is done using the Cost Dependence Matrix, which determines the possible cost reductions deriving from specific interactions between Urban Components. In quantifying these life-cycle costs, the full effectiveness of BG solutions can be demonstrated.
Consider a hypothetical example for surface flood reduction (Figure 13), which explores the interaction between an Urban Solution (change of street permeability and roof substrate thickness, for example) with Water (surface flood management). Apart from reducing surface runoff and thus flood risk, significant cost savings arise from the co-benefits:
The option of using smaller, or even the avoidance in their entirety of, storm drainage and potable water pipes (savings in material and labour).
Water captured in tree pits and in surface and underground storage provide an additional water source for irrigation, leading to savings in the irrigation costs.
The storm water used to irrigate the greenery will lead to evaporative cooling and enhanced shading, thus reducing building cooling costs.
Climate Resilience Matrix
Climate change is associated with more frequent and more extreme weather events. Achieving urban climate change resilience therefore requires adaptation of urban planning practice in order to protect against these events31. For this purpose, a Climate Resilience Matrix has been developed that identifies potential weather extremes affecting different urban categories, applicable in various parts of the world.
The BG Systems approach will investigate proposals for remedial measures designed to enhance the resilience of the BG Solutions themselves to weather extremes. This means that interventions such as tree pits and green roofs are better equipped to manage, for example, extreme rainfall events.
The BG planning approach is guided by the A2R climate resilience approach (Anticipate, Absorb, Reshape)32 and is designed to augment city/project climate vulnerability assessment with a combined sustainability and resilience analysis. This process identifies appropriate resilience measures and integrates them with the BG sustainability measures already planned for that area. Integration of sustainability and resilience measures is instrumental to maximising the operating/resource efficiency and minimising the costs of the introduced urban BG solutions.
The BG Systems approach ensures that the BG solutions will provide:
Decrease of risk, exposure and hazard.Increase of coping capacity.
Compatibility with proposed project sustainability strategies.
Reduce air pollution. To reduce residual air pollution by traffic, in addition to tackling vehicle emissions, one could (for example) change access to and exits from the road area, as well as the movement of vehicles along the road itself. Determination of the best option involves mapping interactions between Urban Solutions, candidate BG Solutions and Pollution. One can use the matrix to look at the effect of using multiple BG Solutions and technological interventions: for example, combining pocket parks with trees, a rain garden and bio filters, with some of these measures also being used as traffic calmers in order to yield road safety benefits.
Cost dependency matrix13
COMPONENT A
Urban Solutions
Streetpermeability androof substratethickness
COMPONENT B
Water
Surface floodmanagement
BENEFIT 1 BENEFIT 2 BENEFIT 3
Surface runoffsmaller
Material andlabour savingsdue to smallersewer pipes
Storm waterharvesting
Reduced potablewater costs dueto free irrigationwater and toiletflushing
Storm waterharvesting
Energy savingsdue to shadingand evaporativecooling bygreenery
TOTAL CAPITAL COST
TOTAL RUNNING COST
Standard Cost
BG Cost
Runn
ing
Cost
Capi
tal C
ost

28 29Blue Green Solutions Guide
5. Case Studies
The case studies demonstrate how the BG Systems approach can substantially enhance the sustainability, resilience and cost-effectiveness of BG Solutions in both new and existing urban developments.
1. Zagreb University Campus Page 28
Demonstrates the multiple benefits of the BG Systems approach, via the Goal Driven Planning Matrix (GDPM), at the district/master planning level.
2. London Decoy Brook Page 30
Illustrates how monetising the wider benefits of BG solutions facilitates their use for managing environmental risks to urban infrastructure.
4. Marlowe Road London Page 34
Demonstrates the application of the BG Systems approach to the planning of a residential area.
5. Šabac city Masterplan Page 36
Describes how the BG systems approach has been utilised to develop a regeneration plan for an entire city.
6. Imperial College London Page 39
Demonstrates how to monitor and model the operational performance of BG solutions at the level of an individual building.
3. Budapest City Park Page 32
How to achieve a closed loop (urban metabolic) system for water, energy and waste using the BG system approach.

30 31Blue Green Solutions Guide
Case study 1: Zagreb University Campus Deployment of the BG Systems approach to deliver an enhanced master plan.
Background
BG Systems Approach Main Outcomes
In 2011, the University of Zagreb held a competition for the design of a flagship campus on a former military airfield located inside a forest. Sustainability, environmental quality and resource efficiency were the key judging criteria. Njiric Architects and EnPlus won this competition and were commissioned to create a Master Plan.
A full-scale analysis was conducted using the BG Interaction Matrix (see page 27). The analysis identified a number of potential interaction synergies that could provide significant life-cycle cost savings for the campus. The integration of groundwater resources, underground storage of energy and specially planned vegetation proved to have significant potential. In particular, by integrating the campus with the forest, with the addition of selected tree species planted in optimally configured positions, the natural functions of the forest could be harnessed to the benefit of the campus.
Trees with large leaf surface areas were positioned to align with summer winds, hence maximising evaporative cooling of the buildings. The southern façades of the buildings were protected from summer solar radiation using trees that lose their leaves early in October, thus also enabling solar passive heating in the winter. Evergreen trees were positioned perpendicular to predominant winter winds to reduce heat losses in the winter.
The optimisation of the master plan via the BG Systems approach yielded a near-zero-energy campus, with overall energy savings of 68 per cent for heating, 92 per cent for cooling and 60 per cent for electricity.
Due to the strategic positioning of the trees, indoor summer temperatures were 4oC lower and indoor winter temperatures were 6oC higher, relative to a zero-tree (i.e., absence of trees) scenario. The energy consumption of the buildings was 26 per cent lower.
Life-cycle Cost Analysis found that the payback time for the additional investment required, compared to standard construction costs, was approximately 4.8 years.
Figure 18 demonstrates the campus’s integrated approach to local reuse of water, localised energy production and recovery for the campus, and use of greenery for passive building design.
The energy for the campus was harvested from nature by means of using solar energy for passive heating, hot water production and electricity production by PV panels. Underground energy storage (in deep rock), as well as ground water, are combined with the solar energy harvesting system to create a unique, natural energy production plant for the campus. The result is a near-zero energy, university campus.
Energy flow diagram and related annual energy savings for Zagreb University campus.
14
15
Multi-purpose water use and reuse and its interaction with localised energy production and recovery, and vegetation.
Energy recovery
Energy storage
Grey water
Black waterDecentralized
WW treatment
Wind driven ventialtion with heat recovery
Waste water quality improvement
Heat island mitigation
Electricity and water exchange
Ground water aquifer
Mains
ArtificialNaturalBuilding energy
and water storage
68%
60%92%
Heating
Cooling
Electricity
Payback Period: approximately 5 years
Annual Energy Savings
PassiveHeating
2000MWh/y
Sun Collectors3400MWh/y
Photovoltaic5000MWh/y
Seasonal Ground
Energy Storage2000MWh/y
Ground Water3500MWh/y

32 33Blue Green Solutions Guide
Case study 2: London Decoy BrookMonetisation of the wider benefits of retrofitting BG solutions for management of environmental risks to urban infrastructure.
Background BG Systems Approach
BG solutions, in the form of integrated, vegetated, Sustainable Urban Drainage Systems (SUDS), improve flood alleviation capacity. However, they also provide wider, ecosystem service derived benefits. The wider benefits are usually not included in cost-benefit analyses, thereby greatly undervaluing BG solutions’ use as strategic assets.
Imperial College London worked with the London Environment Agency (EA), London Borough of Barnet and AECOM to provide compelling and robust evidence for BG Solutions’ cost effectiveness within the UK Flood Risk Management Planning Framework33.
To develop and deliver a framework for quantifying the wider benefits of BG solutions, the Decoy Brook catchment in London (UK) was used as a case study. The brief for Decoy Brook was to protect the critical infrastructure assets Golders Green and Finchley Road junctions, Golders Green tube station, Finchley Road police station and electrical substations. A set of BG solutions were co-designed with the stakeholders via a workshop, with the aid of the Adaptation Support Tool software developed during the Blue Green Dream project.
The financial appraisal of the wider benefits of the BG solutions, such as amenity, air quality, biodiversity and surface water charges reduction, was done using CIRIA’s Benefits for SUDS Tool 34. This encompasses the standard approach to appraising flood risk in the UK (as defined in the Multi-Coloured Manual Handbook35).
16 Selection and grouping of BG solutions for the cost-benefit analysis
Finally, the project explored potential funding mechanisms to promote the wider uptake of BG solutions in London.
Main Outcomes
The economic viability of BG solutions increases considerably when wider benefits are considered: for the case study area, compared to flood-risk benefit estimations only, they increased the value of the benefits provided by the selected options by 60 per cent to 184 per cent.
The pathway towards wider scale BG solutions retrofit in London is to “cost-share” i.e. split the
investment costs among multiple stakeholders (including critical infrastructure owners) by highlighting the additional services provided to each stakeholder (info box).
17
t2
Benefits breakdown per stakeholder group
Cost effectiveness of BG solutions – flood only vs. wider benefits comparison
Catchment - scale solution
BGS 1
BGS 4
BGS 5
BGS 2
BGS 3
· Infiltration Strips· Urban Wetland· Ranwater tank at golders Green Station
· Infiltration Strips· Bio-swale· Roof disconnection
· East pond· West pond
Policestationdetailedsolution
OPTIONS FLOOD-ONLY BENEFITS COST RATIO
WIDER BENEFITSCOST RATIO
INCREASE OF BCR WHEN INCLUDING WIDER BENEFITS
BG-S 1
BG-S 2
BG-S 3
BG-S 4
BG-S 5
0.32
0.66
0.64
0.47
0.65
0.91
1.06
1.82
0.97
1.46
184%
60%
184%
106%
125%
100%
35%
84%
184% increase in economic value of SUDS benefits can be achieved if wider benefits are included in analysis.
35% of total BG solution benefits can be related to commercial sector and infrastructure owners

34 35Blue Green Solutions Guide
Case study 3: Budapest City Park (Varos Liget)Use of the BG systems approach to create a closed loop, zero waste, urban metabolism for a mixed use district and park.
Background
The Budapest City Park area covers approximately 100 hectares. Within its perimeter it hosts restaurants and a number of institutions: a thermal bath, city-zoo, hospital, and several museums. The area is being redeveloped, with key aims being to significantly reduce water & energy consumption and waste generation, and to increase annual visitor numbers (approximately 2 million at the time of the study) to 4 million by 2019.
BG Systems Approach
Main Outcomes
Key figures
For this project, the local BG Team (Biopolus) developed and applied a Metabolic Mapping Methodology. This involves the systematic analysis of water, energy and waste flows (inputs and outputs) for the park, taking into account daily and seasonal variations. The “metabolic”, i.e. material/energy transformation processes, covered bioenergy, waste heat, material, and water recovery.
The integrated waste and energy recycling solution developed delivers potential water savings of 95 per cent, organic waste reductions of 65 per cent, and a thermal energy recovery of up to 12 megawatts (MW) or 35 per cent. The overall payback period is potentially less than 6 years with respect to the cost of the infrastructure.
Aerial view and location map of the Budapest City Park18
19 Schematic of the Urban Metabolic flow.
Energy
Organic
Water
Heat recoveryBioenergy recovery
Primary energy
Primary energy
WasteWastewaterWater products
Products
Losses
Drinking water
Fresh materials
Fresh water
Rain water
Materials recovery
Water recycling

36 37Blue Green Solutions Guide
Case study 4: Marlowe road, London Applying the BG systems approach to maximise energy efficiency and human comfort for a residential district.
Background
The architectural practice Pollard Thomas Edwards (PTE) was commissioned to complete the concept design for the master plan of a new, 41,000 m2 residential area in London. The plan’s aim was to demonstrate how integrated BG solutions can be employed to deliver a traditionally planned neighbourhood with a premier 21st century sustainability level. Key Performance Indicators for the design included urban heat island mitigation, low building energy consumption, enhanced outdoor microclimate, indoor comfort and the efficient use of water.
BG Systems Approach
The BG Team scoped and assessed design options via the use of the GDPM (see page 24). The preliminary analysis identified potentially useful interactions that could be exploited to inform the positioning of buildings and trees and the design of building envelope shading, materialisation and storm water management facilities.Trees were selected and positioned to 1) facilitate adiabatic cooling (along the predominant direction of the summer winds); 2) shade the building envelopes; and 3) mitigate heat island effects. Orientation and spacing of housing units was adjusted to enhance wind effects throughout the site by disconnecting them at strategic points to avoid wind blocking. This invention not only enhances natural cooling of the site through modifying the microclimate, but also by increasing convective heat transfer from the buildings. The
result is an improvement of both the outdoor and indoor comfort during the summer period. Enhanced storm water management was achieved by tailoring the street design to facilitate better drainage, and harvested water was used for watering of the plants. Some of the buildings were designed with roof gardens that feature community gathering points
Main Outcomes
Applying the BG systems approach yielded a solar load reduction of 38.0 per cent, transmission reduction 16 per cent, a heat island effect reduction of 32.5 per cent and an outdoor microclimate reduction of 3.5 ⁰C for summer temperatures, relative to a standard development. As a result, the buildings’ summer energy consumption was reduced by 24 per cent. Moreover, these above benefits were realised without incurring substantial additional costs.
Key figures (graphic presentation)
Reduction of solar radiation on building envelope
Positioning of trees on south facades of buildings
20
21

38 39Blue Green Solutions Guide
Case study 5: City of ŠabacApplication of the BG systems approach to the conception of a Master Plan for the regeneration of an entire city.
Background BG Systems Approach
Šabac (population 80,000) is a city in central Serbia. Situated close to three national borders and with two main highways in its vicinity, it has a long tradition of being a centre of trade. The city’s government is pursuing an urban regeneration agenda, as part of which they have enlisted the BG Systems approach to produce a visionary Master plan for the area. The aim is not only to transition to state-of-the-art urban design, but to deliver a redevelopment model (exemplar) for other towns across the region.
The BG team ran workshops to familiarise the city planning teams with the BG systems approach: especially, the Goal Driven Planning Matrix (GDPM). The city’s targets were entered into the GDPM in order to facilitate a bespoke, BG Solutions based Master plan. Public workshops were held to gather further inputs and work-up candidate design concepts, via the use of the GDPM. The conclusions of these workshops are being incorporated into final version of the Master plan ("work in progress").
Goal Driven Planning Matrix form and outline results22
Main Outcomes
The public workshops were highly valuable: they identified, for example, several new city resources that would not have been tapped into using a standard design process.
A number of BG solutions were embedded into the plans. One solution of particular interest is the multi-functional use of irrigation canals in the city and parks (Figure 23 ). In the past, they would be empty for most of the time, and so would have no aesthetic and recreational value. Under the BG Systems plan, they deliver areas for recreation, biodiversity and flood protection36.
Under dry conditions, water to the irrigation canals/streams is supplied from a shallow groundwater aquifer, driven by pumps powered by solar energy. It serves to maintain minimal water flow for supporting aquatic life throughout the year at no energy cost (Figure 23). The surrounding, vegetated floodplain area is used for recreation and to support biodiversity. Under conditions of heavy rain or high ground water level the floodplain retains its groundwater flood retention capacity. Because of the extended duration groundwater flooding, and clear water, flooded areas are used for water sport recreation activities. Thus, instead of being "reserved for flood storage" only, flood plains are converted into attractive open spaces for year round use.
23 Multi-functional use of floodplains under: a. Dry weather conditions, b. Flooding conditions
1. CITY INNOVATIVE DEVELOPMENT PLAN
3. SOCIALLY BALANCED 4. ENVIRONMENT MANAGEMENT
5. SUSTAINABILITY
7. CITY ADAPTABILITY TO WEATHER EXTREMES
9. SMART GOVERNMENT
11. CITY STRATEGY IMPELMENTATION MONITORING AND MANAGEMENT PLAN
CITY GOALSAgreed with
Mayor’s team
TARGETSFOR EACH GOAL
FUNCTIONS& CONCEPTS/ INDICATORS
CITY FACILITIES / BG ANALYSIS
6.1. Selection of city industries based on specific, agreed criteria
6.3. Create integrated food production
6.4. Create particular economy orientated education
6. COMPETITIVE ECONOMY
8. REPLICABILITY
10. AVOID SHOCKS
2. QUALITY OF LIFE
WOR
K IN
PRO
GRES
S
6.2. Identity specific resources of the location for the development of specific industry.
1. Geographic location (trade)2. Sustainable energy resources (geothermal energy)3. Undeveloped land (strong real estate potential)4a. A tradition of local craftmanship and entrepreneurship4b. A tradition of industrial manufacturing5. Developed industries 6. Already established infrastructure, large working areas7. Brownfield locations8. Planning documentation9. Data on number of citizens and their education structure10. Educational structure of existing professors in local schools11. Already started refurbishment of city port on river Sava12. Planned construction of intermodal terminal and logistic centre.13. Data on the quantity and quality of free land owned by the city.14. Resources for tourism
a
b
Solar powered pump for groundwater abstraction

40 41Blue Green Solutions Guide
Case study 6: Imperial College LondonMonitoring and modelling of the operational performance of BG solutions at the level of an individual building.
Background
BG Systems Approach
Main Outcomes
Monitoring and modelling the performance of BG solutions is crucial to: 1) quantify the difference between their actual and potential (design) performance; and 2) optimise their design to maximise their benefits. At Imperial College London, a living lab (Figure 25) has been established, focussed around three multifunctional green roof plots, for measuring and modelling the water-energy interactions outlined in Chapter 4.
The data collected was used to create new, or improve existing water and energy balance models, for describing the interaction of the multifunctional roof with its environment. Precipitation, runoff and temperature data were used to assess/model benefits of green roof plots. These benefits comprise reduction of flood risk due to delayed, reduced peak storm water runoff and cooling due to transpiration by plants and related evaporative processes. In addition to analysing observed data, the evaporative cooling of roof plots was investigated using simulation tools of varying complexity: 1) the Improved water balance (hydrologic) model 37; 2) an Urban Energy Balance model38; and 3) Large Eddy Simulation (LES)39. Furthermore, the monitoring results are currently used for development and testing of a Blue Green module for a Building Information Management (BIM) software system 40
Water retention capacity was assessed for the three experimental green roof plots, of which two are extensive (A – 70/25mm and B – 70/32mm substrate/drainage layer depths, respectively) and one is intensive (C – 150/45 mm substrate/drainage layer depth). Observed data showed that for the London climate, rainwater retention is high (>45 per cent of incoming rainfall captured), with intensive green roofs retaining as much as 82 per cent of rainwater. In addition, the high temporal resolution of the logged data (i.e. measurements are recorded at frequent intervals over each hour of operation) enables the modelling of multifunctional roof dynamics, which is important for analysis of flood management processes.
The simulations of the evaporative cooling effect of the green roofs using the Urban Energy Balance model41, showed that the cooling effect of the roof surfaces in summer is considerable. Vegetated surfaces are 10°C colder than a conventional roof on a daily mean, and up to 30°C colder during the hottest hours. The heat transfer through green roof is thus reduced considerably compared to a conventional roof, leading to substantial energy savings due to reduced demand for air conditioning and ventilation.
The roof is equipped with instruments to measure weather conditions rainfall water quality runoff soil moisture and soil and roof temperature
Multifunctional roof plots on the Eastside building at Imperial College London.
Cumulative rainfall (in black) and runoff for the roof plots during the year 2015
24
25
1
2
5
6
3
4
1 2
3 4 65
..............................................................................................................................
..............................................................................................................................
..............................................................................................................................
..............................................................................................................................
800
400
0 Jan DecJun / Jul
Average annual water retention [%]
46%
- Green roof A - 70/25mm- Green roof B - 70/32mm - Green roof C - 150/45mm
59%
82%
A
*
B
C
A*B C
- Conventional roof
Cumulative run-off [mm]

42 43Blue Green Solutions Guide
Bridging the Information Gap: the BG Team
Blue-Green (BG) Solutions, if planned and implemented in sympathy with their surroundings, are transformative for the resilience, resource efficiency and quality of life of the host city and its overall sustainability. In this guide we have presented the innovative, BG Systems planning framework for systematically integrating BG Solutions with the cityscape to maximise both their benefits and their cost-effectiveness. Our case studies illustrate the added value that the BG systems approach brings to different urban contexts. Key conclusions are:
The systematic incorporation of BG solutions into urban plans yields substantial reductions in life-cycle costs (case studies 1, 2, 3, 4, 5).
Through mapping and unlocking potential synergies with the local built environment, the BG Systems approach ensures that BG Solutions provide cost effective, sustainable enhancements to quality of life and resilience to extreme weather events (case studies 1, 2, 3, 4, 5).
The added value of the BG Systems approach is fully realised through looking beyond the principal purpose of BG Solutions installations to embrace their wider (co-) benefits – e.g. wellbeing improvement (case study 2).
Stakeholder consultation and engagement is crucial to maximising effectiveness of BG Solutions (case studies 1, 2, 3, 4, 5).
Continuous monitoring of installed BG Solutions is playing a crucial role in building an evidence-base for the effectiveness of their ecosystem service derived benefits (case study 6).
The BG Systems approach primarily realises the potential of BG Solutions via its reconceptualization of the planning and design process. BG Solutions are inherently cross-sectorial. To optimise their benefits, it is therefore necessary to conduct an extensive, systems-level analysis at the pre-design stage. This analysis presents two challenges: firstly, there needs to be a driver/incentive for carrying it out and secondly, assigning responsibility for this task.
The driver for this pre-design analysis is saving costs, improving sustainability and boosting resilience. The analysis itself involves full life-cycle analyses of the design/planning options. As described on page 24, the Goal Driven Planning Matrix (GDPM) has been developed to aid this process. However, to deliver maximum benefits, client and stakeholder requirements both need to be mapped and aligned. This is a radical component of the BG Systems approach, termed the BG Design Brief.
The key innovation here – apart from the tools described in Chapters 3 and 4 – is the introduction of a new participatory group in the
6. Outlook

44 45Blue Green Solutions Guide
design process: the BG Team. This is a group of experts responsible for leading the pre-design analysis. A key role of theirs is to exploit beneficial interactions between the various disciplines present in the planning team and especially, bridge information gaps within the planning team.
Retrofit
Cities are largely undergoing continual expansion and regeneration. The majority of the built environment however - especially in Europe - that will be present in 2050 has already been built. Existing, especially 19-20th century building stock, is typically less energy efficient and resilient than new-build. In order, therefore, to meet stringent carbon emission reduction targets, and protect against climate change, the focus must be on upgrading and enhancing existing building stock. A big need for the BG Systems approach is therefore within the retrofit sector.
Legislation for Urban Sustainable Development
The most effective means for expediting a BG systems paradigm shift is, without doubt, enhancing and implementing planning standards and legislation that fosters or even mandates resource efficient practices. Possible interventions include:
Requiring additional analyses for project approval – e.g. cost dependence analysis (Page 31).
Upgrading compliance criteria. National, regional and city building regulations can be revised to tighten minimum compliance criteria relevant to resource efficiency, resilience to extreme weather events and quality of life.
Revision/supplementation of certification schemes. This involves introducing performance criteria specific to BG Solutions and stipulating post-construction performance monitoring and approval.
Ideally, environmental (BG Systems specific) quality standards should be factored into national and local governments’ key performance indicators for the attainment of international standards and targets such as the Sustainable Development Goals. It is vital also to recognize that the higher the level at which action is taken, the larger the change will be (Figure 7– downward triangle). Hence, for a Blue Green revolution to drive the envisioned reimagining of our cities, policy and law makers operating at national and international levels need to be engaged.
The Need for Post-Construction Monitoring
Changes in legislation and standard practice require a strong evidence base. The cases presented here and in other guides provide a starting point, but there is a need for extensive evidence collection from full-scale developments that feature BG Solutions at global scale. This data is a potent means of dispelling some of the myths surrounding Blue Green Solutions (e.g. that they are not cost-effective, especially for developers) and aiding the accurate calculation of the benefits and cost-savings that they deliver to all stakeholders.
Final Remarks
There is a broad and growing consensus that BG solutions have the potential to mitigate many current and future urban pressures. Achieving this potential requires multi-sector, systematic
planning and detailed analysis of interactions between all components of a cityscape to identify the most cost-effective, sustainable interventions. The BG Systems approach facilitates this process, across different climates and types of cities.
This guide is a call for the joined-up thinking and holistic, rigorous analyses pioneered by the BG Systems approach, to futureproof our cities and deliver an urban environment that is truly liveable.

46 47Blue Green Solutions Guide
References
1. Barata, M., E. Ligeti, G.D. Simone, T. Dickinson, D. Jack, J. Penney, M. Rahman, and R. Zimmerman, Climate change and human health in cities. Climate Change and Cities: First Assessment Report of the Urban Climate Change Research Network. Cambridge University Press, Cambridge, UK, 2011.2. United Nations Department of Economic, Social Affairs, Population Division, World Urbanization Prospects: The 2014 Revision. (ST/ESA/SER.A/366), 2015.3. United Nations Human Settlements Programme, Global report on human settlements 2011 - Cities and climate change. 2011.4. IFRC, World Disasters Report 2010: Focus on Urban Risk. International Federation of Red Cross and Red Crescent Societies (IFRC), Geneva, Switzerland, 211 pp, 2010.5. Heaviside, C., S. Vardoulakis, and X. Cai, Attribution of mortality to the urban heat island during heatwaves in the West Midlands, UK. Environmental Health, 2016.6. Revi, A., D.E. Satterthwaite, F. Aragón-Durand, J. Corfee-Morlot, R.B.R. Kiunsi, M. Pelling, D.C. Roberts, and W. Solecki, Urban areas. In: Climate Change 2014: Impacts, Adaptation, and Vulnerability. Part A: Global and Sectoral Aspects. Contribution of Working Group II to the Fifth Assessment Report of the Intergovernmental Panel on Climate Change. Cambridge University Press, Cambridge, United Kingdom and New York, NY, USA, 2014.7. ARUP, Cities Alive - Green Building Envelope. 2016.8. UK Green Building Council, Demystifying Green Infrastructure. 2015.9. European Commission - Environment, The Multifunctionality of Green Infrastructure. Science for Environment Policy | In-depth Reports, 2012.10. UNEP, Green Infrastructure Guide for Water Management: Ecosystem-based
management approaches for water-related infrastructure projects. (DEP/1827/NA), 2014.11. Tzoulas, K., K. Korpela, S. Venn, V. Yli-Pelkonen, A. Kazmierczak, J. Niemela, and P. James, Promoting ecosystem and human health in urban areas using Green Infrastructure: A literature review. Landscape and urban planning, 2007.12. Maksimović, Č., M. Kurian, and R. Ardakanian, Rethinking Infrastructure Design for Multi-Use Water Services, Springer Briefs in Environmental Science. 2015.13. businessGreen technology award 2015. R&D Programme of the Year. 2015; Available from: http://events.businessgreen.com/technologyawards/static/winners-2015.14. Cohen-Schacham, E., G. Walters, C. Janzen, and S. Maginnis, Nature based Solutions to Address Global Societal Challenges. IUCN, Gland, Switzerland, 2016.15. IUCN, The IUCN Programme 2013-2016. IUCN, Gland, Switzerland, 2012.16. Charlesworth, S.M., E. Harker, and S. Rickard, A Review of Sustainable Drainage Systems (SuDS): A Soft Option for Hard Drainage Questions? Geography, 2003. 88(2): p. 99-107.17. Wong, T.H.F., An overview of water sensitive urban design practices in Australia. Water Practice & Technology, 2006.18. Maksimović, Č., S. Stanković, R. Božović, C. Makropoulos, I. Mirosavić, and M. Mirosavić, Trends in sustainable design of future cities, Proc. of the Workshop: Cities of the Future. University of Ljubljana, Slovenia, 2014.19. Blue Green Dream. Available from: http://bgd.org.uk/.20. Gardens by the bay Available from: http://www.gardensbythebay.com.sg.21. High Line. Available from: http://www.thehighline.org/.22. Blue-Green Wave. Available from:
https://hmco.enpc.fr/Page/Blue-Green-Dream-Wave/en.23. Liget Budapest. Available from: http://www.ligetbudapest.org.24. Village Nature. Available from: http://www.villagesnature.com/.25. Curitiba. Available from: http://www.curitiba.pr.gov.br.26. Wild West End. Available from: http://www.wildwestend.london/.27. Smart Sustainable Districts. Available from: http://ssd-utrecht.nl.28. Versini, P.A., A. Gires, G. Fitton, and I. Tchiguirinskaia, Schertzer, D., ENPC Blue Green Wave : a Blue Green Dream pilot site to assess spatio-temporal variability of hydrological components in green infrastructures. Urban Water Journal, 2016(under review).29. Rozos, E., C. Makropoulos, and Č. Maksimović, Rethinking urban areas: an example of an integrated blue-green approach, Water Science and Technology. Vol. Water Supply, November 2013, 13 (6) 1534-1542. 2013: IWA Publishing.30. Akbari, H., Shade trees reduce building energy use and CO2 emissions from power plants. Environmental Pollution, 2002. 116, Supplement 1: p. S119-S126.31. IPCC, Summary for policymakers. In: Climate Change 2014: Impacts, Adaptation, and Vulnerability. Part A: Global and Sectoral Aspects. Contribution of Working Group II to the Fifth Assessment Report of the Intergovernmental Panel on Climate Change. Cambridge University Press, Cambridge, United Kingdom and New York, NY, USA, 2014.32. United Nations Secretary-General. Climate Resilience Initiative A2R — Anticipate, Absorb, Reshape. Available from: http://www.a2rinitiative.org/.33. Environmental Agency UK. Flood Risk Management. Available from: https://www.
gov.uk/government/collections/flood-risk-management-plans-frmps-2015-to-2021.34. Ciria - susdrain. Available from: http://www.susdrain.org/.35. Multi-Coloured Handbook. Available from: http://www.mcm-online.co.uk/manual/.36. Maksimović, Č. and B. Jandrić, Interactions of Flood Management and Innovative Spatial Planning (interakcije upravljanja poplavama i novih metoda prostornog planiranja). 2014, UNPDP BiH project.37. Liu, X., A. Mijic, and Č. Maksimovic, A conceptual model for simulating the hydrologic performance of extensive green roof systems, in The seventh international conference for SuDBE2015. 2015: Reading.38. Lemonsu, A., V. Masson, L. Shashua-Bar, E. Erell, and D. Pearlmutter, Inclusion of vegetation in the Town Energy Balance model for modelling urban green areas. Geosci. Model Dev., 2012. 5(6): p. 1377-1393.39. Fock, B.H., RANS versus LES models for investigations of the urban climate. 2014.40. Huang, C.H., H.J. Kuo, S.H. Hsieh, and C. Maksimovic. Methodology for Collaborative Development of BIM-enabled Blue-Green Design Tools. in The Twenty-Sixth KKHTCNN Symposium on Civil Engineering. 2013. Singapore.41. Suter, I., C. Maksimovic, and M. van Reeuwijk, A neighbourhood-scale estimate for the cooling potential of green roofs. Urban Climate, 2017(under review.).

Impressum template
Name of publisher
Address
Email address and phone number or contact formIf applicable: name of company, legal form, authorized represantative
Name and place of register, place, registration number.
If applicable: VAT number or Business Identification
Where applicable: supervisory authority
For editorial content: Responsible person
www.website.com