Embed Size (px)
Citation preview
from
USDL - 7352
FOR RELEASE: 3:00 P .M .Monday, August 8, 1966
U. S. Departm ent of L abor BLS, 961 - 2634 ■THE EM PLOYM ENT SITUATION: JULY 1966
Nonfarm payroll em ploym ent continued on a strong uptrend in July, the U. So Departm ent o f Labor* s Bureau o f Labor Statistics rep orted today.
percent in July, was down sharply from a year ago but not sign ificantly changed from the May and June rates of 4. 0 percent.
Industry E m ploym ent Trends
At 63. 8 m illion in July, total nonfarm p ayroll em ploym ent was up 3.1 m illion from a year ago. P ayro ll em ploym ent, which usually d eclin es in July, was down 250, 000 from June; how ever, the reduction w as 150, 000 le s s than seasonally expected fo r this p eriod . The net im provem ent was concentrated in m isce llan eou s se rv ice s and governm ent. W ork stoppages in construction and in transportation and public u tilities w ere p r im a rily respon sib le fo r m oderate d eclin es (seasonally adjusted) in those in d ustries.
On a seasonally adjusted b a sis , m anufacturing em ploym ent was p ra c tica lly unchanged; Ju n e-to -Ju ly gains in m achinery, p rim ary m eta ls , fab ricated m eta ls , and e le c tr ic a l equipm ent w ere o ffse t by a decline in transportation equipm ent. The decline in transportation equipm ent (70, 000 seasonally adjusted) is attributable to early m odel changeovers in the autom obile industry.
While m anufacturing em ploym ent m ade the la rgest contribution (1, 050, 000) to the o v e r -th e -y e a r gain in total payroll em ploym ent, the serv ice -p rod u cin g industries continued to expand rapidly . Em ploym ent in crea ses of n early 500, 000 each w ere reco rd ed in trade and m isce llan eou s s e rv ic e s , while State and lo ca l governm ents added 575,000 jo b s .
At the sam e tim e, the unem ploym ent rate fo r all civ ilian w ork ers , at 3. 9
Digitized for FRASER http://fraser.stlouisfed.org/ Federal Reserve Bank of St. Louis
The E m ploym ent Situation Page 2August 8, 1966
An im portant feature o f the y e a r -to -y e a r in crea se in m anufacturing em ploym ent was the concentration o f gains among production w ork ers . At a lev e l of 14.1 m illion in July, production w ork er em ploym ent was up nearly 800, 000 from a year earlier,.
F a ctory H ours and Earnings
The fa ctory w orkw eek m oved down by 0. 4 hour to 410 2 h ou rs in July. A fter seasonal adjustm ent, the average w orkw eek in m anufacturing was down slightly fo r the third consecutive month but was still at a com p aratively high levelo Included in the average w orkw eek w ere 3. 7 hours o f overtim e , the highest overtim e figure fo r July since the se r ie s began in 1956. In com p arison with July 1965, the w orkw eek was up 0. 2 hour.
F a ctory w orkers* average hourly earnings edged down 1 cent to $2. 70 in July, la rge ly as a resu lt of the em ploym ent decline in the auto industry.With the d ecrea ses in both the w orkw eek and average hourly earn in gs, w eekly earnings dropped $1. 50 to $111. 25. O ver the y ea r, w eekly earnings w ere up $ 4 .2 5 . Higher hourly earnings (up 9 cents to $2. 70) accounted fo r roughly $3. 75 o f the gain, while a longer w orkw eek accounted fo r the rem ain d er.
Unem ployment
Total unem ploym ent declined seasonally by 650, 000 to 3. 2 m illion .Over the y ea r, unem ploym ent was down 400, 000, with the entire net decline among p erson s seeking fu ll-t im e jo b s . There w ere approxim ately 1.0 m illion unem ployed adult m en in J u ly --th e vast m a jority seeking fu ll-t im e w ork . A pproxim ately on e-sixth of the 870,000 unem ployed adult w om en w ere seeking p art-tim e jo b s , while 30 p ercen t of the 1.3 m illion unem ployed teenagers w ere doing so.
Unem ploym ent among nonwhites totaled 800,000 , or on e-fou rth of the unem ployed. Their jo b le s s rate o f 7 .9 percent was not sign ificantly changed from May and June but was down a fu ll percentage point from a year e a r lie r .
The unem ploym ent rate fo r teenagers, at 12. 2 percen t, w as unchanged over the month. F or adult w om en, the unem ploym ent rate was 3, 7 percent in July, down m arginally from May and June but about the sam e as in M arch and A p ril.
Unem ploym ent rates fo r m en aged 25 years and over and fo r m a rried m en ed.ged up in July fo r the second su ccess iv e m onth. These changes w ere accom panied by the third consecutive r ise in the rate fo r b lu e -co lla r w ork ers . P resu m ably , these developm ents are tied c lo se ly to the slow dow n in auto production and the ea rly m odel changeover.
Digitized for FRASER http://fraser.stlouisfed.org/ Federal Reserve Bank of St. Louis
The Em ploym ent Situation Page 3August 8, 1966
State insured unem ploym ent m oved up m ore than seasonally between June and July, advancing by 177, 000 to 963, 000o As a resu lt, the adjusted rate of insured jo b le ssn e ss m oved up from 2.1 to 20 4 percento In addition to the usual unem ploym ent among w ork ers not elig ib le fo r pay while their plants are c losed fo r vacation s, ea r lier-th a n -u su a l layoffs in autom obile plants fo r m odel changes contributed to the r is e Q
V irtually all m easu res of unem ploym ent continued to show significant im provem ent from a year e a r lie r 0 The unem ploym ent rate was down from 4. 5 to 3. 9 percento Total unem ploym ent was down by 400, 000 from July 1965, with the entire net decline among person s seeking fu ll-t im e w ork 0 M ore than half o f the reduction o ccu rred among those out of w ork 15 weeks or longer* L on g -term unem ploym ent, at 0o 6 percent of the labor fo r ce in June and July, was at its low est lev e l since January 1954* Job less rates w ere down from July 1965 fo r the m a jor a g e -se x groups and for w ork ers in m ost nonfarm occupation and industry groups*
Total Em ploym ent and Labor F o rce
At 4 m illion , total em ploym ent was up 1* 6 m illion from July 1965 and at high. Over the year there was t 2 ,2 m illion pickup innonagriao^t&r&l em ploym ent, as farm em ploym ent continued its lon g -term downtrend, Teenage em ploym ent was up $$0, 000 from a year ago.
Included in the em ploym ent total w ere 2« 2 m illion nonagricultural w ork ers on part tim e fo r econ om ic reasons* The number of these involuntary part-tim e w ork ers was down 150, 000 over the year and at its low est July leve l since 1956,
The total labor fo r c e , at 82. 8 m illion in July, was up 1* 6 m illion from a year earlier* The A rm ed F o rce s have in crea sed by about 400,000 since July 1965, while the civ ilian labor fo rce expanded by 1, 2 m illion .
* * * * *
This re lease presents and analyzes sta tistics from two m ajor surveys. Data on labor fo r ce , total em ploym ent, and unemployment are derived from the sam ple survey of households conducted and tabulated by the Bureau of the Census for the Bureau of Labor Statistics. Statistics on industry em ploym ent, hours, and earnings are co llected by State agencies from payroll re cord s of em ployers and are tabulated by the Bureau of Labor Statistics. A d escrip tion of the two surveys appears in the B L S publication Em ploym ent and E a r n i n g s and Monthly R eport on the Labor F orce .
Digitized for FRASER http://fraser.stlouisfed.org/ Federal Reserve Bank of St. Louis
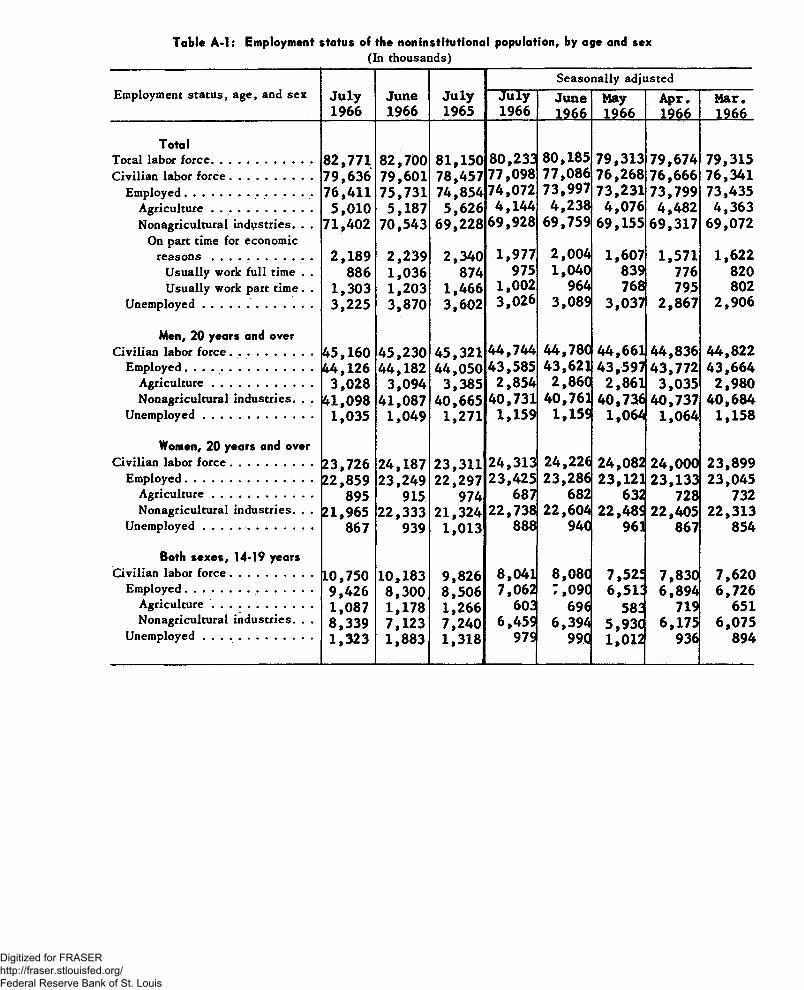
Table A -l: Employment status of the noninstitutional population, by age and sex(In thousands)
Employment status, age, and sex July1966
June1966
July1965
Seasonally adjustedJuly1966
June1966
May1966
A pr.1966
Mar.1966
TotalTotal labor force.............................. 82,771 82,700 81,150 80,233 80,185 79,313 79,674 79,315Civilian labor force......................... 79,636 79,601 78,457 77,098 77,086 76,268 76,666 76,341
Employed...................................... 76,411 75,731 74,854 74,072 73,997 73,231 73,799 73,435Agriculture.............................. 5,010 5,187 5,626 4,144 4,238 4,076 4,482 4,363Nonagricultural industries. . . 71,402 70,543 69,228 69,928 69,759 69,155 69,317 69,072
On part time for economicreasons .............................. 2,189 2,239 2,340 1,977 2,004 1,607 1,571 1,622
Usually work full time . . 886 1,036 874 975 1,040 839 776 820Usually work part time . . 1,303 1,203 1,466 1,002 964 768 795 802
Unemployed................................. 3,225 3,870 3,602 3,026 3,089 3,037 2,867 2,906
Men, 20 years and overCivilian labor force......................... 45,160 45,230 45,321 44,744 44,780 44,661 44,836 44,822
Employed...................................... 44,126 44,182 44,050 43,585 43,621 43,597 43,772 43,664Agriculture.............................. 3,028 3,094 3,385 2,854 2,860 2,861 3,035 2,980Nonagricultural industries. . . 41,098 41,087 40,665 40,731 40,761 40,736 40,737 40,684
Unemployed................................. 1,035 1,049 1,271 1,159 1,159 1,064 1,064 1,158
Women, 20 years and overCivilian labor force......................... 23,726 24,187 23,311 24,313 24,226 24,082 24,000 23,899
Employed.............................. .. 22,859 23,249 22,297 23,425 23,286 23,121 23,133 23,045Agriculture.............................. 895 915 974 687 682 632 728 732Nonagricultural industries. . . 21,965 22,333 21,324 22,738 22,604 22,489 22,405 22,313
Unemployed........... ..................... 867 939 1,013 888 940 961 867 854
Both sexes, 14-19 yearsCivilian labor force......................... 10,750 10,183 9,826 8,041 8,080 7,521 7,830 7,620
Employed................................... .. 9,426 8,300 8,506 7,062 7,09C 6 ,5 i : 6,894 6,726Agriculture.............................. 1,087 1,178 1,266 603 696 583 719 651Nonagricultural industries. . . 8,339 7,123 7,240 6,459 6,394 5,930 6,175 6,075
Unemployed ................................. 1,323 1,883 1,318 979 990 1,012 936 894
Digitized for FRASER http://fraser.stlouisfed.org/ Federal Reserve Bank of St. Louis
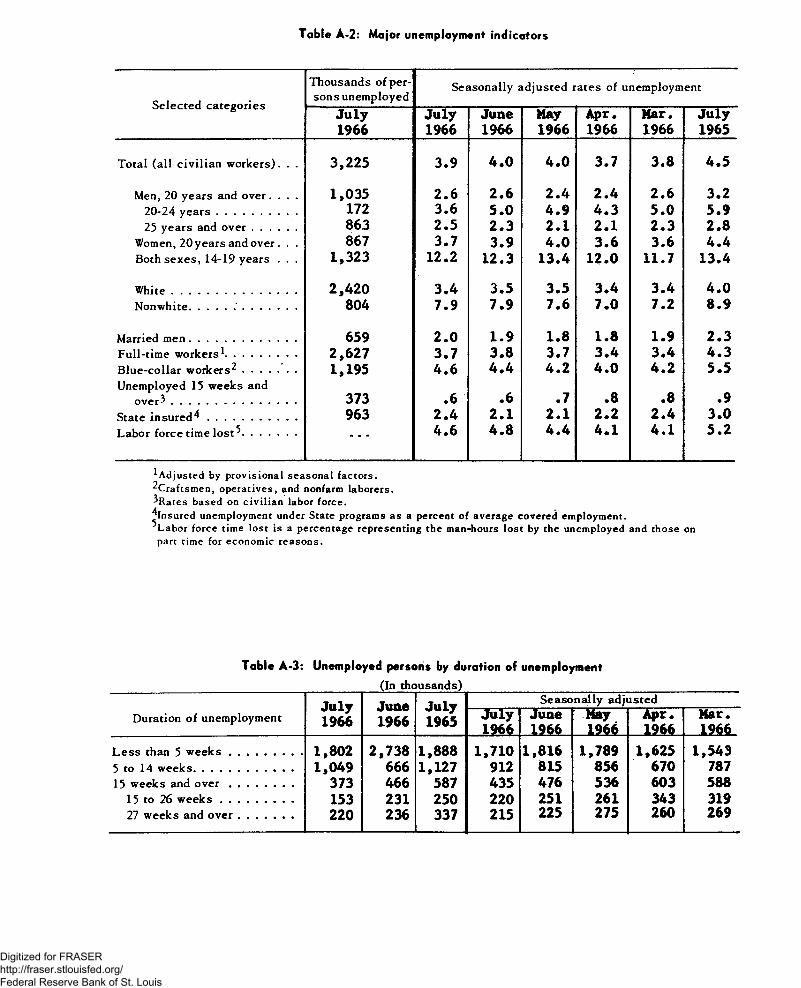
Table A-2: Major unemployment indicators
Selected categories
Thousands of persons unemployed
Seasonally aidjusted rates of unemployment
July1966
July1966
June1966
May1966
Apr.1966
Mar.1966
July1965
Total (all civilian workers). . . 3,225 3.9 4 .0 4 .0 3.7 3.8 4 .5
Men, 20 years and over. . . . 1,035 2.6 2.6 2 .4 2 .4 2.6 3.220-24 years........................ 172 3.6 5 .0 4 .9 4 .3 5.0 5.925 years and ov er ............. 863 2.5 2 .3 2.1 2.1 2 .3 2.8
Women, 20 years and over. . . 867 3.7 3.9 4 .0 3.6 3.6 4 .4Both sexes, 14-19 years . . . 1,323 12.2 12.3 13.4 12.0 11.7 13.4
White..................................... 2,420 3.4 3.5 3.5 3.4 3.4 4 .0Non white............................... 804 7.9 7.9 7.6 7 .0 7.2 8 .9
Married men................................ 659 2.0 1.9 1.8 1.8 1.9 2 .3Full-time workers1..................... 2,627 3.7 3.8 3.7 3 .4 3.4 4 .3Blue-collar workers2 ................Unemployed 15 weeks and
1,195 4 .6 4 .4 4 .2 4 .0 4 .2 5.5
over ..................................... 373 .6 .6 .7 .8 .8 .9State insured^........................... 963 2 .4 2.1 2 .1 2 .2 2 .4 3.0Labor force time lost ................ — 4.6 4 .8 4 .4 4.1 4.1 5.2
^Adjusted by provisional seasonal factors.^Craftsmen, operatives, and nonfarm laborers.^Rates based on civilian labor force.^Insured unemployment under State programs as a percent of average covered employment.^Labor force time lost is a percentage representing the man-hours lost by the unemployed and those on part time for economic reasons.
Table A-3: Unemployed persons by duration of unemployment(In thousands)
Duration of unemploymentJuly1966
June1966
July1965
Seasonally adjustedJuly1966
June1966
May1966
Apr.1966
Mar.1966_
Less than 5 w eek s...................... 1,802 2,738 1,888 1,710 1,816 1,789 1,625 1,5435 to 14 weeks. . ......................... 1,049 666 1,127 912 815 856 670 78715 weeks and o v e r ................... 373 466 587 435 476 536 603 588
15 to 26 w eek s ...................... 153 231 250 220 251 261 343 31927 weeks and ov er................ 220 236 337 215 225 275 260 269
Digitized for FRASER http://fraser.stlouisfed.org/ Federal Reserve Bank of St. Louis
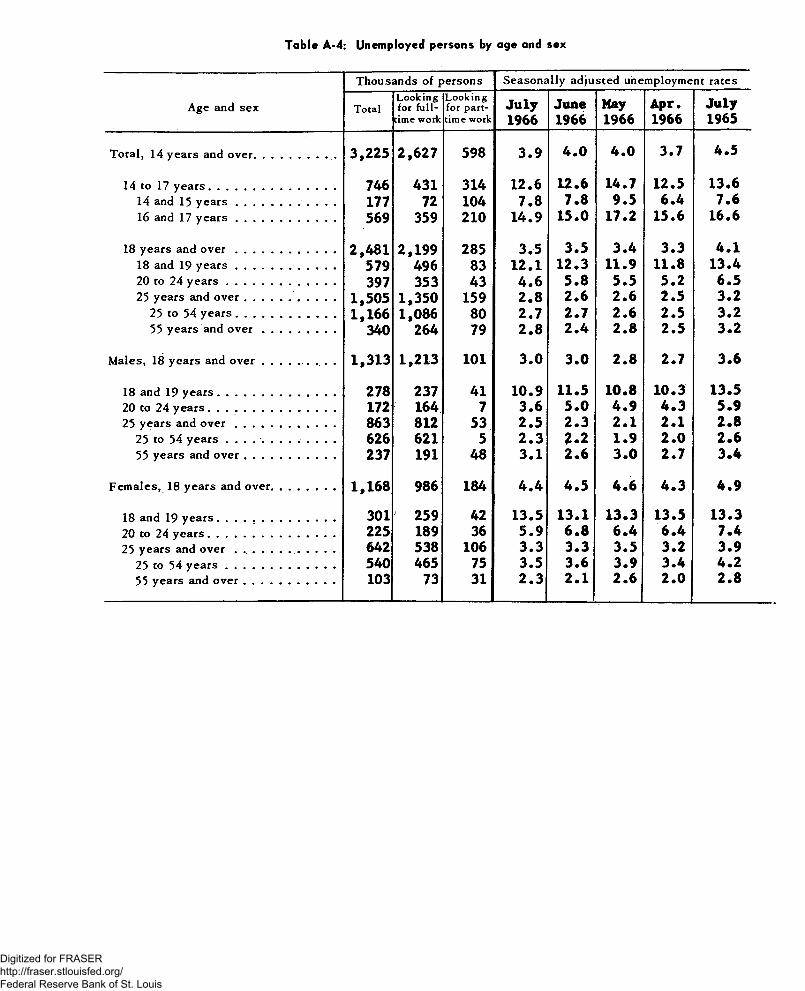
Table A-4: Unemployed persons by age and sex
Age and sex
Thousands of persons Seasonally adjusted unemployment rates
TotalLooking for hill-
time work
Looking for part- time work
July1966
June1966
May1966
Apr.1966
July1965
Total, 14 years and over............................ 3,225 2,627 598 3.9 4 .0 4 .0 3.7 4.5
14 to 17 y e a rs ........................................... 746 431 314 12.6 12.6 14.7 12.5 13.614 and 15 y e a r s ....................... . . . 177 72 104 7.8 7.8 9.5 6.4 7.616 and 17 y e a r s .................................. 569 359 210 14.9 15.0 17.2 15.6 16.6
18 years and o v e r .................................. 2,481 2,199 285 3.5 3.5 3.4 3.3 4 .118 and 19 y e a r s .................................. 579 496 83 12.1 12.3 11.9 11.8 13.420 to 24 y e a r s ..................................... 397 353 43 4.6 5 .8 5.5 5.2 6.525 years and o v e r ............................... 1,505 1,350 159 2 .8 2.6 2 .6 2.5 3.2
25 to 54 y e a rs .................................. 1,166 1,086 80 2.7 2.7 2.6 2.5 3.255 years and o v e r ......................... 340 264 79 2 .8 2 .4 2 .8 2.5 3.2
Males, 18 years and o v e r ................ 1,313 1,213 101 3.0 3.0 2 .8 2.7 3.6
18 and 19 y e a rs ............................... ... 278 237 41 10.9 11.5 10.8 10.3 13.520 to 24 y e a rs ........................................... 172 164 7 3.6 5 .0 4 .9 4 .3 5.925 years and o v e r .................................. 863 812 53 2.5 2.3 2 .1 2.1 2 .8
25 to 54 years . . . . . . . . . . . . . 626 621 5 2 .3 2.2 1.9 2 .0 2 .655 years and o v e r ............................... 237 191 48 3.1 2 .6 3 .0 2.7 3.4
Females, 18 years and over................ 1,168 986 184 4 .4 4 .5 4 .6 4 .3 4 .9
18 and 19 y e a rs ........................................ 301 259 42 13.5 13.1 13.3 13.5 13.320 to 24 y e a rs ........................................... 225 189 36 5.9 6 .8 6 .4 6 .4 7 .425 years and o v e r .................................. 642 538 106 3.3 3.3 3.5 3.2 3.9
25 to 54 y e a r s ..................................... 540 465 75 3.5 3.6 3.9 3.4 4 .255 years and o v e r ............................... 103 73 31 2 .3 2.1 2 .6 2 .0 2.8
Digitized for FRASER http://fraser.stlouisfed.org/ Federal Reserve Bank of St. Louis
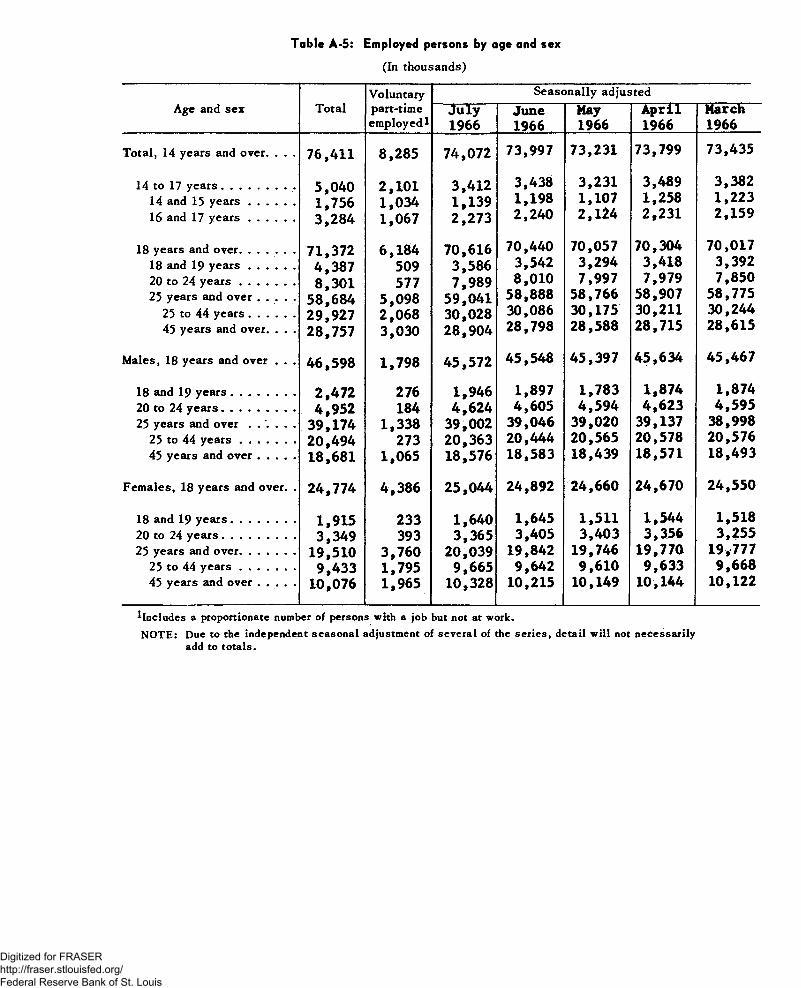
Table A-5: Employed persons by age and sex
(In thousands)
Age and sex TotalVoluntary part-time employed I
Seasonally adjustedJuly1966
June1966
May1966
April1966
March1966
Total, 14 years and over. . . . 7 6 ,4 1 1 8 ,2 8 5 7 4 ,0 7 2 7 3 ,9 9 7 7 3 ,2 3 1 73 ,7 9 9 7 3 ,4 3 5
14 to 17 years...................... 5 ,0 4 0 2 ,1 0 1 3 ,4 1 2 3 ,4 3 8 3 ,2 3 1 3 ,4 8 9 3 ,3 8 214 and 15 y e a rs .............. 1 ,7 5 6 1 ,0 3 4 1 ,1 3 9 1 ,1 9 8 1 ,1 0 7 1 ,2 5 8 1 ,2 2 316 and 17 y e a rs .............. 3 ,2 8 4 1 ,0 6 7 2 ,2 7 3 2 ,2 4 0 2 ,1 2 4 2 ,2 3 1 2 ,1 5 9
18 years and over................ 7 1 ,3 7 2 6 ,1 8 4 7 0 ,6 1 6 7 0 ,4 4 0 7 0 ,0 5 7 7 0 ,3 0 4 7 0 ,0 1 718 and 19 y e a rs .............. 4 ,3 8 7 509 3 ,5 8 6 3 ,5 4 2 3 ,2 9 4 3 ,4 1 8 3 ,3 9 220 to 24 years . . . . . . . 8 ,3 0 1 577 7 ,9 8 9 8 ,0 1 0 7 ,9 9 7 7 ,9 7 9 7 ,8 5 025 years and ov er ........... 5 8 ,6 8 4 5 ,0 9 8 5 9 ,0 4 1 5 8 ,8 8 8 5 8 ,7 6 6 5 8 ,9 0 7 5 8 ,7 7 5
25 to 44 years.............. 2 9 ,9 2 7 2 ,0 6 8 3 0 ,0 2 8 3 0 ,0 8 6 3 0 ,1 7 5 3 0 ,2 1 1 3 0 ,2 4 445 years and over. . . . 2 8 ,7 5 7 3 ,0 3 0 2 8 ,9 0 4 2 8 ,7 9 8 2 8 ,5 8 8 2 8 ,7 1 5 2 8 ,6 1 5
Males, 18 years and over . . . 4 6 ,5 9 8 1 ,7 9 8 4 5 ,5 7 2 4 5 ,5 4 8 4 5 ,3 9 7 4 5 ,6 3 4 4 5 ,4 6 7
18 and 19 years................... 2 ,4 7 2 276 1 ,9 4 6 1 ,8 9 7 1 ,7 8 3 1 ,8 7 4 1 ,8 7 420 to 24 years...................... 4 ,9 5 2 184 4 ,6 2 4 4 ,6 0 5 4 ,5 9 4 4 ,6 2 3 4 ,5 9 525 years and over . . . . . . 3 9 ,1 7 4 1 ,3 3 8 3 9 ,0 0 2 3 9 ,0 4 6 3 9 ,0 2 0 3 9 ,1 3 7 3 8 ,9 9 8
25 to 44 y e a rs ................. 2 0 ,4 9 4 273 2 0 ,3 6 3 2 0 ,4 4 4 2 0 ,5 6 5 2 0 ,5 7 8 2 0 ,5 7 645 years and over ........... 1 8 ,6 8 1 1 ,0 6 5 1 8 ,5 7 6 1 8 ,5 8 3 1 8 ,4 3 9 1 8 ,5 7 1 1 8 ,4 9 3
Females, 18 years and over. . 2 4 ,7 7 4 4 ,3 8 6 2 5 ,0 4 4 2 4 ,8 9 2 2 4 ,6 6 0 2 4 ,6 7 0 2 4 ,5 5 0
18 and 19 years................... 1 ,9 1 5 233 1 ,6 4 0 1 ,6 4 5 1 ,5 1 1 1 ,5 4 4 1 ,5 1 820 to 24 years...................... 3 ,3 4 9 393 3 ,3 6 5 3 ,4 0 5 3 ,4 0 3 3 ,3 5 6 3 ,2 5 525 years and over. . . * . . . 1 9 ,5 1 0 3 ,7 6 0 2 0 ,0 3 9 1 9 ,8 4 2 1 9 ,7 4 6 1 9 ,7 7 0 1 9 ,7 7 7
25 to 44 y e a rs ................. 9 ,4 3 3 1 ,7 9 5 9 ,6 6 5 9 ,6 4 2 9 ,6 1 0 9 ,6 3 3 9 ,6 6 845 years and ov er ........... 1 0 ,0 7 6 1 ,9 6 5 1 0 ,3 2 8 1 0 ,2 1 5 1 0 ,1 4 9 1 0 ,1 4 4 1 0 ,1 2 2
^Includes a proportionate number of persons with a job but not at work.NOTE: Due to the independent seasonal adjustment of several of the series, detail will not necessarily
add to totals.
Digitized for FRASER http://fraser.stlouisfed.org/ Federal Reserve Bank of St. Louis
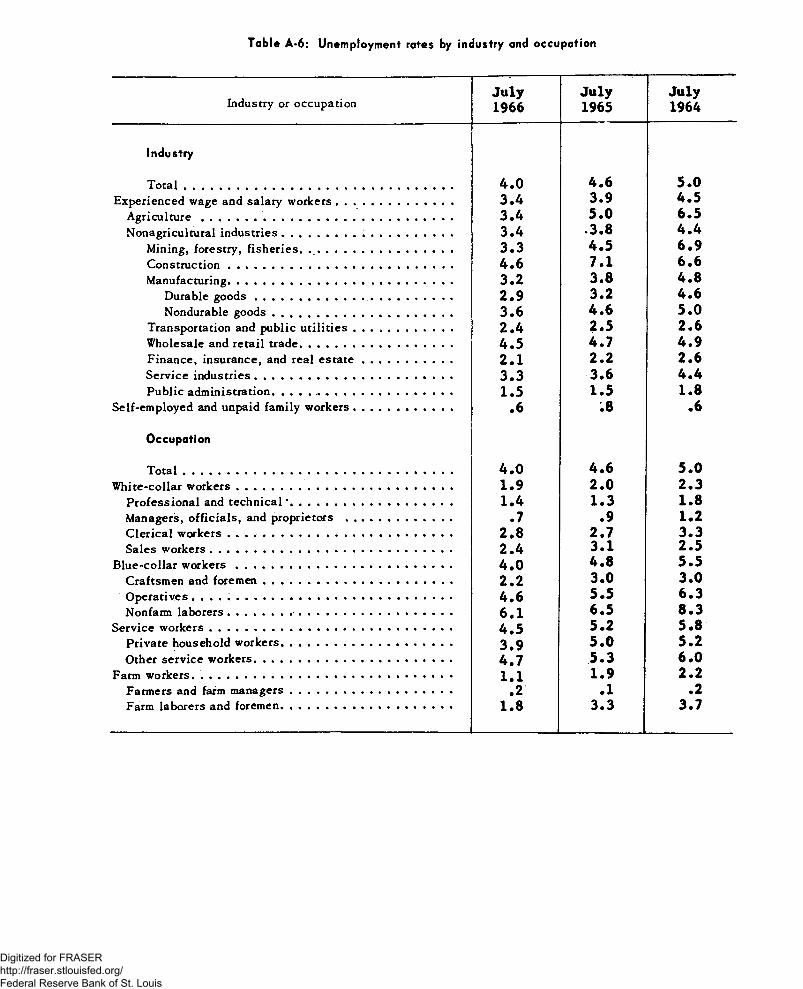
Table A-6: Unemployment rates by industry and occupation
Industry or occupationJuly1966
July1965
July1964
Industry
Total ................................................................................. 4.0 4 .6 5*0Experienced wage and salary workers ................................... 3.4 3.9 4*5
Agriculture................ .......................................................... 3.4 5 .0 6*5N onagri cultural industries. ................... .. .......................... 3.4 .3.8 4 .4
Mining, forestry, fisheries. ........................................... 3.3 4 .5 6 .9Construction................................................................... 4.6 7.1 6.6Manufacturing................ .. ..................... ....................... . 3.2 3.8 4 .8
Durable g o o d s ................................ ......................... 2.9 3.2 4.6Nondurable good s...................................................... 3.6 4 .6 5.0
Transportation and public utilities .............................. 2.4 2.5 2.6Wholesale and retail trade.............................................. 4.5 4.7 4 .9Finance, insurance, and real e s ta te ........................... 2.1 2.2 2.6Service industries...................... ..................................... 3.3 3.6 4 .4Public administration........... .. ....................................... 1.5 1.5 1.8
Self-employed and unpaid family workers .............................. .6 .8 .6
Occupation
T ota l................................................................................. 4.0 4 .6 5 .0White-collar workers ................................................................. 1.9 2 .0 2 .3
Professional and technical*. .............................................. 1.4 1.3 1.8Managers, officials, and proprietors ................................ .7 .9 1.2Clerical workers ................................................................... 2.8 2.7 3 .3Sales workers......................................................................... 2.4 3 .1 2.5
Blue-collar w orkers................................................................ 4 .0 4 .8 5 .5Craftsmen and foremen........................... ............................. 2.2 3.0 3.0Operatives .............................................................................. 4.6 5.5 6 .3Non fa mi laborers................... ................................................ 6.1 6.5 8 .3
Service workers................... .................................................... 4 .5 5 .2 5 .8Private household workers................................................... 3.9 5 .0 5.2Other service workers........................................................... 4.7 5 .3 6 .0
l . l 1.9 2.2Farmers and farm managers ................................................. .2 .1 .2Farm laborers and foremen................................................... 1.8 3 .3 3.7
Digitized for FRASER http://fraser.stlouisfed.org/ Federal Reserve Bank of St. Louis
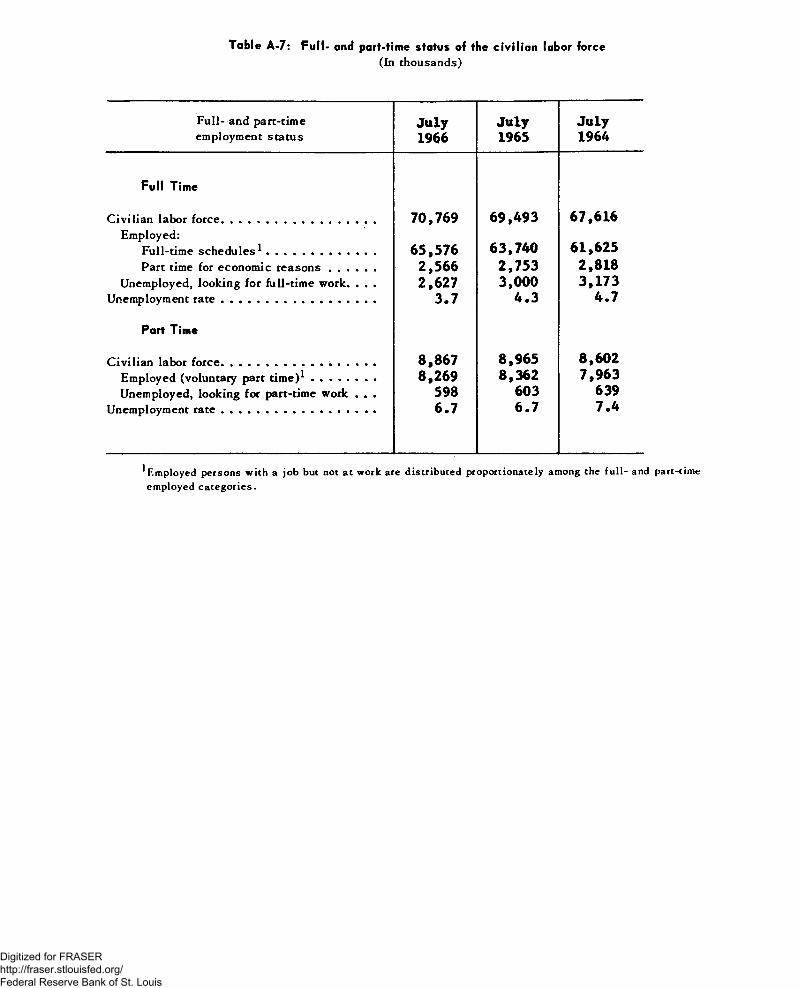
Table A-7: Full- and part-time status of the civilian labor force(In thousands)
Full- and part-time employment status
July1966
July1965
July1964
Full Time
Civilian labor force.......................... ..................Employed:
Full-time schedules1 .................................Part time for economic reasons..............
Unemployed, looking for full-time work. . . . Unemployment rate..............................................
70,769
65,5762,5662,627
3.7
69,493
63,7402,7533,000
4 .3
67,616
61,6252,8183,173
4.7
Part Time
Civilian labor force. ...........................................Employed (voluntary part time)1 ...................Unemployed, looking for part-time work . . .
Unemployment rate........... .. .................. .. • • • •
8,8678,269
5986.7
8,9658,362
6036.7
8,6027,963
6397.4
* Employed persons with a job but not at work are distributed proportionately among the full- and part-time employed categories.
Digitized for FRASER http://fraser.stlouisfed.org/ Federal Reserve Bank of St. Louis
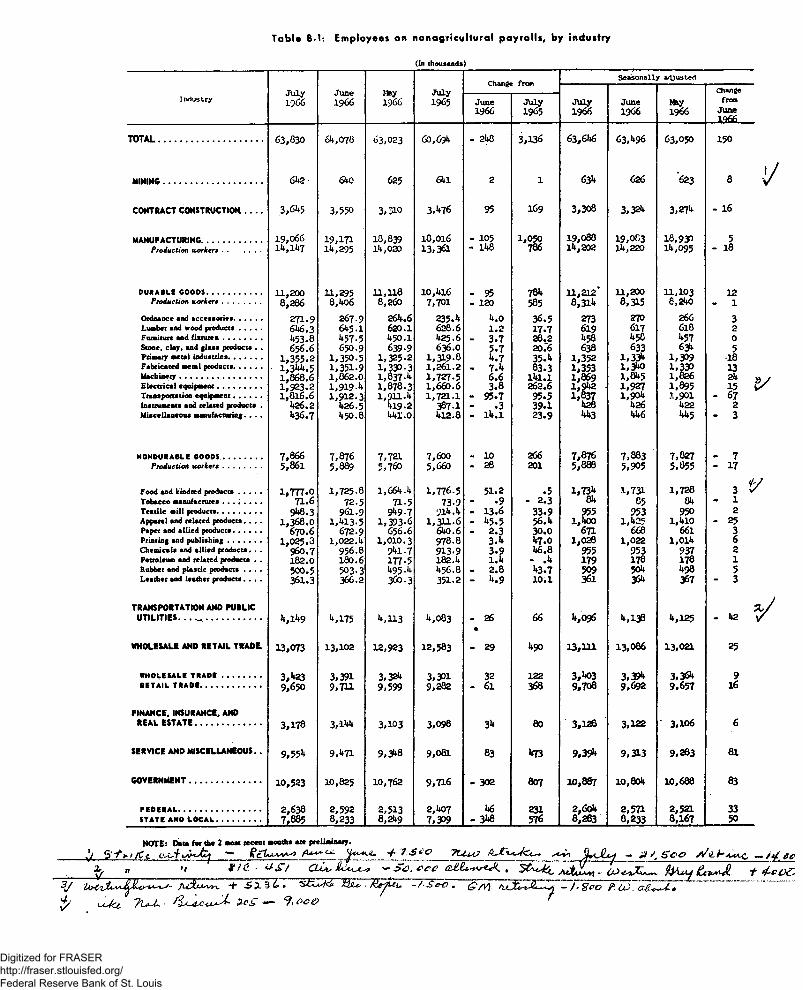
Table B-1: Employees on nonagricu ltural payro lls, by industry
(In thousands)
Industry
1:1 J u n e
1 9 6 6May1 9 6 6
J u ly1965
Change fromSeason a lly ad justed
J u l y1966
11 May1966
Changefrom
J u n e1066
II J u l y1 9 ^ 5
TOTAL.................................... 63,830 6 k , 078 6 3 ,0 2 3 60, 691* - 2*8 3 ,1 3 6 63, 61*6 6 3 ,* 9 6 6 3 ,0 5 0 150
M IN IN G ........................................................... 6* 2 61*0 6 2 5 61*1 2 1 63* 626 6 2 3 8 yC O N T R A C T C O N S T R U C T IO N .______ 3,61*5 3 ,5 5 0 3 ,3 1 0 3,1*76 9 5 1 6 9 3 ,3 0 8 3 ,3 2 * 3 ,2 7 * - 1 6
M A N U FA C TU R IN G .................................... 19,066 1 9 ,1 7 1 18,839 l G , 0l 6 - 1 0 5 1 , 0rt919,088 1 9 ,0 0 3 1 8 ,9 3 0 5
Production 1corkers . . 1 * ,1 * 7 1** ,2 9 5 I k , 020 1 3 ,3 6 1 - I k 8 786 l k , 202 1*,220 l * , 0 9 5 « 1 8
DURABLE GOODS............................... 11,200 1 1 ,2 9 5 11,118 10, 1*16 - 95 781* 11 , 212’ 11,200 11,103 12Production workers ...................... 8;286 8, 1*06 8,260 7 ,7 0 1 - 120 5 85 8 ,3 1 * 8 ,3 1 5 6, 2*0 - 1
Ordnance and a ccessories. . . . . . 2 7 1 .9 2 6 7 -9 26*.6 2 3 5 . 1* 1*.0 3 6 .5 2 7 3 270 266 3Lumber and wood p ro d u c ts ............. 6*6.3 61*5-1 620.1 628.6 1.2 1 7 . 7 619 6 1 7 610 2Furniture and fix tu re s ...................... 1*53 .8 1*57.5 1*50.1 1*25.6 - 3 . 7 28.2 *58 * 5 0 * 5 7 0Stone, clay , and glass products . . 656.6 650.9 639.9 636.0 5 - 7 20.6 638 6 3 3 6 3 * 5Primary metal industries................... 1 ,3 5 5 . 2 1 ,3 5 0 - 5 1 ,3 2 5 . 2 1 , 3 1 9 - 8 k .7 35.1* 1 ,3 5 2 1 ,3 3 * 1 ,3 0 9 •18Fabricated metal products................ 1 , 31*1*. 5 1 , 3 5 1 - 9 1 ,3 3 0 - 3 1 , 261.2 - 7 . * 8 3 . 3 1 ,3 5 3 l , 3 * o 1 ,3 3 0 1 3M achinery.............................................. 1 , 868.6 1 , 862.0 1 , 837. 1* 1 ,7 2 7 . 5 6.6 1* 1.1 1,869 1 ,8 * 5 1,826 2*Electrical equipm ent......................... 1 ,9 2 3 . 2 1 , 919. 1* 1 , 878.3 1 , 660.6 3 . 8 262.6 1 , 9 * 2 • 1 ,9 2 7 1 ,8 9 5 1 5 1 /Transportation equipm ent................ 1 , 816.6 1 , 9 1 2 . 3 1 ,9 1 1 -1 * 1 ,7 2 1 . 1 - 9 5 . 7 9 5 .5 ! , 8 3 7 1 , 9 0 * 1 ,9 0 1 - 67Instruments and related products . 1*26.2 1*26.5 U19.2 3 8 7 .1 . 3 3 9 . 1 1*28 *26 *22 2M iscellaneous aumufacturing. . . . 1*36 .7 1*50 .8 1*1*1.0 1*12.8 - l * . l 2 3 . 9 1*1*3 *1*6 **5 - 3
NONDURABLE GOODS...................... 7,866 7 ,8 7 6 7,721 7,600 - 10 266 T ,8 7 6 7 ,8 8 3 7 ,8 2 7 - 7Production workers ..................... 5,861 5 ,8 8 9 5,760 5,660 - 28 201 5,888 5 ,9 0 5 5 ,8 5 5 - 1 7
Food and kindred p ro d u c ts ............. 1 , 7 7 7 . 0 1 , 725.8 1,661*.1* 1 ,7 7 6 . 5 5 1 .2 . 5 1 ,7 3 1 1,728 3 VT obacco manufactures . . . . . . . . 71.6 7 2 .5 7 1 .5 7 3 * 9 •9 - 2 . 3 8>» 0 5 8* - 1T extile mill products. ...................... 9W .3 961.9 9 * 9 - 7 911*. k - 13.6 33.9 9 5 5 9 5 3 9 5 0 2Apparel and related products. . . . 1 , 368.0 1 ,1 * 1 3 -5 1 , 3 9 3 . 6 1 , 311.6 - **5.5 56.1* 1 ,|W 0 1 ,* 2 5 1,*10 - 2 5Paper and allied products................ 670.6 672.9 656.6 61*0 .6 - 2 . 3 30.0 6 7 1 668 661 3Printing and pu b lish in g ............ 1 , 0 2 5 . 3 1 , 022. 1* 1 , 0 1 0 . 3 9 7 8 .8 3 . * 1*7.0 1,028 1,022 1 , 01* 6Chem icals and allied products. . . 9 6 0 .7 9 5 6 .8 9 * 1 - 7 9 1 3 .9 3 . 9 1*6.8 9 5 5 9 5 3 9 3 7 2Petroleum and related products . . 182.0 180.6 1 7 7 -5 182. 1* 1 . 1* - . 1* 1 7 9 178 1 7 8 1Rubber and plastic products . . . . 9 0 0 . 5 5 0 3 -3 * 9 5 - * 1*56.8 - 2.8 * 3 .7 5 0 9 56* *98 5Leather and leather products. . . . 3 6 1 .3 366.2 3 6 0 -3 3 5 1 .2 - * . 9 10.1 3 6 1 3 6 * 3 6 7 - 3
T R A N S P O R T A T IO N AN D P U B L ICU T IL IT IE S . . . ................................. l* ,l**9 M 7 5 * , H 3 l* ,0 8 3 - 26
a66 * , 0 9 6 * , 1 3 8 * , 1 2 5 - *2 \ /
W H O LESALE AN D R E T A IL T R A D E . 1 3 ,0 7 3 1 3 ,1 0 2 1 2 ,9 2 3 1 2 ,5 8 3 - 2 9 1*90 1 3 ,1 1 1 13,006 13,021 25
WNOLESALE TRADE ...................... 3 ,1*23 3 ,3 9 1 3,321* 3 ,3 0 1 3 2 122 3 ,* 0 3 3 ,3 9 * 3 ,3 6 * 9RETAIL TRADE.................................. 9 ,6 5 0 9 ,7 1 1 9 ,5 9 9 9,282 - 6l 368 9 ,7 0 8 9 ,6 9 2 9 ,6 5 7 16
F IN A N C E . IN SU RAN CE, ANDR E A L E S T A T E .................... .............. 3 ,1 7 8 3,11*1* 3 ,1 0 3 3 ,0 9 8 31* 80 3,126 3,122 3 ,1 0 6 6
SE R V IC E A N D M ISC E LL A N E O U S. . 9,55>* 9,1*71 9 ,3 * 8 9,081 8 3 1*73 9 ,3 9 * 9 ,3 1 3 9 ,2 8 3 81
G O VERN M EN T ........................................... 1 0 ,5 2 3 10,825 10,762 9 ,7 1 6 - 302 80? 10,887 10, 80* 10,688 8 3
FEDERAL.............................................. 2,638 2 ,5 9 2 2 ,5 1 3 2,1*07 1*6 2 3 1 2, 60* 2 ,5 7 1 2 ,5 2 1 3 3STATE AND L O C A L ......................... 7 ,8 8 5 8 ,2 3 3 8 ,21*9 7 ,3 0 9 - 3 W 5 7 6 8 ,2 8 3 8 ,2 3 3 8 ,1 6 7 5 0
N OTE: Data for the 2 m ost recent months ate prelim inary.______ S Rt%**As**> ^ 7 , 3 * 0 ?LLuJ 3 / S C O S t /& b * ^ c « - /y f CC
n __________ »f ¥ ? £ - * + £ / O U , - > 4 . &0 C Ae&x>*v\ - C O t s i J ^ . fttrUA^Jl + 4-COCs
3/ j\jC%xx*s)r ' ■+ • /Q& iu - / • ^ ► i ^ / v j p. 10. <xB n *
$ i Jct 7UM ■ 3-eS — 9< ooe? ’
Digitized for FRASER http://fraser.stlouisfed.org/ Federal Reserve Bank of St. Louis
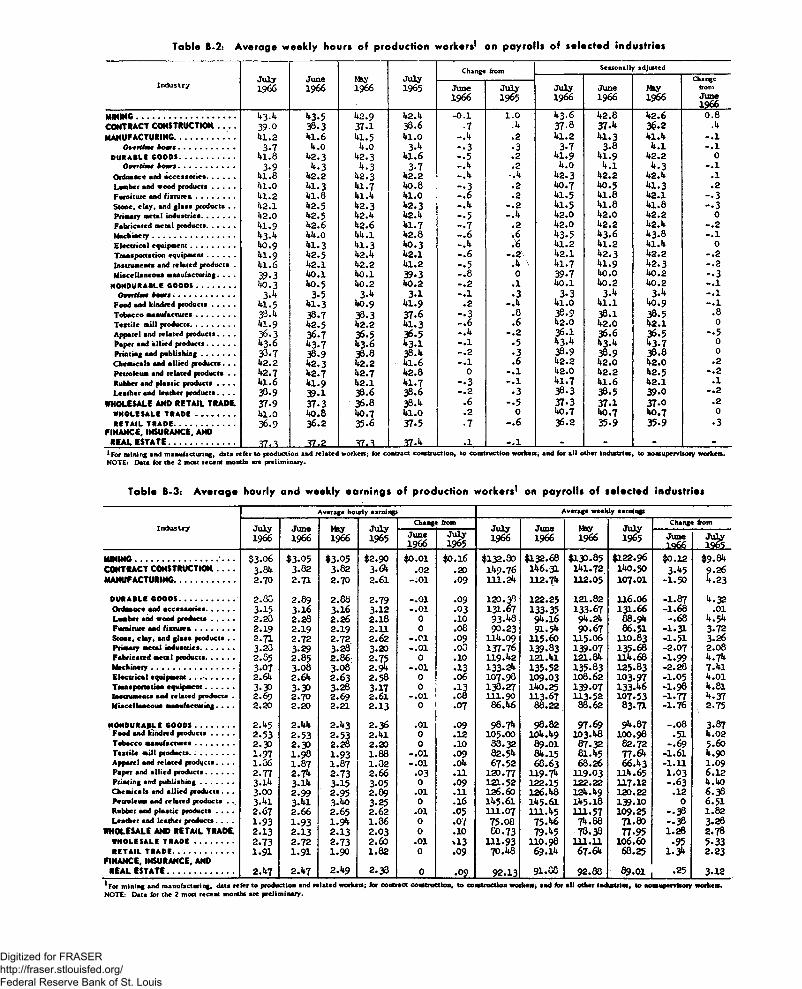
Table B-2: Average weekly hours of production workers* on payrolls of selected industries
IndustryJ u ly1966
J u n e 19 6 6
May1966
J u ly1965
Change from Seasonally adjtsted
J u ly 19 6 6
J u n e1966
May1966
ChangefromJ u n e1966
J u n e1966
J u l y1 9 6 5
M IN IN G ............................................................ 43.4 4 3 . 5 4 2 . 9 4 2 . 4 - 0 . 1 1.0 43.6 4 2 . 8 4 2 . 6 0.8C O N T R A C T C O N S T R U C T IO N .--------- 3 9 - 0 3 8 .3 3 7 .1 38.6 •7 .4 37.8 3 7 .4 3 6 .2 .4M A N U FA C TU R IN G ..................................... 4 1 . 2 4 1 . 6 4 1 .5 4 1 .0 - . 4 .2 4 1 . 2 4 1 . 3 4 1 . 4 -.1
O iertfor b om s ................................ 3 .7 4 . 0 4 .0 3 .4 - . 3 • 3 3 .7 3 .8 4 . 1 -.1DURABLE COOOS............................... 4 1 . 8 4 2 . 3 4 2 . 3 4 1 . 6 - . 5 .2 4 1 . 9 4 1 . 9 4 2 . 2 0
Overtime b om s ............................... 3 .9 4 . 3 4 . 3 3 .7 - . 4 .2 4 . 0 4 . 1 4 . 3 -.1Ordnance and a ccessories................ 4 1 . 8 4 2 . 2 4 2 . 3 4 2 . 2 - . 4 - . 4 4 2 . 3 4 2 . 2 4 2 . 4 .1Lumber and wood p ro d u c ts ............ 4 l .O 4 1 . 3 4 1 . 7 4 0 . 8 - . 3 .2 4 0 . 7 4 0 . 5 4 1 . 3 .2Furniture and fix tu re a ...................... 4 1 . 2 4 1 . 8 4 1 .4 4 1 .0 -.6 .2 4 1 . 5 4 1 . 8 4 2 . 1 - 3Stone, clay , and glass products . . 4 2 .1 4 2 . 5 4 2 . 3 4 2 . 3 - . 4 -.2 4 1 . 5 4 1 . 8 4 1 . 8 - 3Primary metal industries................... 4 2 .0 4 2 . 5 4 2 .4 4 2 . 4 - 5 - . 4 4 2 . 0 4 2 . 0 4 2 . 2 0Fabricated metal products................ 4 1 . 9 4 2 . 6 4 2 .6 4 1 . 7 - . 7 .2 4 2 . 0 4 2 . 2 4 2 .4 -.2M achinery.............................................. 4 3 .4 4 4 .0 4 4 .1 4 2 . 8 -.6 ,6 4 3 . 5 4 3 . 6 43.8 -.1E lectrical equipm ent......................... 4 0 . 9 4 1 . 3 4 1 . 3 4 0 . 3 - . 4 .6 4 1 . 2 4 1 . 2 4 1 . 4 0
4 1 . 9 4 2 . 5 4 2 . 4 4 2 . 1 -.6 -.2 4 2 . 1 4 2 . 3 4 2 . 2 -.2Instruments and related products . 4 1 . 6 4 2 . 1 4 2 . 2 4 1 . 2 - 5 . 4 \ 4 1 . 7 4 1 . 9 4 2 . 3 -.2Miscellaneous manufacturing. . . . 3 9 .3 4 0 . 1 4 0 .1 3 9 .3 -.8 0 3 9 .7 4 0 . 0 4 0 . 2 - . 3
NONDURABLE OOODS...................... 4 0 . 3 4 0 . 5 4 0 . 2 4 0 . 2 -.2 .1 4 0 . 1 4 0 . 2 4 0 . 2 -.1Overtime b o m s .................................. 3 .4 3 .5 3 .4 3 .1 -.1 • 3 3 .3 3 .4 3 .4 -.1
Food and kindred p ro d u cts ............. 4 1 .5 4 1 . 3 4 0 . 9 4 1 . 9 .2 - . 4 4 l . O 4 1 . 1 4 0 . 9 -.1T obacco manufactures...................... 3 3 .4 3 8 .7 3 8 .3 3 7 .6 - 3 .8 3 8 .9 3 8 .1 3 8 .5 .8Textile mill products......................... 4.1.9 4 2 .5 4 2 . 2 4 1 . 3 -.6 •6 4 2 .0 4 2 . 0 4 2 . 1 0Apparel and related products. . . . 3 6 .3 3 6 .7 3 6 .5 3 6 .5 - . 4 -.2 3 6 .1 36.6 3 6 .5 - 5Paper and a llied products................ 43.6 4 3 . 7 4 3 . 6 43.1 -.1 .5 4 3 . 4 4 3 . 4 4 3 . 7 0Printing and pu b lish in g ................... 3 3 .7 3 8 .9 38.8 3 8 .4 -.2 .3 3 8 .9 3 8 .9 38.8 0Cheaucals and allied products. . . 4 2 . 2 4 2 . 3 4 2 . 2 4 1 . 6 -.1 •6 4 2 . 2 4 2 . 0 4 2 . 0 .2Petroleum and related products . . 4 2 . 7 4 2 . 7 4 2 . 7 4 2 . 8 0 -.1 4 2 .0 4 2 . 2 4 2 . 5 -.2Rubber and plastic products . . . . 4 1 . 6 4 1 . 9 4 2 . 1 4 1 . 7 - 3 -.1 4 1 . 7 4 1 . 6 4 2 . 1 .1Leather and leather products. . . . 3 3 .9 3 9 .1 38.6 38.6 -.2 • 3 3 8 .3 3 8 .5 3 9 .0 -.2
W H O LESALE AN D R E T A IL TR A D E . 3 7 .9 3 7 .3 36.8 3 8 .4 .6 - 5 3 7 .3 3 7 - 1 3 7 - 0 .2WHOLESALE TRADE ...................... 4 1 .0 4 0 . 8 4 0 . 7 4 1 . 0 .2 0 4 0 . 7 4 0 . 7 4 0 . 7 0RETAIL TRADE.................................. 3 6 .9 36.2 35.6 3 7 .5 <7 -.6 36.2 3 5 .9 3 5 .9 • 3
FIN A N C E . IN SU RAN CE, ANDR E A L E S T A T E ........................................ T 7 .1 3 7 .2 ___3Z±3____ 3 7 .^ ____ .1 -.1 - - - -
1 For mining and manufacturing, data refer to production and related workers; for contract construction, to construction workers; and for all other indintries, to nonsupervisory workers. NOTE: Data for the 2 most recent months are preliminary.
Table B-3: Average hourly and weekly earnings of production workers* on payrolls of selected industries
Industry
Average hourly earnings Average weekly earnings
J u ly1966
J u n e 1966
May1966
J u l y1 9 6 5
Change fromJ u ly1966
J u n e1966
May 1966
J u ly1965
Change from
J u n e1966 J u ly1965 II J u ly
1 9 6 5 _
M IN IN G .................................................. $ 3.06 $ 3 .0 5 $ 3 .0 5 $ 2.90 $ 0 .0 1 $0.16 $ 1 3 2 .3 0 $ 1 3 2 .6 8 $ 1 3 0 .8 5 $ 122.96 $ 0 .1 2 $ 9 .8 4C O N T R A C T C O N S T R U C T IO N ,--------- 3 .8 4 3.82 3.82 3 .6 4 .02 .20 1 4 9 .7 6 1 4 6 .3 1 1 4 1 .7 2 1 4 0 .5 0 3 .4 5 9.26M A N U FA C TU R IN G ..................................... 2 .7 0 2 .7 1 2 .7 0 2.61 -.01 . 0 9 1 1 1 .2 4 1 1 2 .7 4 1 1 2 .0 5 107.01 - 1.50 4 . 2 3
DURABLE GOODS............................... 2.00 2 .8 9 2.88 2 .7 9 -.01 .0 9 120.38 1 2 2 .2 5 121.82 116.06 - 1 . 8 7 4 .3 2Ordnance and a ccessories ................ 3 .1 5 3.16 3.16 3 .1 2 -.01 . 0 3 1 3 1 .6 7 1 3 3 .3 5 1 3 3 .6 7 131.66 - 1 . 6 8 .01Lumber and wood products . . . . . 2.28 2.28 2.26 2.18 0 .10 9 3 * 4 8 9 4 .1 6 9 4 .2 4 8 8 .9 4 -.68 4 .5 4Furniture and fix tu re a ...................... 2 .1 9 2 .1 9 2 .1 9 2.11 0 .08 9 0 .2 3 9 1 .5 4 9 0 .6 7 8 6 .5 1 - 1 . 3 L 3 .7 2Stone, clay , and glass products . . 2 .7 1 2.72 2.72 2.62 -.01 .09 1 1 4 .0 9 115.60 115.06 1 1 0 .8 3 - 1 . 5 1 3.26Primacy metal industries................... 3 .2 3 3 .2 9 3.28 3.20 -.01 . 0 3 1 3 7 .7 6 1 3 9 .8 3 1 3 9 .0 7 1 3 5 .6 8 - 2.07 2.08Fabricated metal products................ 2 .5 5 2 .8 5 2.86 2 .7 5 0 .10 1 1 9 .4 2 1 2 1 .4 1 1 2 1 .8 4 1 1 4 .6 8 - 1 . 9 9 4 .7 4M achinery.............................................. 3 .0 7 3.08 3.08 2 .9 4 -.01 .13 1 3 3 -2 4 1 3 5 .5 2 1 3 5 .8 3 1 2 5 .8 3 - 2.28 7 .4 1E lectrica l equipment . . ................ 2 .6 4 2 .6 4 2 .6 3 2 .5 8 0 .06 1 0 7 .9 8 1 0 9 .0 3 108.62 1 0 3 .9 7 - 1 . 0 5 4 .0 1Transportation equipm ent................ 3 .3 0 3 .3 0 3.28 3 .1 7 0 •13 1 3 8 .2 7 1 4 0 .2 5 1 3 9 .0 7 1 3 3 .4 6 - 1.98 4 .8 1Inacnuneota and related products . 2.69 2 .7 0 2.69 2.61 -.01 .08 I H .90 1 1 3 .6 7 1 1 3 .5 2 1 0 7 .5 3 - 1 . 7 7 4 .3 7M iscellaneous manufacturing. . . . 2.20 2.20 2.21 2 .1 3 0 i1 .07 8 6 .4 6 88.22 88.62 8 3 .7 1 - 1 . 7 6 2 .7 5
NONDURABLE GOODS...................... 2 .4 5 2 .4 4 2 .4 3 2.36 .01 .09 9 8 .7 4 98.82 9 7 .6 9 9 4 .8 7 -.08 3 .8 7Food and kindred p ro d u c ts ............. 2 .5 3 2 .5 3 2 .5 3 2 .4 1 0 .12 105.00 1 0 4 .4 9 1 0 3 .4 8 IO O .98 . 5 1 4 . 0 2T obacco m anufactures...................... 2.30 2.30 2.28 2.20 0 .10 3 3 .3 2 89.01 8 7 .3 2 8 2 .7 2 -.69 5.60Textile mill products. ...................... 1 .9 7 1 .9 0 1 .9 3 1.88 -.01 . 0 9 8 2 .5 4 8 4 .1 5 8 1 .4 5 7 7 .6 4 - 1.61 4 .9 0Apparel and related prodqcts. . . . 1 .3 6 1 .8 7 1 .8 7 1 .3 2 -.01 .0 4 6 7 .5 2 68.63 68.26 6 6 .4 3 - 1 . 1 1 1 .0 9Paper and allied products................ 2 .7 7 2 .7 4 2 .7 3 2.66 . 0 3 .11 1 2 0 .7 7 1 1 9 .7 4 1 1 9 .0 3 1 1 4 .6 5 1 .0 3 6.12Printing and pu b lish in g ................... 3 .1 4 3 .1 4 3 .1 5 3 .0 5 0 . 0 9 121.52 1 2 2 .1 5 122.22 117.12 -.63 4.1*0Chem icals and allied products. . . 3.00 2 .9 9 2 .9 5 2.O 9 .01 .11 126.60 1 2 6 .4 8 1 2 4 .4 9 120.22 .12 6.38Petroleum and related products . 3 -4 1 3 .4 1 3 .4 0 3 .2 5 0 .16 1 4 5 .6 1 1 4 5 .6 1 1 4 5 .1 8 1 3 9 .1 0 0 6 .5 1Rubber and plastic products . . . . 2.67 2.66 2 .6 5 2.62 .01 . 0 5 111.07 I H . 4 5 1 1 1 .5 7 1 0 9 .2 5 - 3 8 1.82
1 .9 3 1 . 9 3 1 .9 4 1 .3 6 0 •oy 7 5 .0 8 7 5 .4 6 7 4 .8 8 71.80 - 3 8 3.28W H O LESALE AN D R E T A IL TR A D E . 2 .1 3 2 .1 3 2 .1 3 2 .0 3 0 .10 8 0 .7 3 7 9 .4 5 7 3 .3 0 7 7 .9 5 1.28 2 .7 8
WHOLESALE TRADE ...................... 2 .7 3 2.72 2 .7 3 2.60 .01 * 1 3 1 1 1 .9 3 H O .98 111.11 106.60 • 95 5 .3 3RETAIL TRADE.................................. 1 .9 1 1 .9 1 1 .9 0 1.82 0 .09 7 0 .4 8 6 9 .1 4 6 7 .6 4 6 8 .2 5 1 .3 ^ 2 .2 3
F IN A N C E , IN SU RAN CE, ANDR E A L E S T A T E ........................................ 2 .4 7 2 .4 7 2 .4 9 2.33 0 .09 9 2 .1 3 91.88 92.88 89.01 ,
L _ *25 3 .1 2
1 For mining and m anufacture, data refer to production and related workers; for contract construction, to construction workers; and for all other industries, to nonsupervisory workers. NOTE: Data for the 2 most recent months are preliminary.
Digitized for FRASER http://fraser.stlouisfed.org/ Federal Reserve Bank of St. Louis


