Embed Size (px)
Citation preview

A 3 ;
Industry Wage Survey:Mill work June 1979U.S. Department of Labor Bureau of Labor Statistics December 1980
Bulletin 2083
Digitized for FRASER http://fraser.stlouisfed.org/ Federal Reserve Bank of St. Louis

Industry Wage SurveyMillworkJune 1979U.S. Department of Labor Ray Marshall, Secretary
Bureau of Labor Statistics Janet L. Norwood, Commissioner
December 1980
Bulletin 2083
For sale by the Superintendent of Documents, U.S. Government Printing Office Washington, D.C. 20402 - Price $3.25
Digitized for FRASER http://fraser.stlouisfed.org/ Federal Reserve Bank of St. Louis

Digitized for FRASER http://fraser.stlouisfed.org/ Federal Reserve Bank of St. Louis

Preface
This bulletin summarizes the results of the first survey by the Bureau of Labor Statistics of wages and supplementary benefits in the millwork industry in June 1979.
Separate releases were issued earlier for: California, Florida, Illinois, New York, Ohio, Oregon, Pennsylvania, Texas, Washington, and Wisconsin. Copies of these may be obtained from the Bureau of Labor Statistics, Washington, D.C. 20212, or any of its regional offices.
This study was conducted in the Bureau’s Office of Wages and Industrial Relations. Sandra L. King of the
Division of Occupational Wage Structures prepared the analysis in this bulletin. Fieldwork for the survey was conducted by the Assistant Regional Commissioners for Operations.
Other reports available from the Bureau’s program of industry wage studies, as well as the addresses of the Bureau’s regional offices, are listed at the end of this bulletin.
Unless specifically identified as copyright, material in this publication is in the public domain and may, with appropriate credit, be reproduced without permission.
iii
Digitized for FRASER http://fraser.stlouisfed.org/ Federal Reserve Bank of St. Louis

Digitized for FRASER http://fraser.stlouisfed.org/ Federal Reserve Bank of St. Louis

Contents
Page
Earnings and benefits................................................................................................................... 1Industry characteristics................................................................................................................. 1
Reference tables:1. Average hourly earnings by selected characteristics..................................................... 32. Average hourly earnings and employment characteristics—selected S tates................ 3
Earnings distribution:3. All production workers.................................................................................................. 44. Assemblers..................................................................................................................... 65. Molding-machine operators.................................................................................. 86. Machine off-bearers ..................................................................................................... 107. Forklift operators ...................................................................... 128. Rip-saw operators......................................................................................................... 14
Occupational averages:9. All establishments......................................................................................................... 16
10. By size of community................................................................................................... 2211. By size of establishment........................................................................ 2412. By labor-management contract coverage..................................................................... 26
Establishment practices and supplementary wage provisions:13. Method of wage payment................................................................................................ 2814. Minimum entrance rates: Machine off-bearers..............................................................2915. Minimum entrance rates: Hand sanders.......................................................................3016. Scheduled weekly hours............................................................................................... 3117. Shift differential provisions............................................................................................ 3218. Paid holidays...................................................................................................................3319. Paid vacations................................................................................................................. 3420. Health, insurance, and retirement plans...................................................................... 3621. Other selected benefits................................................................................................. 37
Appendixes:A. Scope and method of survey............................................................................................38B. Occupational descriptions................................................................ 42
v
Digitized for FRASER http://fraser.stlouisfed.org/ Federal Reserve Bank of St. Louis

Digitized for FRASER http://fraser.stlouisfed.org/ Federal Reserve Bank of St. Louis

Millwork, June 1979
Earnings and benefitsStraight-time earnings of production and related
workers in millwork manufacturing averaged $5.55 an hour in June 1979 (table 1). Earnings for nine-tenths of the workers covered by this first-time survey1 were between $3 and $9 (table 3); the middle 50 percent fell between $4.08 and $6.60—a relatively broad range compared to earnings variations found in other BLS wage surveys.
Average hourly earnings for all production workers were highest in the Pacific States ($6.90) and lowest in the Southwest ($3.95). Workers in the Great Lakes, the region of greatest industry employment, averaged $5.96.
Among the principal product categories studied, manufacturers of windows had the highest average ($5.88); softwood doors, the lowest ($5). Workers in establishments primarily producing flush and molded doors averaged $5.75; those producing interior woodwork, $5.65. These nationwide pay levels were influenced by the regional distribution of the workers in each product category. For example, the Great Lakes, a relatively high-paying region, accounted for three-fifths of the workers manufacturing windows, while the Southwest, the lowest-paying region, accounted for no workers in window-making firms.
Occupational earnings for production workers typically were higher in metropolitan areas than in nonmetropolitan areas; higher in union than in nonunion plants; and higher in plants with 250 workers or more than in those with less than 100. However, workers in the smallest plant-size category (less than 100) typically averaged more per hour than their counterparts in establishments with 100 to 249 workers. (See tables 9-12 for occupational earnings by these characteristics.)
Nationwide, averages among the 29 production occupations studied spanned a broad range—from $7.49 for hand shaper operators (who set up and operate the machines) to $4 for hand sanders (table 9)2. Assemblers,
1 Earnings data in this bulletin exclude premium pay for overtime and for work on weekends, holidays, and late shifts. See appendix A for scope and method of survey.
the largest occupational category studied, averaged $5.64. Together, the 29 occupations accounted for nearly one-half of the production work force. (See tables 4-8 for distribution of earnings by occupation.)
Virtually all production workers were employed in millwork plants providing paid holidays, paid vacations, and at least part of the cost of hospitalization, surgical, and basic medical insurance (tables 18-20). Workers typically received 6 to 11 holidays annually, in addition to 1 to 4 or more weeks of vacation pay, depending on years of service. Two-thirds of the workers also were covered by retirement pension plans. Regionally, paid leave provisions were most liberal in the Great Lakes and Pacific States. Other benefits covering a majority of the production workers included funeral leave and jury-duty pay (table 21). Provisions for cost-of-living pay adjustments, generally based on the BLS Consumer Price Index, applied to one-fifth of the workers.
Industry characteristicsMillwork manufacturing establishments within scope
of the survey (those with at least 8 workers) employed about 44,000 production and related workers in June 1979. The Great Lakes and Pacific regions each employed about one-fourth of the workers, the Southwest and Southeast, about one-tenth each, and the remaining regions, a smaller proportion. Employment in the 10 States published separately (table 2) accounted for nearly three-fifths of the national total. Seven-tenths of the workers were employed in metropolitan areas. By region, however, the proportion of workers in larger communities varied widely—from nine-tenths or more in the Mountain and Pacific States to about half in New England, Border States, and Great Lakes, and to about one-fifth in the Middle West.
Establishments in the millwork industry manufacture a variety of products, including wood moldings and trim, garage doors, and window frames. In June 1979, one-fourth of the production work force was in plants primarily manufacturing windows (frames or complete
2 See appendix B for job descriptions.
1
Digitized for FRASER http://fraser.stlouisfed.org/ Federal Reserve Bank of St. Louis

units) and one-fourth, interior woodwork. Nearly two- fifths of the workers were in plants where doors were the primary product—about equally divided between exterior (flush and molded) and interior (softwood) doors. Most of the remaining workers primarily manufactured window and door sash, stairs, or exterior woodwork. Two-thirds of the establishments visited produced other mill work items as secondary products.
Nearly one-half of the industry’s work force was in small establishments (each under 100 workers) and in plants having collective bargaining agreements covering a majority of the production workers. The major union in the industry is the United Brotherhood of Carpenters and Joiners (AFL-CIO). By region, union coverage ranged from about one-tenth in New England and the Middle West to two-thirds in the Great Lakes and Pacific States.
Nine-tenths of the production workers were paid on a time-rate basis, typically under formal plans providing either a single rate or a range of rates for specified occupations. Incentive pay plans were most common in the Great Lakes, applying to one-fourth of the workers. (See table 13.)
Slightly more than nine-tenths of the employees were in establishments with weekly schedules of 40 hours (table 16). Most of the remainder were on longer schedules—generally 45 hours. Pay provisions for second- shift work were reported by plants employing just over one-half of the production workers; for third shifts, the proportion was one-third (table 17). About one-eighth of the production workers, however, were actually employed on late shifts at the time of the survey. Their premiums above day-shift rates commonly were between 10 and 20 cents per hour.
2Digitized for FRASER http://fraser.stlouisfed.org/ Federal Reserve Bank of St. Louis

Table 1. Average hourly earnings by selected characteristics
(Number and average straight-time hourly earnings1 of workers in millwork manufacturing establishments, United States and selected regions, June 1979)
United States New England Middle Atlantic Border States Southeast Southwest Great Lakes Middle West Mountain Pacific
Item Numberof
workers
Average
hourlyearnings
Numberof
workers
Average
hourlyearnings
Numberof
workers
Average
hourlyearnings
Numberof
workers
Average
hourlyearnings
Numberof
workers
Average
hourlyearnings
Numberof
workers
Average
hourlyearnings
Numberof
workers
Average
hourlyearnings
Numberof
workers
Average
hourlyearnings
Numberof
workers
Average
hourlyearnings
Numberof
workers
Average
hourlyearnings
All production workers.................................. 43,914 $5.55 905 $4.25 2,735 $5.34 2,042 $4.39 4,076 $4.05 5,593 $3.95 12,228 $5.96 3,240 $5.18 2,602 $5.93 10,493 $6.90Men ............................................................. 34,307 5.65 771 4.40 2,586 5.43 1,597 4.56 3,360 4.11 4,840 3.96 9,373 6.13 - - - - 9,150 7.05Women........................................................ - - 134 3.40 149 3.77 445 3.80 716 3.78 - - 2,855 5.42 - - - - - -
Size of community:Metropolitan areas..................................... 30,154 5.88 436 4.20 1,930 5.56 1,005 5.02 2,983 4.24 4,561 4.03 5,799 6.88 604 4.73 2,343 5.75 10,493 6.90Nonmetropolitan areas .............................. 13,760 4.82 469 4.30 805 4.80 1,037 3.78 1,093 3.53 1,032 3.58 6,429 5.14 2,636 5.29 _ - - -
Size of establishment:8-99 workers .............................................. 20,677 5.48 797 4.24 1,761 5.63 1,055 4.84 3,425 4.07 2,569 4.14 3,261 5.80 944 4.91 1,248 5.49 5,617 7.13100-249 workers.............................. .......... 9,448 4.93 - - 974 4.81 - - - - 1,974 3.71 2,297 5.40 487 4.29 398 5.38 2,116 6.18250 workers or more .................................. 13,789 6.06 - - - - - - - - - - 6,670 6.24 - - 956 6.73 2,760 7.00
Labor-management contract coverage: Establishments with-
Majority of workers covered................... 20,024 6.18 - - 1,527 5.70 644 $5.25 872 $3.91 927 $3.72 7,775 5.70 387 4.83 592 7.16 7,228 7.47None or minority of workers covered .... 23,890 5.02 833 4.16 1,208 4.87 1,398 3.99 3,204 4.09 4,666 3.99 4,453 6.43 2,853 5.23 2,010 5.57 3,265 5.65
Principal product:Flush and molded doors............................ 8,198 5.75 162 4.18 447 4.46 - - 706 4.49 1,161 3.91 2,304 5.74 - - - - 3,301 6.94Softwood doors.......................................... 7,784 5.00 - - - _ - - 1,357 3.77 1,666 3.62 1,519 5.47 - - 364 4.78 1,881 7.06Windows ..................................................... 10,445 5.88 349 3.92 781 4.56 - - 376 4.35 - - 6,015 6.33 - - - - 616 6.95Interior woodwork...................................... 10,779 5.65 - - 420 6.43 806 4.95 609 4.72 1,867 3.98 1,110 6.09 512 5.07 1,483 5.93 3,760 6.60
1 Excludes premium pay for overtime and for work on weekends, holidays, and late shifts. NOTE: Dashes indicate no data or data do not meet publication criteria.
Table 2. Average hourly earnings and employment characteristics-selected States
(Number and average straight-time hourly earnings,1 and percent distribution of production workers in millwork manufacturing establishments, June 1979)
Percent of production workers in establishments according to~
State All workersAveragehourly
earnings
Primary product2 Size of community Size of establishment Majority covered by
union contract
Flush and molded doors
Softwooddoors Windows Interior
woodworkMetropolitanareas
Nonmetropolitanareas
8-249workers
250-499workers
500workers or
more
California........................................................ 5,569 $7.05 23 15 6 45 100 _ 91 9 _ 80-84Florida .............................. .............................. 1,143 4.09 2 49 - 20 81 19 100 - - 15-19Illinois.................................................. ............ 1,057 6.30 29 - 10 32 56 44 70 30 - 85-89New York ....................................................... 1,066 5.39 24 - 25 21 67 33 100 - - 70-74Ohio ................................................................ 1,950 4.93 - 12 41 13 40 60 78 - 22 70-74Oregon ............................................ ............... 3,150 6.73 51 4 8 29 100 - 46 40 14 40-44Pennsylvania................................................... 667 5.55 28 25 - 30 75 25 100 - - 65-69Texas .............................................................. 4,565 3.90 19 30 - 33 77 23 77 23 - 20-24Washington................................................. 1,774 6.75 23 50 1 19 100 - 69 - 31 70-74Wisconsin....................................................... 4,300 5.54 35 8 47 6 27 73 47 20 33 90-94
1 Excludes premium pay for overtime and for work on weekends, holidays, and late 2 Overall data include products in addition to those shown separately,shifts.
Digitized for FRASER http://fraser.stlouisfed.org/ Federal Reserve Bank of St. Louis

Table 3. Earnings distribution: All production workers
(Percent distribution of production workers in millwork manufacturing establishments by straight-time hourly earnings, United States and selected regions and States, June 1979)
Hourly earnings
United States Region State
Allworkers Men Women
NewEngland
MiddleAtlantic
BorderStates
Southeast
Southwest
GreatLakes
MiddleWest
Mountain Pacific Cali
fornia Florida Illinois NewYork Ohio Oregon
Pennsyl
vaniaTexas Wash
ingtonWis
consin
Number of workers.................. 43,914 34,307 6,520 905 2,735 2,042 4,076 5,593 12,228 3,240 2,602 10,493 5,569 1,143 1,057 1,066 1,949 3,150 667 4,565 1,774 4,300Average hourly earnings1 ......... $5.55 $5.65 $4.78 $4.25 $5.34 $4.39 $4.05 $3.95 $5.96 $5.18 $5.93 $6.90 $7.05 $4.09 $6.30 $5.39 $4.93 $6.73 $5.55 $3.90 $6.75 $5.54
Percent distribution.................. 100.0 100.0 100.0 100.0 100.0 100.0 100.0 100.0 100.0 100.0 100.0 100.0 100.0 100.0 100.0 100.0 100.0 100.0 100.0 100.0 100.0 100.0
Under $2.90.............................. - - - - - - - - - - - - - - - - - - - - - -
$2.90 and under $3.00............. 3.1 3.2 2.2 3.8 1.2 2.6 10.4 11.5 .1 4.4 - .3 .4 13.0 - 2.7 - .4 .7 11.0 - -
$3.00 and under $3.10............. 3.4 3.5 3.3 6.3 .2 4.7 9.2 13.5 .4 3.0 .8 .4 .6 9.2 .5 .3 _ .3 .3 12.3 .1 .2$3.10 and under $3.20............. 1.7 1.6 2.7 7.2 .5 3.8 3.9 6.5 (2) .3 - .4 .7 4.5 - .7 .2 - 1.2 6.5 .2 (2)$3.20 and under $3.30............. 2.2 2.1 3.9 7.6 .3 6.0 5.1 7.1 .3 2.1 1.2 .3 .4 7.3 .9 .5 .7 .2 .6 7.0 .4 -$3.30 and under $3.40............. 1.4 1.4 2.3 3.8 1.4 2.2 4.1 2.8 .9 .6 - .5 .6 1.8 4.9 3.7 .4 .4 - 3.0 .1 .1$3.40 and under $3.50............. 1.7 1.1 5.6 2.2 5.7 3.4 2.5 2.9 .5 1.0 .1 1.3 .9 1.2 1.5 8.5 2.1 2.6 9.6 3.5 - .2$3.50 and under $3.60............. 2.2 2.2 2.9 4.6 1.2 6.7 3.9 4.0 .9 3.0 3.2 .9 .6 5.5 3.8 2.5 1.7 1.4 .7 4.4 1.2 .3$3.60 and under $3.70............. 1.5 1.4 2.2 3.8 1.2 2.8 1.3 4.5 .8 1.7 .2 .5 .9 1.2 .4 1.0 1.5 .1 3.4 5.3 - 1.3$3.70 and under $3.80............. 2.5 2.7 2.5 3.3 3.5 4.7 4.5 7.0 .4 2.9 2.4 1.0 1.6 3.0 .8 2.2 .9 .2 1.5 8.0 .5 .6$3.80 and under $3.90............ 1.4 1.2 2.9 2.7 .9 5.4 1.8 3.0 .5 2.1 .2 .7 .8 2.7 .4 1.1 2.3 1.0 1.9 3.3 .1 .3$3.90 and under $4.00............. 1.6 1.5 2.3 2.2 .5 6.3 4.5 1.8 .7 1.8 .6 .8 1.0 4.5 - 1.4 4.1 .3 - 2.1 .9 .3
$4.00 and under $4.10............. 2.7 2.8 2.6 4.5 4.5 4.5 7.6 4.8 .8 1.2 4.3 .8 .6 6.5 2.5 4.8 2.9 .7 4.8 5.0 1.5 .3$4.10 and under $4.20............. 1.8 1.6 2.5 2.4 1.4 4.2 4.6 1.6 1.2 2.7 2.1 .6 .1 2.4 - 1.6 6.5 1.9 .7 1.5 - .4$4.20 and under $4.30............. 2.7 2.9 2.5 5.7 7.2 6.0 3.7 3.1 1.7 1.2 3.2 1.6 1.9 2.9 3.0 4.3 5.6 1.4 - 3.1 1.2 1.0$4.30 and under $4.40............. 1.6 1.4 2.1 1.8 .9 .5 2.9 .6 2.1 3.5 1.8 1.0 1.5 2.0 .9 1.9 10.6 .5 .7 .7 .1 1.0$4.40 and under $4.50............. 1.2 1.1 2.1 2.3 1.4 .6 2.0 1.5 1.3 .4 2.5 .5 .6 3.5 - .4 4.2 .5 3.0 1.4 - 1.1$4.50 and under $4.60............. 2.5 2.5 2.8 3.2 3.5 8.1 3.5 2.9 1.7 1.6 6.1 .6 .2 7.1 .7 2.7 2.5 .9 .9 3.3 1.5 1.4$4.60 and under $4.70............. 1.4 1.4 1.7 1.7 1.6 2.6 1.5 1.1 1.3 1.5 2.4 1.2 1.3 .6 .9 2.5 1.5 1.6 .3 1.1 .2 2.7$4.70 and under $4.80............. 2.5 2.4 4.3 2.1 4.2 2.8 1.3 2.6 3.9 .8 5.2 .8 .7 1.6 - 6.4 20.0 1.4 5.8 2.1 .3 1.7$4.80 and under $4.90............. 1.1 1.0 1.7 1.5 .8 .6 .6 .6 1.3 1.5 3.4 .6 .4 1.0 1.3 .8 3.4 1.1 .1 .7 .2 1.3$4.90 and under $5.00............. 1.3 1.3 2.0 .4 3.7 1.8 .2 .6 2.1 (2) .5 1.2 1.0 .9 1.7 2.3 1.4 1.6 7.8 .7 .9 4.4
$5.00 and under $5.10............. 2.8 2.7 3.9 3.8 5.0 1.6 3.4 2.7 3.4 1.7 6.7 .6 .2 3.6 1.2 2.4 2.4 1.3 3.6 2.8 .9 5.3$5.10 and under $5.20............. 3.3 3.1 6.3 1.3 2.3 .3 5.8 .4 7.5 - 1.4 1.7 1.3 .2 2.4 1.1 .9 2.0 1.3 .5 2.4 7.3$5.20 and under $5.30............. 3.0 3.1 4.2 2.5 3.5 .6 .8 1.5 7.5 .6 3.0 .7 .4 .3 12.4 2.1 2.1 .6 8.8 1.2 1.8 11.1$5.30 and under $5.40............. 1.8 1.8 2.4 3.4 2.5 .4 2.0 .7 4.1 .6 .8 .3 .1 1.7 .7 1.1 .3 .7 2.4 .8 .3 7.0$5.40 and under $5.50............. 2.0 2.0 3.0 .9 3.2 .4 .7 .3 4.3 .4 1.6 1.4 1.3 .2 6.6 1.6 .8 1.9 5.7 .3 .8 8.1$5.50 and under $5.60............. 3.1 2.6 3.7 3.6 1.5 2.0 1.4 1.5 4.5 8.1 2.8 2.2 2.0 1.4 4.7 1.4 .3 1.9 .7 1.6 3.0 10.2$5.60 and under $5.70............. 1.7 1.4 1.0 1.8 1.7 .3 .5 .3 2.1 6.0 1.7 1.3 2.2 .4 1.0 .9 .6 .3 1.3 .3 .2 4.6$5.70 and under $5.80............. 3.0 2.5 1.5 1.0 7.0 1.1 .7 .6 3.4 11.5 .5 2.1 2.9 .3 2.5 1.9 1.0 1.2 1.2 .3 1.2 6.0$5.80 and under $5.90............. 1.6 1.6 1.4 .1 .4 - .2 .1 2.1 2.5 1.3 2.8 1.5 .2 1.2 .9 1.2 4.8 - .2 3.4 4.0$5.90 and under $6.00............. 1.3 1.3 .4 .8 1.9 .3 (2) .1 1.3 2.9 .1 2.3 3.7 .2 .9 1.0 .6 .2 1.2 .1 1.5 2.3
$6.00 and under $6.10............. 2.3 2.2 .9 .8 2.3 .8 1.9 .6 2.0 8.1 1.4 2.6 2.5 1.7 .3 2.3 .4 2.5 1.6 .6 2.8 2.7$6.10 and under $6.20............. 1.0 1.0 .8 .2 .5 .2 .2 .4 .7 1.6 .7 2.3 2.8 .2 .3 .8 2.5 2.0 .6 .3 1.0 .6$6.20 and under $6.30............. 1.7 1.9 .4 .9 1.4 .5 .4 .4 2.5 2.2 1.3 2.1 2.9 .8 - .2 2.4 1.0 1.0 .1 1.7 1.0$6.30 and under $6.40............. 1.4 1.3 .3 .2 1.1 - .2 .3 .9 4.8 .1 2.9 4.2 .2 .3 .4 .6 1.3 1.5 .1 1.6 1.3$6.40 and under $6.50............. 1.2 1.5 .4 .1 1.2 - - .1 1.2 .5 .9 3.0 4.9 - .2 2.4 .1 1.2 1.0 .1 .6 1.0$6.50 and under $6.60............. 1.8 2.0 .8 1.4 .5 2.4 .3 .9 1.5 1.6 .8 3.9 2.4 1.0 .5 .1 1.6 5.5 1.3 1.1 5.6 1.3
See footnotes at end of table.
Digitized for FRASER http://fraser.stlouisfed.org/ Federal Reserve Bank of St. Louis

Table 3. Earnings distribution: All production workers—Continued
(Percent distribution of production workers in millwork manufacturing establishments by straight-time hourly earnings, United States and selected regions and States, June 1979)
Hourly earnings
United States Region State
Allworkers Men Women
NewEngland
MiddleAtlantic
BorderStates
Southeast
Southwest
GreatLakes
MiddleWest
Mountain Pacific Cali
fornia Florida Illinois NewYork Ohio Oregon
Pennsyl
vaniaTexas Wash
ingtonWis
consin
$6.60 and under $6.70............. 0.8 0.8 0.4 0.1 0.7 0.3 0 0.2 0.4 1.8 0.3 2.0 2.1 0.2 _ 1.1 0.4 0.5 0.9 0.1 4.5 0.3$6.70 and under $6.80............. 1.1 1.2 .9 .2 - 1.2 0.3 1.1 1.1 1.4 .6 1.8 1.7 - 2.8 - .8 1.2 - 1.2 3.3 .4$6.80 and under $6.90............. .7 .7 .8 - .4 .1 .1 .1 1.0 .1 - 1.5 1.5 .2 .9 .8 1.5 1.4 .6 .1 1.7 .2$6.90 and under $7.00............. .9 1.0 .6 1.4 .1 .1 .1 .3 .9 .5 1.3 1.9 .8 .3 .1 .2 .2 2.9 .3 .3 3.3 .3
$7.00 and under $7.10............. 1.4 1.5 .8 _ 1.2 .6 .4 .7 1.0 2.7 .9 2.8 1.9 .9 .5 .6 .2 .2 1.6 .2 10.5 .2$7.10 and under $7.20............. .7 .7 .5 - (1 2) - (2) (2) .8 1.2 .3 1.5 1.8 .1 .3 - .4 1.1 .1 (2) 1.4 .2$7.20 and under $7.30............. 1.2 1.4 .8 .3 1.5 .6 .3 .4 1.1 - .3 2.7 1.1 .5 2.7 3.8 1.5 1.3 - .4 10.3 .2$7.30 and under $7.40............. .5 .6 .2 1.3 .2 .1 (2) (2) .6 .1 .6 1.1 .8 .2 2.4 - .3 1.3 .7 (2) 1.6 .2$7.40 and under $7.50............. 1.0 1.0 1.1 - .2 - (2) .2 1.0 .1 5.0 1.7 .7 .2 2.5 .3 .2 1.4 .4 .3 5.2 .1$7.50 and under $7.60............. .8 1.0 .4 .2 .5 - .1 1.0 1.0 .1 1.5 1.3 1.9 .3 .6 1.1 .1 .9 .1 .3 .4 .2$7.60 and under $7.70............. 1.5 1.6 .7 - 4.0 1.7 .1 - .5 .4 2.7 3.7 2.5 - .9 10.1 .2 7.2 .3 - .7 .3$7.70 and under $7.80............. .9 .9 .4 - (2) .5 - .1 .9 - 2.4 2.1 1.3 - - - .8 4.6 .1 .1 .1 .3$7.80 and under $7.90............. 1.3 1.1 .7 - .5 .3 (2 4) - 2.0 - 4.0 1.7 .8 - .6 1.3 .2 4.0 .1 - .6 .1$7.90 and under $8.00............. .9 .8 .9 - .9 .2 - 1.0 - .8 2.2 1.6 - - .1 .1 3.5 3.4 - 1.9 -
$8.00 and under $8.10............. .9 .8 1.1 _ 1.6 .9 .4 .4 1.4 _ 1.3 .7 .4 1.3 .2 _ _ .9 1.8 .4 1.4 (2)$8.10 and under $8.20............. .4 .4 .2 - .5 .1 .2 - .5 - 1.0 .6 .4 .7 .5 .2 - .6 1.8 - 1.0 (2)$8.20 and under $8.30............. 1.0 1.0 .5 .2 .2 .2 - .1 2.4 .2 1.0 .7 .2 - .2 - - 1.4 .7 .2 1.0 -$8.30 and under $8.40............. .5 .5 .2 - .1 .1 - (2) .6 - .7 1.1 .5 - - - - 2.8 .3 (2) .1 -$8.40 and under $8.50............. .5 .6 .1 - .1 .6 - .1 .8 - .5 .8 .2 - .1 .3 - 2.1 - .1 .1 .1$8.50 and under $8.60............. 1.0 1.3 - .1 1.7 - .1 .1 .8 .7 .1 2.6 3.7 .3 .3 4.1 - .2 - .1 3.5 .1$8.60 and under $8.80............. 1.1 1.3 .2 - .3 .1 - .1 1.9 .2 .8 1.8 .9 - 7.0 .4 - 2.5 .7 .1 3.4 .2$8.80 and under $8.80............. - - - - - - - - - - - - - - - - - - - - - -
$8.80 and under $8.90............. .6 .8 (2) - .1 .3 - .1 .6 - .7 1.6 .6 - 3.8 - - 2.4 .4 .1 3.6 -$8.90 and under $9.00............. .6 .7 (2) - .2 - - - 1.3 - 1.9 .5 .8 - - .1 - .3 .6 - .1 -
$9.00 and o ve r......................... 5.0 6.0 (2) - 2.6 .6 - .3 4.1 - 6.2 3 13.4 4 19.8 (5) 14.6 2.6 2.8 8.6 6.6 - 2.2 4.2
1 Excludes premium pay for overtime and for work on weekends, holidays, and late shifts.2 Less than 0.05 percent.3 Workers were distributed as follows: 4.3 percent at $9 to $9.40; 0.6 percent at $9.80 to $10.20;
3.4 percent at $10.20 to $10.60; and 3.4 percent at $10.60 and over.4 Workers were distributed as follows: 5.0 percent at $9 to $9.40; 2.0 percent at $9.40 to $9.80;
0.5 percent at $9.80 to $10.20; 5.9 percent at $10.20 to $10.60; and 6.4 percent at $10.60 and over.5 Workers were distributed as follows: 9.2 percent at $9 to $9.40; 3.5 percent at $9.40 to $9.80;
0.8 percent at $9.80 to $10.20; 0.2 percent at $10.20 to $10.60; and 0.9 percent at $10.60 and over.
NOTE: Because of rounding, sums of individual items may not equal 100.
Digitized for FRASER http://fraser.stlouisfed.org/ Federal Reserve Bank of St. Louis

Table 4. Earnings distribution: Assemblers
(Percent distribution of assemblers in millwork manufacturing establishments by straight-time hourly earnings, United States and selected regions and States, June 1979)
Hourly earnings UnitedStates
Region State
NewEngland
MiddleAtlantic
BorderStates
Southeast
Southwest
GreatLakes
MiddleWest
Mountain Pacific Cali
fornia Florida Illinois NewYork Ohio Oregon
Pennsyl
vaniaTexas Wash
ingtonWis
consin
Number of workers.................. 7,305 268 561 299 677 755 3,219 498 371 657 474 117 59 166 439 89 69 653 94 415Average hourly earnings1 ......... $5.64 $4.02 $5.04 $4.19 $4.03 $3.79 $6.50 $5.09 $5.47 $7.52 $7.91 $3.57 $5.08 $5.12 $5.36 $6.74 $5.04 $3.71 $6.31 $5.32
Percent distribution.................. 100.0 100.0 100.0 100.0 100.0 100.0 100.0 100.0 100.0 100.0 100.0 100.0 100.0 100.0 100.0 100.0 100.0 100.0 100.0 100.0
Under $2.90.............................. - - - - - - - - - - - - - - - - - - - -
$2.90 and undfer $3.00............. 1.7 .4 1.8 - 3.4 11.3 - .4 - .2 .2 9.4 - 6.0 - - - 11.2 - -
$3.00 and under $3.10............. 3.1 10.8 _ 1.7 13.9 12.7 _ _ _ .9 .4 17.9 _ _ _ 4.5 _ 14.7 - -$3.10 and under $3.20............. .8 1.5 - 2.0 3.8 2.5 - - - .2 .2 12.8 - - - - - 2.9 - -$3.20 and under $3.30............. 3.3 10.4 - 8.4 10.2 11.1 .3 4.0 - .8 .2 9.4 - - - 4.5 - 6.4 - -$3.30 and under $3.40............. 1.9 3.7 5.3 2.0 5.3 5.3 .4 .8 - .3 - 2.6 3.4 18.1 - 2.2 - 6.1 - -$3.40 and under $3.50............. 1.7 3.0 7.0 3.7 1.6 6.1 .1 .4 - .5 .2 2.6 - 9.0 .5 2.2 34.8 7.0 - -$3.50 and under $3.60............. 1.4 4.1 1.8 6.0 4.3 2.0 - 2.4 1.1 .3 - 8.5 - 6.0 - 2.2 - 1.4 - -$3.60 and under $3.70............. 1.5 7.8 - 5.4 .9 3.8 .4 2.2 - 2.3 3.2 3.4 - - - - - 4.4 - 2.9$3.70 and under $3.80............. 2.2 5.6 1.1 8.4 2.2 7.5 .2 4.0 3.5 - - 6.0 13.6 3.6 - - - 8.7 - -$3.80 and under $3.90............. 1.1 4.1 .4 6.4 - 5.2 .2 .8 - .6 .4 - - .6 - 2.2 1.4 6.0 - 1.2$3.90 and under $4.00............. 1.3 3.4 .4 9.7 1 4.1 1.3 .3 .6 1.6 - - 1.7 - 1.2 2.5 - - 1.5 - -
$4.00 and under $4.10............. 2.2 6.7 2.9 3.3 6.8 4.8 .1 .4 7.0 .5 .2 2.6 1.7 _ _ _ - 4.6 2.1 .5$4.10 and under $4.20............. 1.0 1.5 - 2.3 3.4 2.6 - 2.6 1.1 - - 6.0 - - - - - 3.1 - -$4.20 and under $4.30............. 3.2 3.4 17.6 11.0 5.3 2.3 .6 .6 2.7 .9 - 2.6 - .6 3.6 6.7 - 2.6 - .5$4.30 and under $4.40............. 2.2 3.4 .4 .7 4.9 1.2 .2 16.5 - 2.4 3.4 .9 1.7 1.2 .5 - - 1.4 - .5$4.40 and under $4.50............. .6 1.5 .5 .7 .3 .9 .6 .2 1.1 - - 1.7 - .6 2.3 - 2.9 1.1 - 1.9$4.50 and under $4.60............. 3.1 2.6 5.3 14.4 2.2 2.6 2.8 1.0 3.5 .8 - 2.6 - 4.8 1.4 - - 3.1 5.3 3.4$4.60 and under $4.70............. .8 .7 .4 - 1.3 .4 '1.0 .6 1.1 - - 1.7 1.7 1.2 .9 - - .5 - 6.5$4.70 and under $4.80............. 5.9 2.2 5.7 2.0 .9 4.1 9.0 1.6 14.6 .3 - - - 12.7 61.0 - 4.3 4.7 2.1 4.1$4.80 and under $4.90............. .9 2.6 1.4 1.0 .9 .1 .9 - 3.5 - - .9 1.7 - - - - .2 - 4.1$4.90 and under $5.00............. 1.0 .7 2.7 - .3 .3 1.5 - .5 - - 1.7 1.7 1.8 - - 5.8 .3 - 7.2
$5.00 and under $5.10............. 3.6 4.1 5.7 _ 1.8 4.0 3.3 _ 15.9 1.4 _ 1.7 _ _ _ 4.5 _ 3.7 5.3 7.2$5.10 and under $5.20............. 5.9 1.9 2.3 - 9.3 .5 9.9 - .5 3.8 - .9 1.7 1.8 1.4 13.5 - .6 13.8 6.5$5.20 and under $5.30............. 3.8 2.2 2.9 .3 1.3 - 7.1 - 4.3 .3 - .9 16.9 - - 2.2 23.2 - - 11.1$5.30 and under $5.40............. 1.5 9.3 .9 - 2.1 - 1.9 - .5 - - - 8.5 1.8 - - - - - 5.5$5.40 and under $5.50............. 1.1 .7 .7 - 2.4 .3 1.8 - .5 - - - 20.3 - .9 - - .3 - 7.5$5.50 and under $5.60............. 2.1 1.5 .7 - 1.2 2.3 1.5 7.6 7.8 .5 - 1.7 8.5 - - - - 2.6 3.2 10.4$5.60 and under $5.70............. 2.1 - 1.4 - 1.6 - .2 13.7 2.7 7.6 9.7 - . 1.7 - - 4.5 - - - 1.2$5.70 and under $5.80............. 3.8 - 9.3 - 2.5 .8 .6 26.3 .5 7.0 9.3 - 15.3 - .9 - - - 2.1 1.2$5.80 and under $5.90............. .9 - - - .9 .1 .6 3.4 - 2.9 - - - - - - - .2 20.2 1.0$5.90 and under $6.00............. .6 - 3.2 - - .1 .7 .6 .5 - - - - - .9 - - .2 - 1.0
$6.00 and under $6.10............. 1.1 _ 3.7 _ .9 .1 .7 3.0 3.2 .5 .2 _ 1.7 1.2 _ _ 1.4 .2 2.1 1.0$6.10 and under $6.20............. .5 - .4 - - - .8 .4 - .5 - - - - 3.2 - - - 3.2 .5$6.20 and under $6.30............. 2.3 - 3.0 - - - 4.0 1.8 1.1 1.4 1.5 - - 5.5 - 4.3 - 2.1 1.0$6.30 and under $6.40............. .6 - - - - .9 .8 - - 1.1 1.5 - - - - - - .2 - 1.7$6.40 and under $6.50............. 1.0 - .5 - - - 1.9 - 1.1 .2 .2 - - - - - 4.3 - - .5$6.50 and under $6.60............. 1.1 - .5 10.7 - - .8 - 2.2 2.0 2.5 - - - 4.6 - 1.4 - 1.1 1.7
See footnotes at end of table.
Digitized for FRASER http://fraser.stlouisfed.org/ Federal Reserve Bank of St. Louis

Table 4. Earnings distribution: Assemblers—Continued
(Percent distribution of assemblers in millwork manufacturing establishments by straight-time hourly earnings, United States and selected regions and States, June 1979)
Hourly earnings UnitedStates
Region State
NewEngland
MiddleAtlantic
BorderStates
Southeast
Southwest
GreatLakes
MiddleWest
Mountain Pacific Cali
fornia Florida Illinois NewYork Ohio Oregon
Pennsyl
vaniaTexas Wash
ingtonWis
consin
$6.60 and under $6.70............. 0.4 _ 0.5 _ _ 0.8 0.4 _ _ 0.6 _ _ _ _ _ _ 4.3 _ 4.3 0.7$6.70 and under $6.80............. .4 - - - - - .4 - 1.1 1.4 - - - - - - - - 9.6 .7$6.80 and under $6.90............. .4 - .2 - - - .7 - - .3 0.4 - - - 1.8 - 1.4 - - .2$6.90 and under $7.00............. .6 - - - - - 1.1 - 2.7 - - - - - - - - - - 1.0
$7.00 and under $7.10............. .6 _ _ _ _ 1.6 .3 4.0 .5 _ _ _ _ _ _ _ _ _ _ .2$7.10 and under $7.20............. .3 - .2 - - - .7 - - - - - - - - - 1.4 - - .5$7.20 and under $7.30............. .6 - - - - - 1.4 - - - - - - - - - - - - 1.2$7.30 and under $7.40............. .5 - - - - .1 1.0 - - .6 .6 - - - - - - 0.2 1.1 .5$7.40 and under $7.50............. .8 - - - .1 1.8 - - - - - - - - - - .2 - .5$7.50 and under $7.60............. .8 - .2 - - - .7 - .5 5.2 6.8 - - - - - 1.4 - 2.1 .2$7.60 and under $7.70............. 1.2 - 2.5 - - - .6 - 2.2 7.3 8.9 - - 7.8 - 6.7 1.4 - - 1.2$7.70 and under $7.80............. .6 - - - - - 1.3 - - - - - - - - - - - - .5$7.80 and under $7.90............. 2.2 - - - - - 5.0 - - - - - - - - - - - - .2$7.90 and under $8.00............. 1.1 - - -* - - 2.4 - - .3 - - - - - - - - 2.1 -
$8.00 and under $8.10............. 2.2 _ _ _ _ _ 5.0 _ _ _ _ _ _ _ _ _ _ _ _ _$8.10 and under $8.20............. .3 - - - - - .4 - 2.2 .6 .8 - - - - - - - - .5$8.20 and under $8.30............. 3.6 - - - - - 8.1 - - - - - - - - - - - - -$8.30 and under $8.40............. 1.0 - - - - - 1.9 - 2.7 .8 1.1 - - - - - - - - -$8.40 and under $8.50............. .6 - - - - - 1.2 - 1.1 _ - - - - - - - _ - -$8.50 and under $8.60............. 1.2 - 5.5 - - - 1.6 - - 1.2 - - - 18.7 - - - - 8.5 -$8.60 and under $8.80............. 2.1 - .5 - - - 3.8 - - 4.1 4.2 - - 1.2 - - 1.4 - 7.4 .2$8.80 and under $8.80............. - - - - - - - - - - - - - - - - - - - -$8.80 and under $8.90............. .3 - .4 - - - .6 - - - - - - - - - 2.9 - - -$8.90 and under $9.00............. 1.7 - .2 - - - 3.0 - 4.9 1.8 2.5 - - - - - 1.4 - - -
$9.00 and ove r......................... 4.0 - - - - - 1.7 - - 2 36.1 3 41.4 - - - 8.2 43.8 (4) - 2.1 -
1 Excludes premium pay for overtime and for work on weekends, holidays, and late shifts. 4 Workers were distributed as follows: 13.5 percent at $9 to $9.20; and 30.3 percent at $9.202 Workers were distributed as follows: 3.0 percent at $9 to $9.20; 17.2 percent at $9.20 to to $9.40.
$9.40; and 15.8 percent at $10.40 to $10.60.3 Workers were distributed as follows: 1.7 percent at $9 to $9.20; 17.7 percent at $9.20 to
$9.40; and 21.9 percent at $10.40 to $10.60.NOTE: Because of rounding, sums of individual items may not equal 100.
Digitized for FRASER http://fraser.stlouisfed.org/ Federal Reserve Bank of St. Louis

Table 5. Earnings distribution: Molding-machine operators
(Percent distribution of molding-machine operators in millwork manufacturing establishments by straight-time hourly earnings, United States and selected regions and States, June1979)
Hourly earnings UnitedStates
Region State
NewEngland
MiddleAtlantic
BorderStates
Southeast
Southwest
GreatLakes
MiddleWest
Mountain Pacific Cali
fornia Ohio OregonPennsyl
vaniaTexas Wash
ingtonWis
consin
Number of workers.................. 1,373 25 46 49 103 236 242 68 132 472 313 72 122 24 210 37 96Average hourly earnings1 ......... $5.82 $5.01 $5.13 $4.82 $4.41 $4.59 $5.74 $5.68 $6.23 $6.90 $6.87 $5.39 $6.67 $5.01 $4.38 $7.92 $5.56
Percent distribution.................. 100.0 100.0 100.0 100.0 100.0 100.0 100.0 100.0 100.0 100.0 100.0 100.0 100.0 100.0 100.0 100.0 100.0
Under $2.90.............................. - - - - - - - - - - - - - - - - -
$2.90 and under $3.00............. 1.7 - - - 11.7 3.8 - - - .4 .6 - - - 4.3 - -
$3.00 and under $3.10............. 1.5 _ _ _ _ 8.9 _ _ _ _ _ _ _ _ 10.0 _ _$3.10 and under $3.20............. .1 - 2.2 - - - - - - - - - - - - - -$3.20 and under $3.30............. 1.4 - 2.2 8.2 4.9 3.8 - - - S. - - - - 4.3 - -$3.30 and under $3.40............. .1 - 2.2 - - .4 - - - - - - - - .5 - -
$3.40 and under $3.50............. .9 4.0 2.2 - 4.9 2.1 - - - .2 .3 - - - 2.4 - -$3.50 and under $3.60............. 2.8 - - 18.4 1.9 3.4 - 5.9 .8 3.0 4.5 - - - 3.8 - -$3.60 and under $3.70............. .9 4.0 2.2 - - 2.1 - 5.9 - .2 .3 - - - 2.4 - -$3.70 and under $3.80............. 2.5 4.0 - 4.1 15.5 4.2 - 7.4 .8 - - - - - 4.8 - -$3.80 and under $3.90............. 2.0 4.0 17.4 - 1.9 3.4 - 11.8 - - - - - 33.3 3.8 - -
$3.90 and under $4.00............. 1.5 - - 8.2 2.9 5.1 - - 1.5 - - - - - 5.7 - -
$4.00 and under $4.10............. 2.5 _ 2.2 _ 7.8 1.7 _ 1.5 4.5 3.0 4.5 _ _ 4.2 1.9 _ _$4.10 and under $4.20............. .9 - - - 2.9 1.7 1.7 - 1.5 - - 5.6 - - 1.9 - -
$4.20 and under $4.30............. 2.5 4.0 2.2 16.3 2.9 5.9 2.5 - .8 - - 4.2 - - 6.7 - 3.1$4.30 and under $4.40............. 2.2 - 2.2 - 5.8 .4 9.1 - - - - 27.8 - - .5 - 2.1$4.40 and under $4.50............. 1.2 - 4.3 - 4.9 1.7 .4 - .8 .6 - - 2.5 8.3 1.9 - 1.0$4.50 and under $4.60............. 1.7 12.0 - - 2.9 6.4 .4 - .8 - - - - - 7.1 - -
$4.60 and under $4.70............. 1.4 - - - - 4.7 1.7 - .8 .6 - - 2.5 - 3.3 - 4.2$4.70 and under $4.80............. 2.8 - 13.0 2.0 3.9 4.2 2.5 - 8.3 - - 8.3 - 8.3 4.8 - -
$4.80 and under $4.90............. 1.8 - - - _ 1.3 5.8 _ 6.1 _ - 12.5 - - 1.4 - 4.2$4.90 and under $5.00............. .9 - - 4.1 - .4 3.3 1.5 .8 - - 8.3 - - .5 - 2.1
$5.00 and under $5.10............. 3.0 24.0 4.3 10.2 _ 5.9 2.5 _ 6.1 _ _ _ _ _ 3.8 _ 2.1$5.10 and under $5.20............. 1.9 - - 6.1 - .4 8.3 - 1.5 - - - - - .5 - 14.6$5.20 and under $5.30............. 1.3 - 2.2 - - 3.0 2.9 - 2.3 - - 1.4 - 4.2 3.3 - -
$5.30 and under $5.40............. 1.1 8.0 - - - .8 3.7 - - .4 - - 1.6 - 1.0 - 4.2$5.40 and under $5.50............. 1.5 - - - 5.8 .4 3.7 - - .8 .3 - 2.5 - .5 - 4.2$5.50 and under $5.60............. 5.7 - 2.2 - - 8.5 4.5 - 15.2 5.5 4.5 - 8.2 4.2 9.5 5.4 7.3$5.60 and under $5.70............. 2.8 32.0 6.5 - 1.0 .4 5.0 _ .8 2.5 3.8 _ - 12.5 .5 - 9.4$5.70 and under $5.80............. .5 _ 8.7 _ _ _ _ - .8 .4 - _ - - - 5.4 -
$5.80 and under $5.90............. 1.7 - - - _ _ 3.7 _ _ 3.0 - _ 10.7 - - 2.7 8.3$5.90 and under $6.00............. 3.5 - - - - - 8.3 1.5 .8 5.5 7.7 - 1.6 - - - 18.8
$6.00 and under $6.10............. 3.9 _ _ _ 12.6 2.1 2.9 10.3 _ 4.7 3.5 _ 4.1 _ 1.4 16.2 5.2$6.10 and under $6.20............. 1.4 - - - - - 5.4 - - 1.3 1.9 15.3 - - - - 2.1$6.20 and under $6.30............. 2.9 - 6.5 12.2 - 1.3 4.1 4.4 3.0 2.3 3.2 - .8 4.2 1.4 - -
$6.30 and under $6.40............. 1.0 - 6.5 - - - .4 _ _ 2.1 1.6 - 2.5 12.5 - 5.4 1.0$6.40 and under $6.50........... 2.9 - - - - - .4 4.4 3.0 6.8 9.9 - - - - 2.7 1.0
See footnotes at end of table.
Digitized for FRASER http://fraser.stlouisfed.org/ Federal Reserve Bank of St. Louis
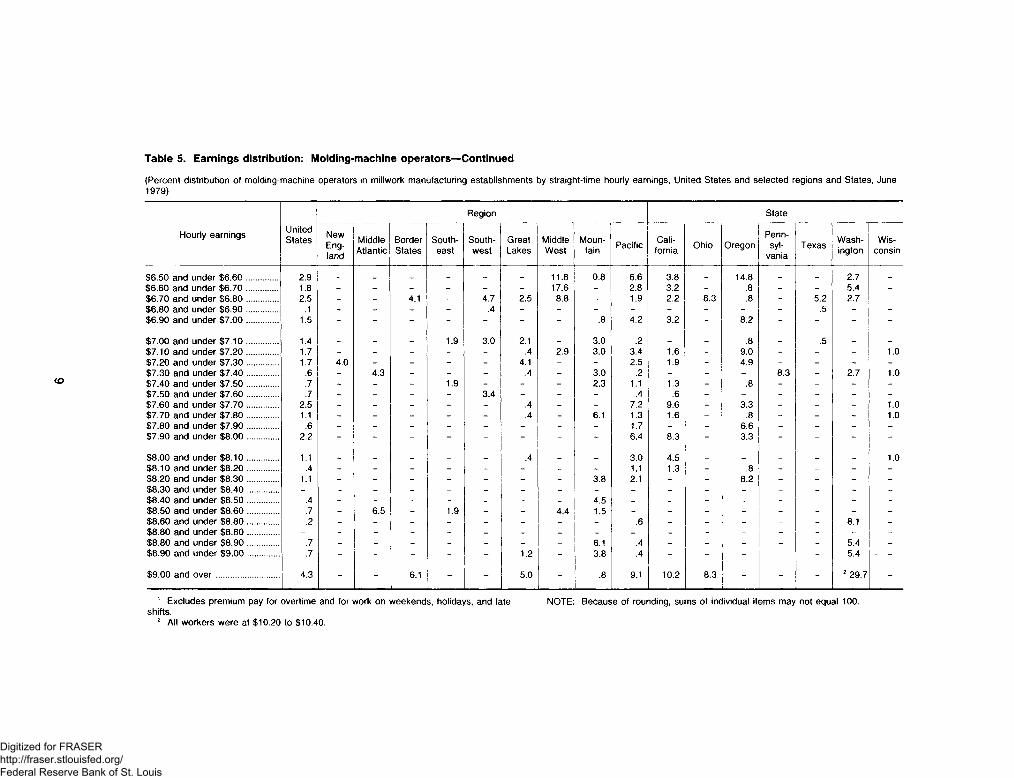
Table 5. Earnings distribution: Molding-machine operators—Continued
(Percent distribution of molding-machine operators in millwork manufacturing establishments by straight-time hourly earnings, United States and selected regions and States, June1979)
Hourly earnings UnitedStates
Region State
NewEngland
MiddleAtlantic
BorderStates
Southeast
Southwest
GreatLakes
MiddleWest
Mountain Pacific Cali
fornia Ohio OregonPennsyl
vaniaTexas Wash
ingtonWis
consin
$6.50 and under $6.60............ 2.9 _ _ _ _ _ _ 11.8 0.8 6.6 3.8 _ 14.8 _ _ 2.7 _$6.60 and under $6.70............ 1.8 - - - - - - 17.6 - 2.8 3.2 - .8 - - 5.4 -$6.70 and under $6.80 ............. 2.5 - - 4.1 - 4.7 2.5 8.8 - 1.9 2.2 8.3 .8 - 5.2 2.7 -$6.80 and under $6.90............ .1 - - - - .4 - - - - - - - - .5 - -$6.90 and under $7.00............ 15 - - - - - - - .8 4.2 3.2 - 8.2 - - - -
$7.00 and under $7.10............ 1.4 _ _ _ 1.9 3.0 2.1 _ 3.0 .2 _ _ .8 _ .5 _ _$7.10 and under $7.20............ 1.7 - - - - - .4 2.9 3.0 3.4 1.6 - 9.0 - - - 1.0$7.20 and under $7.30............ 1.7 4.0 - - - - 4.1 - - 2.5 1.9 - 4.9 - - - -$7.30 and under $7.40............ .6 - 4.3 - - - .4 - 3.0 .2 - - - 8.3 - 2.7 1.0$7.40 and under $7.50............ .7 - - - 1.9 - - - 2.3 1.1 1.3 - .8 - - - -$7.50 and under $7.60............ .7 - - - - 3.4 - - - .4 .6 - - - - - -$7.60 and under $7.70............ 2.5 - - - - - .4 - - 7.2 9.6 - 3.3 - - - 1.0$7.70 and under $7.80............ 1.1 - - - - - .4 - 6.1 1.3 1.6 - .8 - - - 1.0$7.80 and under $7.90............ .6 - - - - - - - - 1.7 - - 6.6 - - - -$7.90 and under $8.00............ 2.2 - - - - - - - - 6.4 8.3 - 3.3 - - - -
$8.00 and under $8.10............ 1.1 _ _ _ _ _ .4 _ _ 3.0 4.5 _ _ _ _ _ 1.0$8.10 and under $8.20............ .4 - - - - - - - - 1.1 1.3 - .8 - - - -$8.20 and under $8.30............ 1.1 - - - - - - - 3.8 2.1 - - 8.2 - - - -$8.30 and under $8.40............ - - - - - - - - - - - - - - - - -$8.40 and under $8.50............ .4 - - - - - - - 4.5 - - - - - - - -$8.50 and under $8.60............ .7 - 6.5 - 1.9 - - 4.4 1.5 - - - - - - - -$8.60 and under $8.80............ .2 - - - - - - - - .6 - - - - - 8.1 -$8.80 and under $8.80............ - - - - - - - _ - - - - - - - - -$8.80 and under $8.90............ .7 - - - - - - - 6.1 .4 - - - - - 5.4 -$8.90 and under $9.00............ .7 - - - - - 1.2 - 3.8 .4 ~ - - - - 5.4 ■ -
$9.00 and ove r......................... 4.3 - - 6.1 - - 5.0 - .8 9.1 10.2 8.3 - - - 2 29.7 -
1 Excludes premium pay for overtime and for work on weekends, holidays, and late shifts.
2 All workers were at $10.20 to $10.40.
NOTE: Because of rounding, sums of individual items may not equal 100.
Digitized for FRASER http://fraser.stlouisfed.org/ Federal Reserve Bank of St. Louis

Table 6. Earnings distribution: Machine off-bearers
(Percent distribution of machine off-bearers in millwork manufacturing establishments by straight-time hourly earnings, United States and selected regions and States, June1979)
Hourly earnings UnitedStates
Region State
MiddleAtlantic
BorderStates
Southeast
Southwest
GreatLakes
MiddleWest
Mountain Pacific Cali
fornia Florida Ohio Oregon Texas Washington
Wisconsin
Number of workers.................. 2,590 35 54 156 448 560 79 150 1,098 426 36 141 519 389 153 315Average hourly earnings1 ......... $5.06 $3.77 $3.34 $3.62 $3.27 $5.07 $4.48 $5.60 $6.09 $5.81 $3.79 $4.75 $6.26 $3.23 $6.33 $4.97
Percent distribution.................. 100.0 100.0 100.0 100.0 100.0 100.0 100.0 100.0 100.0 100.0 100.0 100.0 100.0 100.0 100.0 100.0
Under $2.90.............................. - - - - - - - - - - - - - - - -
$2.90 and under $3.00............ 5.3 11.4 - 5.1 27.7 - - - - - 5.6 - - 28.8 - -
$3.00 and under $3.10............ 5.0 _ 14.8 22.4 18.3 _ 5.1 _ _ _ 13.9 _ - 18.8 - -$3.10 and under $3.20............ 2.7 11.4 14.8 4.5 11.4 - - - - - 13.9 - - 12.6 - -$3.20 and under $3.30............ 3.6 - 24.1 2.6 14.3 .4 8.9 - .2 - - 1.4 .4 16.5 - -$3.30 and under $3.40............ 1.3 - 7.4 - 1.3 2.7 10.1 - - - - 1.4 - 1.5 - -$3.40 and under $3.50............ 1.3 28.6 14.8 7.1 .4 - - 2.0 - - 2.8 - - .5 - -$3.50 and under $3.60............ 2.4 2.9 7.4 3.8 3.3 4.5 7.6 .7 .4 - 2.8 9.9 .4 3.9 1.3 -$3.60 and under $3.70............ 1.4 2.9 1.9 4.5 2.9 2.0 - 2.0 - - 5.6 - - 3.3 - 3.5$3.70 and under $3.80............ 2.0 - 3.7 7.1 4.7 .5 - 4.0 .5 1.4 5.6 - - 1.8 - 1.0$3.80 and under $3.90............ 1.3 2.9 9.3 - 1.3 3.2 1.3 - - - - 12.8 - 1.5 - -$3.90 and under $4.00............ 2.3 2.9 1.9 24.4 - .9 5.1 1.3 .8 .5 27.8 - 1.3 - - 1.6
$4.00 and under $4.10............ 3.1 _ _ 9.0 11.6 .2 7.6 2.7 .2 _ _ _ .4 7.7 _ .3$4.10 and under $4.20............ 1.7 - - 1.3 - .2 11.4 4.0 2.3 - - - 4.8 - - .3$4.20 and under $4.30............ 2.3 - - - .9 6.3 - 2.0 1.6 - - 12.8 2.3 1.0 3.9 5.4$4.30 and under $4.40............ 1.2 - - - - 4.3 3.8 .7 .3 - - 8.5 .6 - - 2.9$4.40 and under $4.50............ 1.7 2.9 - 1.3 - 2.7 - 4.7 1.6 3.8 5.6 .7 .4 - - 4.4$4.50 and under $4.60............ 2.1 31.4 - 4.5 .7 3.2 - .7 1.4 - 5.6 - 1.0 .8 6.5 5.7$4.60 and under $4.70............ .6 - - 1.3 - .9 - 4.0 .3 - 5.6 - .6 - - 1.6$4.70 and under $4.80............ 3.8 - - - - 13.4 - 2.7 1.8 .9 - 28.4 2.7 - 1.3 11.1$4.80 and under $4.90............ .9 2.9 - - .9 .7 - 1.3 1.1 - - - 1.9 1.0 1.3 .6$4.90 and under $5.00............ 1.9 - - - - 5.0 - - 1.9 2.8 - - 1.7 - - 8.9
$5.00 and under $5.10............ 2.9 _ _ _ _ 5.5 _ 22.0 .9 _ _ _ 1.5 _ 1.3 5.4$5.10 and under $5.20............ 3.7 - - - - 8.2 - - 4.6 10.1 - - .8 - 2.6 12.4$5.20 and under $5.30............ 3.3 - - - .2 11.1 - 4.0 1.5 1.9 - - .4 .3 3.9 19.7$5.30 and under $5.40............ 1.2 - - - - 4.6 - - .5 - - .7 1.0 - - 5.4$5.40 and under $5.50............ 3.5 - - - - .5 3.8 4.0 7.2 10.3 - - 6.6 - .7 -$5.50 and under $5.60............ 2.9 - - 1.3 - 1.2 3.8 4.0 5.3 10.3 5.6 1.4 .6 - 7.2 1.6$5.60 and under $5.70............ 1.3 - - - - .4 6.3 - 2.5 4.9 - - 1.2 - - .6$5.70 and under $5.80............ 3.1 - - - - 2.0 15.2 - 5.2 5.6 - 2.8 6.0 - 1.3 2.2$5.80 and under $5.90............ 4.1 - - - - 1.1 1.3 - 9.1 .9 - 2.8 18.5 - - .6$5.90 and under $6.00............ .8 - - - - 1.1 - - 1.3 1.9 - .7 .4 - 2.6 1.6
$6.00 and under $6.10............ 1.1 _ _ _ _ .9 8.9 _ 1.5 1.9 _ 1.4 1.7 _ _ 1.0$6.10 and under $6.20............ .5 - - - - .2 - - 1.0 2.6 - .7 - - - -$6.20 and under $6.30............ .6 - - - - 1.2 - - .7 1.2 - - .6 - - -$6.30 and under $6.40............ 3.9 - - - - 1.2 - - 8.5 21.8 - 2.1 - - - -$6.40 and under $6.50 ............. 1.9 - - - - .4 - - 4.2 10.6 - .7 .2 - - -$6.50 and under $6.60............ .5 - - - - .7 - - .8 .2 - 2.1 1.5 - - .3
See footnotes at end of table.
Digitized for FRASER http://fraser.stlouisfed.org/ Federal Reserve Bank of St. Louis

Table 6. Earnings distribution: Machine off-bearers—Continued
(Percent distribution of machine off-bearers in millwork manufacturing establishments by straight-time hourly earnings, United States and selected regions and States, June1979)
Hourly earnings UnitedStates
Region State
MiddleAtlantic
BorderStates
Southeast
Southwest
GreatLakes
MiddleWest
Mountain Pacific Cali
fornia Florida Ohio Oregon Texas Washington
Wisconsin
$6.60 and under $6.70............ 0.8 _ _ _ _ 0.4 _ _ 1.7 3.3 _ 0.7 _ _ 3.3 _$6.70 and under $6.80............ .4 - - - - .5 - - .7 .2 - 1.4 - - 4.6 0.3$6.80 and under $6.90............ 1.1 - - - - .9 - - 2.2 - - 2.8 1.9 - 9.2 .3$6.90 and under $7.00............ .1 - - - - .4 - - - - - .7 - - - .3
$7.00 and under $7.10............ 3.0 _ _ _ _ .7 _ _ 6.7 _ _ 1.4 _ _ 48.4 .3$7.10 and under $7.20............ .3 - - - - .5 - - .5 1.2 - 1.4 - - - -$7.20 and under $7.30............ - - - - - - - - ■ - - - - - - - -
$7.30 and under $7.40............ .3 - - - - .4 - 4.0 - - - - - - - .3$7.40 and under $7.50............ 1.4 - - - - - - 23.3 - - - - _ _ _ _
$7.50 and under $7.60............ .3 - - - - .2 - - .6 1.6 - - - - - -
$7.60 and under $7.70............ 7.0 - - - - .2 - 6.0 15.7 - - - 33.1 - - .3$7.70 and under $7.80............ .6 - - - - .2 - - 1.3 - - - 2.7 - _ _
$7.80 and under $7.90............ .4 - - - - .2 _ _ .8 - - - 1.7 _ _ _
$7.90 and under $8.00............ .1 - - - - - - - .2 - - - .2 - .7 -
$8.00 and under $8.10............ .3 _ _ _ .4 _ .5 _ _ 1.0 _ _
$8.10 and under $8.20............ .1 - - - - .4 _ - - - _ _ _ - _ _
$8.20 and under $8.30............ .2 - - - - .7 _ - - _ _ _ _ _ _ _
$8.30 and under $8.40............ 0 - - - _ .2 _ _ _ _ _ _ _ _ _ _
$8.40 and under $8.50............ 0 - _ _ - .2 - _ - _ _ _ _ _ _ _
$8.50 and under $8.60............ .1 _ - _ - .5 _ _ _ _ _ _ _ - _ _
$8.60 and under $8.80............ .1 - - _ _ .4 _ _ _ _ - _ _ _ _ _
$8.80 and under $8.80............ - - - _ _ _ _ _ _ _ _ - _ _ _ _
$8.80 and under $8.90............ .1 _ _ _ - .4 _ _ _ _ - _ _ _ _ _
$8.90 and under $9.00............ 0 - - - - .2 - - - - - - - - -
$9.00 and ove r......................... .2 - - - - 1.1 - - - - - - - - - -
1 Excludes premium pay for overtime and for work on weekends, holidays, and NOTE: Because of rounding, sums of individual items may not equal 100.late shifts.
2 Less than 0.05 percent.
Digitized for FRASER http://fraser.stlouisfed.org/ Federal Reserve Bank of St. Louis

Table 7. Earnings distribution: Forklift operators
(Percent distribution of forklift operators in millwork manufacturing establishments by straight-time hourly earnings, United States and selected regions and States, June 1979)
Hourly earnings UnitedStates
Region State
MiddleAtlantic
BorderStates
Southeast
Southwest
GreatLakes
MiddleWest
Mountain Pacific Cali
fornia Florida NewYork Ohio Oregon
Pennsyl
vaniaTexas Wash
ingtonWis
consin
Number of workers.................. 1,258 69 47 85 147 334 94 111 367 183 26 28 96 125 23 131 59 100Average hourly earnings1 ......... $5.57 $4.99 $4.28 $4.22 $3.88 $5.49 $5.26 $6.05 $6.84 $6.72 $4.20 $4.74 $4.69 $6.85 $4.76 $3.89 $7.23 $5.24
Percent distribution................... 100.0 100.0 100.0 100.0 100.0 100.0 100.0 100.0 100.0 100.0 100.0 100.0 100.0 100.0 100.0 100.0 100.0 100.0
Under $2.90.............................. - - - - - - - - - - - - - - - - - -
$2.90 and under $3.00............. .2 - 6.4 - - - - - - - - - - - - - - -
$3.00 and under $3.10............. .8 _ _ 2.4 5.4 _ _ _ _ _ _ _ _ - _ 6.1 - -$3.10 and under $3.20............. 1.0 - - 3.5 6.1 - - - - - 3.8 - - - - 6.9 - -$3.20 and under $3.30............. 1.8 1.4 - 1.2 14.3 - - - - - 3.8 3.6 - - - 10.7 - -$3.30 and under $3.40............. .2 - - - 2.0 - - - - - - - - - - 2.3 - -$3.40 and under $3.50............. .6 - - - 4.1 . 6 - - - - - - - - - 3.1 - -
$3.50 and under $3.60............. 2.4 1.4 - 3.5 12.2 2.4 - - - - 11.5 3.6 2.1 - - 12.2 - -$3.60 and under $3.70............. 1.3 2.9 - 2.4 6.1 . 6 1.1 - - - - 3.6 - - 4.3 6.9 - -$3.70 and under $3.80............. 2.4 7.2 4.3 3.5 4.8 - 12.8 - - - - - - - 21.7 5.3 - -$3.80 and under $3.90............. 1.2 - - 2.4 3.4 . 6 6.4 - - - - - - - - 3.8 - -
$3.90 and under $4.00............. 4.2 - 46.8 14.1 7.5 2.4 - - - - - - 7.3 - - 8.4 - 1.0
$4.00 and under $4.10............. 2.1 5.8 6.4 4.7 3.4 2.1 _ 3.6 _ _ 7.7 14.3 7.3 _ _ 3.8 _ _
$4.10 and under $4.20 ................... .8 - - 11.8 - - - - - - 3.8 - - - - - - -
$4.20 and under $4.30 ................... 1.8 1.4 2.1 4.7 4.8 2.1 - 2.7 - - - 3.6 6.3 - - 5.3 - 1.0$4.30 and under $4.40 ................... 2.4 4.3 - - - 3.0 17.0 .9 - - - - 10.4 - 13.0 - - -
$4.40 and under $4.50............. 1.7 - - 16.5 2.0 1.2 - - .3 .5 53.8 - - - - 2.3 - 4.0$4.50 and under $4.60............. 2.2 - 8.5 5.9 6.1 .6 - 6.3 - - 15.4 - 2.1 - - 6.9 - -
$4.60 and under $4.70 ................... 1.8 8.7 - 10.6 .7 - 1.1 3.6 .5 - - 21.4 - 1.6 - .8 - -
$4.70 and under $4.80 ................... 1.9 7.2 8.5 - 6.8 - 3.2 - .3 .5 - 17.9 - - - 4.6 - -
$4.80 and under $4.90 ................... 4.8 - - - 2.7 15.3 1.1 2.7 - - - - 51.0 - - 2.3 - 2.0$4.90 and under $5.00............. 1.1 4.3 - - - 2.4 - 2.7 - - - 3.6 - - 8.7 - - 8.0
$5.00 and under $5.10 ................... 1.4 _ _ 5.9 _ .6 _ 9.0 _ _ _ _ _ _ _ _ _ 2.0$5.10 and under $5.20 ................... 4.8 2.9 4.3 7.1 2.7 13.8 - .9 - - - - - - - 3.1 - 25.0$5.20 and under $5.30 ................... 2.1 2.9 - - 2.0 3.9 - 8.1 - - - 3.6 - - 4.3 2.3 - 11.0$5.30 and under $5.40 ................... 3.3 - 6.4 - - 10.8 - 1.8 .3 - - - - .8 - - - 20.0$5.40 and under $5.50............. 2.3 15.9 - - .7 2.4 - 8.1 - - - - - - 47.8 .8 - 5.0$5.50 and under $5.60 ................... 2.8 5.8 - - .7 5.7 - 4.5 1.6 2.7 - 14.3 2.1 .8 - .8 - 13.0$5.60 and under $5.70 ................... 1.4 1.4 - - - 3.9 3.2 - - - - 3.6 2.1 - - - - 3.0$5.70 and under $5.80 ................... 4.1 23.2 - - - 5.1 3.2 .9 3.8 6.6 - - 9.4 1.6 - - - 2.0$5.80 and under $5.90 ................... 2.5 1.4 - - - 3.0 4.3 6.3 2.5 4.4 - 3.6 - .8 - - - -
$5.90 and under $6.00 ................... 2.1 - - - - .9 10.6 - 3.8 7.7 - - - - - - - 3.0
$6.00 and under $6.10 ................... 5.8 _ 6.4 _ 1.4 4.2 22.3 3.6 7.9 3.3 _ _ _ 17.6 _ 1.5 1.7 _
$6.10 and under $6.20 ................... 2.4 - - - - - 10.6 1.8 4.9 8.7 - - - 1.6 - - - -
$6.20 and under $6.30 ................... 1.3 - - - - - _ _ 4.4 6.0 - - - 2.4 - - 3.4 -
$6.30 and under $6.40 ................... .6 - - - - - - - 1.9 2.2 - - - - - - 5.1 -
$6.40 and under $6.50............. 2.4 - - - - .9 - - 7.4 2.7 - - - 17.6 - - - -
$6.50 and under $6.60............. 2.9 - - - ~ - - - 9.8 8.7 - - - 12.8 - - 6.8
See footnotes at end of table.
Digitized for FRASER http://fraser.stlouisfed.org/ Federal Reserve Bank of St. Louis

Table 7. Earnings distribution: Forklift operators—Continued
(Percent distribution of forklift operators in millwork manufacturing establishments by straight-time hourly earnings, United States and selected regions and States, June 1979)
Hourly earnings UnitedStates
Region State
MiddleAtlantic
BorderStates
Southeast
Southwest
GreatLakes
MiddleWest
Mountain Pacific Cali
fornia Florida NewYork Ohio Oregon
Pennsyl
vaniaTexas Wash
ingtonWis
consin
$6.60 and under $6.70............ 0.7 _ _ _ _ _ _ _ 2.5 1.1 . . . 11.9$6.70 and under $6.80............ 1.4 - - - _ - _ _ 4.6 4.9 _ _ _ 6.4 _ _ _ _$6.80 and under $6.90............ .2 1.4 - - _ - _ _ .5 _ _ 3.6 _ 1.6 _ _ _ _$6.90 and under $7.00............ .5 - - - - - - - 1.6 - - - - 1.6 - - 6.8 -
$7.00 and under $7.10............ _ _ _ _ _ _ _ _ _$7.10 and under $7.20............ 1.4 - - - _ _ _ _ 4.6 8.7 _ _ _ _ _ _ 1.7 _
$7.20 and under $7.30............ 1.9 - - - _ _ _ _ 6.5 13.1 _ _ _ _ _ _ _
$7.30 and under $7.40............ .8 - - - - _ - _ 2.7 4.9 _ _ _ _ _ _ 1.7 _$7.40 and under $7.50............ 2.7 - _ - - - _ _ 9.3 2.7 _ _ _ 1.6 _ _ 45.8 _
$7.50 and under $7.60............ 1.0 - - - _ _ _ _ 3.3 _ _ _ 9.6 _ _ _
$7.60 and under $7.70............ .1 - - - _ _ _ 0.9 _ _ _ _ _ _ _ _ _$7.70 and under $7.80............ - - _ _ _ _ _ _ _ _ _ _ _ _ _ _ _ _
$7.80 and under $7.90............ 1.6 - _ _ 0.9 _ 15.3 _ _ _ _ _ _ _ _ _
$7.90 and under $8.00............ 1.6 - - - - 1.2 - - 4.4 3.8 - - - 7.2 - - - -
$8.00 and under $8.10............ .7 _ _ _ _ .3 _ 7.2 _
$8.10 and under $8.20............ 1.9 - - - - .6 _ 5.4 4.4 _ _ _ _ 8.8 _ _ 8.5 _
$8.20 and under $8.30............ 1.0 - - - _ .6 3.2 3.6 1.1 _ _ _ _ _ _ _ 6.8 _
$8.30 and under $8.40............ .4 - - _ _ .6 _ .8 _ _ _ _ 2.4 _ _
$8.40 and under $8.50............ .7 - _ _ _ 1.5 _ _ 1.1 _ _ _ _ 3.2 _ _ _ _
$8.50 and under $8.60............ .4 _ - _ .3 _ _ 1.1 2.2 _ _ _ _ _ _$8.60 and under $8.80............ .3 _ _ _ _ 1.2 _ _ _ _ _ _ _ _ _ _ _
$8.80 and under $8.80............ - - _ _ _ _ _ _ _ _ _ _ _ _ _
$8.80 and under $8.90............ .1 _ _ _ _ .3 _ _ _ _ _ _ _ _ _ _ _ _$8.90 and under $9.00............ 1.0 - - - - 3.9 - - - - - - - - - - - -
$9.00 and o ve r......................... .7 - - - - .3 - - 2.2 4.4 - - - - - - - -
1 Excludes premium pay for overtime and for work on weekends, holidays, and late NOTE: Because of rounding, sums of individual items may not equal 100.shifts.
Digitized for FRASER http://fraser.stlouisfed.org/ Federal Reserve Bank of St. Louis

Table 8. Earnings distribution: Rip-saw operators
(Percent distribution of rip-saw operators in millwork manufacturing establishments by straight-time hourly earnings, United States and selected regions and States, June1979)
Hourly earnings UnitedStates
Region State
NewEngland
MiddleAtlantic
BorderStates
Southeast
Southwest
GreatLakes
MiddleWest
Mountain Pacific Cali
fornia Ohio Oregon Texas Washington
Wisconsin
Number of workers.................. 774 20 34 25 66 144 174 21 36 254 147 52 56 120 51 84Average hourly earnings1 ......... $5.64 $3.63 $5.19 $4.14 $3.67 $4.47 $5.51 $4.85 $6.33 $7.24 $7.56 $5.16 $6.88 $4.20 $6.73 $5.40
Percent distribution................... 100.0 100.0 100.0 100.0 100.0 100.0 100.0 100.0 100.0 100.0 100.0 100.0 100.0 100.0 100.0 100.0
Under $2.90.............................. - - - - - - - - - - - - - - - -
$2.90 and under $3.00............. 1.3 - - - 6.1 4.2 - - - - - - - 5.0 - -
$3.00 and under $3.10............. 2.1 _ _ _ 24.2 _ _ _ _ - _ _ _ - _ _$3.10 and under $3.20............. 2.7 30.0 - 12.0 3.0 6.9 - - - - - - - 8.3 - -$3.20 and under $3.30............. 1.9 30.0 - - - 6.3 - - - - - - - 7.5 - -$3.30 and under $3.40............. .5 10.0 - - 3.0 - - - - - - - - - - -$3.40 and under $3.50............. .4 - - - - 2.1 - - - - - - - 2.5 - -$3.50 and under $3.60............. 1.4 - - 4.0 1.5 5.6 - 4.8 - - - - - 6.7 - -$3.60 and under $3.70............. 3.2 - 2.9 4.0 - 9.7 2.9 19.0 - - 9.6 - 11.7 - -$3.70 and under $3.80............. 2.6 - 2.9 - 18.2 4.9 - - - - - - - 5.8 - -$3.80 and under $3.90............. .8 - - - 3.0 1.4 1.1 - - - - 3.8 - 1.7 - -$3.90 and under $4.00............. 2.7 - - 20.0 9.1 1.4 3.4 9.5 - - i — 11.5 - 1.7 - -
$4.00 and under $4.10............. 3.1 5.0 2.9 _ 6.1 7.6 _ _ _ 2.8 _ _ 12.5 9.2 _ _$4.10 and under $4.20............. 3.2 - - 8.0 13.6 3.5 4.6 - - .4 .7 15.4 - 4.2 - -$4.20 and under $4.30............. 3.6 5.0 47.1 - - 4.2 2.3 - - .4 .7 3.8 - 5.0 - 2.4$4.30 and under $4.40............. .6 - - - 3.0 .7 1.1 - - - - - - .8 - 2.4$4.40 and under $4.50............. .3 - - - - .7 .6 - - - - 1.9 - .8 - -$4.50 and under $4.60............. 2.7 5.0 - 44.0 1.5 3.5 - 14.3 - - - - - 4.2 - -$4.60 and under $4.70............. .6 - - - 3.0 - 1.1 4.8 - - - - - - - 2.4$4.70 and under $4.80............. 2.6 - - 8.0 4.5 - 7.5 - - .8 - 23.1 3.6 - - 1.2$4.80 and under $4.90............. .6 - - - - 2.8 .6 - _ - - - - 3.3 - 1.2$4.90 and under $5.00............. .6 5.0 - - - .7 1.7 - - - - - - .8 - 3.6
$5.00 and under $5.10............. 2.3 10.0 14.7 _ _ 3.5 3.4 _ _ _ _ _ _ .8 _ 2.4$5.10 and under $5.20............. 2.1 - - - - - 4.6 - 13.9 1.2 .7 - - - 3.9 4.8$5.20 and under $5.30............. 4.7 - - - - 7.6 13.2 - - .8 - - 3.6 2.5 - 23.8$5.30 and under $5.40............. 1.8 - - - - 2.1 5.7 - 2.8 - - - - 2.5 - 11.9$5.40 and under $5.50............. 2.8 - - - - .7 12.1 - - * - 5.8 - .8 - 9.5$5.50 and under $5.60............. 3.7 - 2.9 - - - 5.7 38.1 - 3.9 2.7 - - - 11.8 9.5$5.60 and under $5.70............. 1.2 - - - - - 1.7 - 16.7 - - - - - - 3.6$5.70 and under $5.80............. 1.3 - - - - 2.1 1.7 - - 1.6 .7 - - 2.5 5.9 1.2$5.80 and under $5.90............. 2.7 - - - - - 7.5 - 16.7 .8 1.4 11.5 - - - 6.0$5.90 and under $6.00............. 2.2 - - - - .7 4.6 - - 3.1 5.4 - - .8 - 9.5
$6.00 and under $6.10............. 1.9 _ 5.9 _ _ 4.2 _ _ _ 2.8 _ _ _ _ 13.7 _
$6.10 and under $6.20............. .5 - - - - - - _ _ 1.6 2.7 - - - - -
$6.20 and under $6.30............. 2.1 - - - - .7 1.1 _ 11.1 3.5 5.4 - - .8 2.0 2.4$6.30 and under $6.40............. .3 - - - - - _ _ _ .8 .7 - - - 2.0 -$6.40 and under $6.50............. 1.8 - - - - - - - 16.7 3.1 5.4 - - - - -
See footnotes at end of table.Digitized for FRASER http://fraser.stlouisfed.org/ Federal Reserve Bank of St. Louis

Table 8. Earnings distribution: Rip-saw operators—Continued
(Percent distribution of rip-saw operators in millwork manufacturing establishments by straight-time hourly earnings, United States and selected regions and States, June1979)
Hourly earnings UnitedStates
Region State
NewEngland
MiddleAtlantic
BorderStates
Southeast
Southwest
GreatLakes
MiddleWest
Mountain Pacific Cali
fornia Ohio Oregon Texas Washington
Wisconsin
$6.50 and under $6.60............ 5.4 _ 2.9 _ _ 8.3 _ _ _ 11.4 10.9 _ 8.9 10.0 15.7 _$6.60 and under $6.70............ .8 - - - - - 0.6 - - 2.0 3.4 - - - - 1.2$6.70 and under $6.80............ 2.6 - - - - - .6 9.5 - 6.7 10.9 - 1.8 - - 1.2$6.80 and under $6.90............ .3 - - - - - - - - .8 - - 3.6 - - -$6.90 and under $7.00............ 2.1 - - - - - 2.9 - - 4.3 - - 14.3 - 5.9 -
$7.00 and under $7.10............ 2.3 _ _ _ _ 4.2 _ _ 5.6 3.9 4.8 _ _ _ 5.9 _$7.10 and under $7.20............ .4 - - - - - - - 2.8 .8 1.4 - - - - -$7.20 and under $7.30............ .3 - - - - - - - - .8 1.4 - - - - -
$7.30 and under $7.40............ .4 - 2.9 - - - - - - .8 .7 - - - 2.0 -$7.40 and under $7.50............ 1.6 - - - - - - - - 4.7 1.4 - - - 19.6 -$7.50 and under $7.60............ 3.0 - 5.9 - - - .6 - - 7.9 12.2 1.9 3.6 - - -$7.60 and under $7.70............ - - - - - - - - - - - - - - - -$7.70 and under $7.80............ .6 - - - - - - - - 2.0 - - 7.1 - 2.0 -$7.80 and under $7.90............ 1.2 - - - - - - - - 3.5 - - 16.1 - - _$7.90 and under $8.00............ 1.9 - - - - - - - - 5.9 2.0 - 21.4 - - -
$8.00 and under $8.10............ _ _ _ _ _ _ _ _ _ _ _ _ _ _ _ _$8.10 and under„$8.20............ - - - - - - - - - _ - - - - - -
$8.20 and under $8.30........... .3 - - - - - - - - .8 - - 3.6 - - _$8.30 and under $8.40............ .3 - - - - - - - 5.6 - - - - - - -
$8.40 and under $8.50............ - - - - - - - - - - _ - - - - -$8.50 and under $8.60............ .4 - 8.8 - - - - - - - - - - - - -$8.60 and under $8.80............ .5 - - - _ - - - 2.8 1.2 - _ - - 5.9 -$8.80 and under $8.80............ - - - - - - _ - - - _ _ - - - _$8.80 and under $8.90............ .3 - - - _ - _ - 5.6 _ - _ _ - - _$8.90 and under $9.00............ - - - - - - - - - - - - - - - -
$9.00 and over........................ 6.5 - - - - - 6.9 - - 2 15.0 3 24.5 4 11.5 - - 3.9 -
1 Excludes premium pay for overtime and for work on weekends, holidays, and late shifts.
2 Workers were distributed as follows: 3.9 percent at $9 to $9.20; 7.9 percent at $10.40 to $10.60; and 3.2 percent at $10.60 and over.
3 Workers were distributed as follows: 5.4 percent at $9 to $9.20; 13.6
percent at $10.40 to $10.60; and 5.5 percent at$10.60 and over.4 All workers were at $9.40 to $9.60.
NOTE: Because of rounding, sums of individual items may not equal 100.
Digitized for FRASER http://fraser.stlouisfed.org/ Federal Reserve Bank of St. Louis

Table 9. Occupational averages: All establishments
(Number and average straight-time hourly earnings1 of workers in selected occupations in millwork manufacturing establishments, United States and selected regions, June 1979)
Occupation
United States New England Middle Atlantic Border States
Number of work
ers
Hourly earnings1 Num- ber of work
ers
Hourly earnings’ Num- ber of workers
Hourly earnings1 Num- ber of workers
Hourly earnings1
Mean Median Middle range Mean Median Middle range Mean Median Middle range Mean Median Middle range
Assembler, wood products .................... 7,305 $5.64 $5.19 $4.25 _ $7.16 268 $4.02 $3.84 $3.30 - $4.70 561 $5.04 $4.75 $4.25 _ $5.71 299 $4.19 $3.90 $3.60 _ $4.55M en............................................... 5,380 5.82 5.29 4.25 - 7.65 261 4.04 3.85 3.35 - 4.75 532 5.12 4.90 4.25 - 5.71 208 4.36 3.99 3.75 - 4.55Women .......................................... - - - - - 7 3.28 - - - - - - - - 91 3.78 3.66 3.29 - 4.20
Boring-machine operator........................ 340 4.81 3.90 3.24 - 5.85 - - - - - 6 4.36 - - - - - - - -M en ............................................... 304 4.79 3.90 3.20 - 5.85 - - - - - 6 4.36 - - - - - - - -
Cut-off saw operator............................... 1,749 5.55 5.43 4.25 - 6.68 32 3.90 4.00 3.50 - 4.17 43 5.49 5.09 4.40 - 6.73 59 4.09 3.75 3.58 - 4.19M en............................................... 1,293 5.62 5.52 4.25 - 6.81 28 3.92 4.00 3.50 - 4.07 40 5.58 5.15 4.66 - 7.20 50 4.13 3.75 3.55 - 4.22Women .......................................... - - - - _ - - - - - - - _ _ _ 9 3.88 _ - -
Gluer, rough stock .................................. 603 5.08 4.95 3.70 - 6.26 - - - - - 54 4.76 4.40 4.25 - 5.05 _ - - - -M en ............................................... 489 5.10 5.05 3.70 - 6.26 - - - - - 51 4.82 4.40 4.25 - 5.05 - - - - -
Janitor...................................................... 448 4.72 4.55 3.50 - 5.41 16 3.31 3.15 3.15 - 3.23 21 4.38 4.35 3.85 - 4.94 23 4.10 4.25 3.11 - 4.83M en............................................... 377 4.58 4.50 3.45 - 5.28 15 3.27 3.15 3.15 - 3.20 21 4.38 4.35 3.85 - 4.94 22 4.15 4.25 3.29 - 4.92
Lathe operator, automatic...................... 135 5.85 5.45 4.45 - 6.84 - - - - - - - - - - - - - - -M en ............................................... 116 5.94 6.00 4.45 - 7.24 - - - - - - - _ _ - - - - - -W omen.......................................... 19 5.35 5.23 5.23 - 5.60 - _ - - - _ _ _ _ _ - - _ _ -
Set up and operate.............................. 96 6.08 6.12 5.23 - 6.70 - - - - - - - - - - - - - - -M en............................................... 83 6.14 6.23 4.78 - 7.32 - - - - - - - - - - - - - - -
Feed only.............................................. 39 5.29 4.35 4.35 - 7.24 - - - - - - - - - - - - - - -M en ............................................... 33 5.43 4.35 4.35 - 7.24 - - - - - - - - - - - - - - -
Maintainer, general utility ....................... 663 6.09 5.83 4.95 - 7.00 8 5.14 - - - 25 5.70 5.65 4.94 - 6.04 38 4.84 4.70 4.43 - 4.95M en............................................... 620 6.08 5.83 4.98 - 7.00 8 5.14 - - - 25 5.70 5.65 4.94 - 6.04 38 4.84 4.70 4.43 - 4.95
Millwright.................................................. 175 6.98 6.76 5.63 - 8.53 - - - - - - - - - - - - - - -M en............................................... 151 6.75 6.41 5.61 - 8.00 - _ - _ _ - - - - - - - - - -
Molding-machine operator..................... 1,373 5.82 5.64 4.50 - 6.75 25 5.01 5.00 4.56 - 5.63 46 5.13 4.75 3.85 - 5.75 49 4.82 4.25 3.50 - 5.10M en............................................... 1,225 5.86 5.75 4.56 - 6.75 24 5.07 5.00 4.56 - 5.63 43 5.18 4.75 3.85 - 6.00 47 4.89 4.25 3.75 - 5.10
Set up and operate.............................. 810 6.32 6.25 5.00 - 7.50 23 5.12 5.00 4.78 - 5.63 25 5.90 5.60 4.75 - 6.30 21 5.98 6.25 5.00 - 6.25M en............................................... 764 6.33 6.23 5.00 - 7.59 23 5.12 5.00 4.78 - 5.63 24 5.92 5.60 4.75 - 6.30 21 5.98 6.25 5.00 - 6.25
Feed only.............................................. 563 5.10 5.04 4.10 - 5.95 - - - - - 21 4.20 3.85 3.85 - 4.40 28 3.96 3.75 3.50 - 4.25M en............................................... 461 5.08 5.11 4.25 - 5.95 - - - - - 19 4.25 3.85 3.85 - 4.55 26 4.01 4.00 3.50 - 4.25
Mortising machine operator................... 210 5.47 5.10 4.20 - 6.48 6 3.83 - - - 22 5.21 5.18 4.65 - 5.40 - - - - -M en ............................................... 189 5.64 5.40 4.26 - 6.57 - - - - - 22 5.21 5.18 4.65 - 5.40 - - - - -Women .......................................... 21 3.92 3.65 3.30 - 3.87 - - - - _ - - - _ - - - - - -
Off-bearer, machine................................ 2,590 5.06 5.06 3.78 - 6.00 10 3.45 - - - 35 3.77 3.45 3.45 - 4.50 54 3.34 3.25 3.15 - 3.45M en............................................... 1,894 5.09 5.08 3.75 - 6.37 - _ - - _ 29 3.84 3.80 3.10 _ 4.50 34 3.36 3.25 3.16 - 3.50Women ......................................... 626 4.80 4.89 3.75 - 5.47 - - - - _ _ _ _ _ _ 20 3.29 3.40 3.00 - 3.41
Planer operator........................................ 275 5.73 5.40 4.61 - 7.18 - - - - - 6 6.54 _ - - - - - - -M en ........................ ....................... 240 5.69 5.40 4.50 - 7.06 - - - - _ 6 6.54 _ _ - - - - - _
Set up and operate.............................. 203 5.83 5.47 4.69 - 7.19 - - - - - 6 6.54 _ - _ - - - - -M en ................... ............................ 183 5.84 5.40 4.75 - 7.20 - - - - _ 6 6.54 _ - - - - - - -
Feed only................ .............................. 72 5.44 5.38 4.50 - 6.57 - _ _ - _ _ _ _ _ - ~ - - - -M en............................................... 57 5.21 5.29 3.50 - 6.57 - - - - - - - - - - - ~ - - -
See footnotes at end of table.
Digitized for FRASER http://fraser.stlouisfed.org/ Federal Reserve Bank of St. Louis

Table 9. Occupational averages: All establishments—Continued
(Number and average straight-time hourly earnings1 of workers in selected occupations in millwork manufacturing establishments, United States and selected regions, June 1979)
Occupation
United States New England Middle Atlantic Border States
Num- ber of workers
Hourly earnings1 Num- ber of workers
Hourly earnings1 Num- ber of workers
Hourly earnings1 Num- ber of workers
Hourly earnings1
Mean Median Middle range Mean Median Middle range Mean Median Middle range Mean Median Middle range
Power-truck operator.............................. 1,345 $5.62 $5.50 $4.45 _ $6.55 _ _ _ _ _ 69 $4.99 $5.20 $4.65 - $5.71 51 $4.23 $3.95 $3.95 - $4.55M en................................................ 1,197 5.52 5.36 4.40 - 6.49 - - - - - 68 5.00 5.30 4.65 - 5.71 50 4.25 3.95 3.95 - 4.55
Forklift operator................... ................ 1,258 5.57 5.40 4.49 - 6.49 - - - - - 69 4.99 5.20 4.65 - 5.71 47 4.28 3.95 3.95 - 4.65M en............................................... 1,124 5.49 5.36 4.45 - 6.49 - - - - - 68 5.00 5.30 4.65 - 5.71 47 4.28 3.95 3.95 - 4.65
Other than fo rk lift................................. 87 6.37 6.21 4.12 - 8.33 - - - - - _ - _ _ _ _ _ _ _ _M en............................................... 73 6.02 5.97 4.11 - 7.95 - - - - - - - - _ - - _ _ _ _
Rip-saw operator..................................... 774 5.64 5.46 4.15 - 6.66 20 $3.63 $3.25 $3.13 - $4.09 34 5.19 4.25 4.25 - 5.89 25 4.14 4.50 3.92 - 4.50M en............................................... 717 5.66 5.47 4.15 - 6.66 14 3.85 - - - 34 5.19 4.25 4.25 - 5.89 25 4.14 4.50 3.92 - 4.50
Router operator....................................... 281 5.74 5.30 4.33 - 7.00 - - - - - 34 6.56 7.99 4.95 - 8.00 - - _ - -M en ............................................... 237 5.85 5.40 4.34 - 7.54 - - - - - 34 6.56 7.99 4.95 - 8.00 - - _ - -
Sander, hand ........................................... 241 4.00 3.84 3.27 - 4.40 - - - - - _ - - _ _ 10 3.22 _ _ _M en............................................... 152 3.98 3.96 3.20 - 4.50 - - - - _ _ _ _ _ _ 7 3.32 _ _ _Women .......................................... 82 3.89 3.75 3.50 - 4.15 - - - - _ _ _ _ _ _ _ _ _ _ _
Sander, machine ..................................... 347 5.21 4.95 4.00 - 6.10 - - - - - 23 5.65 5.23 4.20 - 7.10 _ _ _ _ _M en ............................................... 278 5.29 5.29 3.83 - 6.36 - - - - - 23 5.65 5.23 4.20 - 7.10 _ _ ■ _ _ _
B e lt........................................................ 247 5.13 5.05 3.50 - 6.10 - - - - - 21 5.58 5.23 4.20 - 6.00 _ _ _ _ _M en............................................... 199 5.20 5.29 3.50 - 6.33 - - - - - 21 5.58 5.23 4.20 - 6.00 _ _ _ _ _
Other than belt ..................................... 100 5.43 4.88 4.15 - 6.09 _ _ _ _ _ _ _ _ _ _ _ _ _ _ _M en............................................... 79 5.53 5.41 4.05 - 6.36 - _ _ _ _ _ _ _ _ _ _ _ _ _ _Women .......................................... 19 4.75 4.44 4.33 - 5.25 _ _ _ _ _ _ _ _ _ _ _ _ _ _ _
Shaper operator, automatic................... 203 6.01 5.90 4.35 - 7.24 - - - - - 24 6.53 6.84 5.68 - 7.65 - _ _ - -M en ............................................... 190 6.02 6.05 4.35 - 7.24 - - - - - 24 6.53 6.84 5.68 - 7.65 _ _ _ - _Women .......................................... 13 5.86 - - - - - _ _ _ _ _ _ _ _ _ _ _ _ _
Set up and operate.............................. 136 6.58 6.25 4.61 - 8.51 - - - - - 16 7.50 7.65 7.24 - 7.81 _ _ _ - _Feed only.............................................. 67 4.87 5.35 3.33 - 6.57 - - - _ _ _ _ _ _ _ _ _ _ _ _
M en............................................... 56 4.67 3.98 3.20 - 6.57 - - _ _ _ _ _ _ _ _ _ _ _ _ _Women .......................................... 11 5.88 - - - - _ _ _ _ _ _ _ _ _ _ _ _ _ _
Shaper operator, hand ........................... 87 7.12 7.80 5.68 - 8.33 - - - _ _ _ _ _ _ _ _ _ _ _ _Set up and operate.............................. 75 7.49 8.17 6.74 - 8.38 - - _ _ _ _ _ _ _ _ _ _ _ _ _Feed only.............................................. 12 4.81 - - - _ - _ _ _ _ _ _ _ _ _ _ _ _ _
M en............................................... 10 4.49 - - - _ _ _ _ _ _ _ _ _ _ _ _ _ _ _Tenoner operator .................................... 429 5.64 5.62 4.50 - 6.45 10 4.66 - - - 13 5.43 - - _ 10 4.51 _ - _
M en............................................... 378 5.64 5.65 4.50 - 6.35 10 4.66 - - _ 13 5.43 - - _ 10 4.51 _ _ _Set up and operate.............................. 322 5.66 5.75 4.57 - 6.48 10 4.66 - - - 8 5.46 - - _ 9 4.62 _ _ _
M en............................................... 292 5.65 5.75 4.54 - 6.30 10 4.66 - - _ 8 5.46 - - _ 9 4.62 _ _ _Feed only.............. ............................... 107 5.58 5.25 4.34 - 6.45 - _ _ _ _ _ _ _ _ _ _ _ _ _ _
M en............................................... 86 5.61 5.54 4.35 - 6.45 - _ - _ _ _ _ _ _ _ _ _ _ _ _Variety saw operator............................... 508 5.52 5.15 4.13 - 6.08 - - - - - 16 8.54 8.73 8.35 - 9.49 14 4.08 _ _ _
M en............................................... 417 5.68 5.15 4.20 - 6.50 - - - - - 16 8.54 8.73 8.35 - 9.49 6 4.48 _ _ _Women .......................................... 79 4.65 4.68 3.40 - 5.51 - - - - - - - - - - - - - - -
See footnotes at end of table.
Digitized for FRASER http://fraser.stlouisfed.org/ Federal Reserve Bank of St. Louis

Table 9. Occupational averages: All establishments—Continued
(Number and average straight-time hourly earnings1 of workers in selected occupations in millwork manufacturing establishments, United States and selected regions, June 1979)
Occupation
Southeast Southwest Great Lakes
Numberof
workers
Hourly earnings1 Numberof
workers
Hourly earnings1 Numberof
workers
Hourly earnings1
Mean Median Middle range Mean Median Middle range l(/lean Median Middle range
Assembler, wood products .................... 677 $4.03 $4.00 $3.20 - $4.81 755 $3.79 $3.50 $3.10 _ $4.15 3,219 $6.50 $6.25 $5.13 _ $8.05M en ............................................... 493 4.14 4.05 3.30 - 5.00 620 3.80 3.47 3.05 - 4.19 2,221 6.84 7.05 5.22 - 8.22Women ......................................... 184 3.75 3.25 3.05 - 4.18 - - - - - 998 5.74 5.13 4.76 - 6.65
Boring-machine operator............... ........ 17 4.30 3.96 3.75 - 5.00 139 3.32 3.20 3.10 - 3.50 74 5.67 5.47 4.44 - 6.10M en............................................... 16 4.27 3.86 3.75 - 5.00 139 3.32 3.20 3.10 - 3.50 55 6.18 5.84 5.35 - 6.18Women ......................................... - - - - - - - - - - 19 4.21 3.78 3.60 - 4.44
Cut-off saw operator............................... 140 4.01 4.12 3.70 - 4.34 244 3.64 3.50 3.05 - 4.00 300 5.43 5.25 4.83 - 5.60M en ............................................... 57 4.07 4.15 3.75 - 4.34 225 3.62 3.45 3.05 - 3.80 212 5.51 5.30 4.76 - 5.66Women ......................................... 83 3.97 4.12 3.70 - 4.34 - - - - - 88 5.23 5.25 4.98 - 5.52
Gluer, rough stock .................................. 68 3.51 3.25 3.05 - 3.97 127 3.63 3.45 3.10 - 4.00 158 5.22 5.10 4.76 - 5.51M en............................................... 55 3.43 3.25 3.05 - 3.78 107 3.60 3.39 3.10 - 4.00 118 5.49 5.10 5.10 - 5.80Women ......................................... 13 3.88 - - - 19 3.80 3.70 3.30 - 4.25 40 4.43 4.70 3.40 - 5.17
Janitor...................................................... 44 3.98 3.72 3.21 - 5.00 51 3.59 3.50 3.05 - 3.95 114 4.92 5.04 4.20 - 5.23M en ............................................... 44 3.98 3.72 3.21 - 5.00 46 3.51 3.38 3.00 - 3.85 91 5.10 5.06 4.24 - 5.32Women ......................................... - - - - - - - - - - 23 4.21 4.41 3.30 - 5.00
Lathe operator, automatic...................... - - - - - - - - - - 38 4.86 4.45 4.35 - 5.26M en ............................................... - - - - - - - - - - 33 4.78 4.45 4.35 - 4.78
Set up and operate.............................. - - - - - - - - - - 17 5.21 4.78 4.45 - 5.93M en ............................................... - - - - - - - - - - 16 5.16 4.78 4.45 - 6.01
Maintainer, general utility ....................... 36 4.96 4.82 4.50 - 5.15 75 5.16 4.95 4.34 - 6.10 198 5.49 5.34 5.08 - 6.07M en ............................................... 36 4.96 4.82 4.50 - 5.15 74 5.14 4.95 4.30 - 6.00 196 5.49 5.34 5.06 - 6.07
Millwright.................................................. 9 6.08 - - - - - - - - 75 6.51 5.77 5.61 - 6.76M en ............................................... 9 6.08 - - - - - - - - 75 6.51 5.77 5.61 - 6.76
Molding-machine operator ..................... 103 4.41 4.08 3.70 - 5.08 236 4.59 4.50 3.70 - 5.28 242 5.74 5.53 4.92 - 6.10M en............................................... 86 4.54 4.34 3.54 - 5.40 210 4.64 4.55 3.75 - 5.50 229 5.78 5.55 5.01 - 6.10Women ......................................... 17 3.73 3.70 3.70 - 3.75 23 4.00 4.25 3.58 - 4.47 13 4.87 - - -
Set up and operate.............................. 51 4.87 5.40 3.20 - 6.00 129 5.15 5.24 3.95 - 6.00 172 6.04 5.90 5.23 - 6.28M en ............................................... 51 4.87 5.40 3.20 - 6.00 127 5.15 5.24 3.98 - 6.00 170 6.04 5.90 5.27 - 6.32
Feed only.............................................. 52 3.96 3.88 3.70 - 4.24 107 3.91 3.90 3.05 - 4.56 70 4.99 5.11 4.81 - 5.25M en............................................... 35 4.07 4.00 3.75 - 4.34 83 3.87 3.90 3.05 - 4.56 59 5.03 5.11 4.92 - 5.25Women ......................................... 17 3.73 3.70 3.70 - 3.75 22 4.01 4.25 3.56 - 4.47 11 4.75 - - -
Mortising machine operator................... 17 4.01 4.15 3.95 - 4.26 37 3.85 3.74 3.30 - 4.25 34 6.06 5.87 5.41 - 6.15M en............................................... 13 4.17 - - - 31 3.92 4.01 3.20 - 4.26 32 6.11 5.87 5.45 - 6.15
Off-bearer, machine................................ 156 3.62 3.68 3.05 - 3.98 448 3.27 3.10 2.95 - 3.50 560 5.07 4.99 4.40 - 5.29M en............................................... 108 3.66 3.75 3.04 - 4.00 375 3.25 3.10 2.95 - 3.50 363 5.23 5.02 4.38 - 5.55Women ......................................... 48 3.54 3.49 3.15 - 3.95 66 3.27 3.15 3.00 - 3.26 197 4.77 4.91 4.44 - 5.23
Planer operator....................................... 13 3.57 - - - 41 4.12 4.28 2.90 - 5.16 83 5.29 5.21 4.75 - 5.52M en ............................................... 13 3.57 - - - 39 4.15 4.28 2.90 - 5.26 62 5.28 4.95 4.56 - 5.50
Set up and operate.............................. 9 3.67 - - - 26 4.65 4.69 4.21 - 5.75 62 5.18 5.02 4.35 - 5.55M en ............................................... 9 3.67 - - - 24 4.75 4.75 4.28 - 5.75 50 5.14 4.75 4.35 - 5.40
Feed only.............................................. - - - - - - - - - - 21 5.61 5.29 5.18 - 5.38M en ............................................... - - - - - - - - - - 12 5.85 - - -
See footnotes at end of table.
Digitized for FRASER http://fraser.stlouisfed.org/ Federal Reserve Bank of St. Louis

Table 9. Occupational averages: All establishments—Continued
(Number and average straight-time hourly earnings1 of workers in selected occupations in millwork manufacturing establishments, United States and selected regions, June 1979)
Occupation
Southeast Southwest Great Lakes
Numberof
workers
Hourly earnings1 Numberof
workers
Hourly earnings1 Numberof
workers
Hourly earnings1
Mean Median Middle range Mean Median Middle range Mean Median Middle range
Power-truck operator.............................. 104 $4.14 $4.14 $3.90 _ $4.46 151 $3.90 $3.70 $3.28 - $4.50 375 $5.70 $5.35 $4.81 _ $5.89M en ............................................... 102 4.13 4.12 3.90 - 4.45 151 3.90 3.70 3.28 - 4.50 356 5.70 5.35 4.81 - 5.84Women ......................................... - - - - - - - - - 19 5.69 5.50 4.81 - 6.01
Forklift operator................................... 85 4.22 4.20 3.90 - 4.50 147 3.88 3.69 3.25 - 4.40 334 5.49 5.24 4.81 - 5.70M en ............................................... 83 4.21 4.15 3.90 - 4.50 147 3.88 3.69 3.25 - 4.40 316 5.49 5.24 4.81 - 5.66Women ......................................... - - - - - - - - - - 18 5.58 5.40 4.81 - 5.98
Other than fo rk lift................................ 19 3.76 3.98 3.38 - 4.11 - - - - - - - - - -M en ............................................... 19 3.76 3.98 3.38 - 4.11 - - - - - - - - - -
Rip-saw operator.................................... 66 3.67 3.75 3.02 - 4.08 144 4.47 4.09 3.59 - 5.25 174 5.51 5.36 4.87 - 5.70M en ............................................... 64 3.65 3.75 3.02 - 4.00 134 4.51 4.12 3.60 - 5.29 161 5.54 5.36 4.90 - 5.80Women ......................................... - - - - - - - - - - 13 5.20 - _ -
Router operator...................................... 47 3.94 3.75 3.10 - 5.08 21 4.40 4.75 3.45 - 5.00 62 5.85 5.80 4.35 - 6.25M en............................................... 27 3.61 3.20 3.15 - 4.21 19 4.49 4.75 3.57 - 5.25 62 5.85 5.80 4.35 - 6.25Women ......................................... 20 4.38 5.15 3.05 - 5.15 - - - - - - - - - -
Sander, hand .......................................... 17 3.27 2.95 2.95 - 3.75 34 3.57 3.27 3.04 - 3.72 23 4.38 3.84 3.55 - 5.31M en ............................................... - - - - - 34 3.57 3.27 3.04 - 3.72 8 5.13 - - -Women ......................................... - - - - - - - - - - 15 3.98 3.84 3.43 - 3.84
Sander, machine .................................... 23 3.44 3.25 3.00 - 3.79 54 4.22 4.03 3.78 - 4.78 86 5.11 5.39 4.00 - 5.85M en ............................................... 21 3.49 3.25 3.10 - 3.83 46 4.09 4.00 3.46 - 4.75 75 5.20 5.56 4.18 - 5.90Women ......................................... - - - - - - - - - - 11 4.49 - - _
B e lt........................................................ 21 3.49 3.25 3.10 - 3.83 38 4.36 4.75 3.46 - 4.87 68 5.18 5.52 4.00 - 5.93M en ............................................... 19 3.54 3.50 3.14 - 3.83 30 4.20 4.17 3.15 - 4.78 62 5.26 5.62 4.35 - 5.99Women ......................................... - - - - - - - - - - 6 4.34 - - -
Other than belt .................................... - - - - - 16 3.87 4.00 3.78 - 4.00 18 4.84 4.95 4.44 - 5.62M en ............................................... - - - - - 16 3.87 4.00 3.78 - 4.00 13 4.91 - - -
Shaper operator, automatic................... 6 3.92 - - - 52 5.03 5.33 4.04 - 6.25 37 5.09 5.15 4.35 - 6.08M en............................................... 6 3.92 - - - 48 5.00 4.94 3.80 - 6.25 35 5.05 4.97 4.35 - 5.97
Set up and operate............................. - - - - - 40 5.36 5.50 4.25 - 6.50 31 5.33 5.25 4.39 - 6.14Feed only.............................................. - - - - - 12 3.94 - - - - - - - -
Shaper operator, hand .......................... - - - - - - - - - - 13 8.14 - - -M en ............................................... - - - - - - - - - - 13 8.14 - - -
Set up and operate............................. - - - - - - - - - - 13 8.14 - - -
M en ............................................... - - - - - - _ - - - 13 8.14 - - -Tenoner operator ................................... 35 4.51 4.34 3.88 - 5.16 58 3.99 3.73 3.60 - 4.34 140 5.88 5.62 5.25 - 6.06
M en ............................................... 31 4.54 4.08 3.75 - 5.20 56 3.99 3.71 3.60 - 4.36 126 5.93 5.70 5.40 - 6.08Women ......................................... - - - - - - - - - - 14 5.45 - - -
Set up and operate............................. 26 4.61 4.00 3.75 - 5.31 48 4.02 3.71 3.60 - 4.39 109 6.12 5.90 5.48 - 6.23M en............................................... 26 4.61 4.00 3.75 - 5.31 46 4.02 3.68 3.60 - 4.46 102 6.13 5.90 5.48 - 6.25Women ......................................... - - - - - - - - - - 7 5.92 - _ -
Feed only.............................................. - - - - - 10 3.84 - - - - - _ _ _M en............................................... - - - - - 10 3.84 - - - - - - - -
Variety saw operator.............................. 74 4.73 5.12 4.30 - 5.15 83 4.30 3.81 3.72 - 5.00 113 5.34 5.51 4.52 - 5.78M en ............................................... 68 4.69 5.00 4.26 - 5.15 83 4.30 3.81 3.72 - 5.00 89 5.34 5.51 4.20 - 5.78
See footnotes at end of table.
Digitized for FRASER http://fraser.stlouisfed.org/ Federal Reserve Bank of St. Louis

Table 9. Occupational averages: All establishments— Continued
(Number and average straight-time hourly earnings1 of workers in selected occupations in millwork manufacturing establishments, United States and selected regions, June 1979)
Occupation
Middle West Mountain Pacific
Numberof
workers
Hourly earnings1 Numberof
workers
Hourly earnings1 Numberof
workers
Hourly earnings1
Mean Median Middle range Mean Median Middle range Mean Median Middle range
Assembler, wood products .................... 498 $5.09 $5.60 $4.33 - $5.70 371 $5.47 $5.00 $4.75 - $6.00 657 $7.52 $7.61 $5.75 $9.36M en............................................... - - - - - 340 5.42 5.00 4.75 - 5.68 613 7.65 7.61 5.75 - 9.36
Boring-machine operator........................ 23 4.23 3.70 3.50 - 3.90 12 5.05 - - - 51 8.21 8.23 7.55 - 8.50M en............................................... 19 4.35 3.70 3.50 - 3.90 11 4.84 - - - 44 8.22 8.36 6.82 - 9.00
Cut-off saw operator............................... 97 5.18 5.00 3.95 - 6.36 140 5.92 5.27 4.73 - 7.62 694 6.76 6.58 5.95 - 7.38M en............................................... - - - - - - - - - - 590 6.84 6.72 6.07 - 7.45Women .......................................... - - - - - - - - - - 92 5.94 6.15 5.40 - 6.58
Gluer, rough stock .................................. - - - - - 38 6.52 6.19 5.72 - 7.62 121 7.00 6.66 6.38 - 8.23M en............................................... - - - - - - - - - - 117 7.02 6.66 6.38 - 8.23
Janitor...................................................... 22 4.35 4.24 3.00 - 5.70 67 5.16 4.68 3.50 - 7.45 90 5.70 5.77 4.90 - 6.49M en............................................... - - - - - - - - - - 86 5.65 5.77 4.90 - 6.44
Maintained general utility ....................... 58 5.81 6.30 4.64 - 7.00 44 6.81 6.50 5.50 - 8.78 181 7.65 7.55 6.59 - 8.84M en............................................... - - - - - 39 6.48 6.20 5.43 - 7.05 181 7.65 7.55 6.59 - 8.84
Millwright.................................................. - - - - - - - - - - 41 8.29 8.53 7.10 - 9.41M en............................................... - - - - - - - - - - 36 8.13 8.39 6.76 - 8.87
Molding-machine operator ..................... 68 5.68 6.34 3.87 - 6.68 132 6.23 5.55 4.82 - 7.77 472 6.90 6.63 5.95 - 7.76M en............................................... - - - - - 114 6.16 5.53 4.94 r- 7.30 441 6.91 6.59 5.95 - 7.75
Set up and operate.............................. 68 5.68 6.34 3.87 - 6.68 51 7.19 7.17 6.34 - 8.40 270 7.49 7.61 6.55 - 8.01M en............................................... - - - - - 48 7.10 7.17 6.28 - 8.40 269 7.49 7.61 6.55 - 8.01
Feed only.............................................. - - - - - 81 5.63 5.27 4.70 - 5.56 202 6.10 6.02 5.63 - 6.50M en............................................... - - - - - 66 5.47 5.16 4.72 - 5.50 172 5.99 6.00 5.63 - 6.43
Mortising machine operator................... - - - - - 13 5.70 - - - 71 6.70 6.68 5.27 - 7.73M en............................................... - - - - - 12 5.54 - - - 71 6.70 6.68 5.27 - 7.73
Off-bearer, machine................................ 79 4.48 4.10 3.50 - 5.65 150 5.60 5.08 4.60 - 7.40 1,098 6.09 5.82 5.45 - 7.09M en............................................... - - - - - 111 5.14 5.04 4.45 - 5.43 819 6.23 6.37 5.51 - 7.09Women ......................................... - - - - _ _ _ - - - 254 5.50 5.47 4.90 - 5.82
Planer operator........................................ 11 5.05 - - - 23 7.01 7.19 5.80 - 8.41 93 6.90 7.02 6.10 - 7.75M en............................................... - - - - - - - - - - 89 6.85 7.02 5.95 - 7.74
Set up and operate.............................. 11 5.05 - - - 18 6.98 6.15 5.80 - 8.68 68 6.99 7.19 6.20 - 7.91M en............................................... - - - - - 15 6.62 5.85 5.80 - 8.14 67 6.96 7.18 6.18 - 7.91
Feed only.............................................. - - - - - - - - - - 25 6.67 6.57 5.95 - 7.74M en............................................... - - - - - - - - - - 22 6.51 6.57 5.95 - 6.71
Power-truck operator.............................. 94 5.26 5.84 4.33 - 6.04 120 6.26 5.55 5.00 - 7.88 377 6.84 6.60 6.14 - 7.40M en............................................... - - - - - - - - - - 355 6.80 6.59 6.13 - 7.40
Forklift operator.................................... 94 5.26 5.84 4.33 - 6.04 111 6.05 5.44 5.00 7.81 367 6.84 6.60 6.14 - 7.40M en............................................... - - - - - - - - - - 348 6.81 6.59 6.14 - 7.40
Other than forklift ................................. - - - - - - - - - - 10 6.73 - - -Rip-saw operator..................................... 21 4.85 4.60 3.90 - 5.53 36 6.34 6.05 5.65 - 6.45 254 7.24 6.96 6.43 - 7.83
M en............................................... - - - - - 33 6.24 5.85 5.65 - 6.45 235 7.27 6.94 6.43 - 7.76Router operator....................................... 24 5.97 6.04 4.33 - 6.74 - - - - - 71 6.91 6.82 4.34 - 8.68
M en............................................... - - - - - - _ - - - 63 6.93 6.82 4.34 - 8.79Sander, hand .......................................... 16 4.31 3.35 3.26 - 5.63 60 3.67 3.61 3.25 - 4.10 39 4.70 4.60 3.75 - 5.70
M en............................................... - - - - - - - - - - 24 4.99 5,02 4.00 - 6.00Women ......................................... - - - - - - - - - - 15 4.24 4.10 3.73 - 4.75
See footnotes at end of table.
Digitized for FRASER http://fraser.stlouisfed.org/ Federal Reserve Bank of St. Louis

Table 9. Occupational averages: All establishments—Continued
(Number and average straight-time hourly earnings1 of workers in selected occupations in millwork manufacturing establishments, United States and selected regions, June 1979)
Occupation
Middle West Mountain Pacific
Numberof
workers
Hourly earnings1 Numberof
workers
Hourly earnings1 Numberof
workers
Hourly earnings1
Mean Median Middle range Mean Median Middle range Mean Median Middle range
Sander, machine .................................... 43 $4.52 $3.50 $3.26 - $5.99 _ _ _ _ _ 94 $6.56 $6.54 $5.65 - $7.85M en ............................................... - - - - - 6 $5.24 - - - 81 6.70 6.65 5.80 - 7.85
B e lt....................................................... 43 4.52 3.50 3.26 - 5.99 10 4.77 - - - 40 6.92 6.65 6.13 - 7.39M en ............................................... - - - - - 6 5.24 - - - 38 6.93 6.65 6.22 - 7.24
Other than belt .................................... - - - - - - - - - - 54 6.30 5.85 4.88 - 7.85M en............................................... - - - - - - - - - - 43 6.49 6.35 5.34 - 7.85
Shaper operator, automatic................... - - - - - - - - - - 72 7.16 6.90 5.98 - 9.02M en ............................................... - - - - - - - - - - 65 7.27 7.24 6.57 - 9.06
Set up and operate............................. - - - - - - - - - - 35 8.89 9.06 8.60 - 9.62Feed only.............................................. - - - - - - - - - - 37 5.53 6.57 3.70 - 6.57
M en ............................................... - - - - - - - - - - 30 5.38 6.57 3.45 - 6.57Shaper operator, hand .......................... - - - - - - - - - - 33 8.12 8.28 7.86 - 8.38
Set up and operate............................. - - - - - - - - - - 29 8.17 8.28 8.28 - 8.53Tenoner operator ................................... 34 4.88 4.35 3.50 - 6.58 26 6.18 $6.24 $4.82 - $7.87 103 6.96 6.68 6.12 - 7.75
M en ............................................... - - - - - 21 6.61 6.24 6.24 - 7.87 96 6.93 6.67 6.12 - 7.75Set up and operate............................. 30 5.06 4.82 3.87 - 6.66 21 6.61 6.24 6.24 - 7.87 61 6.88 6.68 6.12 - 7.32
M en ............................................... - - - - - 21 6.61 6.24 6.24 - 7.87 59 6.91 6.68 6.12 - 7.41Feed only.............................................. - - - - - - - - - - 42 7.08 6.89 6.13 - 8.23
M en.............................................. - - - - - - - - - - 37 6.96 6.45 6.13 - 8.23Variety saw operator.............................. 27 4.88 4.82 3.50 - 5.99 25 6.44 6.45 5.35 - 7.60 118 7.40 6.65 4.95 - 10.50
M en.............................. ................ - - - - - 21 6.22 5.67 5.00 - 7.60 106 7.63 6.68 4.95 - 10.50Women.......................................... - - - - - - - - - - 12 5.38 - - -
1 See appendix A for definition of means, medians, and middle ranges. Medians NOTE: Dashes indicate no data or data do not meet publication criteria,and middle ranges are not provided for entries with fewer than 15 workers.
Digitized for FRASER http://fraser.stlouisfed.org/ Federal Reserve Bank of St. Louis

Table 10. Occupational averages by size of community
(Number and average straight-time hourly earnings1 of workers in millwork manufacturing establishments by size of community, United States and selected regions, June 1979)
Occupation
United States New England Middle Atlantic Border States Southeast
Metropolitan Nonmetropolitan Metropolitan Nonmetropolitan Metropolitan Nonmetropolitan Metropolitan Nonmetropolitan
Number of work
ers
Average
hourlyearnings
Number of work
ers
Average
hourlyearnings
Number of work
ers
Average
hourlyearnings
Number of work
ers
Average
hourlyearnings
Number of work
ers
Average
hourlyearnings
Number of work
ers
Average
hourlyearnings
Number of work
ers
Average
hourlyearnings
Number of work
ers
Average
hourlyearnings
Numberof
workers
Average
hourlyearnings
Assembler, wood products........................... 4,877 $6.03 2,428 $4.84 149 $3.61 360 $5.05 201 $5.02 116 $4.93 183 $3.72 521 $4.22 156 $3.42Boring-machine operator.............................. 269 4.87 71 4.60 - - - - - - - - - - 17 4.30 - -Cut-off saw operator..................................... 1,287 5.81 462 4.83 11 3.96 35 5.77 8 4.28 27 4.58 - - 113 4.04 27 3.92Gluer, rough stock......................................... 413 5.37 190 4.45 - - 40 4.79 14 4.67 - - - - 32 3.69 36 3.36Janitor............................................................ 329 4.88 119 4.26 9 3.43 13 4.35 8 4.42 15 4.56 - - 37 4.12 - -Lathe operator, automatic............................ 102 6.42 33 4.10 - - - - - - - - - - - - - -
Set up and operate.................................... 79 6.57 17 3.83 - - - - - - - - - - - - - -Feed only.................................................... 23 5.92 - - - - - - - - - - - - - - - -
Maintained general utility ............................. 403 6.57 260 5.35 6 5.22 15 5.98 10 5.27 14 5.43 24 4.49 27 5.13 9 4.46Millwright........................................................ 110 7.60 65 5.93 - - - - - - - - - - - - - -Molding-machine operator............................ 989 6.05 384 5.21 9 4.95 39 5.19 7 4.79 41 4.92 8 4.32 89 4.51 - -
Set up and operate.................................... 549 6.72 261 5.48 9 4.95 18 6.33 7 4.79 16 6.57 - - 42 5.08 - -Feed only.................................................... 440 5.23 123 4.62 - - 21 4.20 - - 25 3.87 - - 47 4.01 - -
Mortising machine operator......................... 149 5.68 61 4.96 - - 16 5.26 - - - - - - 10 4.01 - -Off-bearer, machine...................................... 1,908 5.30 682 4.40 - - 21 3.94 - - - - 37 3.43 144 3.58 - -Planer operator............................................. 206 5.97 69 5.02 - - - - - - - - - - 11 3.47 - -
Set up and operate.................................... 149 6.13 54 5.02 - - - - - - - - - - 7 3.54 - -Feed only.................................................... 57 5.55 15 5.00 - - - - - - - - - - - - - -
Power-truck operator.................................... 882 5.97 463 4.95 - - 35 4.81 34 5.17 16 4.84 35 3.95 89 4.15 15 4.06Forklift operator......................................... 808 5.91 450 4.95 - _ 35 4.81 34 5.17 16 4.84 - - 70 4.26 15 4.06Other than fo rk lift....................................... 74 6.61 13 4.99 - - - - - - - - - - 19 3.76 - -
Rip-saw operator.......................................... 560 6.01 214 4.68 7 4.19 32 5.24 - - 16 4.28 9 3.90 40 3.91 - -Router operator............................................ 220 6.04 61 4.67 - - 31 6.71 - - - - - - 34 4.08 13 3.57Sander, hand ................................................ 205 4.00 36 3.96 - - - - - - 10 3.22 - - - - - -Sander, machine ........................................... 253 5.35 94 4.84 - - 20 5.76 - - - - - - 21 3.49 - -
B e lt.............................................................. 175 5.17 72 5.03 - _ 19 5.62 - - - - - - 21 3.49 - -Other than be lt........................................... 78 5.76 22 4.25 - _ _ - - - _ - - - - - - -
Shaper operator, automatic ......................... 165 6.28 38 4.87 - - 24 6.53 - - - - - - - - - -Set up and operate.................................... 104 7.05 32 5.04 - - 16 7.50 - - - - - - - - - -Feed only.................................................... 61 4.95 6 3.98 - - - - - - - - - - - - - -
Shaper operator, hand.................................. 71 7.55 16 5.21 - - - - - - - - - - - - - -Set up and operate.................................... 65 7.63 10 6.59 - - - - - - - - - - - - - -
Tenoner operator .......................................... 264 5.87 165 5.27 - - 11 5.63 - - - - - - 30 4.67 - -Set up and operate.................................... 188 5.87 134 5.37 - - 6 5.83 - _ _ - - - 22 4.83 - -Feed only.................................................... 76 5.88 - - - - - - - - - - - - - - - -
Variety saw operator..................................... 396 5.79 112 4.60 - - 16 8.54 - - - - - - 67 4.80 ~ -See footnotes at end of table.
Digitized for FRASER http://fraser.stlouisfed.org/ Federal Reserve Bank of St. Louis

Table 10. Occupational averages by size of community—Continued
(Number and average straight-time hourly earnings1 of workers in millwork manufacturing establishments by size of community, United States and selected regions, June 1979)
Occupation
Southwest Great Lakes Middle West Mountain Pacific
Metropolitan Nonmetropolitan Metropolitan Nonmetropolitan Metropolitan Nonmetropolitan Metropolitan
Number of work
ers
Averagehourly
earnings
Number of work
ers
Averagehourly
earnings
Number of work
ers
Averagehourly
earnings
Number of work
ers
Averagehourly
earnings
Number of work
ers
Averagehourly
earnings
Number of work
ers
Averagehourly
earnings
Number of work
ers
Averagehourly
earnings
Number of work
ers
Averagehourly
earnings
Assembler, wood products........................... 696 $3.85 59 $3.12 _ _ 1,289 $5.08 91 $4.35 _ _ 357 $5.38 657 $7.52Boring-machine operator.............................. 131 3.29 8 3.80 41 $6.15 33 5.08 - - - - 10 4.59 51 8.21Cut-off saw operator..................................... 193 3.69 51 3.45 69 6.53 231 5.10 23 4.69 74 $5.33 122 5.62 694 6.76Gluer, rough stock........................................ 95 3.64 32 3.62 86 5.66 72 4.70 - - - - 34 6.33 121 7.00Janitor............................................................ 40 3.61 11 3.53 51 5.48 63 4.46 9 3.28 13 5.09 65 5.08 90 5.70Lathe operator, automatic............................ - - - - - - - - - - - - - - - -
Set up and operate.................................... - - - - - - - - - - - - - - - -Feed on ly.................................................... - - - - - - - - - - - - - - - -
Maintained general utility ............................. 50 5.21 25 5.07 59 6.12 139 5.22 15 5.17 43 6.03 36 6.37 181 7.65Millwright........................................................ - - - - 37 7.19 38 5.84 - - - - - - 41 8.29Molding-machine operator............................ 156 4.78 80 4.21 47 6.99 195 5.43 17 5.68 51 5.68 119 5.97 472 6.90
Set up and operate.................................... 96 5.30 33 4.72 38 7.53 134 5.62 17 5.68 51 5.68 43 6.88 270 7.49Feed on ly.................................................... 60 3.95 47 3.85 9 4.73 61 5.03 - - - - 76 5.46 202 6.10
Mortising machine operator......................... 27 3.90 - - 10 6.74 24 5.78 - - - - 11 5.34 71 6.70Off-bearer, machine..................................... 299 3.30 149 3.22 186 5.74 374 4.74 19 4.85 60 4.37 115 5.06 1,098 6.09Planer operator............................................. 36 4.03 - - 36 5.72 47 4.95 - - - - 18 6.61 93 6.90
Set up and operate................................... 24 4.59 - - 27 5.56 35 4.88 - - - - 13 6.41 68 6.99Feed only.................................................... - - - - - - 12 5.15 - - - - - - 25 6.67
Power-truck operator ................................... 100 3.87 51 3.96 142 6.73 233 5.06 14 5.40 80 5.23 106 6.04 377 6.84Forklift operator......................................... 96 3.83 51 3.96 110 6.40 224 5.04 14 5.40 80 5.23 97 5.78 367 6.84Other than forklift ...................................... - - - - - - 9 5.61 - - - - - - 10 6.73
Rip-saw operator.......................................... 124 4.54 20 4.08 50 6.46 124 5.13 - - 17 4.92 33 6.11 254 7.24Router operator............................................ 21 4.40 - - 36 6.58 26 4.84 - - - - - - 71 6.91Sander, hand ................................................ 27 3.59 - - 12 4.54 11 4.21 - - - - 60 3.67 39 4.70Sander, machine .......................................... 45 4.25 - - 28 5.90 58 4.72 - - - - - - 94 6.56
B e lt.............................................................. 38 4.36 - - 18 6.48 50 4.71 - - - - 9 4.47 40 6.92Other than be lt........................................... 7 3.64 - - 10 4.87 - - - - - - - - 54 6.30
Shaper operator, automatic ......................... 49 5.12 - - - - 30 5.21 - - - - - - 72 7.16Set up and operate................................... 37 5.50 - - - - 28 5.23 - - - - - - 35 8.89Feed on ly.................................................... 12 3.94 - - - - - - - - - - - - 37 5.53
Shaper operator, hand................................. - - - - 10 9.09 - - - - - - - - 33 8.12Set up and operate................................... - - - - 10 9.09 - - - - - - - - 29 8.17
Tenoner operator ......................................... 44 4.06 - - 37 6.92 103 5.51 9 4.29 25 5.09 19 5.52 103 6.96Set up and operate................................... 37 4.04 11 3.98 33 7.16 76 5.67 - - 25 5.09 14 5.94 61 6.88Feed on ly.................................................... - - - - - - - - - - - - - - 42 7.08
Variety saw operator.................................... 79 4.29 - - 78 5.72 35 4.48 - - - - 13 5.85 118 7.40
1 Excludes premium pay for overtime and for work on weekends, holidays, and late shifts. NOTE: Dashes indicate no data or data do not meet publication criteria.
Digitized for FRASER http://fraser.stlouisfed.org/ Federal Reserve Bank of St. Louis

Table 11. Occupational averages by size of establishment
(Number and average straight-time hourly earnings1 of workers in millwork manufacturing establishments by size of establishment, United States and selected regions, June 1979)
Occupation
United States New England Middle Atlantic Border States Southeast Southwest
8-99 workers 100-249workers
250 workers or more 8-99 workers 100-249
workers 8-99 workers 100-249workers
Numberof
workers
Average
hourlyearnings
Numberof
workers
Average
hourlyearnings
Numberof
workers
Average
hourlyearnings
Numberof
workers
Average
hourlyearnings
Numberof
workers
Average
hourlyearnings
Numberof
workers
Average
hourlyearnings
Numberof
workers
Average
hourlyearnings
Numberof
workers
Average
hourlyearnings
Numberof
workers
Average
hourlyearnings
Numberof
workers
Average
hourlyearnings
Assembler, wood products........................... 3,305 $5.24 1,172 $4.64 2,828 $6.51 172 $3.75 357 $5.04 204 $5.04 74 $5.09 557 $4.07 470 $3.72 202 $3.83Boring-machine operator.............................. 215 4.38 63 5.36 62 5.74 - - - - - - - - 16 4.23 - - 27 3.55Cut-off saw operator..................................... 655 5.43 588 4.97 506 6.38 32 3.90 30 5.97 13 4.38 11 5.06 118 3.95 77 3.70 140 3.42Gluer, rough stock......................................... 290 4.82 174 4.57 139 6.27 - - 40 4.87 14 4.45 - - 40 3.48 41 3.38 62 3.63Janitor............................................................ 237 4.27 89 4.61 122 5.65 16 3.31 12 4.44 9 4.29 14 4.56 36 4.12 20 3.47 16 3.56Lathe operator, automatic............................ 82 5.73 - - - - - - - - - - - - - - - - - -
Set up and operate.................................... 76 5.88 - - - - - - - - - - - - - - - - - -Maintained general utility ............................. 238 5.82 192 5.91 233 6.52 8 5.14 10 6.00 15 5.49 10 5.56 23 4.93 26 5.55 19 4.98Millwright........................................................ 47 6.93 39 6.66 89 7.14 - - - - - - - - - - - - - -Molding-machine operator............................ 727 6.10 323 5.00 323 6.00 25 5.01 35 5.24 11 4.77 36 5.09 91 4.46 93 5.13 108 4.18
Set up and operate.................................... 465 6.75 184 5.30 161 6.24 23 5.12 15 6.65 10 4.77 17 6.46 49 4.87 65 5.69 52 4.56Feed on ly.................................................... 262 4.94 139 4.62 162 5.76 - - 20 4.18 - - - - 42 3.99 28 3.82 56 3.83
Mortising machine operator......................... 103 5.12 61 5.80 46 5.82 6 3.83 16 5.16 - - - - 17 4.01 14 3.71 15 3.82Off-bearer, machine...................................... 837 4.43 813 4.56 940 6.05 10 3.45 - - 17 3.71 33 3.35 107 3.52 172 3.31 241 3.25Planer operator............................................. 128 5.56 76 5.27 71 6.53 - - - - - - - - 12 3.51 22 4.10 18 4.13
Set up and operate.................................... 102 5.83 63 5.24 38 6.84 - - - - - - - - 8 3.59 - - 16 4.09Feed on ly.................................................... 26 4.49 13 5.44 33 6.18 - - - - - - - - - - - - - -
Power-truck operator.................................... 443 5.21 359 5.27 543 6.19 - - 29 4.85 40 5.09 15 4.63 64 4.14 45 3.68 66 3.78Forklift operator.......................................... 430 5.24 347 5.31 481 6.04 - - 29 4.85 40 5.09 15 4.63 55 4.23 45 3.68 66 3.78Other than fo rk lift....................................... 13 3.95 - _ 62 7.29 _ - - - - - - - - - - - - -
Rip-saw operator........................................... 444 5.77 201 5.01 129 6.20 20 3.63 30 5.33 - - 19 4.07 61 3.63 58 5.11 63 3.86Router operator............................................ 194 5.72 41 4.87 46 6.61 - - 28 6.87 6 5.07 - - 44 3.95 14 4.55 - -Sander, hand ................................................ 142 3.74 35 4.05 64 4.53 - - - - - - 10 3.22 17 3.27 - - - -Sander, machine ........................................... 167 5.00 82 5.04 98 5.72 - - 19 5.78 - - - - 21 3.39 18 4.49 26 3.82
B e lt.............................................................. 128 4.80 49 4.66 70 6.05 - - 18 5.63 - - - - 19 3.44 18 4.49 13 3.74Other than be lt........................................... 39 5.66 33 5.59 28 4.91 - - - - - - - - - - - - - -
Shaper operator, automatic......................... 118 6.40 49 5.11 36 5.98 - - 22 6.64 - - - - 6 3.92 40 5.19 - -Set up and operate.................................... 77 7.18 30 5.69 29 5.90 - - 14 7.81 - - - - - - 30 5.61 - -Feed only.................................................... 41 4.94 19 4.19 - - - - - - - - - - - - - - - -
Shaper operator, hand.................................. 44 7.18 26 6.37 - - - - - - - - - - - - - - - -Set up and operate.................................... 37 7.95 21 6.16 - - - - - - - - - - - - - - - - -
Tenoner operator .......................................... 141 5.39 125 5.45 163 5.99 10 4.66 10 5.74 - - - - 29 4.47 - - 32 3.93Set up and operate.................................... 104 5.54 111 5.35 107 6.10 10 4.66 - - - - - - 22 4.53 - - 31 3.95Feed only.................................................... 37 4.99 14 6.26 56 5.79 - - - - - - - - - - - - - -
Variety saw operator..................................... 335 5.61 66 5.26 107 5.42 - - 13 9.28 - - - - 68 4.75 35 4.38 23 4.74
See footnotes at end of table.
Digitized for FRASER http://fraser.stlouisfed.org/ Federal Reserve Bank of St. Louis

Table 11. Occupational averages by size of establishment—Continued
(Number and average straight-time hourly earnings1 of workers in millwork manufacturing establishments by size of establishment, United States and selected regions, June 1979)
Occupation
Great Lakes Middle West Mountain Pacific
8-99 workers 100-249 workers 250 workers or more 8-99 workers 100-249 workers 8-99 workers 100-249 workers 250 workers or
more
Number of work
ers
Average
hourlyearnings
Number of work
ers
Averagehourly
earnings
Number of work
ers
Average
hourlyearnings
Number of work
ers
Average
hourlyearnings
Number of work
ers
Average
hourlyearnings
Number of work
ers
Average
hourlyearnings
Number of work
ers
Average
hourlyearnings
Number of work
ers
Average
hourlyearnings
Number of work
ers
Average
hourlyearnings
Assembler, wood products........................... 653 $6.03 237 $5.10 2,329 $6.77 169 $4.67 66 $4.41 289 $5.25 564 $7.53 58 $6.43 35 $9.14Boring-machine operator.............................. 43 5.79 13 5.23 18 5.72 18 4.43 - - - - 15 8.33 19 7.98 - -Cut-off saw operator..................................... 62 5.88 101 4.90 137 5.62 28 4.55 15 4.10 46 5.12 251 6.85 225 6.35 218 7.09Gluer, rough stock......................................... 88 4.77 17 4.58 53 6.19 - - - - - - 61 6.90 40 6.53 - -Janitor............................................................ 53 4.22 13 4.79 48 5.72 12 3.89 - - 28 3.77 46 5.41 28 5.89 16 6.22Lathe operator, automatic............................ - - - - - - - - - - - - - - - - - -
Set up and operate.................................... - - - - - - - - - - - - - - - - - -Maintained general utility ................... ......... 56 4.99 50 5.81 92 5.61 29 5.25 8 4.68 8 5.86 68 7.25 59 7.01 54 8.84Millwright........................................................ 15 7.26 26 5.85 34 6.68 - - - - - - 18 7.41 - - 13 8.94Molding-machine operator............................ 78 6.51 72 5.10 92 5.57 17 5.90 15 4.90 84 6.05 268 7.25 85 6.22 119 6.60
Set up and operate.................................... 55 7.21 64 5.17 53 5.87 17 5.90 15 4.90 30 7.25 194 7.67 37 6.80 39 7.25Feed on ly.................................................... 23 4.84 - - 39 5.17 - - - - 54 5.38 74 6.12 48 5.78 80 6.28
Mortising machine operator......................... 7 6.15 - - 19 6.18 - - - - - - 31 6.15 30 7.04 - -Off-bearer, machine...................................... 105 4.23 173 4.89 282 5.50 - - 17 3.48 85 4.72 263 5.76 287 5.77 548 6.43Planer operator............................................. 25 5.66 21 4.51 37 5.47 - - - - 9 5.73 47 6.61 25 6.81 21 7.66
Set up and operate.................................... 22 5.36 20 4.50 20 5.65 - - - - 7 5.63 42 6.61 17 7.25 9 8.24Feed only.................................................... - - - - 17 5.27 - - - - - - - - 8 5.89 12 7.23
Power-truck operator.................................... 88 4.94 59 4.99 228 6.17 32 4.83 - - 46 5.33 120 6.78 117 6.94 140 6.82Forklift operator.......................................... 86 4.97 58 4.99 190 5.88 32 4.83 - - 46 5.33 118 6.79 116 6.94 133 6.81Other than fo rk lift....................................... - - - - - _ - _ _ _ - _ _ - - - - -
Rip-saw operator........................................... 73 5.66 48 4.90 53 5.86 - - 8 4.90 28 5.98 144 7.61 65 6.36 45 7.34Router operator............................................ 31 5.93 - - 18 6.44 14 5.94 - - - - 45 6.94 11 5.63 15 7.76Sander, hand ................................................ - - - - 7 5.61 - - - - 29 3.35 18 4.73 - - - -Sander, machine ........................................... 29 4.18 23 4.91 34 6.03 - - 9 4.86 - - 49 6.58 16 7.43 29 6.06
B e lt.............................................................. 21 4.22 17 4.76 30 6.08 - _ 9 4.86 - _ 23 6.87 - _ _ -Other than be lt............................................ - - - - - _ - _ _ _ _ 26 6.32 12 7.81 _ -
Shaper operator, automatic......................... - - 19 4.84 14 5.91 - - - - - - 38 8.21 24 5.20 - -Set up and operate.................................... - - 17 4.85 14 5.91 - - - - - - 23 9.28 7 7.84 - -Feed only.................................................... - - - - - _ - _ _ - _ _ - _ _ _ _ -
Shaper operator, hand.................................. 12 8.29 - - - - - - - - - - - - 10 7.39 - -Set up and operate.................................... 12 8.29 - - - - - - - - - - - - - - - -
Tenoner operator ......................................... 7 5.59 40 6.13 93 5.80 - - 11 4.35 - - 50 6.54 26 7.43 27 7.31Set up and operate.................................... - - 39 6.18 65 6.08 - - 11 4.35 - - 34 6.77 17 7.36 10 6.46Feed only.................................................... - - - - - - - - - - - - - - 9 7.56 17 7.81
Variety saw operator..................................... 47 4.96 - - - - - - - - 15 5.65 95 7.67 18 6.22 - -
1 Excludes premium pay for overtime and for work on weekends, holidays, and late shifts. NOTE: Dashes indicate no data or data do not meet publication criteria.
Digitized for FRASER http://fraser.stlouisfed.org/ Federal Reserve Bank of St. Louis

Table 12. Occupational averages by labor-management contract coverage
(Number and average straight-time hourly earnings1 of workers in millwork manufacturing establishments by labor-management contract coverage, United States and selected regions, June 1979)
Occupation
United States New England Middle Atlantic Border States Southeast
Establishments with--
Majority covered None or minority covered Majority covered None or minority covered Majority covered None or minority
covered Majority covered None or minority covered
Number of work
ers
Averagehourly
earnings
Number of work
ers
Average
hourlyearnings
Number of work
ers
Average
hourlyearnings
Number of work
ers
Average
hourlyearnings
Number of work
ers
Average
hourlyearnings
Number of work
ers
Average
hourlyearnings
Number of work
ers
Average
hourlyearnings
Number of work
ers
Average
hourlyearnings
Number of work
ers
Average
hourlyearnings
Assembler, wood products........................... 2,540 $5.88 4,765 $5.51 266 $4.02 313 $5.36 248 $4.64 _ _ 198 $3.95 168 $3.85 509 $4.10Boring-machine operator.............................. 148 6.29 192 3.67 - - 6 4.36 - - - - - - - - 15 4.26Cut-off saw operator..................................... 823 6.17 926 5.00 28 3.85 22 6.09 21 4.86 39 $4.08 20 4.10 38 4.26 102 3.92Gluer, rough stock......................................... 278 5.78 325 4.48 - - 17 4.98 - - - - - - - - 57 3.38Janitor............................................................ 207 4.84 241 4.61 15 3.26 19 4.34 - - 12 4.76 11 3.39 - - 40 4.03Lathe operator, automatic............................ 74 6.79 61 4.72 - - - - - - - - - - - - -
Set up and operate.................................... 55 6.92 41 4.97 - - - - - - - - - - - - - -Maintainer, general utility ............................. 333 6.44 330 5.75 7 5.09 20 5.62 - - 14 5.16 24 4.65 11 5.50 25 4.73Millwright........................................................ 91 7.05 84 6.90 - - - - - - - - - - - - 9 6.08Molding-machine operator............................ 549 6.55 824 5.33 24 4.92 23 4.73 23 5.52' - - 37 4.60 16 3.91 87 4.50
Set up and operate.................................... 374 7.07 436 5.67 22 5.02 14 5.31 11 6.65 - - 18 5.38 - - 50 4.86Feed only.................................................... 175 5.42 388 4.95 - - - - - - - - - - 15 3.80 37 4.02
Mortising machine operator......................... 103 6.39 107 4.59 - - 17 5.16 - - - - - - - - 17 4.01Off-bearer, machine...................................... 1,404 5.62 1,186 4.40 10 3.45 - - 30 3.76 - - 35 3.34 61 3.92 95 3.43Planer operator............................................. 179 6.24 96 4.79 - - - - - - - - - - - - 9 3.34
Set up and operate................................... 135 6.27 68 4.98 - - - - - - - - - - - - 6 3.41Feed only.................................................... 44 6.14 28 4.33 - - - - - - - - - - - - - -
Power-truck operator.................................... 678 5.77 667 5.46 - - 55 4.95 14 5.15 12 4.94 39 4.01 41 4.16 63 4.12Forklift operator .......................................... 648 5.79 610 5.33 - - 55 4.95 14 5.15 12 4.94 35 4.06 31 4.23 54 4.22Other than forklift ....................................... 30 5.44 57 6.87 - - - - - - - - - - - - - -
Rip-saw operator.......................................... 390 6.34 384 4.94 - - 11 6.48 - - - - 20 4.05 13 4.13 53 3.56Router operator............................................ 126 6.55 155 5.08 - - 11 5.41 - - - - - - - - 40 4.03Sander, hand ................................................ 43 4.37 198 3.92 - - - - - - - - - - - - - -Sander, machine ........................................... 173 6.04 174 4.39 - - 19 5.60 - - - - - - - - 22 3.40
B e lt.............................................................. 118 5.98 129 4.34 - - 17 5.51 - - - - - - - - 20 3.45Other than be lt........................................... 55 6.15 45 4.54 - - - - - - - - - - - - - -
Shaper operator, automatic......................... 103 7.09 100 4.90 - - 18 6.84 - - . - - - - - - - -Set up and operate.................................... 71 7.76 65 5.29 - - 14 7.81 - - - - - - - - - -
Feed only.................................................... 32 5.62 35 4.18 - - - - - - - - - - - - - -Shaper operator, hand.................................. 55 8.04 32 5.53 - - - - - - - - - - - - - -
Set up and operate.................................... 51 8.06 24 6.26 - - - - - - - - - - - - - -Tenoner operator.......................................... 229 5.89 200 5.35 7 4.49 7 5.01 - - - - - - - - 30 4.49
Set up and operate.................................... 183 5.74 139 5.56 7 4.49 6 5.20 - - - - - - - - 23 4.53Feed only.................................................... 46 6.51 61 4.87 - - - - - - - - - - - - - -
Variety saw operator..................................... 239 6.66 269 4.52 - - 13 9.28 - - - - - - - _ 70 4.71
roo>
See footnotes at end of table.
Digitized for FRASER http://fraser.stlouisfed.org/ Federal Reserve Bank of St. Louis

Table 12. Occupational averages by labor-management contract coverage—Continued
(Number and average straight-time hourly earnings1 of workers in millwork manufacturing establishments by labor-management contract coverage, United States and selected regions, June 1979)
Southwest Great Lakes Middle West Mountain Pacific
Establishments with-
OccupationMajoritycovered
None or minority covered
Majoritycovered
None or minority covered
Majoritycovered
None or minority covered
Majoritycovered
None or minority covered
Majoritycovered
None or minority covered
Numberof
workers
Average
hourlyearnings
Numberof
workers
Average
hourlyearnings
Numberof
workers
Average
hourlyearnings
Numberof
workers
Average
hourlyearnings
Numberof
workers
Average
hourlyearnings
Numberof
workers
Average
hourlyearnings
Numberof
workers
Average
hourlyearnings
Numberof
workers
Average
hourlyearnings
Numberof
workers
Average
hourlyearnings
Numberof
workers
Average
hourlyearnings
Assembler, wood products........................... 116 $3.35 639 $3.87 1,169 $5.64 _ _ _ _ 455 $5.07 56 $6.52 315 $5.28 572 $7.98 85 $4.45Boring-machine operator.............................. - - - - 63 5.97 11 $3.97 - - 23 4.23 - - - - 51 8.21 - -Cut-off saw operator..................................... 38 3.58 206 3.65 228 5.51 72 5.18 - - 90 5.16 - - 118 5.62 425 7.09 269 6.25Gluer, rough stock......................................... 12 3.78 115 3.62 123 4.97 35 6.10 - - - - 14 6.51 24 6.52 97 7.35 24 5.57Janitor............................................................ 11 3.63 40 3.58 74 4.57 40 5.55 7 $4.25 15 4.39 22 4.01 45 5.72 57 6.11 33 5.00Lathe operator, automatic............................ - - - - 24 5.16 - - - - - - - - - - - - - -
Set up and operate.................................... - - - - 17 5.21 - - - - - - - - - - - - - -Maintainer, general utility ............................. 14 4.69 61 5.27 130 5.61 68 5.26 - - 51 5.90 - - 33 6.36 125 7.78 56 7.36Millwright........................................................ - - - - 57 6.30 18 7.17 - - - - - - - - 29 8.31 12 8.24Molding-machine operator............................ 26 3.94 210 4.67 179 6.00 63 4.99 14 5.37 54 5.76 - - 118 5.97 264 7.49 208 6.14
Set up and operate.................................... 17 4.17 112 5.30 137 6.31 35 4.98 14 5.37 54 5.76 - - 42 6.88 178 8.10 92 6.32Feed only.................................................... - - 98 3.95 42 4.99 - - - - - - - - 76 5.46 86 6.24 116 6.00
Mortising machine operator......................... 8 3.59 29 3.92 30 5.96 - - - - - - - - 11 5.34 40 7.90 31 5.16Off-bearer, machine...................................... - - 373 3.27 450 4.98 110 5.43 - - 41 4.84 - - 112 5.05 718 6.47 380 5.38Planer operator............................................. - - 37 4.08 71 5.40 - - - - - - - 15 6.76 82 6.94 11 6.66
Set up and operate.................................... - - 22 4.68 51 5.30 - - - - - - - - 10 6.58 61 6.97 7 7.13Feed on ly.................................................... - - - - 20 5.66 - - - - - - - - - - 21 6.83 - -
Power-truck operator.................................... 23 3.58 128 3.96 277 5.24 - - 18 5.14 76 5.28 - - 105 6.05 237 7.04 140 6.50Forklift operator.......................................... 23 3.58 124 3.93 267 5.23 67 6.55 18 5.14 76 5.28 - - 96 5.78 227 7.05 140 6.50Other than forklift ....................................... - - - - 10 5.64 - - - - - - - - - - 10 6.73 - -
Rip-saw operator.......................................... 23 3.86 121 4.59 146 5.52 28 5.49 - - 19 4.96 - - 30 6.14 183 7.51 71 6.55Router operator............................................ - - 19 4.48 42 6.12 20 5.28 - - 18 5.11 - - - - 53 7.65 18 4.74Sander, hand ................................................ - - 30 3.65 23 4.38 - - - - 16 4.31 - - 60 3.67 - - 29 4.52Sander, machine .......................................... - - 45 4.27 64 5.45 22 4.09 - - 40 4.60 - - - - 67 7.12 27 5.17
B e lt.............................................................. - - 34 4.42 50 5.53 - - - _ 40 4.60 - - - - 35 7.22 - -Other than be lt........................................... - - - - 14 5.17 - - _ _ - - - - - - 32 7.02 22 5.25
Shaper operator, automatic......................... - - 50 5.07 25 5.30 - - - - - - - - - - 51 8.22 - -Set up and operate.................................... - - 38 5.43 19 5.76 - - - - - - - - - - 31 9.17 - -Feed only.................................................... - - 12 3.94 - - - - - - - - - - - - - - - -
Shaper operator, hand.................................. - - - - 13 8.14 - - - - - - - - - - 29 8.24 - -Set up and operate.................................... - - - - 13 8.14 - - - - - - - - - - 25 8.31 - -
Tenoner operator ......................................... 21 3.76 37 4.13 96 5.68 44 6.32 - - 28 5.09 - - 19 5.52 77 7.07 26 6.64Set up and operate.................................... 21 3.76 27 4.23 88 5.74 21 7.71 - - 24 5.36 - - 14 5.94 43 6.99 18 6.62Feed only.................................................... - - 10 3.84 - - - - - - - - - - - - 34 7.18 8 6.69
Variety saw operator..................................... - - 53 4.48 96 5.61 - - - - 24 4.76 - - 15 5.65 82 8.46 36 4.98
1 Excludes premium pay for overtime and for work on weekends, holidays, and late shifts. NOTE: Dashes indicate no data or data do not meet publication criteria.
Digitized for FRASER http://fraser.stlouisfed.org/ Federal Reserve Bank of St. Louis

Table 13. Method of wage payment
(Percent of production workers in millwork manufacturing establishments by method of wage payment,1 United States and selected regions and States, June 1979
Method UnitedStates
Region
NewEngland
MiddleAtlantic
BorderStates Southeast Southwest Great
LakesMiddleWest Mountain Pacific
All workers.................................................. 100 100 100 100 100 100 100 100 100 100
Time-rated workers........................................ 92 99 98 100 92 97 75 97 100 100Formal p lans................................................ 73 33 64 69 39 56 72 89 77 96
Single ra te ................................................. 35 5 10 17 17 2 34 6 37 79Range of rates.......................................... 38 28 54 52 22 54 38 83 39 16
Individual rates ............................................ 19 67 34 31 53 41 2 9 23 4
Incentive workers........................................... 8 1 2 _ 8 3 25 3 _ _Individual piecework.................................... 2 1 2 - 1 1 6 (2) - -Group piecework......................................... 2 - - - 2 2 6 - - -Individual bonus .......................................... 4 - (2) - 2 - 13 3 - -Group bonus................................................ (2) - - - 3 - (2) - - -
State
California Florida Illinois New York Ohio Oregon Pennsylvania Texas Wash
ington Wisconsin
All workers.................................................. 100 100 100 100 100 100 100 100 100 100
Time-rated workers........................................ 100 98 100 99 91 100 94 97 100 84Formal plans................................................ 93 24 97 77 79 98 32 56 98 84
Single ra te ................................................. 81 - 43 19 64 71 10 2 90 43Range of rates.......................................... 13 24 53 58 15 28 22 54 8 41
Individual rates ............................................ 7 74 3 22 12 2 62 41 2 -
Incentive workers........................................... _ 2 _ 1 9 _ 6 3 _ 16Individual piecework.................................... - 1 - - 5 - 6 1 - 15Group piecework......................................... - - - - - - - 2 - 1Individual bonus .......................................... - 1 - 1 3 - - - - -Group bonus................................................ - - - - 1 - - - -
1 For definition of method of wage payment, see appendix A. NOTE: Because of rounding, sums of individual items may not equal totals.2 Less than 0.5 percent.
Digitized for FRASER http://fraser.stlouisfed.org/ Federal Reserve Bank of St. Louis

Table 14. Minimum entrance rates: Machine off-bearers
(Number of establishments studied by formally established minimum entrance (hiring) rates1 for full-time machine off-bearers, millwork manufacturing establishments,United States and selected regions, June 1979)
Minimum rate UnitedStates
NewEngland
MiddleAtlantic
BorderStates Southeast Southwest Great
LakesMiddleWest Mountain Pacific
Establishments studied................................. 334 17 31 22 42 40 60 16 26 80
Establishments having machine off-bearers . 176 4 11 8 20 27 37 9 12 48
Establishments having a specified minimum 153 4 9 8 12 20 37 7 12 44
$2.90 and under $3.00.................................. 18 1 2 1 3 7 1 2 - 1
$3.00 and under $3.10.................................. 11 1 1 1 1 4 1 1 _ 1$3.10 and under $3.20.................................. 6 - 1 2 1 2 - - - -$3.20 and under $3.30.................................. 6 - - 1 1 1 2 1 - -$3.30 and under $3.40.................................. 2 - - - - 1 1 - - -$3.40 and under $3.50.................................. 6 1 2 - 1 1 - - 1 -$3.50 and under $3.60.................................. 13 1 - 1 - 2 1 2 3 3$3.60 and under $3.70.................................. 3 - - - 1 - 2 - - -$3.70 and under $3.80.................................. 5 - - - 1 1 - - 2 1$3.80 and under $3.90.................................. 3 - - 1 - - 1 - 1 -$3.90 and under $4.00.................................. 7 - - 1 2 - 2 - - 2
$4.00 and under $4.10.................................. 8 _ _ _ _ 1 4 _ 1 2$4.10 and under $4.20.................................. 2 - 1 - - - - - - 1$4.20 and under $4.30.................................. 6 _ 2 - - - 3 - - 1$4.30 and under $4.40.................................. 3 - - - - - 2 - - 1$4.40 and under $4.50.................................. 1 - - - - - 1 - - -$4.50 and under $4.60.................................. 4 - - - 1 - 1 - - 2$4.60 and under $4.70.................................. - - - - - - - - - -$4.70 and under $4.80.................................. 2 - - - - _ 2 - - -$4.80 and under $4.90.................................. 6 - - - - - 1 1 1 3$4.90 and under $5.00.................................. 4 - - - - - 2 - - 2
$5.00 and under $5.10.................................. 2 _ _ _ _ 2 _ _ _$5.10 and under $5.20.................................. 4 - - - - - 2 - - 2$5.20 and under $5.30.................................. 4 - - - - - 1 - 1 2$5.30 and under $5.40.................................. 1 - - - - - 1 - - -$5.40 and under $5.50.................................. 1 - - - - - - - - 1$5.50 and under $5.60.................................. 2 - _ - _ _ - - - 2$5.60 and under $5.70.................................. 2 - - - - - - - - 2$5.70 and under $5.80.................................. 1 - - - - - - - - 1$5.80 and under $5.90.................................. - - - - - - ~ - - -$5.90 and under $6.00.................................. 2 - - - - - 1 - - 1
$6.00 and over........................... .................. 18 - - - - - 3 - 2 2 13
1 Minimum entrance rates refer to the lowest formal hiring rates established $6.40, 2 at $6.40 to $6.60, 1 at $6.60 to $6.80, 2 at $7 to $7.20, 4 at $7.60 tofor machine off-bearers. $7.80, and 1 at $8 and over.
2 Establishments were distributed as follows: 1 at $6 to $6.20, 2 at $6.20 to
Digitized for FRASER http://fraser.stlouisfed.org/ Federal Reserve Bank of St. Louis

H d sandersTable 15. Minimum entrance rates
(Number of establishments studied by form / established minimum entrance (hiring) rates 1 for full-time hand sanders, millwork manufacturing establishments, UnitedStates and selected regions, June 1979)
Minimum rate UnitedStates
NewEngland
MiddleAtlantic
BorderStates Southeast Southwest Great
LakesMiddleWest Mountain Pacific
Establishments studied ................................. 334 17 31 22 42 40 60 16 26 80
Establishments having hand sanders .......... 72 - 7 4 5 5 16 6 7 22
Establishments having a specified minimum 55 - 4 3 4 3 15 5 6 15
Under $2.90.................................................... _ _ _ _ _ _ _ _ _ _$2.90 and under $3.00.................................. 30 - 3 3 3 3 5 4 5 4
$3.00 and under $3.10.................................. 21 _ 2 2 2 1 4 2 5 3$3.10 and under $3.20.................................. - - - - - - - - - -$3.20 and under $3.30.................................. 4 - - - 1 - 2 1 - -$3.30 and under $3.40.................................. - - - - - - - - - -$3.40 and under $3.50.................................. 2 - 1 - - - - - 1 -$3.50 and under $3.60.................................. 5 - - - - - - 1 2 2$3.60 and under $3.70.................................. - - - - - - - - - -$3.70 and under $3.80.................................. 4 - 1 - 1 - - - 1 1$3.80 and under $3.90.................................. 1 - - - - - 1 - - -$3.90 and under $4.00.................................. 14 - - 1 1 - 5 1 1 5
$4.00 and under $4.10.................................. 12 _ _ _ 1 _ 4 1 1 5$4.10 and under $4.20.................................. 1 - - - - - - - - 1$4.20 and under $4.30.................................. - - - - - - - - - -$4.30 and under $4.40.................................. 1 - - - - - - - - 1$4.40 and under $4.50.................................. 1 - - - - - 1 - - -
$4.50 and under $4.60.................................. 2 - - - 1 - 1 - - -$4.60 and under $4.70.................................. - - - - - - - - - -$4.70 and under $4.80.................................. - - - - - - - - - -$4.80 and under $4.90.................................. 2 - - - - - - 1 - 1$4.90 and under $5.00.................................. 11 - 1 - - - 5 - - 5
$5.00 and under $5.10.................................. 10 _ 1 _ _ _ 5 _ _ 4$5.10 and under $5.20.................................. 1 - - - - - - - - 1$5.20 and under $5.30.................................. 2 - - - - - 1 - - 1$5.30 and under $5.40.................................. 1 - - - - - 1 - - -$5.40 and under $5.50.................................. 1 - - - - - - - - 1$5.50 and under $5.60.................................. 1 - - - - - - - - 1$5.60 and under $5.70.................................. - - - - - - _ - - -$5.70 and under $5.80.................................. 1 - - - - - 1 - - -$5.80 and under $5.90.................................. - - - - - - - - - -$5.90 and under $6.00.................................. 2 - - - - - 2 - - -
$6.00 and over............................................... 3 - - - - - 1 - - 2
1 Minimum entrance rates refer to the lowest formal hiring hiring rates established for hand sanders.
Digitized for FRASER http://fraser.stlouisfed.org/ Federal Reserve Bank of St. Louis

Table 16. Scheduled weekly hours
(Percent of production workers in millwork manufacturing establishments by scheduled weekly hours,1 United States and selected regions, June 1979)
Weekly hours UnitedStates
NewEngland
MiddleAtlantic
BorderStates Southeast Southwest Great
LakesMiddleWest Mountain Pacific
All workers................................................. 100 100 100 100 100 100 100 100 100 100Under 28 hours............................................. (1 2) - 1 - - - - - - -35 hours......................................................... (2) - - - - - 1 - - -36 hours......................................................... (2) - - - - - - - - 140 hours......................................................... 92 89 95 89 84 85 93 89 100 98Over 40 and under 45 hours........................ 1 5 - 9 3 3 (2) - - -45 hours......................................................... 5 6 3 2 7 12 5 9 - -Over 45 hours ............................................... 1 - - - 6 - - 2 - 1
1 Data relate to the predominant schedule for full-time day-shift workers in NOTE: Because of rounding, sums of individual items may not equal 100.each establishment.
2 Less than 0.5 percent.
Digitized for FRASER http://fraser.stlouisfed.org/ Federal Reserve Bank of St. Louis

Table 17. Shift differential provisions
(Percent of production workers in millwork manufacturing establishments with formal provisions for shift differentials,1 United States and selected regions, June 1979)
Shift differential UnitedStates
NewEngland
MiddleAtlantic
BorderStates Southeast Southwest Great
LakesMiddleWest Mountain Pacific
Second shift
Workers in establishments withsecond-shift provisions................................ 60.1 30.7 39.4 26.3 21.8 34.6 80.6 77.5 70.8 71.1With shift differential................................... 53.9 23.4 39.4 26.3 17.6 32.5 74.4 30.2 67.8 71.1
Uniform cents per hour ........................... 44.4 8.8 33.3 22.2 17.6 32.5 54.6 30.2 52.5 62.05 cen ts.................................................... 2.2 - 1.4 - 5.2 4.2 2.0 6.8 - -Over 5 and under 10 cents................... 1.4 - - - 5.3 - 2.8 - - .610 cents.................................................. 10.4 - 2.3 18.5 - 19.6 12.2 10.4 8.8 9.2Over 10 and under 15 cents ................ 6.8 - 4.1 - 2.1 - 11.3 - - 13.415 cents.................................................. 11.0 - 4.4 3.7 5.1 2.3 19.5 13.0 19.4 9.416 cents.......................................... ....... 1.5 - - - - - - - - 6.320 cents.................................................. 8.5 - 6.0 - - 2.5 4.3 - 24.3 21.525 cents.................................................. 1.4 - - - - 2.4 2.6 - - 1.630 cents.................................................. .7 - 10.7 - - - - - - -35 cents.................................................. .3 - 4.5 - - - - - - -Over 35 cents ........................................ .4 8.8 - - - 1.4 - - - -
Uniform percentage ................................. 6.3 - 6.0 4.1 - - 18.4 - - 2.66 percent ................................................ 5.1 - - - - - ' 18.4 - - -7 percent ................................................ .6 - - - - - - - - 2.610 percent.............................................. .6 - 6.0 4.1 - - - - - -
Other formal paid differential................... 3.1 14.6 - - - - 1.4 - 15.3 6.5
Third or other late shift
Workers in establishments with third-shift provisions.............................................. 36.1 17.6 28.1 18.5 11.0 11.6 47.6 53.3 46.4 44.6With shift differential................................... 32.3 17.6 28.1 18.5 11.0 11.6 47.6 6.0 46.4 43.3
Uniform cents per hour ........................... 21.8 - 22.0 18.5 11.0 11.6 27.8 6.0 36.2 28.110 cents.................................................. 2.9 - 1.4 - 3.6 5.5 6.0 - - .6Over 10 and under 15 cents ................ 2.1 - - - 5.3 - 5.3 - - .615 cents................................................. 3.1 - - 18.5 - - 4.6 - 15.5 -18 cents.................................................. 2.1 - 1.6 - 2.1 - - - - 7.420 cents.................................................. 4.8 - 3.9 - - 2.4 6.8 6.0 5.7 6.6Over 20 and under 25 cents ................ .6 - - - - - - - - 2.325 cents.................................................. 1.1 - - - - - 2.6 - - 1.6Over 25 and under 30 cents ........... . 3.0 - - - - - - - 15.0 9.030 cents.................................................. .7 - 10.7 - - - - - - -35 cents.................................................. .3 - - - - 2.3 - - - -45 cents....................... .......................... .2 - - - - 1.4 - - - -50 cents.................................................. 1.0 - 4.5 - - 2.6 - - -
Uniform percentage ................................. 6.1 - 6.0 - - - 18.4 - - 2.69 percent ................................................ 5.1 - - - - - 18.4 - - -10 percent.............................................. .4 - 6.0 - - - - - - -Over 10 and under 15 percent.......... . .6 - - - - - - - - 2.6
Other formal paid differential................... 4.4 17.6 - - - - 1.4 - 10.2 12.6
1 Refers to policies of establishments currently operating late shifts or having NOTE: Because of rounding, sums of individual items may not equal totals,provisions covering late shifts.
Digitized for FRASER http://fraser.stlouisfed.org/ Federal Reserve Bank of St. Louis
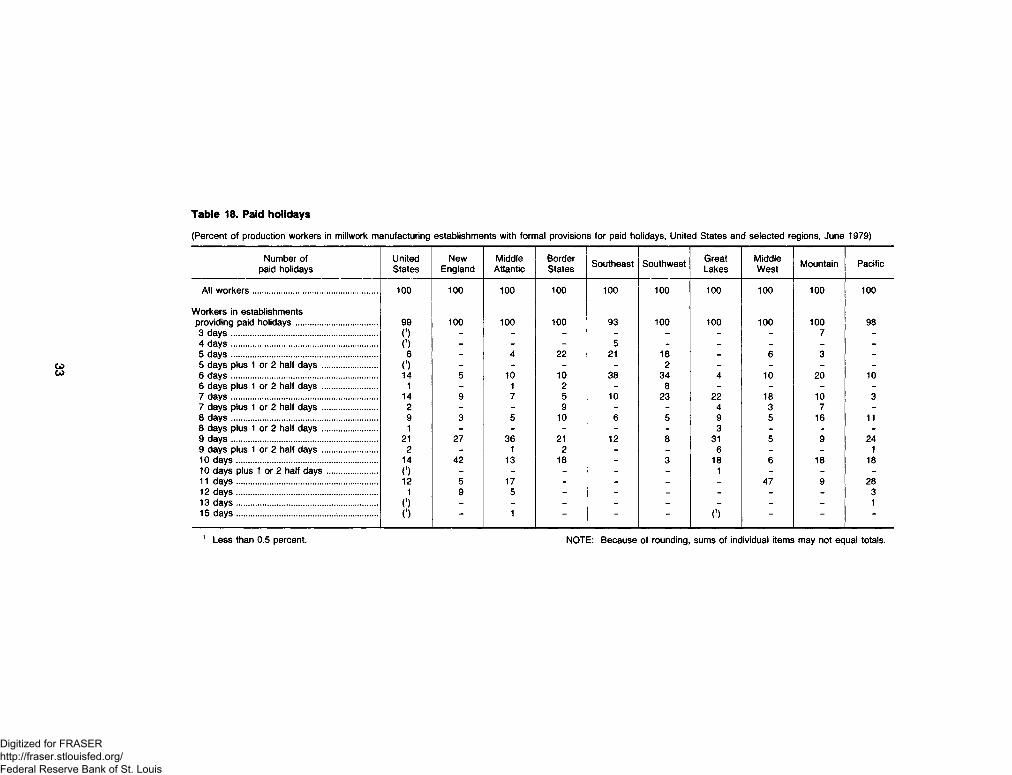
Table 18. Paid holidays
(Percent of production workers in millwork manufacturing establishments with formal provisions for paid holidays, United States and selected regions, June 1979)
Number of paid holidays
UnitedStates
NewEngland
MiddleAtlantic
BorderStates Southeast Southwest Great
LakesMiddleWest Mountain Pacific
All workers................................................. 100 100 100 100 100 100 100 100 100 100
Workers in establishmentsproviding paid holidays................................ 99 100 100 100 93 100 100 100 100 983 days .......................................................... O - - - - - - - 7 -4 days .......................................................... 0 - - - 5 - - - - -5 days .......................................................... 6 - 4 22 21 18 - 6 3 -5 days plus 1 or 2 half days...................... 0 - - - - 2 - - - -6 days ......................................................... 14 5 10 10 38 34 4 10 20 106 days plus 1 or 2 half days ...................... 1 - 1 2 - 8 - - - -7 days................................ ......................... 14 9 7 5 10 23 22 18 10 37 days plus 1 or 2 half days ..................... 2 - - 9 - - 4 3 7 -8 days .......................................................... 9 3 5 10 6 5 9 5 16 118 days plus 1 or 2 half days ...................... 1 - - - - - 3 - - -9 days ......................................................... 21 27 36 21 12 8 31 5 9 249 days plus 1 or 2 half days ...................... 2 - 1 2 - - 6 - - 110 days........................................................ 14 42 13 18 - 3 18 6 18 1810 days plus 1 or 2 half days.................... O - - - - - 1 - - -11 days ....................................................... 12 5 17 - - - - 47 9 2812 days....................................................... 1 9 5 - - - - - - 313 days ........................................................ 0 - - - - - - - - 115 days........................................................ ( 1) 1 - - - ( 1) - - ~
Less than 0.5 percent. NOTE: Because of rounding, sums of individual items may not equal totals.
Digitized for FRASER http://fraser.stlouisfed.org/ Federal Reserve Bank of St. Louis

Table 19. Paid vacations
(Percent of production workers in millwork manufacturing establishments with formal provisions for paid vacations after selected periods of service, United States andselected regions, June 1979)
Vacation policy UnitedStates
NewEngland
MiddleAtlantic
BorderStates Southeast Southwest Great
LakesMiddleWest Mountain Pacific
All workers.................................................. 100 100 100 100 100 100 100 100 100 100
Method of paymentWorkers in establishmentsproviding paid vacations.............................. 99 100 100 100 93 96 100 100 100 100Length-of-time payment ............................. 85 100 92 100 91 91 59 100 96 98Percentage payment................................... 13 - 4 - 2 5 41 - 4 2Flat sum ...................................................... 0 - 4 - - - - - - -O ther............................................................ 1 - - - 7 4 - - - -
Amount of vacation pay2After 1 year of service:
1 w eek......................................................... 80 87 89 96 69 81 64 98 89 88Over 1 and under 2 weeks........................ 5 - 5 - 1 2 13 - - 12 weeks ....................................................... 8 13 2 4 20 13 4 - 7 9Over 2 and under 3 weeks......................... 0 - 4 - - - - - - -Over 3 and under 4 weeks........................ (1) - - - - - - - 4 -Over 4 and under 5 weeks......................... 5 - - - - - 18 - - 1
After 2 years of service:1 w eek......................................................... 56 69 42 57 56 51 50 28 72 72Over 1 and under 2 weeks......................... 7 - 8 28 4 5 13 4 - 22 weeks ....................................................... 28 31 45 15 30 40 12 68 25 26Over 2 and under 3 weeks........................ 2 - 4 - - - 6 - - -Over 3 and under 4 weeks......................... 0 - - - - - - - 4 -Over 4 and under 5 weeks......................... 5 - - - - - 18 - - 1
After 3 years of service:1 week......................................................... 15 34 4 29 30 28 9 11 25 8Over 1 and under 2 weeks......................... 4 - 6 28 4 7 4 4 - -2 weeks ....................................................... 67 66 85 41 57 55 52 86 70 89Over 2 and under 3 weeks........................ 6 _ 6 2 _ 6 16 _ 1 13 weeks ....................................................... 0 - _ _ _ _ - - - 1Over 3 and under 4 weeks......................... 0 - - _ _ _ _ _ 4 -Over 4 and under 5 weeks........................ 5 - - - _ _ 18 _ - 1
After 5 years of service:1 week......................................................... 7 7 - 19 22 20 3 3 - 2Over 1 and under 2 weeks........................ 2 - 1 16 7 _ - 4 - -2 weeks ....................................................... 56 77 72 63 60 65 49 38 65 55Over 2 and under 3 weeks......................... 13 - 19 2 - 8 22 47 1 33 weeks ....................................................... 15 16 7 _ 4 4 7 7 30 39Over 3 and under 4 weeks......................... 0 - _ - - _ 1 - 4 -Over 4 and under 5 weeks......................... 5 - - - - - 18 - - 1
After 10 years of service:1 week......................................................... 6 7 - 17 19 15 1 3 - 2Over 1 and under 2 weeks......................... 1 - - - 1 - 2 - - -2 weeks ....................................................... 23 62 28 44 53 41 12 19 28 5Over 2 and under 3 weeks........................ 1 - 6 2 3 - 1 - - -3 weeks ....................................................... 45 16 59 37 16 34 40 72 31 65Over 3 and under 4 weeks........................ 9 - 7 - - 5 25 - 4 24 weeks ....................................................... 9 15 - - - - 1 6 27 25Over 4 and under 5 weeks......................... 5 - - - _ - 18 - - 15 weeks .......................................................
i1
i- - - - - - - 9 -
See footnotes at end of table.Digitized for FRASER http://fraser.stlouisfed.org/ Federal Reserve Bank of St. Louis

Table 19. Paid vacations—Continued
(Percent of production workers in millwork manufacturing establishments with formal provisions for paid vacations after selected periods of service, United States andselected regions, June 1979)
Vacation policy UnitedStates
NewEngland
MiddleAtlantic
BorderStates Southeast Southwest Great
LakesMiddleWest Mountain Pacific
Amount of vacation pay1 2After 12 years of service:
1 w eek......................................................... 6 7 - 17 19 15 1 3 - 2Over 1 and under 2 weeks......................... o - - - 1 - - - - -2 weeks ....................................................... 20 62 28 44 53 41 5 12 28 3Over 2 and under 3 weeks........................ 1 - 6 2 - - 3 - - -3 weeks ....................................................... 43 16 55 37 19 34 45 32 31 63Over 3 and under 4 weeks......................... 12 - 11 - - 2 24 47 4 24 weeks ....................................................... 10 15 - - - 3 2 6 27 28Over 4 and under 5 weeks........................ 6 - - - - - 20 - - 15 weeks....................................................... 1 - - - - - - - 9 -
After 15 years of service:1 w eek......................................................... 6 7 - 17 19 15 1 3 - 2Over 1 and under 2 weeks......................... o - - - 1 - - - - -2 weeks ....................................................... 17 32 28 39 42 41 3 9 28 3Over 2 and under 3 weeks ......................... 1 - 4 8 _ - 2 - - -3 weeks ....................................................... 40 38 51 37 27 26 38 35 28 56Over 3 and under 4 weeks......................... 11 - 10 - - 2 20 47 4 24 weeks....................................................... 9 22 7 - 4 11 8 6 16 11Over 4 and under 5 weeks........................ 8 - - - - - 28 - - 15 weeks ....................................................... 7 - - - - - - _ 15 256 weeks...................................................... 1 - - - _ - - - 9 _
After 20 years of service:1 w eek......................................................... 6 7 - 17 19 15 1 3 - 2Over 1 and under 2 weeks........................ 0 - - - 1 - - - - -2 weeks....................................................... 17 32 27 39 42 41 3 9 28 3Over 2 and under 3 weeks........................ 1 _ 4 8 _ - 2 _ - -3 weeks ....................................................... 28 30 33 18 25 19 21 33 16 44Over 3 and under 4 weeks........................ 1 - 2 - - 2 0 - 4 14 weeks ....................................................... 24 30 28 19 6 18 28 49 27 19Over 4 and under 5 weeks........................ 4 _ 5 - _ - 11 _ - 25 weeks ....................................................... 16 _ - _ _ - 28 6 15 28Over 5 and under 6 weeks........................ 2 - - _ _ - 6 _ - _6 weeks ....................................................... 1 _ - _ _ _ _ _ 9 _
After 25 years of service:31 w eek......................................................... 6 7 - 17 19 15 1 3 - 2Over 1 and under 2 weeks......................... 0 - - - 1 - _ _ - _2 weeks ....................................................... 17 32 27 39 42 41 3 9 28 3Over 2 and under 3 weeks........................ 1 - 4 8 - - - - - _3 weeks ....................................................... 27 30 33 18 25 19 20 28 11 44Over 3 and under 4 weeks........................ 1 - - - - 2 0 - 4 14 weeks ....................................................... 19 30 29 19 6 18 26 7 23 17Over 4 and under 5 weeks........................ 6 _ 5 _ _ _ 7 47 _ 25 weeks ....................................................... 6 - 2 _ _ _ 11 6 9 9Over 5 and under 6 weeks........................ 6 - - - - _ 23 _ - _6 weeks ....................................................... 8 - - - _ - 3 - 24 22Over 6 and under 7 weeks........................ 1 - - - - - 5 - - -
1 Less than 0.5 percent.2 Vacation payments, such as percent of annual earnings, were converted to
an equivalent time basis. Periods of service were chosen arbitrarily and do notnecessarily reflect individual establishment provisions for progression. For example, changes indicated at 10 years may include changes that occurred
between 5 and 10 years.3 Vacation provisions were virtually the same after longer periods of service.
NOTE: Because of rounding, sums of individual items may not equal totals.
Digitized for FRASER http://fraser.stlouisfed.org/ Federal Reserve Bank of St. Louis

Table 20. Health, insurance, and retirement plans
(Percent of production workers in miilwork manufacturing establishments with specified health, insurance, and retirement plans,1 United States and selected regions,June 1979)
Type of plan UnitedStates
NewEngland
MiddleAtlantic
BorderStates Southeast Southwest Great
LakesMiddleWest Mountain Pacific
All workers.................................................. 100 100 100 100 100 100 100 100 100 100
Workers in establishments providing:Life insurance .............................................. 91 87 90 85 89 86 96 97 91 89
Noncontributory plans.............................. 72 53 84 69 48 46 72 90 76 85Accidental death anddismemberment insurance ........................ 67 68 72 83 67 42 54 91 73 83Noncontributory plans.............................. 55 42 67 67 31 30 39 86 67 80
Sickness and accident insuranceor sick leave or both1 2 ................................ 63 59 46 86 41 38 91 20 62 67Sickness and accident insurance............ 47 41 40 71 25 24 71 12 57 45
Noncontributory plans........................... 34 23 37 53 16 16 43 10 46 39Sick leave (full pay,no waiting period) ................................... 19 24 10 19 16 14 23 9 1 27
Sick leave (partial payor waiting period) .................................... 1 - - - - - (3) - 3 4
Long-term disability insurance.................... 6 - 1 13 3 7 8 - - 10Noncontributory plans.............................. 4 - 1 - 3 7 5 - - 6
Hospitalization insurance ........................... 97 93 98 96 95 95 99 99 99 98Noncontributory plans.............................. 73 51 89 63 49 47 73 91 65 94
Surgical insurance....................................... 97 93 98 96 92 95 99 99 99 98Noncontributory plans.............................. 73 51 89 63 47 47 73 91 65 94
Medical insurance....................................... 96 93 98 96 92 95 96 99 99 98Noncontributory plans.............................. 72 51 89 63 47 47 69 91 65 94
Major medical insurance............................ 94 93 84 86 86 90 95 99 99 99Noncontributory plans.............................. 70 51 75 57 41 44 69 91 65 94
Retirement plans4 ........................................ 67 50 71 59 35 45 78 83 64 77Pensions.................................................... 66 50 71 59 35 45 75 79 64 77
Noncontributory plans........................... 59 35 58 35 32 30 70 76 64 72Severance pay.......................................... 2 - 2 - - - 3 4 - 3
1 Includes those plans for which the employer pays at least part of the cost and excludes legally required plans such as workers’ compensation and social security; however, plans required by State temporary disability laws are included if the employer contributes more than is legally required or the employees receive benefits in excess of legal requirements. “ Noncontributory plans” include only those plans financed entirely by the employer.
2 Unduplicated total of workers receiving sickness and accident insurance
and sick leave shown separately.3 Less than 0.5 percent.4 Unduplicated total of workers covered by pension plans and severance pay
shown separately.
NOTE: Because of rounding, sums of individual items may not equal totals.
Digitized for FRASER http://fraser.stlouisfed.org/ Federal Reserve Bank of St. Louis

Table 21. Other selected benefits
(Percent of production workers in millwork manufacturing establishments with formal provisions for specified benefits,1 United States and selected regions, June 1979)
Item UnitedStates
NewEngland
MiddleAtlantic
BorderStates Southeast Southwest Great
LakesMiddleWest Mountain Pacific
Workers in establishments with provisions for:
Funeral leave................................................. 62 54 80 64 43 48 86 83 38 46Jury duty leave.............................................. 52 36 53 53 43 62 54 97 27 43Technological severance pay........................ 6 6 - 5 9 6 7 6 2 5Cost-of-living adjustments............................. 19 31 2 - 4 7 19 55 6 28
Based on BLS consumer price index......... 14 20 2 - 1 7 16 55 - 18Other basis ................................................. 4 12 - - 3 - 3 - 6 11
For definition of items, see appendix A. NOTE: Because of rounding, sums of individual items may not equal totals.
Digitized for FRASER http://fraser.stlouisfed.org/ Federal Reserve Bank of St. Louis

Appendix A. Scope and Method of Survey
Scope of surveyThe survey included establishments engaged primar
ily in manufacturing millwork (SIC 2431 as defined in the 1972 edition of the Standard Industrial Classification Manual prepared by the U.S. Office of Management and Budget). Separate auxiliary units such as central offices were excluded.
Establishments studied were selected from those employing 8 workers or more at the time of reference of the data used in compiling the universe lists. Table A-l shows the number of establishments and workers estimated to be within the scope of the survey, as well as the number actually studied by the Bureau.
Products.Classification of establishments by product was based
on the principal type of millwork manufactured. For example, if 60 percent of the total value of an establishment’s production was doors, and 40 percent was windows, all workers in that establishment were considered as producing doors.
Method of studyData were obtained by personal visits of the Bureau’s
field representatives to a probability-based sample of establishments within the scope of the survey. To obtain appropriate accuracy at minimum cost, a greater proportion of large than of small establishments was studied. All estimates are presented, therefore, as relating to all establishments in the industry, excluding only those below the minimum size at the time of reference of the universe data.
Establishment definitionAn establishment is defined for this study as a single
physical location where manufacturing operations are performed. An establishment is not necessarily identical with a company, which may consist of one establishment or more.
EmploymentEstimates of the number of workers within the scope
of the study are intended as a general guide to the size and composition of the industry’s labor force, rather than as precise measures of employment.
Production workersThe terms “production workers’’ and “production
and related workers,” used interchangeably in this bulletin, include working supervisors and all nonsupervi- sory workers engaged in nonoffice activities. Administrative, executive, professional, and technical personnel, and force-account construction employees, who are used as a separate work force on the firm’s own properties, are excluded.
Occupational classificationOccupational classification was based on a uniform
set of job descriptions designed to take account of interestablishment and interarea variations in duties within the same job. (See appendix B for these descriptions.) The criteria for selection of the occupations were: The number of workers in the occupation; the usefulness of the data in collective bargaining; and appropriate representation of the entire job scale in the industry. Working supervisors, apprentices, learners, beginners, trainees, and handicapped, part-time, temporary, and probationary workers were not reported in the data for selected occupations but were included in the data for all production workers.
Wage dataInformation on wages relates to straight-time hourly
earnings, excluding premium pay for overtime and for work on weekends, holidays, and late shifts. Incentive payments, such as those resulting from piecework or production bonus systems, and cost-of-living bonuses were included as part of the workers’ regular pay. Non- production bonus payments, such as Christmas or year- end bonuses, were excluded.
3 8
Digitized for FRASER http://fraser.stlouisfed.org/ Federal Reserve Bank of St. Louis

Average (mean) hourly rates or earnings for each occupation or category of workers, such as production workers, were calculated by weighting each rate (or hourly earnings) by the number of workers receiving the rate, totaling, and dividing by the number of individuals. The hourly earnings of salaried workers were obtained by dividing straight-time salary by normal (or standard) hours to which the salary corresponds.
The median designates position; that is, one-half of the employees surveyed received more than this rate and one-half received less. The middle range is defined by rates of pay such that one-fourth of the employees earned less than the lower of these rates and one-fourth earned more than the higher rate.
Size of communityTabulations by size of community pertain to metro
politan and nonmetropolitan areas. The term “metropolitan areas,” as used in this bulletin, refers to the Standard Metropolitan Statistical Areas as defined by the U.S. Office of Management and Budget through February 1974. Except in New England, a Standard Metropolitan Statistical Area is defined as a county or group of contiguous counties which contains at least one city of 50,000 inhabitants or more. Counties contiguous to the one containing such a city are included in a Standard Metropolitan Statistical Area if, according to certain criteria, they are essentially metropolitan in character and are socially and economically integrated with the central city. In New England, where the city and town are administratively more important than the county, they are the units used in defining Standard Metropolitan Statistical Areas.
Labor-management agreementsSeparate wage data are presented, where possible,
for establishments that had (1) a majority of the production workers covered by labor-management contracts, and (2) none or a minority of the production workers covered by labor-management contracts.
Method of wage paymentTabulations by method of wage payment relate to
the number of workers paid under the various time and incentive wage systems. Formal rate structures for timerated workers provide single rates or a range of rates for individual job categories. In the absence of a formal rate structure, pay rates are determined primarily by the qualifications of the individual worker. A single rate structure is one in which the same rate is paid to all experienced workers in the same job classification. Learners, apprentices, or probationary workers may be paid according to rate schedules which start below the single rate and permit the workers to achieve the full job rate over a period of time. An experienced worker occasionally may be paid above or below the single rate for special reasons, but such payments are excep
tions. Range-of-rate plans are those in which the minimum, maximum, or both of these rates paid experienced workers for the same job are specified. Specific rates of individual workers within the range may be determined by merit, length of service, or a combination of these. Incentive workers are classified under piecework or bonus plans. Piecework is work for which a predetermined rate is paid for each unit of output. Production bonuses are for production in excess of a quota or for completion of a task in less than standard time.
Minimum ratesMinimum entrance rates are the lowest formal rates
established for inexperienced time-rated workers employed as hand sanders and machine off-bearers. Excluded are incentive-paid workers and hourly rated learners who eventually will be on an incentive basis.
Scheduled weekly hoursData on weekly hours refer to the predominant work
schedule for full-time production workers employed on the day shift.
Shift provisions and practicesShift provisions relate to the policies of establishments
either currently operating late shifts or having formal provisions covering late-shift work. Practices relate to workers employed on late shifts at the time of the survey.
Establishment practices and supplementary wage provisions
Supplementary benefits in an establishment were considered applicable to all production workers if they applied to half or more of such workers in the establishment. Similarly, if fewer than half of the workers were covered, the benefit was considered nonexistent in the establishment. Because of length-of-service and other eligibility requirements, the proportion of workers receiving the benefits may be smaller than estimated.
Paid holidays. Paid holiday provisions relate to full and half-day holidays provided annually.
Paid vacations. The summary of vacation plans is limited formal arrangements and exclude informal plans whereby time off with pay is granted at the discretion of the employer or supervisor. Payments not on a time basis were converted; for example, a payment of 2 percent of annual earnings was considered the equivalent of 1 week’s pay. The periods of service for which data are presented represent the most common practices, but they do not necessarily reflect individual establishment provisions for progression. For example, changes in proportions indicated at 10 years of service may include changes which occurred between 5 and 10 years.
3 9Digitized for FRASER http://fraser.stlouisfed.org/ Federal Reserve Bank of St. Louis

Health, insurance, and retirement plans. Data are presented for health, insurance, pension, and retirement severance plans for which the employer pays all or a part of the cost, excluding programs required by law such as workers’ compensation and social security. Among plans included are those underwritten by a commercial insurance company and those paid directly by the employer from his current operating funds or from a fund set aside for this purpose.
Death benefits are included as a form of life insurance. Sickness and accident insurance is limited to that type of insurance under which predetermined cash payments are made directly to the insured on a weekly or monthly basis during illness or accident disability. Information is presented for all such plans to which the employer contributes at least a part of the cost. However, in New York and New Jersey, where temporary disability insurance laws require employer contributions,1 plans are included only if the employer (1) contributes more than is legally required, or (2) provides the employees with benefits which exceed the requirements of the law.
Tabulations of paid sick leave plans are limited to formal plans which provide full pay or a proportion of the worker’s pay during absence from work because of illness; informal arrangements have been omitted. Separate tabulations are provided for (1) plans which provide full pay and no waiting period, and (2) plans providing either partial pay or a waiting period.
Long-term disability insurance plans provide payments to totally disabled employees upon the expiration of sick leave, sickness and accident insurance, or both, or after a specified period of disability (typically 6 months). Payments are made until the end of disability, a maximum age, or eligibility for retirement benefits. Payments may be full or partial, but are almost always reduced by social security, workers’ compensation, and
1 The temporary disability laws in California and Rhode Island do not require employer contributions.
private pension benefits payable to the disabled employee.
Medical insurance refers to plans providing for complete or partial payment of doctors’ fees. Such plans may be underwritten by a commercial insurance company or a nonprofit organization, or they may be a form of self-insurance.
Major medical insurance, sometimes referred to as extended medical or catastrophe insurance, includes plans designed to cover employees for sickness or injury involving an expense which exceeds the normal coverage of hospitalization, medical, and surgical plans.
Tabulations of retirement pensions are limited to plans which provide regular payments for the remainder of the retiree’s life. Data are presented separately for retirement severance pay (one payment or several over a specified period of time) made to employees on retirement. Establishments providing both retirement severance payments and retirement pensions to employees were considered as having both retirement pensions and retirement severance plans; however, establishments having optional plans providing employees a choice of either retirement severance payments or pensions were considered as having only retirement pension benefits.
Paid funeral and jury-duty leave. Provisions for paid funeral and jury-duty leave relate to formal plans which provide at least partial payment for time lost as a result of attending funerals of specified family members or serving as a juror.
Technological severance pay. Data relate to formal plans providing for payments to employees permanently separated from the company because of a technological change or plant closing.
Cost-of-living pay adjustments. Cost-of-living pay adjustments relate to formal plans whereby wage rates are adjusted periodically, in keeping with changes in the Consumer Price Index or on some other basis.
4 0
Digitized for FRASER http://fraser.stlouisfed.org/ Federal Reserve Bank of St. Louis

Table A-1. Estimated number of establishments and employees within scope of survey and number studied, mill work manufacturing, June 1979
Region1 and State
Number of establishments2 Workers in establishments
Within scope of
studyActuallystudied
Within scope of studyActually studied
Total3 Production workers
United States............................................................ 1051 334 57,017 43,914 35,372
New England..................................................................... 41 17 1,277 905 863Middle Atlantic4 ................................................................. 92 31 3,631 2,735 2,025
New Y ork ........................................................................ 39 15 1,422 1,066 1,052Pennsylvania................................................................... 25 12 859 667 611
Border States.................................................................... 55 22 2,757 2,042 1,716Southeast4 ......................................................................... 159 42 5,594 4,076 2,298
Flordia............................................................................. 43 17 1,509 1,143 927Southwest4 ......................................................................... 138 40 7,185 5,593 4,235
Texas............. ................................................................ 91 31 5,807 4,565 3,801Great Lakes4...................................................................... 180 60 16,093 12,228 11,439
Illinois.............................................................................. 35 12 1,676 1,057 971O hio ................................................................................ 40 14 2,650 1,950 1,500Wisconsin........................................................................ 39 19 5,295 4,300 4,345
Middle West....................................................................... 55 16 4,173 3,240 3,107Mountain........................................................................... 58 26 3,087 2,602 2,269Pacific................................................................................ 273 80 13,220 10,493 7,420
California........................................................................ 176 42 6,955 5,569 3,083Oregon ........................................................................... 49 19 4,006 3,150 2,795Washington..................................................................... 48 19 2,259 1,774 1,542
1 The regions used in this study include New England— Connecticut, Maine, Massachusetts, New Hampshire, Rhode Island, and Vermont; M iddle Atlantic— New Jersey, New York, and Pennsylvania; Border States— Delaware, District of Columbia, Kentucky, Maryland, Virginia, and West Virginia; Southeast— Alabama, Florida, Georgia, Mississippi, North Carolina, South Carolina, and Tennessee; Southwest— Arkansas, Louisiana, New Mexico, Oklahoma, and Texas; G reat Lakes—Illinois, Indiana, Michigan, Minnesota, Ohio, and Wisconsin; M iddle West— Iowa, Kansas, Missouri, Nebraska, North Dakota, and South Dakota;
Mountain— Arizona, Colorado, Idaho, Montana, New Mexico, Utah, Wyoming; Pacific— California, Nevada, Oregon, and Washington. Alaska and Hawaii were not included in the study.
2 Includes only those establishments with 8 workers or more at the time of reference of the universe data.
3 Includes executive, professional, office, and other workers in addition to the production worker category shown separately.
4 Includes data for States in addition to those shown separately.
4 1Digitized for FRASER http://fraser.stlouisfed.org/ Federal Reserve Bank of St. Louis

Appendix B. Occupational Descriptions
The primary purpose of preparing job descriptions for the Bureau’s wage surveys is to assist its field representatives in classifying into appropriate occupations workers who are employed under a variety of payroll titles and different work arrangements from establishment to establishment and from area to area. This permits the grouping of occupational wage rates representing comparable job content. Because of this emphasis on comparability of occupational content, the Bureau’s job descriptions may differ significantly from those used in individual establishments or those prepared for other purposes. In applying these job descriptions, the Bureau’s field representatives are instructed to exclude working supervisors, apprentices, learners, beginners, trainees, and handicapped, part-time, temporary, and probationary workers.
Assembler, wood products(Door assembler, sash assembler, knockup man)Assembles and fastens together wooden parts or as
semblies to form sections or complete millwork articles. Work involves the following duties: Glues and drives tenons of precut wood parts into mortises of other parts to assemble wood products, such as window sashes, door frames, or boxes; brushes glue on tenons or into mortises; places wood parts on work table according to specified pattern; inserts mullions between stiles and rails for multipane windows and fastens them with glue. May insert wedges into mortises to fasten parts together. May also operate clamp machine to squeeze tenons into mortises.
Boring-machine operatorOperates a single or multiple spindle boring machine
to bore holes in wooden parts. Work also may involve examining blueprints, drawings, or samples and written specifications to ascertain size, type, and setting of boring tools, stops, jigs, and guides to be used; and adjusting spindle locations and stops to regulate spacing and depth of bore.
Cut-off saw operator(Cut-off-saw operator, treadle operated; swinging-
cut-off-saw operator)Operates a swinging or treadle-operated cutoff saw
to cut wooden stock to desired lengths; grades and cuts stock to best advantage, eliminating knots and other defects.
Gluer, rough stock(Clamp-carrier operator; glue-clamp-machine opera
tor; glue-press operator; glue-rack operator; glue-wheel operator; glueman; revolving-press operator; rotary- clamp operator; squeezer operator)
Applies glue to edges or surfaces of wooden pieces to be joined, assembles and clamps the glued boards into a press until the glue has set or hardened. May also prepare glue.
Janitor(Cleaner, porter; sweeper; charworker)Cleans and keeps in an orderly condition factory
working areas and washrooms, or premises of an office. Duties involve a combination of the following: Sweeping, mopping, or scrubbing, and polishing floors; removing chips, trash and other refuse; dusting equipment, furniture, or fixtures; polishing metal fixtures or trimmings; providing supplies and minor maintenance services, cleaning lavatories, showers, and restrooms. Workers who specialize in window washing are excluded.
Lathe operator, automatic(Swing-type-lathe operator; wood turning-lathe op
erator, etc.)Operates swing-type (rotary cutting) lathe to cut
round wooden articles such as posts or dowels. For wage study purposes, workers are to be classified as follows:
Set up and operate. Selects and installs proper cutting
4 2
Digitized for FRASER http://fraser.stlouisfed.org/ Federal Reserve Bank of St. Louis

heads; inserts and clamps stock between turning centers; and moves lever to swing rotating stock against cutters until shaping is completed.
Feed. Feeds stock into machine.
Maintained general utilityKeeps in repair the machines, mechanical equipment
and/or structure of an establishment (usually a small plant where specialization in maintenance work is impractical). Duties involve the performance of operations and the use of tools and equipment of several trades, rather than specialization in one trade or one type of maintenance work only. Work involves a combination o f the following: Planning and laying out of work relating to repair of buildings, machines, mechanical and/or electrical equipment; repairing electrical and/or mechanical equipment; installing, aligning and balancing new equipment; repairing buildings, floors or stairs as well as making and repairing bins, cribs, and partitions.
MillwrightInstalls new wood working machines or heavy equip
ment, such as power lineshafting and belting, and dismantles and installs machines or heavy equipment when changes in the plant layout are required. Work involves m ost o f the following: Planning and laying out work; interpreting blueprints or other specifications; using a variety of handtools and rigging; making standard shop computations relating to stresses, strength of materials, and centers of gravity; aligning and balancing equipment; selecting standard tools, equipment, and parts to be used; and installing and maintaining in good order power transmission equipment such as drives and speed reducers. In general, the millwright’s work normally requires a rounded training and experience in the trade acquired through a formal apprenticeship or equivalent training and experience.
Molding-machine operator(Molder operator; molding maker, machine; wood
molding-machine operator)Operates a machine that planes wooden boards or
strips on all sides and shapes item to required cross section. For wage survey purposes, workers are to be classified as follows:
Set up an d opera te F eed only
Mortising-machine operator(Chain mortiser operator; chisel-mortiser operator;
louver-mortiser operator)Operates machine to cut mortise slots in wooden
parts. Include operators of machines that automatically space and cut mortises in stiles for insertion of slabs to form louvered doors and windows.
Off-bearer, machine(Catcher; machine tailer; tailer)Catches or receives wooden parts as they come off
the discharge end of a machine; piles products or loads materials on conveyor or truck for transfer elsewhere.
Planer operator(Facer operator; planer; surface operator; woodplaner
operator)Operates a single or double surface planer to level
off irregularities and cut a smooth surface on rough stock, reducing it to specified thickness. Planer operators may be classified on the basis of whether they: Feed only by feeding stock into the machine or set up and operate by adjusting table for depth of cut and thickness of stock, adjusting pressure bar, inserting, guiding and checking stock, and changing dull blades. Includes matcher and sizer operations. For wage study purposes, planer operators are classified as follows:
Set up an d opera te F eed only
Power-truck operatorOperates a manually controlled gasoline- or electric-
powered truck or tractor to transport goods and materials of all kinds about a warehouse, manufacturing plant, or other establishment.
For wage study purposes, workers are classified by type of power truck, as follows:
F ork lift opera torP ow er-tru ck o pera to r (o ther than fo rk lif t)
Rip-saw operator(Band-rip-saw operator; circular-rip-saw operator)Operates a rip-sawing machine to cut lumber with
the grain to specified widths, feeding each piece into roller, adjusting roller speed according to hardness of wood.
Router operator(Router; router-machine operator)Cuts and shapes various designs in wooden stock by
machine. Work involves m ost o f the following: Clamps and tightens bit in chuck of machine; inserts pin in guide hole of machine table; places groove of jig over guide pin and adjusts table for depth of cut and sets table stops; starts machine and feeds stock.
Sander, handSmooths by hand surfaces and edges of boards, or
other wooden articles including assembled products before application of finishing materials. Work involves using sand or emory paper, steel wool, etc. May also use portable sanding machine to complete certain phases of work. However, workers who prim arily use a portable sanding machine to accomplish their duties are excluded.
4 3
Digitized for FRASER http://fraser.stlouisfed.org/ Federal Reserve Bank of St. Louis

Sander, machineSmooths surfaces and edges of boards or other wo
oden articles, or milled stock with fixed or portable sanding machine. For wage survey purposes, workers are to be classified by type of machine, as follows:
B eltO ther than belt
Shaper operator, automatic(Sizer operator, automatic)Operates a machine to form quantities of like, irreg
ularly shaped wooden parts from roughly shaped blanks. For wage survey purposes, workers are to be classified as follows:
S et up an d operate. Selects and installs proper cutters on spindles; sets and locks pattern in place sets stops and clamps to hold blank properly in bed of machine; lays blank over pattern and starts machine.
Feed. Feeds stock into machine.
Shaper operator, hand(Detail-shaper operator; frazer-machine operator;
shaping-machine operator; variety-molder operator; wood-shaping operator)
Operates a hand shaping machine to cut designs of irregular shape in the surface of straight, curved, or irregular shaped pieces of wood by feeding stock against rotating blocks, using template or free hand manipulation to produce shape desired. For wage survey purposes, workers are to classified as follows:
Set up an d opera te F eed on ly
Tenoner operator(Saw-and-chuck-machine operator; double-tenon-
er-machine operator; single-end-tenoner operator; ten- on-machine operator)
Operates a machine that cuts tenons on wooden parts for assembling into complete units. For wage survey purposes, workers are to be classified as follows:
Set up an d opera te F eed on ly
Variety saw operator(Combination saw operator; universal saw operator)Operates adjustable circular saw to perform such op
erations as ripsawing, cross cutting, beveling, grooving, and mitering. Selects sawing blade, adjusts table for angle or depth of cut, and feeds stock into saw.
4 4
Digitized for FRASER http://fraser.stlouisfed.org/ Federal Reserve Bank of St. Louis

Industry Wage Studies
The most recent reports providing occupational wage data for industries included in the Bureau’s program of industry wage surveys are listed below. Copies are for sale from the Superintendent of Documents, U.S. Government Printing Office, Washington, D.C. 20402, or from any of its regional sales offices, and from the regional offices of the Bureau of Labor Statistics shown on the inside back cover. Bulletins that are out of stock are available for reference at leading public, college, or university libraries, or at the Bureau’s Washington or regional offices.
M anufacturing
Basic Iron and Steel, 1978-79. BLS Bulletin 2064 Candy and Other Confectionery Products, 1975. BLS
Bulletin 1939Cigar Manufacturing, 1972. BLS Bulletin 1796 Cigarette Manufacturing, 1976. BLS Bulletin 1944 Corrugated and Solid Fiber Boxes, 1976. BLS Bulletin
1921Drug Manufacturing, September 1978. BLS Bulletin
2077Fabricated Structural Steel, 1974. BLS Bulletin 1935 Fertilizer Manufacturing, 1971. BLS Bulletin 1763 Flour and Other Grain Mill Products, 1977. BLS
Bulletin 2026Fluid Milk Industry, 1973. BLS Bulletin 1871 Footwear, 1975. BLS Bulletin 1946 Hosiery, 1976. BLS Bulletin 1987 Industrial Chemicals, 1976. BLS Bulletin 1978 Iron and Steel Foundries, 1973. BLS Bulletin 1894 Leather Tanning and Finishing, 1973. BLS Bulletin
1835Machinery Manufacturing, 1978. BLS Bulletin 2022 Meat Products, 1979. BLS Bulletin 2082 Men’s Shirts and Separate Trousers, 1978. BLS Bulletin
2035Men’s and Boys’ Suits and Coats, April 1979. BLS
Bulletin 2073Mill work, 1979. BLS Bulletin 2083 Miscellaneous Plastics Products, 1974. BLS Bulletin
1914Motor Vehicles and Parts, 1973-74, BLS Bulletin 1912 Nonferrous Foundries, 1975. BLS Bulletin 1952 Paints and Varnishes, 1976. BLS Bulletin 1973 Paperboard Containers and Boxes, 1970. BLS Bulletin
1719*Petroleum Refining, 1976. BLS Bulletin 1948
Pressed or Blown Glass and Glassware, 1975. BLS Bulletin 1923
Pulp, Paper, and Paperboard Mills, 1977. BLS Bulletin 2008
Semiconductors, 1977. BLS Bulletin 2021 Shipbuilding and Repairing, 1976. BLS Bulletin 1968 Southern Sawmills and Planing Mills, 1969. BLS
Bulletin 1694'Structural Clay Products, 1975. BLS Bulletin 1942 Synthetic Fibers, 1976. BLS Bulletin 1975 Textile Dyeing and Finishing, 1976. BLS Bulletin 1967 Textiles, 1975. BLS Bulletin 1945 Wages and Demographic Characteristics in Work
Clothing Manufacturing, 1972. BLS Bulletin 1858 West Coast Sawmilling, 1969. BLS Bulletin 17041 Women’s and Misses’ Coats and Suits, 1970. BLS
Bulletin 1728'Women’s and Misses’ Dresses, 1977. BLS Bulletin 2007 Wood Household Furniture, Except Upholstered, 1974.
BLS Bulletin 1930
N onm anufacturing
Appliance Repair Shops, 1978. BLS Bulletin 2067 Auto Dealer Repair Shops, 1978. BLS Bulletin 2060 Banking and Life Insurance, 1976. BLS Bulletin 1988 Bituminous Coal Mining, 1976. BLS Bulletin 1999 Communications, 1978. BLS Bulletin 2071 Computer and Data Processing Services, 1978. BLS
Bulletin 2028Contract Cleaning Services, 1977. BLS Bulletin 2009 Contract Construction, 1973. BLS Bulletin 1911 Department Stores, 1977. BLS Bulletin 2006 Educational Institutions: Nonteaching Employees,
1968-69. BLS Bulletin 16711 Electric and Gas Utilites, 1978. BLS Bulletin 2040 Hospitals and Nursing Homes, 1978. BLS Bulletin 2069 Hotels and Motels, 1978. BLS Bulletin 2055 Laundry and Cleaning Services, 1968. BLS Bulletin
1645'Metal Mining, 1977. BLS Bulletin 2017 Motion Picture Theatres, 1966. BLS Bulletin 15421 Oil and Gas Extraction, 1977. BLS Bulletin 2014 Scheduled Airlines, 1975. BLS Bulletin 1951 Wages and Tips in Restaurants and Hotels, 1970. BLS
Bulletin 1712'
'Bulletin out of stock
* U . S . GOVERNMENT P R IN T IN G O F F IC E : 1 9 8 1 - 0 - 3 3 5 = 3 1 l / 7 0 1 f 9
Digitized for FRASER http://fraser.stlouisfed.org/ Federal Reserve Bank of St. Louis

U i i
Employmentand
iploymentandE#™1* *
S 1 0 B (
usBu**^
'A^SSl
*rm
Earnings. .one of six periodicals
published by the Bureau of Labor Statistics, U.S. Department of Labor, gives monthly figures on those tw o top ics for the Nation as a whole, for individual States, and for more than 200 areas. Included are household and establishment data, seasonally and not seasonally adjusted. The data are collected by the Bureau of the Census (Department of Commerce), State Employment Security Agencies, and State Departments of Labor in cooperation with BLS. A supplement is included inthesubscription price.
Subscription Order Form:Enter my Subscription to: E m p loym en t and E arn ings $22; ($5.50 additional for foreign mailing). □ Remittance is enclosed. Q Charge to GPO deposit account no. □ □ □ □ □ □ □ " □ Order No.Credit Card Orders Only-Master Charge and Visa.Total charges $_______________________________Credit Expiration DateCard No. □ □ □ □ □ □ □ □ □ □ □ □ □ □ □ □ □ Month/Year □ □ □ □
Mail Order Form to:Superintendent of Documents, U.S. Government Printing Office, Washington, D.C. 20402 Make checks payable to Superintendent of Documents.
Nam e___________________
Address________________
City, State, and Zip Code
Digitized for FRASER http://fraser.stlouisfed.org/ Federal Reserve Bank of St. Louis


