Embed Size (px)
Citation preview
INDUSTRY WAGE SURVEYCigar Manufacturing
IMARCH 1967
Bulletin No. 1581
UNITED STATES DEPARTMENT OF LABOR '~X5T'
t f eBUREAU OF LABOR STATISTICS
Digitized for FRASER http://fraser.stlouisfed.org/ Federal Reserve Bank of St. Louis
INDUSTRY WAGE SURVEY
Cigar Manufacturing
MARCH 1967
Bulletin No. 1581December 1967
UNITED STATES DEPARTMENT OF LABOR Willard Wirtz, Secretary
BUREAU OF LABOR STATISTICSArthur M. Ross, Commissioner
'3 1
For sale by the Superintendent of Documents, U.S. Government Printing Office, Washington, D.C., 20402 - Price 25 cents
Digitized for FRASER http://fraser.stlouisfed.org/ Federal Reserve Bank of St. Louis

Digitized for FRASER http://fraser.stlouisfed.org/ Federal Reserve Bank of St. Louis
Preface
This bulletin summarizes the results of a Bureau of Labor Statistics survey of wages and supplementary benefits in the cigar manufacturing industry in March 1967.
Separate releases were issued earlier, usually within a few months of the payroll period studied, for the following areas: Scranton and Wilkes-Barre—Hazleton,Pa.; York County, Pa.; and Tampa—St. Petersburg, Fla. Copies of these releases are available from the Bureau of Labor Statistics, Washington, D. C. , 20212, or any of its regional offices.
This study was conducted in the Bureau's Office of Wages and Industrial Relations by the Division of Occupational Pay. The analysis was prepared by Charles E. Scott, Jr. Field work for the survey was directed by the Assistant Regional Directors, Division of Operations.
Other reports available from the Bureau's program of industry wage studies as well as the addresses of the Bureau's six regional offices are listed at the end of this bulletin.
Digitized for FRASER http://fraser.stlouisfed.org/ Federal Reserve Bank of St. Louis
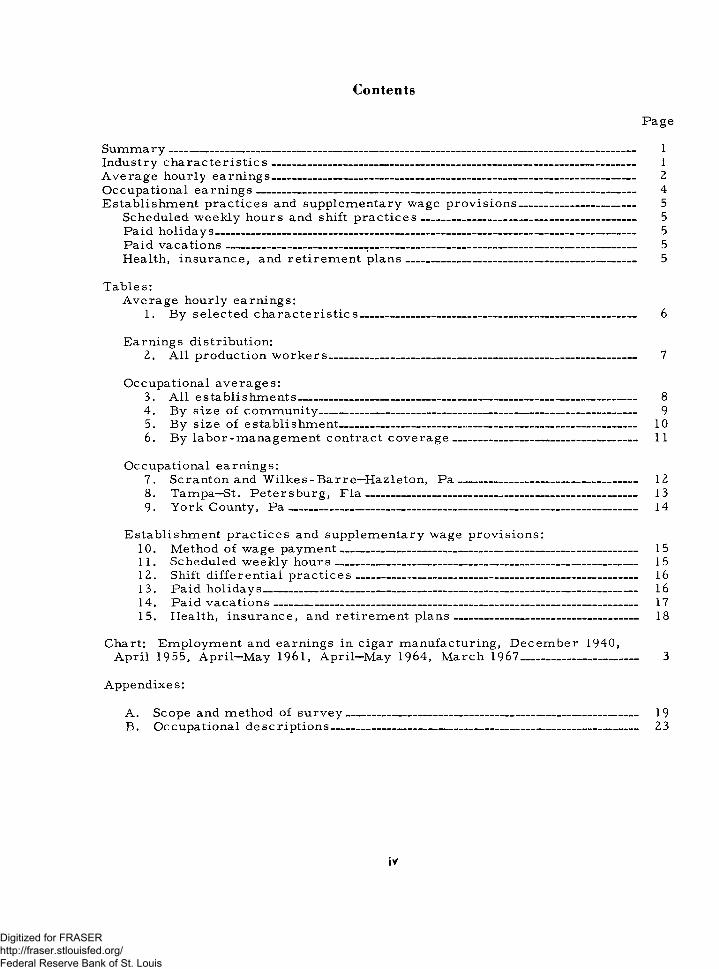
Contents
Page
Summary----------------------------------------------------------------------------------------------------------------------- 1Industry characteristics____________________________________________________________ 1Average hourly earnings-------------------------------------------------------------------------------------------- 2Occupational earnings------------------------------------------------------------------------------------------------ 4Establishment practices and supplementary wage provisions------------------------------ 5
Scheduled weekly hours and shift practices____________________________________ 5Paid holidays______________________________________________________________________ 5Paid vacations----------------------------------- 5Health, insurance, and retirement plans______________________________________ 5
Tables:Average hourly earnings:
1. By selected characteristics______________________________________________ 6
Earnings distribution:2. All production workers___________________________________________________ 7
Occupational averages:3. All establishments-------------------------------------------------------------------------------------- 84. By size of community--------------------------------------------------------------------------------- 95. By size of establishment_________________________________________________ 106. By labor-management contract coverage------------------------------------------------ 11
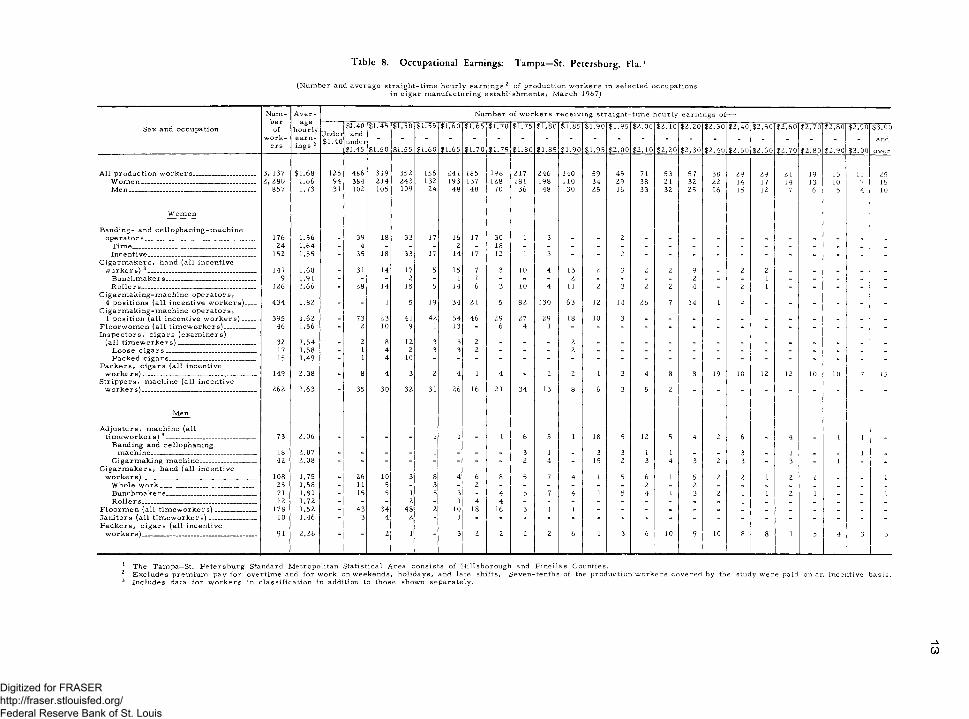
Occupational earnings:7. Scranton and Wilkes - Bar re—Hazleton, P a______________________________ 128. Tampa—St. Petersburg, F la _____________________________________________ 139. York County, P a__________________________________________________________ 14
Establishment practices and supplementary wage provisions:10. Method of wage payment_________________________________________________ 1511. Scheduled weekly hours__________________________________________________ 1512. Shift differential practices_______________________________________________ 1613. Paid holidays----------------------------------------------------------------------------------------------- 1614. Paid vacations--------------------------------------------------------------------------------------------- 1715. Health, insurance, and retirement plans______________________________ 18
Chart: Employment and earnings in cigar manufacturing, December 1940,April 1955, April—May 1961, April—May 1964, March 1967------------------------------ 3
Appendixes:
A. Scope and method of survey________________________________________________ 19B. Occupational descriptions------------------------------------------------------------------------------ 23
iV
Digitized for FRASER http://fraser.stlouisfed.org/ Federal Reserve Bank of St. Louis
Industry Wage Survey—
Cigar Manufacturing, March 1967
Summary
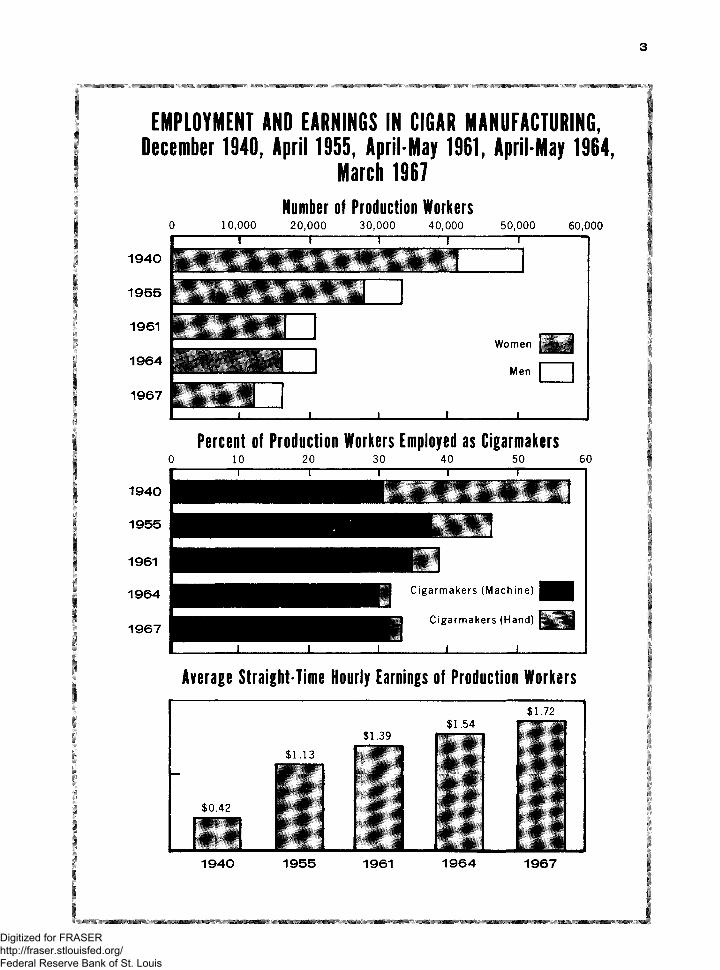
Straight-time e a r n i n g s of production and related workers in the cigar manufacturing industry averaged $1.72 an hour in March 1967. Earnings of nearly all of the 16,552 workers covered by the Bureau's survey1 were within a range of $1.40 to $2.50 an hour; the m i d d l e half earned between $1.51 and $ 1.83. Women constituted three-fourths of the production workers and averaged $1.67 an hour— 17 cents less than men, who accounted for virtually all of the workers in skilled maintenance and machine adjusting jobs.
The industry is concentrated heavily in the Middle Atlantic (nearly all in Pennsylvania) and Southeast (mostly in Florida) regions, 1 2 where earnings averaged $1 . 74 and $1.67 an hour, respectively. Earnings also varied by size of establishment, size of community, labor-management contract status, and occupation.
The large majority of the workers were in plants providing 5, 6, or 7 paid holidays, at least 1 week's vacation pay after 1 year of service, and various types of health insurance benefits.
Industry Characteristics
The 9^ cigar manufacturing plants within scope of the survey employed 16, 552 production and related workers in March 1967, a decline of nearly 25 percent since April— May 1964, the date of a similar study. 3 The number of plants covered by the two studies, however, was virtually the same. The employment level of 21,675 in 1964, marked a pause in the previous steady decline in the industry's employment which had been noted for a number of years.4
1 See appendix A for scope and method of survey. Wage data presented in this bulletin exclude premium pay for overtime and for work on weekends, holidays, and late shifts.
For definitions of regions, see table in appendix A .3 For an account of the earlier study, see Industry Wage
Survey: Cigar Manufacturing, April-M av 1964. BLS Bulletin1436 (1965).
4 See Employment and Earnings Statistics for the UnitedStates, 1909—66. BLS Bulletin 1312-4, and Employment andEarnings. Vol. 13, No. 9, 1967.
Much of the industry's employment decline was due to increased productivity, resulting from new and improved methods of manufacturing. Among these improvements were faster machine speeds, increased machine controlled functions, and combinations of formerly separate functions, particularly on cigarmaking machines. 5
The development of the reconstituted tobacco sheet, 6 which was initially used as cigar binder and more recently as cigar wrapper, has been responsible for substantial occupational changes in the industry. Prior to the introduction of the reconstituted tobacco sheet, a wprker on cigarmaking machines was required to place a binder leaf on the binder die of the machine; the leaf was then rolled around the filler automatically. The reconstituted tobacco s h e e t permits automatic feeding of the binder. Machines which manufacture cigars in a nearly automatic manner, using tobacco sheets for both binder and wrapper, now are being used to a limited extent in the industry.
Since 1955, there has been a substantial s h i f t in the employment of cigarmaking- machine operators from multi- to single- position machines. O p e r a t o r s of singleposition machines, nonexistent in 1955, made up nearly three-fifths of the operators in 1961, and over four-fifths in 1964. As indicated in the tabulation below, there has been a slight decline, however, in the proportion of operators on single - position machines between 1964 and 1967:
garmaking-machine operators:
1967 1964 1961 1955
4 - position---------------------------------- 10 8 11 643-position---------------------------------- 1 1 13 _2-position---------------------------------- 7 4 18 361-position---------------------------------- 81 86 58 -
Total1 ------------------------- ------- 100 100 100 100
Number of workers---------------------> 5 ,1 4 4 6,506 7 ,416 13,061
1 Because of rounding, sums of individual items may not equal 100.
5 Technological Trends in Major American Industries. BLS Bulletin 1474, February 1966.
6 The reconstituted tobacco sheet, used in place of the natural leaf in cigarmaking, is made by pulverizing tobacco and forming it into continuous sheets.
1
Digitized for FRASER http://fraser.stlouisfed.org/ Federal Reserve Bank of St. Louis
2
The number of hand cigarmakers7 also has declined substantially during the 1955—67 period— from 3,074 to 333. (See c h a r t . )
Eighty-six p e r c e n t of the industry's workers were in the Middle Atlantic and Southeast regions and were about evenly divided between the two. Pennsylvania accounted for nearly all of the workers in the Middle Atlantic region and Florida for most of those in the Southeast. Metropolitan areas 8 accounted for slightly more than three-fourths of the production workers in both regions. Scranton and Wilkes - Bar re—Hazleton, Pa. , York County, Pa., and Tampa—St. Petersburg, F l a . , the three areas surveyed separately, accounted for nearly half of the workersin the industry----22, 6, and 19 p e r c e n t ,respectively.
Plants with 500 employees or more accounted for six-tenths of the production workers, compared with three-tenths in plants with 100 to 499 employees and one-tenth in smaller plants. Corresponding proportions were about the same in both the Middle Atlantic and Southeast regions.
Establishments with labor-management contracts covering a majority of their production workers employed slightly less than half of the industry's work force. One-fifth of the workers in the Middle Atlantic region were in establishments with such coverage, compared with nearly two-thirds in the Southeast. The proportions of workers u n d e r c o n t r a c t coverage were about the same (slightly less than half) in metropolitan and nonmetropolitan areas, but were greater in establishments with 500 workers or more (nearly three-fifths) than in smaller establishments (one-third). The major union in the industry was the Cigar Makers' International Union of America.
Incentive wage systems, usually individual piecework, were the basis of wage payment for nearly six-tenths of the production workers (table 10). Slightly more than two-thirds of the workers in the Southeast were paid on an incentive basis, compared with one-half in the Middle Atlantic region. Time-rated workers in the Southeast were most commonly paid under formal systems providing a single rate for a given occupation; rate-range systems were most prevalent in the Middle Atlantic region.
Establishments employing fewer than eight workers were excluded from both surveys. It is estimated that there were approximately 60 such plants employing 250 workers in 1967. It is believed that many of these workers were engaged in the hand production of cigars.
8 Standard Metropolitan Statistical areas as defined by the U. S. Bureau of the Budget through March 1965.
Average Hourly EarningsStraight-time earnings of the 16, 552 pro
duction and related workers in the cigar manufacturing plants covered by the survey averaged $1.72 an hour in March 1967 (table l ) . 9 This was 12 percent above the average recorded in the Bureau's April—May 1964 survey ( $ 1. 54). 10 Averages for produc - tion workers in 1967 in the Middle Atlantic ($1.74) and in the Southeast ($1.67) were 12 and 11 percent higher, respectively, than in 1964.
Women accounted for 7 5 percent of the production and related workers covered by the March 1967 survey and averaged $1.67 an hour, 17 cents less than men. Differences in average pay levels for men and women may be the result of several factors, including variation in the distribution of sexes among establishments and among jobs with disparate pay levels. Seven-tenths of the women, for example, were employed as banding- and cellophaning-machine operators, cigarmaking- m ac hi ne operators, cigar packers, and strippers; men rarely were found in these jobs, but they accounted for almost all workers in the skilled maintenance and machine adjusting occupations. Differences in averages for men and women in the same job and area may reflect minor differences in duties. Job descriptions used in classifying workers in wage surveys are usually more generalized than those used in individual establishments because allowance must be made for minor differences among establishments in specific duties performed. In addition, earnings in some jobs in the industry are determined
9 The straight-time average h o u r ly earnings in this bulletin differ in concept from the gross average hourly earnings published in the Bureau's monthly hours and earnings series ($1.81 in March 1967). Unlike the latter, the estimates presented here exclude premium pay for overtime and for work on weekends, holidays, and late shifts. Average (mean) hourly rates or earnings for each occupation or other group of workers, such as men, women, or production workers were calculated by weighting each rate (or hourly earnings) by the number of workers receiving the rate, totaling, and dividing by the number of individuals. In the monthly series, the sum of the man-hour totals reported by establishments in the industry was divided into the reported payroll totals.
The estimate of the number of production workers within scope of the study is intended only as a general guide to the size and composition of the labor force included in the survey. It differs from the number published in the monthly series (20, 700 in March 1967) by the exclusion of establishments employing fewer than eight workers, and by the fact that the advance planning necessary to make the survey required the use of lists of establishments assembled considerably in advance of data collection. Thus, establishments new to the industry are omitted as are establishments originally classified in the cigar manufacturing industry but found to be in other industries at the time of the survey. Also omitted are establishments manufacturing cigars but classified incorrectly in other industries at the time the lists were compiled.
10 Op. cit. , BLS Bulletin 1436.
Digitized for FRASER http://fraser.stlouisfed.org/ Federal Reserve Bank of St. Louis
EMPLOYMENT AND EARNINGS IN CIGAR MANUFACTURING, December 1940, April 1955, April-May 1961, April-May 1964,
March 1967Number of Production W orkers
0 10,000 20,000 30,000 40,000 50,000 60,000
J____________I___________ I___________ I____________L
Percent of Production Workers Employed as Cigarmakers0 10 20 30 40 50 60
1940
1955
1961
1964
1967
Average S traight-Tim e Hourly Earnings of Production W orkers
1940 1955 1961 1964 1967
Digitized for FRASER http://fraser.stlouisfed.org/ Federal Reserve Bank of St. Louis
4
largely by production at piece rates. Variations in incentive earnings for individuals or sex groupings may be traceable to differences in work experience, effort, workflow, or other factors which the worker may or may not control.
W o r k e r s in establishments employing 500 workers or more averaged $1.74 an hour— 2 cents more than those in plants employing 100 to 499 employees and 19 cents more than those in plants with 8 to 99 workers. This relationship was consistent in the Middle Atlantic region but varied slightly in the Southeast, where workers in establishments with 500 employees or more averaged slightly less than those in establishments with 100 to 499 workers.
Nationwide average hourly earnings were higher in metropolitan areas than in smaller communities ($ 1.72 and $ 1.69), and higher in establishments with union agreements covering a majority of their workers than in establishments without such contract coverage ($1.76 and $1.68) . The same relationships held in the two major regions with the differences greater in the Southeast. In this region, workers in metropolitan areas averaged 12 cents an hour more than those in nonmetropolitan areas, and those in unionized plants averaged 14 cents an hour more than those in nonunion plants. In the Middle Atlantic region, the differences were 4 and 9 cents, respectively.
In considering the wage differences noted in the preceding paragraphs and in the following discussion of occupational earnings, it must be emphasized that it is not possible in a survey such as this to isolate the influence of each factor as a determinant of wages. The interrelationship of some of the factors (e. g. , size of establishment and extent of unionization) has been suggested in the discussion of industry characteristics.
Earnings of nearly all of the workers were within a range of $ 1.40 to $2.50 an hour (table 2). At the lower end of the array, nearly one-fourth of the workers earned less than $1.50 and two-fifths earned less than $1.60. 11 The proportions of workers earning less than $1.60 an hour amounted to slightly more than one-third in the Middle Atlantic compared with about one-half in the Southeast.
11 The Federal minimum wage for workers in establishments producing goods for interstate commerce was raised from $1 .2 5 to $ 1 .4 0 an hour, effective Feb. 1, 1967, and will go to $1 .6 0 an hour effective Feb. 1, 1968.
Occupational Earnings
The occupations studied separately and for which data are provided in table 3, accounted for slightly more than seven-tenths of total production worker employment. Maintenance machinists had the highest average earnings, $2.60 an hour, and janitors the lowest, $1.52.
Nearly all of the 5, 077 cigarmaking- machine operators were women. Approximately four-fifths operated one-position machines and averaged $1.68 an hour. Those assigned to four- and two-position machines averaged $1.81 and $1. 65 an hour, respectively. Four-fifths of the f o u r - p o s i t i o n cigarmaking-machine operators (those used in the manufacture of longfiller cigars) were located in Tampa—St. Petersburg and averaged $1.82 an hour. The number of workers on one-position machines was about the same in the Middle Atlantic and Southeast regions, where they averaged $1.75 and $1.58 an hour, respectively. Tenders of automatic cigarmaking machines ( i . e . , machines using reconstituted tobacco sheet for both binder and w r a p p e r ) averaged $1.56 nationally; slightly more than half of these workers were employed in the Middle Atlantic region, and averaged $1 . 54 an hour.
Seven-eighths of the 333 workers engaged in making cigars by hand methods were in the Southeast and averaged $ 1. 72 an hour. Most of these workers were employed under the "teamwork" system, either as bunchmakers ($1.82) or rollers ($1.65) . One-fourth of all hand cigarmakers manufactured a complete cigar; most were located in the Southeast where they averaged $1.78 an hour.
The 1, 094 workers (all women) operating machines to strip tobacco leaves from the stems averaged $1.67 an hour. They averaged $1.69 in the Middle Atlantic region and $1.61 in the Southeast. Only 65 women were employed to strip tobacco by hand.
Cigar packers averaged $1.88 an hour. The 104 men in the job (almost all employed in Tampa—St. Petersburg) averaged $2 . 30 an hour, compared with $1. 84 for the 1,294 women.
Occupational averages a l s o varied by size of community (table 4), size of establishment (table 5), and by labor-management contract coverage (table 6).
Differences in occupational a v e r a g e s were found not only among regions but also among areas within the same region. For
Digitized for FRASER http://fraser.stlouisfed.org/ Federal Reserve Bank of St. Louis
5
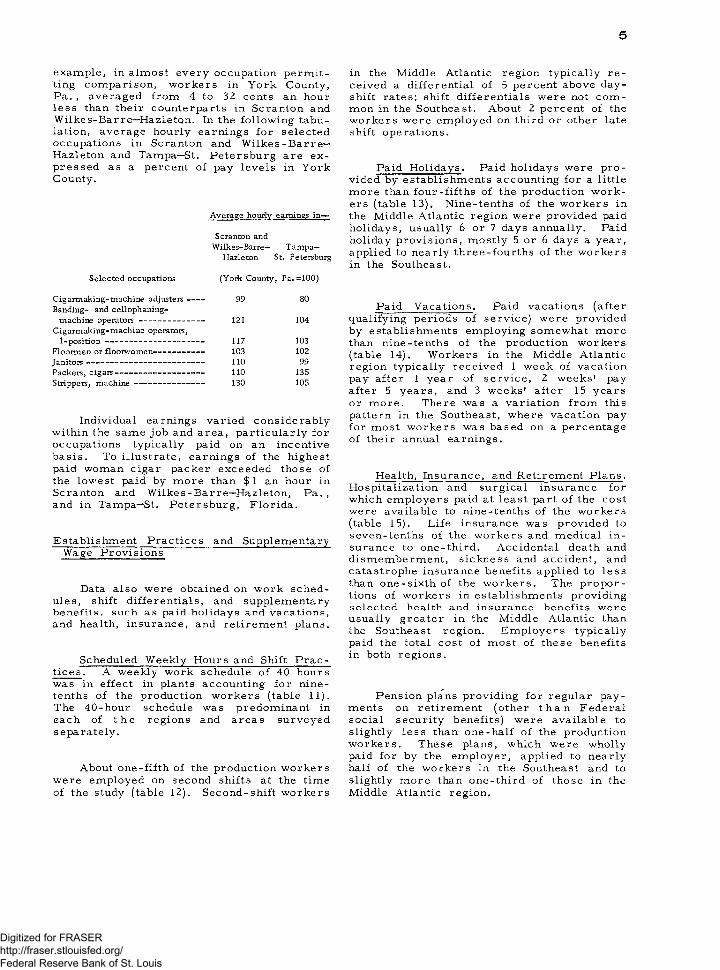
example, in almost every occupation permitting comparison, workers in York County, Pa. , averaged from 4 to 32 cents an hour less than their counterparts in Scranton and Wilkes-Barre—Hazleton. In the following tabulation, average hourly earnings for selected occupations in Scranton and Wilkes-Barre— Hazleton and Tampa—St. Petersburg are expressed as a percent of pay levels in York County.
Average hourly earnings in—
Scranton and Wilkes-Barre— Tampa—
Hazleton St. Petersburg
Selected occupations (York County, Pa. =100)
Cigarmaking-machine adjusters----- 99 80Banding- and cellophaning-
machine operators------------------------- 121 104Cigarmaking-machine operators,
1-position --------------------------------------- 117 103Floormen or floorwomen------------------- 103 102Janitors----------------------------------------- --— 110 99Packers, cigars----------------------------------- 110 135Strippers, m achine--------- ----------------- 130 105
Individual earnings varied considerablywithin the same job and area, particularly for occupations typically paid on an incentive basis. To illustrate, earnings of the highest paid woman cigar packer exceeded those of the lowest paid by more than $ 1 an hour in Scranton and Wilkes - Bar re—Hazleton, Pa. , and in Tampa—St. Petersburg, Florida.
Establishment Practices and Supplementary Wage Provisions
Data also were obtained on work schedules, shift differentials, and supplementary benefits, such as paid holidays and vacations, and health, insurance, and retirement plans.
Scheduled Weekly Hours and Shift Practices. A weekly work schedule of 40 hours was in effect in plants accounting for nine- tenths of the production workers (table 11). The 40-hour schedule was predominant in each of the regions and areas surveyed separately.
About one-fifth of the production workers were employed on second shifts at the time of the study (table 12). Second-shift workers
in the Middle Atlantic region typically received a differential of 5 percent above day- shift rates; shift differentials were not common in the Southeast. About 2 percent of the workers were employed on third or other late shift operations.
Paid Holidays. Paid holidays were provided by establishments accounting for a little more than four-fifths of the production workers (table 13). Nine-tenths of the workers in the Middle Atlantic region were provided paid holidays, usually 6 or 7 days annually. Paid holiday provisions, mostly 5 or 6 days a year, applied to nearly three-fourths of the workers in the Southeast.
Paid Vacations. Paid vacations (after qualifying periods of service) were provided by establishments employing somewhat more than nine-tenths of the production workers (table 14). Workers in the Middle Atlantic region typically received 1 week of vacation pay after 1 year of service, 2 weeks' pay after 5 years, and 3 weeks' after 15 years or more. There was a variation from this pattern in the Southeast, where vacation pay for most workers was based on a percentage of their annual earnings.
Health, Insurance, and Retirement Plans.Hospitalization and surgical insurance for which employers paid at least part of the cost were available to nine-tenths of the workers (table 15). Life insurance was provided to seven-tenths of the workers and medical insurance to one-third. Accidental death and dismemberment, sickness and accident, and catastrophe insurance benefits applied to less than one-sixth of the workers. The proportions of workers in establishments providing s e le c t e d health and in s u r a n c e b e n e fits w e r e usually greater in the Middle Atlantic than the Southeast region. Employers typically paid the total cost of most of these benefits in both regions.
Pension plans providing for regular payments on retirement (other t han Federal social security benefits) were available to slightly less than one-half of the production workers. These plans, which were wholly paid for by the employer, applied to nearly half of the workers in the Southeast and to slightly more than one-third of those in the Middle Atlantic region.
Digitized for FRASER http://fraser.stlouisfed.org/ Federal Reserve Bank of St. Louis
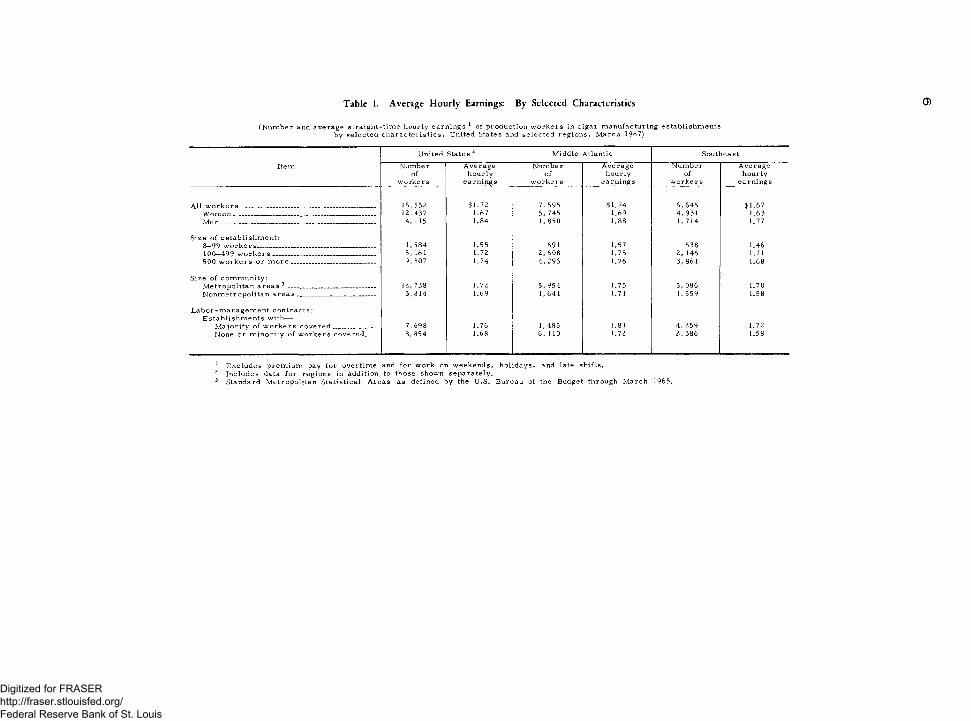
Table 1. Average Hourly Earnings: By Selected Characteristics 0 )
(Number and average straight-time hourly earnings 1 of production workers in cigar manufacturing establishments by selected characteristics, United States and selected regions, March 1967)
United State s 1 2 Middle Atlantic Southeast
Item Numberof
workers
Averagehourly
earnings
Numbe r of
workers
Averagehourly
earnings
Numberof
worke r s
Averagehourly
earnings
All w orkers_________________________________________ 16, 552 $1.72 7, 595 $1.74 6, 645 $1.67W om en____________________________________ ____ 12,437 1.67 5, 745 1.69 4, 931 1.63M en______________________________________________ 4, 115 1.84 1, 850 1.88 1, 714 1.77
Size of establishment:8—99 w orkers___________________ ______________ 1, 584 1.55 691 1.57 638 1.46100-499 w ork ers_______________________________ 5, 161 1.72 2, 608 1.75 2, 146 1.71500 workers or more ________________________ 9, 807 1.74 4, 296 1.76 3, 861 1.68
Size of community:Metropolitan areas 3 ---------------------------------------- 12,738 1.72 5, 954 1.75 5, 086 1.70Nonmetropolitan a r e a s_______________________ 3, 814 1.69 1, 641 1.71 1, 559 1.58
Labor-m anagem ent contracts: Establishments with----
M ajority of workers covered_____________ 7, 698 1.76 1,485 1.81 4, 259 1.72None or minority of workers covered___ 8, 854 1.68 6, 110 1.72 2, 386 1.58
1 Excludes premium pay for overtime and for work on weekends, holidays, and late shifts.2 Includes data for regions in addition to those shown separately.3 Standard Metropolitan Statistical Areas as defined by the U.S. Bureau of the Budget through March 1965.
Digitized for FRASER http://fraser.stlouisfed.org/ Federal Reserve Bank of St. Louis
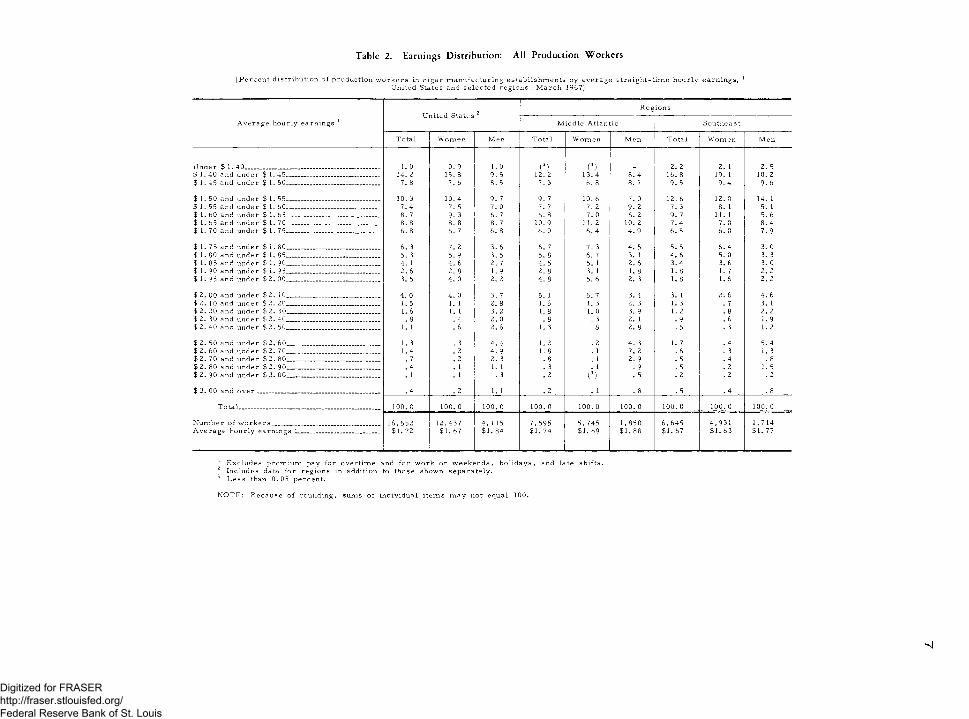
Table 2. Earnings Distribution: All Production Workers
( P e r c e n t d i s t r i b u t i o n o f p r o d u c t i o n w o r k e r s in c i g a r m a n u f a c t u r i n g e s t a b l i s h m e n t s b y a v e r a g e s t r a i g h t - t i m e h o u r l y e a r n i n g s ,U n i t e d S ta te s an d s e l e c t e d r e g i o n s , M a r c h 1967)
A v e r a g e h o u r l y e a r n i n g s 1U n i t e d S t a t e s 2
R e g i o n s
M i d d l e A t l a n t i c S o u t h e a s t
T o t a l W o m e n M e n T o t a l W o m e n M e n T o t a l W o m e n M e n
U n d e r $ 1. 40______ ____________________________ ______ 1. 0 0. 9 1.0 (3) (3) 2. 2 2. 1 2. 5$ 1 .40 a n d u n d e r $ 1. 45________ _________ _________ 14. 2 15. 8 9. 5 12 .2 13. 4 8. 4 16. 8 19. 1 10. 2$ 1 .45 and u n d e r $ 1. 50 7, 8 7. 6 8. 5 7. 3 6. 8 8. 7 9. 5 9. 4 9. 6
$ 1. 50 an d u n d e r $ 1. 55____________________________ 10. 3 10. 4 9. 7 9. 7 10. 6 7. 0 12. 6 12. 0 14. 1$ 1. 55 an d u n d e r $ 1. 60_________________ __________ 7. 4 7. 5 7. 0 7. 7 7. 2 9. 2 7. 3 8. 1 5. 1$ 1. 60 a nd u n d e r $ 1. 65____________________________ 8. 7 9. 3 6. 7 6. 8 7. 0 6. 2 9. 7 11. 1 5. 6$ 1. 65 a nd u n d e r $ 1. 70____________________________ 8. 8 8. 8 8. 7 10. 9 11. 2 10. 2 7. 4 7. 0 8. 4$ 1. 70 an d u n d e r $ 1 .7 5 ____________________________ 6. 8 6. 7 6. 8 6. 0 6 .4 4. 9 6. 5 6. 0 7. 9
$ 1 .7 5 a nd u n d e r $ 1. 80_„__________________________ 6. 3 7. 2 3, 6 6. 7 7. 3 4. 5 5. 5 6. 4 3. 0$ 1. 80 an d u n d e r $ 1. 85 .. . . - 5. 3 5. 9 3. 5 5. 8 6. 7 3. 1 4. 6 5. 0 3. 3$ 1. 85 a nd u n d e r $ 1. 90____________________________ 4. 1 4. 6 2. 7 4. 5 5. 1 2. 6 3. 4 3. 6 3. 0$ 1. 90 an d u n d e r $ 1 .9 5____________________________ 2. 6 2. 8 1. 9 2. 8 3. 1 1. 8 1. 8 1. 7 2. 2$ 1. 9 5 an d u n d e r $ 2. 00 . ____ _____ 3. 5 4. 0 2. 2 4. 8 5, 6 2. 3 1. 8 1. 6 2. 2
$ 2 .0 0 an d u n d e r $ 2. 10____________________________ 4. 0 4. 0 3. 7 5. 1 5. 7 3. 4 3. 1 2. 6 4. 6$ 2 .1 0 an d u n d e r $ 2. 20.. ........................... - 1. 5 1. 1 2. 8 1. 6 1. 3 2. 3 1. 3 . 7 3. 1$ 2. 20 a nd u n d e r $ 2. 30 . _ ., 1. 6 1. 1 3. 2 1. 8 1. 0 3. 9 1. 2 . 8 2. 2$ 2. 30 an d u n d e r $ 2. 40_______________ ____________ . 8 . 4 2. 0 . 8 . 3 2. 1 • 9 . 6 1. 9$ 2. 40 an d u n d e r $ 2 . 50 1. 1 . 6 2. 6 1. 3 . 8 2. 8 . 5 . 3 1. 2
$ 2. 50 a nd u n d e r $ 2. 60____________________________ 1. 3 . 3 4. 4 1. 2 . 2 4. 3 1. 7 . 4 5. 4$ 2. 60 a nd u n d e r $ 2. 70____________________________ 1 .4 . 2 4. 9 1. 8 . 1 7. 2 . 6 . 3 1. 3$ 2. 70 an d u n d e r $ 2. 80____________________________ . 7 . 2 2. 3 . 8 . 1 2. 9 . 5 . 4 . 8$ 2. 80 an d u n d e r $ 2 .9 0 ____________________________ . 4 . 1 1. 1 . 3 . 1 . 9 . 5 . 2 1. 5$ 2. 90 an d u n d e r $ 3. 0 0 _„ .________________________ . 1 . 1 . 3 . 2 (3) . 5 . 2 . 2 . 2
$ 3. 00 an d o v e r ___________ ___________________ ______ . 4 . 2 1. 1 . 2 . 1 . 8 . 5 . 4 . 8
T o t a l ________ ____ _________________________________ 100. 0 100. 0 100. 0 100. 0 100. 0 100. 0 100. 0 100. 0 100. 0
N u m b e r o f w o r k e r s _ . . . . . . 16,552 12,437 4, 115 7 ,5 95 5,7 45 1,850 6,6 45 4,9 31 1,714A v e r a g e h o u r l y e a r n i n g s 1____________________________ $1. 72 $1. 67 $1. 84 $1. 74 $L. 69 $1. 88 $1. 67 $1. 63 $1. 77
1 E x c l u d e s p r e m i u m p a y f o r o v e r t i m e an d f o r w o r k o n w e e k e n d s , h o l i d a y s , and l a t e s h i f t s .2 I n c l u d e s da ta f o r r e g i o n s in a d d i t i o n to t h o s e s h o w n s e p a r a t e l y .3 L e s s than 0 . 0 5 p e r c e n t .
N O T E : B e c a u s e o f r o u n d i n g , s u m s o f i n d i v i d u a l i t e m s m a y n o t e q u a l 100.
-nJ
Digitized for FRASER http://fraser.stlouisfed.org/ Federal Reserve Bank of St. Louis
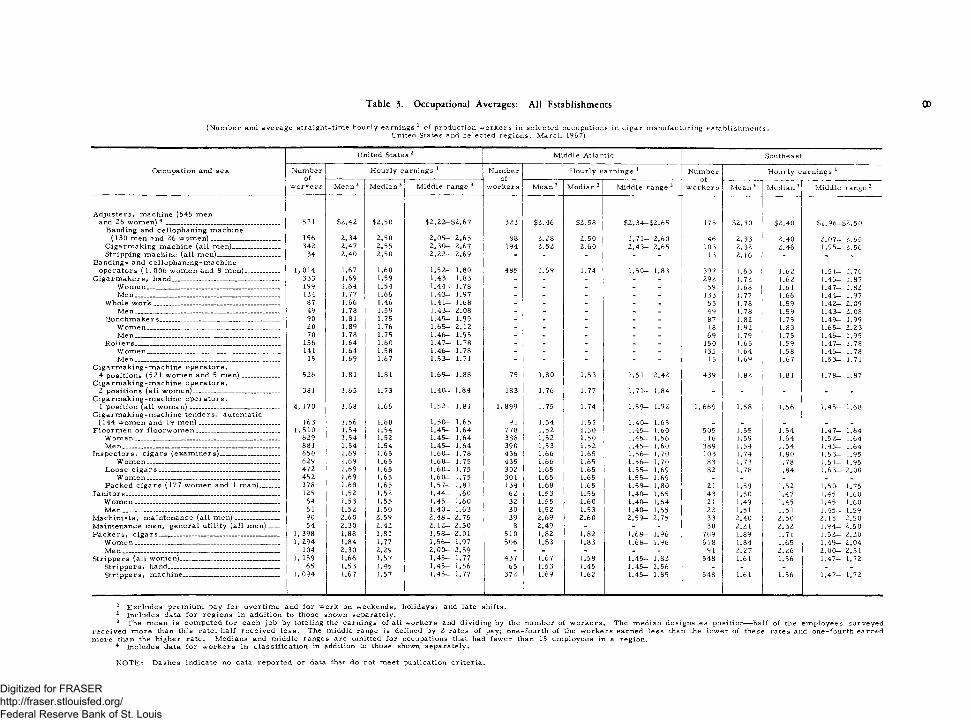
Table 3. Occupational Averages: All Establishments 00
(Number and average straight-time hourly earnings1 of production workers in selected occupations in cigar manufacturing establishments,United States and selected regions, March 1967)
Occupation and sex
United States 2 Middle Atlantic Southeast
Numberof
workers
Hourly earnings 1 Numberof
workers
Hourly earnings 1 Numberof
worker s
Hourly earnings 1
Mean 3 Median 3 Middle range 3 Mean 3 Median 3 Middle range 3 Mean 3 Median 3 Middle range 3
Adjusters, machine (545 menand 26 women) 4 ............... . . ___ 571 $2.42 $2.50 $2.22—$2.67 323 $2.46 $2.58 $2 .34-$2 .65 175 $2.30 $2.40 $1.96—$2.50
Banding and cellophaning machine(130 men and 26 w om en)____________________ 156 2.34 2.50 2 .0 5 - 2.65 88 2.28 2.50 1 .7 1 - 2.60 46 2.33 2.40 2 .0 7 - 2.65
Cigarmaking machine (all men) 342 2.47 2.55 2 .3 0 - 2.67 194 2.52 2.60 2 .4 3 - 2.65 103 2.32 2.46 1 .9 5 - 2.56Stripping machine (all men)___________________ 34 2.40 2.50 2 .2 2 - 2.69 - - - - 13 2.16 _ _
Banding- and cellophaning-machineoperators ( 1, 006 women and 8 men)__________ 1, 014 1.67 1.68 1 .5 2 - 1.80 485 1.69 1.74 1 .5 0 - 1.83 397 1.63 1.62 1 .5 1 - 1.70
Cigarm akers, hand________________________________ 333 1.69 1.59 1 .4 3 - 1.83 - - - - 292 1.72 1.62 1 .4 5 - 1.87W om en________________________________________ 199 1.64 1.54 1.44— 1.78 - - - - 159 1.68 1.61 1 .4 7 - 1.82Men . __ ____ . 134 1.77 1.66 1 .4 3 - 1.97 - - - , 133 1.77 1.66 1 .4 4 - 1.97
Whole w ork______________________________________ 87 1.66 1.46 1 .4 1 - 1.68 - - - _ 55 1.78 1.59 1 .4 2 - 2.09M en___________________________________________ 49 1.78 1.59 1 .4 3 - 2.08 - - - - 49 1.78 1.59 1 .4 3 - 2.08
Bunchmake r s____________________________________ 90 1.81 1.75 1 .4 9 - 1.99 - - - - 87 1.82 1.75 1 .4 9 - 1.99W om en________________________________________ 20 1.89 1.76 1 .6 5 - 2.12 - - - - 18 1.92 1.83 1 .6 5 - 2.23M en___________________________________________ 70 1.78 1.75 1 .4 6 - 1.95 - - - - 69 1.79 1.75 1 .4 6 - 1.95
R ollers___________________________________________ 156 1.64 1.60 1 .4 7 - 1.78 - - - - 150 1.65 1.59 1 .4 7 - 1.78W om en________________________________________ 141 1.64 1.58 1 .4 6 - 1.78 - _ - _ 135 1.64 1.58 1 .4 6 - 1.78Me n ___________________________________________ 15 1.69 1.67 1 .5 3 - 1.71 - - - - 15 1.69 1.67 1 .5 3 - 1.71
Cigarm aking-m achine operators,4 positions (521 women and 5 men) 526 1.81 1.81 1 .6 9 - 1.88 75 1.80 1.53 1 .5 1 - 2.42 439 1.82 1.81 1 .7 8 - 1.87
Cigarmaking-machine operators,2 positions (all women)__________________________ 381 1.65 1.73 1 .4 0 - 1.84 183 1.76 1.77 1 .7 1 - 1.84 - - _ -
Cigarm aking-m achine operators,1 position (all w om en)___________________________ 4, 170 1.68 1.66 1 .5 2 - 1.81 1,899 1.75 1.74 1 .5 9 - 1.92 1,669 1.58 1.56 1 .4 5 - 1.68
Cigarm aking-m achine tenders, automatic(144 women and 19 m en)________________________ 163 1.56 1.60 1 .5 0 - 1.65 91 1.54 1.55 1 .4 0 - 1.65 - - _ _
Floorm en or floorw om en_________________________ 1,510 1.54 1.54 1 .4 5 - 1.64 778 1.52 1.50 1 .4 5 - 1.60 505 1.55 1.54 1.47— 1.64W om en___________________________________________ 629 1.54 1.52 1 .4 5 - 1.64 388 1.52 1.50 1 .4 5 - 1.56 116 1.59 1.64 1 .5 2 - 1.64M en_______________________________________________ 881 1.54 1.54 1 .4 5 - 1.64 390 1.53 1.52 1 .4 5 - 1.60 389 1.54 1.54 1 .4 5 - 1.64
Inspectors, cigars (examiners) ______________ 650 1.69 1.65 1 .6 0 - 1.78 436 1.66 1.65 1 .5 6 - 1.70 103 1.74 1.80 1 .5 3 - 1.95W om en________________________________________ 629 1.69 1.65 1 .6 0 - 1.75 435 1.66 1.65 1 .5 6 - 1.70 83 1.73 1.78 1 .5 1 - 1.95
Loose cigar s ____________________________________ 472 1.69 1.65 1 .6 0 - 1.75 302 1.65 1.65 1 .5 5 - 1.69 82 1.78 1.84 1 .6 3 - 2.00W om en........... .................................... ........... ............. 452 1.69 1.65 1 .6 0 - 1.75 301 1.65 1.65 1 .5 5 - 1.69 _ _ _ _
Packed cigars (177 women and 1 man)______ 178 1.68 1.65 1 .5 7 - 1.81 134 1.68 1.65 1 .5 9 - 1.80 21 1.59 1.52 1 .5 0 - 1.75Janitors______________________________________________ 125 1.52 1.52 1 .4 4 - 1.60 62 1.53 1.56 1 .4 0 - 1.65 43 1.50 1.47 1 .4 5 - 1.60
W om en___________________________________________ 64 1.53 1.55 1 .4 5 - 1.60 32 1.55 1.60 1 .4 0 - 1.64 21 1.49 1.45 1 .4 5 - 1.60M en _______________________________________________ 61 1.52 1.50 1 .4 0 - 1.63 30 1.52 1.53 1 .4 0 - 1.65 22 1.51 1.51 1 .4 5 - 1.59
Machinists, maintenance (all m en )...... .................. 90 2.60 2.59 2 .4 8 - 2.75 39 2.69 2.60 2 .5 9 - 2.75 33 2.40 2.50 2 .1 5 - 2.50Maintenance men, general utility (all m en)___ 54 2.30 2.42 2 .1 2 - 2.50 8 2.49 - - 30 2.21 2.32 1 .9 4 - 2.50Packers, c ig a r s ... ,------------------------------------------------- 1, 398 1.88 1.81 1.58— 2.01 510 1.82 1.82 1 .6 8 - 1.96 709 1.89 1.71 1 .5 2 - 2.20
W om en___________________________________________ 1, 294 1.84 1.77 1 .5 6 - 1.97 506 1.83 1.83 1 .6 8 - 1.96 618 1.84 1.65 1 .4 9 - 2.04Me n _______________________________________________ 104 2.30 2.29 2 .0 0 - 2.59 - - - _ 91 2.27 2.26 2 .0 0 - 2.51
Strippers (all women)______________________________ 1, 159 1.66 1.57 1 .4 5 - 1.77 437 1.67 1.58 1 .4 5 - 1.82 548 1.61 1.56 1 .4 7 - 1.72Strippers, hand_________________________________ 65 1.53 1.45 1 .4 5 - 1.56 65 1.53 1.45 1 .4 5 - 1.56 - - - _Strippers, machine_____________________________ 1, 094 1.67 1.57 1 .4 5 - 1.77 372 1.69 1.62 1 .4 5 - 1.85 548 1.61 1.56 1.47— 1.72
1 Excludes premium pay for overtime and for work on weekends, holidays, and late shifts.2 Includes data for regions in addition to those shown separately.3 The mean is computed for each job by totaling the earnings of all workers and dividing by the number of workers. The median designates position— half of the employees surveyed
received more than this rate; half received le ss . The middle range is defined by 2 rates of pay; one-fourth of the workers earned less than the lower of these rates and one-fourth earned m ore than the higher rate. Medians and middle ranges are omitted for occupations that had fewer than 15 employees in a region.
4 Includes data for workers in classification in addition to those shown separately.
NO TE; Dashes indicate no data reported or data that do not meet publication criteria .
Digitized for FRASER http://fraser.stlouisfed.org/ Federal Reserve Bank of St. Louis
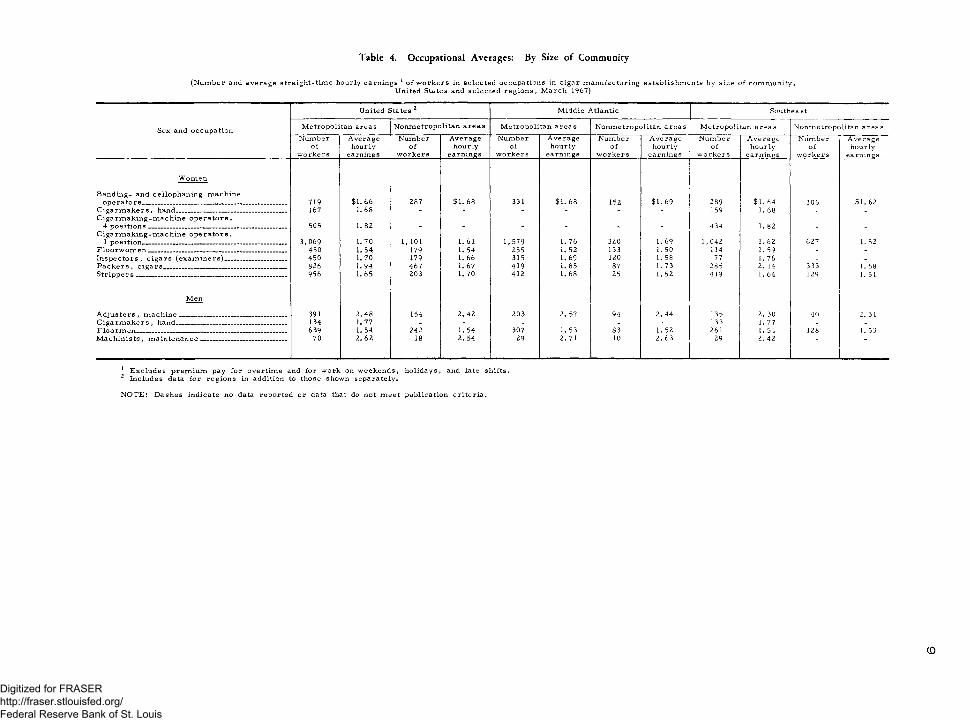
Table 4. Occupational Averages: By Size o f Community
(Number and average straight-time hourly earnings 1 of workers in selected occupations in cigar manufacturing establishments by size of community,United States and selected regions, March 1967)
Sex and occupation
United States 2 Middle Atlantic Southeast
Metropolitan areas Nonmetropolitan areas Metropolitan areas Nonmetropolitan areas Metropolitan areas Nonmetropolitan areasNumber
ofworkers
Averagehourly
earnings
Numberof
workers
Averagehourly
earnings
Numberof
workers
Averagehourly
earnings
Numberof
workers
Averagehourly
earnings
Numberof
workers
Averagehourly
earnings
Numberof
workers
Averagehourly
earnings
Women
Banding- and cellophaning-machineoperators. ________________________________________ 719 $1.66 287 $1. 68 331 $1. 68 152 $1. 69 289 $1. 64 105 $1. 62
Cigarm akers, hand_________________________________ 167 1. 68 - - - - - - 159 1. 68 - -Cigarm aking-m achine operators,
4 position s_________________________________________ 505 1. 82 - - - - - - 434 1. 82 - -Cigarm aking-m achine operators,
1 position__________________________________________ 3 ,069 1. 70 1, 101 1. 61 1,579 1. 76 320 1. 69 1,042 1. 62 627 1. 52Floorw om en_________________________________________ 450 1. 54 179 1. 54 255 1. 52 133 1. 50 114 1 . 59 - -Inspectors, cigars (exam iners)_______________________ 450 1. 70 179 1 . 66 315 1. 69 120 1. 58 77 1. 76 _ _P ackers, cigars______________________________________________ 826 1. 94 467 1. 67 419 1. 85 87 1. 73 285 2. 14 333 1. 58S trippers________________________________________________________ 956 1. 65 203 1. 70 412 1 . 68 25 1. 52 419 1. 64 129 1. 51
Men
A djusters, m achine________________________________________ 391 2.48 154 2. 42 203 2. 57 94 2. 44 135 2. 30 40 2. 31C igarm akers, hand.________________________________________ 134 1. 77 - - - - - - 133 1. 77 - -Floorm en___ ___________________________________________________ 639 1. 54 242 1. 54 307 1. 53 83 1. 52 261 1. 54 128 1. 53M achinists, m aintenance________________________________ 70 2. 62 18 2. 54 29 2. 71 10 2. 63 29 2. 42
1 Excludes premium pay for overtime and for work on weekends, holidays, and late shifts.2 Includes data for regions in addition to those shown separately.
NOTE: Dashes indicate no data reported or data that do not m eet publication criteria .
(0
Digitized for FRASER http://fraser.stlouisfed.org/ Federal Reserve Bank of St. Louis
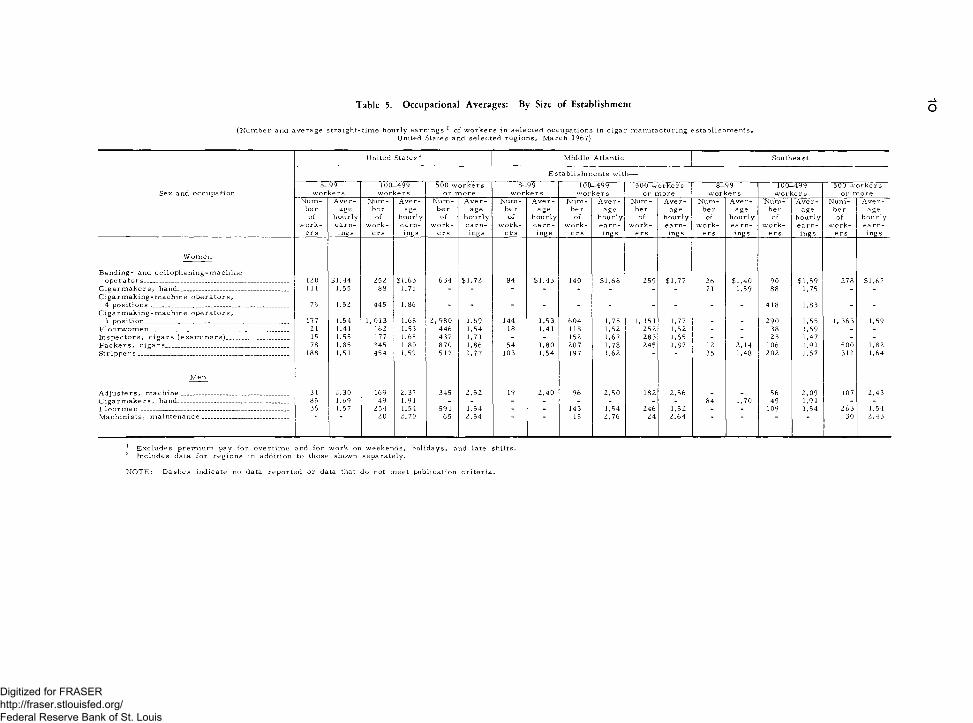
Table 5. Occupational Averages: By Size o f Establishment O
( N u m b e r a nd a v e r a g e s t r a i g h t - t i m e h o u r l y e a r n i n g s 1 o f w o r k e r s in s e l e c t e d o c c u p a t i o n s in c i g a r m a n u f a c t u r i n g e s t a b l i s h m e n t s ,Uni ted S ta te s an d s e l e c t e d r e g i o n s , M a r c h 1967)
U n i te d Sta tes 1 2 M i d d l e A t l a n t i c
E s t a b l i s h m e n t s
S e x an d o c c u p a t i o n8 - 9 9
w o r k e r s1 0 0 - 4 9 9
w o r k e r s50 0 w o r k e r s
o r m o r e8 - 9 9
w o r k e r s1 0 0 - 4 9 9
w o r k e r s50 0 w o r k e r s
o r m o r e8 - 9 9
w o r k e r s1 0 0 - 4 9 9
w o r k e r s500 w o r k e r s
o r m o r eN u m -
be r of
w o r k e r s
A v e r a g e
h o u r l ye a r n in g s
N u m - b c r
ofw o r k
e r s
A v e r age
h o u r l ye a r n ings
N u m b e r
o fw o r k -
e r s
A v e r a g e
h o u r l ye a r n i n g s
N u m b e r
ofw o r k
e r s
A v e r a g e
h o u r l ye a r n i n g s
N u m -b e r
ofw o r k
e r s
A v e r a g e
h o u r l ye a r n i n g s
N u m b e ro f
w o r k e r s
A v e r a g e
h o u r l ye a r n
in g s
N u m b e rof
w o r k e r s
A v e r a g e
h o u r l ye a r n in g s
N u m b e rof
w o r k e r s
A v e r a g e
h o u r l ye a r n in g s
N u m b e ro f
w o r k e r s
A v e r a g e
h o u r l ye a r n i n g s
W o m e n
B a n d i n g - a n d c e l l o p h a n i n g - m a c h i n e o p e r a t o r s ____ _________________ _ _ 120 $1 .4 4 252 $1 .6 3 63 4 $ 1 .7 2 84 $ 1 . 4 3 140 $ 1 .6 8 259 $ 1 .7 7 26 $ 1 .4 0 90 $ 1 .5 9 278 $ 1 .6 7
C i p a r m a k e r s . hand 1 1 1 1.55 88 1.75 - - - - - - - - 71 1.59 88 1.75 - -C i g a r m a k i n g - m a c h i n e o p e r a t o r s ,
4 p o s i t i o n s ____ __ ________ _ __ ___ __ _ __ _ 76 1.52 445 1.86 . _ . 41 8 1.83C i g a r m a k i n g - m a c h i n e o p e r a t o r s ,
1 p o s i t i o n __ _ _ __ _____ _ ____ _ _ __ 177 1.5 4 1, 013 1.68 2, 98 0 1.69 144 1.53 6 04 1.75 1, 151 1.77 290 1.55 1, 363 1.59F l o o r w o m e n ________ _______ __ _________________ 21 1.41 162 1.53 446 1.5 4 18 1.41 1 18 1.52 25 2 1.52 - - 38 1.59 - -I n s p e c t o r s , c i g a r s ( e x a m i n e r s ) __ ____ _________ 15 1.55 177 1.65 437 1.7 1 - - 152 1.67 283 1.65 - - 23 1.47 - -P a c k e r s , c i g a r s _________ ______ ___ _______ 78 1.85 345 1.80 87 0 1.86 54 1.80 207 1.78 245 1.87 12 2 . 1 4 106 1.91 500 1.82S t r i p p e r s _____ _______ _ ____________________ __ __ 188 1.51 45 4 1.59 517 1.77 103 1. 54 197 1.62 - 35 1.48 20 2 1.57 311 1.64
M e n
A d j u s t e r s , m a c h i n e ________________ _____ ___ _____ 31 2 .3 0 169 2.37 345 2 .5 2 19 2 .4 0 96 2 .5 0 182 2.5 6 56 2. 0 9 107 2. 4 3C i g a r m a k e r s , h a n d ___________________ _ _ ______ 85 1.69 49 1.91 - - - - - - - - 84 1.70 49 1.91 - -F l o o r m e n ___________ _ _ _ . — — _ _____ ___ 36 1.57 254 1.54 591 1.54 - - 143 1.54 246 1.52 - - 109 1.54 26 3 1.54M a c h i n i s t s , m a i n t e n a n c e _ _ __ __ _ _ _ _ _ _ __ 20 2. 7 0 65 2 . 5 4 15 2 .7 6 24 2 .6 4 30 2. 4 3
1 E x c l u d e s p r e m i u m p a y f o r o v e r t i m e and f o r w o r k on w e e k e n d s , h o l i d a y s , an d l a t e s h i f t s .2 I n c l u d e s d a t a f o r r e g i o n s in a d d i t i o n t.o t h o s e s h o w n s e p a r a t e l y .
N O T E : D a s h e s i n d i c a t e n o d a t a r e p o r t e d o r da ta that d o no t m e e t p u b l i c a t i o n c r i t e r i a .
Digitized for FRASER http://fraser.stlouisfed.org/ Federal Reserve Bank of St. Louis
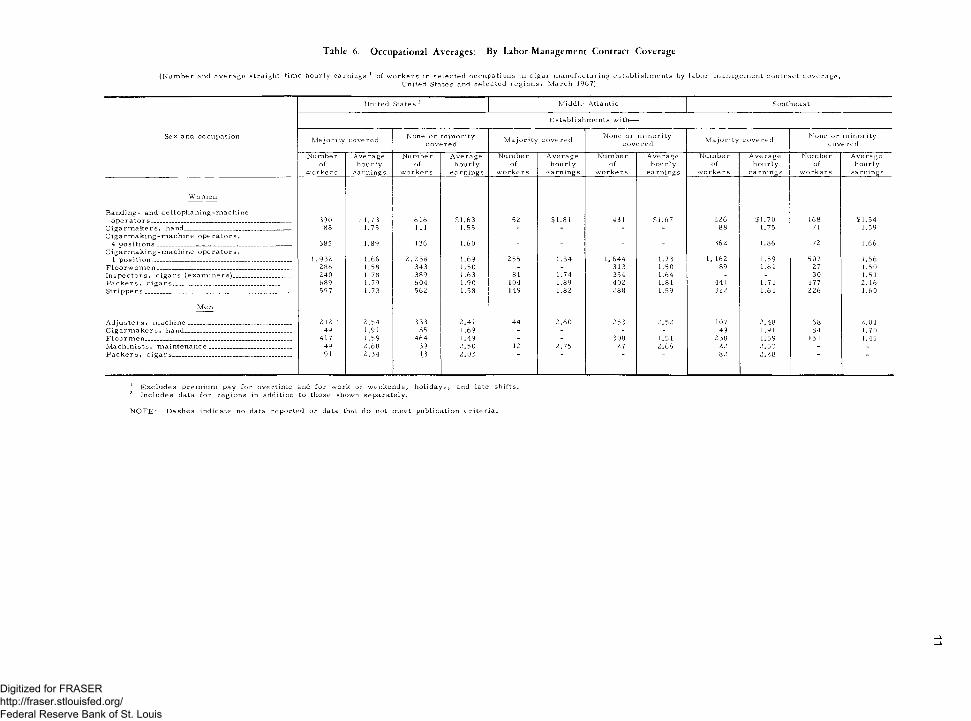
Table 6. Occupational Averages: By Labor-Management Contract Coverage
( N u m b e r an d a v e r a g e s t r a i g h t - t i m e h o u r l y e a r n i n g s 1 o f w o r k e r s in s e l e c t e d o c c u p a t i o n s in c i g a r m a n u f a c t u r i n g e s t a b l i s h m e n t s b y l a b o r - m a n a g e m e n t c o n t r a c t c o v e r a g e ,U n i te d S ta te s and s e l e c t e d r e g i o n s , M a r c h 1967)
S e x a nd o c c u p a t i o n
U n i te d State s 1 2 M i d d l e A t l a n t i c S o u t h e a s t
E s t a b l i s h m e n t s w it h —
M a j o r i t y c o v e r e d N o n e o r m i n o r i t y c o v e r e d
M a j o r i t y c o v e r e d N o n e o r m i n o r i t y c o v e r e d M a j o r i t y c o v e r e d N o n e o r
c o vm i n o r i t ye r e d
N u m b e rof
w o r k e r s
A v e r a g eh o u r l y
e a r n i n g s
N u m b e r of
w o r k e r s
A v e r a g e h o u r l y
e a r n i n g s
N u m b e r o f
w o r k e r s
A v e r a g e h o u r l y
e a r n i n g s
N u m b e ro f
w o r k e r s
A v e r a g eh o u r l y
e a r n i n g s
N u m b e r of
w o r k e r s
A v e r a g eh o u r l y
e a r n i n g s
N u m b e rof
w o r k e r s
A v e r a g eh o u r l y
e a r n i n g s
W o m e n
B a n d i n g - a n d c e l l o p h a n i n g - m a c h i n eo p e r a t o r s _______________________________________________ 390 $ 1 .7 3 616 $ 1 . 6 3 52 $ 1 .8 1 431 $1 .6 7 226 $ 1 .7 0 168 $ 1 .5 4
C i g a r m a k e r s , h a n d ___________________________________ 88 1.75 111 1.55 - - - - 88 1.75 71 1.59C i g a r m a k i n g - m a c h i n e o p e r a t o r s ,
4 p o s i t i o n s _____________________________________________ 385 1.89 136 1.60 - - - - 362 1.86 72 1.66C i g a r m a k i n g - m a c h i n e o p e r a t o r s ,
1 p o s i t i o n _______________________________________________ 1, 93Z 1.66 2, 238 1.69 255 1.8 4 1, 6 44 1.73 1, 162 1.59 507 1.56F l o o r w o m e n _____ ______________________________________ 286 1.58 343 1.50 - - 313 1.50 89 1.61 27 1.50I n s p e c t o r s , c i g a r s ( e x a m i n e r s ) __________________ 240 1.78 389 1.63 81 1.74 354 1.64 - - 30 1.51P a c k e r s , c i g a r s _______________________________________ 689 1.79 6 04 1.90 104 1.89 40 2 1.81 441 1.71 177 2 .1 6S t r i p p e r s _________________________________________________ 597 1.73 562 1.58 149 1.82 288 1.59 322 1.61 226 1.60
M e n
A d j u s t e r s , m a c h i n e __________________________________ 212 ‘ 2 . 5 4 333 2.4 1 44 2 .6 0 253 2 .5 2 107 2 .4 8 68 2.01C i g a r m a k e r s , h a n d ___________________________________ 49 1.91 85 1.69 - - - - 49 1.91 84 1.70F l o o r m e n _________________________________________________ 417 1.59 4 6 4 1.49 - - 308 1.51 238 1.59 151 1.45M a c h i n i s t s , m a i n t e n a n c e ____ 49 2 .6 8 39 2 .5 0 12 2 .7 5 27 2 .6 6 22 2 .5 3 - -P a c k e r s , c i g a r s ..... ..... ..................... 91 2 . 3 4 13 2 .0 3 82 2 .2 8
1 E x c l u d e s p r e m i u m p a y f o r o v e r t i m e and f o r w o r k on w e e k e n d s , h o l i d a y s , an d la te s h i f t s .2 I n c l u d e s d a t a f o r r e g i o n s in a d d i t i o n to t h o s e s h o w n s e p a r a t e l y .
N O T E : D a s h e s i n d i c a t e n o d at a r e p o r t e d o r d at a that d o no t m e e t p u b l i c a t i o n c r i t e r i a .
Digitized for FRASER http://fraser.stlouisfed.org/ Federal Reserve Bank of St. Louis
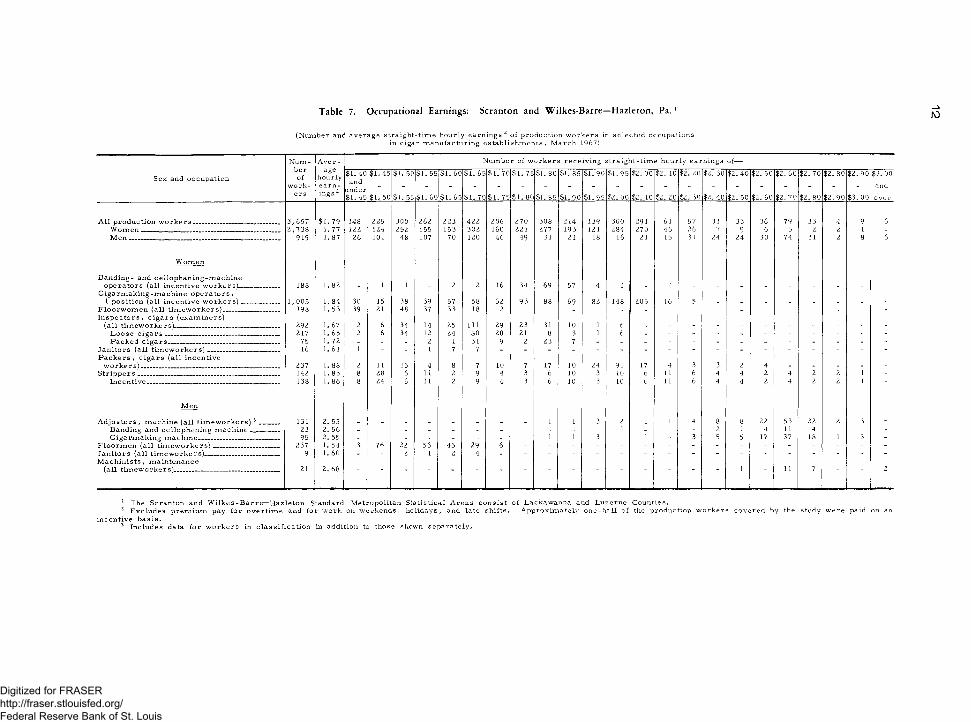
Table 7. Occupational Earnings: Scranton and Wilkes-Barre—Hazleton, Pa. ro
( N u m b e r and a v e r a g e s t r a i g h t - t i m e h o u r l y e a r n i n g s 2 o f p r o d u c t i o n w o r k e r s in s e l e c t e d o c c u p a t i o n sin c i g a r m a n u f a c t u r i n g e s t a b l i s h m e n t s , M a r c h 1967)
N u m - A v e r - N u m b e r o f w o r k e r s r e c e i v i n g s t r a i g h t - t i m e h o u r l y e a r n i n g s o f —
Sex and occupationoerof
workers
agehourlyearnings2
$1. 40 and
under $1.45
$1. 45
$1. 50
$1. 50
$1. 55
$1. 55
$1. 60
$1. 60
$1. 65
$1. 65
$1. 70
$1. 70
$1. 75
$1. 75
$1. 80
$1. 80
$1. 85
$1. 85
$1. 90
$1. 90
$1.95
$1.95
$2. 00
$2. 00
$2. 10
$2. 10
$2. 20
$2. 20
$2. 30
$2. 30
$2. 40
$2. 40
$2. 50
$2. 50
$2. 60
$2. 60
$2. 70
$2. 70
$2. 80
$2. 80
$2. 90
$2. 90
$3. 00
$3. 00 and over
A ll production w orkers__________________________ 3, 657 $1. 79 148 225 300 262 223 422 206 270 308 214 139 300 291 61 57 31 33 36 79 33 4 9 6W om en_________________________________________ Z, 7 38 1. 77 122 124 252 155 153 302 160 221 277 193 121 284 270 46 26 7 9 6 5 2 2 1 -M e n _____________________________________________ 919 1. 87 26 101 48 107 70 120 46 49 31 21 18 16 21 15 31 24 24 30 74 31 2 8 6
W omen
Banding- and cellophaning-machineoperators (all incentive workers)____________ 188 1. 82 - 1 1 - 2 2 16 34 69 57 4 1 - 1 - - - - - - - -
Cigarm aking-m achine operators,1 position (all incentive workers) 1,005 1. 84 30 15 38 39 57 58 62 93 88 69 82 148 205 16 5 - - - - - - - -
198 1. 53 39 21 48 37 33 18 2Inspectors, cigars (examiners)
(all timeworkers)_______________________________ 292 1. 67 2 6 34 14 25 111 29 23 31 10 1 6Loose c ig a r s__________________________________ 217 1. 65 2 6 34 12 24 80 20 21 8 3 1 6Packed c igars_________________________________ 75 1. 72 _ - _ 2 1 31 9 2 23 7
Janitors (all tim ew orkers)_____________________ 16 1. 61 1 - - 1 7 7P ackers, cigars (all incentive
w orkers)_________________________________________ 237 1. 88 2 11 13 4 8 7 10 7 17 10 24 91 17 4 3 3 2 4 - - - - -S trippers__________________________________________ 142 1. 85 8 28 6 11 2 9 4 3 6 10 3 10 6 11 6 4 4 2 4 2 2 1 -
Incentive________________________________________ 138 1. 86 8 24 6 11 2 9 4 3 6 10 3 10 6 11 6 4 4 2 4 2 2 1 -
Men
Adjusters , machine (all tim eworkers) 3 ______ 131 2. 55 _ _ _ _ _ _ _ _ 1 1 3 2 1 1 4 8 8 22 53 22 2 3 -Banding and cellophening machine 23 2. 56 - - - - - - - - - - - 1 - - - 2 1 4 11 4 - - -Cigarmaking machine________________________ 95 2. 55 - - - - - - - - 1 1 3 - 1 - 3 5 5 17 37 18 1 3 -
Floorm en (all tim ew orkers)____________________ 237 1. 54 3 76 22 56 45 29 6Janitors (all timeworkers)______________________ 9 1. 60 - - 2 1 2 4M achinists, maintenance
(all timeworkers)________________________________ 21 2. 68 1 11 7 2
1 T h e S c r a n t o n a n d W i l k e s - B a r r e —H a z l e t o n S t a n d a r d M e t r o p o l i t a n S t a t i s t i c a l A r e a s c o n s i s t o f L a c k a w a n n a an d L u z e r n e C o u n t i e s .2 E x c l u d e s p r e m i u m p a y f o r o v e r t i m e a n d f o r w o r k o n w e e k e n d s , h o l i d a y s , an d l a t e s h i f t s . A p p r o x i m a t e l y o n e - h a l f o f the p r o d u c t i o n w o r k e r s c o v e r e d b y the s t u d y w e r e p a i d on an
i n c e n t i v e b a s i s .3 I n c l u d e s d a ta f o r w o r k e r s in c l a s s i f i c a t i o n in a d d i t i o n to t h o s e sh ow n s e p a r a t e l y .
Digitized for FRASER http://fraser.stlouisfed.org/ Federal Reserve Bank of St. Louis
( N u m b e r an d a v e r a g e s t r a i g h t - t i m e h o u r l y e a r n i n g s 2 o f p r o d u c t i o n w o r k e r s in s e l e c t e d o c c u p a t i o n s in c i g a r m a n u f a c t u r i n g e s t a b l i s h m e n t s , M a r c h 1967)
Table 8. Occupational Earnings: Tampa—St. Petersburg, Fla.1
Numberof
A ver- Number <:>f workers i•eceiving straight-■time hourly earnings of
Sex and occupation hourly $1.40 $1.45 $1.50 $1.55 $1.60 $1.65; $1.70 $1.75 $1.80 $1.85 $1.90 $1.95 $2.00 $2.10 $2.20 $2.30 $2.40 $2.50 $2.60 $2.70 $2.80 $2.90 $3.00work- earn- $1.40 under and
ciB $1.45 $1.50 $1.55 $1.60 $1.65 $1.70 $1.75 $1.80 $1.85 $1.90 $1.95 $2.00 $2.10 $2.20 $2,30 $2.40 $2.50 $2.60 $2.70 $2.80 $2.90 $3.00 over
A ll production w orkers___________________ 3, 137 $1.68 125 486 319 352 156 241 185 198 217 246 140 59 45 71 53 57 38 29 29 21 19 15 11 25W om en__________________________________ 2, 280 1.66 94 384 214 243 132 193 137 128 181 198 110 34 29 38 21 32 22 14 17 14 13 10 7 15
857 1.73 31 102 105 109 24 48 48 70 36 48 30 25 16 33 32 25 16 15 12 7 6 5 4 10
Women
Banding- and cellophaning-machineoperators_________________________________ 176 1.56 - 39 18 33 17 16 17 30 1 3 - - 2 - - - - - - - - _ - -
Tim e__________ ________________________ 24 1.64 - 4 - - - 2 - 18 - - -152 1.55 - 35 18 33 17 14 17 12 1 3 _ _ 2 _ _ _ _ _ _ _ _
C igarm akers, hand (all incentiveworkers) 3________________________________ 141 1.68 - 31 14 17 5 15 7 3 10 4 13 2 3 2 2 9 - 2 2 - - - - -
Runchmakers ...... . ................. . ....... 9 1.91 _ _ _ 2 _ 1 1 _ _ _ 2 _ _ _ _ 2 _ _ 1 _ - -Rollers 126 1.66 _ 28 14 15 5 14 6 3 10 4 11 2 3 2 2 4 _ 2 1 _
Cigarm aking-m achine operators,4 positions (all incentive w orkers)___
Cigarmaking-machine operators,434 1.82 ■ ~ 1 5 19 34 21 5 82 130 63 12 14 26 7 14 1 ■ _ - - -
1 position (all incentive workers) ___ 395 1.62 - 73 23 41 42 54 46 29 27 29 18 10 3Floorwomen (all timeworker s ) .._ ... Inspectors, cigars (examiners)
46 1.56 ~ 2 10 9 1 13 " 6 4 1
(a 11 h'mpmnrtpr 3217
1.541.58
2 8 12 3 3 2 2T,nnse cipars. _ . . _ _ 1 4 2 3 3 2 _ _ _ 2 _ _ _ _ _ _Packed cigars__________________________
Packers, cigars (all incentive15 1.49 - 1 4 10
worke r 149 2.38 8 4 3 2 4 1 4 _ 2 2 1 3 4 8 8 19 10 12 12 10 10 7 15Strippers, machine (all incentive
w orkers)__________________________________ 262 1.63 35 30 32 31 26 16 21 34 13 8 6 3 5 2 “ - ~ ~
Men
A djusters, machine (alltim eworkers) 3___________________________ 73 2.06 - - - - 1 1 - 1 6 5 1 18 5 12 5 4 2 6 _ 4 _ 1 1 _
Banding and cellophaningmachine 18 2.07 1 3 1 3 3 1 1 3 1 1
Cigarmaking machine................ _C igarm akers, hand (all incentive
42 2.08 2 4 - 15 2 3 4 3 2 3 3 - 1 -
workers) _________________________________ 108 1.75 - 26 10 3 8 4 6 8 5 7 4 1 5 6 1 5 2 2 1 2 1 _ _ 1Whole w ork____________________________ 25 1.58 - 11 5 - 3 - 2 - - - - - - 2 - 2 - _ - _ _ _ _ _Bunchmake r s___________________________ 71 1.81 - 15 5 1 5 3 - 4 5 7 4 1 5 4 1 3 2 1 1 2 1 _ _ 1R ollers__________________________________ 12 1.72 - - - 2 - 1 4 4 _ - - - _ _ _ _ _ 1 « _ _ _ _ _
Floorm en (all timeworkers) _ 178 1.52 - 43 34 48 2 10 18 16 5 1 1Janitors (all tim ew orkers)______________Packers, cigars (all incentive
10 1.46 " 3 4 2 1
w orkers)__________________________________ 91 2.26 2 1 3 2 2 2 2 6 1 3 6 10 9 10 8 8 1 5 4 3 3
T h e T a m p a —St. P e t e r s b u r g S t a n d a r d M e t r o p o l i t a n S t a t i s t i c a l A r e a c o n s i s t s o f H i l l s b o r o u g h a nd P i n e l l a s C o u n t i e s .E x c l u d e s p r e m i u m p a y f o r o v e r t i m e and f o r w o r k on w e e k e n d s , h o l i d a y s , an d l a t e s h i f t s . S e v e n - t e n t h s o f the p r o d u c t i o n w o r k e r s c o v e r e d b y the s t u d y w e r e p a i d o n an i n c e n t i v e b a s i s . I n c l u d e s d a t a f o r w o r k e r s in c l a s s i f i c a t i o n in a d d i t io n to t h o s e s h o w n s e p a r a t e l y .
Digitized for FRASER http://fraser.stlouisfed.org/ Federal Reserve Bank of St. Louis
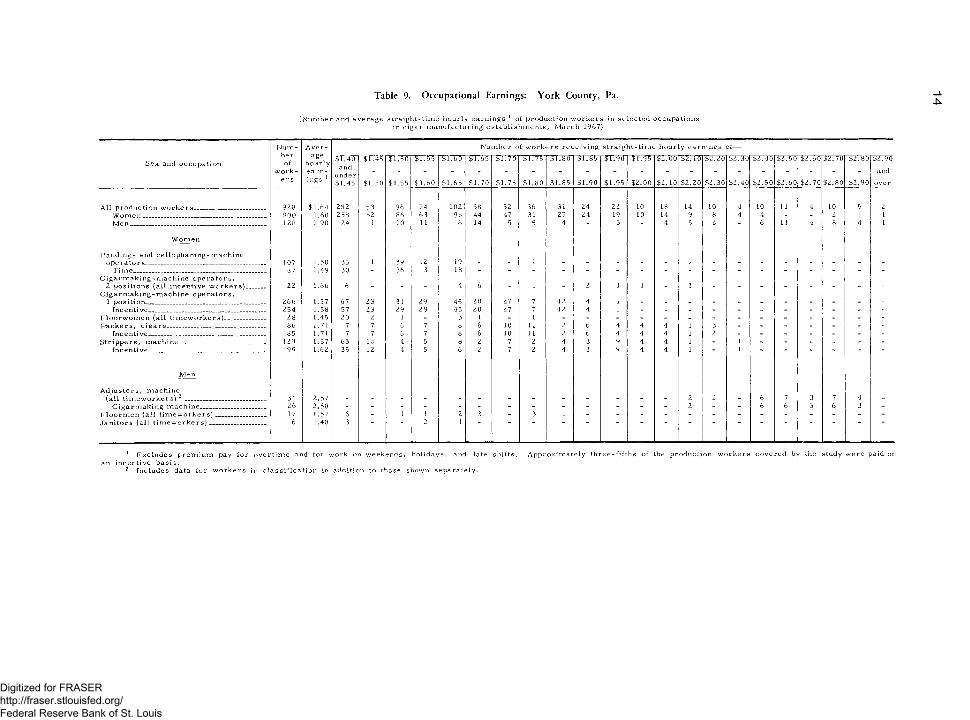
Table 9. Occupational Earnings: York County, Pa.
( N u m b e r an d a v e r a g e s t r a i g h t - t i m e h o u r l y e a r n i n g s 1 o f p r o d u c t i o n w o r k e r s in s e l e c t e d o c c u p a t i o n sin c i g a r m a n u f a c t u r i n g e s t a b l i s h m e n t s , M a r c h 1967)
N u m - A v e r - N u m b e r o f w o r k e r s r e c e i v i n g s t r a i g h t - t i m e : h o u r l y e a r n i n g s (of—
o f h o u r l y $ 1 .4 0and
$1 .4 5 $ 1 .5 0 $ 1 .5 5 $ i . 6 o $1 .6 5 $ 1 . 7 0 $ 1 .7 5 $ 1 .8 0 $ 1 .8 5 $ 1 . 9 0 $ 1 .9 5 $ 2 .0 0 $ 2 .1 0 $ 2 .2 0 $ 2 .3 0 $ 2 .4 0 $ 2 .5 0 $ 2 .6 0 $ 2 .7 0 $ 2 , 8 0 $ 2. 90
andu n d e rCl b m g s $1 .4 5 $ 1 .5 0 $1 .5 5 $ 1 . 6 0 $ 1 .6 5 $ 1 .7 0 $ 1 .7 5 $ 1 .8 0 $1 ,8 5 $ 1 .9 0 $1 .9 5 $ 2 .0 0 $ 2 .1 0 $ 2 .2 0 $ 2 .3 0 $ 2 .4 0 $ 2 .5 0 $ 2 .6 0 $ 2 .7 0 $ 2 .8 0 $ 2 ,9 0 o v e r
9 28 $ 1 .6 4 282 53 96 74 102 58 52 36 31 24 22 10 18 14 10 4 10 11 4 10 5 280 0 1.60 2 58 52 86 63 96 44 47 31 27 24 19 10 14 9 8 4 4 - - 2 1 1128 1.90 24 1 10 11 6 14 5 5 4 3 4 5 2 6 11 4 8 4 1
107 1.50 35 1 39 12 19 187 1.49 30 - 36 3 18 - - - - - - - - - - - -
22 1.66 6 - - - 4 6 - 1 - 2 1 1 - 1 - - - - - - -
26 6 1.57 67 23 31 29 45 20 27 7 12 4 1 _ _2 54 1.58 57 23 29 29 45 20 27 7 12 4 1
28 1.45 20 2 1 - 3 1 - 186 1.71 7 7 6 7 8 6 10 11 2 6 4 4 4 1 3 - _ - - _ _ -85 1.71 7 7 6 7 8 6 10 11 2 6 4 4 4 1 2 - - - - - - -
129 1.57 63 12 4 5 8 2 7 2 4 3 9 4 4 1 - 1 - - - - - -99 1.62 35 12 4 5 6 2 7 2 4 3 9 4 4 1 1
31 2.57 2 2 6 7 3 7 426 2 .5 8 _ . . - _ _ _ _ - - - - _ 2 - - 6 6 3 6 3 -17 1.57 6 - 1 1 2 3 - 3 1
6 1.48 3 2 1
S e x a nd o c c u p a t i o n
A l l p r o d u c t i o n w o r k e r s . .W o m e n __________________M e n ______________________
B a n d i n g - a n d c e l l o p h ao p e r a t o r s ______________
T i m e __________________
i n g - m a c h i n e
C i g a r m a k i n g - m a c h i n e o p e r a t o r s ,2 p o s i t i o n s ( a l l i n c e n t i v e w o r k e r s ) .
C i g a r m a k i n g - m a c h i n e o p e r a t o r s ,1 p o s i t i o n ________________________________
I n c e n t i v e . .F l o o r w o m e n ( a l l t i m e w o r k e r s ) .P a c k e r s , c i g a r s ___________________
I n c e n t i v e _________________________S t r i p p e r s , m a c h i n e _______________
I n c e n t i v e _________________________
M e n
A d j u s t e r s , m a c h i n e( a l l t i m e w o r k e r s) 1 2 ________
C i g a r m a k i n g m a c h i n e ___F l o o r m e n ( a l l t i m e w o r k e r s ' J a n i t o r s ( a l l t i m e w o r k e r s ) .
1 E x c l u d e s p r e m i u m p a y f o r o v e r t i m e a nd f o r w o r k on w e e k e n d s , h o l i d a y s , an d la te s h i f t s . A p p r o x i m a t e l y t h r e e - f i f t h s o f the p r o d u c t i o n w o r k e r s c o v e r e d b y the s t u d y w e r e p ai d on an i n c e n t i v e b a s i s .
2 I n c l u d e s d a t a f o r w o r k e r s in c l a s s i f i c a t i o n in a d d i t i o n to t h o s e s h o w n s e p a r a t e l y .
Digitized for FRASER http://fraser.stlouisfed.org/ Federal Reserve Bank of St. Louis
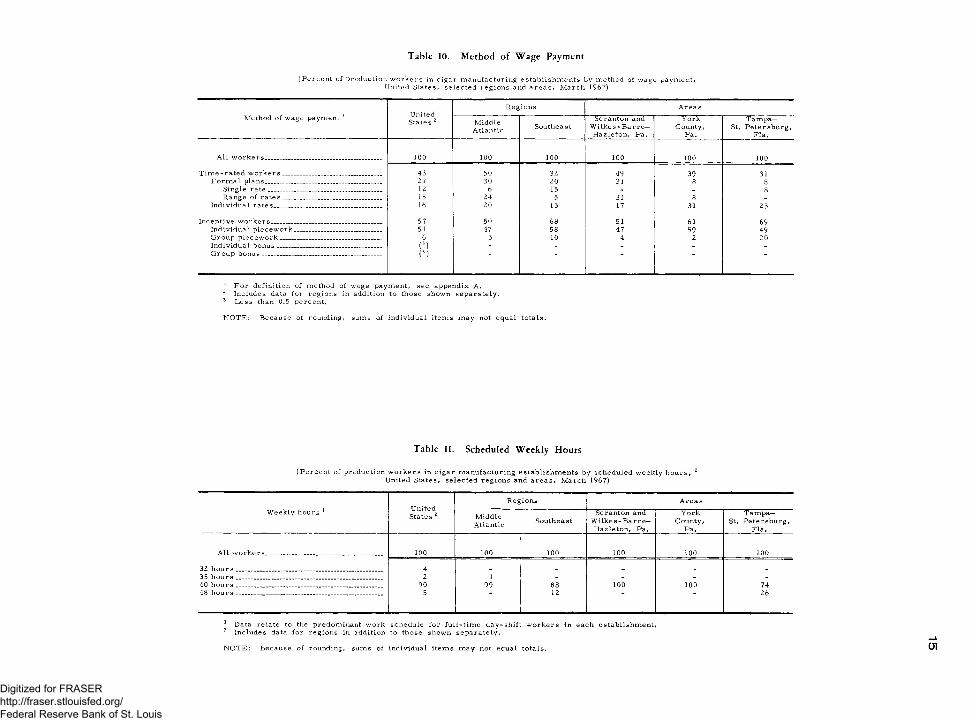
Table 10. Method o f Wage Payment
( P e r c e n t o f p r o d u c t i o n w o r k e r s in c i g a r m a n u f a c t u r i n g e s t a b l i s h m e n t s b y m e t h o d o f w a g e p a y m e n t ,U n i t e d S t a t e s , s e l e c t e d r e g i o n s an d a r e a s , M a r c h 1967)
M e t h o d o f w a g e p a y m e n t 1 U n i te d State s 1 2
R e g i o n s A r e a s
M i d d l eA t l a n t i c S o u t h e a s t
S c r a n t o n and W i l k e s - B a r r e - H a z l e t o n , P a .
Y o r kC o u n t y ,
P a .
T a m past. P e t e r s b u r g ,
F l a .
A l l w o r k e r s . _ ___ .. 100 100 100 100 100 100
T i m e - r a t e d w o r k e r s _________________________________ 43 50 32 49 39 31F o r m a l p l a n s ______________________________ ______ 27 30 20 31 8 8
S in g l e r a t e ______________________________________ 12 6 15 - - 8R a n g e o f r a t e s ____________ _________________ 15 24 5 31 8 _
I n d i v i d u a l r a t e s ___________________ ________________ 16 20 13 17 31 23
I n c e n t i v e w o r k e r s ___________ _______________________ 57 50 68 51 61 69I n d i v i d u a l p i e c e w o r k . __________________________ 51 47 58 47 59 49G r o u p p i e c e w o r k . . .. 6 3 10 4 2 20I n d i v i d u a l b o n u s ___________________________________ ( 3) - - - - _G r o u p b o n u s _______________________________________ ( 3 )
1 F o r d e f i n i t i o n o f m e t h o d o f w a g e p a y m e n t , s e e a p p e n d i x A .I n c l u d e s dat a f o r r e g i o n s in a d d i t i o n t o t h o s e s h o w n s e p a r a t e l y .
3 L e s s than 0.5 p e r c e n t .
N O T E : B e c a u s e o f r o u n d i n g , s u m s o f i n d i v i d u a l i t e m s m a y not e q u a l t o t a l s .
Table 11. Scheduled Weekly Hours
( P e r c e n t o f p r o d u c t i o n w o r k e r s in c i g a r m a n u f a c t u r i n g e s t a b l i s h m e n t s b y s c h e d u l e d w e e k l y h o u r s , 1 U n i te d S t a t e s , s e l e c t e d r e g i o n s an d a r e a s , M a r c h 1967)
U n i te d State s 2
R e g i o n s A r e a s
W e e k l y h o u r s 1 M i d d l eA t l a n t i c S o u t h e a s t
S c r a n t o n an d W i l k e s - B a r r e — H a z l e t o n , P a .
Y oTKC o u n t y ,
P a .
T a m p a —St. P e t e r s b u r g ,
F l a .
A l l w o r k e r s _ .... ._ . 100 100 100 100 100 100
32 h o u r s _________________________________________________ 435 h o u r s _________________________________________________ 2 1 - - - -40 h o u r s 90 99 88 100 100 7448 h o u r s _. . ........................... 5 12 26
1 D a ta r e l a t e to the p r e d o m i n a n t w o r k s c h e d u l e f o r f u l l - t i m e d a y - s h i f t w o r k e r s2 I n c l u d e s d at a f o r r e g i o n s in a d d i t i o n to t h o s e s h o w n s e p a r a t e l y .
e a c h e s t a b l i s h m e n t ,
N O T E : B e c a u s e o f r o u n d i n g , s u m s o f i n d i v i d u a l i t e m s m a y n o t e q u a l t o t a l s . 01
Digitized for FRASER http://fraser.stlouisfed.org/ Federal Reserve Bank of St. Louis
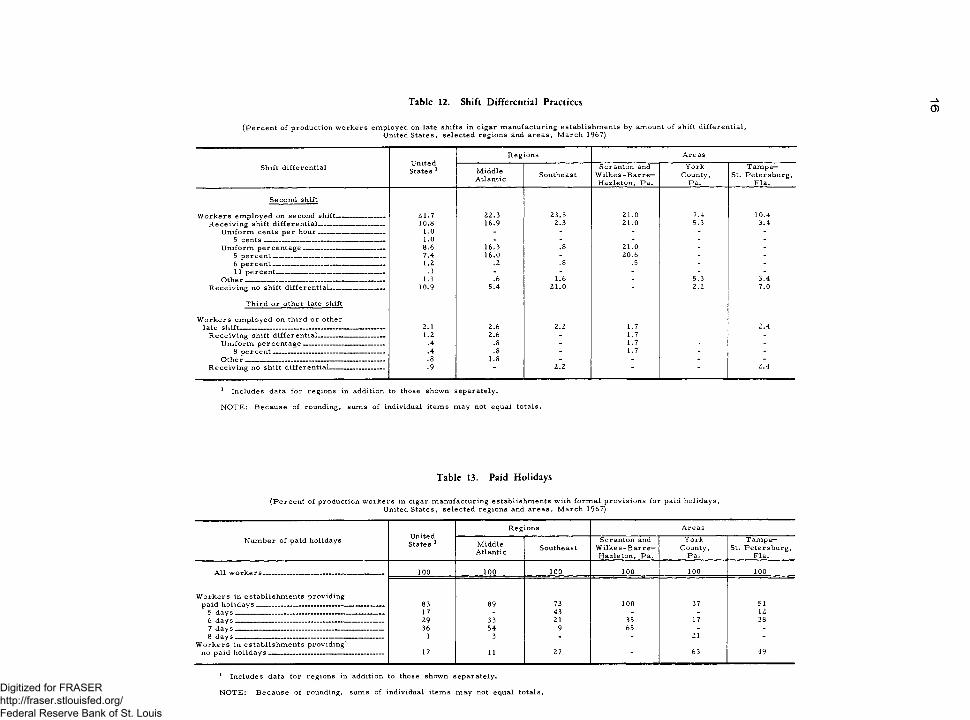
Table 12. Shift Differential Practices 0)(Pe rcent of production workers employed on late shifts in cigar manufacturing establishments by amount of shift differential,
United States, selected regions and areas, March 1967)
Shift differential United States 1
Reg ions Areas
MiddleAtlantic Southeast
Scranton and Wilkes - B a rre - Hazleton, Pa.
YorkCounty,
Pa.
T amp a—St. Petersburg,
Fla.
Second shift
W orkers employed on second shift --------- ----- 21.7 22.3 23.3 21.0 7.4 10.4Receiving shift differential - ------------------ __ 10.8 16.9 2.3 21.0 5.3 3.4
Uniform cents per hour. ______ ________ 1.0 - - - - -5 cen ts____________________________________ 1.0 - - - - -
Uniform percentage — ------ ------------- — 8.6 16.3 .8 21.0 - -5 percent_________________ _______________ 7.4 16.0 - 20.6 - -6 percent--------------------------------------------------- 1.2 .2 .8 .5 - -11 percent------------------------------------------------- .1 - - - - -
Other i . . rn-.iT_______ ...... 1.1 .6 1.6 - 5.3 3.4Receiving no shift differential— ----- _ -------- 10.9 5.4 21.0 2.2 7.0
Third or other late shift
W orkers employed on third or otherlate shift___________________________________________ 2.1 2.6 2.2 1.7 2.4
Receiving shift differential--------- ------------------ 1.2 2.6 - 1.7 -Uniform percentage________________________ .4 .8 - 1.7 -
8 percent ___ ____________ _____ — - .4 .8 - 1.7 - -Othe r — — ---------------- ----------- . ----- -------- .8 1.8 - - - -
Receiving no shift differential-------------- -------- .9 ■ 2.2 “ 2.4
1 Includes data for regions in addition to those shown separately.
NOTE: Because of rounding, sums of individual items may not equal totals.
Table 13. Paid Holidays
(Percent of production workers in cigar manufacturing establishments with form al provisions for paid holidays, United States, selected regions and areas, March 1967)
Reg ions Areas
Number of paid holidays United States 1 Middle
Atlantic SoutheastScranton and
W ilkes-B arre— Hazleton, Pa.
YorkCounty,
Pa.
T amp a—St. Petersburg,
Fla.
A ll workers_ _________ _ _ - - ----- ------ 100 100 100 100 100 100
W orkers in establishments providingpaid holidays ________ __ ___ ___ _________________ 83 89 73 100 37 51
5 days__________ ___ _____ ___________________ _ 17 - 43 - - 126 d a y s_____________________ _________________ __ 29 33 21 35 17 387 days — __ --------------------------------------------------- 36 54 9 65 - -8 d ays________ ____ ___________________ — — 1 3 - - 21 -
W orkers in establishm ents providing'no paid holidays _ _______________ _______________ 17 11 27 “ 63 49
1 Includes data for regions in addition to those shown separately.
NOTE: Because of rounding, sums of individual items may not equal totals.Digitized for FRASER http://fraser.stlouisfed.org/ Federal Reserve Bank of St. Louis
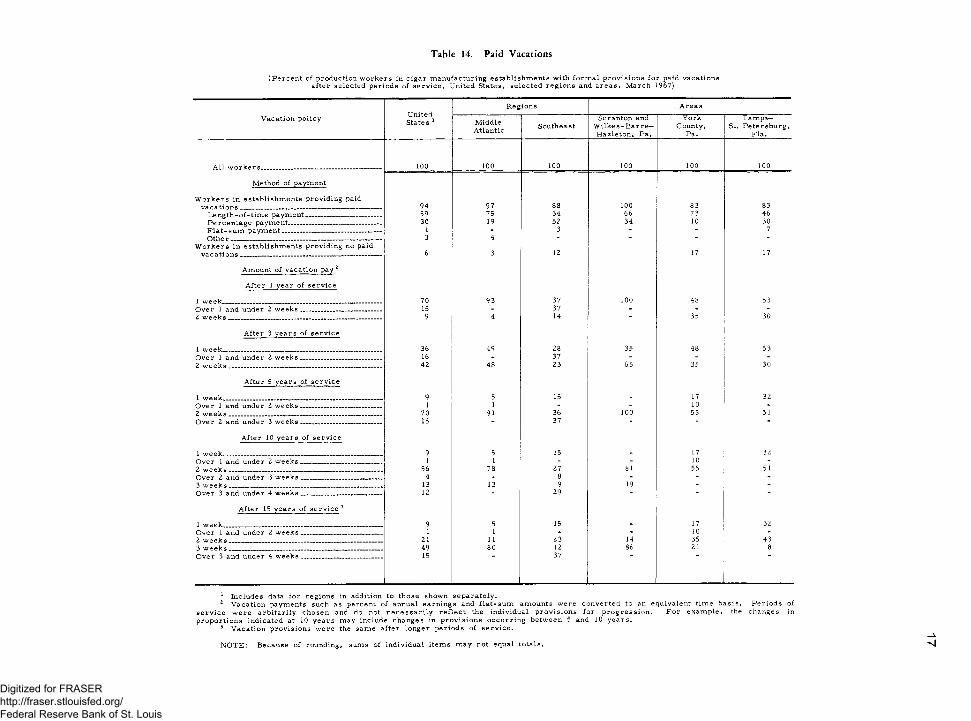
Table 14. Paid Vacations
(Percent of production workers in cigar manufacturing establishments with formal provisions for paid vacationsafter selected periods of service, United States, selected regions and areas, March 1967)
Vacation policy United States 1
Regions Areas
MiddleAtlantic Southeast
Scranton and W ilkes-B ar r e - Hazleton, Pa.
YorkCounty,
Pa.
Tampa—St. Petersburg,
Fla.
A ll w orkers____________________________________ 100 100 100 100 100 100
Method of payment
W orkers in establishments providing paidvacations__________________________________________ 94 97 88 100 83 83
Length-of-tim e payment---------------------------------- 59 75 34 66 73 46Percentage payment------------------------------------------ 30 19 52 34 10 30F la t-su m payment______________________________ 1 - 3 - - 7Othe r _____________________________________________ 3 4 - - - -
W orkers in establishments providing no paidvacations ______________________________________ 6 3 12 17 17
Amount of vacation pay1 2
After 1 year of service
1 week _______________________________________ 70 93 37 100 48 53Over 1 and under 2 w eeks________________________ 15 - 37 - - -2 w eeks______________________________________________ 9 4 14 - 35 30
After 3 years of service
1 week________________________________________________ 36 49 28 35 48 53Over 1 and under 2 w eeks________________________ 16 - 37 - - -2 w eeks______________________________________________ 42 48 23 65 35 30
After 5 years of service
1 week________________________________________________ 9 5 15 - 17 32Over 1 and under 2 w eeks_____________________ __ 1 1 - - 10 -2 w eeks______________________________________________ 70 91 36 100 55 51Over 2 and under 3 w eeks________________________ 15 37 ■ -
After 10 years of service
1 week________________________________________________ 9 5 15 - 17 32Over 1 and under 2 w eeks________________________ 1 1 - - 10 -2 w eeks______________________________________________ 56 78 27 81 55 51Over 2 and under 3 w eeks________________________ 4 - 8 - - -3 w eeks______________________________________________ 13 13 9 19 - -Over 3 and under 4 w eeks________________________ 12 " 29 - "
After 15 years of service 3
1 week _________________________________________ 9 5 15 - 17 32Over 1 and under 2 w eeks________________________ 1 1 - - 10 -2 w eeks______________________________________________ 21 11 23 14 35 433 w eeks______________________________________________ 49 80 12 86 21 8Over 3 and under 4 w eeks.____________ __________ 15 37
1 Includes data for regions in addition to those shown separately.2 Vacation payments such as percent of annual earnings and flat-su m amounts were converted to an equivalent time basis. Periods of
service were arbitarily chosen and do not necessarily reflect the individual provisions for progression. For example, the changes in proportions indicated at 10 years may include changes in provisions occurring between 5 and 10 years.
3 Vacation provisions were the same after longer periods of service.
NOTE: Because of rounding, sums of individual items may not equal totals.
Digitized for FRASER http://fraser.stlouisfed.org/ Federal Reserve Bank of St. Louis
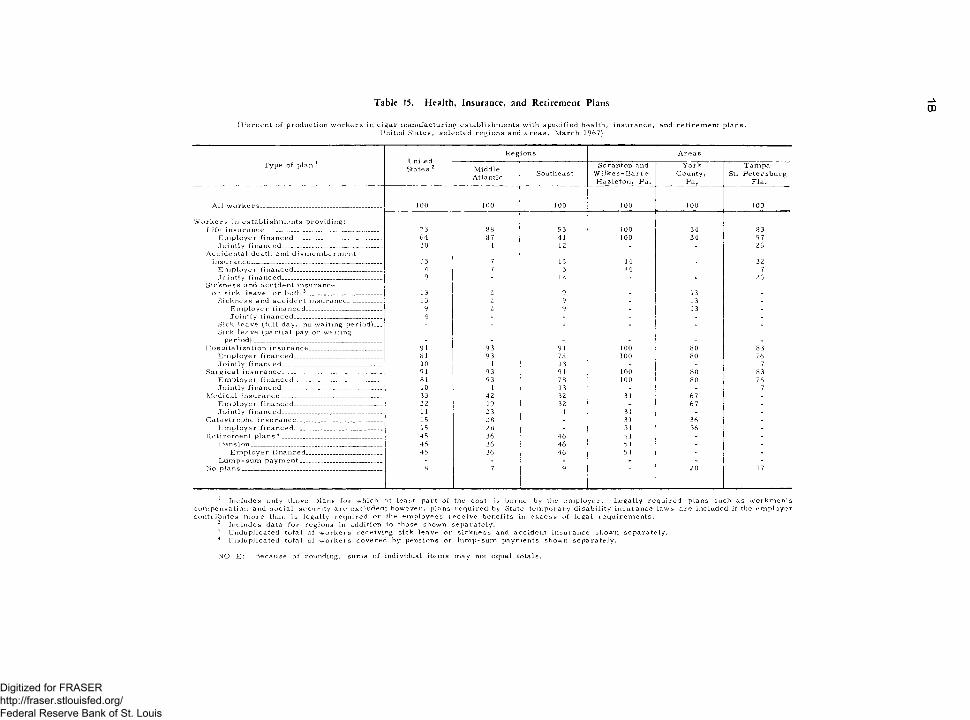
Table 15. Health, Insurance, and Retirement Plans 00( P e r c e n t o f p r o d u c t i o n w o r k e r s in c i g a r m a n u f a c t u r i n g e s t a b l i s h m e n t s w it h s p e c i f i e d h e a l t h , i n s u r a n c e , an d r e t i r e m e n t p l a n s ,
U n i te d S t a t e s , s e l e c t e d r e g i o n s an d a r e a s , M a r c h 1967)
U n i te d State s 1 2
R e g i o n s A r e a s
T y p e o f p l a n 1 M i d d l eA t l a n t i c S o u t h e a s t
S c r a n t o n an d W i l k e s - B a r r e - H a z l e t o n , P a .
Y o r kC o u n t y ,
P a .
T a m p a —St, P e t e r s b u r g
F l a .
A l l w o r k e r s ______________________________ _______ 100 100 100 100 100 100
W o r k e r s in e s t a b l i s h m e n t s p r o v i d i n g :L i f e i n s u r a n c e _______ ______________________________ 73 88 53 100 34 83
E m p l o y e r f i n a n c e d _____________________________ 64 87 41 100 34 57J o i n t l y f i n a n c e d _________________________________ 10 1 12 - - 26
A c c i d e n t a l d e a t h a n d d i s m e m b e r m e n t i n s u r a n c e ___________________________________________ 13 7 15 14 32
E m p l o y e r f i n a n c e d _____________________________ 4 7 3 14 - 7J o i n t l y f i n a n c e d ________________________ _____ __ 9 - 12 - - 26
S i c k n e s s an d a c c i d e n t i n s u r a n c e o r s i c k l e a v e o r b o t h 3 ________________________ 13 2 9 13
S i c k n e s s a nd a c c i d e n t i n s u r a n c e ____ _______ 13 2 9 - 13 -E m p l o y e r f i n a n c e d ________________________ 9 2 9 - 13 -J o i n t l y f i n a n c e d ____________________________ 4 - - - - -
S i c k l e a v e ( f u l l d a y , no w a i t i n g p e r i o d ) __ - - - - - -S i c k l e a v e ( p a r t i a l p a y o r w a it i n g
p e r i o d ) . . . . . __ _ . . . .H o s p i t a l i z a t i o n i n s u r a n c e 91 93 91 100 80 83
E m p l o y e r f i n a n c e d . .. ................. ....... 81 93 78 100 80 76J o i n t l y f i n a n c e d ________ _______________________ 10 1 13 - - 7
S u r v i v a l i n s u r a n c e 91 93 91 100 80 83E m p l o y e r f i n a n c e d 81 93 78 100 80 76J o i n t l y f ina .nc ed 10 1 13 - _ 7
M e d i c a l i n s u r a n c e ______ _______________________ 33 42 32 31 67 -E m p l o y e r f i n a n c e d _____________________________ 22 19 32 - 67 -J o i n t l y f i n a n c e d _______ ____________________ __ 1 1 23 1 31 - -
C a t a s t r o p h e i n s u r a n c e .... 15 28 - 31 36 -E m p l o y e r f i n a n c e d _________________________ __ 15 28 - 31 36 -
R e t i r e m e n t p l a n s 4 . .............. ............... .. 45 36 46 51 - -P e n s i o n 45 36 46 51 - -
E m p l o y e r f i n a n c e d _________________________ 45 36 46 51 - -L u m p - s u m p a y m e n t ----- --------------------------------- - - - - - -
N o p l a n s ______________________________________ ________ 8 7 9 20 17
1 I n c l u d e s o n l y t h o s e p la n s f o r w h i c h at l e a s t p a r t o f the c o s t is b o r n e b y the e m p l o y e r . L e g a l l y r e q u i r e d p la n s s u c h a s w o r k m e n ’ s c o m p e n s a t i o n a nd s o c i a l s e c u r i t y a r e e x c l u d e d ; h o w e v e r , p la n s r e q u i r e d b y State t e m p o r a r y d i s a b i l i t y i n s u r a n c e l a w s a r e i n c l u d e d i f the e m p l o y e r c o n t r i b u t e s m o r e than i s l e g a l l y r e q u i r e d o r the e m p l o y e e s r e c e i v e b e n e f i t s in e x c e s s o f l e g a l r e q u i r e m e n t s .
2 I n c l u d e s d a ta f o r r e g i o n s in a d d i t i o n to th o s e s h o w n s e p a r a t e l y .3 U n d u p l i c a t e d t o t a l o f w o r k e r s r e c e i v i n g s i c k l e a v e o r s i c k n e s s an d a c c i d e n t i n s u r a n c e s h o w n s e p a r a t e l y .4 U n d u p l i c a t e d t o t a l o f w o r k e r s c o v e r e d b y p e n s i o n s o r l u m p - s u m p a y m e n t s s h o w n s e p a r a t e l y .
NOTE: Because of rounding, sums of individual items may not equal totals.
Digitized for FRASER http://fraser.stlouisfed.org/ Federal Reserve Bank of St. Louis
Appendix A. Scope and Method of Survey
Scope of S u rv e y
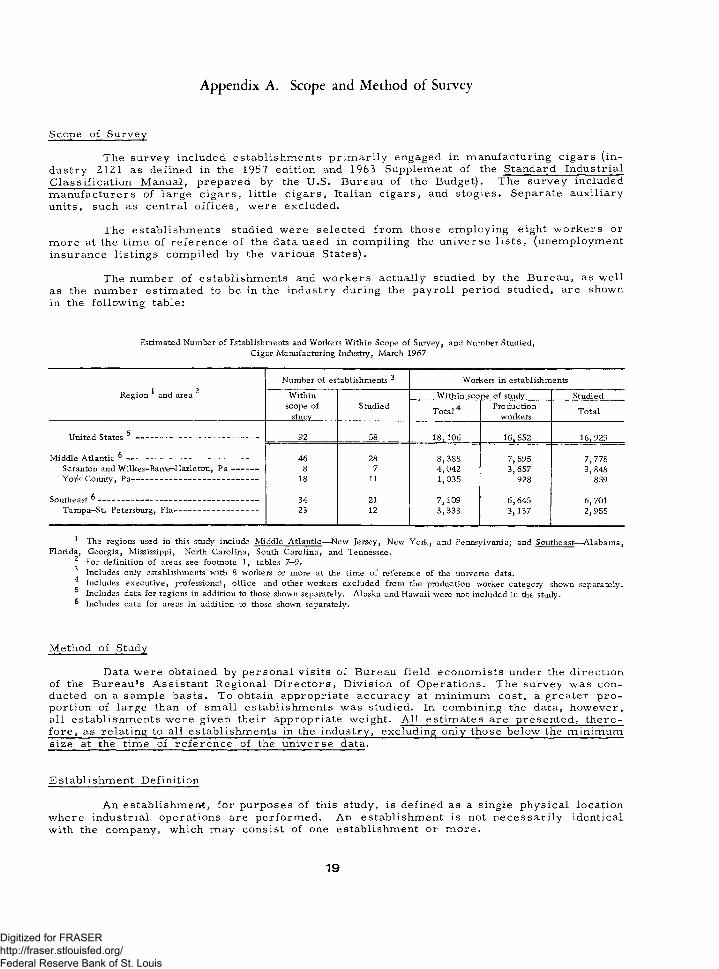
The survey included establishments primarily engaged in manufacturing cigars (industry Z1Z1 as defined in the 1957 edition and 1963 Supplement of the Standard Industrial Classification Manual, prepared by the U.S. Bureau of the Budget). The survey included manufacturers of large cigars, little cigars, Italian cigars, and stogies. Separate auxiliary units, such as central offices, were excluded.
The establishments studied were selected from those employing eight workers or more at the time of reference of the data used in compiling the universe lists, (unemployment insurance listings compiled by the various States).
The number of establishments and workers actually studied by the Bureau, as well as the number estimated to be in the industry during the payroll period studied, are shown in the following table:
Estimated Number of Establishments and Workers Within Scope of Survey, and Number Studied, Cigar Manufacturing Industry, March 1967
Region * and area 2
Number of establishments 3 Workers in establishments
Within Within scope of study Studiedscope of
studyStudied
Total4 Productionworkers Total
United States 5 --------------------------------------------------- 92 58 18,106 16,552 16,929
Middle Atlantic ^ ------------------------------------------------------- 46 28 8 ,388 7, 595 7, 778Scranton and Wilkes-Barre-Hazleton, P a ----------- 8 7 4 ,0 4 2 3,657 3, 848York County, Pa----------------------------------------------------- 18 11 1,035 928 859
Southeast ^ ------------------------------------------------------------------- 34 21 7 ,1 0 9 6,645 6,701Tampa-St. Petersburg, Fla----------------------------------- 23 12 3,333 3, 137 2,955
1 The regions used in this study include Middle Atlantic—-^New Jersey, New York, and Pennsylvania; and Southeast— Alabama, Florida, Georgia, Mississippi, North Carolina, South Carolina, and Tennessee.
2 For definition of areas see footnote 1, tables 7—9,3 Includes only establishments with 8 workers or more at the time of reference of the universe data.
Includes executive, professional, office and other workers excluded from the production worker category shown separately.5 Includes data for regions in addition to those shown separately. Alaska and Hawaii were not included in the study.6 Includes data for areas in addition to those shown separately.
Method of Study
Data were obtained by personal visits of Bureau field economists under the direction of the Bureau*s Assistant Regional Directors, Division of Operations. The survey was conducted on a sample basis. To obtain appropriate accuracy at minimum cost, a greater proportion of large than of small establishments was studied. In combining the data, however, all establishments were given their appropriate weight. All estimates are presented, therefore, as relating to all establishments in the industry, excluding only those below the minimum size at the time of reference of the universe data.
Establishment Definition
An establishment, for purposes of this study, is defined as a single physical location where industrial operations are performed. An establishment is not necessarily identical with the company, which may consist of one establishment or more.
19
Digitized for FRASER http://fraser.stlouisfed.org/ Federal Reserve Bank of St. Louis
20
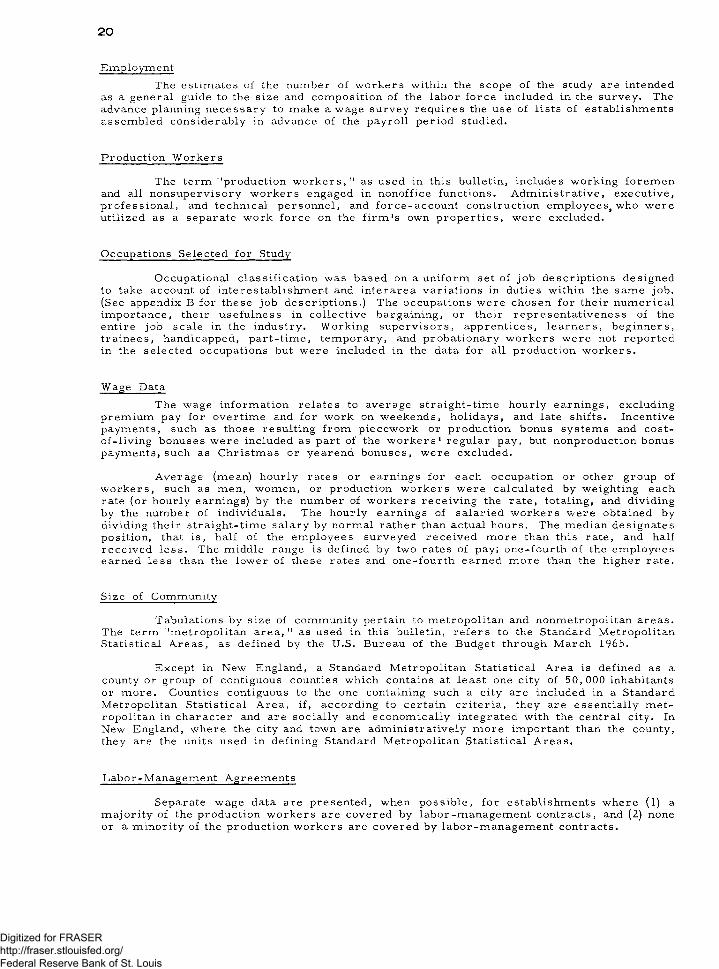
EmploymentThe estimates of the number of workers within the scope of the study are intended
as a general guide to the size and composition of the labor force included in the survey. The advance planning necessary to make a wage survey requires the use of lists of establishments assembled considerably in advance of the payroll period studied.
Production Workers
The term "production workers, 11 as used in this bulletin, includes working foremen and all nonsupervisory workers engaged in nonoffice functions. Administrative, executive, professional, and technical personnel, and force-account construction employees, who were utilized as a separate work force on the firm 's own properties, were excluded.
Occupations Selected for Study
Occupational classification was based on a uniform set of job descriptions designed to take account of interestablishment and interarea variations in duties within the same job. (See appendix B for these job descriptions.) The occupations were chosen for their numerical importance, their usefulness in collective bargaining, or their representativeness of the entire job scale in the industry. Working supervisors, apprentices, learners, beginners, trainees, handicapped, part-time, temporary, and probationary workers were not reported in the selected occupations but were included in the data for all production workers.
Wage DataThe wage information relates to average straight-time hourly earnings, excluding
premium pay for overtime and for work on weekends, holidays, and late shifts. Incentive payments, such as those resulting from piecework or production bonus systems and cost- of-living bonuses were included as part of the workers' regular pay, but nonproduction bonus payments, such as Christmas or yearend bonuses, were excluded.
Average (mean) hourly rates or earnings for each occupation or other group of workers, such as men, women, or production workers were calculated by weighting each rate (or hourly earnings) by the number of workers receiving the rate, totaling, and dividing by the number of individuals. The hourly earnings of salaried workers were obtained by dividing their straight-time salary by normal rather than actual hours. The median designates position, that is, half of the employees surveyed received more than this rate, and half received less. The middle range is defined by two rates of pay; one-fourth of the employees earned less than the lower of these rates and one-fourth earned more than the higher rate.
Size of Community
Tabulations by size of community pertain to metropolitan and nonmetropolitan areas. The term "metropolitan area, " as used in this bulletin, refers to the Standard Metropolitan Statistical Areas, as defined by the U.S. Bureau of the Budget through March 1965.
Except in New England, a Standard Metropolitan Statistical Area is defined as a county or group of contiguous counties which contains at least one city of 50, 000 inhabitants or more. Counties contiguous to the one containing such a city are included in a Standard Metropolitan Statistical Area, if, according to certain criteria, they are essentially metropolitan in character and are socially and economically integrated with the central city. In New England, where the city and town are administratively more important than the county, they are the units used in defining Standard Metropolitan Statistical Areas.
Labor-Management Agreements
Separate wage data are presented, when possible, for establishments where (l) a majority of the production workers are covered by labor-management contracts, and (Z) none or a minority of the production workers are covered by labor-management contracts.
Digitized for FRASER http://fraser.stlouisfed.org/ Federal Reserve Bank of St. Louis
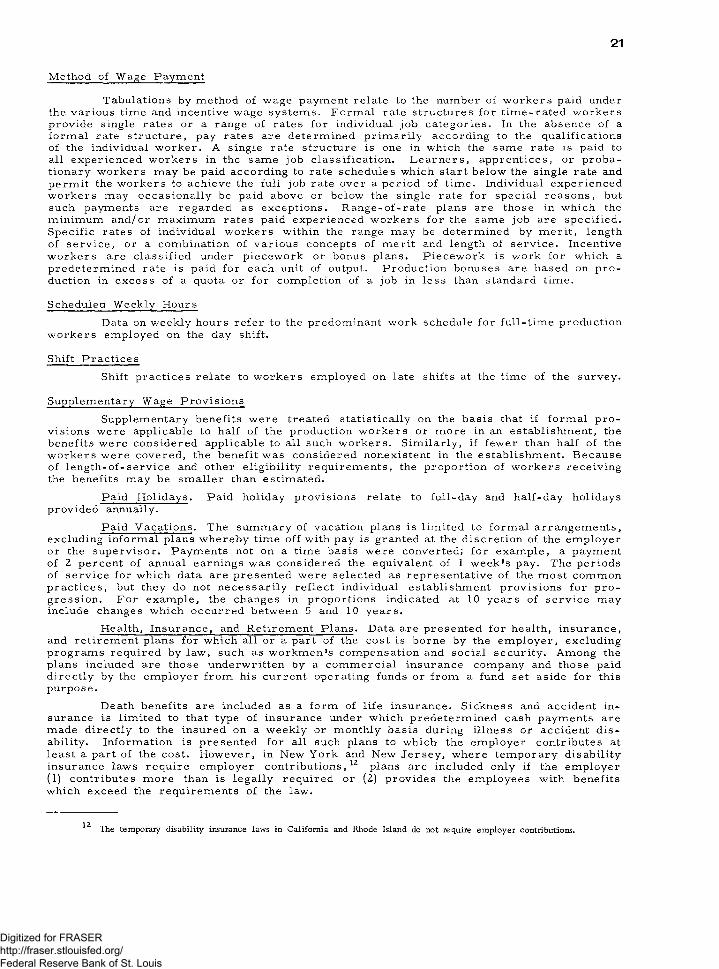
21
Method of Wage Payment
Tabulations by method of wage payment relate to the number of workers paid under the various time and incentive wage systems. Formal rate structures for time-rated workers provide single rates or a range of rates for individual job categories. In the absence of a formal rate structure, pay rates are determined primarily according to the qualifications of the individual worker. A single rate structure is one in which the same rate is paid to all experienced workers in the same job classification. Learners, apprentices, or probationary workers may be paid according to rate schedules which start below the single rate and permit the workers to achieve the full job rate over a period of time. Individual experienced workers may occasionally be paid above or below the single rate for special reasons, but such payments are regarded as exceptions. Range-of-rate plans are those in which the minimum and/or maximum rates paid experienced workers for the same job are specified. Specific rates of individual workers within the range may be determined by merit, length of service, or a combination of various concepts of merit and length of service. Incentive workers are classified under piecework or bonus plans. Piecework is work for which a predetermined rate is paid for each unit of output. Production bonuses are based on production in excess of a quota or for completion of a job in less than standard time.
Scheduled Weekly HoursData on weekly hours refer to the predominant work schedule for full-time production
workers employed on the day shift.
Shift PracticesShift practices relate to workers employed on late shifts at the time of the survey.
Supplementary Wage ProvisionsSupplementary benefits were treated statistically on the basis that if formal pro
visions were applicable to half of the production workers or more in an establishment, the benefits were considered applicable to all such workers. Similarly, if fewer than half of the workers were covered, the benefit was considered nonexistent in the establishment. Because of length-of-service and other eligibility requirements, the proportion of workers receiving the benefits may be smaller than estimated.
Paid Holidays. Paid holiday provisions relate to full-day and half-day holidays provided annually.
Paid Vacations. The summary of vacation plans is limited to formal arrangements, excluding informal plans whereby time off with pay is granted at the discretion of the employer or the supervisor. Payments not on a time basis were converted; for example, a payment of Z percent of annual earnings was considered the equivalent of 1 week's pay. The periods of service for which data are presented were selected as representative of the most common practices, but they do not necessarily reflect individual establishment provisions for progression. For example, the changes in proportions indicated at 10 years of service may include changes which occurred between 5 and 10 years.
Health, Insurance, and Retirement Plans. Data are presented for health, insurance, and retirement plans for which all or a part of the cost is borne by the employer, excluding programs required by law, such as workmen’s compensation and social security. Among the plans included are those underwritten by a commercial insurance company and those paiddirectly by the employer from his current operating funds or from a fund set aside for thispurpose.
Death benefits are included as a form of life insurance. Sickness and accident insurance is limited to that type of insurance under which predetermined cash payments are made directly to the insured on a weekly or monthly basis during illness or accident disability. Information is presented for all such plans to which the employer contributes atleast a part of the cost. However, in New York and New Jersey, where temporary disability insurance laws require employer contributions,12 plans are included only if the employer (1) contributes more than is legally required or (Z) provides the employees with benefits which exceed the requirements of the law.
12 The temporary disability insurance laws in California and Rhode Island do not require employer contributions.
Digitized for FRASER http://fraser.stlouisfed.org/ Federal Reserve Bank of St. Louis
22
Tabulations of paid sick leave plans are limited to formal plans which provide full pay or a proportion of the worker’s pay during absence from work because of illness; informal arrangements have been omitted. Separate tabulations are provided according to (l) plans which provide full pay and no waiting period, and (Z) plans providing either partial pay or a waiting period.
Medical insurance refers to plans providing for complete or partial payment of doctors* fees. Such plans may be underwritten by a commercial insurance company or a nonprofit organization, or they may be a form of self-insurance.
Catastrophe insurance, sometimes referred to as extended medical insurance, includes the plans designed to cover employees in case of sickness or injury involving an expense which goes beyond the normal coverage of hospitalization, medical, and surgical plans.
Tabulations for retirement plans are limited to formal plans which provide pensions or lump-sum retirement pay. Pension plans refer to those which provide regular payments on retirement for the remainder of the worker’s life. Lump-sum retirement pay refers to one payment or a specified number of payments over a period of time. Establishments having provisions for both lump-sum payments and pensions to employees on retirement were considered as having both lump-sum payments and pensions. Establishments having optional plans providing employees a choice of either plan were considered as having only pension benefits.
Digitized for FRASER http://fraser.stlouisfed.org/ Federal Reserve Bank of St. Louis
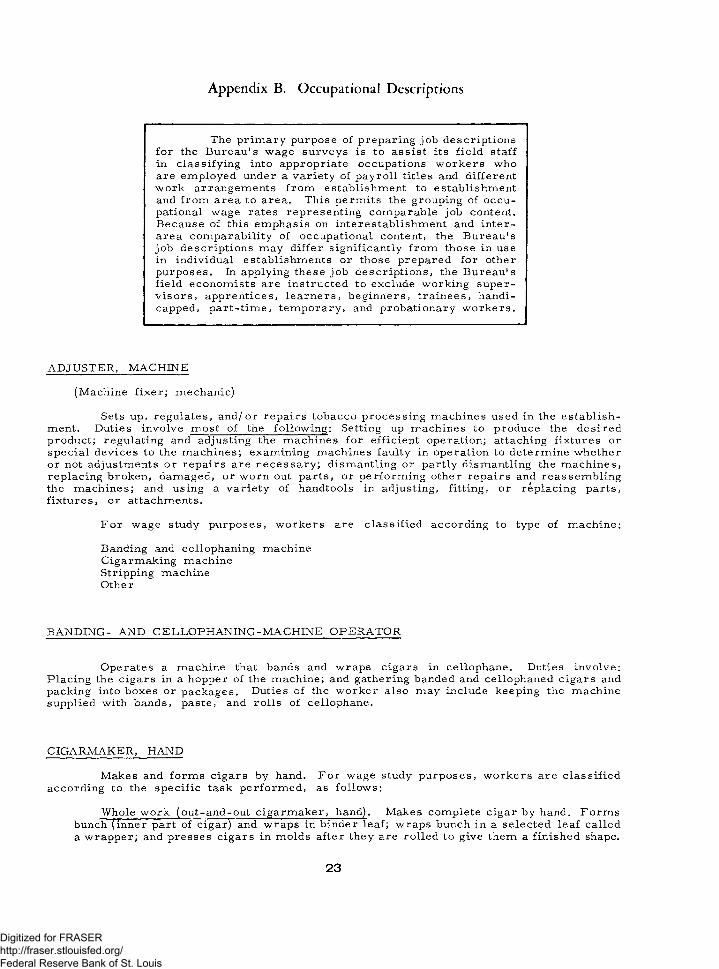
Appendix B. Occupational Descriptions
The primary purpose of preparing job descriptions for the Bureau's wage surveys is to assist its field staff in classifying into appropriate occupations workers who are employed under a variety of payroll titles and different work arrangements from establishment to establishment and from area to area. This permits the grouping of occupational wage rates representing comparable job content. Because of this emphasis on interestablishment and interarea comparability of occupational content, the Bureau's job descriptions may differ significantly from those in use in individual establishments or those prepared for other purposes. In applying these job descriptions, the Bureau's field economists are instructed to exclude working supervisors, apprentices, learners, beginners, trainees, handicapped, part-time, temporary, and probationary workers.
ADJUSTER, MACHINE
(Machine fixer; mechanic)
Sets up, regulates, and/or repairs tobacco processing machines used in the establishment. Duties involve most of the following: Setting up machines to produce the desired product; regulating and adjusting the machines for efficient operation; attaching fixtures or special devices to the machines; examining machines faulty in operation to determine whether or not adjustments or repairs are necessary; dismantling or partly dismantling the machines, replacing broken, damaged, or worn out parts, or performing other repairs and reassembling the machines; and using a variety of handtools in adjusting, fitting, or replacing parts, fixtures, or attachments.
For wage study purposes, workers are classified according to type of machine;
Banding and cellophaning machine Cigarmaking machine Stripping machine Other
BANDING- AND CELLOPHANING-MACHINE OPERATOR
Operates a machine that bands and wraps cigars in cellophane. Duties involve; Placing the cigars in a hopper of the machine; and gathering banded and cellophaned cigars and packing into boxes or packages. Duties of the worker also may include keeping the machine supplied with bands, paste, and rolls of cellophane.
CIGARMAKER, HAND
Makes and forms cigars by hand. For wage study purposes, workers are classified according to the specific task performed, as follows;
Whole work (out-and-out cigarmaker, hand). Makes complete cigar by hand. Forms bunch (inner part of cigar} and wraps in binder leaf; wraps bunch in a selected leaf called a wrapper; and presses cigars in molds after they are rolled to give them a finished shape.
23
Digitized for FRASER http://fraser.stlouisfed.org/ Federal Reserve Bank of St. Louis
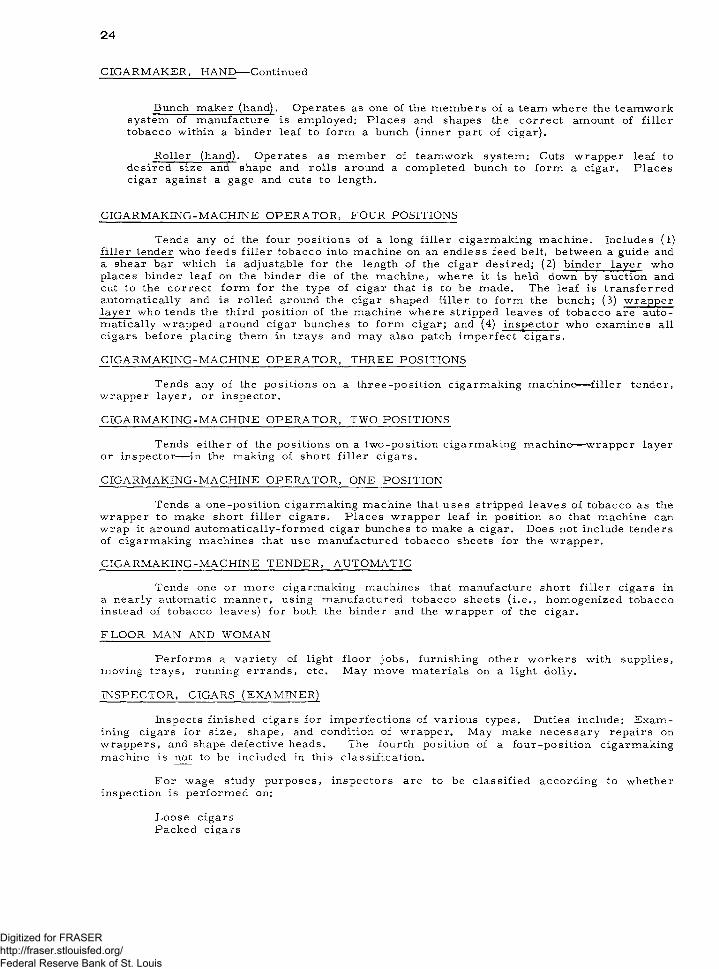
24
CIGARMAKER, HAND— Continued
Bunch maker (hand). Operates as one of the members of a team where the teamwork system of manufacture is employed: Places and shapes the correct amount of filler tobacco within a binder leaf to form a bunch (inner part of cigar).
Roller (hand). Operates as member of teamwork system; Cuts wrapper leaf to desired size and shape and rolls around a completed bunch to form a cigar. Places cigar against a gage and cuts to length.
CIGARMAKING-MACHINE OPERATOR, FOUR POSITIONS
Tends any of the four positions of a long filler cigarmaking machine. Includes (1) filler tender who feeds filler tobacco into machine on an endless feed belt, between a guide and a shear bar which is adjustable for the length of the cigar desired; (Z) binder layer who places binder leaf on the binder die of the machine, where it is held down by suction andcut to the correct form for the type of cigar that is to be made. The leaf is transferredautomatically and is rolled around the cigar shaped filler to form the bunch; (3) wrapperlayer who tends the third position of the machine where stripped leaves of tobacco are automatically wrapped around cigar bunches to form cigar; and (4) inspector who examines all cigars before placing them in trays and may also patch imperfect cigars.
CIGARMAKING-MACHINE OPERATOR, THREE POSITIONS
Tends any of the positions on a three-position cigarmaking machine— filler tender, wrapper layer, or inspector.
CIGARMAKING-MACHINE OPERATOR, TWO POSITIONS
Tends either of the positions on a two-position cigarmaking machine— wrapper layer or inspector— in the making of short filler cigars.
CIGARMAKING-MACHINE OPERATOR, ONE POSITION
Tends a one-position cigarmaking machine that uses stripped leaves of tobacco as the wrapper to make short filler cigars. Places wrapper leaf in position so that machine can wrap it around automatically-formed cigar bunches to make a cigar. Does not include tenders of cigarmaking machines that use manufactured tobacco sheets for the wrapper.
CIGARMAKING-MACHINE TENDER, AUTOMATIC
Tends one or more cigarmaking machines that manufacture short filler cigars in a nearly automatic manner, using manufactured tobacco sheets (i.e ., homogenized tobacco instead of tobacco leaves) for both the binder and the wrapper of the cigar.
FLOOR MAN AND WOMAN
Performs a variety of light floor jobs, furnishing other workers with supplies, moving trays, running errands, etc. May move materials on a light dolly.
INSPECTOR, CIGARS (EXAMINER)
Inspects finished cigars for imperfections of various types. Duties include: Examining cigars for size, shape, and condition of wrapper. May make necessary repairs on wrappers, and shape defective heads. The fourth position of a four-position cigarmaking machine is not to be included in this classification.
For wage study purposes, inspectors are to be classified according to whether inspection is performed on:
Loose cigars Packed cigars
Digitized for FRASER http://fraser.stlouisfed.org/ Federal Reserve Bank of St. Louis
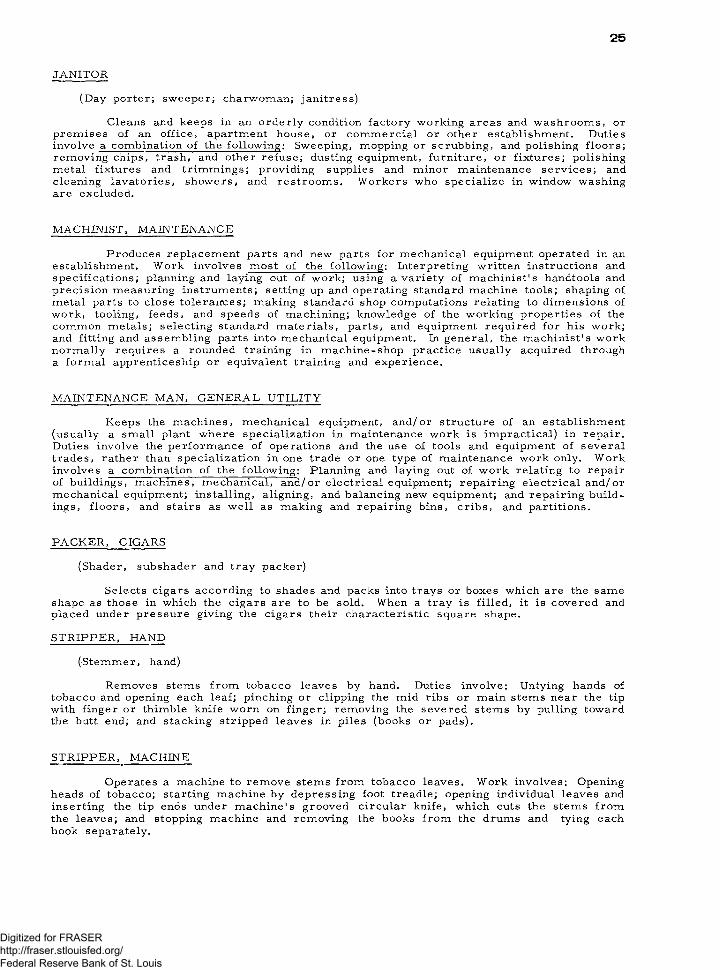
25
JANITOR
(Day porter; sweeper; charwoman; janitress)
Cleans and keeps in an orderly condition factory working areas and washrooms, or premises of an office, apartment house, or commercial or other establishment. Duties involve a combination of the following: Sweeping, mopping or scrubbing, and polishing floors; removing chips, trash, and other refuse; dusting equipment, furniture, or fixtures; polishing metal fixtures and trimmings; providing supplies and minor maintenance services; and cleaning lavatories, showers, and restrooms. Workers who specialize in window washing are excluded.
MACHINIST, MAINTENANCE
Produces replacement parts and new parts for mechanical equipment operated in an establishment. Work involves most of the following: Interpreting written instructions andspecifications; planning and laying out of work; using a variety of machinist's handtools and precision measuring instruments; setting up and operating standard machine tools; shaping of metal parts to close tolerances; making standard shop computations relating to dimensions of work, tooling, feeds, and speeds of machining; knowledge of the working properties of the common metals; selecting standard materials, parts, and equipment required for his work; and fitting and assembling parts into mechanical equipment. In general, the machinist's work normally requires a rounded training in machine-shop practice usually acquired through a formal apprenticeship or equivalent training and experience.
MAINTENANCE MAN, GENERAL UTILITY
Keeps the machines, mechanical equipment, and/or structure of an establishment (usually a small plant where specialization in maintenance work is impractical) in repair. Duties involve the performance of operations and the use of tools and equipment of several trades, rather than specialization in one trade or one type of maintenance work only. Work involves a combination of the following: Planning and laying out of work relating to repair of buildings, machines, mechanical, and/or electrical equipment; repairing electrical and/or mechanical equipment; installing, aligning, and balancing new equipment; and repairing buildings, floors, and stairs as well as making and repairing bins, cribs, and partitions.
PACKER, CIGARS
(Shader, subshader and tray packer)
Selects cigars according to shades and packs into trays or boxes which are the same shape as those in which the cigars are to be sold. When a tray is filled, it is covered and placed under pressure giving the cigars their characteristic square shape.
STRIPPER, HAND
(Stemmer, hand)
Removes stems from tobacco leaves by hand. Duties involve: Untying hands oftobacco and opening each leaf; pinching or clipping the mid ribs or main stems near the tip with finger or thimble knife worn on finger; removing the severed stems by pulling toward the butt end; and stacking stripped leaves in piles (books or pads).
STRIPPER, MACHINE
Operates a machine to remove stems from tobacco leaves. Work involves: Opening heads of tobacco; starting machine by depressing foot treadle; opening individual leaves and inserting the tip ends under machine's grooved circular knife, which cuts the stems from the leaves; and stopping machine and removing the books from the drums and tying each book separately.
Digitized for FRASER http://fraser.stlouisfed.org/ Federal Reserve Bank of St. Louis

Digitized for FRASER http://fraser.stlouisfed.org/ Federal Reserve Bank of St. Louis
Industry Wage Studies
The most recent reports for industries included in the Bureau's program of industry wage surveys since January 1950 are listed below. Those for which a price is shown are available from the Superintendent of Documents, U,S. Government Printing Office, Washington, D .C ., Z040Z, or any of its regionalsales offices. Those for which a price is not shown may be obtained free as long as a supply is available, from the Bureau of Labor Statistics, Washington, D .C., 20212, or from any of the regional offices shown on the inside back cover.
I. Occupational Wage Studies
Manufacturing
Basic Iron and Steel, 1962. BLS Bulletin 1358 (30 cents).Candy and Other Confectionery Products, 1965. BLS Bulletin 1520 (30 cents).
^Canning and Freezing, 1957. BLS Report 136.Cigar Manufacturing, 1964. BLS Bulletin 1436 (30 cents).Cigarette Manufacturing, 1965. BLS Bulletin 1472 (20 cents).Cotton Textiles, 1965. BLS Bulletin 1506 (40 cents).Distilled Liquors, 1952. Series 2, No. 88.
Fabricated Structural Steel, 1964. BLS Bulletin 1463 (30 cents).Fertilizer Manufacturing, 1966. BLS Bulletin 1531 (30 cents).Flour and Other Grain Mill Products, 1961. BLS Bulletin 1337 (30 cents). Fluid Milk Industry, 1964. BLS Bulletin 1464 (30 cents).Footwear, 1965. BLS Bulletin 1503 (50 cents).Hosiery, 1964. BLS Bulletin 1456 (45 cents).
Industrial Chemicals, 1965. BLS Bulletin 1529 (40 cents).Iron and Steel Foundries, 1962. BLS Bulletin 1386 (40 cents).Leather Tanning and Finishing, 1963. BLS Bulletin 1378 (40 cents).Machinery Manufacturing, 1966. BLS Bulletin 1563 (70 cents).Meat Products, 1963. BLS Bulletin 1415 (75 cents).Men's and Boys' Shirts (Except Work Shirts) and Nightwear, 1964.
BLS Bulletin 1457 (40 cents).Men's and Boys' Suits and Coats, 1963. BLS Bulletin 1424 (65 cents). Miscellaneous Plastics Products, 1964. BLS Bulletin 1439 (35 cents). Miscellaneous Textiles, 1953. BLS Report 56.Motor Vehicles and Motor Vehicle Parts, 1963. BLS Bulletin 1393 (45 cents).
Nonferrous Foundries, 1965. BLS Bulletin 1498 (40 cents).Paints and Varnishes, 1965. BLS Bulletin 1524 (40 cents).Paperboard Containers and Boxes, 1964. BLS Bulletin 1478 (70 cents). Petroleum Refining, 1965. BLS Bulletin 1526 (30 cents).Pressed or Blown Glass and Glassware, 1964. BLS Bulletin 1423 (30 cents).
^Processed Waste, 1957. BLS Report 124.Pulp, Paper, and Paperboard M ills, 1962. BLS Bulletin 1341 (40 cents). Radio, Television, and Related Products, 1951. Series 2, No. 84.Railroad Cars, 1952. Series 2, No. 86.
*Raw Sugar, 1957. BLS Report 136.
Southern Sawmills and Planing M ills, 1965. BLS Bulletin 1519 (30 cents). Structural Clay Products, 1964. BLS Bulletin 1459 (45 cents).Synthetic Fibers, 1966. BLS Bulletin 1540 (30 cents).Synthetic Textiles, 1965. BLS Bulletin 1509 (40 cents).Textile Dyeing and Finishing, 1965—66. BLS Bulletin 1527 (45 cents).
* Studies of the effects of the $1 minimum wage.
Digitized for FRASER http://fraser.stlouisfed.org/ Federal Reserve Bank of St. Louis
I. Occupational Wage Studies--- Continued
Manufacturing— Continued
'•'Tobacco Stemming and Redrying, 1957. BLS Report 136.West Coast Sawmilling, 1964. BLS Bulletin 1455 (30 cents).Women's and M isses' Coats and Suits, 1965. BLS Bulletin 1508 (25 cents). Women's and M isses' D resses, 1966. BLS Bulletin 1538 (30 cents).Wood Household Furniture, Except Upholstered, 1965. BLS Bulletin 1496
(40 cents).*Wooden Containers, 1957. BLS Report' 126.Wool Textiles, 1966. BLS Bulletin 1551 (45 cents).Work Clothing, 1964. BLS Bulletin 1440 (35 cents).
N onmanuf a c tur ing
Auto Dealer Repair Shops, 1964. BLS Bulletin 1452 (30 cents).Banking, 1964. BLS Bulletin 1466 (30 cents).Bituminous Coal Mining, 1962. BLS Bulletin 1383 (45 cents).Communications, 1965. BLS Bulletin 1521 (20 cents).Contract Cleaning Services, 1965. BLS Bulletin 1507 (30 cents).Crude Petroleum and Natural Gas Production, I960. BLS Report 181. Department and Women's Ready-to-Wear Stores, 1950. Series 2, No. 78. Eating and Drinking Places, 1963. BLS Bulletin 1400 (40 cents).Electric and Gas Utilities, 1962. BLS Bulletin 1374 (50 cents).Hospitals, 1966. BLS Bulletin 1553 (70 cents).Hotels and Motels, 1963. BLS Bulletin 1406 (40 cents).Laundry and Cleaning Services, 1966. BLS Bulletin 1544 (60 cents).Life Insurance, 1966. BLS Bulletin 1569 (30 cents).Motion Picture Theaters, 1966. BLS Bulletin 1542 (35 cents).Nursing Homes and Related Facilities, 1965. BLS Bulletin 1492 (45 cents).
II. Earnings Distributions StudiesFactory Workers' Earnings— Distribution by Straight-Time Hourly
Earnings, 1958. BLS Bulletin 1252 (40 cents).Factory Workers' Earnings— Selected Manufacturing Industries, 1959.
BLS Bulletin 1275 (35 cents).
Employees Earnings and Hours, June 1965—Retail Trade. BLS Bulletin 1501 (50 cents).Building Materials, Hardware, and Farm Equipment Dealers.
BLS Bulletin 1501-1 (25 cents).General Merchandise Stores. BLS Bulletin 1501-2 (40 cents).Food Stores. BLS Bulletin 1501-3 (30 cents).Automotive Dealers and Gasoline Service Stations.
BLS Bulletin 1501-4 (40 cents).Apparel and Accessory Stores. BLS Bulletin 1501-5 (45 cents).Furniture, Home Furnishings, and Household Appliance Stores.
BLS Bulletin 1501-6 (40 cents).Miscellaneous Stores. BLS Bulletin 1501-7 (30 cents).
Employee Earnings and Hours in Nonmetropolitan Areas of the South and North Central Regions, 1965. BLS Bulletin 1552 (50 cents).
Employee Earnings and Hours in Eight Metropolitan Areas of the South, 1965. BLS Bulletin 1533 (40 cents).
* Studies of the effects of the $1 minimum wage.
* U.S. GOVERNMENT PRINTING OFFICE : 1967 0 -2 8 4 -4 1 7
Digitized for FRASER http://fraser.stlouisfed.org/ Federal Reserve Bank of St. Louis
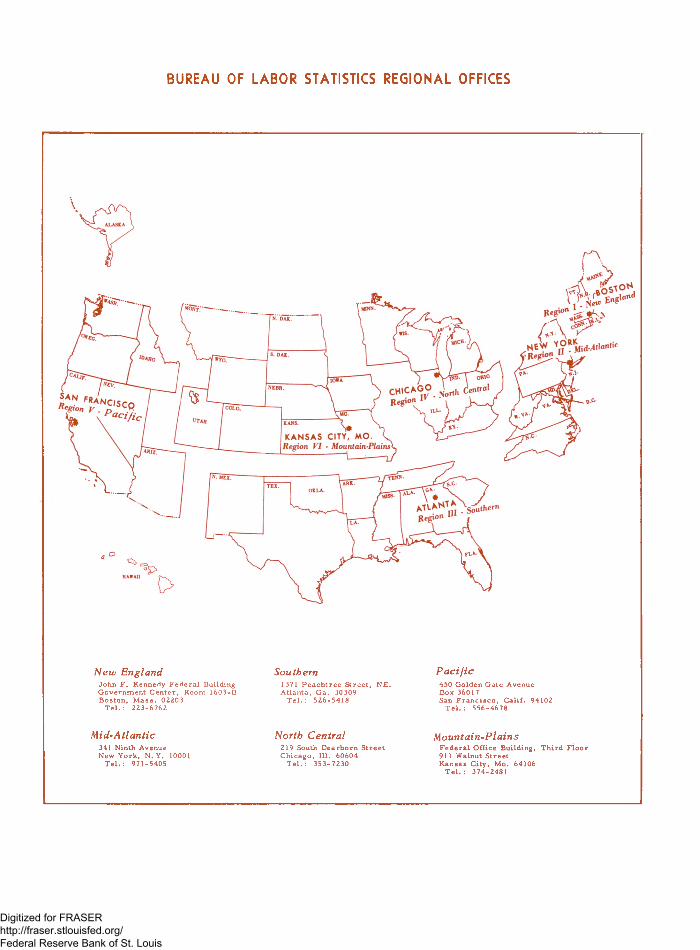
BUREAU OF LABOR STATISTICS REGIONAL OFFICES
New England SouthernJohn F. Kennedy Federal Building 1371 Peachtree Street, NE.Government Center, Room 1603-B Atlanta, Ga. 30309Boston, M ass. 02203 T e l .: 526-5418
T e l.: 223-6762
Pacific450 Golden Gate Avenue Box 36017San Francisco, Calif. 94102
T e l . : 556-4678
Mid-Atlantic341 Ninth Avenue New York, N. Y . 10001
T e l .: 971-5405
North Central219 South Dearborn Street Chicago, 111. 60604
T e l .: 353-7230
Mountain-PlainsFederal Office Building, Third Floor 911 Walnut Street Kansas City, M o. 64106
T e l .: 374-2481
Digitized for FRASER http://fraser.stlouisfed.org/ Federal Reserve Bank of St. Louis


