Embed Size (px)
Citation preview

Union Wages and Hours:
Local-Transit Operating Employees
July 1, 1963and
Trend 1929-63
Bulletin INo. 1396
UNITED STATES DEPARTMENT OF LABOR W. Willard Wirtz, Secretary
BUREAU OF LABOR STATISTICS Ewan Clague, Commissioner
Digitized for FRASER http://fraser.stlouisfed.org/ Federal Reserve Bank of St. Louis
Union Wages and Hours: Local-Transit Operating Employees
July 1, 1963
and
Trend 1929-63
Bulletin No. 1396March 1964
UNITED STATES DEPARTMENT OF LABOR W. Willard Wirtz, Secretary
BUREAU OF LABOR STATISTICS Ewan Clague, Commissioner
For sate by the Superintendent of Documents, U.S. Government Printing Office, Washington, D.C., 20402 - Price 1 5 cents
Digitized for FRASER http://fraser.stlouisfed.org/ Federal Reserve Bank of St. Louis

Digitized for FRASER http://fraser.stlouisfed.org/ Federal Reserve Bank of St. Louis

Preface
The Bureau of Labor S tatistics conducts annual surveys of wage rates and scheduled hours of w ork for sp ecified crafts or jobs as provided in labor-m anagem ent agreem ents in four industries: Building construction ,printing, lo ca l transit, and loca l trucking. The* studies present the wage rates in e ffect as of July 1 of each year, as reported to the Bureau by the appropriate lo ca l labor organizations in each of the cities included in the survey.
Inform ation on the union sca les and hours p r e vailing in each city is available in Septem ber of each year on request to the B ureau 's reg ional o ffices as shown on the inside back cover. A re lea se sum m arizing the rates for lo ca l-tra n s it operating em ployees on a nationwide basis was issued in January 1964. This analysis provides additional data and indexes of the trend of w ages and hours for the p eriod 1929—63.
This study was conducted in the B ureau 's D iv ision of National Wage and Salary Incom e by N orm an J. Sam uels, Chief of the D ivision , under the general d ir e c tion of L. R. L insenm ayer, A ssistant C om m ission er for W ages and Industrial R elations. The analysis was p r e pared by Thom as C. M obley, under the im m ediate su p erv is ion of John F. L aciskey . F ie ld w ork for the survey was d irected by the A ssistant R egional D irectors for W ages and Industrial R elations.
Hi
Digitized for FRASER http://fraser.stlouisfed.org/ Federal Reserve Bank of St. Louis

Digitized for FRASER http://fraser.stlouisfed.org/ Federal Reserve Bank of St. Louis

Contents
P age
S um m ary_________________________________Scope and m ethod of s tu d y -------------------Scale in c r e a s e s , 1962—6 3 _____________W age sca le v a r ia tion s ---------------------------C ity a v e ra g e s -----------------------------------------Standard w ork w eek _____________________Health, in su ran ce , and pen sion plans Union s ca le s by c i t y ______ -___________
T ab les :
1. Indexes of union h ou rly w age ra tes of lo ca l-tra n s itoperating em p loy ees , 1929“ 6 3 _____________________________________________ 4
2. A verage union h ou rly wage rates of lo ca l-tra n s itoperating em p loy ees , July 1, 1963, and in cre a se sin ra tes , July 1, 1962—July 1, 1963----------------------------------------------------------- 4
3. P ercen t changes in union w age ra tes and p ercen t oflo ca l-tra n s it operating em p loyees a ffected ,July 1, 1962—July 1, 1963 ___________________________________________________ 4
4. C e n ts -p e r -h o u r changes in union wage rates and p ercen t oflo ca l-tra n s it operating em p loyees a ffected ,July 1, 1962—July 1, 1963 ___________________________________________________ 5
5. D istribu tion of union operating em p loyees in the lo c a l-tr a n s itindustry by h ou rly wage ra tes , July 1, 1963--------------------------------------------- 5
6. A verage union h ou rly w age rates of lo ca l-tra n s it operatingem p loyees by city, July 1, 1963____________________________________________ 6
7. D istribu tion of union lo ca l-tra n s it operating em p loyeesby standard w eek ly h ou rs, July 1, 1963___________________________________ 6
8. Union sca le s o f w ages and hours fo r lo ca l-tra n s it operatingem p loy ees , July 1, 1962, and July 1, 1963 ______________________________ 7
v
N N
CO CO CO CO
Digitized for FRASER http://fraser.stlouisfed.org/ Federal Reserve Bank of St. Louis

Digitized for FRASER http://fraser.stlouisfed.org/ Federal Reserve Bank of St. Louis
Union Wages and Hours:
Local-Transit Operating Employees, July 1, 1963
Sum m ary
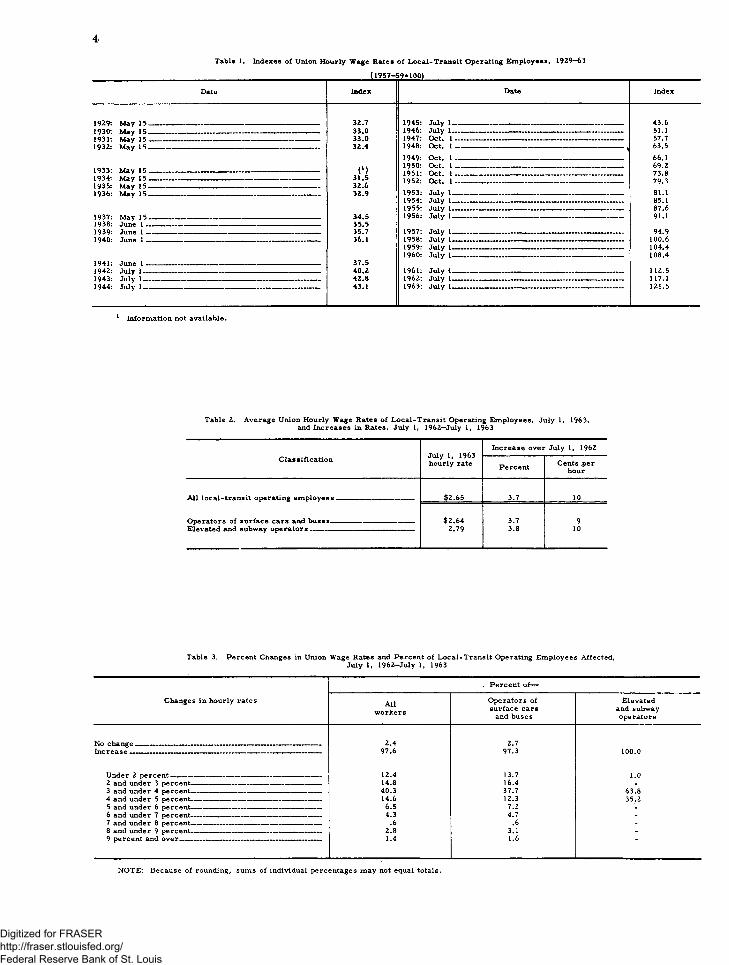
H ourly wage sca les of unionized lo c a l- transit operating em ployees in c ities of 100,000 or m o r e population r o s e an average of 10 cents, or 3.7 percent, during the year ending July 1, 1963, a ccord in g to the 43dannual su rvey of union sca les in the lo c a l- transit industry by the Bureau of L a b o r S tatistics.
N egotiated rates w ere adjusted upward for 98 percent of the lo ca l-tra n s it operating em ployees included in the survey. Advances ranged from 6 to 8 cents 1 for an eighth of the w ork ers ; 8 to 10 cents for a sixth; and 10 to 12 cents for slightly m ore than a fourth. R aises of 12 cents or m ore affected a lm ost another fourth of the operating em ployees.
Union hourly wage sca les on July 1, 1963, averaged $2.65 for operators of lo ca l-tra n s it equipment. N egotiated sca les ranged from $2.60 to $2.90 an hour for half of the w orkers and from $2.25 to $2.60 for a fourth. Rates of $2.90 or m ore an hour w ere in e ffect for a sixth of the transit operating em ployees.
Straight-tim e w orkw eek schedules w ere reported for 95 percent of the operating em p loyees included in the B ureau 's study. Such w eekly schedules averaged 40.5 hours, unchanged since July 1, 1961. W orkweeks of40 hours w ere contained in agreem ents app licable to 86 percent of all operating em ployees.
L abor-m anagem ent agreem ents w h i c h provided health, insurance, and pension plans financed at least in part by the em ployer w ere applicable to v irtu a lly a ll o f the operating em ployees. C ontributory pension plans, f i nanced jo in tly by the em ployers and e m p loyees, p reva iled for half of the w ork ers . S im ilarly financed health and insurance p ro gram s w ere in e ffe ct for nearly tw o-th irds of the operators .
Scope and Method of Study
Union s c a l e s are t h o s e a g r e e d on through co lle ctiv e bargaining between trade unions and em p loyers , and defined as (1) the
1 For ease of reading in this and subsequent discussions of tabulations, the limits of the class intervals are designated as 6 to 8 cents,*■ 2 to 3 percent, e t c . , instead of using the more precise terminology, 6 and under 8 cents, 2 and under 3 percent, etc.
b a s ic (m inim um ) wage sca les (excluding h o liday, vacation, or o t h e r benefit paym ents regu larly m ade or cred ited to the w orker each pay p eriod ), and (2) the m axim um schedules of hours at stra igh t-tim e rates. Rates in ex ce ss of the negotiated m inim um , which m ay be paid for specia l qualifications or other reason s, are not included.
The in form ation presented in this bulletin was based on union sca les in e ffect on July 1, 1963, and cov ered approxim ately 62,000 lo ca l- transit operating em ployees in 61 cities with populations of 100, 000 or m ore . T rackm en and m aintenance w ork ers w ere excluded from the study. O perating em ployees of m unicipally owned transit system s w ere included if unions acted as the bargaining agents. Data w ere obtained p rim a r ily fro m lo ca l union o ffic ia ls by m ail questionnaire; in som e instances, Bureau represen tatives v is ited l o c a l union o ffic ia ls to obtain the d esired inform ation.
• The current survey was designed to r e fle ct union wage sca les of lo ca l-tra n s it o p e r ating em ployees in all cities of 100, 000 or m ore population. A ll c ities with 500, 000 or m ore population w ere included, as w ere m ost c ities in the 250, 000—500, 000 group. The c ities in the 100, 000—250, 000 group se lected for study w ere d istributed w idely throughout the United States. Data for som e c ities w ere weighted to com pensate for cities not su rveyed. To provide appropriate representation in the com bination of data, each geographic reg ion was con sidered separately when city weights w ere assigned.
A verage hourly s ca le s , designed to show current lev e ls , w ere based on a ll sca les r e ported in e ffect on July 1, 1963. Individualsca les w ere weighted by the num ber of union m em bers at each rate. These averages are not designed for p re c is e y e a r -to -y e a r co m parison s because of fluctuations in m em bersh ip and in the c la ss ifica tion s studied. A verage ce n ts -p e r -h o u r and percent changes from July 1, 1962, to July 1, 1963, w ere ,how ever, based on com parable quotations for the various c la ss ifica tion s in both p eriods, weighted by the m em bersh ip reported for the current (1963) survey. The index se r ie s , d e signed for t r e n d purposes, was s im ila rly constructed .
1Digitized for FRASER http://fraser.stlouisfed.org/ Federal Reserve Bank of St. Louis
2
Scale In creases, 1962—63
Changes in wage rates for lo ca l-tra n s it opera tors r e s u l t p r im a r ily f r o m la b o r - m anagem ent negotiations. Of the agreem ents in e ffect on July 1, 1963, in the cities studied, 7 of every 8 w ere negotiated lo r at least 2 years. Such m ultiyear contracts generally provided for one or m ore interim wage in cre a se s and som e for c o s t -o f - l iv in g adjustm ents as w ell. Tow ever, only those sca le changes which actually becam e effective b e tween July 1, 1962, and July 1, 1963, havebeen included in the survey. Some of the sca le adjustm ents w ere provided for in con tracts negotiated p rio r to July 1, 1962. D efe rre d in crea ses e ffective subsequent to July I, 1963, have been excluded from the study. Thus, the sca le changes presented in this report do not re fle c t the total wage advances negotiated in individual agreem ents during the survey year.
Rate rev is ion s e ffective betw een July 1, 1962, and July 1, 1963, ra ised the leve l ofun ionhourly sca les for lo ca l-tra n s it operating em ployees 3.7 percent. T h i s r is e , while slightly sm aller than that reg is te red in the precedin g 12-m onth p eriod , approxim ated the gain record ed in the year ending July 1, 1961, and advanced the B ureau ’s index (1957—59=100) of union hpurly sca les for lo ca l-tra n s it o p e r ating em ployees to 121.5 (table 1).
The advance re fle cted gains of 3. 7 percent for operators oi surface cars and buses and 3.8 percent for those on elevated and subway equipment. On a cen ts -p er -h ou r b asis , the in crease in average sca les was 9 cents and 10 cents, resp ectiv e ly (table 2).
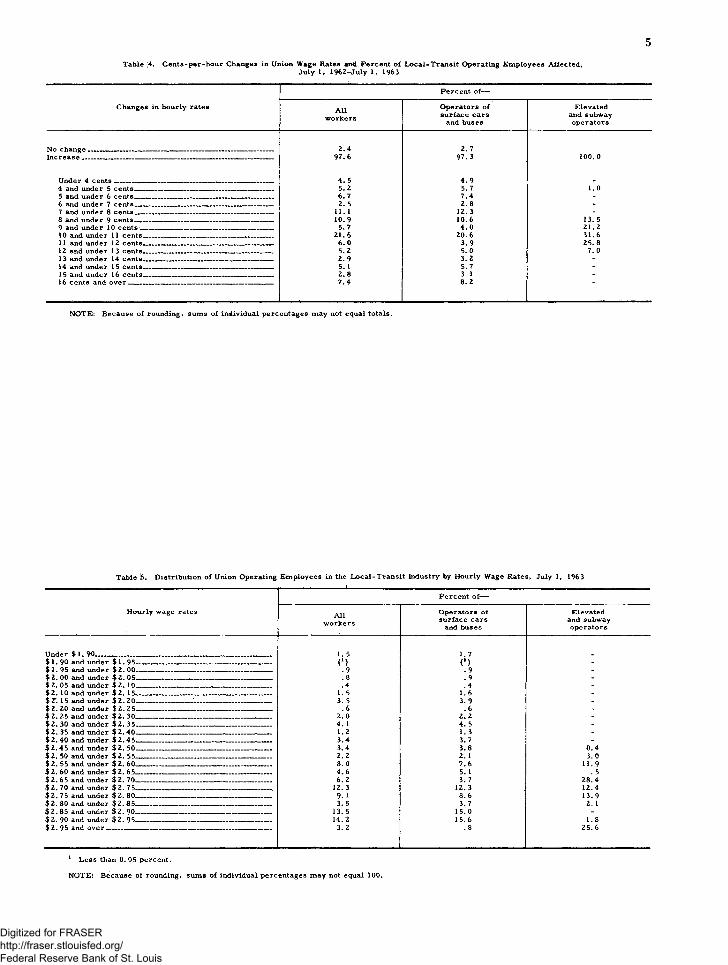
Wage rates w ere adjusted upward between July 1, 1962, and July J, 1963, for 97 p e r cent of the opera tors of surface cars and buses and for all of those on elevated and subway equipment. Although individual sca le in crea ses varied from 2 to 3 7 72 cents for su rface equipment op era tors , ra ises of 10 cents w ere applicable to a fifth of these w ork ers . Scales advanced 6 to 8 cents for a lm ost a sixth; 8 to 10 cents for a seventh; and 12 cents or m ore for a fourth. The advance was le ss than 6 cents for about a sixth.
F or operating em ployees on elevated and subway system s, sca le in crea ses of 11 cents w ere record ed for a fourth; of 8 to 10 cents fo r a third; and of 10 to 11 cents for a lm ost another third (table 4).
The ra ise s fo r op era tors of surface equipment rep resen ted g a i n s of 3 to 4 percent for th ree-e igh th s of tfye w ork ers , and of 4 to 6 percent for a fifth. The gain was 6 percent or m ore for a tenth, and le ss than 3 percent for three-tenths. The r ise was 3 to 4 percent for five -e igh th s of the elevated and subway op era tors , and 4 to 5 percent for a l m o s t th ree-e igh th s (table 3).
Wage Scale V aria tion s
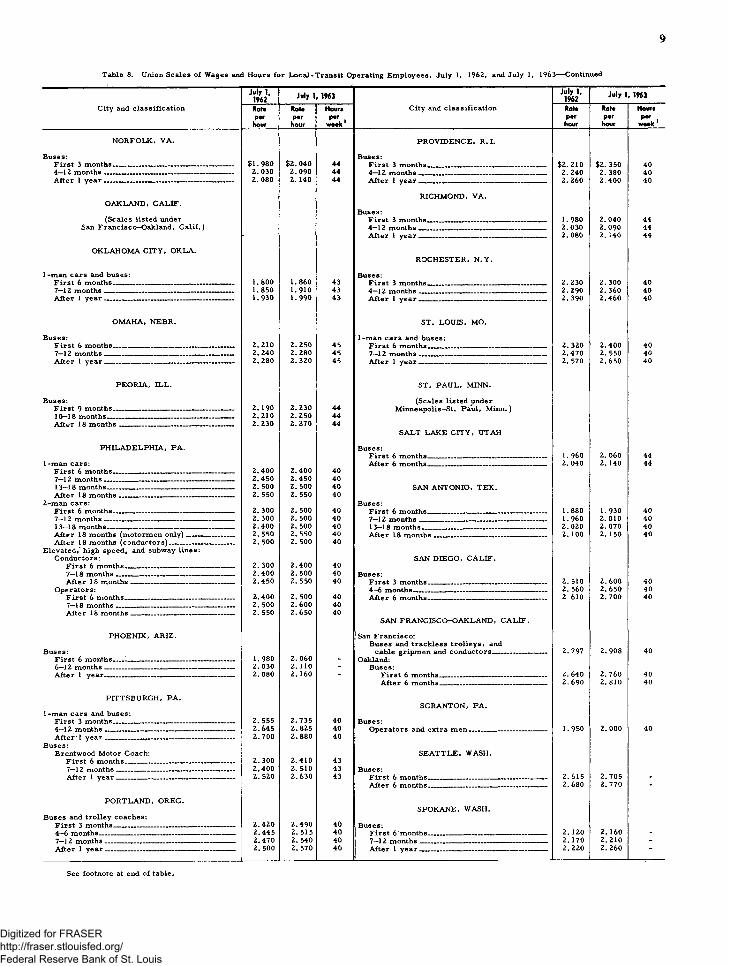
L abor-m anagem ent agreem ents for lo ca l- transit operating em ployees gen erally provide for le n g th -o f-se r v ice d ifferen tia ls— an en trance rate, one or m ore interm ediate rates, and a m axim um or top ra te .2 Although the t i m e intervals betw een rate s t e p s varied among the 61 c ities included in the study, the entrance rate gen era lly applied for 3 or 6 months of em ploym ent. Length of se rv ice was not a fa ctor in M em phis, San F ra n cisco , Scranton, and Tam pa, w here only single rates w ere negotiated.
The entrance or starting rate for surface equipm ent op era tors in the cities surveyed varied fro m a low of $1.65 in Albuquerque and K noxville , to a h i g h of $2.91 in San F ra n c isco . It exceeded $2 an hour in 7 of every 8 c ities . The top or b a s ic sca le for these op era tors varied from $1.75 in Knoxville to $3.02 for m ultiunit car operators in Boston. In 2 of every 5 c it ie s , the top sca le was $2.50 or m ore . The spread between the entrance and top rates was 10 cents in a fourth of the c ities and exceeded this amount in another fourth of the c ities surveyed.
Union sca les of lo ca l-tra n s it operating em ployees in c ities of 100, 000 or m ore population averaged $2.65 an hour on July 1, 1963. O perators of su rface cars and buses, who a c counted for nine-tenths of the w orkers included in the survey, averaged $2.64; and those on elevated and subway equipment $2.79 (table 2).
H ourly sca les of $2.50 to $2.75 w ere con tained in agreem ents applicable to three-tenths of the op era tors of surface cars and buses, $2.75 or m ore for tw o-fifth s, and $2.25 to $2.50 fo r a l m o s t a sixth. F or operators of elevated and subway equipment, nearly th ree -fifth s had sca les of $2.50 to $2.75 an hour and slightly m ore than tw o-fifths had sca les of at least $2.75 an hour (table 5).
This so-called top rate actually becomes the employee's basic scale after a specified period o f employment with the com pany. It is not a maximum rate in the sense that the company may not pay more.
Digitized for FRASER http://fraser.stlouisfed.org/ Federal Reserve Bank of St. Louis

3
City A verages
City averages, designed to show current rate leve ls , are a ffected not only by the wide variation in the leve ls of sca les w hich exist in the individual c ities but a lso by variations in the proportion s of union m em bers at each of the graduated sca les within cities . These d ifferen ces are re fle cted in the w eighting of individual rates by the number of m em bers at e a c h rate. T h ere fore , even though all rates in two areas m ay be identical, the a v e r ages for the two areas m ay d iffer.
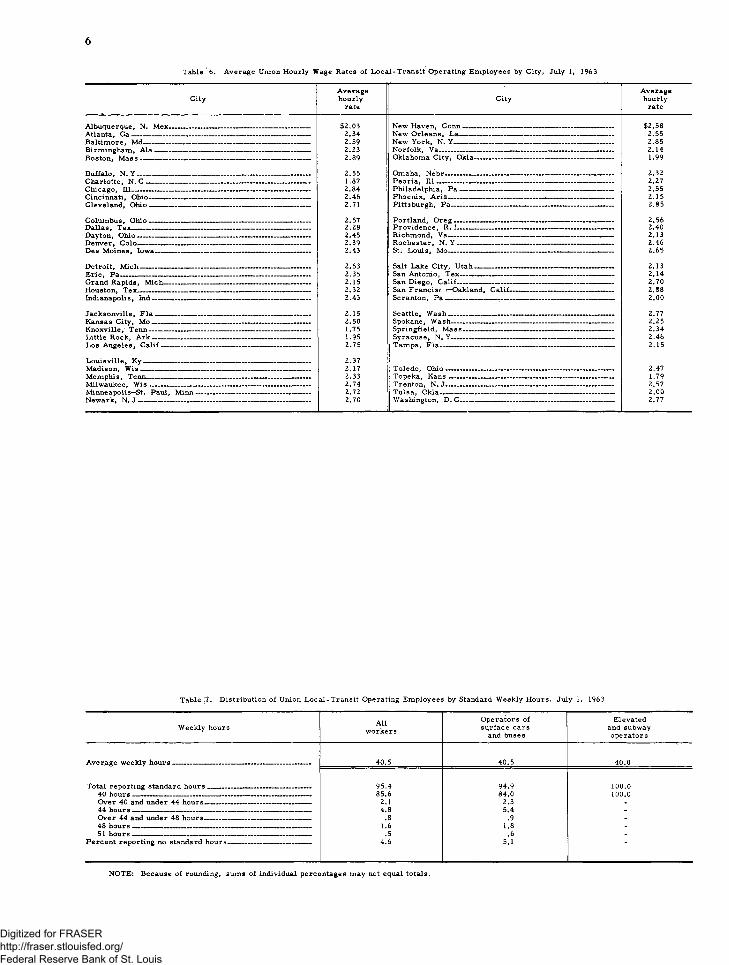
During the y e a r ending July 1, 1963,hourly sca les w ere in crea sed for all or som e w ork ers in 60 of the 61 cities included in the survey. The advances varied from 2 cents in Cincinnati to 37V2 cents for som e bus o p e r ators on one line in New Y ork City. In creases of 7 and 8 cents w ere each reported in a fifth of the c ities. R aises w ere 9 or m ore cents for all or som e w orkers in a fourth of the cities and less than 6 cents in a slightly la rger proportion of cities.
Am ong the cities surveyed, average hourly sca les varied from $1.75 in K noxville to $2.89 in Boston. Scales averaged $2.75 or m ore in 7 others, between $2.25 and $2.50 in 19 cities , $2.50 and $2.75 in 16 c ities , and $2 and $2.25 in 13 cities (table 6).
Standard W orkweek
Straight-tim e w orkw eeks w ere reported for surface equipment operators in 52 of the 61 cities included in the survey. Such w eekly schedules w ere applicable to 95 percent of the car and bus operators included in the survey and averaged 40.5 hours on July 1, 1963, the same as a year ea rlie r .
The m ost prevalent w orkw eek, 40 hours, was in e ffect in 5 of every 8 c it ie s . Such schedules a ffected 5 of every 6 op era tors of surface equipm ent and all of those on elevated- and subway equipm ent (tables 7 and 8).
Health, Insurance, and P en sion Plans
Labor-m anagem ent agreem ents containing p rov is ion s for one or m ore health, insurance, and pension plans a ffected p ra ctica lly all of the lo ca l-tra n s it operating em ployees in the Bureau's su rvey .3 Health and insurance plans financed jo in tly by em ployees and em ployers w ere stipulated in con tracts applicable to five -e igh th s of the op era tors on su rface cars and buses and m ore than nine-tenths of those on elevated and subway ca rs . P en sion plans s im ila rly financed w ere provided in a g re e m ents for half o f the op era tors o f su rface equipment and an eighth of those on elevated and subway equipment.
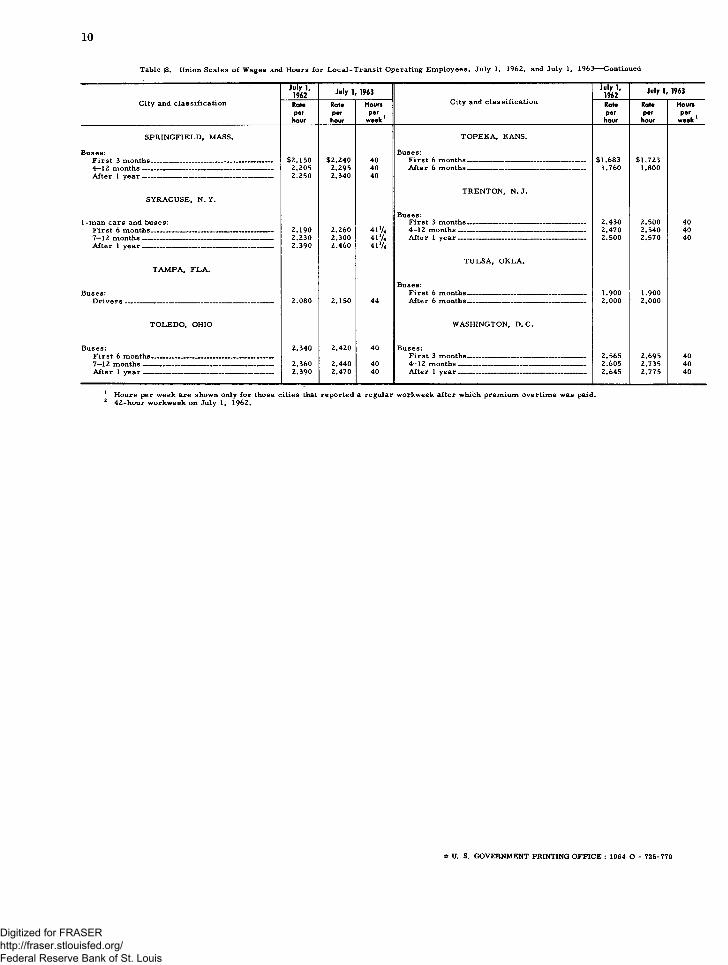
Union Scales by City
Table 8 p resen ts the union wage sca les in e ffect on July 1, 1962, and July 1, 1963,in each of the 61 c ities surveyed. W eekly hours are a lso shown for cities for w hich a regular stra igh t-tim e w orkw eek was reported .
3 The prevalence of negotiated health, insurance, and pension programs for local-transit operating employees was first studied in 1954. Information for these plans was restricted to those financed entirely or in part by the employer. Plans financed by workers through union dues or assessments were excluded from the study. No attempt was made to secure information on the kind and extent of benefits provided or on the expenditures for such benefits.
Digitized for FRASER http://fraser.stlouisfed.org/ Federal Reserve Bank of St. Louis
4
Table 1. Indexes of Union Hourly Wage Rates of Local-Transit Operating Employees, 1929—63
T able 2. A vera g e Union H ourly W age R ates o f L o ca l-T r a n s it O perating E m p loyees, July 1, 1963, and In cre a se s in R ates, July 1, 1962—July 1, 1963
July 1, 1963 h ou rly rate
In crease o v e r July 1, 1962C la s s if ica t io n
P e rce n t Cents .per hour
A ll lo c a l-t r a n s it operating e m p loy ees $2.65 3.7 10
O perators o f su r fa ce c a rs and buses $2 .64 3.7 9E levated and subway o p e r a t o r s — - 2.79 3.8 10
T ab le 3. P e rce n t Changes in Union W age Rates and P ercen t o f L o ca l-T r a n s it O perating E m p loyees A ffected ,July 1, 1962—July 1, 1963
Changes in h ou rly ra tes
. P e rce n t o f—
A llw o rk e rs
O perators o f su r fa ce ca rs
and buses
E levated and subway o p era tors
No change — — — ------ 2 .4 2.7I n c r e a s e --------------------------------------------------------------------------------------- 97.6 97.3 100.0
Under 2 p e r ce n t --------------------------------------------------------------------- 12.4 13.7 1.02 and under 3 p ercen t----------------------------------------------------------- 14.8 16.4 -3 and under 4 p e rcen t— — --------------------------------------------------- 40.3 37.7 63.84 and under 5 p ercen t------------------------------------------------------------ 14.6 12.3 35.25 and under 6 percen t ----- ---------- ------- — 6.5 7.2 -6 and under 7 p ercen t------------- - ------------ - — — 4.3 4.7 -7 and under 8 percen t----------------------------------------------------------- .6 .6 -8 and under 9 p ercen t----------------------------------------------------------- 2.8 3.1 -9 percen t and o v e r ----------------------------------------------------------------- 1.4 1.6
NOTE: Because of rounding, sums of individual percentages may not equal totals.
Digitized for FRASER http://fraser.stlouisfed.org/ Federal Reserve Bank of St. Louis
5
Table 4. C e n ts -p e r -h o u r Changes in Union W age Rates and P ercen t o f L o ca l-T r a n s it O perating E m p loyees A ffected ,Ju ly 1, 1962—July 1, 1963
Changes in hou rly rates
P e rce n t o f—
A llw o rk e rs
O p erators o f su r fa ce ca rs
and buses
E levated and subway op e ra to rs
No ch a n g e____________ ._____ _ --------------- - ----- -------------- 2 .4 2 .7I n c r e a s e __ ___________ „ — ___ ______ 9 7 .6 9 7 .3 100 .0
Under 4 cents — __ _ _____ _ —______ _ _ 4 . 5 4 .9 _4 and under 5 ce n ts . __________ ________________ 5 .2 5 .7 1 .05 and under 6 ce n ts______ ____ _ __ ------- — _ — 6 .7 7 .4 -6 and under 7 ce n ts__ __ „ ______ ______ _ 2. 5 2 .8 -7 and under 8 cents _______ _____________ ______ ____ _ 11.1 1 2 .3 -8 and under 9 ce n ts .________ ____ __ ___________________ 1 0 .9 10 .6 13. 59 and under 10 c e n t s ________________________________________ 5. 7 4 .0 2 1 .210 and under 11 ce n ts__ _______ ______ __ . . . _ __ 2 1 .6 2 0 .6 31 .611 and under 12 cents . _ —__________ . ------------- _ _ 6 .0 3 .9 2 5 .812 and under 13 ce n ts_____ _ . ____ ___ ______ . ------- 5 .2 5. 0 7 .013 and under 14 cents ______ _______ _ . ___ _ __ 2 .9 3 .2 -14 and under 15 ce n ts--- ---------- ----------------------------- 5. 1 5 .7 -15 and under 16 cen ts_______________________________________ 2 .8 3 1 -16 cen ts and o v e r --------- --------------------- -------------- 7 .4 8 .2
NOTE: B ecause o f rounding, sum s o f individual p ercen ta ges m ay not equal to ta ls .
Table |5. D istr ibution o f Union O perating E m p loyees in the L o ca l-T r a n s it Industry by H ourly W age R ates, July 1, 1963
P e rce n t o f—
H ourly wage rates A llw ork ers
O perators o f su r fa ce ca rs
and buses
E levated and subw ay op e ra to rs
Under $ 1 . 90 - ...................... - .............. - ...............................- 1. 5 1 .7$ 1 .9 0 and under $ 1. 95 __________ - ____ __ ___ — - (*) <l ) -$ 1 .9 5 and under $ 2. 00_________________________________________ .9 .9 -$ 2. 00 and under $ 2. 05 ___________ ________ __________ — .8 . 9 -$ 2. 05 and under $ 2. 10 ____________ ___ ________________ .4 .4 -$ 2 .1 0 and under $ 2 . 1 5 _ ----- -------- ----- --------- ------------- 1. 5 1 .6 -$ 2*. 15 and under $ 2 .2 0 _____ _ __ ------- ---------- __ 3. 5 3. 9 _$ 2. 20 and under $ 2. 25 __ ____ _________ - _____ - __ .6 .6 -$ 2. 25 and under $ 2. 30 ___ — ____ __ — 2. 0 2 .2 -$ 2. 30 and under $ 2. 35_________________________________________ 4 . 1 4. 5 -$ 2. 3'5 and under $ 2 .40____________________ — ------- 1 .2 1 .3 -$ 2 .4 0 and under $ 2 .4 5 ______ _____ _ _ _ _ _ ____ __ 3 .4 3 .7 -$ 2 .4 5 and under $ 2 . 50_________________________________________ 3 .4 3 .8 0 .4$ 2 .5 0 and under $ 2 .5 5 _ _____ ____ __ __ __ _ _ _ 2. 2 2. 1 3 .0$ 2. 55 and under $ 2. 60 _____ ______ _ ~ --------------- 8. 0 7 .6 1 1 .9$ 2. 60 and under $ 2. 65 — _____________ - — - - 4 .6 5. 1 . 5$ 2. 65 and under $ 2. 70 _ _ _________________ -_______ — 6 .2 3 .7 2 8 .4$ 2 .7 0 and under $ 2 .7 5 ____ __ — __________ ______ _ __ 12. 3 12. 3 1 2 .4$ 2. 75 and under $ 2. 80 _______ ______ ______ _____ __ ____ 9. 1 8 .6 1 3 .9$ 2. 80 and under $ 2 .8 5 _________________________________________ 3. 5 3 .7 2. 1$ 2. 85 and under $ 2. 90 ___ ______ __________ ___ __ ___ 13. 5 15 .0 -$ 2. 90 and under $ 2. 95 ______ __ _______ __ ___ _____ 14 .2 15. 6 1 .8$ 2 .9 5 and o v e r _____ _ _ ---------- ----------------------- 3 .2 .8 2 5 .6
1 L e ss than 0. 05 p ercen t.
NOTE: Because of rounding, sums of individual percentages may not equal 100.
Digitized for FRASER http://fraser.stlouisfed.org/ Federal Reserve Bank of St. Louis
6
Table 1 6. Average Union Hourly Wage Rates of Local-Transit Operating Employees by City, July 1, 1963
A lbuquerque, N. Mex.Atlanta, G a -----------------B a ltim ore , Md------------B irm ingham , A la -------Boston , M a s s -------------
C ityA veragehourly
rate
$2.032.342.592.232.89
New Haven, C o n n ___New O rleans, L a-------New Y ork , N. Y______N orfo lk , Va__________O klahom a C ity, Okla.
C ityA veragehourly
rate
$2.582.552.852.141.99
B uffa lo, N. Y _____C harlotte , N. C —C hicago , 111-----------C incinnati, Ohio— Cleveland, Ohio —
2.551.872.842.462.71
Omaha, N ebr____P e o r ia , 111----------Philadelphia , PaP hoenix, A r iz -----P ittsburgh , P a—
2.322.272.552.152.85
C olum bus, Ohio —D allas, T ex-----------Dayton, O h io --------D enver, C o lo --------Des M oines, Iowa.
2.572.282.452.392.43
P ortland , O r e g __P rov id en ce , R . I_.R ichm ond, V a------R och e ste r , N. Y_. St. L ou is , M o___
2.562.402.132.462.65
D etro it, M ich ---------------E r ie , P a________________Grand R apids, M ich—Houston, T ex__________Indianapoli s , Ind ---------
2.632.352.152.322.43
Salt Lake C ity, U tah----------------San Antonio, T ex -----------------------San D iego, C a lif------------------------San F ra n cisr i—Oakland, C a lif- Scranton, P a _______________ ____
2.132.14 2.70 2.88 2.00
J ack son v ille , F la — Kansas C ity, Mo —K noxville , T en n -----L ittle R ock , A rk — L os A n geles, C a lif
2.152.501.75 1.952.75
Seattle, W a sh ------Spokane, W ash-----S pringfield , M ass.S yracuse , N. Y-----Tam pa, F la _______
2.772.252.342.462.15
L o u isv ille , K y ------------M adison, W is --------------M em phis, Tenn------------M ilw aukee, W is ----------M inneapolis—St. Paul, New ark, N. J -----------:—
Minn
2.372.172.332.742.722.70
T oled o , O h io ------Topeka, K a n s___Trenton, N. J------T ulsa, Okla---------W ashington, D. C
2.471.792.572.002.77
T able 7. D istr ibu tion o f Union L o ca l-T r a n s it Operating E m p loyees by Standard W eekly H ours, July 1, 1963
W eekly hours A llw ork ers
O perators o f sq r fa ce ca rs
and buses
E levated and subway o p erators
Aver.age w eekly h o u r s --------- -------------------------------------------- — 40.5 40.5 40.0
Total reporting standard h o u r s__ ___________________ ______ 95.4 94.9 100.040 h o u r s --------------------------------------------------------------------------------- 85.6 84.0 100.0O ver 40 and under 44 hours ____________________________ 2.1 2.3 _44 hours - ____ __________________________________ 4.8 5.4 -O ver 44 and under 48 h ou rs— --------------- ------------------------- .8 .9 -48 hours _ _ ____ 1.6 1.8 _51 hours -------------------------- -----------------------------— .5 .6 _
P ercen t rep orting no standard h ou rs--------------- ------------------- 4.6 5.1
NOTE: Because of rounding, sums of individual percentages may not equal totals
Digitized for FRASER http://fraser.stlouisfed.org/ Federal Reserve Bank of St. Louis

7
Table j8. Union Scales of Wages and Hours for Local-Transit Operating Employees, July 1, 1962, gnH July 1, 1963
C ity and c la s s ific a t io n
July 1, 1962
July 1, 1963
Rateperhour
Rateperhour
Hoursper
week
ALBU QU ERQU E, N. M EX.
Buses:F ir s t 4 m onths--- ------------------------------------------------- $1 .6 00 $ 1.650 -5—1 2 m o n th s________________________ ______________ 1 .830 1 .880 -A fter 1 y e a r ----------------------------------------------------------- 2 .0 0 0 2. 050
A T L A N T A , GA.
Buses:F ir s t 6 m onths. ______ __ ---------------------------------- 2. 160 2. 240 -7—12 m o n th s___________ __ — ------ ------------------ 2. 220 2. 300 -A fter 1 y e a r _____________________________ _________ 2. 260 2. 340 -
B A L T IM O R E , MD.1-m an ca rs and buses:
F ir s t 6 m onths_____________ ____________________ 2 .4 0 0 2. 500 407—12 m o n th s________________ _______ ________ 2 .4 5 0 2. 550 40A fte r 1 y e a r . . __ _____ _____ _ _______ ______ 2. 500 2. 600 40
BIRMINGHAM, A L A .B uses and tro lle y coa ch es :
F ir s t 6 m onths. ____ __ _______________________ 2. 100 2. 180 2 407—12 m o n th s_____ ______________________ _______ 2. 120 2. 200 z 40A fte r 1 y ea r ______________________ _____ ____ 2. 150 2. 230 240
BOSTON, MASS.
1 -m an ca rs and buses:F ir s t 3 m onths— ------------------ ------ _ ----- ------ 2 .4 8 5 2 .6 0 5 404—6 m onths-------------------- ------------- ------------- ------ 2. 605 2. 725 407—9 m onths______ — --------- ------- ----- ----------- 2 .6 4 0 2 .7 6 0 4010—12 m onths___________ ____ __ ____ _ __ _ 2 .6 8 8 2. 808 40A fte r 1 y e a r . _________________________ _. ____ 2 .7 8 5 2 .9 0 5 40
P .C .C . su r fa ce lid es op erators :F ir s t 3 m onths____________________________________ 2. 605 2. 725 404—6 m onths____________ ___ — --------- ----------- 2 .7 2 8 2. 848 407—9 m onths ----- ------- --------- _ __ ------- _ 2. 760 2. 880 4010—12 m onths--------------- --------------------------------------- 2 .8 0 5 2. 925 40Aft.pr 1 y p a r ............... ............... _ _ . 2. 903 3. 023 40
Rapid transit lines:G uards:
F ir s t 3 m onths---------------------- --- --------------- 2. 363 2 .4 8 3 404—6 m onths ------- --------------- ------ ------------- 2 .4 8 5 2 .6 0 5 407—9 m onths_______________ _____________—.. .. 2. 523 2 .6 4 3 401 0—1 7. m onths . .... ................ 2. 568 2 .6 8 8 40A fter 1 y e a r ___ __ __ ______ _____ __ ____ 2 .6 6 8 2. 788 40
M otorm en:Road ._ — . . __________ __ ____ ______ 2. 728 2 .8 4 8 40Y a r d ___ __ ___ __ _____________ _ _ __ 2 .7 8 5 2. 905 40
P la tform m en:W a rd e rs — ____ . __ ----- _ — ----------- 2. 508 2 .6 2 8 40G atem en __ _ --------- ----- ----------- ------ _ __ 2. 568 2 .6 8 8 40
B U FF A L O , N .Y .Buses:
F ir s t 3 m onths___________________________________ 2. 360 2. 500 404—12 m on th s_____ ___ _ _ _______ ___ ____ 2 .3 9 0 2. 530 40A fter 1 y ea r --- ----------- ------ ----- -------------- 2 .4 1 0 2. 550 40
C H A R L O T T E , N .C .B uses:
F ir s t 2 m onths__ ___ ____________ __ __ _ 1 .710 1 .780 -3—6 m onths_______ ___________ ____________________ 1 .760 1 .830 -A fter 6 m onths __ __ __ __ ------ -_______ 1 .810 1 .880 "
CH ICAGO, IL L .
Buses:F ir s t 3 m onths__ _ _ ____ _ _ _ ------ 2 .7 1 0 2 .8 1 0 404—12 m o n th s. _ _ _ _ _ _ ----- ----- --------- 2 .7 4 0 2. 840 40A fter 1 year:
D ays ------------- - — - — --------- - - 2 .7 6 0 2. 860 40Nights— b e fo re 2 a. m . _____ _ __ . _____ 2. 790 2. 890 40Nights— after 2 a. m ___ _. ----- 2 .8 1 0 2. 910 40
E levated and subw ay ra ilw ays:M otorm en (regu la r) _ ___ _ — — ----- _ _ 2 .651 2 .761 40M otorm en (ex tra ):
F irg t 3 m onths ----- _. _ — — - 2 .5 9 7 2. 707 404—12 m onths . _. — _ — -------------- 2 .6 0 6 2 .7 1 6 40A fter 1 y e a r . . _ ------ ---------- . ----- — 2.651 2.761 40
C onductors (regu la r) . __ . __ __ ._ . __ _ 2 .6 0 6 2 .7 1 6 40C onductors (extra):
F ir s t y ear _ — _ — ------ ------------- _ 2. 588 2 .6 9 8 40A fte r 1 y e a r . . _____________ __ __ __ __ 2 .6 0 6 2 .7 1 6 40
G uards (extra):F ir s t 3 m on th s.. _ __________ — --------- 2. 560 2 .6 7 0 404—12 m onths ....________ 2. 570 2 .6 8 0 40A fte r 1 y e a r — _ . ------ . . . . 2. 579 2 .6 8 9 40
C ity and c la s s ific a t io n
July 1, 1962
July 11, 1963
Rate Rate Hoursper per P*r ,hour hour week 1
$ 2 ,250 $ 2,270 402. 300 2. 320 402. 350 2. 370 402 .4 0 0 2 .4 2 0 402 .4 5 0 2 .4 7 0 40
2. 540 2 .6 8 0 442. 570 2 .7 1 0 442. 590 2 .7 3 0 44
2 .4 4 0 2. 580 442 .4 7 0 2 .6 1 0 442 .4 9 0 2 .6 3 0 44
2 .4 7 0 2 520 402. 520 2. 570 40
2. 140 2 .2 0 02 .2 2 0 2 .2 8 0
2. 290 2. 370 402 .3 4 0 2 .4 2 0 402. 390 2 .4 7 0 40
2 .2 8 0 2. 360 402 290 2. 370 402. 300 2. 380 402. 310 2 .3 9 0 402 .3 2 0 2 .4 0 0 40
2 .2 8 0 2. 350 402 .3 1 0 2 .3 8 0 402 .3 6 0 2 .4 3 0 40
2 .4 7 5 2. 525 402. 525 2. 575 402 .5 7 5 2 .6 2 5 402 .6 7 5 2 .7 2 5 40
2 .2 1 0 2 .2 5 0 402 .2 8 0 2. 320 402 .3 1 0 2. 350 40
2 .0 0 0 2 .0 5 0 482 .0 5 0 2. 100 482. 100 2. 150 48
2. 190 2 .2 4 0 42Vz2 .2 2 0 2 .2 7 0 42Vz2 .2 5 0 2. 300 42Vz2 .2 8 0 2. 330 427z
2 .3 0 0 2. 370 402 .3 2 0 2 .3 9 0 402 .3 7 0 2 .4 4 0 40
CINCINNATI, OHIO
B uses and tro lle y coa ch es :F ir s t 6 m onths___________7—12 m o n th s___:__________13—18 m onths.. 19—24 m onths.. A fter 2 y e a rs ..
C L E V E LA N D , OHIO
Buses and tro lle y coa ch es : F ir s t 3 m on th s.__________4—12 m o n th s ----------------------------------A fter 1 y e a r ______________________
Rapid transit— T rainm en:F ir s t 3 m onths___________________4—12 m onths .A fter 1 y ea r _
COLUM BUS, OHIO
B uses and t ro lle y coa ch e s : F ir s t 26 w eek s___________A fter 26 w eek s___________________________
D A L LA S , T E X .
B uses and t ro lle y coa ch es : F ir s t y e a r _A fter 1 year _
D AYTO N , OHIO
B uses:F ir s t 6 m onths_____________________7—12 m o n th s___________________A fter 1 y e a r __________________
D EN VER, CO LO .
Buses and tro lle y coa ch es : F ir s t 3 m onths___________4—12 m o n th s___13—18 m onths—19—24 m onths__A fter 2 y e a r s__
DES MOINES, IOWA
Buses:F ir s t 3 m onths— 4—12 m onths _A fte r 1 y e a r _________________
D E T R O IT , MICH.
B uses:F ir s t 6 m onths..7—12 m o n th s___A fter 1 y e a r -----Night b u s e s -------
B uses:F ir s t 6 m onths__7—12 m onths _A fter 1 y e a r ___________
GRAND RAPIDS, MICH.
B uses:F ir s t 3 m onths - 4—12 m o n th s___A fter 1 year
HOUSTON, T E X .
Buses:F ir s t 3 m onths__4—9 m onths_______10—15 m onths____A fte r 15 m onths _
INDIANAPOLIS, IND.
Buses and tro lle y coa ch es : F ir s t y e a r ..Second y e a r ..A fter 2 y e a r s_______
See footnotes at end of table.
Digitized for FRASER http://fraser.stlouisfed.org/ Federal Reserve Bank of St. Louis

8
Table |8. Union Scales o f Wages and Hours for Local-Transit Operating Employees, July 1, 1962, and July 1, 1963— Continued
C ity and c la s s ific a t io n
July 1, 1962 July 1,,1963
Rateperhour
Rateperhour
Hours P®r .
week1
JACKSONVILLE. F L A .
Buses:F ir s t 3 m onths . _____ __________ ____ $1,980 $2,050 404—6 m onths___— ___________________________________ 2.030 2.100 40A fter 6 m onths 2.080 2.150 40
KANSAS C IT Y , MO.
Buses:F ir s t 4 m o n th s..— —______ __ 2.275 2.440 405—8 m onths — —_ — — . . 2.295 2.460 409—12 m o n th s------- --------------- . . . ---------- ----- ------ --------- 2.315 2.485 40A fter 1 y e a r — — 2.330 2.500 40
K N O XV ILLE, TENN.
Buses:F ir s t year . . ------- ----- 1.600 1.650 48S econd y e a r— — — _________________ _ ___ 1.650 1.700 48A fter 2 y e a r s ----------------------------------- ------ --------------- 1.700 1.750 48
L IT T L E ROCK, ARK .
Buses:F ir s t 6 m onths------------------------------------------------------- 1.720 1.800 517—12 m onths . 1.770 1.850 5113—18 m onths______________________ _____ __________ 1.820 1.900 51A fter 18 m onths - - - ___ — . 1.870 1.950 51
LOS AN GELES. C A U F .
1 -m an ca rs and buses:F ir s t 6 m onths- — . . . . . . — 2.620 2.650 40A fter 6 m onths. — - - ----- 2.720 2.750 40
2 -m a n ca rs :F ir s t 6 m on th s...... ..-..-r, — —... 2.520 2.550 40A fter 6 m onths 2.620 2.650 40
LOU ISVILLE, KY.
B uses:F ir s t 3 m onths . - - ______.__.................. ..... . 2.140 2.220 404—6 m onths. 2.220 2.300 407—12 m o n th s---------- ------------------------------------------------- 2.270 2.350 40A fter 1 year 2.290 2.370 40
MADISON, WIS.Buses:
F ir s t 6 m onths:Day---------------------------------------------------------------------- 2.050 2.100 40Night------------------------------------------------------------------- 2.090 2.140 40
7—12 m onths:D a y ___ — __ 2.090 2.140 40Night. 2.130 2.180 40
j 13—18 m onths:Day------------ --------------------------------------------------------- 2.170 2.220 40Night------------------------------------------------------------------- 2.210 2.260 40
A fter 18 m onths:Day___ _ _ _ _ 2.190 2.240 40Night_______ . . . 2.230 2.280 40
MEMPHIS, TENN.Buses and t ro lle y coa ch es :
D riv e rs — 2.250 2.330 40
M ILW AUKEE, WIS.
Buses:F ir s t y e a r - . . . . — __ _ __ _ 2.620 2.700 40A fter 1 y e a r ----------------------------------------------------------- 2.660 2.740 40
MINNEAPOLIS—ST. PA U L , MINN.Buses:
F ir s t 9 m onths— — ------ ----------- 2.590 2.660 4010—18 m onths— - - ---------- — - — - 2.620 2.690 40A fter 18 m onths — - ----- ----- - — — 2.660 2.730 40
NEWARK, N. J.1 -m an ca rs and buses:
F ir s t 6 m onths— -------- — ------------- ------- 2.480 2.520 407—12 m onths T -ti. - t__ . . . „r,.. _ __ 2.570 2.610 40A fter 1 y e a r _____ _— — ___________________ _____- 2.670 2.710 40
Subway:M otorm en:
F ir s t 6 m onths--------- ------------------------------ — 2.480 2.520 407—12 m onths 2.570 2.610 40A fter 1 y e a r ----------- _ --------------- -------------- 2.670 2.710 40
P la tform m e n ------- — — ------------------- - — 2.670 2.710 40
C ity and c la s s ific a t io n
July 1, 1962
July 1,, 1963
Rot*purhour
Rotupur
hour
Hourspur
wuuk
NEW HAVEN, CONN.
B uses:F ir s t 3 mmVhq —,--------------------------- .__ „_______ — $2,440 $2,510 404—12 m o n th s------ - — ------ — — — 2.470 2.540 40A fter 1 y e a r ---------------------------------------------------------- 2 .510 2.580 40
NEW ORLEAN S, L A .
1 -m an ca rs and buses:F ir s t 6 m onths — --------- — ------- — 2.440 2.510 407—12 m onths — — — ----- — . . . ----- 2 .470 2.540 40A fter 1 y e a r ______________ ______________________ 2.500 2.570 40
2 -m a n ca rs :F ir s t 6 m onths . . . . . — __ . . . — 2.370 2.440 407—12 m onths — - ------- --------— -------- 2.400 2.470 40A fter 1 y ea r - _ ------------ ------- 2 .430 2.500 40
NEW YORK, N. Y.
Buses:Avenue B and East Broadw ay
T ra n sit C o . :F ir s t 6 m onths. — — ---------- -------- _ 2 .300 2.410 407—12 m onths - __ — — _____ __ 2.380 2.490 4013—24 m onths - — — — — ----- — 2.450 2.685 40A fte r 2 y ears - ------ —----- _ ___ 2.585 2.685 40
B rook lyn Bus D iv is ion ; B rook lynD iv is ion N o. 2; Manhattan BusD ivision :
F ir s t 6 m onths- — _______ ___ _______ _ 2.530 2.625 407—12 m onths _ ------ ---------------- ----- 2 .670 2.765 40A fter 1 year — — ----------- — — _ . 2 .810 2.910 40
Queens Bus D ivision :F ir s t 6 m onths. ___________ _ — — — 2.500 2.625 407—12 m o n th s__ __ . ____ _____ 2.630 2.765 40A fter 1 y e a r __ __ ___ 2.730 2.910 40
G reen L ines:F ir s t 6 m onths- - --------- ------ - 2 .520 2.720 407—12 m onths .. . ........... 2.570 2.770 4013—18 m onths - ------ 2.640 2.840 40A fte r 18 m on th s - __ ~ 2.800 3.000 40
Jam aica B u ses , In c .:F ir s t 6 m onths - . . . . — 2.365 2.465 407—12 m onths — — . 2 .445 2.545 4013—18 m onths--------------------------------------------------- 2 .515 2.615 40A fte r 18 m onths ____ ___ 2.650 2.750 40
Manhattaxr-Bronx Surface Authority:F ir s t 6 m on th s.. ---------- 2.175 2.550 407—12 m onths — - — — . ------ 2.350 2.670 4013—18 m onths — . __ — — — 2.450 2.730 40A fter 18 m onths _ _ ------- _ --------- 2.625 2.850 40
Queens T ra n sit C o r p . :F ir s t 6 m onths------------------------------------------------- 2.335 2.435 407—12 m onths _ _ _ ----- __ __ _ 2.415 2.515 4013—18 m onths ------ — ---------- — ------- 2.485 2.585 4019—24 m onths-------------------------------------------------- - 2.555 2.655 40A fter 2 y e a r s . - 2.625 2.720 40
Schenck T ra n sport C o . :F ir s t 9 m onths — _ - ----- . — ._ 2.210 2.330 4010—18 m onths— ------- --------- ' _ 2.270 2.390 40A fter 18 m onths - ------- ------ 2.480 2.600 40
Steinway T ransit C o r p . :F ir s t 6 m onths------ ----- — ___ ____ _ _ 2.335 2.435 407—12 m onths -------------- ------- 2.415 2.515 4013—18 m onths _ _ — ------------- _ __ 2.485 2.585 4019—24 m onths- — ------ ------------- . - 2.555 2.655 40A fter 2 y e a r s— - - — ------ --- — _ 2.625 2.720 40
T r i -B o r o C oach C o r p . :F ir s t 12 m o n th s---------------------------------------------- 2.350 2.450 4013—18 m onths ----- ----------------- --------- ._ . 2.540 2.640 40A fter 18 m o n th s---------------------------------------------- 2.650 2.750 40
Subway:C ond uctors :
F ir s t position :F ir s t y e a r __________ __ _____ _____ ___ 2.528 2.615 40A fter 1 y e a r _______________ ____________ 2.593 2.683 40
Second p o s it io n ________ __________________ _ 2.478 2.565 40M otorm en :
Road:F ir s t y ea r ____________ _______________ 2.965 3.070 40A fter 1 y e a r . . _ __ _____ __ _____ 3.033 3.140 40
Y ard :F ir s t y e a r __________ _________________ 2.830 2.930 40A fter 1 y e a r ________ __ ________ _____ 2.895 2.998 40
P la tfo rm m en:F ir s t y e a r____ _____ ________ _____ ----- 2.383 2.465 40A fter 1 y e a r _____ ________ __ ---------- 2.423 2.508 40
See footnote at end of table.
Digitized for FRASER http://fraser.stlouisfed.org/ Federal Reserve Bank of St. Louis
9
Table 8. Union Scales of Wages and Hours for Local-Transit Operating Employees, July 1, 1962, and July 1, 1963— Continued
C ity and c la s s ifica t io n
July 1,1962 July 1 1963 July 1,
1962July 1, 1963
Rat*per
hour
Rateperhour
Houri P«r .
week1
C ity and c la s s ific a t io n Rateperhour
Rateper
hour
Hours P*r .
week 1
NO RFO LK, VA. PRO VIDEN CE, R .I .
Buses: Buses:$ 1 ,9 80 $2. 040 44 F ir s t 3 m onths . .. . $2. 210 $2. 350 40
2. 030 2 .0 9 0 44 4—1 ?, m onths 2. 240 2. 380 402. 080 2. 140 44 A fter 1 y ea r 2. 260 2 .4 0 0 40
RICHMOND, VA.OAK LAND , C A L IF .
Buses:(S cales listed under F ir s t 3 m onths- __ _____ __ ____ __________ 1 .980 2. 040 44
San F ra n cisco -O a k la n d , C a l i f . ) 4—1Z m onths , 2 .0 3 0 2. 090 44A fte r 1 y e a r ____ _____ ____ _______ _______ 2. 080 2. 140 44
OKLAH OM A C IT Y , O KLA.RO CH ESTER, N. Y .
1 -m an ca rs and buses: B uses:F ir s t 6 m onths____________________________________ 1 .8 0 0 1 .860 43 F ir s t 3 m on th s. __ ____ ____ ______________ 2. 230 2. 300 407—12 m o n th s_________ __________________________ _ 1 .850 1 .910 43 4—12 m o n th s____ ______ __ __ — ____ _ - 2 .2 9 0 2. 360 40A fte r 1 y e a r ----------------------------------------------------------- 1 .930 1 .990 43 A fter 1 y e a r _ _ _ _ _ _ _ __ __ _____________ 2. 390 2 .4 6 0 40
OMAH A, NEBR. ST . LOUIS, MO.
B uses: 1 -m an ca rs and buses:2. 210 2 .2 5 0 45 F ir s t 6 m onths 2. 320 2 .4 0 0 402. 240 2. 280 45 7—1 2 m onths 2 .4 7 0 2. 550 402. 280 2. 320 45 A fter 1 y ea r 2. 570 2. 650 40
P EO RIA, IL L . ST. P A U L , MINN.
B uses: (S cales liste d underF ir s t 9 m onths. ____ __ __________ — ----------- 2. 190 2 .2 3 0 44 M inneapolis—St. P au l, M inn .)10-18 m on th s. ----------------------------- ------ ----------- 2 .2 1 0 2. 250 44A fte r 18 m o n th s ------------- ----------- ----- _ ------- 2 .2 3 0 2. 270 44
SALT LAKE C IT Y , UTAH
PH ILA DE LPH IA, P A . Buses:F ir s t 6 m onths _ _ — --------- ---------- 1 .960 2. 060 44
1 -m an ca rs : A fter 6 m onths __ _ --- ----------- — — — 2. 040 2. 140 44F ir s t 6 m onths. ____ ____________ _____ ______ 2 .4 0 0 2 .4 0 0 407—12 m onths __________ ___ ______ — _ - 2 .4 5 0 2 .4 5 0 4013—18 m onths — - — — - 2. 500 2. 500 40 SAN AN TONIO, T E X .A fter 18 m o n th s------ --------- ----- - - 2. 550 2. 550 40
2 -m an ca rs : Buses:2. 300 2. 500 40 F ir s t 6 m onths . .. 1 .880 1 .930 40
7—1 7. m onths . . 2. 300 2. 500 40 7—1 7 m onths 1 .960 2. 010 401 3—1 ft m onths . . 2 .4 0 0 2. 500 40 1 ^—1ft m onths . .. 2. 020 2. 070 40After m onths (m otorm en only) 2. 550 2. 550 40 Aftpr 1 ft m onths 2. 100 2. 150 40A fter 18 m onths (c o n d u c to rs )— ---------- ------- 2. 500 2. 500 40
E levated ,' high sp eed , and subway lin e s :C onductors : SAN DIEGO, C A L IF .
F ir s t 6 m onths----- ----------- ------ --------- ------ 2. 300 2 .4 0 0 407—18 m onths __ ________ _ ------ — ------ 2 .4 0 0 2 .5 0 0 40 B uses:A fter 1 ft m o n t h s ................... 2 .4 5 0 2. 550 40 F ir s t 3 m onths . . 2. 510 2 .6 0 0 40
O perators: 4—6 m onths------------------------------------------------------------- 2. 560 2 .6 5 0 40F ir s t 6 m onths ... . Z. 400 2. 500 40 A fter 6 m onths __ . . . . _ 2 610 2 .7 0 0 407—18 m onths _ __ __ ------------- — ---------- 2. 500 2 .6 0 0 40A fter 18 m o n th s_______________________________ 2. 550 2 .6 5 0 40
SAN F R A N CISCO -O AK LA N D , C A L IF .
PHOENIX, A R IZ . San F ra n c is co :B uses and tra ck le ss t r o l le y s , and
B uses: ca b le gripm en and con d u ctors — ---------- — 2. 797 2. 908 40F ir s t 6 m onths------------- ---------- ----- ----------------- 1 .980 2 .0 6 0 - Oakland:6—12 m o n th s----- — --------- — ----- ------- — 2. 030 2. 110 - B uses:A fter 1 yea r ____ _____ __ _ 2. 080 2. 160 _ F ir s t 6 m onths . . . 2. 640 2. 760 40
A fter 6 m onths____ — — ------------- 2. 690 2. 810 40
PITTSBU RGH, PA .SCRANTON, P A .
1 -m an ca rs and buses:F ir s t 3 m onths__ _______ ______________ ___ — 2. 555 2 .7 3 5 40 Buses:4—12 m onths .... .. .... _ _ 2 .6 4 5 2 .8 2 5 40 O p erators and evtra m en 1 .950 2. 000 40A fter T y e a r ----- ----- ----------------------------------------- 2 .7 0 0 2 .8 8 0 40
Buses:Brentw ood M otor Coach: S E A T T L E , WASH.
F ir s t 6 m onths----- ------------------------------------------ 2. 300 2 .4 1 0 437—12 m o n th s ------------------------------------------------------ 2 .4 0 0 2. 510 43 Buses:A fter 1 year 2. 520 2 .6 3 0 43 F ir s t 6 m onths _ - .. - . .. 2 .6 1 5 2 .7 0 5 _
A fte r 6 m onths____________________________________ 2 .6 8 0 2. 770 -
P O R TLAN D , OREG.SPOKAN E, WASH.
Buses and tro lle y coa ch e s :F ir s t 3 m onths---------- ----- __ ------- ----------------- 2 .4 2 0 2 .4 9 0 40 B uses:4— nntVis _ . _ . ... _ 2 .4 4 5 2. 515 40 F ir s t ^ 'm on th s - 2. 120 2. 1607—12 m onths __ ...... _ _ 2 .4 7 0 2. 540 40 7—1 7- m onths 2. 170 2. 210 _Aftpr 1 y#»ar ....... . . . . 2. 500 2. 570 40 A fter 1 y e a r . _______ ... ......... 2 .2 2 0 2. 260 _
See footnote at end of table.
Digitized for FRASER http://fraser.stlouisfed.org/ Federal Reserve Bank of St. Louis
10
Table |8. Union Scales of Wages and Hours for Local-Transit Operating Employees, July 1, 1962, and July 1, 1963- Continued
C ity and c la s s ific a t io n
J u ly 1, 1962 J u ly 1,, 1963
J u ly 1,
1962Ju ly 1, 1963
Rateper
hour
Rateperhour
Hours
Z v '
C ity and c la s s ific a t io n Rateperhour
Rateper
hour
Hours
Z * 'SPRIN G FIELD , MASS. TO P E K A , KANS.
B uses: Buses:F ir s t 3 m onths------------------------------------------------------- $2,150 $2,240 40 F ir s t 6 m onths____________________________ ______ $1,683 $1,7234—12 m o n th s ----------------------------------------------------------- 2.205 2.295 40 A fter 6 m onths___________________________________ 1.760 1.800A fter 1 y ear - — — — — — 2.250 2.340 40
TREN TON , N. J.SYRACUSE, N. Y.
Buses:1 -m an ca rs and buses: F ir s t 3 m onths________________________________ —_ 2.430 2.500 40
f i r s t (\ mnntlis 2.190 2.260 41l/4 4—1 2 mnntlis 2.470 2.540 407—12 m onths ------- ------------- - . . . 2.230 2.300 4 lV 4 2.500 2.570 40A fte r 1 y e a r ------------------------------------------------------------ 2.390 2.460 4lV4
TULSA, OK LA.T A M P A , F L A .
Buses:Buses: F ir s t 6 m onths___________________________________ 1.900 1.900
D riv e rs 2.080 2.150 44 Aftar f* m onths 2.000 2.000
TOLED O , OHIO WASHINGTON, D. C.
Buses: 2.340 2.420 40 B u ses:F ir s t 6 m on th s. __ . . . F ir s t 3 m onths______________ ______________________ 2.565 2.695 407—1 ? mrmtVic 2.360 2.440 40 4—1 2 m onths . . . ... .... _ .......... . 2.605 2.735 40A-ft-ar 1 y*»a-r 2.390 2.470 40 Aftar 1 y sa r 2.645 2.775 40
H ours per w eek a re show n only fo r those c it ie s that re p o rte d a reg u lar w orkw eek a fter w hich prem iu m ov e rtim e was paid. 4 2 -h ou r w orkw eek on July 1, 1962.
☆ U. S. GOVERNMENT PRINTING OFFICE : 1964 O - 725-779
Digitized for FRASER http://fraser.stlouisfed.org/ Federal Reserve Bank of St. Louis
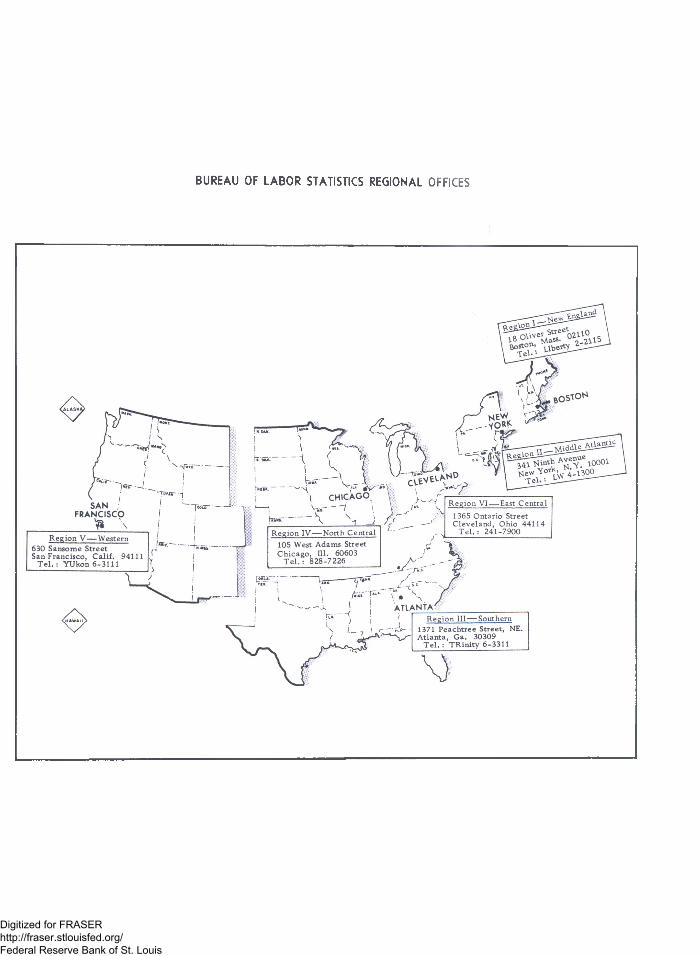
BUREAU OF LABOR STATISTICS REGIONAL OFFICES
Digitized for FRASER http://fraser.stlouisfed.org/ Federal Reserve Bank of St. Louis


