Embed Size (px)
Citation preview

warwick.ac.uk/lib-publications
Original citation: Bloodworth, Alan G. and Houlsby, Guy T.. (2016) Analysis of pre-vault tunnelling interaction with buildings. Proceedings of the Institution of Civil Engineers - Geotechnical Engineering. Permanent WRAP URL: http://wrap.warwick.ac.uk/85071 Copyright and reuse: The Warwick Research Archive Portal (WRAP) makes this work by researchers of the University of Warwick available open access under the following conditions. Copyright © and all moral rights to the version of the paper presented here belong to the individual author(s) and/or other copyright owners. To the extent reasonable and practicable the material made available in WRAP has been checked for eligibility before being made available. Copies of full items can be used for personal research or study, educational, or not-for-profit purposes without prior permission or charge. Provided that the authors, title and full bibliographic details are credited, a hyperlink and/or URL is given for the original metadata page and the content is not changed in any way. Publisher’s statement: http://dx.doi.org/10.1680/jgeen.15.00176 A note on versions: The version presented here may differ from the published version or, version of record, if you wish to cite this item you are advised to consult the publisher’s version. Please see the ‘permanent WRAP URL’ above for details on accessing the published version and note that access may require a subscription. For more information, please contact the WRAP Team at: [email protected]

Bloodworth & Houlsby
1
Analysis of pre-vault tunnelling interaction with buildings
First (corresponding) author:
Alan G. Bloodworth MA MSc DIC DPhil CEng MICE
Principal Teaching Fellow in Tunnelling and Underground Space
School of Engineering
University of Warwick
Library Road
Coventry
CV4 7AL
Email: [email protected]
Second author:
Guy T. Houlsby MA DSc FREng FICE
Professor of Civil Engineering
Department of Engineering Science
University of Oxford
Parks Road
Oxford OX1 3PJ
Bloodworth & Houlsby
2
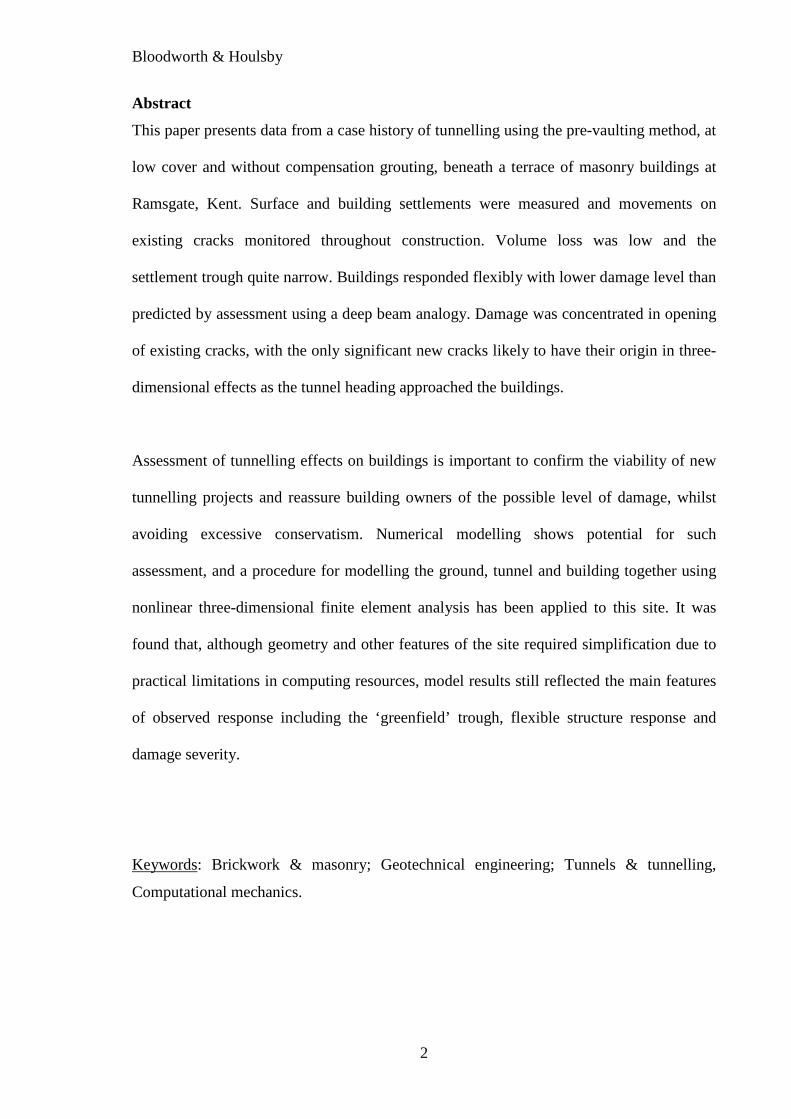
Abstract
This paper presents data from a case history of tunnelling using the pre-vaulting method, at
low cover and without compensation grouting, beneath a terrace of masonry buildings at
Ramsgate, Kent. Surface and building settlements were measured and movements on
existing cracks monitored throughout construction. Volume loss was low and the
settlement trough quite narrow. Buildings responded flexibly with lower damage level than
predicted by assessment using a deep beam analogy. Damage was concentrated in opening
of existing cracks, with the only significant new cracks likely to have their origin in three-
dimensional effects as the tunnel heading approached the buildings.
Assessment of tunnelling effects on buildings is important to confirm the viability of new
tunnelling projects and reassure building owners of the possible level of damage, whilst
avoiding excessive conservatism. Numerical modelling shows potential for such
assessment, and a procedure for modelling the ground, tunnel and building together using
nonlinear three-dimensional finite element analysis has been applied to this site. It was
found that, although geometry and other features of the site required simplification due to
practical limitations in computing resources, model results still reflected the main features
of observed response including the ‘greenfield’ trough, flexible structure response and
damage severity.
Keywords: Brickwork & masonry; Geotechnical engineering; Tunnels & tunnelling,
Computational mechanics.
Bloodworth & Houlsby
3
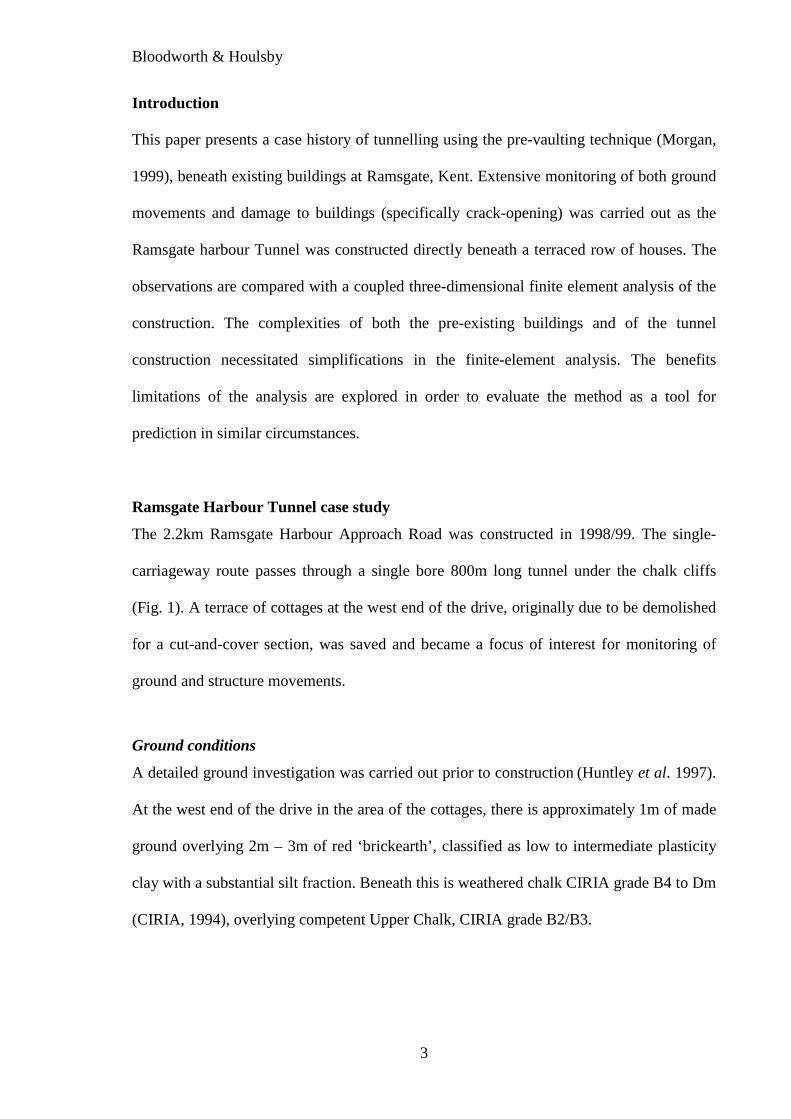
Introduction
This paper presents a case history of tunnelling using the pre-vaulting technique (Morgan,
1999), beneath existing buildings at Ramsgate, Kent. Extensive monitoring of both ground
movements and damage to buildings (specifically crack-opening) was carried out as the
Ramsgate harbour Tunnel was constructed directly beneath a terraced row of houses. The
observations are compared with a coupled three-dimensional finite element analysis of the
construction. The complexities of both the pre-existing buildings and of the tunnel
construction necessitated simplifications in the finite-element analysis. The benefits
limitations of the analysis are explored in order to evaluate the method as a tool for
prediction in similar circumstances.
Ramsgate Harbour Tunnel case study
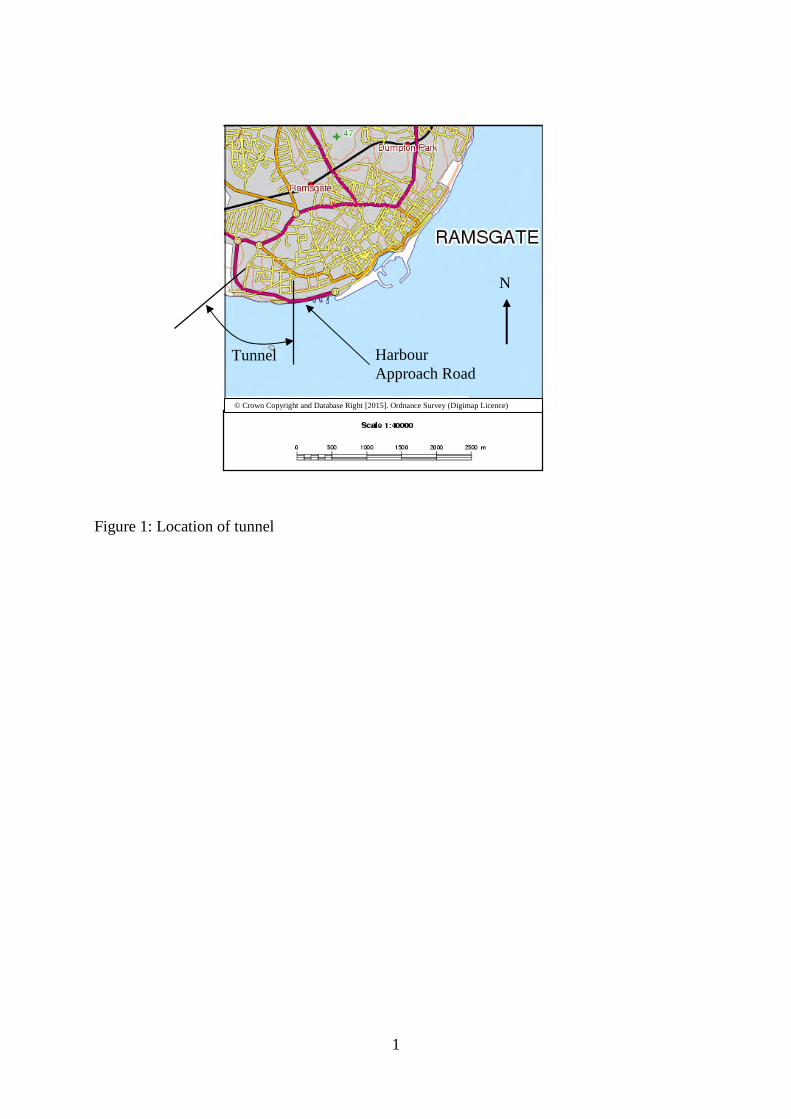
The 2.2km Ramsgate Harbour Approach Road was constructed in 1998/99. The single-
carriageway route passes through a single bore 800m long tunnel under the chalk cliffs
(Fig. 1). A terrace of cottages at the west end of the drive, originally due to be demolished
for a cut-and-cover section, was saved and became a focus of interest for monitoring of
ground and structure movements.
Ground conditions
A detailed ground investigation was carried out prior to construction (Huntley et al. 1997).
At the west end of the drive in the area of the cottages, there is approximately 1m of made
ground overlying 2m – 3m of red ‘brickearth’, classified as low to intermediate plasticity
clay with a substantial silt fraction. Beneath this is weathered chalk CIRIA grade B4 to Dm
(CIRIA, 1994), overlying competent Upper Chalk, CIRIA grade B2/B3.
Bloodworth & Houlsby
4
Ground strata encountered within the tunnel envelope are shown in Newman and Ingle
(2002). At the cottages, a buried river valley increases the depth of chalk weathering
significantly. The invert lies in competent chalk, but the crown passes through weathered to
highly weathered chalk grades Dc to Dm, classified on site as low plasticity clay. Chalk
cover over the crown is only 1m – 2m, with the brickearth and made ground overlying.
Groundwater was predicted to be present only in the invert in the deeper part of the drive,
under high tide conditions (Newman et al., 2003), and was therefore not expected to
significantly impact tunnelling operations.
Tunnel construction
The Ramsgate tunnel was the first use in the UK of the pre-vaulting method (Morgan,
1999). The tunnel is approximately 11m in diameter, with an arched profile and flat invert.
In the pre-vaulting method, a slot is cut in stages around the sides and crown of the tunnel
face and a primary lining or ‘pre-vault’ is cast by spraying concrete into the slot to provide
advanced support (Crow and Newman, 1999). The method is also known as the
‘mechanical pre-cutting method’ from its origins in Europe (Bougard, 1988; Martarèche,
2013), where it has found favour for relatively short drives at low cover and/or in variable
ground conditions. The face is temporarily reinforced with glass fibre face bolts and then
advanced using standard excavation equipment, and the flat invert slab is cast, enabling the
machine to move forward for the next construction cycle. Radial rockbolts were also
installed in the lower haunch regions. Illustrations of the full pre-vaulting sequence are
given by Newman and Ingle (2002). A secondary lining of in situ reinforced concrete is
cast later as a separate operation.
Bloodworth & Houlsby
5
The strength of the primary lining may be adjusted to suit ground conditions by varying the
pre-vault overlaps. At Ramsgate, length of advance per cycle of operations varied from
2.5m – 4.5m, with each cycle taking typically 24 hours. Greater overlaps were used in the
vicinity of the cottages.
Buildings
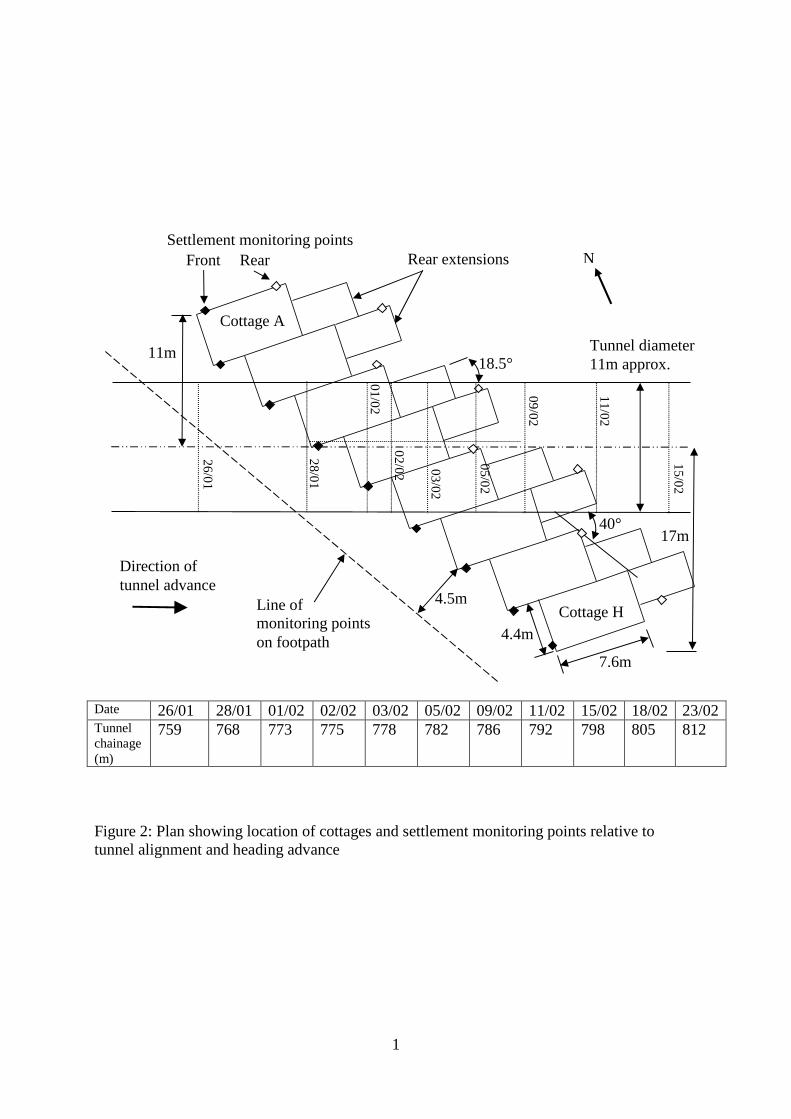
The tunnel passed at 40° skew beneath a terrace of eight cottages (Fig. 2) with a cover of
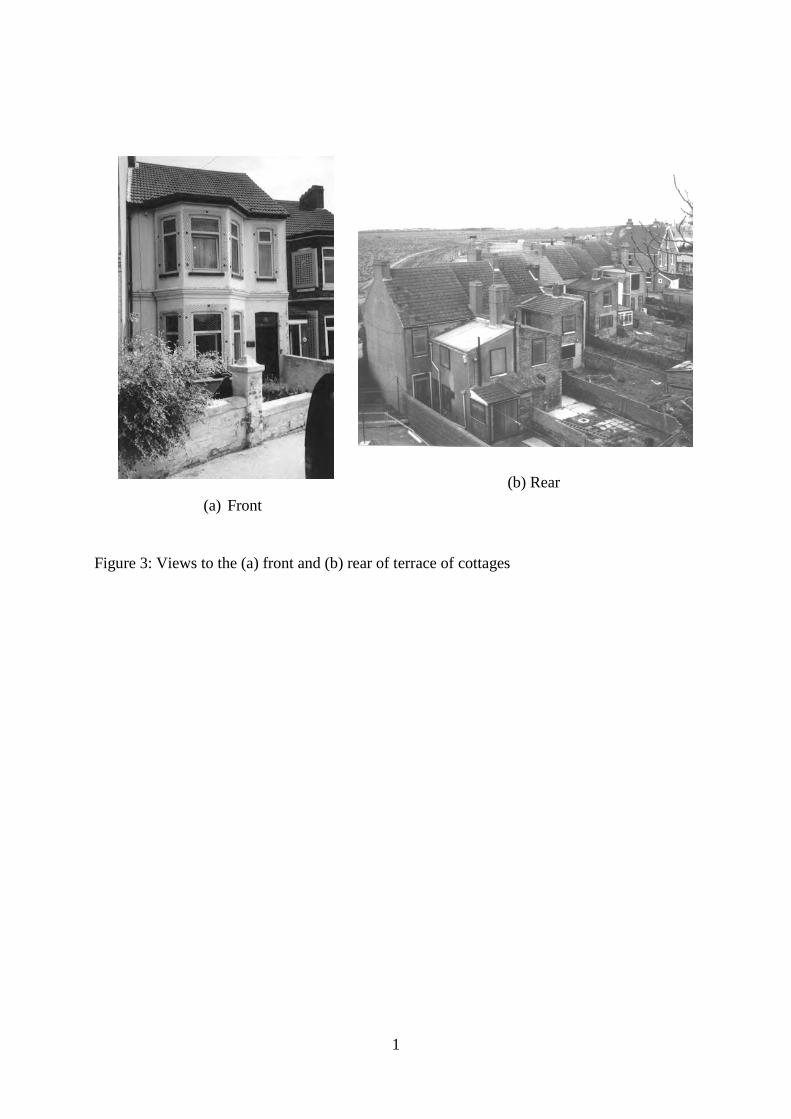
only 6m (approximately half a diameter). The cottages date from the early 1900’s and are
two-storey with no basements (Fig. 3). Each cottage has an extension wing at the back, and
is staggered relative to the next by 2m. The structural form is load-bearing brick masonry
(solid 220mm thick) on shallow strip foundations, with timber suspended floors and
ceilings. Although some alterations have taken place, the main load bearing walls – front,
rear and party walls – have been retained, along with the important openings to the front
and rear.
Structural surveys of the cottages were carried out prior to tunnel construction. The
majority were found to be in good condition, with only occasional hairline cracking.
However, cottage H at the south end was extensively cracked, due to previous ground
movements. Since it lay outside the predicted settlement trough, it was not expected to be
directly affected by the tunnelling settlements, and this was confirmed by the monitoring.
Monitoring
Transverse arrays of precise levelling points in a field to the west of the cottages gave an
indication of the ‘greenfield’ settlement response to the advancing tunnel. However, the
ground conditions in this area were distinct from those at the cottages, with loose, blocky
chalk of grades C4/C5 encountered in the crown that caused problems of localised failure
of the prevault slots, necessitating grouting to be used (Newman and Ingle, 2002). No
Bloodworth & Houlsby
6
grouting was necessary at the cottages. The settlement array most closely representing
‘greenfield’ settlements in the vicinity of the cottages was located along the footpath, about
4m in front of the cottage façades. The contractor also carried out comprehensive in-tunnel
monitoring throughout the project (Morgan, 1999; Crow and Newman, 1999).
Monitoring of the cottages was specified as part of this research project. Precise levelling
studs were grouted at each end of the party walls between cottages, to measure settlements
at the front and rear. Crack telltales were used on the larger pre-existing cracks in cottage
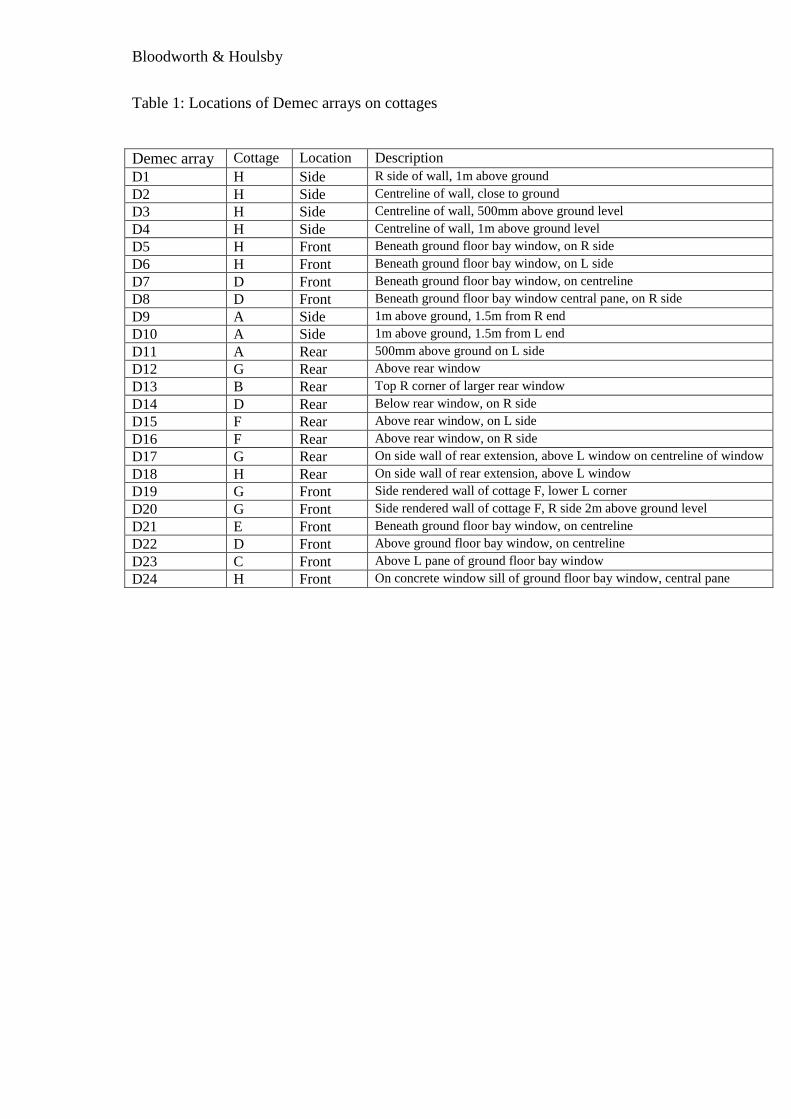
H. Demec arrays were located on smaller (typically 1 – 2mm wide) pre-existing cracks on
the external faces of other cottages, often located close to windows and doors, as detailed
in Table 1. For convenience, arrays were located no more than 2.5m above ground, but
there were no significant pre-existing cracks above this level.
A baseline survey of the instruments was carried out two months before tunnelling. Daily
monitoring began when the tunnel heading was 30m from the cottages. The face passed
under the front of the cottages 11 days later, and daily monitoring continued for a further
25 days, at which time the face had advanced to 15m beyond the southern end of the
cottages. Monitoring continued at weekly intervals for five weeks.
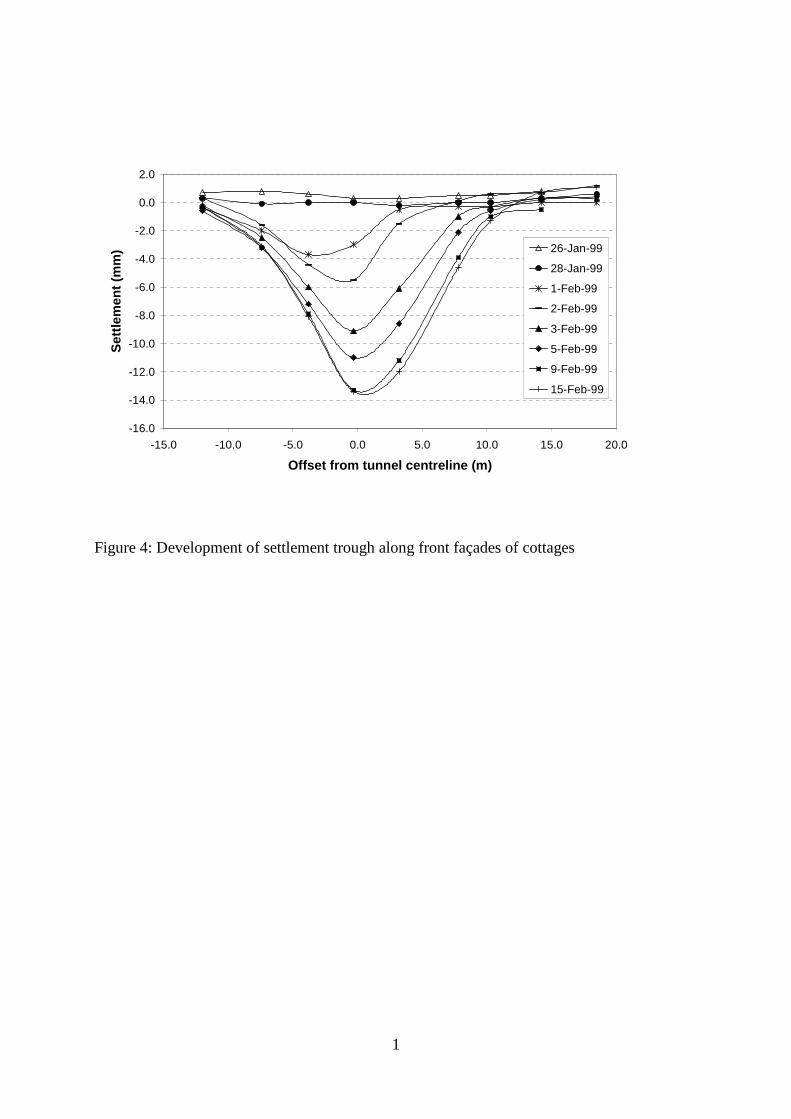
Observed settlements
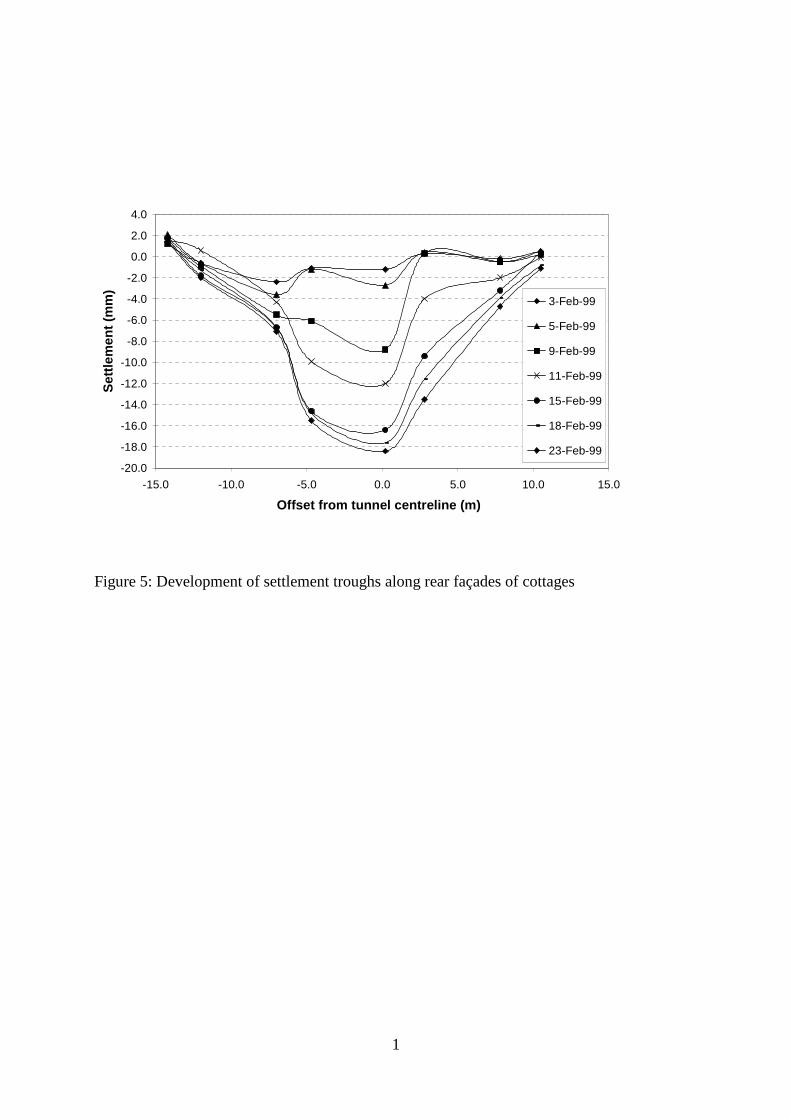
The development of the settlement troughs at the front and rear of the cottages is shown in
Figures 4 and 5, where the offset from the tunnel centreline is measured perpendicular to
the tunnel axis direction in all cases. Limiting settlements were reached after two weeks
from when settlements due to tunneling were first discernible, although the majority of
settlement occurred in the first four days.
Bloodworth & Houlsby
7
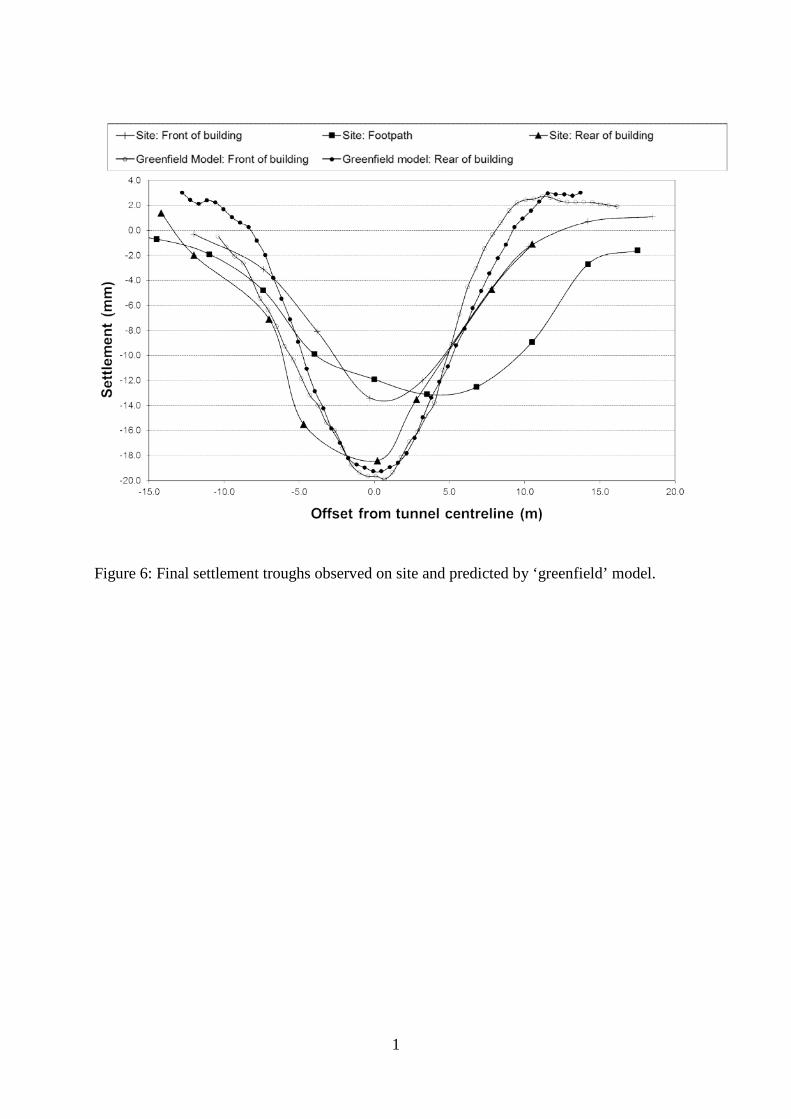
Final settlement troughs are shown in Figure 6 (including the footpath). Maximum
settlements were 12.8mm on the footpath, 13.4mm at the front of the cottages and 18.4mm
at the rear; the greater value at the rear probably due to lower chalk cover and greater depth
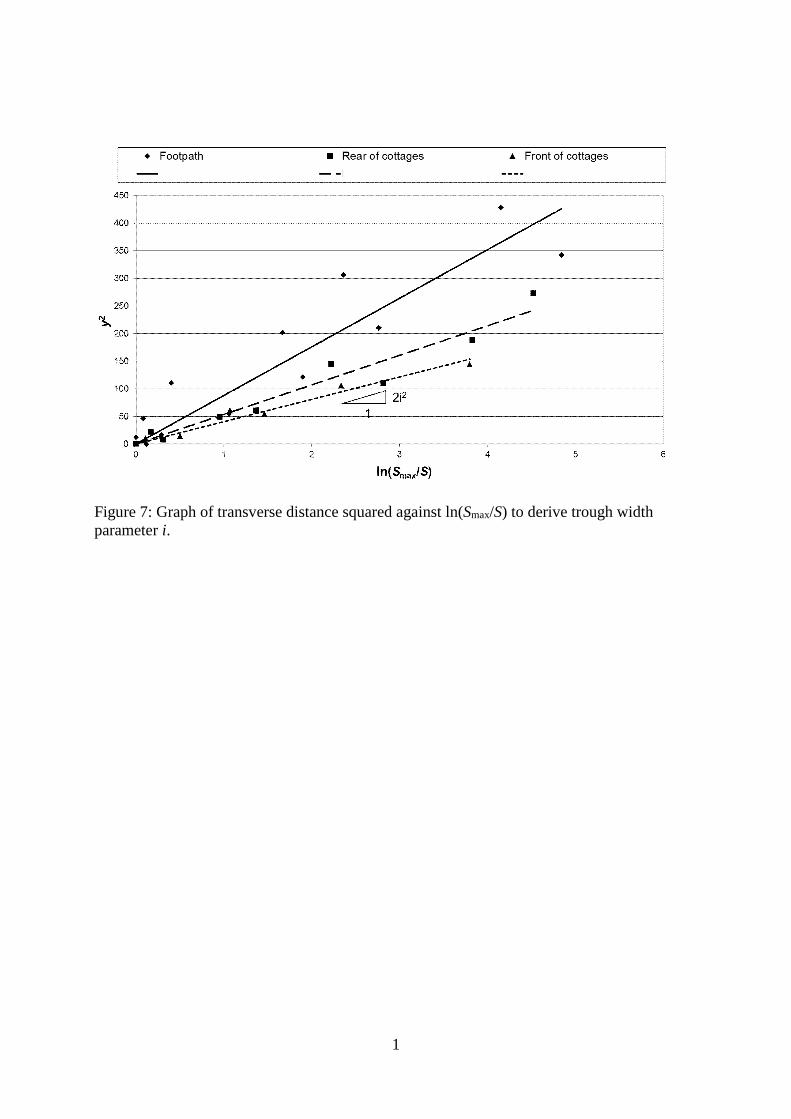
of brickearth above the tunnel. If an approximation is made to the empirical Gaussian
model for surface settlements due to tunnelling (Peck, 1969), the trough width parameter i
may be obtained from the gradient of a graph of the transverse co-ordinate from the tunnel
axis y squared against the natural logarithm of the ratio of maximum settlement Smax to
settlement S at transverse co-ordinate y. This has been done in Figure 7 which gives i equal
to 6.6m on the footpath, 4.5m at the front of the cottages and 5.2m at the rear
(perpendicular to the tunnel axis direction in all cases). Although on the footpath and at the
rear of the cottages the trough shape appears visually to deviate from the Gaussian model,
Figure 7 shows it is nevertheless still possible to approximate it as such, although scatter is
more for the footpath data.
These results suggest that the buildings responded in a relatively flexible manner, not
modifying the ‘greenfield’ trough (as represented by the footpath) significantly (Franzius
et al., 2004). Volume loss calculated from the integral of the observed troughs is 0.19% at
the footpath, 0.14% at the front of the cottages and 0.21% at the rear.
The depth z0 to the tunnel axis at the cottages is about 11m, and hence the ratio i/z0 lies in
the range 0.40 – 0.50, typical for cohesive materials. However, later in the drive, as the
tunnel advanced into competent chalk and z0 increased to over 20m, the trough width
remained almost unchanged, with i equal to approximately 5m (Fig. 5 of Crow and
Newman, 1999), and i/z0 therefore decreasing to 0.2 – a narrow trough width relative to
tunnel depth. This suggests that the origin of the settlements is at the crown of the tunnel
(rather than distributed around the cross-section as is more typical in conventional bored
Bloodworth & Houlsby
8
tunnelling) – either deflection of the primary lining at the crown or volume loss localised
in the crown region prevaults. Crown deflections of 5mm and convergence of 2 – 5mm
was recorded in the region of the cottages (Crow and Newman, 1999).
Effects on structures
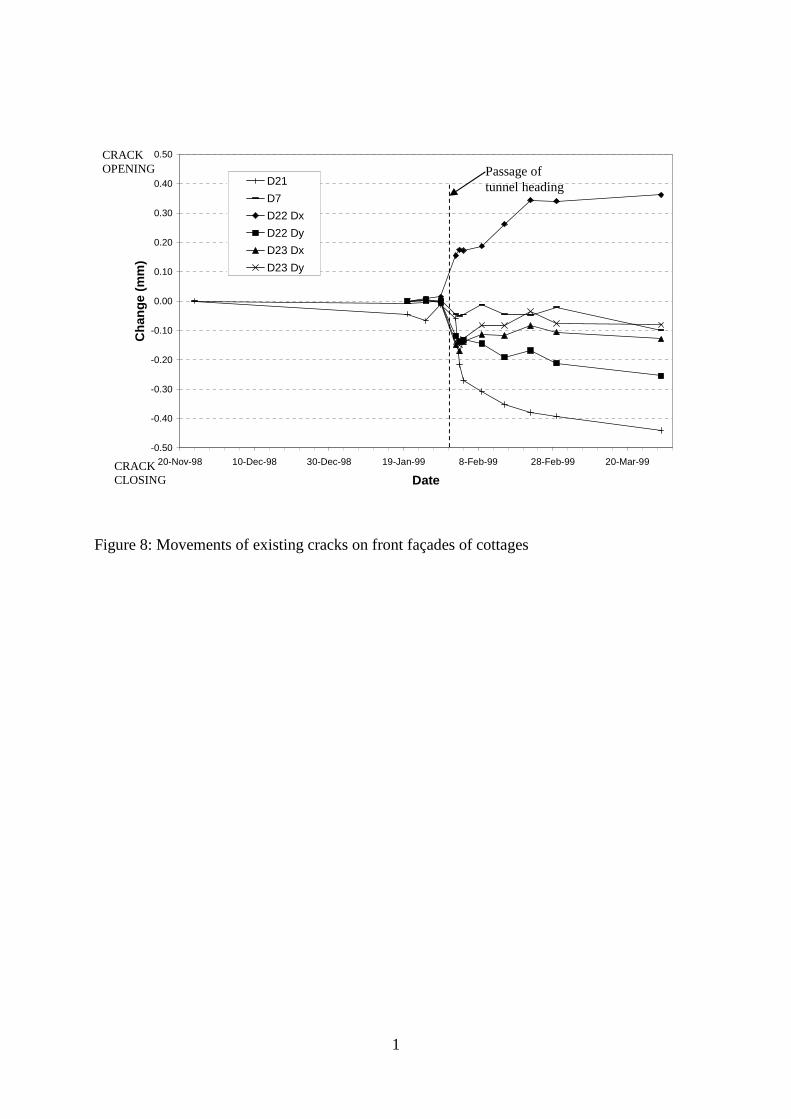
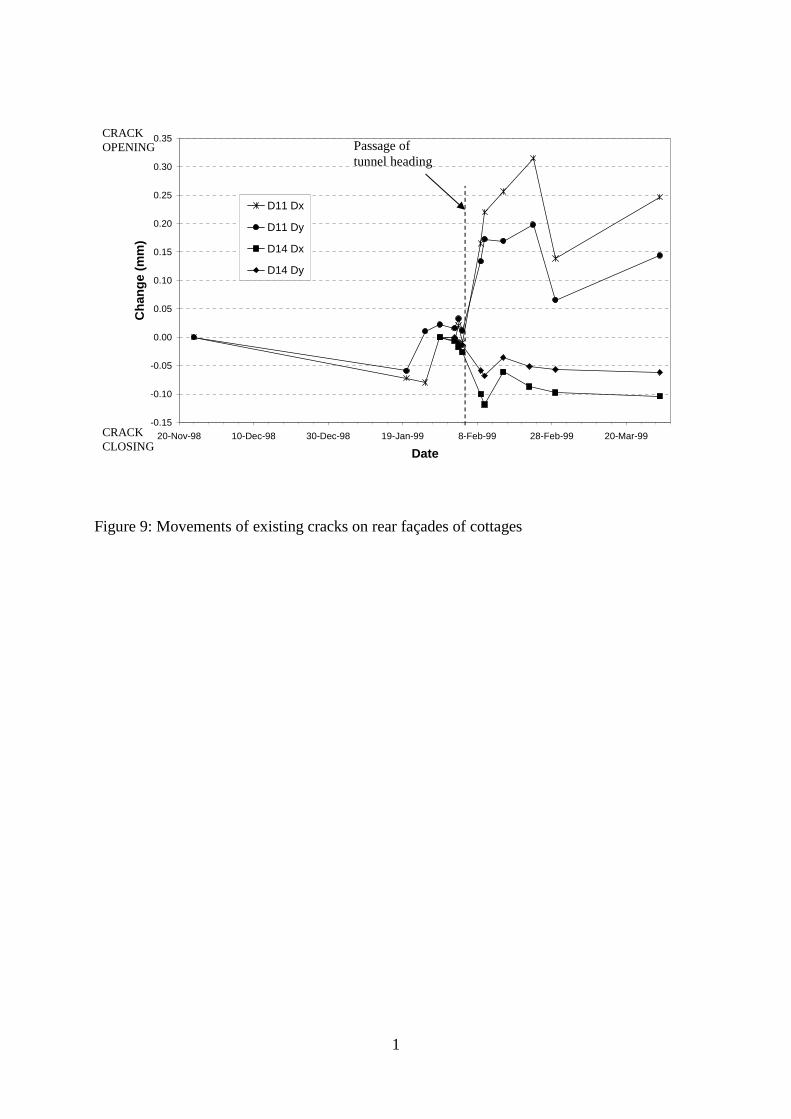
Movements on existing cracks monitored with Demec arrays on cottages A to G, where the
total movement at the end of the monitoring period was 0.05mm or greater, are shown in
Figures 8 and 9. “Dx” denotes horizontal movement and “Dy” denotes vertical movement.
Movements are strongly correlated in time with the arrival of the tunnel face on 1st
February. The magnitudes, at 0.4mm – 0.5mm, correlate with damage category “Very
Slight” according to the classification of Burland et al. (1977). Based on the observed
settlement trough, the method of Burland and Wroth (1975) predicts a higher damage
category of “Slight”.
Cracks with detectable movements are concentrated on cottages B to E, close to or over the
tunnel. Two conclusions can be drawn. The first is that small cracks in masonry buildings
may remain stable over a typical four-month period if not subjected to significant ground
movements. The second is that response of a masonry building to ground settlements
includes movements on existing cracks. Therefore, an understanding of the initially
cracked state is important.
The data show that more cracks closed up due to the tunnelling than opened further.
Location of active cracks vertically on the façades, and their position in the hogging or
sagging regions of the settlement trough, may be compared to the deep beam analogy of
building response (Burland and Wroth, 1975), which states that a building located over the
hogging region of the settlement trough will experience flexure with the neutral axis for
bending at ground level, whereas a building spanning the sagging region of the settlement
Bloodworth & Houlsby
9
trough will deform with the neutral axis at mid height of the building. However,
conclusions from this comparison with the beam analogy are not clear-cut. For example,
D11 is close to ground level in the hogging region and opened by about 0.25mm, which is
consistent with the façade acting as a deep beam with neutral axis at foundation level.
However, D21, also low down in the hogging region, closed. D14, low down in the
sagging region (where tension is expected), closed. D22, just above a ground floor window
in the sagging region (where low strain is expected), opened, but D23 at the same level in
the same region closed.
Inspection of the cottages one month after the tunnel had passed highlighted only two
significant new cracks:
(i) Internal, penetrated through party wall between C and D, on first floor towards the rear.
Vertical, typically 1.5mm wide.
(ii) Internal, in party wall between C and D, not penetrated through but only visible from
D, running vertically for most of height of stair opening, typically 1.0mm wide, maximum
2.0mm at the top.
Both these cracks are consistent with cottages C and D being subjected to greater
settlement at the rear than at the front, as supported by the observed settlement troughs
(Figs. 4 and 5).
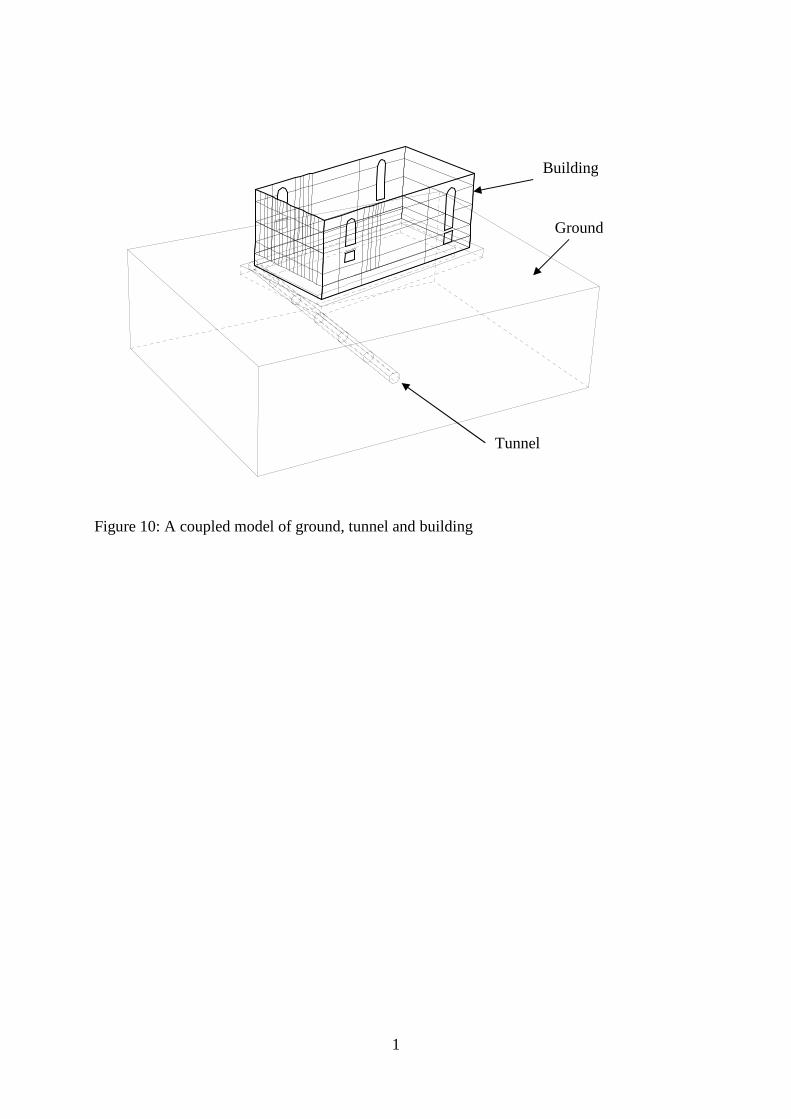
Numerical modelling of tunnel-building interaction
Three-dimensional finite element modelling procedures have been developed to predict the
effects of tunnelling on surface structures, in which the ground, tunnelling process and
building are all included in a ‘coupled’ model (Fig. 10). This is an advance on assessment
techniques that apply ‘greenfield’ settlements to a model of the building alone, many of
which fail to capture the influence of the building weight and stiffness in modifying the
Bloodworth & Houlsby
10
ground movements (Farrell et al., 2014). These interaction effects have been shown to be
significant in cases such as the Jubilee Line Extension (Burland et al., 2001). Although
modelling in three dimensions requires considerably greater computing resources, it is
necessary to represent adequately most real sites (Mair, 1993), as a tunnel and buildings
may be arranged in any orientation and plane strain analysis may involve unacceptable
oversimplification.
The procedures were initially demonstrated by idealised example analyses of a shallow
tunnel in clay soil beneath a masonry building (Burd et al., 2000). These showed that the
stiffness of the building smoothed the settlement trough, reducing differential settlements
and damage compared to simplified methods that apply ‘greenfield’ settlements to the
building. The importance of building weight in causing increased settlements locally
beneath the building was also shown, as noted by others (e.g. Mroueh and Shahrour, 2002;
Franzius et al., 2004). Building geometry relative to the tunnel and distribution of stiffness
within the building (e.g. presence of significant openings in the walls) was found to
influence the response and damage more than absolute value of building stiffness.
The modelling procedures were then verified against case history data from three sites
(Bloodworth, 2002): A shaft close to a masonry church (Bloodworth and Houlsby, 2000),
Ramsgate Harbour tunnel and a pedestrian tunnel beneath the Mansion House, London
(Frischmann et al., 1994). These sites were chosen because no intervention measures such
as compensation grouting had been used. Inclusion of compensation grouting has been
considered in a parallel project (Wisser et al., 2001).
The procedures have application both in enabling better understanding of mechanisms of
response of masonry buildings to tunnelling, and potentially as a design tool when a
Bloodworth & Houlsby
11
building fails the initial stage of assessment in which the ‘greenfield’ settlement profile is
imposed on a structural model of the building (Mair et al., 1996). This paper aims to
demonstrate how an analyst could apply the procedures in practice, in which one of the
main challenges is to identify appropriate simplifying assumptions whilst retaining the
essential core of the analytical methods.
Modelling procedures
Details of the procedures, which were implemented in the Oxford in-house program
OXFEM, are given by Burd et al. (2000). The main features are:
1. Tunnel excavation is modelled explicitly by removing soil elements and activating
elements to model a tunnel lining.
2. Ground is modelled by tetrahedral solid elements, in an unstructured mesh that allows
greater refinement close to the building and tunnel and also can accommodate awkward
and skewed geometry.
3. The tunnel lining may be either shell elements, of an overlapping facetted type that are
compatible with solid elements (Phaal and Calladine, 1992), or thin continuum elements
(Augarde and Burd, 2001). In this case study, shell elements were used.
4. Volume loss is modelled by artificially shrinking the lining in the circumferential
direction by specified strain. Because lining stiffness is high relative to the surrounding
soil, soil restraint to this shrinkage is not significant, so that volume loss may be controlled
by this method. For example, 1% shrinkage strain imposed on the whole lining causes 2%
reduction in tunnel cross-sectional area, modelling 2% volume loss. Stresses in the vicinity
of the tunnel will be unrealistic, but ground movements away from the tunnel are
calculated satisfactorily.
Bloodworth & Houlsby
12
5. The masonry building is modelled as a series of connected façades. Lighter, more
flexible elements such as floors and roof are neglected. Walls are modelled by plane stress
elements and are tied together and to the ground using displacement constraints,
implemented as independent ‘tie’ elements (Houlsby et al., 2000). An alternative approach
in which facades are modelled as beams with equivalent stiffness tied to the ground has
also been demonstrated (Pickhaver et al., 2010).
6. Constitutive models for the ground and building reproduce the material behaviour
relevant to the problem.
7. For stiff undrained clay, a multi-surface plasticity model is used (Houlsby, 1999)
reflecting higher stiffness of soil observed at very small strains. In principle any model
capable of representing small strain pre-failure behaviour of soil could be used, subject to
verification.
8. Masonry is modelled as an elastic no-tension material, i.e. with a low tensile strength
and infinite compressive strength, using a smeared cracking approach. If the minor
principal strain becomes tensile at an integration point, a crack is deemed to have formed
perpendicular to this strain, and the material stiffness perpendicular to the crack is reduced
sharply to small nominal value. The direction of the crack does not change with subsequent
loading. The component perpendicular to the crack of any subsequent strain taking place is
output as the ‘cracking strain’, and used as a measure of damage severity, analogous to the
use of maximum tensile strain in an elastic model of a building subjected to ‘greenfield’
settlements (Burland and Wroth, 1975; Boscardin and Cording, 1989).
Modelling strategy and assumptions
Overview
A reasonable understanding of the ‘greenfield’ settlement response of the ground was
obtained at Ramsgate. The first priority in numerical modelling was to reproduce this
Bloodworth & Houlsby
13
‘greenfield’ behaviour. Buildings were then added to form the coupled model. Emphasis
was placed on studying the response of the terrace of cottages as a whole.
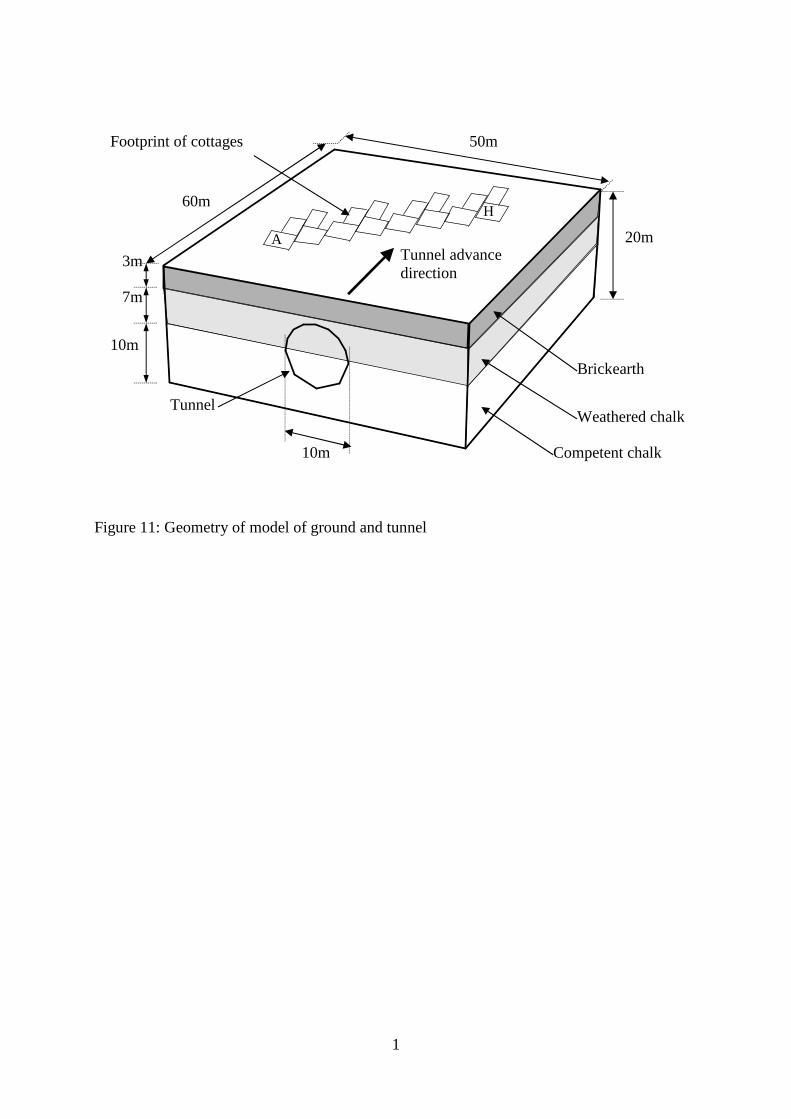
Ground
To model the site, simplifications in the geometry were made. A 2m level difference along
the terrace was neglected, and strata thicknesses and tunnel axis level taken as those at the
intersection of the tunnel axis and the longitudinal centreline of the cottages. The top
surface of the model was set at foundation level of the cottages, 600mm below ground
level, and 12kN/m2 surcharge applied to model self-weight of the soil above. Model
boundaries were set outside the zones of influence of both the tunnel and buildings, whilst
economising as much as possible on the size of the analysis (Fig. 11), by setting vertical
boundaries outside lines marking the intersections of 45° planes extending outwards from
the building footprint with the horizontal plane at tunnel springing level. Ground below the
tunnel invert was relatively stiff and not expected to displace significantly, and therefore a
shallow model depth of 20m was used.
Properties for the main soil strata were obtained from the geotechnical interpretative report
for the construction project. Brickearth was classified as low to intermediate plasticity silty
clay, with a coefficient of consolidation of 2m2/yr – 6m2/yr from oedometer tests.
Calculations indicated that assuming undrained behaviour during short-term tunnelling
settlements was reasonable, as confirmed on site where a number of trenches for service
diversions remained stable. Hand vane tests gave an average undrained strength su of
60kPa, and surface wave geophysics indicated the shear modulus G increasing at a rate of
60MPa per metre depth, i.e. with an average value of 90MPa in the 3m thickness.
The weathered chalk was also classified as stiff clay, although little testing was carried out
specifically on this material. As a first approximation, it was assumed to have properties
Bloodworth & Houlsby
14
intermediate between the brickearth and Upper Chalk (the latter having been extensively
tested), with G increasing with depth at 80MPa/m and su at 40kPa/m. The multi-surface
plasticity model was regarded as suitable for modelling both brickearth and weathered
chalk.
The Upper Chalk was classified as a jointed rock, with su in the range 1000 – 1500kPa.
Because it lies below tunnel springing level, it was expected to have less influence on the
ground movements than the other strata and so to simplify the model, an elastic
constitutive model was used. Shear modulus G was taken increasing with depth at
125MPa/m from a value of 650MPa at the top of the Upper Chalk, to be consistent with
pressuremeter data indicating stiffness of around 1400MPa at 16m below ground level.
Appendix A gives details of the parameters used in the multi-surface plasticity model for
the weathered clay and brickearth, and shows a simplifying assumption in which the
profiles of strength and stiffness with depth for these two materials were combined.
In situ stresses were measured only in the Upper Chalk, by means of pressuremeters.
Significant variability was found, with K0 closest to the cottages ranging from 0.59 – 1.82.
Values towards the lower end of this range were expected at the cottages due to the depth
of weathering of the chalk. In the model, the soil was allowed to settle under its own self-
weight prior to tunnel excavation, causing initial K0 to be approximately 1.0.
Tunnel
The tunnel was modelled as straight, level and parallel to the sides of the ground block.
Tunnel cross-section was approximated as a regular polygon, with eight segments above
springing level and four below (Fig. 11), enabling the facetted shell elements to be used for
Bloodworth & Houlsby
15
the lining. High stiffness (5x10⁶GPa) was used for the lining to guarantee numerical
stability.
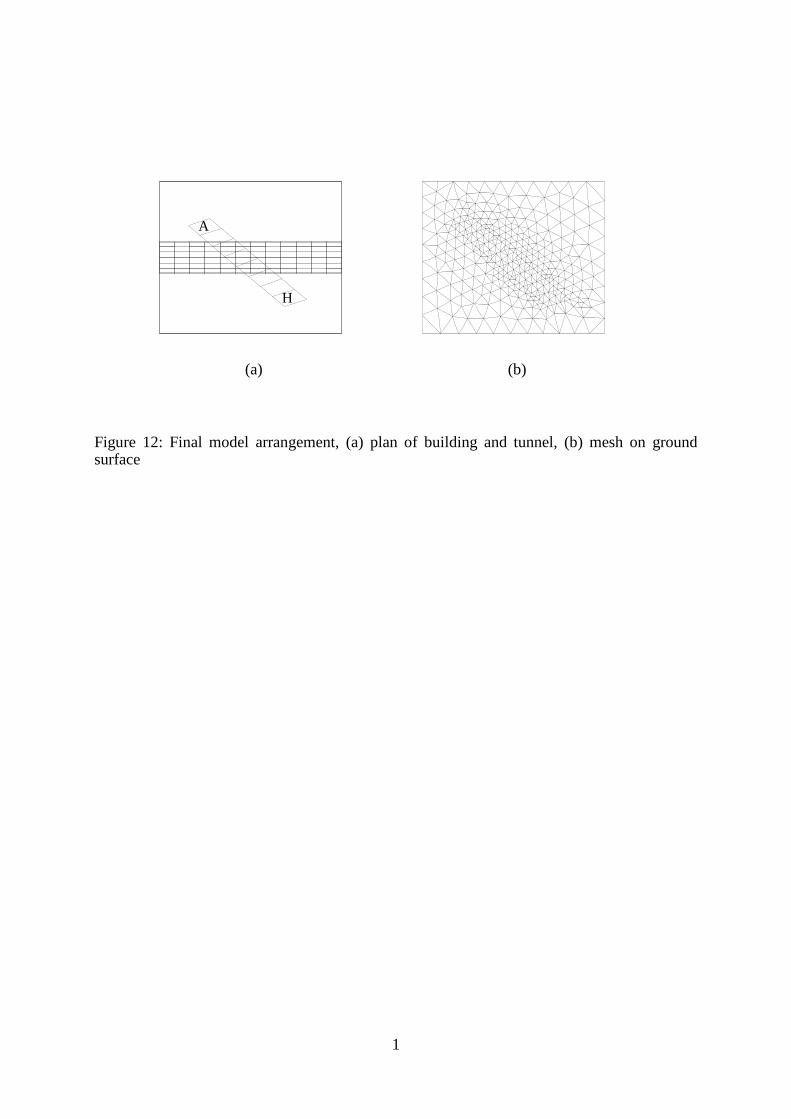
Buildings
The cottages were initially modelled as a staggered terrace in plan. It was decided at an
early stage to neglect the rear extensions, because their effect on the transverse settlement
behaviour of the terrace as a whole was thought to be small. This reduced the number of
degrees-of-freedom in the model significantly. The plan layout of the main load-bearing
walls of the cottages was further simplified to that shown in Figure 12. Walls were
modelled using the elastic, no-tension constitutive model, with a self-weight of 20kN/m3
and a Young’s modulus of 2GPa. More details on the stress-strain relationship and
parameters for the masonry model are given in Appendix B.
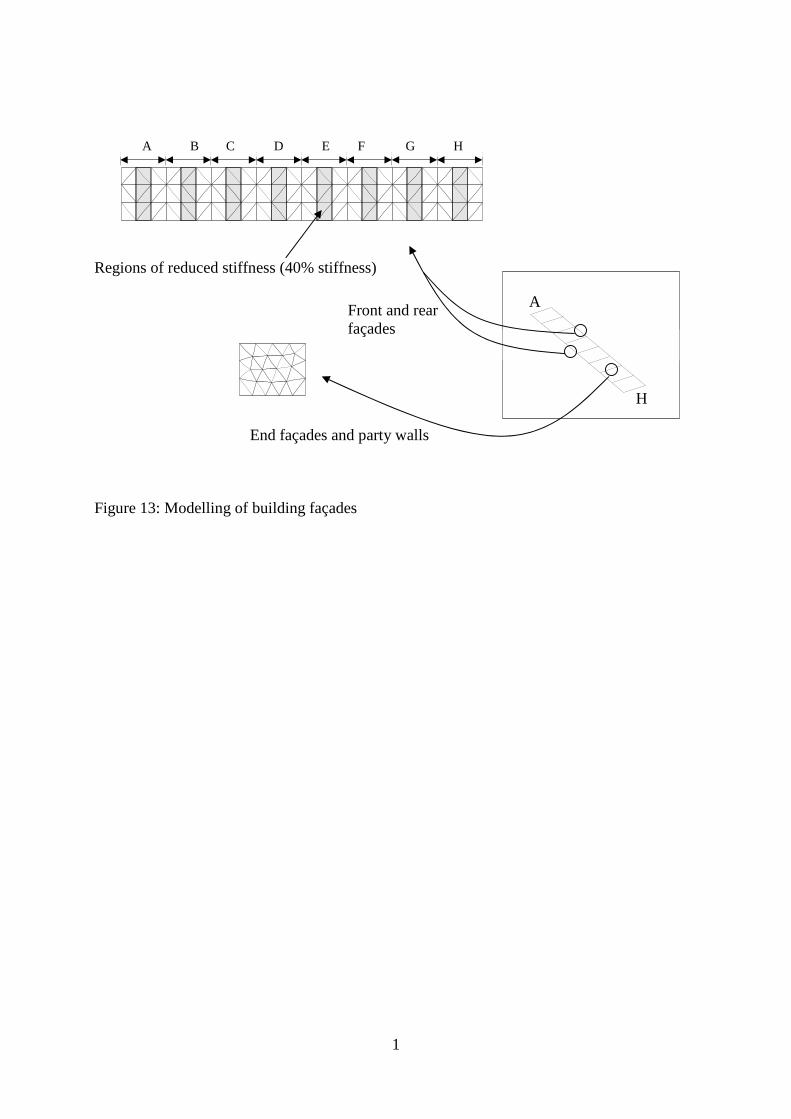
Previous research had shown the significance of openings, such as doors and windows. In
the Maddox Street analyses (Bloodworth and Houlsby, 2000) openings were large and
played an important role in initiating damage in a building that did not span across the
whole settlement trough but was positioned in the hogging region. However, at Ramsgate
the buildings spanned the entire trough and openings were more uniformly distributed.
Thus, individual openings were expected to have less impact on global building behaviour
than at Maddox Street. The main openings in the front and rear facades were represented as
vertical regions or ‘columns’ of reduced stiffness, following the approach taken in
Bloodworth and Houlsby (2000) as shown in Figure 13 (where 40% is chosen as the
approximate percentage of solid façade remaining above and below the openings). This is
similar to the concept used by Simpson (1994), although in his case rows of openings were
modelled as horizontal ‘strata’ of reduced stiffness. Vertical ‘columns’ were regarded as
more appropriate in this case because of the aspect ratio of the main window openings
Bloodworth & Houlsby
16
being deeper than their width and with very little masonry present across the top (Figure
3(a)).
Overview of analyses
The strategy was to analyse a ‘greenfield’ model (i.e. without the building) first and verify
this against the ‘greenfield’ settlement trough recorded on site. The building was then
introduced and a series of coupled analyses carried out. The ability of the models to
reproduce the global behaviour and the amount and distribution of damage to the façades
was examined.
In the analysis the tunnel was excavated in a single stage. Provision was made for the
tunnel to be excavated incrementally, although this was not exploited at the time of the
study due to significantly longer run times. The study focussed therefore on modelling the
final condition of the ground and buildings after all tunnelling was complete.
‘Greenfield’ analyses
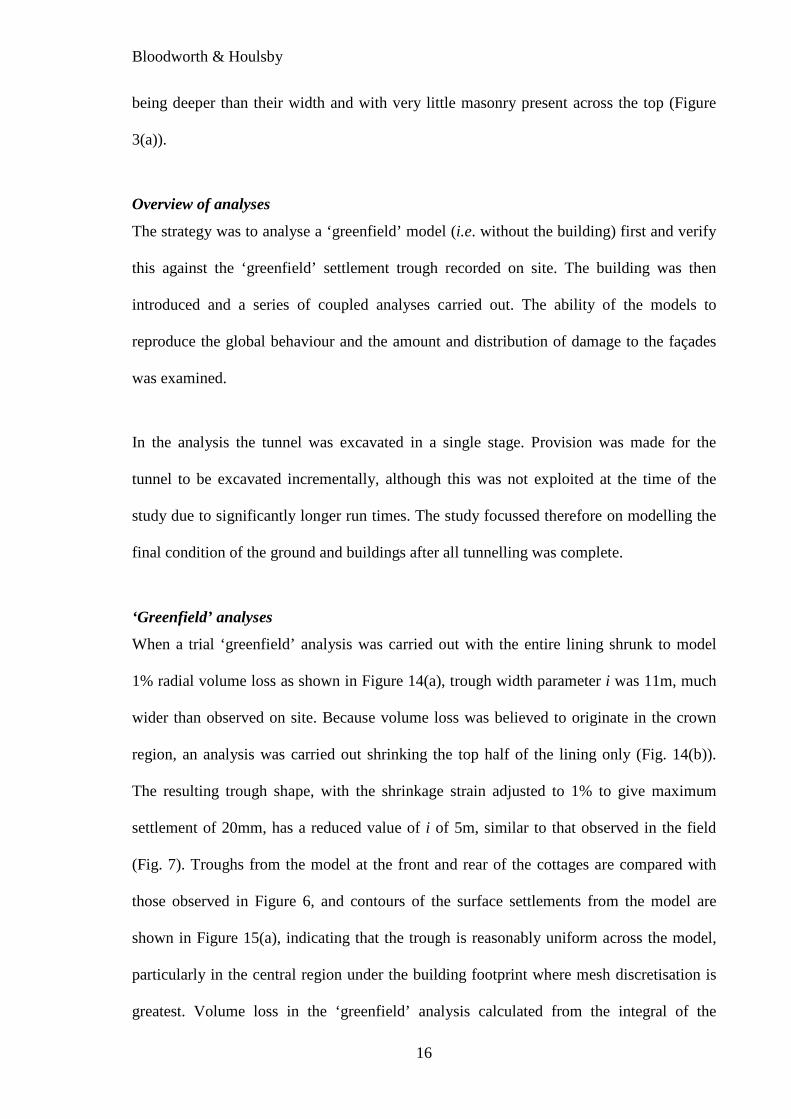
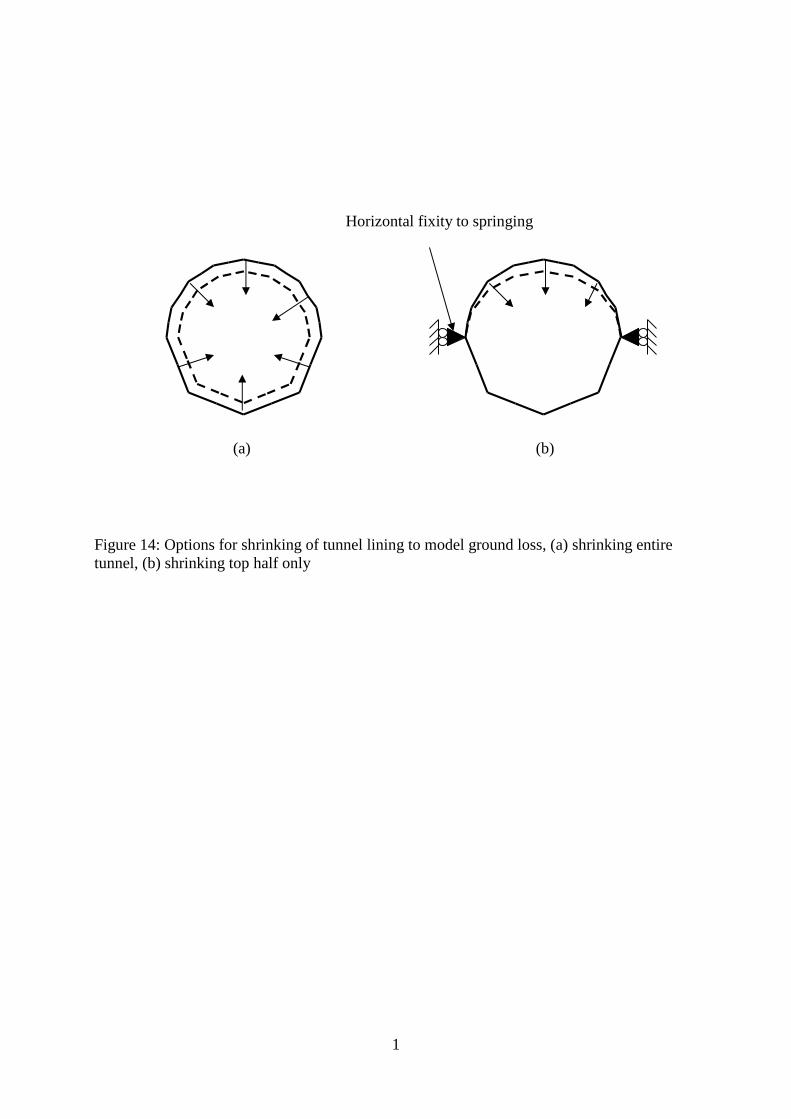
When a trial ‘greenfield’ analysis was carried out with the entire lining shrunk to model
1% radial volume loss as shown in Figure 14(a), trough width parameter i was 11m, much
wider than observed on site. Because volume loss was believed to originate in the crown
region, an analysis was carried out shrinking the top half of the lining only (Fig. 14(b)).
The resulting trough shape, with the shrinkage strain adjusted to 1% to give maximum
settlement of 20mm, has a reduced value of i of 5m, similar to that observed in the field
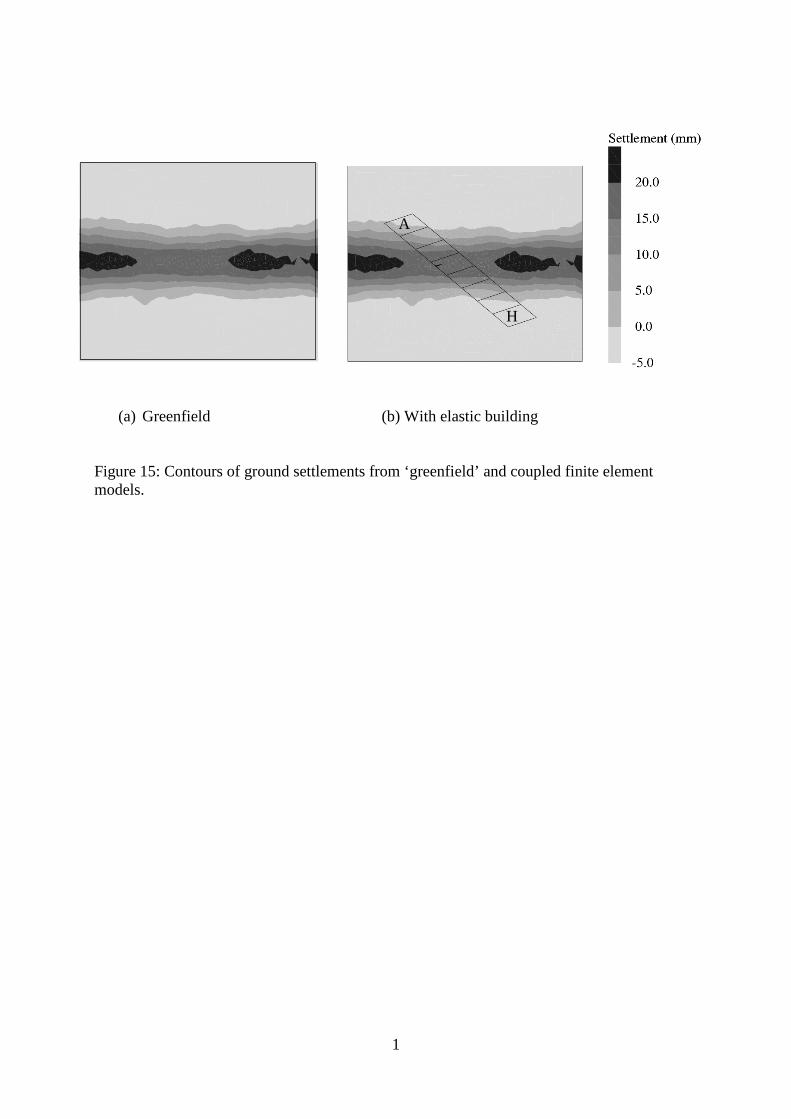
(Fig. 7). Troughs from the model at the front and rear of the cottages are compared with
those observed in Figure 6, and contours of the surface settlements from the model are
shown in Figure 15(a), indicating that the trough is reasonably uniform across the model,
particularly in the central region under the building footprint where mesh discretisation is
greatest. Volume loss in the ‘greenfield’ analysis calculated from the integral of the
Bloodworth & Houlsby
17
settlement troughs shown in Figure 6 is 0.21% at the front of the cottages and 0.20% at the
rear, which is similar to the site observations.
When the top half only of the lining was shrunk, horizontal fixity was introduced at
springing level as shown in Figure 14(b) to ensure the desired distorted shape with top half
lining shrinkage was indeed achieved. The presence of this fixity virtually eliminated any
lining movement below springing level. This was felt to be an acceptable approximation,
given the presence of competent chalk in the lower half of the heading and rockbolting in
the haunch areas.
Coupled analyses including building
Analyses were carried out to examine the influence of internal party walls and openings
and compare masonry and elastic material models for the building, as summarised in Table
2.
The elastic analysis with the party walls, C4, would be expected to exhibit the stiffest
building response. Even in this model, however, ground settlements were not modified
significantly compared to the ‘greenfield’ case (Fig. 15(b)), indicating that the long and not
very tall terrace is relatively flexible in longitudinal bending.
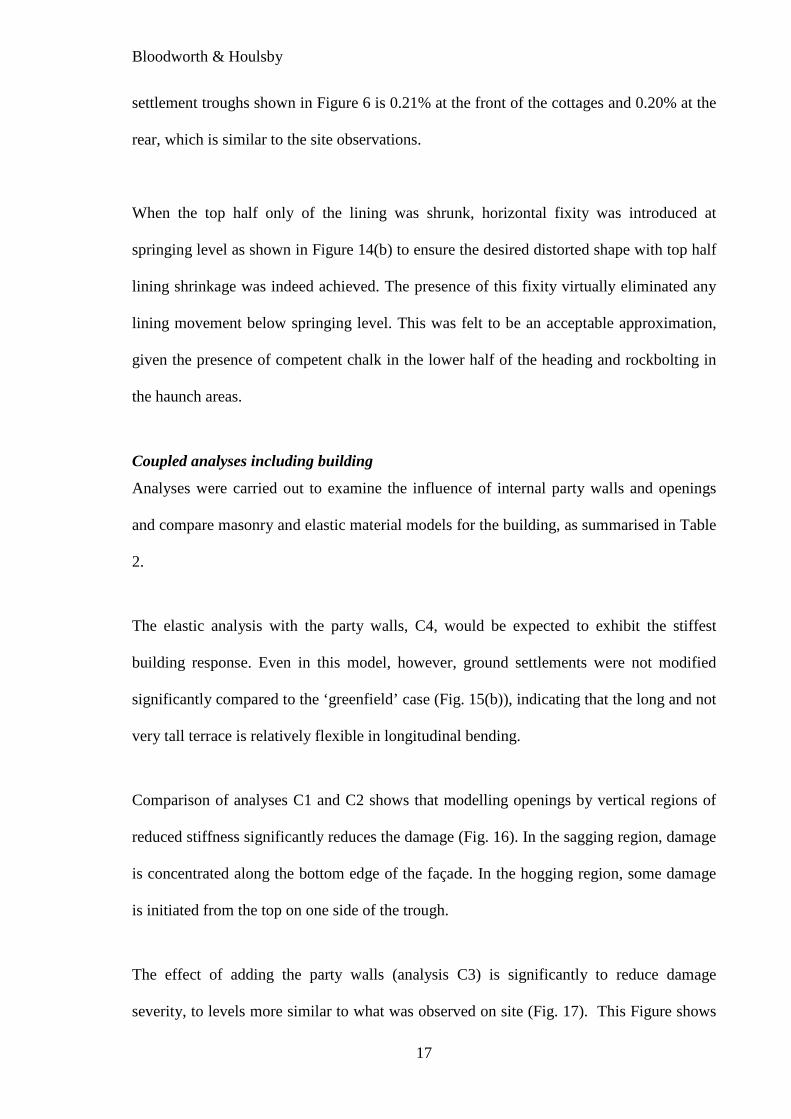
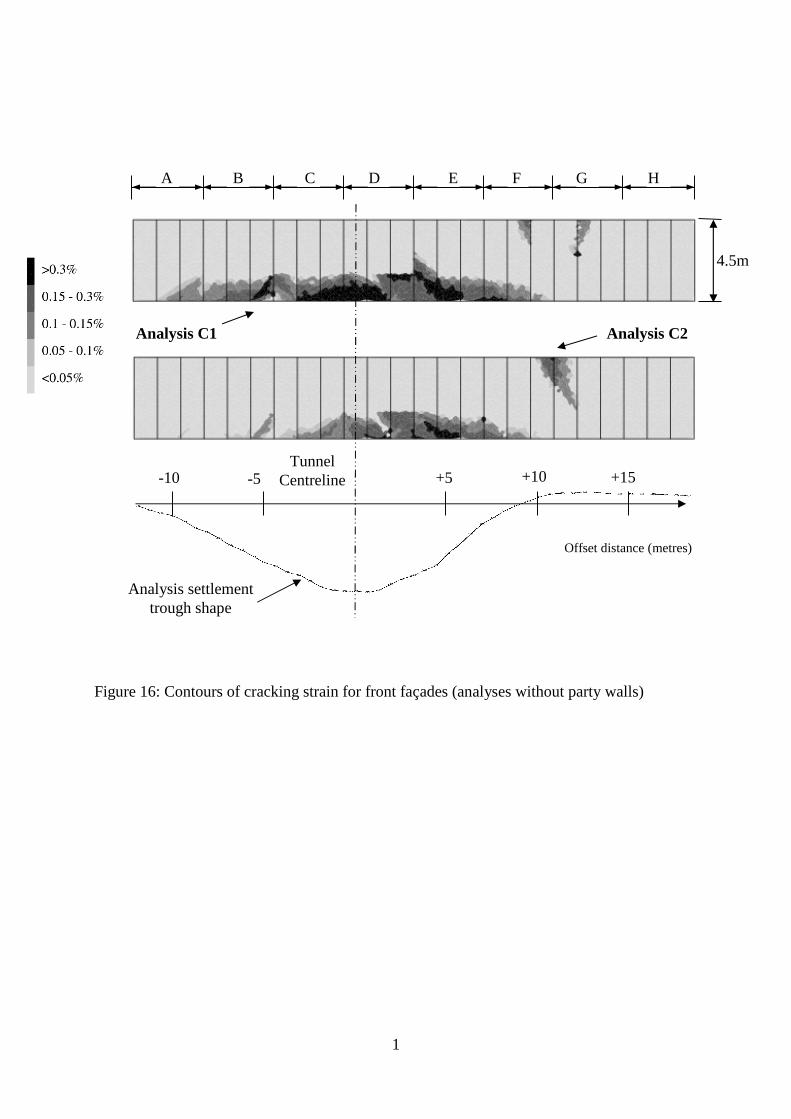
Comparison of analyses C1 and C2 shows that modelling openings by vertical regions of
reduced stiffness significantly reduces the damage (Fig. 16). In the sagging region, damage
is concentrated along the bottom edge of the façade. In the hogging region, some damage
is initiated from the top on one side of the trough.
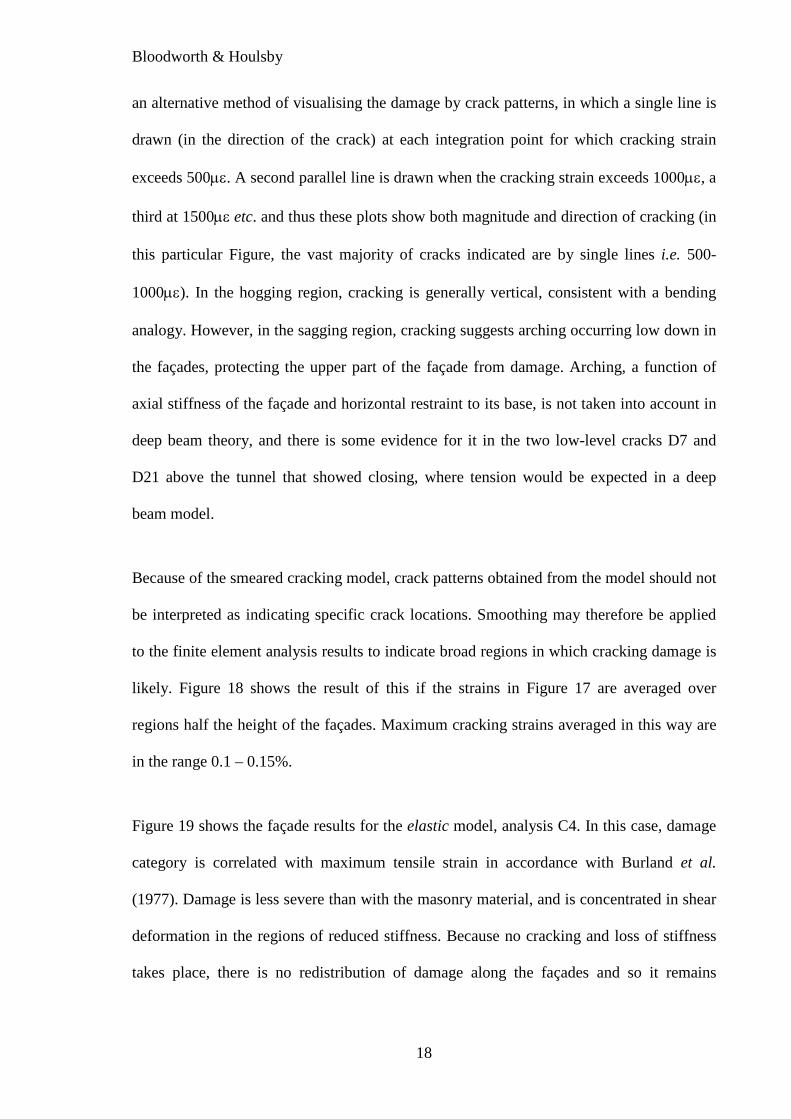
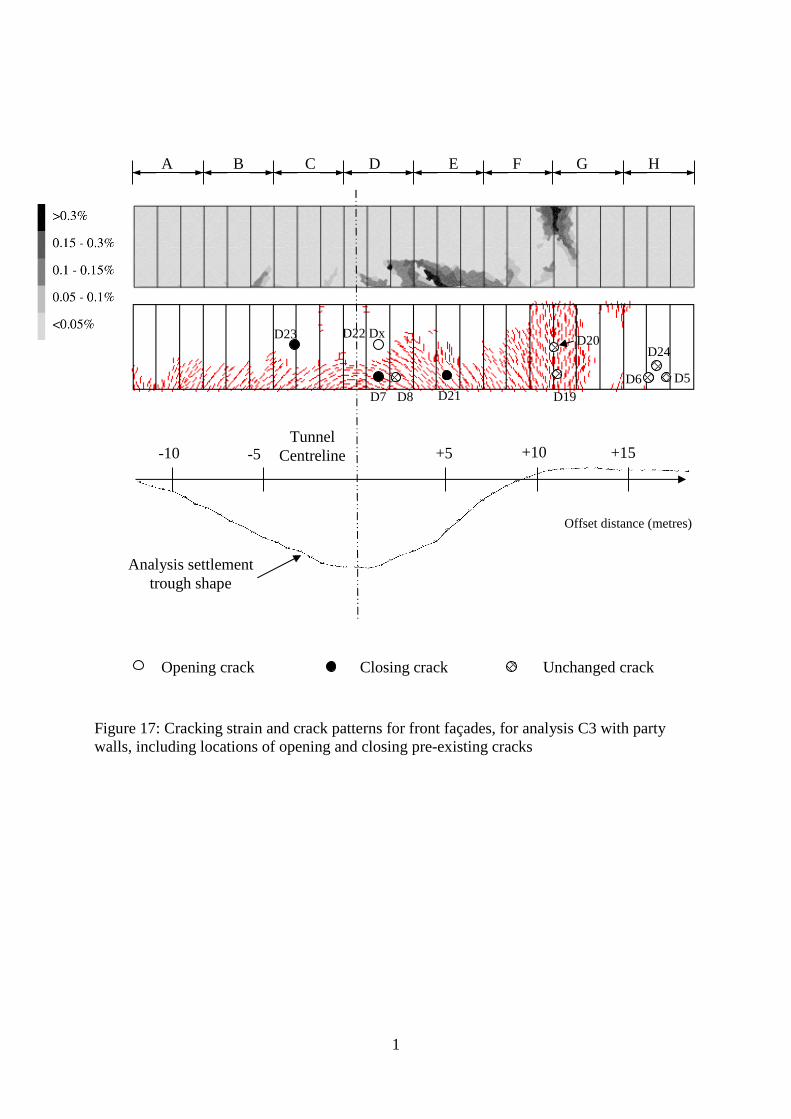
The effect of adding the party walls (analysis C3) is significantly to reduce damage
severity, to levels more similar to what was observed on site (Fig. 17). This Figure shows
Bloodworth & Houlsby
18
an alternative method of visualising the damage by crack patterns, in which a single line is
drawn (in the direction of the crack) at each integration point for which cracking strain
exceeds 500µε. A second parallel line is drawn when the cracking strain exceeds 1000µε, a
third at 1500µε etc. and thus these plots show both magnitude and direction of cracking (in
this particular Figure, the vast majority of cracks indicated are by single lines i.e. 500-
1000µε). In the hogging region, cracking is generally vertical, consistent with a bending
analogy. However, in the sagging region, cracking suggests arching occurring low down in
the façades, protecting the upper part of the façade from damage. Arching, a function of
axial stiffness of the façade and horizontal restraint to its base, is not taken into account in
deep beam theory, and there is some evidence for it in the two low-level cracks D7 and
D21 above the tunnel that showed closing, where tension would be expected in a deep
beam model.
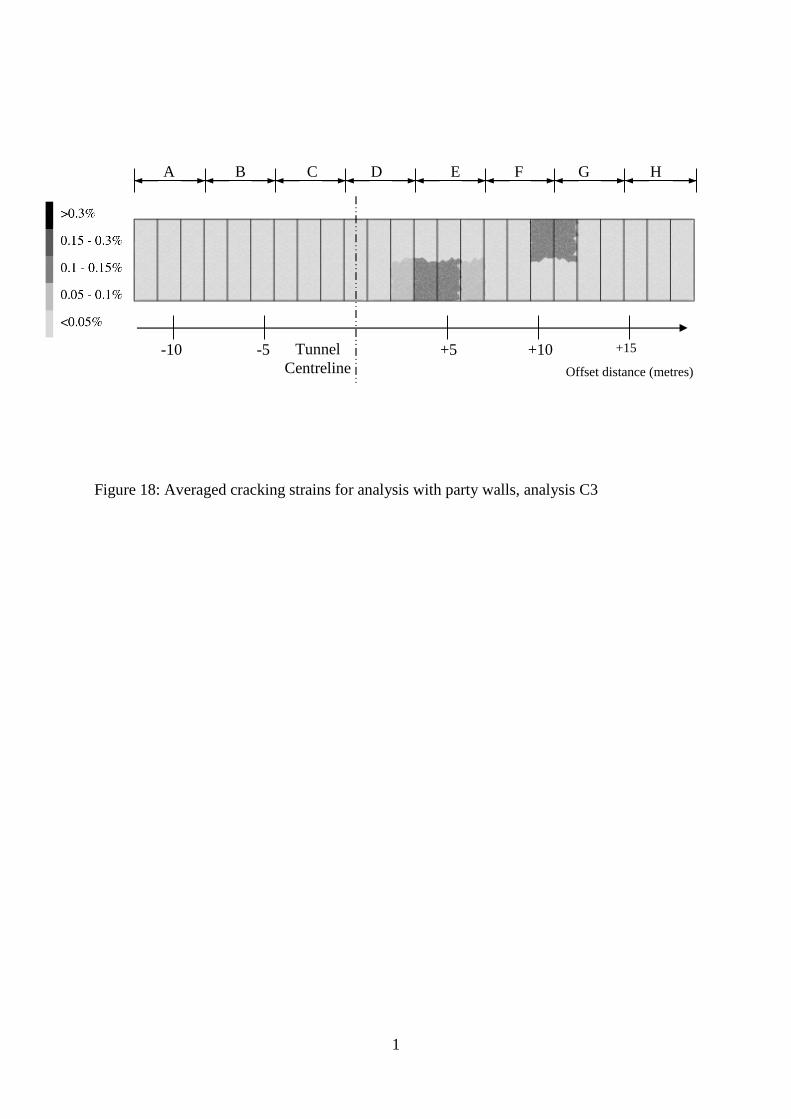
Because of the smeared cracking model, crack patterns obtained from the model should not
be interpreted as indicating specific crack locations. Smoothing may therefore be applied
to the finite element analysis results to indicate broad regions in which cracking damage is
likely. Figure 18 shows the result of this if the strains in Figure 17 are averaged over
regions half the height of the façades. Maximum cracking strains averaged in this way are
in the range 0.1 – 0.15%.
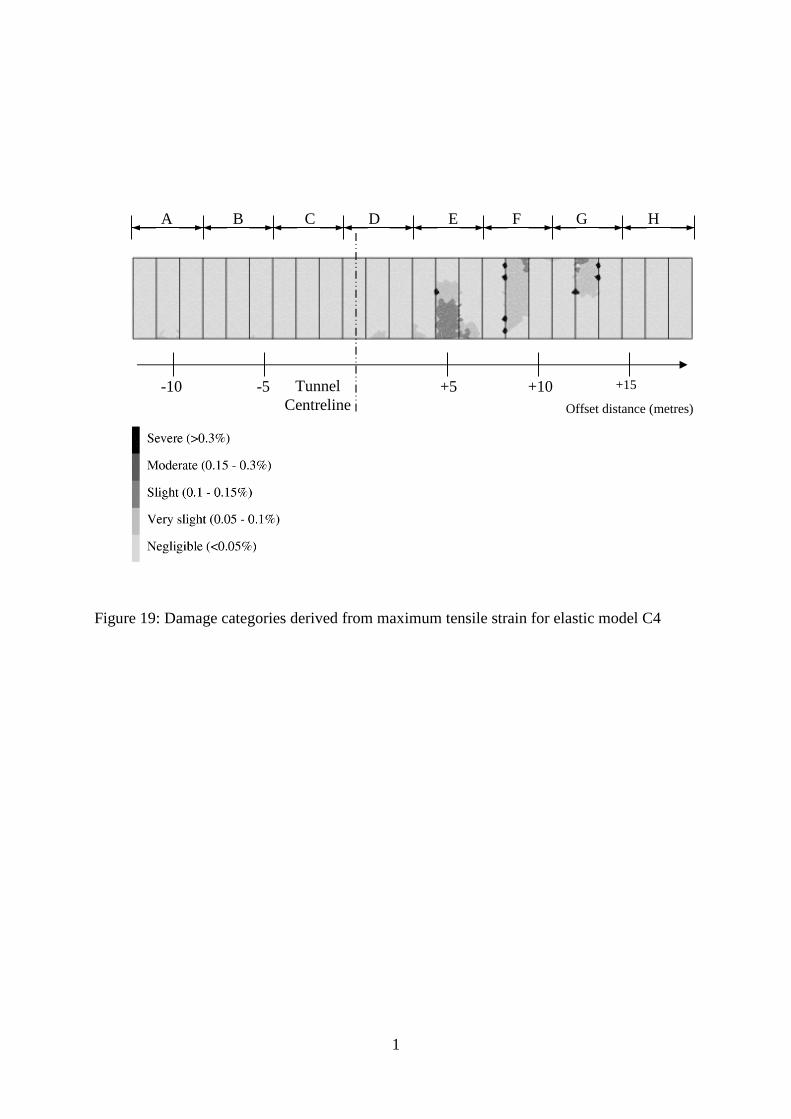
Figure 19 shows the façade results for the elastic model, analysis C4. In this case, damage
category is correlated with maximum tensile strain in accordance with Burland et al.
(1977). Damage is less severe than with the masonry material, and is concentrated in shear
deformation in the regions of reduced stiffness. Because no cracking and loss of stiffness
takes place, there is no redistribution of damage along the façades and so it remains
Bloodworth & Houlsby
19
concentrated close to the tunnel axis. This agrees less well than the masonry model results
with the distribution of movements observed on existing cracks on site.
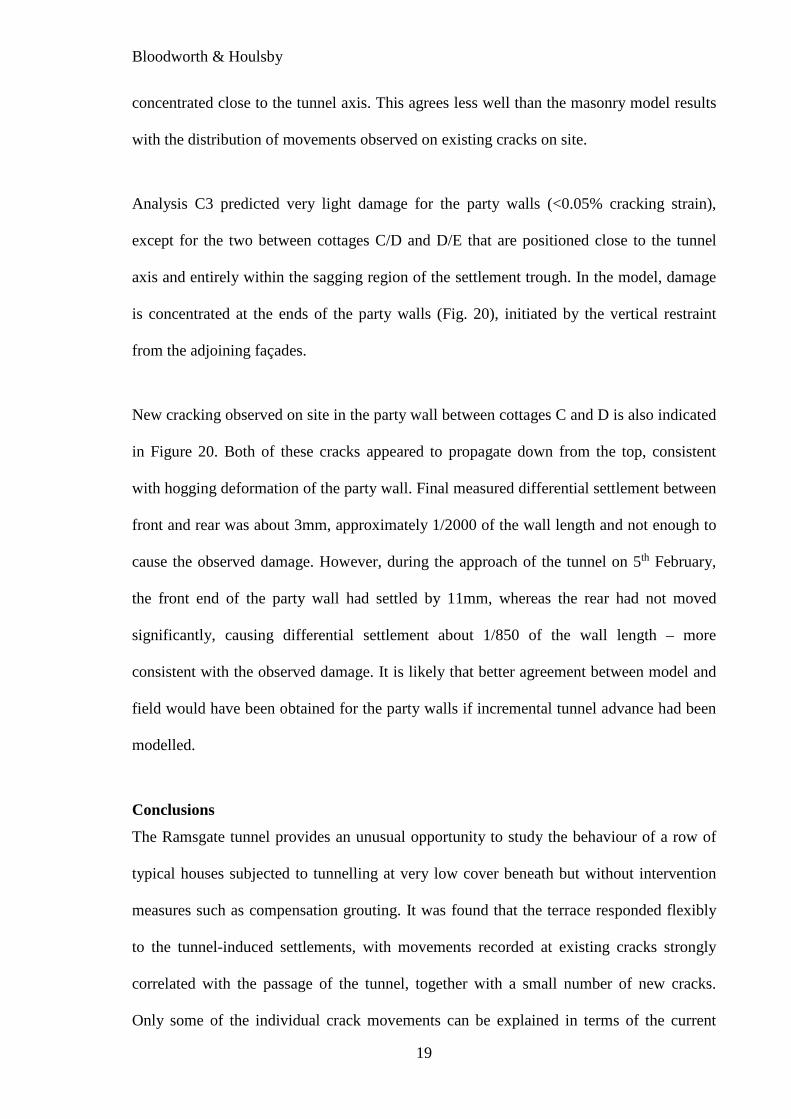
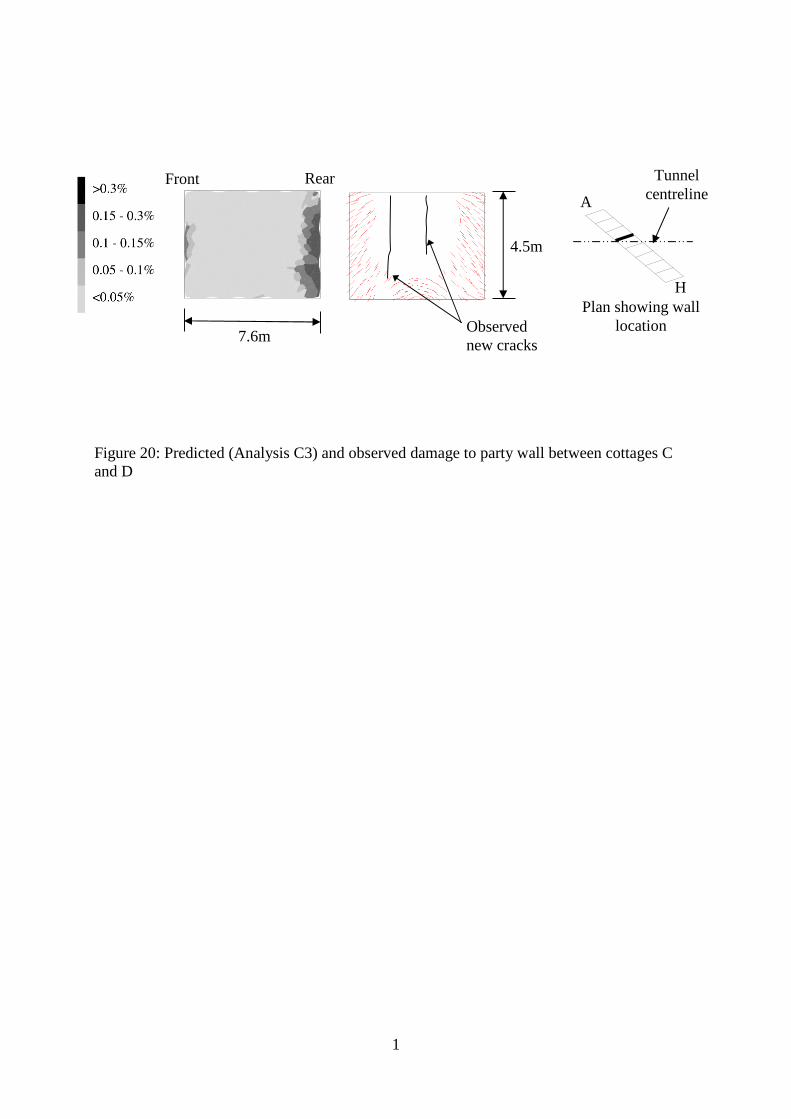
Analysis C3 predicted very light damage for the party walls (<0.05% cracking strain),
except for the two between cottages C/D and D/E that are positioned close to the tunnel
axis and entirely within the sagging region of the settlement trough. In the model, damage
is concentrated at the ends of the party walls (Fig. 20), initiated by the vertical restraint
from the adjoining façades.
New cracking observed on site in the party wall between cottages C and D is also indicated
in Figure 20. Both of these cracks appeared to propagate down from the top, consistent
with hogging deformation of the party wall. Final measured differential settlement between
front and rear was about 3mm, approximately 1/2000 of the wall length and not enough to
cause the observed damage. However, during the approach of the tunnel on 5th February,
the front end of the party wall had settled by 11mm, whereas the rear had not moved
significantly, causing differential settlement about 1/850 of the wall length – more
consistent with the observed damage. It is likely that better agreement between model and
field would have been obtained for the party walls if incremental tunnel advance had been
modelled.
Conclusions
The Ramsgate tunnel provides an unusual opportunity to study the behaviour of a row of
typical houses subjected to tunnelling at very low cover beneath but without intervention
measures such as compensation grouting. It was found that the terrace responded flexibly
to the tunnel-induced settlements, with movements recorded at existing cracks strongly
correlated with the passage of the tunnel, together with a small number of new cracks.
Only some of the individual crack movements can be explained in terms of the current
Bloodworth & Houlsby
20
theory of building façades acting as deep beams. Overall, damage was less severe than
predicted by current analyses, and in particular, significant opening of cracks at the top of
the façades in the key hogging region was not observed.
A three-dimensional model of the site was analysed. It was possible to reproduce the
observed ‘greenfield’ settlement trough for the particular tunnelling method being
employed. The model confirmed the flexible transverse behaviour of the terrace. The best
structural model for the buildings proved to be one using a no-tension material model for
masonry, which included internal structural walls and the effects of openings in reducing
structural stiffness. The model results showed arching occurring in the building façades
over the tunnel, not taken into account in deep beam theories, but for which there was
some evidence in the field data.
The model allowed for interactions between the buildings and the ground. Although in this
instance the buildings were sufficiently flexible that they had little influence on the
settlement pattern, this would not always be the case. To predict correctly damage to walls
aligned with the direction of tunnelling, it would be necessary to model the three-
dimensional incremental advance of the tunnel heading, which should be possible with
increased computing power. Thus the comparison between the field data of this case
history and the numerical model exposes some of the limitations of numerical techniques
to modelling the full complexity of real structural behaviour, whilst capturing some of the
essential features of the observations.
Acknowledgements
The first author is grateful for the support of Kellogg Brown & Root and the Royal
Commission for the Exhibition of 1851, from whom he was in receipt of an Industrial
Bloodworth & Houlsby
21
Fellowship. The authors acknowledge the support and assistance of the site supervision
team at the Ramsgate Harbour Approach Road Tunnel site, including staff from Babtie,
Taylor Woodrow Construction and Perforex S.A. Calculations were carried out at the
Oxford Supercomputing Centre, using code substantially written by Harvey Burd, Charles
Augarde and Liu Gang.
References
Augarde CE and Burd HJ (2001) Three-dimensional finite element analysis of lined
tunnels. Int. J. for Numerical and Analytical Methods in Geomechanics 25: 243-262.
Bloodworth AG (2002) Three-dimensional analysis of tunnelling effects on structures to
develop design methods. DPhil Thesis. University of Oxford.
Bloodworth AG and Houlsby GT (2000) Three-dimensional analysis of building settlement
caused by shaft construction. In Proc. Int. Sympos. on Geotechnical Aspects of
Underground Construction in Soft Ground. Balkema, Rotterdam, pp. 607-612.
Boscardin MD, and Cording EJ (1989) Building response to excavation-induced
settlement. Journal of Geotechnical Engineering, ASCE 115 (1): 1-21.
Bougard JF (1988) Mechanical pre-cutting method. Tunnelling and Underground Space
Technology 3(2): 163-167.
Burd HJ, Houlsby GT, Augarde, CE and Liu G (2000) Modelling the effects on masonry
buildings of tunnelling-induced settlement. Proceedings of the Institution of Civil
Engineers – Geotechnical Engineering 143 (1): 17-29.
Burland JB, Broms BB and de Mello VFB (1977) Behaviour of foundations and structures.
In Proc. 9th ICSMFE, Vol. 3. Japanese Society of Soil Mechanics and Foundation
Engineering, pp. 495-546.
Burland JB, Standing JR and Jardine FM (eds) (2001) Building response to tunnelling.
Case studies from the Jubilee Line Extension, London. Volumes 1 & 2. Thomas Telford,
London, UK.
Burland JB and Wroth CP (1975) Settlement of buildings and associated damage. In Proc.
Conference on Settlement of Structures. Pentech Press, London, pp. 611-654.
CIRIA (Construction Industry Research and Information Association) (1994). Foundations
in chalk. Project Report No. 11.
Bloodworth & Houlsby
22
Crow MR and Newman TG (1999) Tunnelling using the pre-vaulting system in chalk for
the Ramsgate Harbour Approach Tunnel, United Kingdom. In Proc. Int. Symposium
Tunnel Construction and Piling ’99. Brintex Ltd, London.
Farrell, R, Mair, R, Sciottic, A and Pigorini, A (2014) Building response to tunnelling.
Soils and Foundations 54(3): 269–279.
Franzius, JN, Potts, DM, Addenbrooke, TI and Burland, JB (2004). The influence of
building weight on tunnelling induced ground and building deformation. Soils and
Foundations 44(1): 25-38.
Frischmann WW, Hellings JE and Snowden C (1994) Protection of the Mansion House
against damage caused by ground movements due to the Docklands Light Railway
Extension. Proceedings of the Institution of Civil Engineers – Geotechnical Engineering
107 (2): 65-76.
Houlsby GT (1999) A model for the variable stiffness of undrained clay. In Proc. Int.
Symp. on Pre-Failure Deformation of Soils, Vol. 1. Balkema, Rotterdam, pp. 443-450.
Houlsby GT, Liu G and Augarde CE (2000) A tying scheme for imposing displacement
constraints in finite element analysis. Communications in Numerical Methods in
Engineering 16 (10): 721-732.
Huntley SL, Holtrieger PJ, Jewell PJ and Macklin SR (1997) Ground investigations for the
Ramsgate Harbour Approach Road Tunnel – planning, procurement, evaluation and
interpretation. In Proc. Int. Sympos. Tunnelling ’97. Institution of Mining and Metallurgy,
London.
Mair RJ (1993) Developments in geotechnical engineering research: Application to tunnels
and deep excavations. Proceedings of the Institution of Civil Engineers – Civil Engineering
93 (1): 27-41.
Mair RJ, Taylor RN and Burland JB (1996) Prediction of ground movements and
assessment of risk of building damage due to bored tunnelling. In Proc. Int. Sympos. on
Geotechnical Aspects of Underground Construction in Soft Ground. Balkema, Rotterdam,
pp. 713-718.
Martareche F (2013) The perforex pre-cutting method: An inventive tunnel construction
technique maximizing safety for the workers and surroundings. In Proc. 13th World Conf.
on ACUUS: Advances in Underground Space Development, ACUUS 2012. Research
Publishing, Singapore, pp. 1141-1148.
Morgan SR (1999) Prevaulting success at Ramsgate Harbour. Tunnels and Tunnelling
International 31 (7): 31-34.
Bloodworth & Houlsby
23
Mroueh H and Shahrour I (2002) Three-dimensional finite element analysis of the
interaction between tunnelling and adjacent structures. In Proc. Int. Sympos. on
Geotechnical Aspects of Underground Construction in Soft Ground. Balkema, Rotterdam,
pp. 729-734.
Newman TG and Ingle JL (2002) A comparison between tube-à-manchette and lance
grouting to assist tunnel excavation in chalk. Proceedings of the Institution of Civil
Engineers – Geotechnical Engineering 155 (3): 175-186.
Peck RB (1969) Deep excavations and tunnelling in soft ground. In Proc. 7th ICSMFE,
State-of-the-Art Volume. Sociedad Mexicana de Mecánica de Suelos, Mexico, pp. 225-290.
Phaal R and Calladine CR (1992) A simple class of finite elements for plate and shell
problems II: an element for thin shells, with only translational degrees of freedom.
International Journal of Numerical Methods in Engineering 35: 979-996.
Pickhaver, JA, Burd, HJ and Houlsby GT (2010) An equivalent beam method to model
masonry buildings in 3D finite element analysis. Computers and Structures 88: 1049–1063.
Simpson B (1994) A model of interaction between tunnelling and a masonry structure. In
Proc. 3rd European Conf. on Numerical Methods in Geotechnical Engineering, ECONMIG
’94. Balkema, Rotterdam, pp. 221-228.
Wisser C, Augarde CE and Burd HJ (2001) Three-dimensional finite element analysis of
compensation grouting. Computer Methods and Advances in Geomechanics, Proc.
IACMAG 10, Tucson, Arizona. Balkema, Rotterdam, pp.1731-1736.
Bloodworth & Houlsby
Table 1: Locations of Demec arrays on cottages
Demec array Cottage Location Description
D1 H Side R side of wall, 1m above ground
D2 H Side Centreline of wall, close to ground
D3 H Side Centreline of wall, 500mm above ground level
D4 H Side Centreline of wall, 1m above ground level
D5 H Front Beneath ground floor bay window, on R side
D6 H Front Beneath ground floor bay window, on L side
D7 D Front Beneath ground floor bay window, on centreline
D8 D Front Beneath ground floor bay window central pane, on R side
D9 A Side 1m above ground, 1.5m from R end
D10 A Side 1m above ground, 1.5m from L end
D11 A Rear 500mm above ground on L side
D12 G Rear Above rear window
D13 B Rear Top R corner of larger rear window
D14 D Rear Below rear window, on R side
D15 F Rear Above rear window, on L side
D16 F Rear Above rear window, on R side
D17 G Rear On side wall of rear extension, above L window on centreline of window
D18 H Rear On side wall of rear extension, above L window
D19 G Front Side rendered wall of cottage F, lower L corner
D20 G Front Side rendered wall of cottage F, R side 2m above ground level
D21 E Front Beneath ground floor bay window, on centreline
D22 D Front Above ground floor bay window, on centreline
D23 C Front Above L pane of ground floor bay window
D24 H Front On concrete window sill of ground floor bay window, central pane

Bloodworth & Houlsby
Table 2: Details of combined analyses of Ramsgate site
Analysis Façade layout Regions of reduced stiffness foropenings
Material model
C1 No partywalls
No Masonry
C2 No partywalls
Yes, 40% stiffness Masonry
C3 Includeparty walls
Yes, 40% stiffness Masonry
C4 Includeparty walls
Yes, 40% stiffness Elastic
Bloodworth & Houlsby
A1
Appendix A: Multi-surface plasticity soil model
The soil model used to model the brickearth and weathered clay at Ramsgate is one
designed for the modelling of the undrained behaviour of clays (Houlsby, 1999). It takes
into account the nonlinear behaviour of the soil at small strains, and also includes effects
such as hysteresis and stiffness dependence on recent stress history, by means of multiple
kinematic hardening yield surfaces (in this case nine, plus a bounding von Mises perfectly
plastic failure surface).
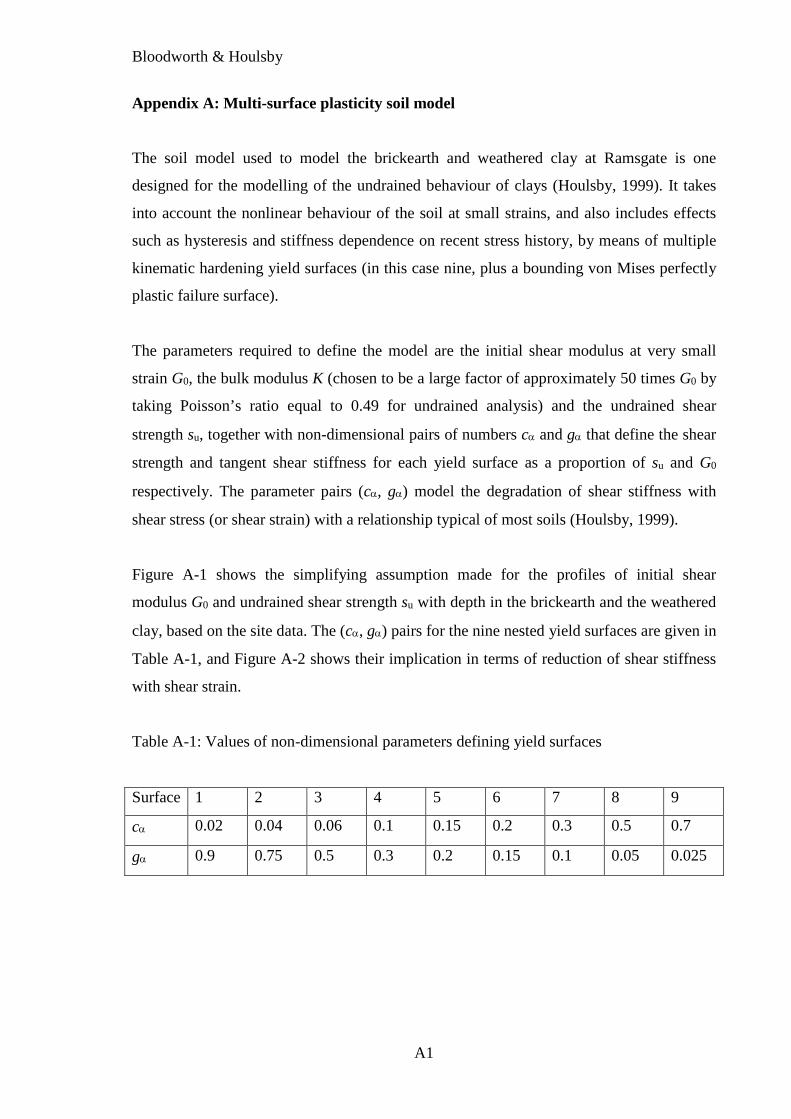
The parameters required to define the model are the initial shear modulus at very small
strain G0, the bulk modulus K (chosen to be a large factor of approximately 50 times G0 by
taking Poisson’s ratio equal to 0.49 for undrained analysis) and the undrained shear
strength su, together with non-dimensional pairs of numbers cα and gα that define the shear
strength and tangent shear stiffness for each yield surface as a proportion of su and G0
respectively. The parameter pairs (cα, gα) model the degradation of shear stiffness with
shear stress (or shear strain) with a relationship typical of most soils (Houlsby, 1999).
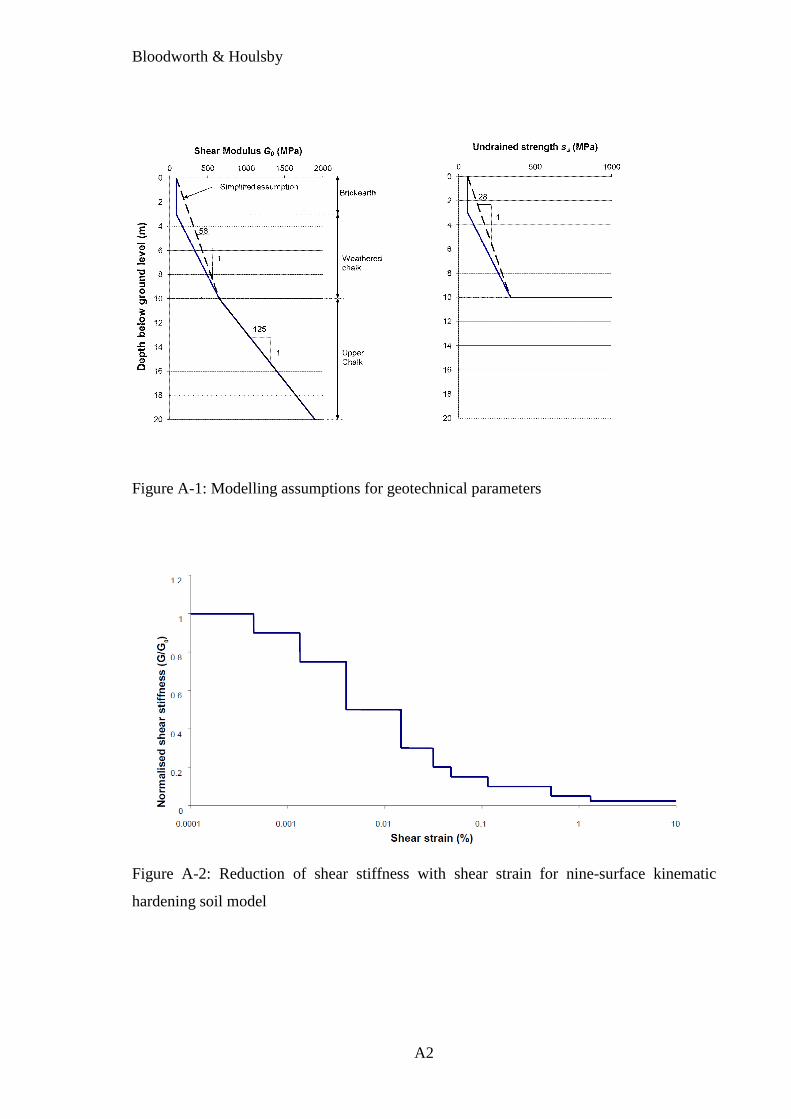
Figure A-1 shows the simplifying assumption made for the profiles of initial shear
modulus G0 and undrained shear strength su with depth in the brickearth and the weathered
clay, based on the site data. The (cα, gα) pairs for the nine nested yield surfaces are given in
Table A-1, and Figure A-2 shows their implication in terms of reduction of shear stiffness
with shear strain.
Table A-1: Values of non-dimensional parameters defining yield surfaces
Surface 1 2 3 4 5 6 7 8 9
cα 0.02 0.04 0.06 0.1 0.15 0.2 0.3 0.5 0.7
gα 0.9 0.75 0.5 0.3 0.2 0.15 0.1 0.05 0.025
Bloodworth & Houlsby
A2
Figure A-1: Modelling assumptions for geotechnical parameters
Figure A-2: Reduction of shear stiffness with shear strain for nine-surface kinematic
hardening soil model
Bloodworth & Houlsby
A3
Appendix B: Masonry elastic no-tension material model
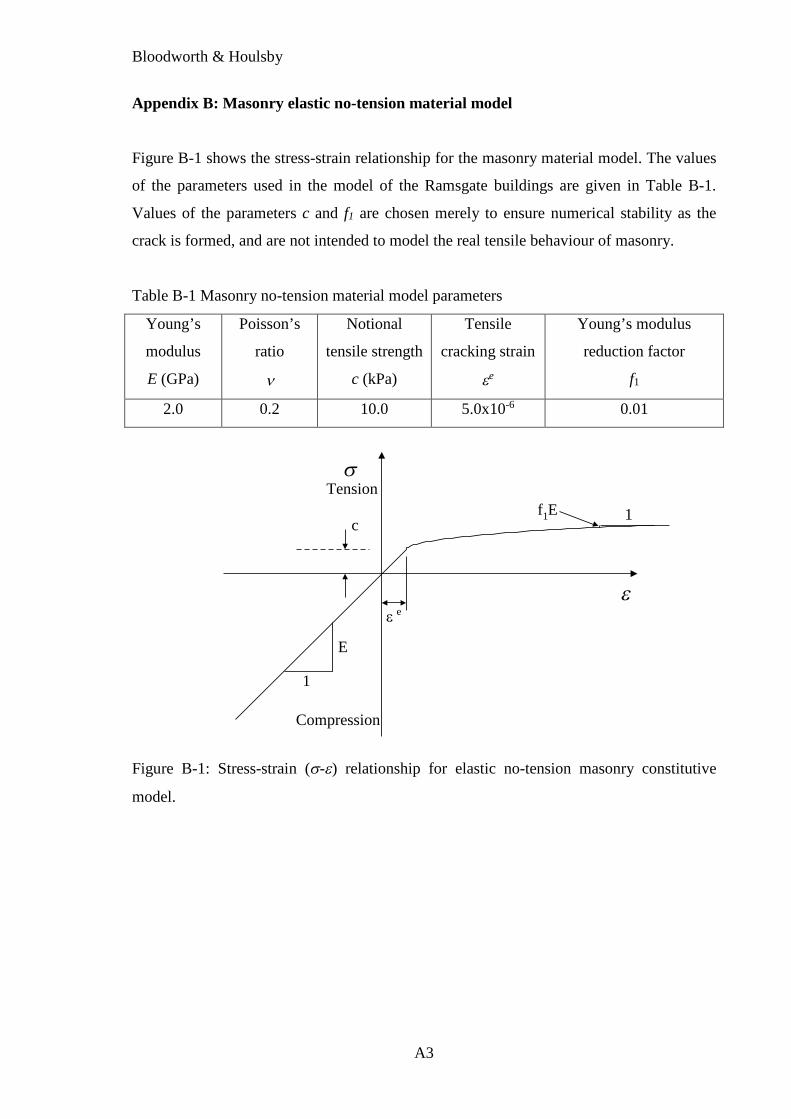
Figure B-1 shows the stress-strain relationship for the masonry material model. The values
of the parameters used in the model of the Ramsgate buildings are given in Table B-1.
Values of the parameters c and f1 are chosen merely to ensure numerical stability as the
crack is formed, and are not intended to model the real tensile behaviour of masonry.
Table B-1 Masonry no-tension material model parameters
Young’s
modulus
E (GPa)
Poisson’s
ratio
ν
Notional
tensile strength
c (kPa)
Tensile
cracking strain
εe
Young’s modulus
reduction factor
f1
2.0 0.2 10.0 5.0x10⁻⁶ 0.01
Figure B-1: Stress-strain (σ-ε) relationship for elastic no-tension masonry constitutive
model.
E
1
σ Tension
Compression
ε
c1f1E
ε e
1
Figure 1: Location of tunnel
Tunnel HarbourApproach Road
© Crown Copyright and Database Right [2015]. Ordnance Survey (Digimap Licence)
N
1
Date 26/01 28/01 01/02 02/02 03/02 05/02 09/02 11/02 15/02 18/02 23/02Tunnelchainage(m)
759 768 773 775 778 782 786 792 798 805 812
Figure 2: Plan showing location of cottages and settlement monitoring points relative totunnel alignment and heading advance
Cottage A
N
Cottage H
Rear extensionsSettlement monitoring points
RearFront
Tunnel diameter11m approx.
17m
7.6m
4.4m
18.5°
40°
11m
Direction oftunnel advance
4.5mLine ofmonitoring pointson footpath
26
/01
28
/01
01
/02
02
/02 03
/02
05
/02
09
/02
11
/02
15
/02
1
Figure 3: Views to the (a) front and (b) rear of terrace of cottages
(a) Front
(b) Rear
1
Figure 4: Development of settlement trough along front façades of cottages
-16.0
-14.0
-12.0
-10.0
-8.0
-6.0
-4.0
-2.0
0.0
2.0
-15.0 -10.0 -5.0 0.0 5.0 10.0 15.0 20.0
Offset from tunnel centreline (m)
Se
ttle
me
nt
(mm
) 26-Jan-99
28-Jan-99
1-Feb-99
2-Feb-99
3-Feb-99
5-Feb-99
9-Feb-99
15-Feb-99
1
Figure 5: Development of settlement troughs along rear façades of cottages
-20.0
-18.0
-16.0
-14.0
-12.0
-10.0
-8.0
-6.0
-4.0
-2.0
0.0
2.0
4.0
-15.0 -10.0 -5.0 0.0 5.0 10.0 15.0
Offset from tunnel centreline (m)
Se
ttle
me
nt
(mm
)
3-Feb-99
5-Feb-99
9-Feb-99
11-Feb-99
15-Feb-99
18-Feb-99
23-Feb-99
1
Figure 6: Final settlement troughs observed on site and predicted by ‘greenfield’ model.
1
Figure 7: Graph of transverse distance squared against ln(Smax/S) to derive trough widthparameter i.
1
Figure 8: Movements of existing cracks on front façades of cottages
Dx
Dx
Passage oftunnel heading
-0.50
-0.40
-0.30
-0.20
-0.10
0.00
0.10
0.20
0.30
0.40
0.50
20-Nov-98 10-Dec-98 30-Dec-98 19-Jan-99 8-Feb-99 28-Feb-99 20-Mar-99
Date
Ch
an
ge
(mm
)
D21
D7
D22 Dx
D22 Dy
D23 Dx
D23 Dy
CRACKOPENING
CRACKCLOSING
1
Figure 9: Movements of existing cracks on rear façades of cottages
-0.15
-0.10
-0.05
0.00
0.05
0.10
0.15
0.20
0.25
0.30
0.35
20-Nov-98 10-Dec-98 30-Dec-98 19-Jan-99 8-Feb-99 28-Feb-99 20-Mar-99
Date
Ch
an
ge
(mm
)
D11 Dx
D11 Dy
D14 Dx
D14 Dy
CRACKOPENING
CRACKCLOSING
Passage oftunnel heading
1
Figure 10: A coupled model of ground, tunnel and building
Building
Ground
Tunnel
1
Figure 11: Geometry of model of ground and tunnel
10m
20m
50m
60m
3m
7m
10m
Brickearth
Weathered chalk
Competent chalk
Tunnel
Footprint of cottages
A
H
Tunnel advancedirection
1
Figure 12: Final model arrangement, (a) plan of building and tunnel, (b) mesh on groundsurface
(a) (b)
A
H
1
Figure 13: Modelling of building façades
End façades and party walls
A B C D E F G H
Regions of reduced stiffness (40% stiffness)
Front and rearfaçades
A
H
1
Figure 14: Options for shrinking of tunnel lining to model ground loss, (a) shrinking entiretunnel, (b) shrinking top half only
Horizontal fixity to springing
(a) (b)
1
(a) Greenfield (b) With elastic building
Figure 15: Contours of ground settlements from ‘greenfield’ and coupled finite elementmodels.
A
H
1
Figure 16: Contours of cracking strain for front façades (analyses without party walls)
A B C D E F G H
Analysis C1 Analysis C2
TunnelCentreline
Offset distance (metres)
+5 +10-10 -5 +15
Analysis settlementtrough shape
4.5m
1
Figure 17: Cracking strain and crack patterns for front façades, for analysis C3 with partywalls, including locations of opening and closing pre-existing cracks
A B C D E F G H
Opening crack Closing crack Unchanged crack
D23 D22 Dx
D7 D8 D21
D20
D19
D6 D5
D24
TunnelCentreline
Offset distance (metres)
+5 +10-10 -5 +15
Analysis settlementtrough shape
1
Figure 18: Averaged cracking strains for analysis with party walls, analysis C3
A B C D E F G H
TunnelCentreline Offset distance (metres)
+5 +10-10 -5 +15
1
Figure 19: Damage categories derived from maximum tensile strain for elastic model C4
A B C D E F G H
TunnelCentreline Offset distance (metres)
+5 +10-10 -5 +15
1
Figure 20: Predicted (Analysis C3) and observed damage to party wall between cottages Cand D
A
HPlan showing wall
location
Tunnelcentreline
7.6m
Front Rear
Observednew cracks
4.5m