Embed Size (px)
Citation preview
Blood Pressure Lowering in Acute Intracerebral Haemorrhage:
How low?
Else Charlotte Sandset, MD, PhDDepartment of NeurologyOslo University Hospital
10th International Congress of Internal MedicineAthens 2018
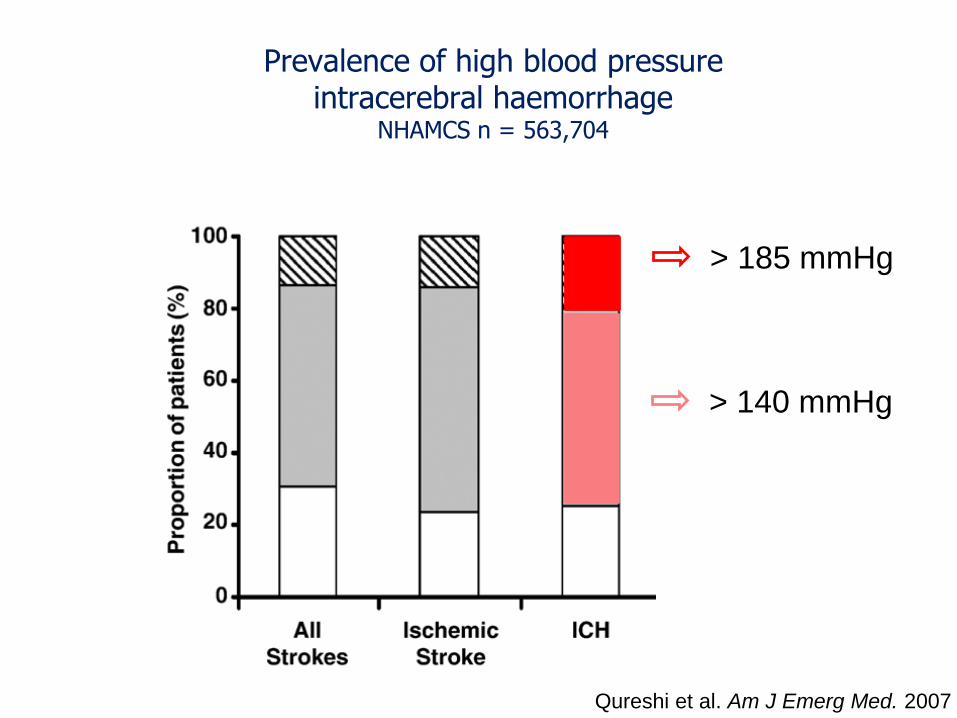
Prevalence of high blood pressure intracerebral haemorrhage
NHAMCS n = 563,704
Qureshi et al. Am J Emerg Med. 2007
> 185 mmHg
> 140 mmHg
Mechanisms –hypertensive response
• Inadequately treated or undiagnosed
• Stress response
• Activation of neuroendocrine systems
• Damage to autonomic centres in the brain
• Cushing reflex
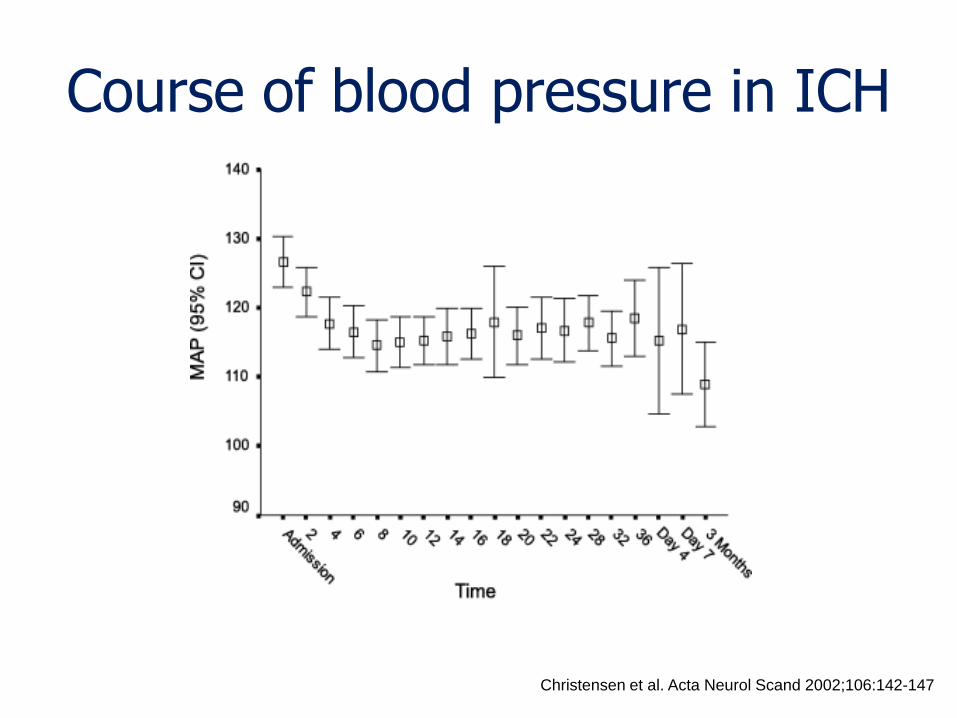
Course of blood pressure in ICH
Christensen et al. Acta Neurol Scand 2002;106:142-147
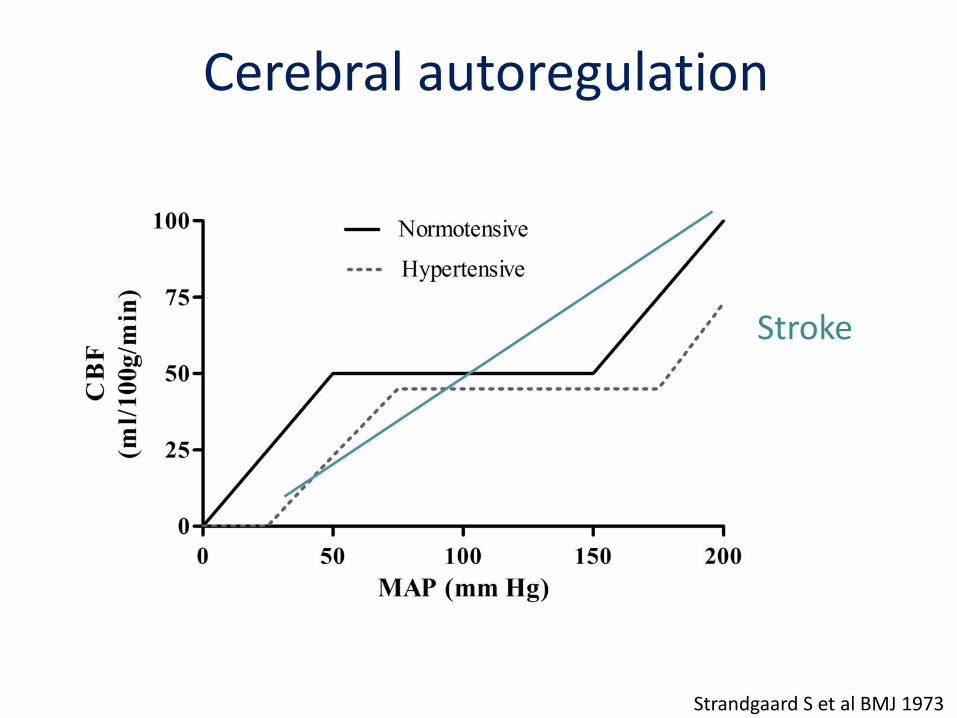
Cerebral autoregulation
Strandgaard S et al BMJ 1973
Stroke
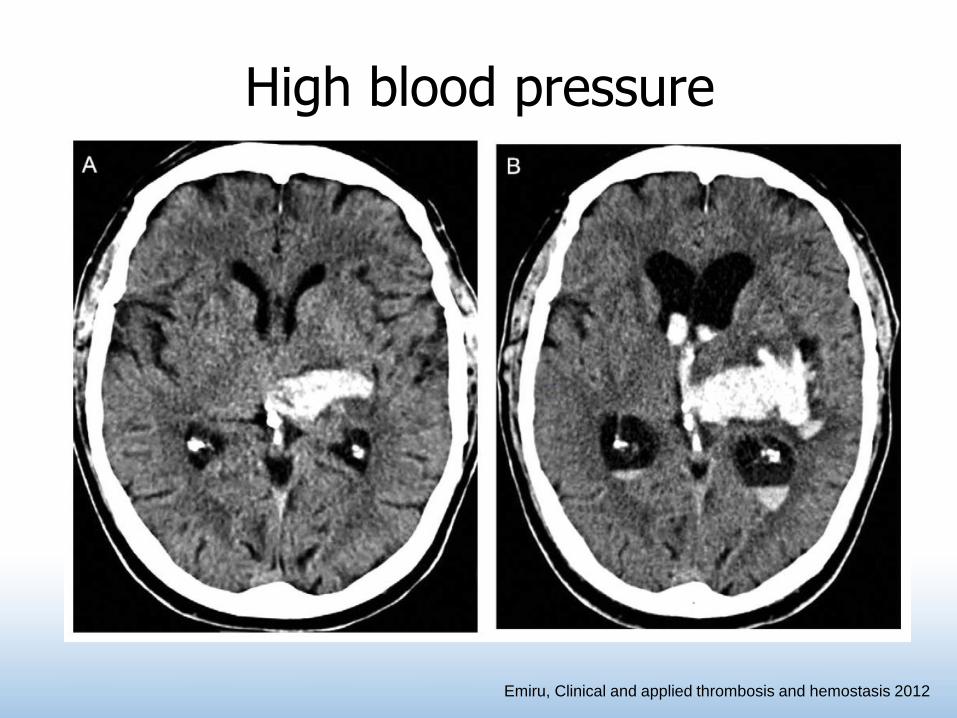
Emiru, Clinical and applied thrombosis and hemostasis 2012
High blood pressure
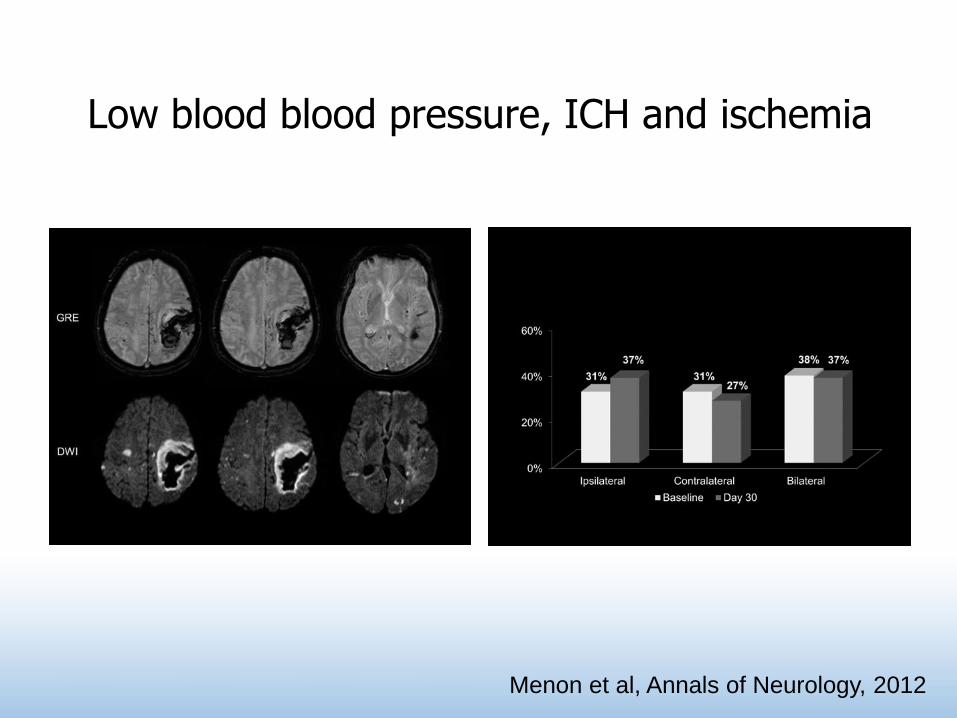
Low blood blood pressure, ICH and ischemia
Menon et al, Annals of Neurology, 2012
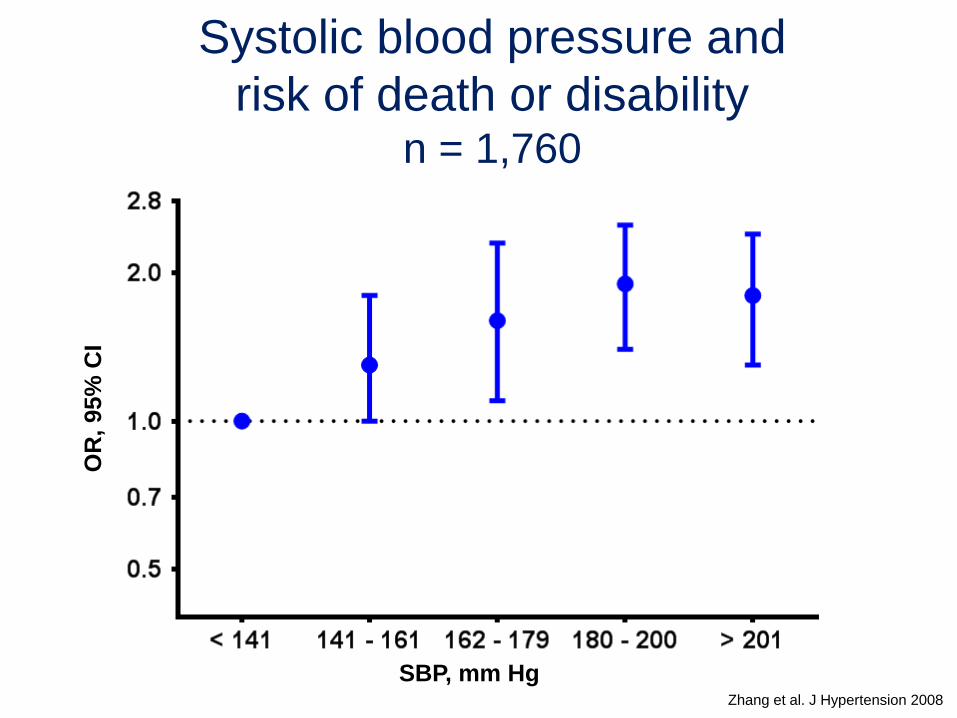
Zhang et al. J Hypertension 2008
Systolic blood pressure and
risk of death or disabilityn = 1,760
SBP, mm Hg
OR
, 95%
CI
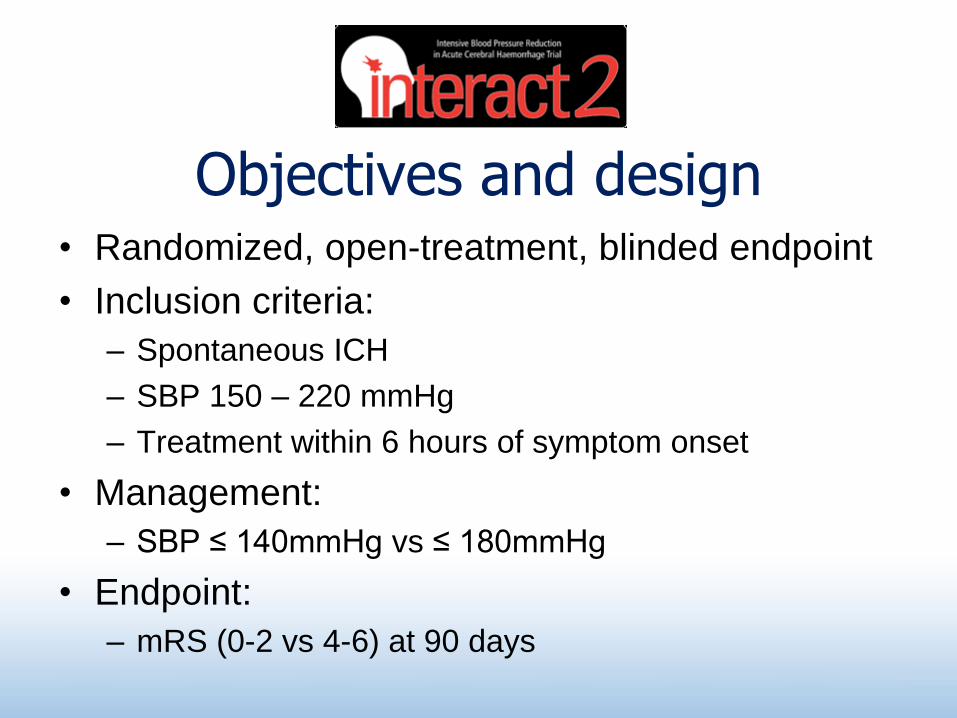
Objectives and design• Randomized, open-treatment, blinded endpoint
• Inclusion criteria:
– Spontaneous ICH
– SBP 150 – 220 mmHg
– Treatment within 6 hours of symptom onset
• Management:
– SBP ≤ 140mmHg vs ≤ 180mmHg
• Endpoint:
– mRS (0-2 vs 4-6) at 90 days
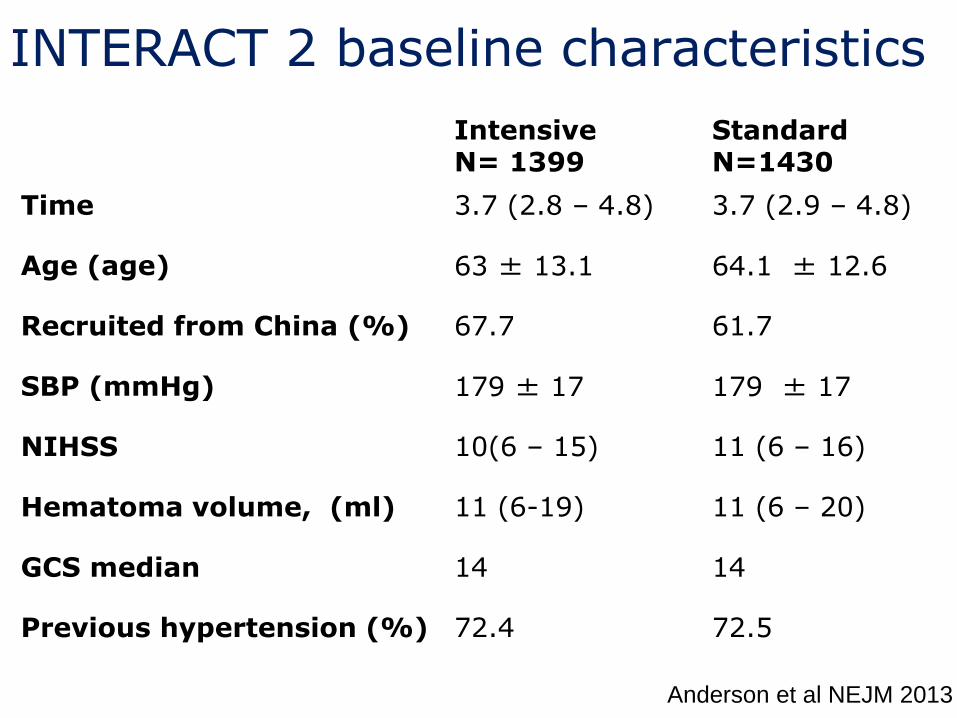
INTERACT 2 baseline characteristics
Intensive N= 1399
StandardN=1430
Time 3.7 (2.8 – 4.8) 3.7 (2.9 – 4.8)
Age (age) 63 ± 13.1 64.1 ± 12.6
Recruited from China (%) 67.7 61.7
SBP (mmHg) 179 ± 17 179 ± 17
NIHSS 10(6 – 15) 11 (6 – 16)
Hematoma volume, (ml) 11 (6-19) 11 (6 – 20)
GCS median 14 14
Previous hypertension (%) 72.4 72.5
Anderson et al NEJM 2013
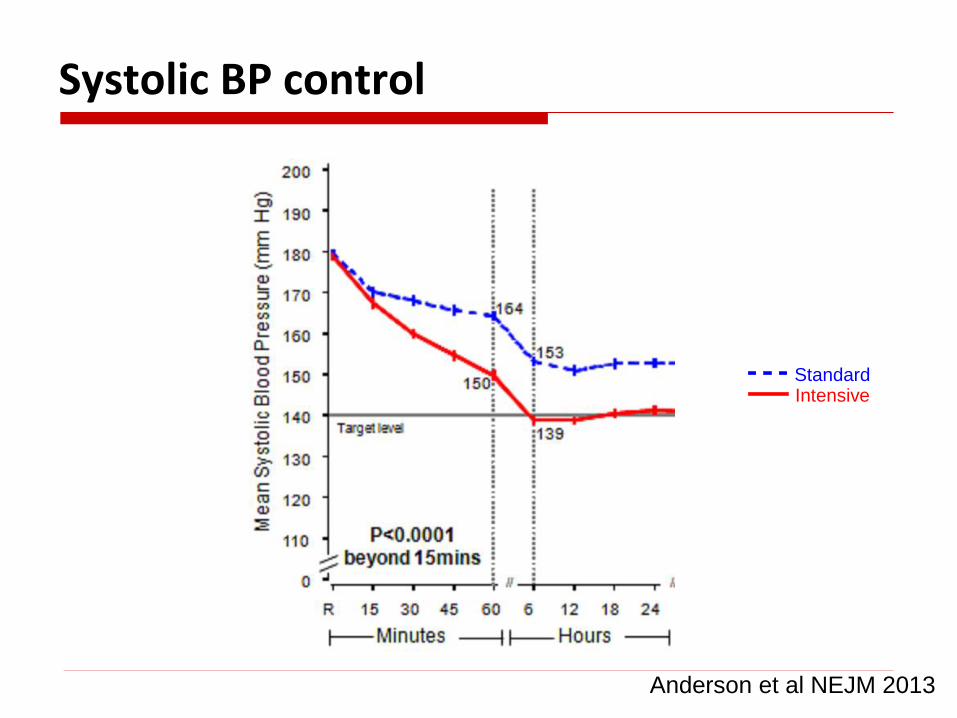
Systolic BP control
Anderson et al NEJM 2013
StandardIntensive
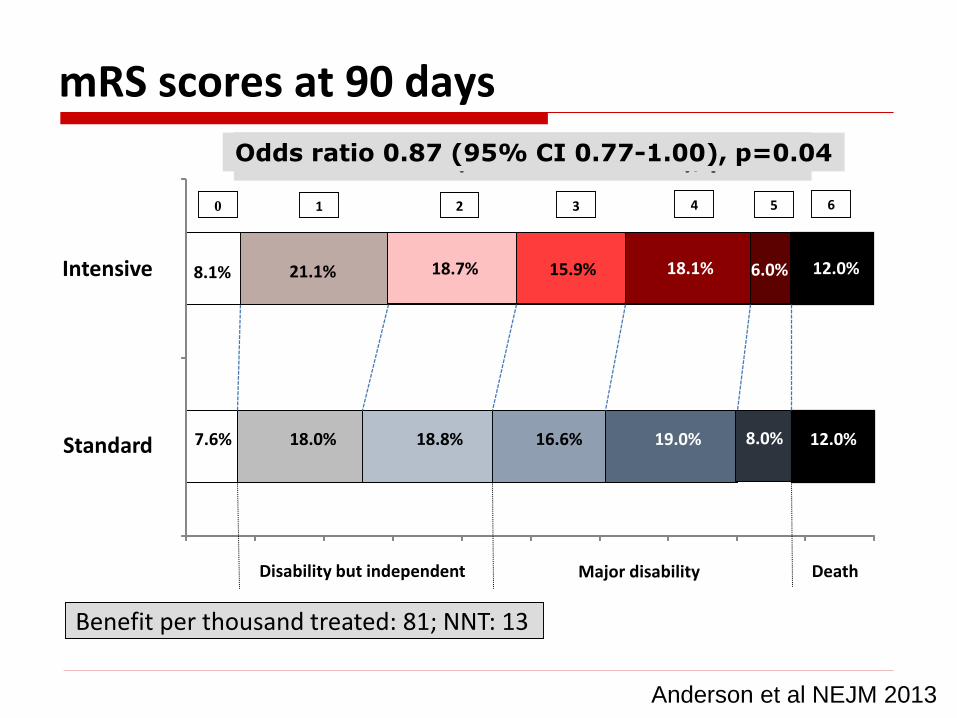
mRS scores at 90 days
18.0% 18.8% 16.6% 19.0%
\
12.0%8.0%
0 1 2 3 4 5 6
Intensive
Standard
Major disability DeathDisability but independent
18.7% 15.9% 18.1% 6.0%21.1%8.1% 12.0%
7.6%
Benefit per thousand treated: 81; NNT: 13
Anderson et al NEJM 2013
Odds ratio 0.87 (95% CI 0.75-1.01), p=0.06Odds ratio 0.87 (95% CI 0.77-1.00), p=0.04
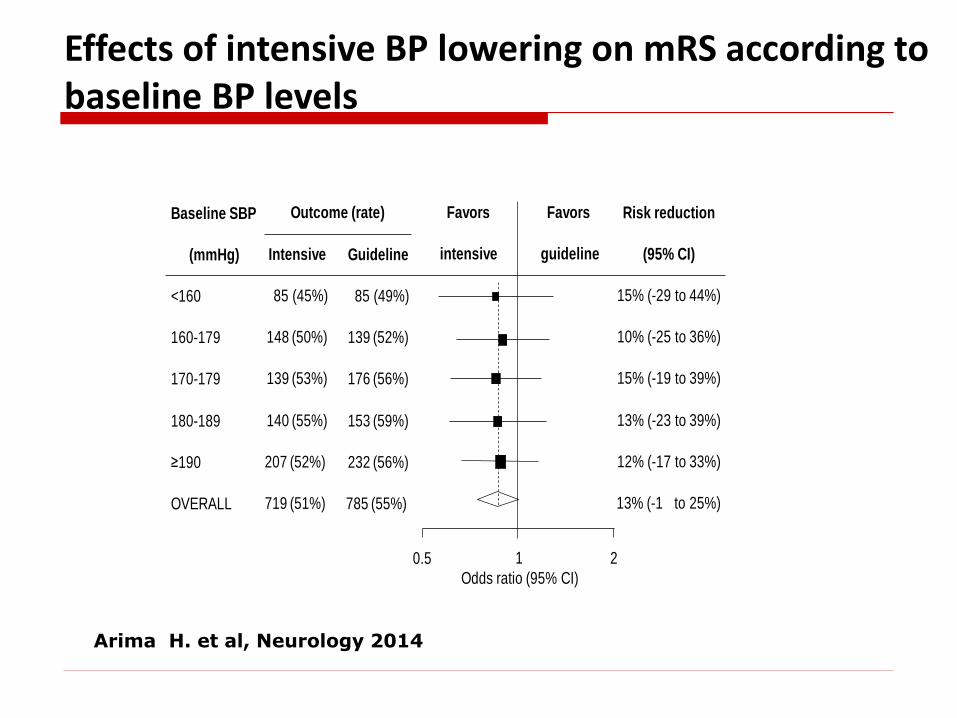
Risk reduction
(95% CI)
15% (-29 to 44%)
10% (-25 to 36%)
15% (-19 to 39%)
13% (-23 to 39%)
12% (-17 to 33%)
13% (-1 to 25%)
Intensive
85 (45%)
148 (50%)
139 (53%)
140 (55%)
207 (52%)
719 (51%)
Guideline
85 (49%)
139 (52%)
176 (56%)
153 (59%)
232 (56%)
785 (55%)
Favors
intensive
Outcome (rate) Favors
guideline
Odds ratio (95% CI)0.5 1
Baseline SBP
(mmHg)
<160
160-179
170-179
180-189
≥190
OVERALL
2
Effects of intensive BP lowering on mRS according to baseline BP levels
Arima H. et al, Neurology 2014
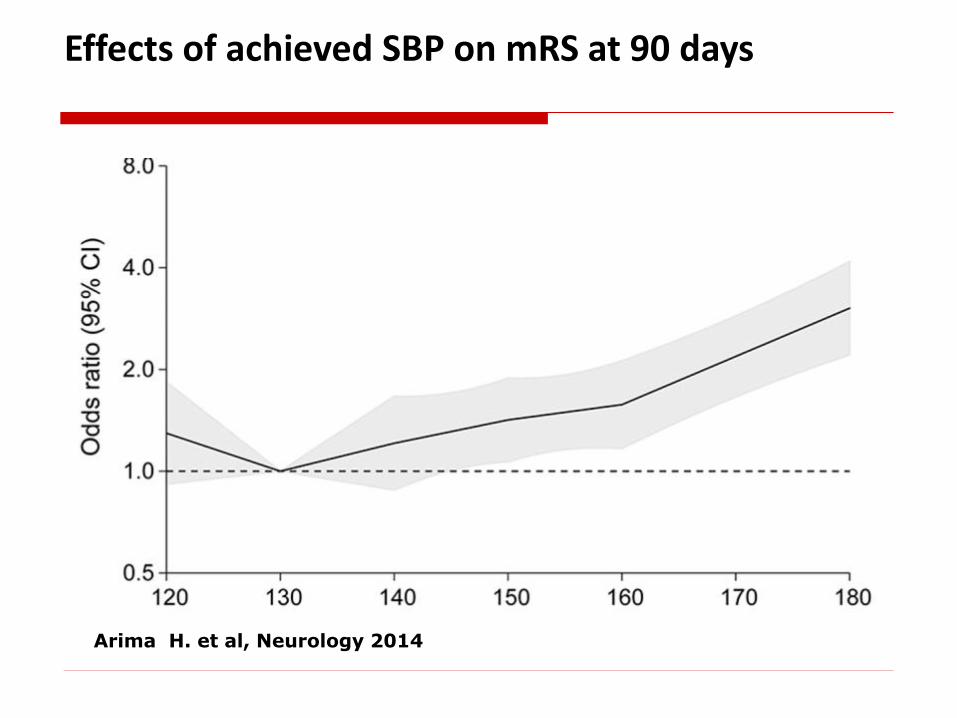
Effects of achieved SBP on mRS at 90 days
Arima H. et al, Neurology 2014
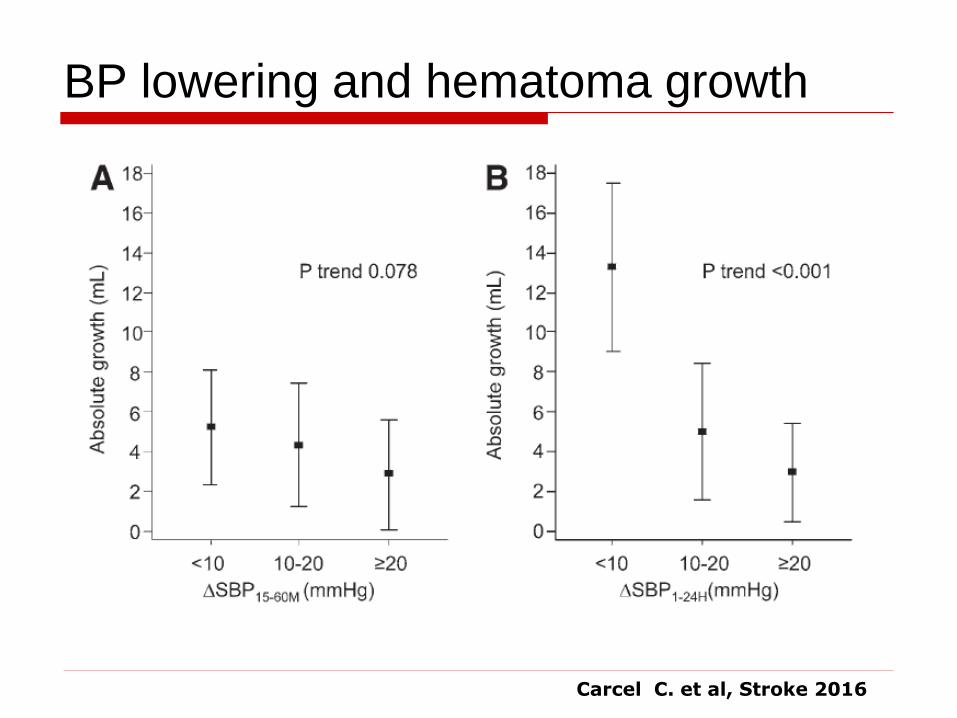
BP lowering and hematoma growth
Carcel C. et al, Stroke 2016
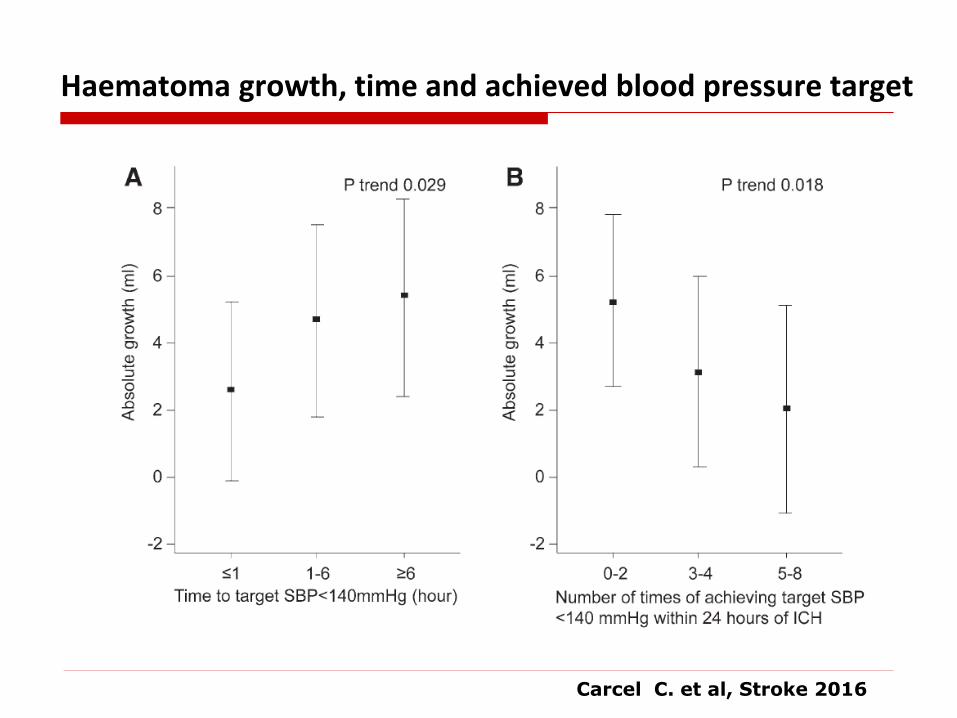
Haematoma growth, time and achieved blood pressure target
Carcel C. et al, Stroke 2016
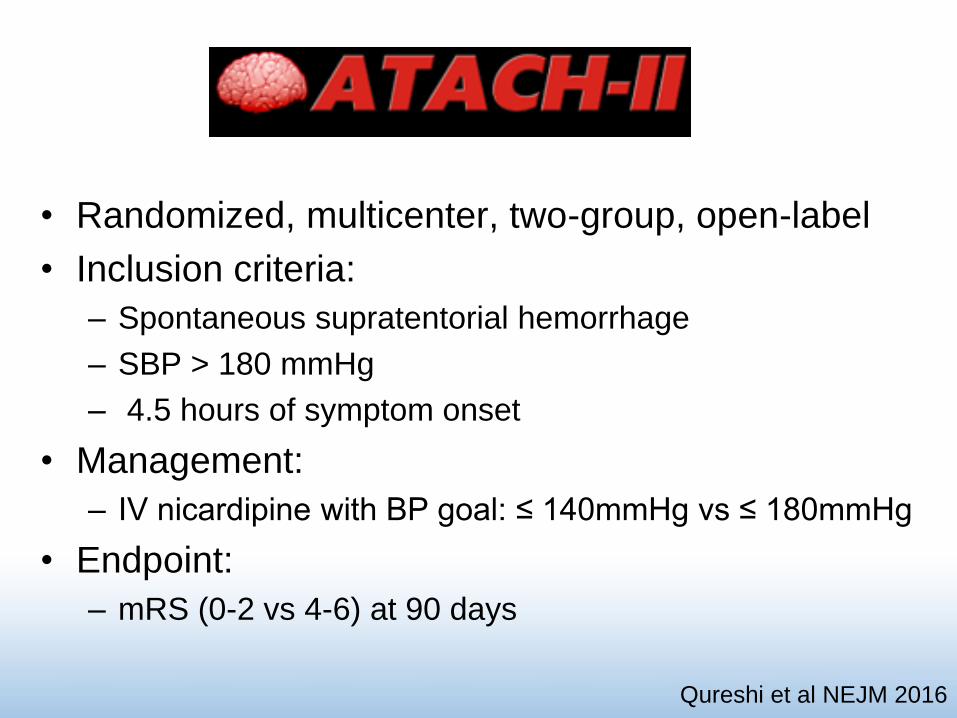
• Randomized, multicenter, two-group, open-label
• Inclusion criteria:
– Spontaneous supratentorial hemorrhage
– SBP > 180 mmHg
– 4.5 hours of symptom onset
• Management:
– IV nicardipine with BP goal: ≤ 140mmHg vs ≤ 180mmHg
• Endpoint:
– mRS (0-2 vs 4-6) at 90 days
Qureshi et al NEJM 2016
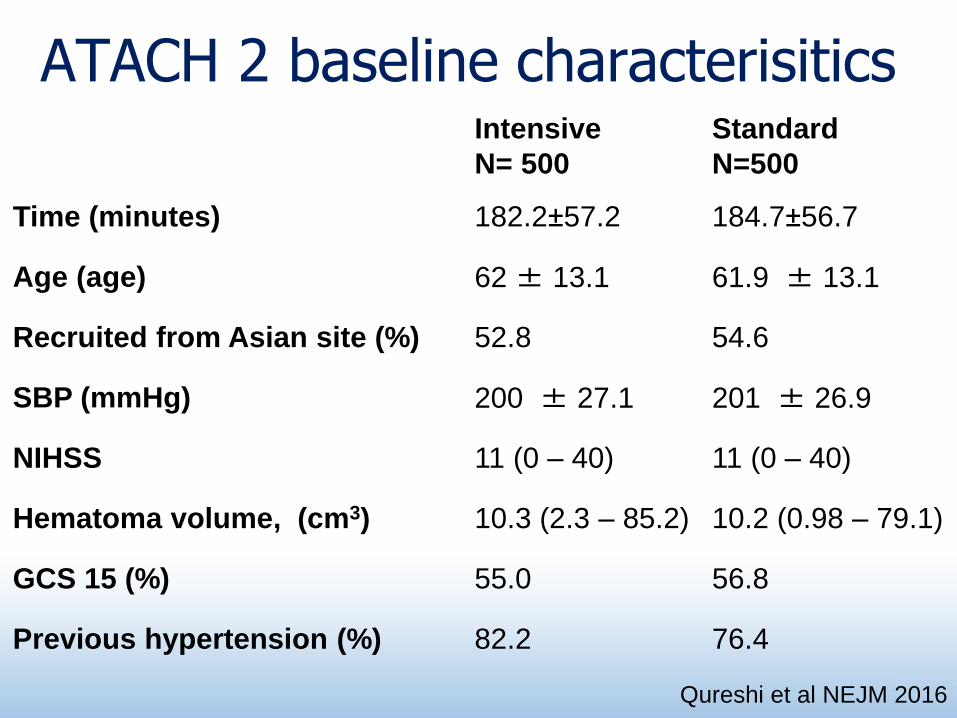
ATACH 2 baseline characterisitics Intensive
N= 500
Standard
N=500
Time (minutes) 182.2±57.2 184.7±56.7
Age (age) 62 ± 13.1 61.9 ± 13.1
Recruited from Asian site (%) 52.8 54.6
SBP (mmHg) 200 ± 27.1 201 ± 26.9
NIHSS 11 (0 – 40) 11 (0 – 40)
Hematoma volume, (cm3) 10.3 (2.3 – 85.2) 10.2 (0.98 – 79.1)
GCS 15 (%) 55.0 56.8
Previous hypertension (%) 82.2 76.4
Qureshi et al NEJM 2016
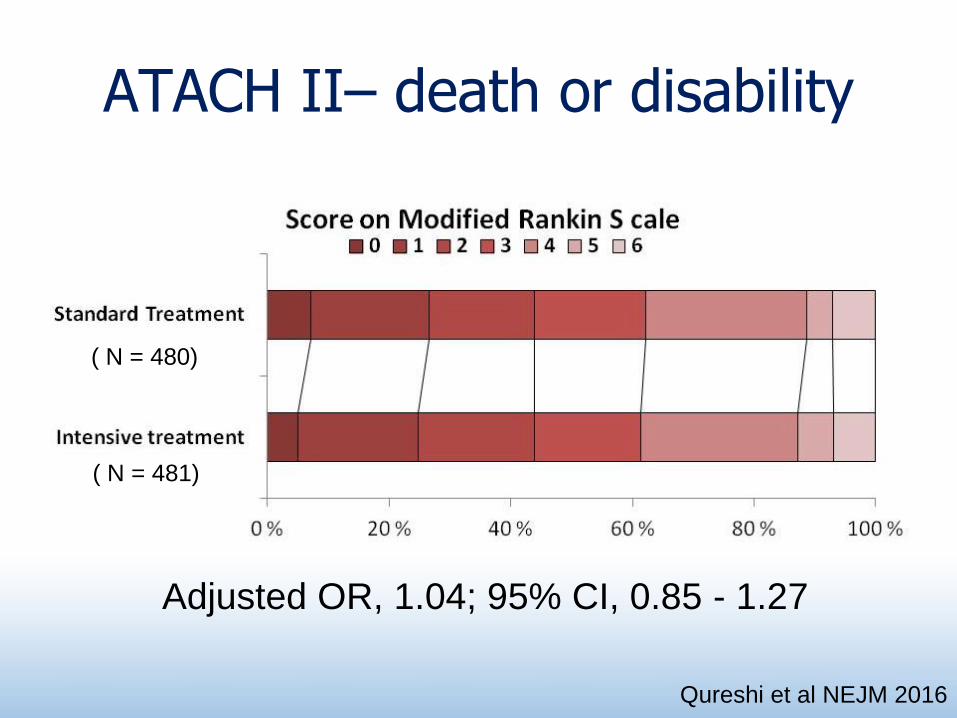
ATACH II– death or disability
( N = 480)
( N = 481)
Qureshi et al NEJM 2016
Adjusted OR, 1.04; 95% CI, 0.85 - 1.27
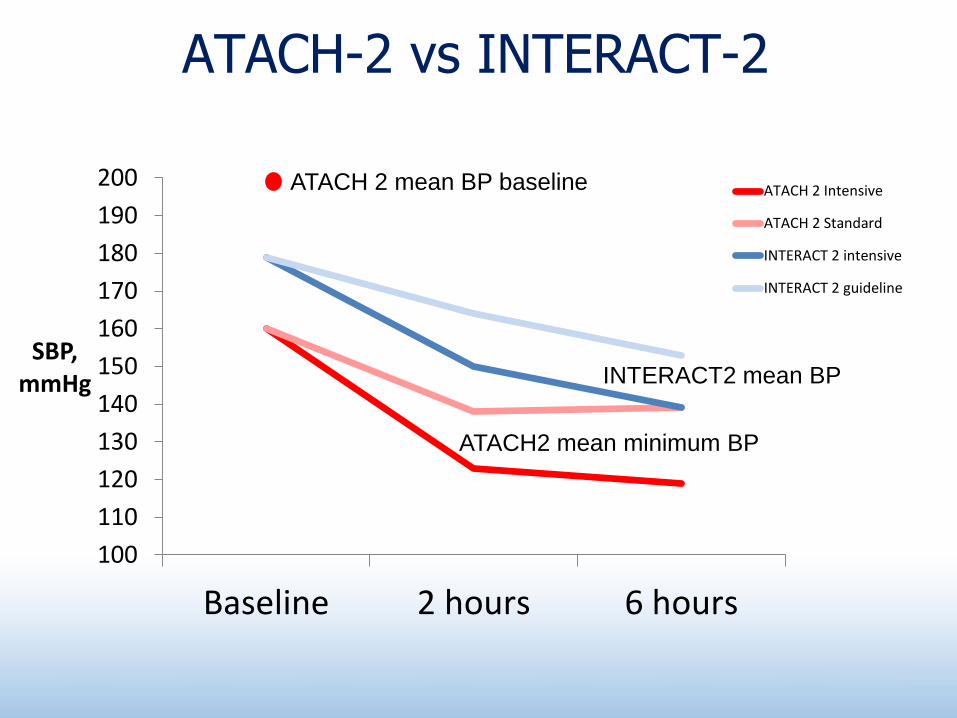
ATACH-2 vs INTERACT-2
100
110
120
130
140
150
160
170
180
190
200
Baseline 2 hours 6 hours
SBP,mmHg
ATACH 2 Intensive
ATACH 2 Standard
INTERACT 2 intensive
INTERACT 2 guideline
ATACH 2 mean BP baseline
ATACH2 mean minimum BP
INTERACT2 mean BP
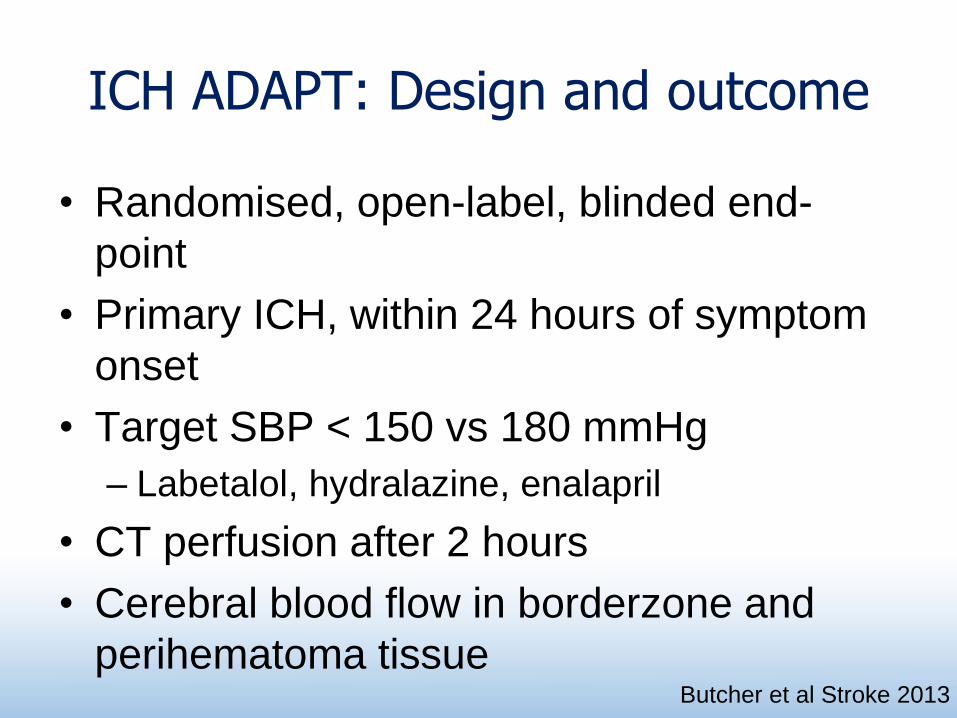
ICH ADAPT: Design and outcome
• Randomised, open-label, blinded end-
point
• Primary ICH, within 24 hours of symptom
onset
• Target SBP < 150 vs 180 mmHg
– Labetalol, hydralazine, enalapril
• CT perfusion after 2 hours
• Cerebral blood flow in borderzone and
perihematoma tissueButcher et al Stroke 2013
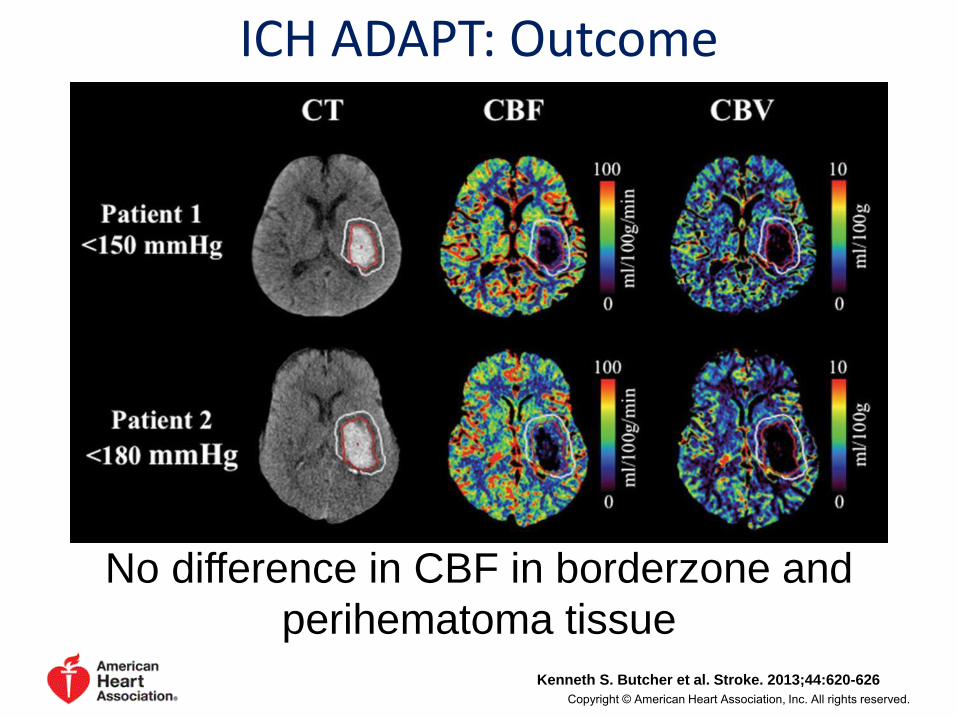
Kenneth S. Butcher et al. Stroke. 2013;44:620-626
Copyright © American Heart Association, Inc. All rights reserved.
ICH ADAPT: Outcome
No difference in CBF in borderzone and
perihematoma tissue
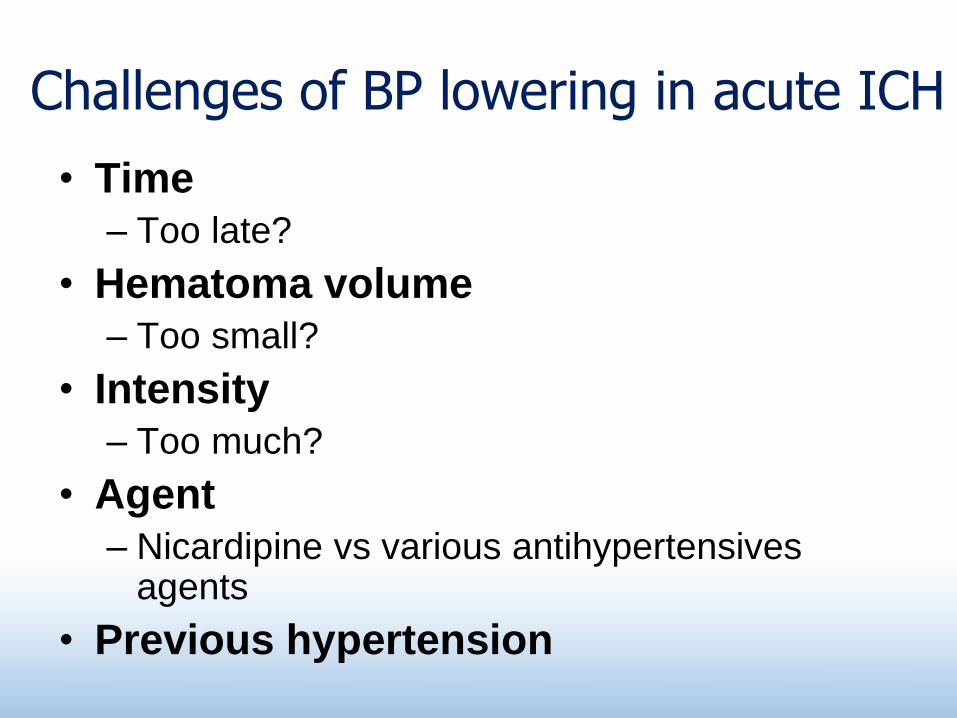
Challenges of BP lowering in acute ICH
• Time
– Too late?
• Hematoma volume
– Too small?
• Intensity
– Too much?
• Agent
– Nicardipine vs various antihypertensives agents
• Previous hypertension
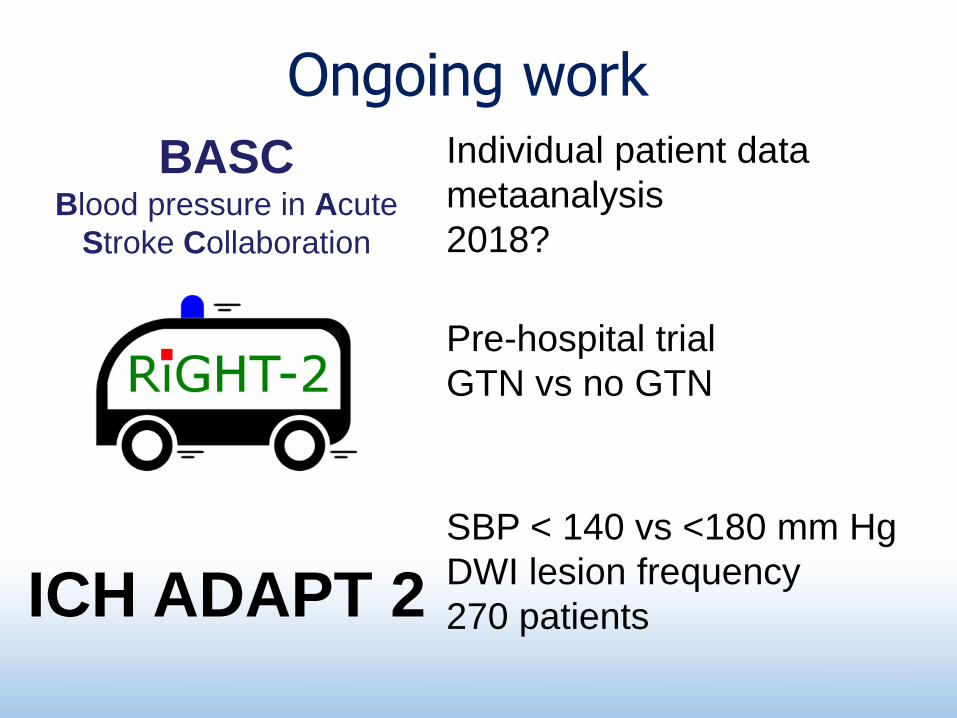
BASCBlood pressure in Acute
Stroke Collaboration
Individual patient data
metaanalysis
2018?
Pre-hospital trial
GTN vs no GTN
ICH ADAPT 2
SBP < 140 vs <180 mm Hg
DWI lesion frequency
270 patients
Ongoing work
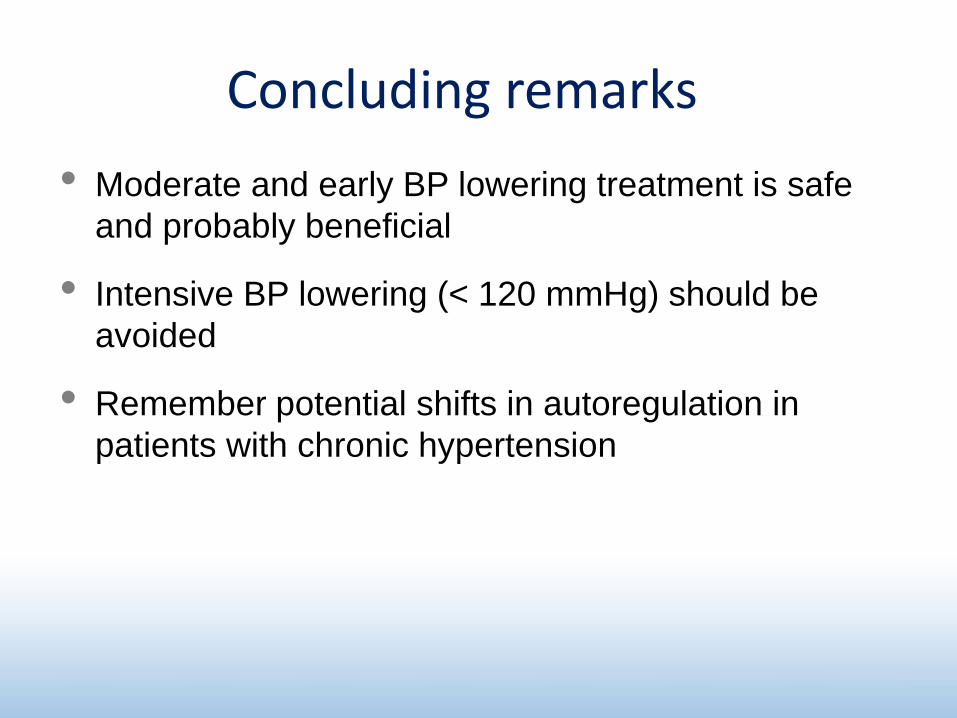
Concluding remarks
• Moderate and early BP lowering treatment is safe
and probably beneficial
• Intensive BP lowering (< 120 mmHg) should be
avoided
• Remember potential shifts in autoregulation in
patients with chronic hypertension
Thank you for your attention!
John Fabre Exihibit, Palma de Mallorca, 2014