Embed Size (px)
DESCRIPTION
Blominvest Bank - The Lebanon Brief - New Angel Investors for Tech Startups - The Lebanese Banks
Citation preview
Your Investment Reference
THE
LEBANON BRIEF
ISSUE 835
Week of 02 – 07 September, 2013
ECONOMIC RESEARCH DEPARTMENT
Rashid Karame Street, Verdun Area
P.O.Box 11-1540 Beirut, Lebanon
T (01) 747802 F (+961) 1 737414
www.blom.com.lb
S A L

The Lebanon Brief Table Of Contents Page 2 of 14
ISSUE 832; Week of 05 – 17 August 2013
S A L
TABLE OF CONTENTSTABLE OF CONTENTSTABLE OF CONTENTSTABLE OF CONTENTS
FINANCIAL MARKETSFINANCIAL MARKETSFINANCIAL MARKETSFINANCIAL MARKETS 3333
Equity Market 3
Foreign Exchange Market 5
Money & Treasury Bills Market 5
Eurobond Market 6
ECONOMIC AND FINANCIAL NEWSECONOMIC AND FINANCIAL NEWSECONOMIC AND FINANCIAL NEWSECONOMIC AND FINANCIAL NEWS 7777
Lebanon’s Fiscal Deficit Touches $1.62B by May 2013 7
Commercial Banks Consolidated Total Assets Grew to $157.81B in July 8
BMI: Lebanon’s Sovereign Risk Rating Score slips to 38/100 8
Trade Deficit Increases to $9.92B up to July 2013 9
Public Sector Wages Increased to $647.43M up to March 2013 10
CORPORATE DEVELOPMENTSCORPORATE DEVELOPMENTSCORPORATE DEVELOPMENTSCORPORATE DEVELOPMENTS 11111111
BLC Bank Lists New Preferred “C” shares 11
FOCUS IN BRIEFFOCUS IN BRIEFFOCUS IN BRIEFFOCUS IN BRIEF 12121212
New Angel Investors for Tech Startups: the Lebanese Banks 12
This report is published for information purposes only. The information herein has been compiled from, or based upon sources we believe to be
reliable, but we do not guarantee or accept responsibility for its completeness or accuracy. This document should not be construed as a
solicitation to take part in any investment, or as constituting any representation or warranty on our part. The consequences of any action taken
on the basis of information contained herein are solely the responsibility of the recipient.
The Lebanon Brief Page 3 of 14
ISSUE 832; Week of 05 – 17 August 2013
S A L
FINANCIAL MARKETSFINANCIAL MARKETSFINANCIAL MARKETSFINANCIAL MARKETS
Equity Market
Stock Market
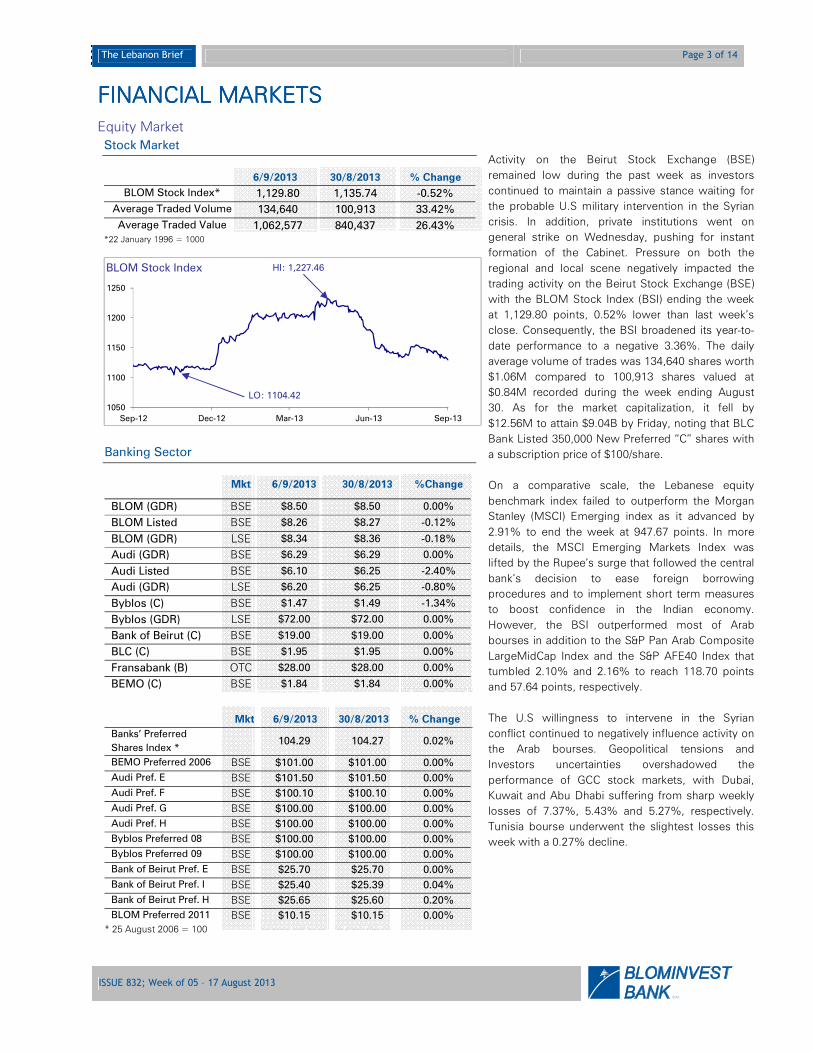
6/9/2013 30/8/2013 % Change
BLOM Stock Index* 1,129.80 1,135.74 -0.52%
Average Traded Volume 134,640 100,913 33.42%
Average Traded Value 1,062,577 840,437 26.43% *22 January 1996 = 1000
Activity on the Beirut Stock Exchange (BSE)
remained low during the past week as investors
continued to maintain a passive stance waiting for
the probable U.S military intervention in the Syrian
crisis. In addition, private institutions went on
general strike on Wednesday, pushing for instant
formation of the Cabinet. Pressure on both the
regional and local scene negatively impacted the
trading activity on the Beirut Stock Exchange (BSE)
with the BLOM Stock Index (BSI) ending the week
at 1,129.80 points, 0.52% lower than last week’s
close. Consequently, the BSI broadened its year-to-
date performance to a negative 3.36%. The daily
average volume of trades was 134,640 shares worth
$1.06M compared to 100,913 shares valued at
$0.84M recorded during the week ending August
30. As for the market capitalization, it fell by
$12.56M to attain $9.04B by Friday, noting that BLC
Bank Listed 350,000 New Preferred “C” shares with
a subscription price of $100/share.
On a comparative scale, the Lebanese equity
benchmark index failed to outperform the Morgan
Stanley (MSCI) Emerging index as it advanced by
2.91% to end the week at 947.67 points. In more
details, the MSCI Emerging Markets Index was
lifted by the Rupee’s surge that followed the central
bank’s decision to ease foreign borrowing
procedures and to implement short term measures
to boost confidence in the Indian economy.
However, the BSI outperformed most of Arab
bourses in addition to the S&P Pan Arab Composite
LargeMidCap Index and the S&P AFE40 Index that
tumbled 2.10% and 2.16% to reach 118.70 points
and 57.64 points, respectively.
The U.S willingness to intervene in the Syrian
conflict continued to negatively influence activity on
the Arab bourses. Geopolitical tensions and
Investors uncertainties overshadowed the
performance of GCC stock markets, with Dubai,
Kuwait and Abu Dhabi suffering from sharp weekly
losses of 7.37%, 5.43% and 5.27%, respectively.
Tunisia bourse underwent the slightest losses this
week with a 0.27% decline.
Banking Sector
Mkt 6/9/2013 30/8/2013 %Change
BLOM (GDR) BSE $8.50 $8.50 0.00%
BLOM Listed BSE $8.26 $8.27 -0.12%
BLOM (GDR) LSE $8.34 $8.36 -0.18%
Audi (GDR) BSE $6.29 $6.29 0.00%
Audi Listed BSE $6.10 $6.25 -2.40%
Audi (GDR) LSE $6.20 $6.25 -0.80%
Byblos (C) BSE $1.47 $1.49 -1.34%
Byblos (GDR) LSE $72.00 $72.00 0.00%
Bank of Beirut (C) BSE $19.00 $19.00 0.00%
BLC (C) BSE $1.95 $1.95 0.00%
Fransabank (B) OTC $28.00 $28.00 0.00%
BEMO (C) BSE $1.84 $1.84 0.00%
* 25 August 2006 = 100
Mkt 6/9/2013 30/8/2013 % Change
Banks’ Preferred
Shares Index *
104.29 104.27 0.02%
BEMO Preferred 2006 BSE $101.00 $101.00 0.00%
Audi Pref. E BSE $101.50 $101.50 0.00%
Audi Pref. F BSE $100.10 $100.10 0.00%
Audi Pref. G BSE $100.00 $100.00 0.00%
Audi Pref. H BSE $100.00 $100.00 0.00%
Byblos Preferred 08 BSE $100.00 $100.00 0.00%
Byblos Preferred 09 BSE $100.00 $100.00 0.00%
Bank of Beirut Pref. E BSE $25.70 $25.70 0.00%
Bank of Beirut Pref. I BSE $25.40 $25.39 0.04%
Bank of Beirut Pref. H BSE $25.65 $25.60 0.20%
BLOM Preferred 2011 BSE $10.15 $10.15 0.00%
1050
1100
1150
1200
1250
Sep-12 Dec-12 Mar-13 Jun-13 Sep-13
BLOM Stock Index HI: 1,227.46
LO: 1104.42

The Lebanon Brief Page 4 of 14
ISSUE 832; Week of 05 – 17 August 2013
S A L
Real Estate
Mkt 6/9/2013 30/8/2013 % Change
Solidere (A) BSE $10.90 $11.01 -1.00%
Solidere (B) BSE $10.82 $10.62 1.88%
Solidere (GDR) LSE $10.31 $10.65 -3.19%
Once again, the banking sector spread its
dominance over the market this week, accounting
for 77.51% of total trades. The listed shares of
BLOM, Audi and Byblos declined by 0.12%,
2.40% and 1.34% to settle at $8.26, $6.10 and
$1.47, respectively.
Manufacturing Sector
Mkt 6/9/2013 30/8/2013 % Change
HOLCIM Liban BSE $15.68 $15.68 0.00%
Ciments Blancs (B) BSE $3.23 $3.23 0.00%
Ciments Blancs (N) BSE $3.24 $3.24 0.00%
On the London Stock Exchange, the GDRs of
Solidere, BLOM and Audi edged down by 3.19%,
0.18% and 0.80% to reach $10.31, $8.34 and
$6.20, respectively.
Funds
Mkt 6/9/2013 30/8/2013 % Change
BLOM Cedars Balanced
Fund Tranche “A” ----- $6,882.56 $6,898.26 -0.23%
BLOM Cedars Balanced
Fund Tranche “B” ----- $5,009.47 $5,024.81 -0.31%
BLOM Cedars Balanced
Fund Tranche “C” ----- $5,227.35 $5,239.28 -0.23%
BLOM Bond Fund ----- $9,621.91 $9,724.12 -1.05%
On the other hand, the BLOM preferred shares
index (BPSI) slightly edged up by 0.02% to reach
104.29 points boosted by Bank of Beirut preferred
shares increases. Accordingly, the class “I”
posted a 0.04% to $25.40, while the class “H”
edged 0.20% up to settle at $25.65. Worth
pointing out that BLC bank listed on the BSE
350,000 preferred shares class “C” that started
trading on Monday.
Retail Sector
Mkt 6/9/2013 30/8/2013 % Change
RYMCO BSE $3.50 $3.50 0.00%
ABC (New) OTC $33.00 $33.00 0.00%
Solidere stocks were seen traded on low volume
this week, representing 22.49% of total trades.
Solidere stock Class A fell 1.00% to end the week
at $10.90, while Solidere Class B increased by
1.88% to $10.82.
Looking ahead, if the cabinet formation dilemma
would be solved in the near future, it may pull up
the BSI from its losses. However, investors will
remain on the sidelines waiting the final decision
of the U.S concerning its military action in Syria.
Tourism Sector
Mkt 6/9/2013 30/8/2013 % Change
Casino Du Liban OTC $480.00 $480.00 0.00%
SGHL OTC $7.00 $7.00 0.00%
The Lebanon Brief Page 5 of 14
ISSUE 832; Week of 05 – 17 August 2013
S A L
Foreign Exchange Market
Lebanese Forex Market
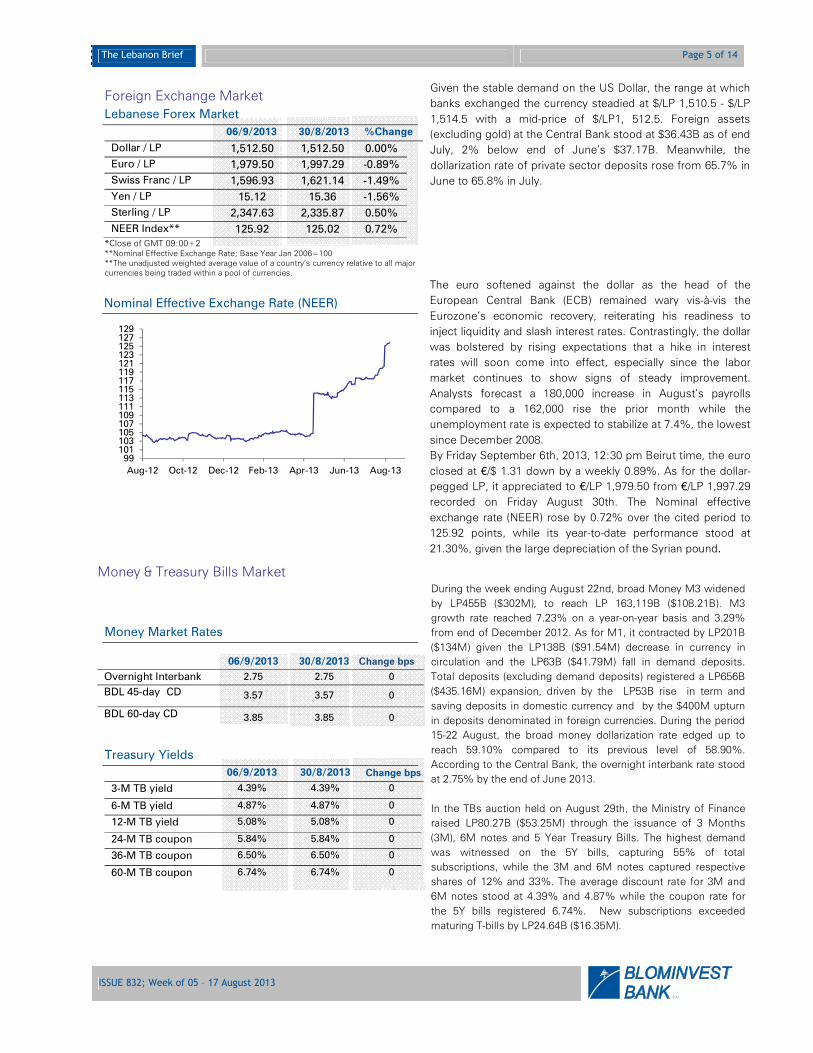
06/9/2013 30/8/2013 %Change
Dollar / LP 1,512.50 1,512.50 0.00%
Euro / LP 1,979.50 1,997.29 -0.89%
Swiss Franc / LP 1,596.93 1,621.14 -1.49%
Yen / LP 15.12 15.36 -1.56%
Sterling / LP 2,347.63 2,335.87 0.50%
NEER Index** 125.92 125.02 0.72% *Close of GMT 09:00+2 **Nominal Effective Exchange Rate; Base Year Jan 2006=100
**The unadjusted weighted average value of a country’s currency relative to all major
currencies being traded within a pool of currencies.
Given the stable demand on the US Dollar, the range at which
banks exchanged the currency steadied at $/LP 1,510.5 - $/LP
1,514.5 with a mid-price of $/LP1, 512.5. Foreign assets
(excluding gold) at the Central Bank stood at $36.43B as of end
July, 2% below end of June’s $37.17B. Meanwhile, the
dollarization rate of private sector deposits rose from 65.7% in
June to 65.8% in July.
Nominal Effective Exchange Rate (NEER)
The euro softened against the dollar as the head of the
European Central Bank (ECB) remained wary vis-à-vis the
Eurozone’s economic recovery, reiterating his readiness to
inject liquidity and slash interest rates. Contrastingly, the dollar
was bolstered by rising expectations that a hike in interest
rates will soon come into effect, especially since the labor
market continues to show signs of steady improvement.
Analysts forecast a 180,000 increase in August’s payrolls
compared to a 162,000 rise the prior month while the
unemployment rate is expected to stabilize at 7.4%, the lowest
since December 2008.
By Friday September 6th, 2013, 12:30 pm Beirut time, the euro
closed at €/$ 1.31 down by a weekly 0.89%. As for the dollar-
pegged LP, it appreciated to €/LP 1,979.50 from €/LP 1,997.29
recorded on Friday August 30th. The Nominal effective
exchange rate (NEER) rose by 0.72% over the cited period to
125.92 points, while its year-to-date performance stood at
21.30%, given the large depreciation of the Syrian pound.
Money & Treasury Bills Market
Money Market Rates
Treasury Yields
06/9/2013 30/8/2013 Change bps
3-M TB yield 4.39% 4.39% 0
6-M TB yield 4.87% 4.87% 0
12-M TB yield 5.08% 5.08% 0
24-M TB coupon 5.84% 5.84% 0
36-M TB coupon 6.50% 6.50% 0
60-M TB coupon 6.74% 6.74% 0
06/9/2013 30/8/2013 Change bps
Overnight Interbank 2.75 2.75 0
BDL 45-day CD 3.57 3.57 0
BDL 60-day CD 3.85 3.85 0
During the week ending August 22nd, broad Money M3 widened
by LP455B ($302M), to reach LP 163,119B ($108.21B). M3
growth rate reached 7.23% on a year-on-year basis and 3.29%
from end of December 2012. As for M1, it contracted by LP201B
($134M) given the LP138B ($91.54M) decrease in currency in
circulation and the LP63B ($41.79M) fall in demand deposits.
Total deposits (excluding demand deposits) registered a LP656B
($435.16M) expansion, driven by the LP53B rise in term and
saving deposits in domestic currency and by the $400M upturn
in deposits denominated in foreign currencies. During the period
15-22 August, the broad money dollarization rate edged up to
reach 59.10% compared to its previous level of 58.90%.
According to the Central Bank, the overnight interbank rate stood
at 2.75% by the end of June 2013.
In the TBs auction held on August 29th, the Ministry of Finance
raised LP80.27B ($53.25M) through the issuance of 3 Months
(3M), 6M notes and 5 Year Treasury Bills. The highest demand
was witnessed on the 5Y bills, capturing 55% of total
subscriptions, while the 3M and 6M notes captured respective
shares of 12% and 33%. The average discount rate for 3M and
6M notes stood at 4.39% and 4.87% while the coupon rate for
the 5Y bills registered 6.74%. New subscriptions exceeded
maturing T-bills by LP24.64B ($16.35M).
99101103105107109111113115117119121123125127129
Aug-12 Oct-12 Dec-12 Feb-13 Apr-13 Jun-13 Aug-13
The Lebanon Brief Page 6 of 14
ISSUE 832; Week of 05 – 17 August 2013
S A L
Eurobond Market
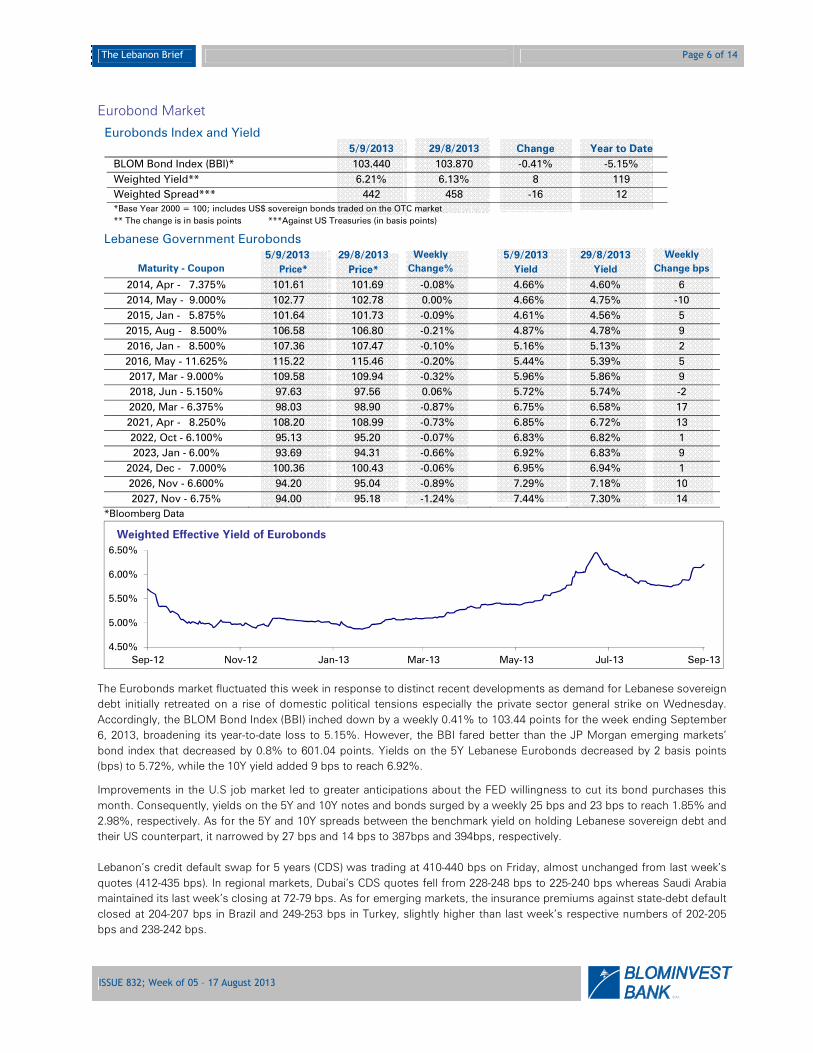
Eurobonds Index and Yield 5/9/2013 29/8/2013 Change Year to Date
BLOM Bond Index (BBI)* 103.440 103.870 -0.41% -5.15%
Weighted Yield** 6.21% 6.13% 8 119
Weighted Spread*** 442 458 -16 12
*Base Year 2000 = 100; includes US$ sovereign bonds traded on the OTC market
** The change is in basis points ***Against US Treasuries (in basis points)
Lebanese Government Eurobonds
Maturity - Coupon
5/9/2013
Price*
29/8/2013
Price*
Weekly
Change%
5/9/2013
Yield
29/8/2013
Yield
Weekly
Change bps
2014, Apr - 7.375% 101.61 101.69 -0.08% 4.66% 4.60% 6
2014, May - 9.000% 102.77 102.78 0.00% 4.66% 4.75% -10
2015, Jan - 5.875% 101.64 101.73 -0.09% 4.61% 4.56% 5
2015, Aug - 8.500% 106.58 106.80 -0.21% 4.87% 4.78% 9
2016, Jan - 8.500% 107.36 107.47 -0.10% 5.16% 5.13% 2
2016, May - 11.625% 115.22 115.46 -0.20% 5.44% 5.39% 5
2017, Mar - 9.000% 109.58 109.94 -0.32% 5.96% 5.86% 9
2018, Jun - 5.150% 97.63 97.56 0.06% 5.72% 5.74% -2
2020, Mar - 6.375% 98.03 98.90 -0.87% 6.75% 6.58% 17
2021, Apr - 8.250% 108.20 108.99 -0.73% 6.85% 6.72% 13
2022, Oct - 6.100% 95.13 95.20 -0.07% 6.83% 6.82% 1
2023, Jan - 6.00% 93.69 94.31 -0.66% 6.92% 6.83% 9
2024, Dec - 7.000% 100.36 100.43 -0.06% 6.95% 6.94% 1
2026, Nov - 6.600% 94.20 95.04 -0.89% 7.29% 7.18% 10
2027, Nov - 6.75% 94.00 95.18 -1.24% 7.44% 7.30% 14
*Bloomberg Data
The Eurobonds market fluctuated this week in response to distinct recent developments as demand for Lebanese sovereign
debt initially retreated on a rise of domestic political tensions especially the private sector general strike on Wednesday.
Accordingly, the BLOM Bond Index (BBI) inched down by a weekly 0.41% to 103.44 points for the week ending September
6, 2013, broadening its year-to-date loss to 5.15%. However, the BBI fared better than the JP Morgan emerging markets’
bond index that decreased by 0.8% to 601.04 points. Yields on the 5Y Lebanese Eurobonds decreased by 2 basis points
(bps) to 5.72%, while the 10Y yield added 9 bps to reach 6.92%.
Improvements in the U.S job market led to greater anticipations about the FED willingness to cut its bond purchases this
month. Consequently, yields on the 5Y and 10Y notes and bonds surged by a weekly 25 bps and 23 bps to reach 1.85% and
2.98%, respectively. As for the 5Y and 10Y spreads between the benchmark yield on holding Lebanese sovereign debt and
their US counterpart, it narrowed by 27 bps and 14 bps to 387bps and 394bps, respectively.
Lebanon’s credit default swap for 5 years (CDS) was trading at 410-440 bps on Friday, almost unchanged from last week’s
quotes (412-435 bps). In regional markets, Dubai’s CDS quotes fell from 228-248 bps to 225-240 bps whereas Saudi Arabia
maintained its last week’s closing at 72-79 bps. As for emerging markets, the insurance premiums against state-debt default
closed at 204-207 bps in Brazil and 249-253 bps in Turkey, slightly higher than last week’s respective numbers of 202-205
bps and 238-242 bps.
4.50%
5.00%
5.50%
6.00%
6.50%
Sep-12 Nov-12 Jan-13 Mar-13 May-13 Jul-13 Sep-13
Weighted Effective Yield of Eurobonds
The Lebanon Brief Page 7 of 14
ISSUE 832; Week of 05 – 17 August 2013
S A L
EEEECONOMIC AND FINANCIAL NEWS CONOMIC AND FINANCIAL NEWS CONOMIC AND FINANCIAL NEWS CONOMIC AND FINANCIAL NEWS
Lebanon’s Fiscal Deficit
(By May, in $B)
Source: Ministry of Finance
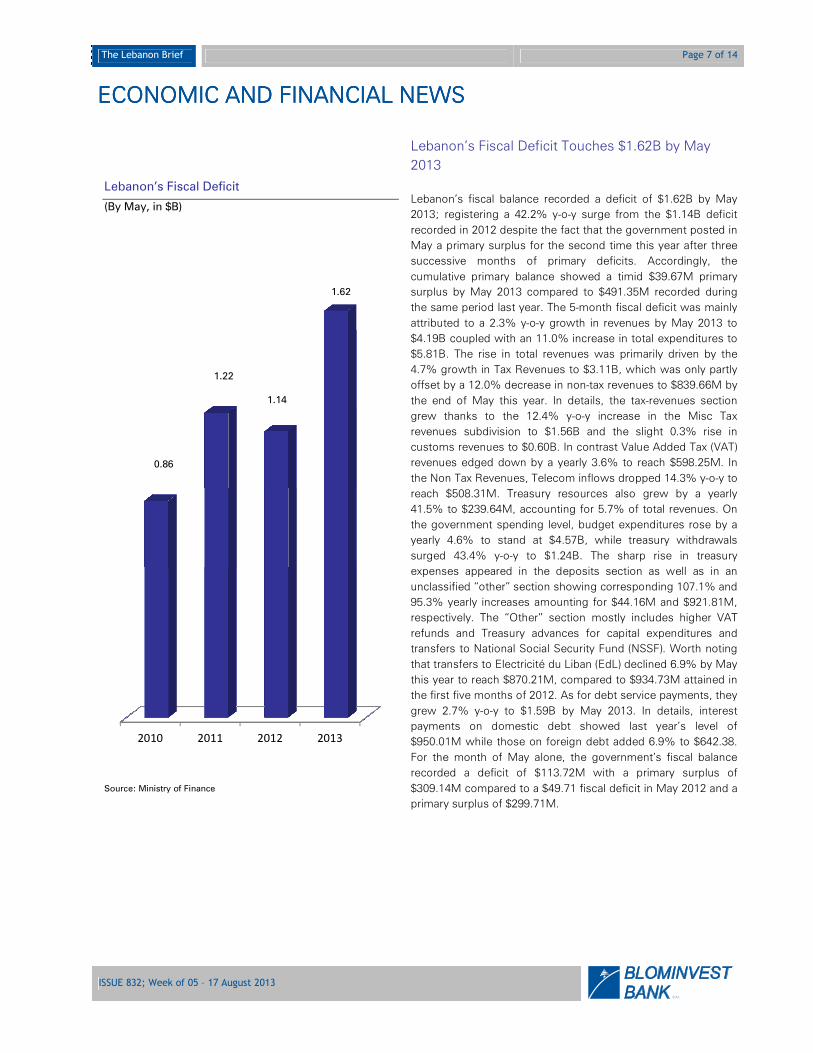
Lebanon’s Fiscal Deficit Touches $1.62B by May
2013
Lebanon’s fiscal balance recorded a deficit of $1.62B by May
2013; registering a 42.2% y-o-y surge from the $1.14B deficit
recorded in 2012 despite the fact that the government posted in
May a primary surplus for the second time this year after three
successive months of primary deficits. Accordingly, the
cumulative primary balance showed a timid $39.67M primary
surplus by May 2013 compared to $491.35M recorded during
the same period last year. The 5-month fiscal deficit was mainly
attributed to a 2.3% y-o-y growth in revenues by May 2013 to
$4.19B coupled with an 11.0% increase in total expenditures to
$5.81B. The rise in total revenues was primarily driven by the
4.7% growth in Tax Revenues to $3.11B, which was only partly
offset by a 12.0% decrease in non-tax revenues to $839.66M by
the end of May this year. In details, the tax-revenues section
grew thanks to the 12.4% y-o-y increase in the Misc Tax
revenues subdivision to $1.56B and the slight 0.3% rise in
customs revenues to $0.60B. In contrast Value Added Tax (VAT)
revenues edged down by a yearly 3.6% to reach $598.25M. In
the Non Tax Revenues, Telecom inflows dropped 14.3% y-o-y to
reach $508.31M. Treasury resources also grew by a yearly
41.5% to $239.64M, accounting for 5.7% of total revenues. On
the government spending level, budget expenditures rose by a
yearly 4.6% to stand at $4.57B, while treasury withdrawals
surged 43.4% y-o-y to $1.24B. The sharp rise in treasury
expenses appeared in the deposits section as well as in an
unclassified “other” section showing corresponding 107.1% and
95.3% yearly increases amounting for $44.16M and $921.81M,
respectively. The “Other” section mostly includes higher VAT
refunds and Treasury advances for capital expenditures and
transfers to National Social Security Fund (NSSF). Worth noting
that transfers to Electricité du Liban (EdL) declined 6.9% by May
this year to reach $870.21M, compared to $934.73M attained in
the first five months of 2012. As for debt service payments, they
grew 2.7% y-o-y to $1.59B by May 2013. In details, interest
payments on domestic debt showed last year’s level of
$950.01M while those on foreign debt added 6.9% to $642.38.
For the month of May alone, the government’s fiscal balance
recorded a deficit of $113.72M with a primary surplus of
$309.14M compared to a $49.71 fiscal deficit in May 2012 and a
primary surplus of $299.71M.
2010 2011 2012 2013
0.86
1.22
1.14
1.62

The Lebanon Brief Page 8 of 14
ISSUE 832; Week of 05 – 17 August 2013
S A L
Total Consolidated Assets of Commercial Banks
(By July, in $B)
Source: Banque du Liban
MENA Sovereign Risk Rating Scores- Q3 2013
Country Total Score
Oman 88
Qatar 86
UAE 85
Israel 76
Algeria 69
Bahrain 65
Iraq 65
Morocco 50
Jordan 46
Lebanon 38
Tunisia 38
Egypt 36
Commercial Banks Consolidated Total Assets Grew
to $157.81B in July
Commercial banks’ total consolidated assets amounted to
$157.81B by July, equivalent to an 8.5% y-o-y growth. On a year-
to-date basis, total assets grew by 3.9%, slightly faster than
3.5% recorded in the same period last year. The upturn in total
assets is accredited to the respective 5% and 6% y-t-d growths
of claims on the resident private sector and the public sector to
$39.77B and $32.88B. By July, commercial banks’ holdings of
LBP denominated treasury bills (T-bills) stood at $17.16B, higher
than $15.62B for foreign-currency denominated T-bills.
However, the latter grew by 19.4% since year-start compared to
a 4.6% slip in the former, showing banks’ preference towards
holding Eurobonds in their lending portfolio. Meanwhile, foreign
assets continued their downward trend, slipping by 2.9% to
$25.41B by July. In detail, claims on the non-resident private
and financial sectors were scaled down by 3.7% and 4.9% to
$5.40B and $13.69B, respectively. In fact, lower non-resident
lending is linked to further instability in several MENA countries.
On the liabilities side, resident private sector deposits edged up
by 3% since year start to $104.1B, as deposits in foreign
currencies rose by 4% to $62.53B and as those in local currency
inched up by 2% to $41.58B. As for non-resident private sector
deposits, they continue to grow significantly, advancing by 12%
y-t-d to $27.08B, especially as heightened security tensions in
neighboring countries generates hefty capital outflows. The
dollarization rate of private sector deposits went from 65.7% in
June to 65.8% in July.
BMI: Lebanon’s Sovereign Risk Rating Score slips to
38/100
Business Monitor International (BMI)’s average Sovereign Risk
Rating (SRR) score for 12 MENA countries (excluding Syria)
steadied at 62/100 in Q3 2013. However, the report warns that
this broad figure fails to portray the widening gap between
gas/oil rich countries of the Gulf and net oil importers in North
Africa and the Levant region. In this light, and compared to the
previous quarter, the average SRR for the four rated Gulf States
rose by one point to 81 in parallel to a frail 47 for the six-rated oil
importers, a 2 points drop. In details, Lebanon’s SRR lost 2
points to 38 in Q3 2013 as BMI forecasts that no major policy
initiatives will see the light of day amidst the Syrian-imported
violence. Moreover, with public debt being one of the highest in
the world and with the primary budget sliding into deficit for the
first time in six years, future external shocks are likely to weigh
on Lebanon’s external position. On a comparative note,
Lebanon, Tunisia and Egypt were the bottom three with
respective scores of 38, 38 and 36. Contrastingly, Oman, Qatar
and UAE were the top rankers, with respective scores of 88, 86
and 85.
105.39
124.05
136.88
145.51
157.81
2009 2010 2011 2012 2013

The Lebanon Brief Page 9 of 14
ISSUE 832; Week of 05 – 17 August 2013
S A L
Source: Ministry of Tourism
Lebanon’s trade deficit
(Up to July, in $B)
Source: Jones Lang LaSalle
Trade Deficit Increases to $9.92B up to July 2013
The Lebanese trade deficit widened by 6.3% up to July 2013 to
reach $9.92B compared to $9.33B in the same period last year.
When annualized, the trade deficit to GDP ratio amplified from
37.9% in 2012 to 39.4% in 2013. This increase in deficit is due
to a 5.87% upturn in imports to $12.51B which outpaced the
4.26% rise in exports to $2.59B. The rise in imports does not
indicate a boost in domestic demand but is rather linked to the
heavy influx of Syrian refugees into the country. Mineral
products represented 24.5% of total imports as Machinery and
Electrical Instruments followed suit with a share of 12.37%. The
latter increased by 27% to $1.55B while the former rose by 4%
to $3.05B. China holds 9% of overall imports followed by 8% for
Italy and the USA and 7% for France. As for exports, Pearls,
Precious stones and metals, the largest with a share of 22% of
the total, plummeted by 40% year-on-year to reach $578.76M.
Exports of mineral products and base metals came in second
with the same share of 13%. Exports of mineral products
surged from $31.45M up to July 2012 to $325.445M up to July
2013 while those of base metals increased by 41% to
$347.28M. Syria still holds the largest portion of Lebanese
exports with 16% of total exports, followed by South Africa with
12%. Transit revenues rose by 36% to reach $266.45M up to
July compared to $196.318M for the same period in 2012. In
July alone, the trade deficit reached $1.44B given the 4.97%
monthly rise in imports to $1.72B and the 19.5% slump in
exports to $279.98M.
8.028.37
9.339.92
10.4310.91
11.8212.51
2.41 2.53 2.49 2.59
0.00
2.00
4.00
6.00
8.00
10.00
12.00
14.00
2010 2011 2012 2013
Trade Deficit Imports Exports
The Lebanon Brief Page 10 of 14
ISSUE 832; Week of 05 – 17 August 2013
S A L
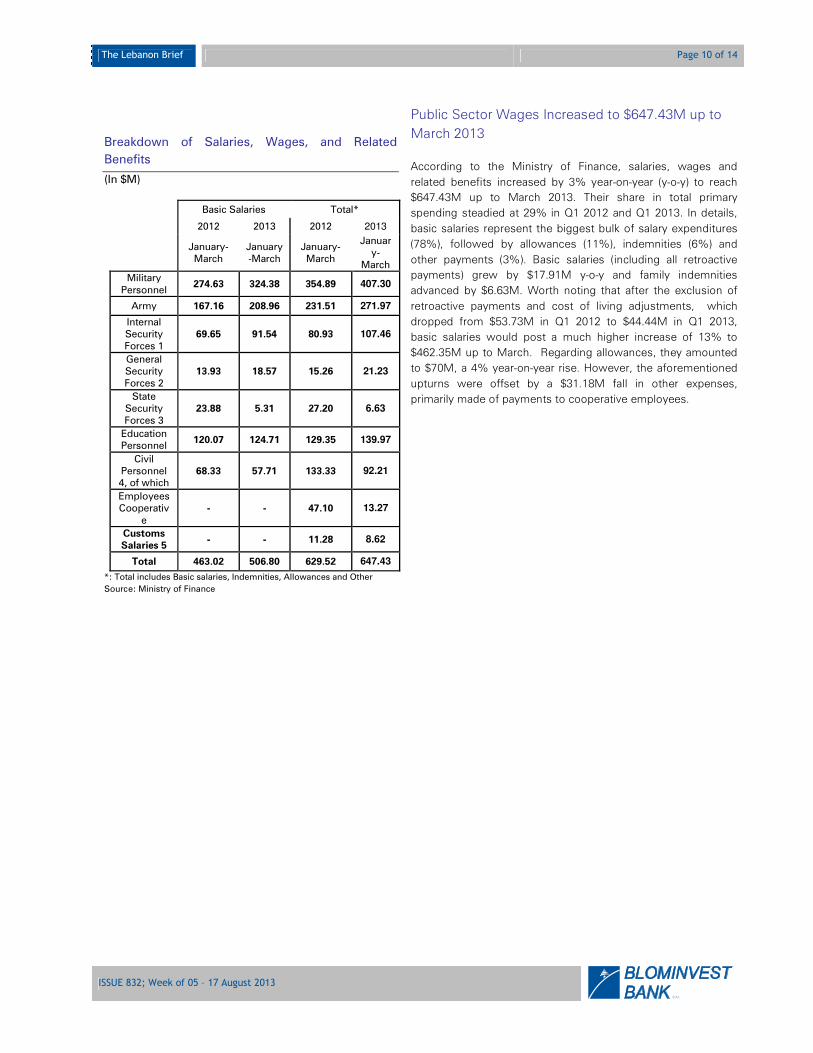
Breakdown of Salaries, Wages, and Related
Benefits
(In $M)
Basic Salaries Total*
2012 2013 2012 2013
January-March
January-March
January-March
January-
March
Military Personnel
274.63 324.38 354.89 407.30
Army 167.16 208.96 231.51 271.97
Internal Security Forces 1
69.65 91.54 80.93 107.46
General Security Forces 2
13.93 18.57 15.26 21.23
State Security Forces 3
23.88 5.31 27.20 6.63
Education Personnel
120.07 124.71 129.35 139.97
Civil Personnel 4, of which
68.33 57.71 133.33 92.21
Employees Cooperativ
e - - 47.10 13.27
Customs
Salaries 5 - - 11.28 8.62
Total 463.02 506.80 629.52 647.43
*: Total includes Basic salaries, Indemnities, Allowances and Other
Source: Ministry of Finance
Public Sector Wages Increased to $647.43M up to
March 2013
According to the Ministry of Finance, salaries, wages and
related benefits increased by 3% year-on-year (y-o-y) to reach
$647.43M up to March 2013. Their share in total primary
spending steadied at 29% in Q1 2012 and Q1 2013. In details,
basic salaries represent the biggest bulk of salary expenditures
(78%), followed by allowances (11%), indemnities (6%) and
other payments (3%). Basic salaries (including all retroactive
payments) grew by $17.91M y-o-y and family indemnities
advanced by $6.63M. Worth noting that after the exclusion of
retroactive payments and cost of living adjustments, which
dropped from $53.73M in Q1 2012 to $44.44M in Q1 2013,
basic salaries would post a much higher increase of 13% to
$462.35M up to March. Regarding allowances, they amounted
to $70M, a 4% year-on-year rise. However, the aforementioned
upturns were offset by a $31.18M fall in other expenses,
primarily made of payments to cooperative employees.
The Lebanon Brief Page 11 of 14
ISSUE 832; Week of 05 – 17 August 2013
S A L
CCCCORPORATEORPORATEORPORATEORPORATE DEVELOPMENTSDEVELOPMENTSDEVELOPMENTSDEVELOPMENTS
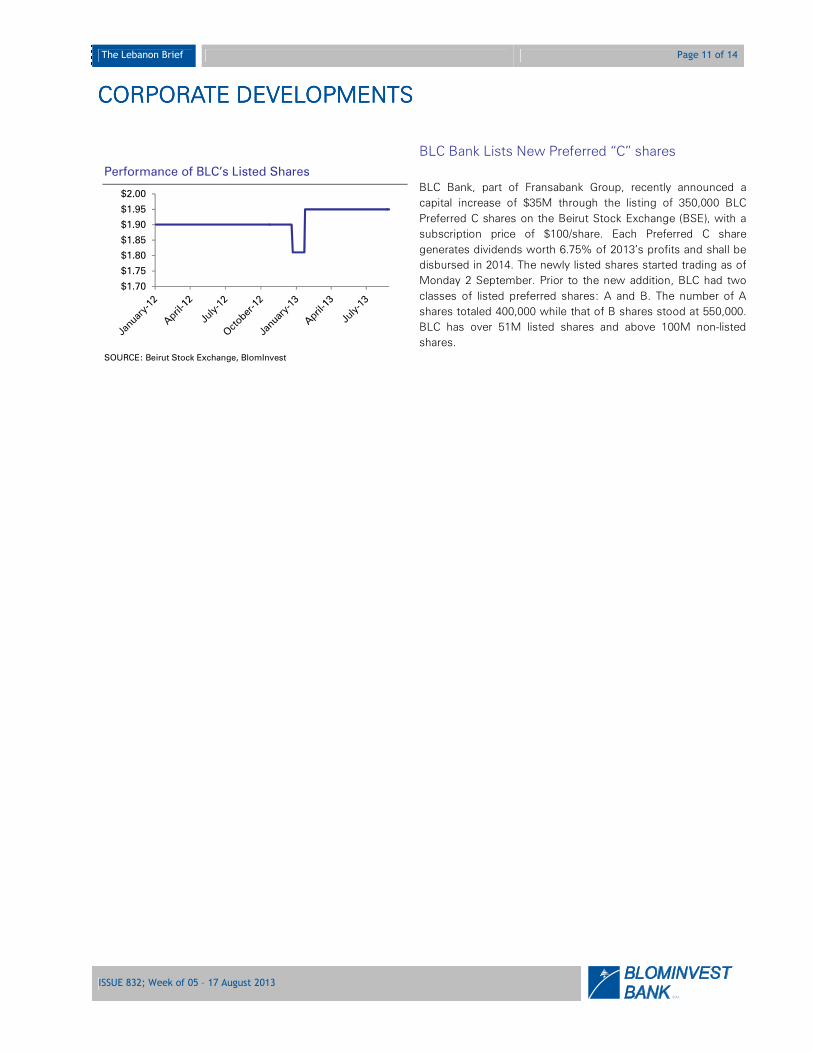
Performance of BLC’s Listed Shares
SOURCE: Beirut Stock Exchange, BlomInvest
BLC Bank Lists New Preferred “C” shares
BLC Bank, part of Fransabank Group, recently announced a
capital increase of $35M through the listing of 350,000 BLC
Preferred C shares on the Beirut Stock Exchange (BSE), with a
subscription price of $100/share. Each Preferred C share
generates dividends worth 6.75% of 2013’s profits and shall be
disbursed in 2014. The newly listed shares started trading as of
Monday 2 September. Prior to the new addition, BLC had two
classes of listed preferred shares: A and B. The number of A
shares totaled 400,000 while that of B shares stood at 550,000.
BLC has over 51M listed shares and above 100M non-listed
shares.
$1.70
$1.75
$1.80
$1.85
$1.90
$1.95
$2.00

The Lebanon Brief Page 12 of 14
ISSUE 832; Week of 05 – 17 August 2013
S A L
FFFFOCUS IN BRIEFOCUS IN BRIEFOCUS IN BRIEFOCUS IN BRIEF
New Angel Investors for Tech Startups: the Lebanese Banks
Value Added of Information &Technology to GDP, 2012
Source: world Bank data
Main Challenges for Private Equity Investments
Source: Survey by Zawya focusing on General Partners in the MENA
region, during Q1 of 2013
Amidst tighter economic conditions, an innovative financial service consented by the BdL introduced a new financing option
to the Lebanese startups. A new Circular (#331, available on BdL’s website) licensed the stepping in of banks to finance
startups, venture capital firms, incubators and accelerators working in the knowledge economy, not through the usual debt,
but this time through equity.
In essence, the move complements past initiatives to subsidize companies working in various economic sectors, and aims
at boosting the economic cycle through domestic lending and job creation. Meanwhile the unconventional part allowing
equity investment in startups builds on further market characteristics.
Tech startup firms are especially appreciated for their job creation benefits and resilience to the economic downturns when
fixed jobs are less available and entrepreneurship becomes more tempting. Yet, they are the ones facing most difficulties
when it comes to financing. Their current options were limited to private equity and some products of Islamic banking,
while the commercial banks were only involved through debt offering, provided that it is guaranteed by Kafalat and only for
a ceiling of $400k per company.
The BdL’s move thus reshuffled some of the financing options for both banks and startups. Building on the continuous
growth of bank deposits which advanced at an annual pace of 10% by July, much faster than the economy’s growth,
Lebanese banks preserved the best position to provide capital for the private sector, as the BdL governor puts it. On the
other hand, their lending portfolio to the private sector reached around $39.7 billion, almost 94% of the country’s GDP,
representing a high leverage ratio for companies and limiting the growth of debt-driven investments capabilities, hence the
benefits of switching to equity.
But does the circular offer enough incentives for banks to make use of it? A review of its clauses and conditions reveal
interesting opportunities, and quite some challenges.
The circular allows investments up to 7 years in startup companies, incubators, accelerators and venture capital firms
working in the knowledge economy field, as long as they are a Lebanese joint stock company and not working offshore.
36%
30%
30%
29%
20%
20%
Egypt
Tunisia
Morocco
Jordan
Lebanon
UnitedStates
21%
14%
14%
10%
9%
8%
8%
7%
7%
2%
Quality of deal flow
Corporate governance
High valuations
Human capital
Acceptance of PE funds as…
Market Regulations
Growth prospects
Lack of control over deals
Lack of bank financing
Lack of intermediary

The Lebanon Brief Page 13 of 14
ISSUE 832; Week of 05 – 17 August 2013
S A L
The returns are tempting. The circular stipulates that BdL will finance 75% of the bank’s investment in these firms. Banks
would receive zero-interest loans from BdL, and invest them in treasury bills. The invested loans will be calculated in a way
to generate interest equivalent to 75% of the bank’s participation in the firm, therefore limiting the banks’ exposure to 25%.
Total investable amounts in these firms are also limited. Only 3% of the bank’s capital can be used, out of which a
maximum of 10% is allowed in a single company. To put this into perspective, the largest banks such as BLOM and Audi
can individually invest up to $50 million and $66 million in the field, respectively, and given the offered hedge from BdL, the
direct exposure won’t exceed $12.5 million for BLOM and $16 million for Audi. Investments in a single company would also
be limited to $5million from BLOM and $6.6 million from Audi. Whilst this is minimal on a large bank’s balance sheets, it is
very advantageous for firms, as most current investments are concentrated below the $2 million bar.
For reference, Lebanese Business Angels and Cedrus Ventures offer to finance companies with a budget going from $50k
to $500k. Venture capital funds like Berytech’s and Middle East Venture Fund invest up to $2 million, and only the
International Finance Corporation (IFC) and Riyada Enterprise Development (RED) participate with more than $2 million.
Now, and as a result of the new circular, the Lebanese banks would make around $385 million available to fund startups in
the knowledge economy.
The 10% rule also highlights the need for diversification and entails investment in 10 different companies. The reason is that
despite their unlimited upside potential, startup companies have a low survivorship rate of around 20% during the first 3
years. In this area, incubators and accelerators play a significant role as they increase the chances of hosting successful
companies. For instance, Seeqnce reported that 10 of 22 of their graduated tenants are fully active.
The offered hedge by BdL against the banks’ investments therefore looks appealing. Some aspects remain to be cleared
though. One is the method that will be used to calculate the interests to be received by banks, or more accurately whether
the bank’s initial investment would be matched by interests based on its present or future value. Another question for banks
would be the risk-weighted assets required for such investments. Basel II stipulates a risk weighted allocation of 100% for
exposures to equity investments, while Basel III can go up to 400% for exposures to not publicly traded equity investments
and 600% for certain investment funds.
But aside from the risks and returns, many challenges await the implementation of this circular.
Certainly, the regular channels of commercial banks’ credit are not best suited to advise on equity financing opportunities,
but most of the Lebanese banks have an investment arm and are not short of skilled investment teams. Many banks are
also already indirectly engaged in the private equity world. Blominvest bank, alongside 5 other banks1, holds a share in the
Building Block Equity Fund which has a capital of $7.3 million and is managed by Middle East Venture Partners (MEVP). The
fund had made successful investments in 3 companies (shahiya.com, shawarmanji and cedar books). Audi Saradar
investment bank is also a partner in Berytech. The question remains whether banks’ participations in these funds and firms
would benefit from BdL’s facilities, given that the majority are not limited to tech companies and many have the legal form
of a limited partnership or registered offshore.
The circular also notes an active role for banks in the development of the firm’s business, which might be of concern to
both banks and startups. The screening and selection of successful startups is an enormous effort and the continuous
counseling and follow up require a mobilization of dedicated teams. To note the difficulty of having companies in the
pipeline, it suffices to see that many of the funds’ available capital are still not allocated. Incubators and accelerators remain
the first place where investment funds look as they have developed considerable experience in screening companies and
fostering their development. Berytech, the pioneer incubator in Lebanon graduated over 60 tenants during the past decade.
In this context, banks might opt for investments in funds at the expense of direct investing in companies if they represent
less of a hassle.
In all cases, the potential remains huge, especially for technology and information startups. Software and online products
and solutions can reach a huge consumer base and need not be capital intensive. The MENA region alone has a population
of over 350 million people, a third of which are under the age of 15, eager for connectivity and smart devices. Some of the
1 Fransabank, Bank Audi, BankMed, BLF, Crédit Libanais

The Lebanon Brief Page 14 of 14
ISSUE 832; Week of 05 – 17 August 2013
S A L
MENA countries also rank well on the list of highest GDP/Capita in the world. In Lebanon, around 1 million are subscribed to
3G services and around 2.6 million use internet through their fixed lines. The penetration rate for mobiles is also projected
to exceed the current 93% as Lebanon remains one of the few countries with a less than 100% rate.
Private equity remains subdued in the MENA region, with total investments representing 0.05% of its GDP in 2012, well
below the US’ 0.86% and the UK’s 1.05%. However information and technology gained special focus earning it the largest
share of 40% of the total investment volume made in the MENA region (excluding Israel) during 2012. This is one sector
where a small population is not an impediment. The 7million+ population of Israel recorded around 3,500 startups solely
focused on tech during 2012. Its dubbed “Silicon Wadi” is the second largest concentration of high tech industries after US’
“Silicon Valley”.
With low liquidity needs, high expected returns and a hedged risk, funding the tech startups though equity represents a
worthy opportunity. The legendary entrepreneurial spirit of the Lebanese might find more reasons to hold on to the country
and help pull the economy out of stagnation and debt. Certainly, the accompanying infrastructure and mechanics need to
follow, but it is still a milestone that was achieved by the Central bank and to be followed by the financial sector, hoping it
will encourage talent to uncover and multiply.
The Lebanon Brief
Page 15 of 14
Your Investment Reference
S A L
Research Department:
Riwa Daou [email protected]
Mirna Chami [email protected]
Maya Mantach [email protected]
Marwan Mikhael [email protected]