Embed Size (px)
Citation preview

P R I N C E T O N S U R V E Y R E S E A R C H A S S O C I A T E S I N T E R N A T I O N A L
1
Blogger Callback Survey Final Revised Topline 7/6/06
Data for July 5, 2005 – February 17, 2006
Princeton Survey Research Associates International for the Pew Internet & American Life Project
Sample: n = 233 bloggers, age 18 and older Interviewing dates: 07.05.05 – 02.17.06 Margin of error is plus or minus 7 percentage points for results based on the full sample [n=233]
NOTE: All trends are based on internet users age 18 and older, unless otherwise noted.
Q5 Do you use a computer at your workplace, at school, at home, or anywhere else on at
least an occasional basis?
CURRENT
% 100 Yes * No
Q6a Do you use the internet, at least occasionally? Q6b Do you send or receive email, at least occasionally?
CURRENT
% 100 Yes
Q7 Did you happen to use the internet YESTERDAY?
CURRENT
% 84 Yes 16 No 0 Don’t know/Refused

P R I N C E T O N S U R V E Y R E S E A R C H A S S O C I A T E S I N T E R N A T I O N A L
2
Q12 About how many years have you been an internet user? Q12.1 About how many months is that?
SIX MONTHS
OR LESS A
YEAR
TWO OR THREE YEARS
MORE THAN THREE
YEARS ----------
FOUR YEARS ----------
FIVE YEARS ----------
SIX OR MORE
DON’T KNOW/
REFUSED
Current 0 0 4 95 3 9 82 1 Jan/Feb 20061 2 3 9 85 7 14 64 1 Nov/Dec 20052 1 4 12 80 5 14 61 3
September 20053 1 3 11 83 5 16 62 1 May/June 20054 2 4 14 79 7 14 58 1 February 20055 2 4 11 82 7 14 61 1 January 20056 2 4 12 81 8 17 56 1
November 23-30, 20047 1 4 11 83 6 17 60 2 May/June 20048 2 4 15 78 9 16 54 1 February 20049 2 3 14 79 10 16 53 2
November 200310 2 4 16 77 9 19 49 1 July 200311 2 5 19 74 9 20 44 1
June 200312 2 5 19 73 12 19 42 2 April/May 200313 2 5 18 74 11 19 45 1
March 12-19, 200314 2 7 16 74 12 18 44 1 March 3-11, 200315 2 5 14 77 12 20 45 1
February 200316 1 4 19 73 9 18 46 1 December 200217 1 6 23 68 13 19 36 2 November 200218 2 5 23 70 12 19 39 1
October 200219 3 6 22 68 12 18 38 1 September 200220 2 5 23 68 13 18 38 1
July 200221 2 6 24 65 13 19 33 2 March/May 200222 7 10 31 52 10 15 25 *
January 200223 8 13 36 43 8 13 21 * December 200124 6 13 34 47 10 14 20 * November 200125 7 12 34 47 12 12 20 *
October 200126 5 15 32 47 12 14 19 1 September 200127 7 15 34 44 11 14 17 *
August 200128 10 15 32 43 10 13 18 * February 200129 11 16 37 35 10 11 13 1
December 200030 12 19 35 34 n/a n/a n/a * November 200031 11 19 33 37 n/a n/a n/a *
October 200032 12 20 33 35 n/a n/a n/a * September 200033 11 21 37 31 n/a n/a n/a *
July/August 200034 14 21 33 32 n/a n/a n/a * May/June 200035 15 19 33 33 n/a n/a n/a *
March/April 200036 18 20 32 30 n/a n/a n/a * October 199937 15 22 32 31 n/a n/a n/a 0
July 1999 17 23 32 28 n/a n/a n/a * November 1998 20 26 34 19 n/a n/a n/a 1
October 1996 26 38 24 12 n/a n/a n/a *

P R I N C E T O N S U R V E Y R E S E A R C H A S S O C I A T E S I N T E R N A T I O N A L
3
Q16 About how often do you go online from (INSERT) — several times a day, about once a day, 3-5 days a week, 1-2 days a week, every few weeks, every few months, or less often?
SEVERAL TIMES A
DAY
ABOUT ONCE A
DAY 3-5 DAYS A
WEEK 1-2 DAYS A
WEEK EVERY FEW
WEEKS LESS
OFTEN (VOL) NEVER
DON’T KNOW/REFUSED
a Home Current 64 17 9 4 2 1 2 0 Jan/Feb 2006 29 25 17 12 5 6 6 * May/June 2005 27 22 15 13 6 7 10 * June/July 2004 27 27 17 13 5 5 7 * March 2004 29 24 15 13 6 5 8 * b Work Current 43 6 5 4 1 6 35 * Jan/Feb 2006 35 8 5 3 2 7 40 1 May/June 2005 35 9 5 4 2 6 39 * June/July 2004 28 12 5 4 1 5 44 * March 2004 28 10 5 6 2 4 44 * c Someplace other
than home or work
Current 6 8 4 15 11 22 34 1 Jan/Feb 2006 3 3 4 5 9 21 56 * March 2004 3 3 3 6 6 15 64 1
WEBA Please tell me if you ever use the internet to do any of the following things. Do you
ever…?
TOTAL HAVE EVER DONE
THIS HAVE NOT DONE
THIS DON’T KNOW/
REFUSED
Create a web log or “blog” that others can read on the web
Current 100 0 0 Look online for news or information about
politics or political campaigns
Current 72 28 0 Nov 2004 58 42 * May/June 2004 49 51 * February 2004 46 54 * Nov 2002 40 60 * Oct 2002 45 55 * Sept 2002 42 57 * June 26-July 26, 2002 43 57 0 Fall 2000 43 57 * July-August 2000 30 70 * May-June 2000 34 66 * April 2000 34 66 * March 2000 35 65 *
P R I N C E T O N S U R V E Y R E S E A R C H A S S O C I A T E S I N T E R N A T I O N A L
4
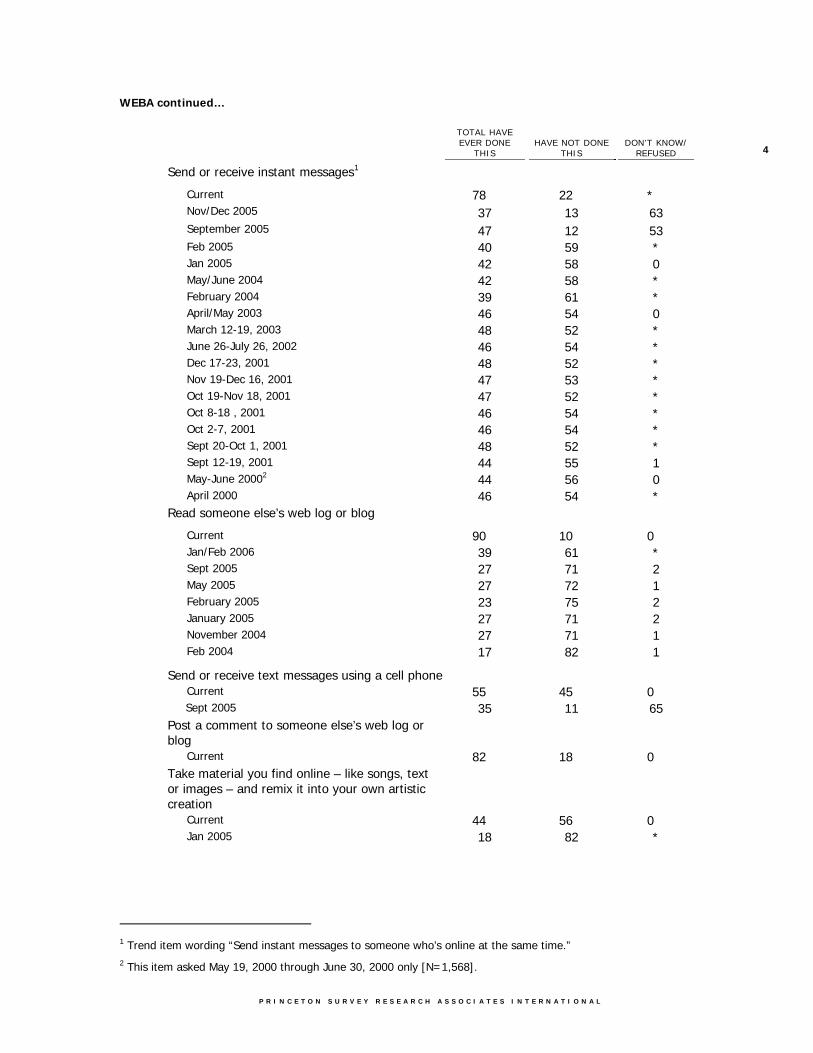
WEBA continued…
TOTAL HAVE EVER DONE
THIS HAVE NOT DONE
THIS DON’T KNOW/
REFUSED
Send or receive instant messages1
Current 78 22 * Nov/Dec 2005 37 13 63 September 2005 47 12 53 Feb 2005 40 59 * Jan 2005 42 58 0 May/June 2004 42 58 * February 2004 39 61 * April/May 2003 46 54 0 March 12-19, 2003 48 52 * June 26-July 26, 2002 46 54 * Dec 17-23, 2001 48 52 * Nov 19-Dec 16, 2001 47 53 * Oct 19-Nov 18, 2001 47 52 * Oct 8-18 , 2001 46 54 * Oct 2-7, 2001 46 54 * Sept 20-Oct 1, 2001 48 52 * Sept 12-19, 2001 44 55 1 May-June 20002 44 56 0 April 2000 46 54 * Read someone else’s web log or blog
Current 90 10 0 Jan/Feb 2006 39 61 * Sept 2005 27 71 2 May 2005 27 72 1 February 2005 23 75 2 January 2005 27 71 2 November 2004 27 71 1 Feb 2004 17 82 1
Send or receive text messages using a cell phone Current 55 45 0 Sept 2005 35 11 65 Post a comment to someone else’s web log or
blog
Current 82 18 0 Take material you find online – like songs, text
or images – and remix it into your own artistic creation
Current 44 56 0 Jan 2005 18 82 *
1 Trend item wording “Send instant messages to someone who’s online at the same time.” 2 This item asked May 19, 2000 through June 30, 2000 only [N=1,568].

P R I N C E T O N S U R V E Y R E S E A R C H A S S O C I A T E S I N T E R N A T I O N A L
5
WEBA continued…
TOTAL HAVE EVER DONE
THIS HAVE NOT DONE
THIS DON’T KNOW/
REFUSED
Share something online that you created yourself, like your own artwork, photos, stories or videos
Current 77 23 0 Nov/Dec 2005 26 74 *
Q19 On a different subject…Please tell me if you ever get news or information from the
following sources. Q20 Did you happen to gets news or information from (INSERT) YESTERDAY, or not?
TOTAL EVER USE SOURCE
----------
USED SOURCE YESTERDAY
TOTAL NEVER USE SOURCE
DON’T KNOW/ REFUSED
a Newspapers Current 83 44 17 * Jan/Feb 2006 (Total GP adults) 85 49 15 * June/July 2004 (Total GP adults) 85 51 15 0 b Television Current 86 66 14 0 Jan/Feb 2006 90 76 10 0 June/July 2004 92 74 8 * c Magazines Current 66 25 34 0 Jan/Feb 2006 56 21 44 0 June/July 2004 56 21 44 * d The radio Current 76 58 24 0 Jan/Feb 2006 72 54 28 * June/July 2004 73 54 27 * e The Internet Current 95 71 5 0 Jan/Feb 2006 53 38 47 0 June/July 2004 51 30 49 * Items f and g based on bloggers who get news from the internet [n=220] f Email newsletters or listservs Current 55 34 45 0 June/July 2004 29 15 70 * g Blogs Current 47 26 52 *

P R I N C E T O N S U R V E Y R E S E A R C H A S S O C I A T E S I N T E R N A T I O N A L
6
Q21 Thinking about the different kinds of news available to you, what do you prefer…?
CURRENT
JUNE/JULY 2004 (TOTAL GP ADULTS)
% 45 Getting news from sources that DON’T HAVE a particular political point of view
50
24 Getting news from sources that CHALLENGE your political point of view
18
18 Getting news from sources that SHARE your political point of view 22 13 Don’t know/Refused 10
Q22 Which of the following comes closest to describing why you go ONLINE to get news and
information?
Based on bloggers who get news online [N=220]
CURRENT JUNE/JULY 2004
(TOTAL GP ADULTS)
% 42 Because getting information online is more CONVENIENT for you 40 28 Because you can get information from a WIDER RANGE OF
VIEWPOINTS on the Web 29
9 Because you can get more IN DEPTH information on the Web 24 18 (VOL) Combination of above 2 3 Don’t know/Refused 5
Q23 IN THE PAST MONTH, have you used any of the following things?
YES NO DON’T KNOW/
REFUSED
a A cellular phone 89 11 0 b A digital camera 78 22 0 c A personal digital assistant or PDA,
such as a Palm Pilot or pocket PC 28 72 *
d A laptop computer with a wireless modem
56 44 0
e An iPod or MP3 player 47 53 0
BLOG1 About how many years have you been blogging? BLOG2 About how many months is that?
CURRENT
% 18 Six months or less 33 One year 30 2-3 years 19 4+ years 6 4 years 6 5 years 7 6+ years 1 Don’t know/Refused

P R I N C E T O N S U R V E Y R E S E A R C H A S S O C I A T E S I N T E R N A T I O N A L
7
BLOG3 BEFORE you started blogging, did you have a personal website, or not?
CURRENT
% 37 Yes 62 No * Don’t know/Refused
BLOG4 How many blogs do you have online?
CURRENT
% 53 One 17 Two 26 Three or more 5 Don’t know/Refused
BLOG5 For my next few questions, please think only about your MAIN blog, the one you spend
the most time on. Are you the only author on that blog, or are there multiple authors?
CURRENT
% 71 Respondent only author 29 Multiple authors 0 Don’t know/Refused
BLOG6 Do you blog under your own name, or do you use a pseudonym or made-up name?
CURRENT
% 43 Blog under own name 55 Use pseudonym/made-up name 2 Don’t know/Refused

P R I N C E T O N S U R V E Y R E S E A R C H A S S O C I A T E S I N T E R N A T I O N A L
8
BLOG7 What type of blogging software do you use?
CURRENT
% 13 Live Journal 9 MySpace 6 Blogger 2 Xanga 2 FrontPage 2 Typepad 2 Blogspot 1 Moveable Type 1 Squarespace 17 Something else 2 Respondent created own blogging software 5 Don’t use blogging software 38 Don’t know/Refused
BLOG9 Please tell me if you ever post any of the following on your blog, or not.
YES NO DON’T KNOW/
REFUSED
a Text, in the form of essays, articles or written entries
80 20 0
b Photos 72 28 * c Video 15 84 * d Audio 30 70 * e Images other than photos, like drawings,
graphs or clipart 49 50 1
BLOG10 How often do you typically post new material on your blog?
CURRENT
% 4 Several times a day 9 About once a day 15 3-5 days a week 24 1-2 days a week 28 Every few weeks 19 Less often 2 Don’t know/Refused

P R I N C E T O N S U R V E Y R E S E A R C H A S S O C I A T E S I N T E R N A T I O N A L
9
BLOG11 We’d like to know what inspires you to post new material on your blog. How often, if ever, have you been inspired to post by…?
OFTEN SOMETIMES HARDLY
EVER NEVER DON’T KNOW/
REFUSED
a A personal experience you had 48 30 11 12 0 b Something you read on another blog 18 36 18 28 0 c Something you heard or read in the
news media 24 31 20 26 0
d A song, movie or TV show 16 24 19 41 0 e Something else I haven’t already
mentioned 15 14 6 58 8
BLOG12 Overall, would you say…?
CURRENT
% 70 You only post new material when something inspires you to 22 You usually post new material on a regular schedule 4 (VOL) Both 2 (VOL) Neither 2 Don’t know/Refused
BLOG13 In a typical week, approximately how many hours do you spend working on your blog?
CURRENT
% 59 1-2 26 3-9 10 10 or more 6 Don’t know/Refused 2.00 Median
BLOG14 Where do you USUALLY blog from – home, work, or someplace else?
CURRENT
% 83 Home 7 Work 3 Someplace else 6 (VOL) Both home and work equally * Don’t know/Refused

P R I N C E T O N S U R V E Y R E S E A R C H A S S O C I A T E S I N T E R N A T I O N A L
10
BLOG15 Does your blog include a list of links to other blogs, like a blog roll, or not?
CURRENT
% 41 Yes 57 No 2 Don’t know/Refused
BLOG16 Approximately how many links are on your blog roll or list?
Based on those who have a blog roll [N=92] CURRENT
% 43 Fewer than 10 29 10-49 18 50 or more 10 Don’t know/Refused 10.00 Median
BLOG17 How often do you read other people’s web diaries or blogs?
Based on those who read others’ blogs [N=212] CURRENT
% 19 Several times a day 16 About once a day 16 3-5 days a week 20 1-2 days a week 15 Every few weeks 13 Less often 0 Don’t know/Refused
BLOG18 Do you happen to know if your blog is included on anyone else’s blog roll or list
of links?
CURRENT
% 46 Yes, blog is on others’ blog rolls 34 No 20 Don’t know 0 Refused

P R I N C E T O N S U R V E Y R E S E A R C H A S S O C I A T E S I N T E R N A T I O N A L
11
BLOG19 Approximately how many other blogs link to your site?
Based on those whose blog is on others’ blog rolls [N=104] CURRENT
% 27 Fewer than 10 29 10-49 19 50 or more 24 Don’t know 1 Refused 13.00 Median
BLOG20 In a typical day, about how many hits do you get on your blog?
CURRENT
% 22 Fewer than 10 17 10-99 13 100 or more 47 Don’t know 1 Refused 12.00 Median
BLOG21 Who reads your blog? Would you say your audience is mostly people you personally know – like friends, family members and colleagues – or mostly people you’ve never met?
CURRENT
% 49 Mostly people respondent personally knows 35 Mostly people respondent has never met 14 (VOL) Both equally 3 Don’t know 0 Refused
BLOG22 Overall, would you say you blog…?
CURRENT
% 52 Mostly for yourself 32 Mostly for your audience 14 (VOL) Both equally 1 (VOL) Neither 1 Don’t know/Refused

P R I N C E T O N S U R V E Y R E S E A R C H A S S O C I A T E S I N T E R N A T I O N A L
12
BLOG23 Do you allow comments on your blog, or not?
CURRENT
% 87 Yes 13 No 1 Don’t know/Refused
BLOG24 Do you provide an RSS feed of your blog, or not?
CURRENT
% 18 Yes 59 No 23 Don’t know/Refused
BLOG25 Is your blog mostly about one specific topic, like politics or food, or do you blog about a lot of different topics?
CURRENT
% 35 One topic 64 A lot of different topics 1 Don’t know/Refused
BLOG26 What would you say is the MAIN topic of your blog?
CURRENT
% 37 My life and personal experiences (personal diaries, journals) 11 Politics and government 7 Entertainment (movies, music, MP3 blogs) 6 Sports 5 General news and current events 5 Business 4 Technology (computers, internet, programming) 2 Religion/Spirituality/Faith 1 A particular hobby 1 Health (general health, an illness) 18 Other 3 Don’t know/Refused
BLOG27 Do you make money through your blog, or not?
CURRENT
% 8 Yes 92 No 0 Don’t know/Refused

P R I N C E T O N S U R V E Y R E S E A R C H A S S O C I A T E S I N T E R N A T I O N A L
13
BLOG28 Do you make money on your blog…?
Based on those who make money on their blog [N=18]
YES NO DON’T KNOW/
REFUSED
a Through advertising 56 44 0 b Through reader contributions, like a “tip
jar” 29 66 5
c Through premium content that is only accessibly by paying a fee
19 81 0
d By selling items on your site 68 32 0
BLOG29 Which of the following three statements BEST describes what your blog means to you…?
CURRENT
% 13 My blog is very important to me and it’s a big part of my life 40 My blog is like a hobby for me, and I enjoy working on it when I
can 44 My blog is something I do, but not something I spend a lot of
time on 2 (VOL) None of these 1 Don’t know/Refused
BLOG30 Here are some reasons a person might blog. Please tell me if each one is a reason YOU
PERSONALLY blog, or not. IF YES: Is it a MAJOR reason or only a MINOR reason?
TOTAL YES MAJOR
REASON
MINOR REASON
TOTAL NO, NOT A
REASON
DON’T KNOW/
REFUSED
a To express yourself creatively 77 52 25 23 0 b To influence the way other people think 51 27 24 49 0 c To motivate other people to action 61 29 32 38 1 d To document your personal experiences
and share them with others 76 50 26 24 0
e To share practical knowledge or skills with others
64 34 30 35 *
f To network or to meet new people 50 16 34 50 0 g To entertain people 61 28 33 39 0 h To stay in touch with friends and family 60 37 22 40 0 i To make money 15 7 8 85 0 j To store resources or information that is
important to you 48 28 21 52 0

P R I N C E T O N S U R V E Y R E S E A R C H A S S O C I A T E S I N T E R N A T I O N A L
14
BLOG32 Has your blog ever received attention from or been mentioned by any of the following?
YES NO DON’T KNOW/
REFUSED
a Public officials, politicians, or political campaigns
10 89 1
b The news media 9 90 1 c Other bloggers 60 35 5 d Local community members 20 77 3 e Colleagues, coworkers or bosses 35 64 1 f Family members 52 47 *
BLOG33 How often, if ever, do you do each of the following things on your blog? If an item doesn’t apply to you, just say so and I’ll go to the next one.
OFTEN SOMETIMES HARDLY
EVER NEVER
(VOL) DOESN’T APPLY TO
ME DON’T KNOW/
REFUSED
a Quote other people or media sources directly
15 25 13 41 5 0
b Post corrections to something you have written
11 27 21 38 2 *
c Take content from other sources and remix it into something new
12 19 19 48 2 1
d Discuss current events or news 30 29 16 25 1 0 e Include links to original source
material you have cited or used in some way
35 22 14 27 2 0
f Spend extra time trying to verify facts you want to include in your post
35 21 14 28 2 0
g Respond to posts or comments from others
42 28 11 17 2 0
h Get permission to post copyrighted material
12 8 11 50 17 1
BLOG34 Overall, do you consider your blog a form of JOURNALISM, or not?
CURRENT
% 34 Yes 65 No 1 Don’t know/Refused

P R I N C E T O N S U R V E Y R E S E A R C H A S S O C I A T E S I N T E R N A T I O N A L
15
BLOG35 Aside from your blog, have you ever published your own writing or media creations anywhere else, either online or offline – or is your blog the only place you have published original material?
CURRENT
% 44 Have published other places 54 Blog is only place respondent has published original material 2 Don’t know/Refused
BLOG36 If you had to say, do you think you’ll still be blogging a year from now, or not?
CURRENT
% 82 Yes 11 No 3 (VOL) Have already stopped blogging 4 Don’t know 0 Refused
MODEM Does the computer you use at HOME connect to the Internet through a dial-up telephone line, or do you have some other type of connection, such as a DSL-enabled phone line, a cable TV modem, a wireless connection, or a T-1 or fiber optic connection?
Based on those who use the internet at home [N=228]
CURRENT NOV/DEC
2005 MAY 2005 FEB 2005 JAN 2005 FEB 2004 NOV 2003
% 19 Dial-up telephone line 35 44 47 48 55 62 80 High-speed 61 53 50 50 42 35 37 DSL-enabled phone line 29 24 22 21 18 13 36 Cable modem 27 25 25 26 23 21 6 Wireless connection (either
land-based or satellite) 4 3 3 2 1 1
1 T-1 or fiber optic connection 1 1 1 1 1 * 1 Other 1 1 1 1 1 1 0 Don’t know/Refused 3 1 3 1 2 2

P R I N C E T O N S U R V E Y R E S E A R C H A S S O C I A T E S I N T E R N A T I O N A L
16
Methodology
Blogger Callback Survey
Prepared by Princeton Survey Research Associates International for the Pew Internet and the American Life Project
March 2006
SUMMARY
The Blogger Callback Survey, sponsored by the Pew Internet and American Life Project (PIAL), obtained telephone interviews with 233 self-identified bloggers from previous surveys conducted for PIAL. The interviews were conducted in English by Princeton Data Source, LLC from July 5, 2005 to February 17, 2006. Statistical results are weighted to correct known demographic discrepancies. The margin of sampling error for the complete set of weighted data is ±6.7%.
Details on the design, execution and analysis of the survey are discussed below. DESIGN AND DATA COLLECTION PROCEDURES Sample Design
Sample for this survey was collected from several recent PIAL general population surveys.3 All respondents who said they wrote their own blogs were eligible for this callback survey. Sample for the original surveys was drawn using standard list-assisted random digit dialing (RDD) methodology.
3 The survey used for callback sample were: February 2004 and 2005 Tracking Surveys; November 2004 Tracking; November Activity Tracking; January 2005 Tracking; September 2005 Tracking; the Exploratorium Survey; Nov/Dec 2005 Tracking Survey; the Spyware Survey; and PSRAI’s Demographic Tracking Survey.

P R I N C E T O N S U R V E Y R E S E A R C H A S S O C I A T E S I N T E R N A T I O N A L
17
Contact Procedures
Interviews were conducted from July 5, 2005 to February 17, 2006. As many as 10 attempts were made to contact every sampled telephone number. Calls were staggered over times of day and days of the week to maximize the chance of making contact with potential respondents. Each household received at least one daytime call in an attempt to find someone at home.
WEIGHTING AND ANALYSIS
Weighting is generally used in survey analysis to compensate for patterns of nonresponse that might bias results. The interviewed sample of all bloggers was weighted to match parameters for sex, age, education, race, Hispanic origin, and region. These parameters were defined as the weighted demographics of all self-identified bloggers from the general population surveys from which callback sample was garnered. Table 1 compares weighted and unweighted sample distributions to population parameters.
Weighting was accomplished using Sample Balancing, a special iterative sample weighting program that simultaneously balances the distributions of all variables using a statistical technique called the Deming Algorithm. Weights were trimmed to prevent individual interviews from having too much influence on the final results. The use of these weights in statistical analysis ensures that the demographic characteristics of the sample closely approximate the demographic characteristics of the national population

P R I N C E T O N S U R V E Y R E S E A R C H A S S O C I A T E S I N T E R N A T I O N A L
18
Table 1: Sample Demographics
Parameter Unweighted Weighted Gender
Male 58.6 61.4 58.5 Female 41.4 38.6 41.5
Age
18-24 34.4 28.9 33.1 25-34 22.0 25.9 22.7 35-44 18.5 18.1 18.7 45-54 14.0 15.9 14.2 55-64 8.6 8.6 8.8
65+ 2.5 2.6 2.5
Education Less than HS Grad. 8.6 3.9 6.6
HS Grad. 22.9 22.7 23.3 Some College 32.2 34.3 33.0 College Grad. 36.3 39.1 37.1
Region
Northeast 19.2 18.0 19.1 Midwest 18.9 20.2 19.1
South 32.8 34.3 32.7 West 29.1 27.5 29.1
Race/Ethnicity
White/not Hispanic 64.8 75.5 65.8 Black/not Hispanic 9.3 6.1 9.3
Hispanic 14.6 11.4 14.3 Other/not Hispanic 11.3 7.0 10.7

P R I N C E T O N S U R V E Y R E S E A R C H A S S O C I A T E S I N T E R N A T I O N A L
19
Effects of Sample Design on Statistical Inference
Post-data collection statistical adjustments require analysis procedures that reflect departures from simple random sampling. PSRAI calculates the effects of these design features so that an appropriate adjustment can be incorporated into tests of statistical significance when using these data. The so-called "design effect" or deff represents the loss in statistical efficiency that results from systematic non-response and disproportionate sampling. The total sample design effect for this survey is 1.10.
PSRAI calculates the composite design effect for a sample of size n, with each case having a weight, wi as:
In a wide range of situations, the adjusted standard error of a statistic should be
calculated by multiplying the usual formula by the square root of the design effect (√deff ). Thus, the formula for computing the 95% confidence interval around a percentage is:
where p� is the sample estimate and n is the unweighted number of sample cases in the group
being considered. The survey�s margin of error is the largest 95% confidence interval for any estimated proportion based on the total sample� the one around 50%. For example, the margin of error for the entire sample is ±6.7%. This means that in 95 out every 100 samples drawn using the same methodology, estimated proportions based on the entire sample will be no more than 6.7 percentage points away from their true values in that population. It is important to remember that sampling fluctuations are only one possible source of error in a survey estimate. Other sources, such as respondent selection bias, questionnaire wording and reporting inaccuracy, may contribute additional error of greater or lesser magnitude.
2
1
1
2
=
∑
∑
=
=
n
ii
n
ii
w
wndeff formula 1
−×±
nppdeffp
)�1(�
96.1� formula 2

P R I N C E T O N S U R V E Y R E S E A R C H A S S O C I A T E S I N T E R N A T I O N A L
20
RESPONSE RATE
Table 2 reports the disposition of all sampled telephone numbers dialed from the original callback sample. The response rate estimates the fraction of all eligible respondents in the sample that were ultimately interviewed. At PSRAI it is calculated by taking the product of three component rates:4
o Contact rate � the proportion of working numbers where a request for interview was
made � of 88 percent5
o Cooperation rate � the proportion of contacted numbers where a consent for interview
was at least initially obtained, versus those refused � of 85 percent
o Completion rate � the proportion of initially cooperating and eligible interviews that were
completed � of 95 percent
Thus the response rate for this survey was 71 percent.6
4 PSRAI’s disposition codes and reporting are consistent with the American Association for Public Opinion Research standards. 5 For this callback survey, PSRAI assumes that 25 percent of cases that result in a constant disposition of “No answer” or “Busy” over 10 or more attempts are actually not working numbers. 6 Response rates for the original RDD surveys ranged from 28.4% to 34.6%.

P R I N C E T O N S U R V E Y R E S E A R C H A S S O C I A T E S I N T E R N A T I O N A L
21
Table 2: Sample Disposition Final
Total Numbers dialed 1,016 Business 17 Computer/Fax 26 Other Not-Working 68 Additional projected NW 11
Working numbers 894 Working Rate 88.0%
Answering Machine 1 Callbacks 23 Other Non-Contacts 82
Contacted numbers 788 Contact Rate 88.2%
Initial Refusals 67 Second Refusals 51
Cooperating numbers 670 Cooperation Rate 85.0%
No Adult in HH 27 Language Barrier 8 Ineligible 390
Eligible numbers 245 Eligibility Rate 36.6%
Interrupted 12
Completes 233 Completion Rate 95.1%
Response Rate 71.3%

P R I N C E T O N S U R V E Y R E S E A R C H A S S O C I A T E S I N T E R N A T I O N A L
22
Endnotes
1 Jan/Feb 2006 trends based on the Exploratorium survey conducted Jan.9-Feb.6, 2006 [N=2,000]. 2 Nov/Dec 2005 trends based on daily tracking survey conducted Nov. 29-Dec.31, 2005 [N=3,011]. 3 September 2005 trends based on daily tracking survey conducted Sept. 14-Oct.13, 2005 [N=2,251]. 4 May/June 2005 trends based on the Spyware Survey, conducted May 4-June7, 2005 [N=2,001]. 5 February 2005 trends based on daily tracking survey conducted Feb. 21-March 21, 2005 [N=2,201]. 6 January 2005 trends based on daily tracking survey conducted Jan. 13-Feb.9, 2005 [N=2,201]. 7 November 23-30, 2004 trends based on the November Activity Tracking Survey, conducted Nov 23-Nov 30, 2004 [N=914]. 8 May/June 2004 trends based on daily tracking survey conducted May 14-June 17, 2004 [N=2,200]. 9 February 2004 trends based on daily tracking survey conducted February 3-March 1, 2004 [N=2,204]. 10 November 2003 trends based on daily tracking survey conducted November 18-December 14, 2003 [N=2,013]. 11 July 2003 trends based on ‘E-Government’ survey conducted June 25-August 3, 2003 [N=2,925]. 12 June 2003 trends based on ‘Internet Spam’ survey conducted June 10-24, 2003 [N=2,200]. 13 April/May 2003 trends based on daily tracking survey conducted April 29-May 20, 2003 [N=1,632]. 14 March 12-19, 2003 trends based on daily tracking survey conducted March 12-19, 2003 [N=883]. 15 March 3-11, 2003 trends based on daily tracking survey conducted March 3-11, 2003 [N=745]. 16 February 2003 trends based on daily tracking survey conducted February 12-March 2, 2003 [N=1,611]. 17 December 2002 trends based on daily tracking survey conducted Nov. 25–Dec. 22, 2002 [N=2,038]. 18 November 2002 trends based on daily tracking survey conducted October 28-November 24, 2002 [N=2,745]. 19 October 2002 trends based on daily tracking survey conducted October 7-27, 2002 [N=1,677]. 20 September 2002 trends based on daily tracking survey conducted September 9-October 6, 2002 [N=2,092]. 21 July 2002 trends based on ‘Sept. 11th-The Impact Online’ survey conducted June 26-July 26, 2002 [N=2,501]. 22 March/May 2002 trends based on daily tracking surveys conducted March 1-31, 2002 and May 2-19, 2002. 23 January 2002 trends based on a daily tracking survey conducted January 3-31, 2002. 24 December 2001 trends represent a total tracking period of December 1-23, 2001 [N=3,214]. This tracking period based on daily tracking surveys conducted December 17-23, 2001 and November 19-December 16, 2001. 25 November 2001 trends represent a total tracking period of November 1-30, 2001 [N=2,119]. This tracking period based on daily tracking surveys conducted October 19 – November 18, 2001 and November 19 – December 16, 2001. 26 October 2001 trends represent a total tracking period of October 1-31, 2001 [N=1,924]. This tracking period based on daily tracking surveys conducted September 20 – October 1, 2001, October 2-7, 2001, October 8-18, 2001, and October 19 – November 18, 2001. 27 September 2001 trends represent a total tracking period of September 1-30, 2001 [N=742]. This tracking period based on daily tracking surveys conducted August 13-September 10, 2001, September 12-19, 2001 and September 20 – October 1, 2001.

P R I N C E T O N S U R V E Y R E S E A R C H A S S O C I A T E S I N T E R N A T I O N A L
23
28 August 2001 trends represent a total tracking period of August 13-31, 2001 [N=1,505]. This tracking period based on a daily tracking survey conducted August 13-September 10, 2001. 29 February 2001 trends based on a daily tracking survey conducted February 1, 2001-March 1, 2001 [N=2,096]. 30 December 2000 trends based on a daily tracking survey conducted December 2-22, 2000 [N=2,383]. 31 November 2000 trends based on a daily tracking survey conducted November 2, 2000 – December 1 [N=6,322]. 32 October 2000 trends based on a daily tracking survey conducted October 2 – November 1, 2000 [N=3,336]. 33 September 2000 trends based on a daily tracking survey conducted September 15 – October 1, 2000 [N=1,302]. 34 July/August 2000 trends based on a daily tracking survey conducted July 24 – August 20, 2000 [N=2,109]. 35 May/June 2000 trends based on a daily tracking survey conducted May 2 – June 30, 2000 [N=4,606]. 36 March/April 2000 trends based on a daily tracking survey conducted March 1 – May 1, 2000 [N=6,036]. 37 All trend results prior to March 2000 based on surveys conducted by The Pew Research Center for People & the Press.