Embed Size (px)
Citation preview

`
April 2008


DISKO WEST BLOCKS 4 AND 6 2-D SEISMIC SURVEY
PRELIMINARY ENVIRONMENTAL IMPACT
ASSESSMENT
APRIL 2008


DISKO WEST BLOCKS 4 & 6 SEISMIC SURVEY PEIA TABLE OF CONTENTS
i
1. EXECUTIVE SUMMARY...........................................................................................................1-1
1.1 Introduction and Project Description.....................................................................................1-1 1.2 Potential Impacts, Mitigation Measures and Monitoring ......................................................1-1 1.3 Conclusions ...........................................................................................................................1-3
2. INTRODUCTION.........................................................................................................................2-1 2.1 Description of the Licence Holders .......................................................................................2-1 2.2 The Location of the Licence Blocks......................................................................................2-1 2.3 Purpose and Structure of the Seismic PEIA ..........................................................................2-4
2.3.1 Background ...................................................................................................................2-4 2.3.2 The PEIA Report ...........................................................................................................2-4
2.4 Schedule of Activities............................................................................................................2-5 3. LEGISLATIVE FRAMEWORK ..................................................................................................3-1
3.1 BMP Requirements ...............................................................................................................3-1 3.1.1 Licence Requirements ...................................................................................................3-1 3.1.2 Requirements for Preparation of a PEIA.......................................................................3-1
3.2 International EIA Guidelines.................................................................................................3-1 3.3 Esso Corporate Requirements ...............................................................................................3-2 3.4 International Guidelines and Standards.................................................................................3-3 3.5 Greenland’s Obligation to International Conventions...........................................................3-4
4. ENVIRONMENTAL SETTING...................................................................................................4-1 4.1 Geographical Setting .............................................................................................................4-1 4.2 Physical and Chemical Environment.....................................................................................4-2
4.2.1 Meteorology ..................................................................................................................4-2 4.2.2 Oceanography................................................................................................................4-7 4.2.3 Geology and Geomorphology .....................................................................................4-20
4.3 Biological Environment.......................................................................................................4-23 4.3.1 Benthic and Planktonic Communities .........................................................................4-23 4.3.2 Fish and Fisheries ........................................................................................................4-25 4.3.3 Seabirds .......................................................................................................................4-29 4.3.4 Mammals .....................................................................................................................4-32
4.4 Socio-Economic Environment.............................................................................................4-38 4.4.1 Natural Resource Utilisation .......................................................................................4-38 4.4.2 Protected Areas............................................................................................................4-44
4.5 Summary of Key Sensitivities and Focal Issues..................................................................4-45 5. PROJECT DESCRIPTION ...........................................................................................................5-1
5.1 General Description of Seismic Surveys ...............................................................................5-1 5.1.1 Introduction ...................................................................................................................5-1
5.2 Seismic Sound Source ...........................................................................................................5-1 5.2.1 Types of Seismic Survey ...............................................................................................5-3
5.3 Outline of the Proposed 2-D Seismic Survey Programme ....................................................5-5 5.3.1 Overview .......................................................................................................................5-5 5.3.2 Survey Programme ........................................................................................................5-6 5.3.3 Survey Area...................................................................................................................5-7 5.3.4 Vessels...........................................................................................................................5-8 5.3.5 Seismic Source ............................................................................................................5-12 5.3.6 Hydrophone Streamer Cable .......................................................................................5-14 5.3.7 Re-supply and Logistics ..............................................................................................5-15
6. IMPACT ASSESSMENT .............................................................................................................6-1 6.1 Introduction & Methodological Considerations ....................................................................6-1 6.2 Key Programme Aspects and Environmental Sensitivities ...................................................6-2 6.3 Impacts of Seismic Sound on Marine Life and Resources ....................................................6-2
6.3.1 Introduction ...................................................................................................................6-2 6.3.2 Impacts of Seismic Sound on Adult Fish ......................................................................6-4 6.3.3 Impacts of Seismic Sound on Fish Eggs and Larvae.....................................................6-5 6.3.4 Impacts of Seismic Sound on Fisheries .........................................................................6-6 6.3.5 Birds ..............................................................................................................................6-8 6.3.6 Impact of Seismic Sound on Marine Mammals.............................................................6-8
6.4 Impacts of Routine Operations ............................................................................................6-12 6.4.1 Physical Presence of Vessels and Equipment..............................................................6-12

DISKO WEST BLOCKS 4 & 6 SEISMIC SURVEY PEIA TABLE OF CONTENTS
ii
6.4.2 Waste ...........................................................................................................................6-12 6.4.3 Emissions to Air ..........................................................................................................6-13 6.4.4 Invasive Species ..........................................................................................................6-14
6.5 Accidental Events ................................................................................................................6-15 6.5.1 Introduction .................................................................................................................6-15 6.5.2 Loss or Damage to Towed Equipment ........................................................................6-15 6.5.3 Spillage of Fuel or Chemicals......................................................................................6-15
6.6 Cumulative and Transboundary Impacts .............................................................................6-16 7. ENVIRONMENTAL MITIGATION AND MONITORING .......................................................7-1
7.1 Introduction ...........................................................................................................................7-1 7.2 Sound and Physical Presence of Operations..........................................................................7-1
7.2.1 General...........................................................................................................................7-1 7.2.2 Plankton and Benthos ....................................................................................................7-1 7.2.3 Fish and Fisheries ..........................................................................................................7-1 7.2.4 Birds...............................................................................................................................7-2 7.2.5 Mammals .......................................................................................................................7-2 7.2.6 Ice Monitoring and Management...................................................................................7-3 7.2.7 Other Monitoring...........................................................................................................7-4
7.3 Waste .....................................................................................................................................7-5 7.4 Emissions to Air ....................................................................................................................7-5 7.5 Invasive Species ....................................................................................................................7-5 7.6 Accidental Events ..................................................................................................................7-6
7.6.1 Loss or Damage to Towed Equipment ..........................................................................7-6 7.6.2 Spillage of Fuel or Chemicals........................................................................................7-6
7.7 Environmental Management Plan..........................................................................................7-8 7.7.1 Introduction ...................................................................................................................7-8 7.7.2 Environmental Procedures and Training .......................................................................7-8 7.7.3 Socio-economic Considerations – Stakeholder Consultations.......................................7-9
7.8 Summary of Impacts and Mitigation ...................................................................................7-11 8. CONCLUSIONS ...........................................................................................................................8-1 9. PLANS FOR FURTHER STUDIES .............................................................................................9-1 10. REFERENCES AND BIBLIOGRAPHY................................................................................10-1 APPENDICES........................................................................................................................................ A
Appendix A: Abbreviations.................................................................................................................. 2

DISKO WEST BLOCKS 4 & 6 SEISMIC SURVEY PEIA TABLE OF CONTENTS
iii
Tables Table 1.1: Impact assessment summary ...............................................................................................1-2 Table 4.1: Summary of selected important fish and large invertebrate species in the study area
(Modified from Hansen et al., 2004 and Mosbech et al., 2007a)................................................4-25 Table 4.2: Seabird occurrence and activity in the coastal zone and offshore areas between latitude 68
and 72°N (Modified from Hansen et al., 2004 and Mosbech et al., 2007a) ...............................4-30 Table 4.3: An overview of the marine mammals found within the study area between latitude 68 and
72°N (Modified from Hansen et al., 2004 and Mosbech et al., 2007a).......................................4-34 Table 4.4: Total fisheries in Greenland waters....................................................................................4-39 Table 5.1: Details of survey area..........................................................................................................5-7 Table 5.2: M/V CGG Princess specifications ......................................................................................5-9 Table 5.3: Vessel class and maximum fuel capacity for the chase vessels..........................................5-10 Table 5.4: Summary details of proposed seismic source....................................................................5-13 Table 5.5: Summary details of hydrophone streamer cable ...............................................................5-14 Table 6.1: Categories of potential environmental impacts ....................................................................6-1 Table 6.2: Effects on adult fish caused by seismic airguns ...................................................................6-5 Table 6.3: Impacts on benthic organisms from seismic airgun surveys ................................................6-7 Table 6.4: Summary of modeled sound exposure levels at distances from points 1 and 2. ...........6-11 Table 6.5: Estimated waste volumes generated during the survey.....................................................6-13 Table 6.6: Estimated fuel consumption and emissions of vessels per day and for the planned survey...6-
14 Table 7.1: Impact assessment summary ............................................................................................7-11 Table 9.1: Proposed further studies.......................................................................................................9-1

DISKO WEST BLOCKS 4 & 6 SEISMIC SURVEY PEIA TABLE OF CONTENTS
iv
Figures Figure 2.1: Geographical context of the Disko West Area, Baffin Bay and Davis Strait, West
Greenland ..................................................................................................................................... 2-2 Figure 2.2: Location of Block 4 (Puilasoq) and Block 6 (Orsivik) ..................................................... 2-3 Figure 2.3: Indicative schedule of activities ......................................................................................... 2-5 Figure 4.1: Licence Blocks 4 and 6 and the Disko West study area .................................................... 4-1 Figure 4.2: Monthly frequency of wind speeds in excess of 5, 10 and 15m/s at two monitoring
locations in the Davis Strait. Data averaged for period 1980–1993. (Source data: European Centre for Medium Range Weather Forecasts (ECMWF)) .......................................................... 4-3
Figure 4.3: Winter and summer wind roses at four monitoring locations throughout the Davis Strait. Data averaged for period 1980–1993 (Source data: ECMWF, modified from Hansen et al., 2004)...................................................................................................................................................... 4-4
Figure 4.4: Mean air temperature (°C) and precipitation (mm) for Sisimiut on the West Greenland coast...................................................................................................................................................... 4-6
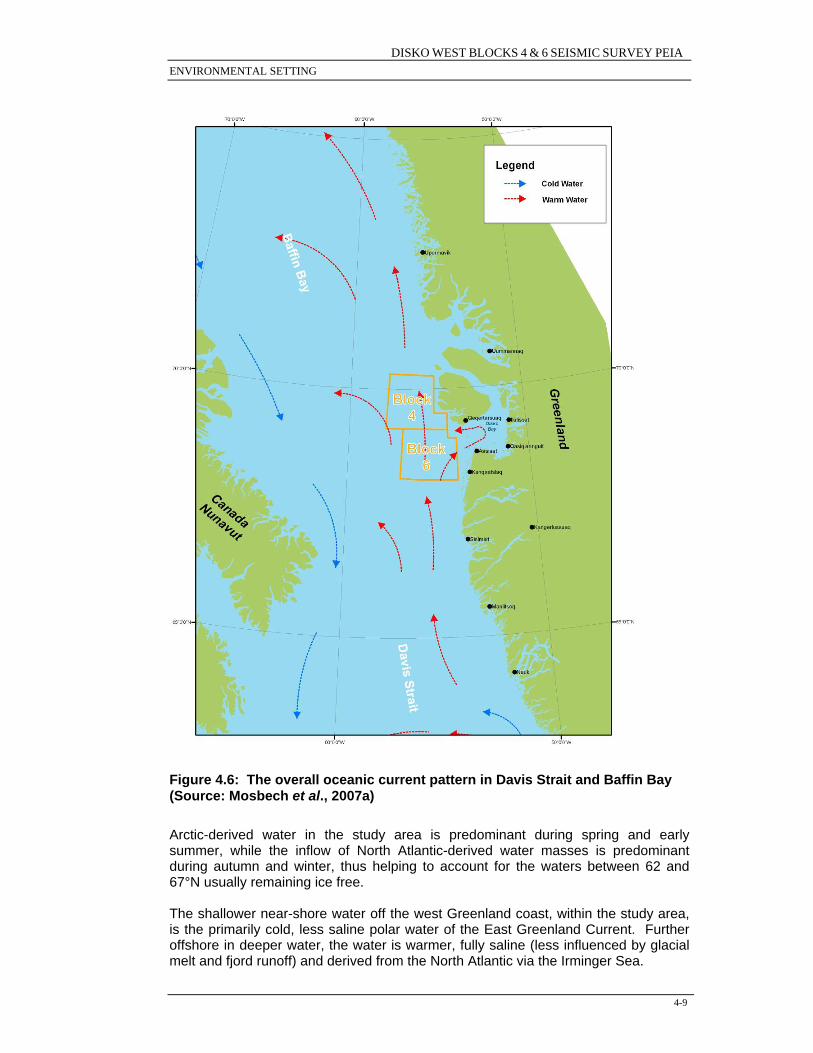
Figure 4.5: Occurrence of fog (number of days in each month) at Aasiaat........................................ 4-7 Figure 4.6: The overall oceanic current pattern in Davis Strait and Baffin Bay (Source: Mosbech et al.,
2007a) ........................................................................................................................................... 4-9 Figure 4.7: Regions within the project study area where high rates of vertical water movement
(upwelling and downwelling) are observed. Vertical rates are indicated by the standard deviation of the vertical speed of upwelling/downwelling (Source: Mosbech et al., 2007a)..................... 4-11
Figure 4.8: 2004 Monthly sea-ice cover for the Disko West Study Area, based on satellite monitoring data from the Defence Meteorological Satellite Programme (DMSP) and multi-channel radiometer (Source: Mosbech et al., 2007a) ................................................................................................. 4-14
Figure 4.9: Sea ice conditions in the Davis Strait, Disko West Area and Baffin Bay, March 2, 2008 (Source: Danish Meteorological Institute).................................................................................. 4-16
Figure 4.10: Iceberg density in the Disko Bay and Disko West Area, June 14, 1999 (Source: Mosbech et al., 2007a) ............................................................................................................................... 4-18
Figure 4.11: Bathymetry of the Disko Bay and Disko West study area ............................................ 4-19 Figure 4.12: Typical coastal morphology West Greenland ............................................................... 4-20 Figure 4.13: Stratigraphic section of the West Greenland Shelf, showing the depths of source rocks
and potential reservoirs............................................................................................................... 4-21 Figure 4.14: A cross-sectional diagram of the offshore central West Greenland sedimentary basin at
approximately 69° 30'N (to the west of Disko Island). The depth is obtained from depth-converted seismic data, with a vertical exaggeration x 7 (Source: GEUS, 2003) ............ 4-22
Figure 4.15: Spawning and fishery map for capelin and lumpsucker in the coastal waters of the study area ............................................................................................................................................. 4-28
Figure 4.16: Principal seabird colonies and sea duck moulting areas within Disko Bay and the Disko West Study Area......................................................................................................................... 4-33
Figure 4.17: The distribution and migration routes of wintering beluga in West Greenland............ 4-38 Figure 4.18: Deepwater shrimp fishery map for the Disko West study area..................................... 4-40 Figure 4.19: Fisheries for Greenland halibut and snow crab............................................................. 4-41 Figure 4.20: Extent of coastal fishing grounds for capelin, within the project study area ................ 4-42 Figure 4.21: Extent of coastal fishing grounds for lumpsucker within the project study area .......... 4-43 Figure 4.22: Map showing the environmental protected areas within and immediately vicinity of the
study area.................................................................................................................................... 4-44 Figure 5.1: Schematic of offshore seismic survey............................................................................... 5-1 Figure 5.2: Operation of an airgun ..................................................................................................... 5-2 Figure 5.3: Schematic showing 2 types of seismic surveys A) 2-D survey using single streamer; and B)
3-D survey using multiple streamers. ........................................................................................... 5-4 Figure 5.4: Existing 2-D image indicating some geological features. The sub-basalt data quality is
inadequate to identify potential target structures.......................................................................... 5-5 Figure 5.5: Map of the proposed survey programme, showing survey line orientation for Block 4 and
Block 6.......................................................................................................................................... 5-8 Figure 5.6: MV CGG Princess ............................................................................................................ 5-9 Figure 5.7: F/F Meredian .................................................................................................................. 5-11 Figure 5.8: M/S Kvitbjørn ................................................................................................................. 5-11 Figure 5.9: Typical Norpower workboat and MOB fast response vessel.......................................... 5-12

DISKO WEST BLOCKS 4 & 6 SEISMIC SURVEY PEIA TABLE OF CONTENTS
v
Figure 5.10: Proposed layout of airgun array.....................................................................................5-13 Figure 6.1: Source–path–receiver model..............................................................................................6-3 Figure 6.2: Schematic representation of zones of potential effects associated with anthropogenic
sounds on marine mammals ..........................................................................................................6-4 Figure 6.3: Median closest distance of approach of cetaceans to large volume airgun arrays in relation
to airgun activity (from Stone and Tasker 2006)...........................................................................6-9 Figure 6.4: Location of selected modelling point for airgun array in Blocks 4 and 6 as used in modelled
scenario........................................................................................................................................6-10 Figure 6.5: Vertical profiles of modelled sound exposure levels at (top) Point 1 (Block 6) and (bottom)
Point 2 (Block 4) in the water column above the seafloor. .........................................................6-11 Figure 7.1: Sigma S6 ice radar capabilities for tracking ice particle movement ..................................7-4

DISKO WEST BLOCKS 4 & 6 SEISMIC SURVEY PEIA EXECUTIVE SUMMARY
1-1
1. EXECUTIVE SUMMARY
1.1 Introduction and Project Description In October 2007, the Government of Greenland granted exclusive licences for exploration and exploitation of hydrocarbon resources in Blocks 4 and 6 (Figure 2.2) in the Disko West area off the coast of Western Greenland. The Government of Greenland’s Bureau of Minerals and Petroleum (BMP) has provided requirements for submitting applications for the different stages of oil and gas exploration, development and production. This document meets the requirements of a Preliminary Environmental Impact Assessment (PEIA), which is required as part of the exploration application for seismic surveys (BMP, 2003). Due to the adjacent nature of Blocks 4 and 6, and the limited availability of seismic acquisition vessels, the operators of Block 4 (DONG) and Block 6 (Esso) have negotiated access to a common seismic survey vessel and have designed an integrated 2-D seismic acquisition programme for the two Blocks. All Licence Holders in the two Blocks have agreed that Esso will be operator for the seismic acquisition in both of the Blocks on behalf of the respective Licence Holders. Esso plans to carry out the 2-D seismic acquisition across Blocks 4 and 6 during the open water (ice-free) period, typically July to October/November in 2008. The acquired seismic data from each Block will be processed and interpreted by the operator of that Block. The primary objective of the seismic programme is to acquire a total of approximately 6,000km of high quality 2-D seismic data over the licence Blocks 4 and 6, particularly at the sub-basalt level. This comprises two approximately 3,000km surveys, being 3,000km in each of Block 4 and Block 6.
1.2 Potential Impacts, Mitigation Measures and Monitoring The potential impacts, mitigation and monitoring for the seismic programme in Blocks 4 and 6 are summarised in Table 1.1.

DISKO WEST BLOCKS 4 & 6 SEISMIC SURVEY PEIA EXECUTIVE SUMMARY
1-2
Table 1.1: Impact assessment summary
Aspect or Source Potential Impact
Probability of Occurrence or
Exposure
Proposed Monitoring or
Mitigation Measures
Residual Outcome or
Impact Routine Activities
Disruption effect on local social environment and economy
Contact with local Greenland communities during port activities
Stakeholder consultations Negligible
Interaction with fishing activities operating in the survey area
Very low considering the limited fishing activity anticipated within Blocks 4 and 6 and the mitigation measures in place
Advise relevant Greenland authorities to notify vessels within the survey area Two chase vessel utilised Use of the appropriate signals in accordance with International Maritime Law, including communications via radio, light signals
Negligible
Physical presence of the seismic survey vessel and recording Seismic airgun array and streamer
Interaction with existing marine traffic
Low due to low densities of marine traffic in the area and mitigation measures in place
Warnings (Notice to Mariners) of the proposed activities will be issued
Negligible
Water impacts from seismic survey and chase vessels’ waste generation
Very low considering mitigation measures in place
Compliance with the vessel’s Waste Management Plan
Negligible
Vessels operations/ routine emissions and discharges
Air impacts from emissions
Very low based on low total emissions
Proper maintenance of equipment and generators Regular monitoring of fuel consumption Proper use of onboard incinerator for appropriate wastes
Negligible
Disturbance to marine mammals (potential physical/ physiological/ behavioural effects)
Unlikely due to expected low densities of marine mammals in the area and mitigation measures in place
Application of the UK-JNCC guidelines for minimising the acoustic disturbance on cetaceans. Use of two dedicated marine mammal observers (MMO) on seismic vessel
Minor Operation of seismic equipment: airguns/sound
Disturbance to marine organisms: fish, invertebrates, plankton and birds
Low; potential impact restricted to organisms in close proximity to source
None Negligible

DISKO WEST BLOCKS 4 & 6 SEISMIC SURVEY PEIA EXECUTIVE SUMMARY
1-3
Table 1.1 continued:
Aspect or Source Potential Impact
Probability of Occurrence or
Exposure
Proposed Monitoring or
Mitigation Measures
Residual Outcome or
Impact Non-Routine Activities (including accidental events)
Accidental loss of streamer fluid/ streamer and associated equipment
Water impact. Planned use of solid streamer, but in the event that it is not available, fluid streamer sill be used Very limited due to relatively small volume of fluid contained in streamer section Chase vessels will help to minimise potential for other vessels to disturb the streamer
Solid streamer is planned Multi-section streamer Presence of chase vessels
Minor
Vessels operation/ Spillage during refuelling at port
Water impact Coastal area impact
Very limited due to procedures and mitigation measures in place
Refuelling operation will be managed through detailed vessel specific procedures and emergency response plans Long range of vessels with limited number of port calls
Minor
Vessels operations/fuel and oil spills from the vessels
Water impact Coastal area impact
Extremely unlikely considering good condition and maintenance of vessels, navigational systems to identify/avoid obstacles
Vessel specific procedures and emergency response plans. Use of marine diesel and not heavy fuel oil
Minor
1.3 Conclusions This Preliminary Environmental Impact Assessment (PEIA) concludes, consistent with results from many previous published studies that normal 2-D seismic survey programme activities result in both:
• negligible long-term adverse effects that would inhibit recovery of the environment to its normal state; and
• negligible adverse acute biological effects. However, it is understood that seismic survey activities can lead to minor changes to normal behaviour of higher organisms such as fish, sea mammals and birds and that within close range (<5m) of an operating airgun array, mortality of plankton and juvenile fish unable to swim away from the airguns could occur. Mortality and injury effects are predicted to be most frequent and serious only within 1.5m of the airgun

DISKO WEST BLOCKS 4 & 6 SEISMIC SURVEY PEIA EXECUTIVE SUMMARY
1-4
array and are not considered to represent significant impacts to plankton populations or specifically to fish recruitment at the population level. Potential impacts identified specifically in connection with the proposed Block 4 and Block 6 seismic surveys were:
• Possible minor interactions with some whale species if present and possible acoustic disturbance, although sound levels outside the safety zone for whales are not sufficient to cause any physical harm. Negative interactions with marine mammals will be mitigated by the operational controls which will be applied, (e.g. "soft starts") and the presence of MMOs on the vessels to ensure the JNCC Guidelines are adhered to at all times. It should also be noted that the species that would be most susceptible to sound disturbance, i.e. the bowhead whale, beluga and narwhal are unlikely to be present during the open water season when the seismic survey is planned;
• Possible interactions with vessels fishing for shrimp and snow crab, causing temporary short-term displacement from fishing areas. These interactions will be minimized by communications with the fishing communities before the start of the surveys, the presence of the chase/guard vessels and by the fact that a Fisheries Liaison Officer will be onboard one of the vessels at all times, and will facilitate communication with other sea users;
• Possible interactions with icebergs which could cause damage to equipment and vessels particularly in poor visibility conditions. This will be mitigated by the installation of specialized ice detection radar on the seismic vessel and one of the chase/guard vessels, and the presence of dedicated ice observation personnel on the vessels;
• The routine production of waste onboard the vessels will be controlled by a specific Waste Management Plan and the impacts related to this are assessed as being negligible; and
• Air emissions from the seismic survey will have a negligible environmental impact.
Regarding potential accidental events, navigational equipment onboard the seismic survey vessel, streamer cable tailbuoys and the chase/guard vessels will provide warning to other sea users of the location of the streamer and planned operation areas. Thus, risk of damage to the equipment and possible resultant spillages or loss of equipment to the marine environment can be avoided or significantly reduced. The potentially more significant impact related to the seismic survey programme would be caused by an oil spill caused by a vessel grounding or collision with a subsequent rupture of the fuel tanks. This could cause impacts on birds at sea and to sensitive coastal resources. However, this risk will be reduced by the fact that the vessels will use marine diesel instead of heavy fuel oil which is more persistent in the marine environment. The likelihood of such an occurrence is very small. However, as a specific requirement in Esso's Operations Integrity Management System, an Oil Spill Contingency Plan will be documented and be implemented ahead of the commencement of the survey programme operations. This Plan will integrate with the local Greenland resources, as well as with the resources held on the programme vessels and any other Licence Block operators who have operations over the same time period. Esso will have available through its affiliate contacts and contracts, oil spill response resources which have expertise in spill response planning, oil spill modelling,

DISKO WEST BLOCKS 4 & 6 SEISMIC SURVEY PEIA EXECUTIVE SUMMARY
1-5
logistics and spill command. Esso also have immediate access to significant oil spill response equipment stockpiles (Tier 3) in North America and the U.K. (primarily Oil Spill Response Limited in Southampton). Esso can access these 24 hours a day, and is well drilled in their notification, activation and integration into any spill response operation. However, it is expected that this level of response will not be required for any incident which may release oil (fuel) to the environment. Onshore activities associated with the seismic survey programme should have little or no detrimental socio-economic impact, and should on balance provide a limited short-term direct benefit to the local economy. In the medium term, if the findings of the seismic survey programme indicate the potential presence of hydrocarbon reserves, further exploration activities, and any further development activities associated with any identified hydrocarbon reserves will provide an important direct benefit to Greenland. The contractor selected to undertake the seismic survey programme of Blocks 4 and Block 6 will be required to operate in compliance with Esso's corporate environmental policy and Environmental Management System (EMS). CGGVeritas have the M/V CCG Princess working for Esso in Libya, and hence are fully familiar with Esso's system and management. The performance of the vessel and crew reflects the full understanding of each Company's systems. In addition the seismic survey will be carried out in accordance with all relevant Regulations, Guidelines and Standards, thus ensuring best possible environmental performance. Overall, as a consequence of the timing of the seismic survey and the mitigation measures that will be employed to reduce or avoid potential impacts or disturbance, no significant environmental impacts are anticipated.


DISKO WEST BLOCKS 4 & 6 SEISMIC SURVEY PEIA INTRODUCTION
2-1
2. INTRODUCTION
2.1 Description of the Licence Holders In October 2007, the Government of Greenland granted exclusive licences for exploration and exploitation of hydrocarbon resources in Blocks 4 and 6 (see Figure 2.2) in the Disko West area off the coast of Western Greenland. The Licence Holders are as follows: Block 4, Puilasoq
• DONG Grønland A/S (DONG), percentage share: 29 1/6% (and is the operator);
• Chevron Greenland Exploration A/S (Chevron), percentage share: 29 1/6%; • Esso Exploration Greenland Limited (Esso), percentage share: 29 1/6%; and • NUNAOIL A/S (NunaOil), percentage share: 12.5%.
Block 6, Orsivik
• Esso Exploration Greenland Limited (Esso), percentage share: 43.75 % (and is the operator);
• Husky Oil Operations Limited (Husky), percentage share: 43.75 %; and • NUNAOIL A/S (NunaOil), percentage share: 12.5 %.
For the first phase of the exploration commitments contained in the licence agreements, the operators plan to carry out 2-D seismic data acquisition in the two Blocks (4 and 6) in the open water/ice-free season of 2008. Due to the adjacent nature of Blocks 4 and 6, and the limited availability of seismic acquisition vessels, the operators of Block 4 (DONG) and Block 6 (Esso) have negotiated access to a common seismic survey vessel and have designed an integrated 2-D seismic acquisition programme for the two Blocks. All Licence Holders in the two Blocks have agreed that Esso will be operator for the seismic acquisition in both of the Blocks on behalf of the respective Licence Holders. Further discussion of the integrated nature of the seismic acquisition is provided in the following chapters. The Government of Greenland’s Bureau of Minerals and Petroleum (BMP) has identified requirements for submitting applications for the different stages of oil and gas exploration, development and production. The current document is designed to meet the requirements of a Preliminary Environmental Impact Assessment (PEIA), which is required as part of the exploration application for seismic surveys (BMP, 2003).
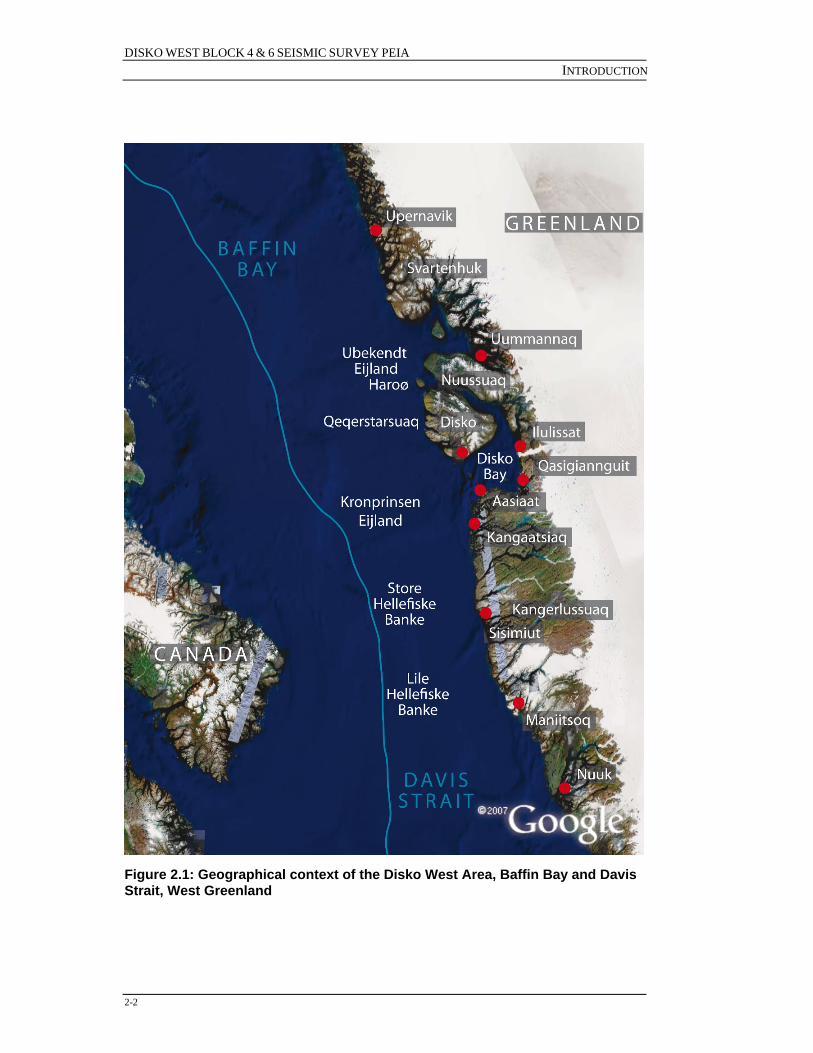
2.2 The Location of the Licence Blocks The wider geographical setting is illustrated in Figure 2.1. The location of the licence Blocks (Puilasoq and Orsivik) off the west coast of Greenland are shown in Figure 2.2;
DISKO WEST BLOCK 4 & 6 SEISMIC SURVEY PEIA INTRODUCTION
2-2
Figure 2.1: Geographical context of the Disko West Area, Baffin Bay and Davis Strait, West Greenland

DISKO WEST BLOCKS 4 & 6 SEISMIC SURVEY PEIA INTRODUCTION
2-3
Caim Energy PLCNunaoil
Caim Energy PLCNunaoil
HuskyNunaoil ExxonMobil
HuskyNunaoil
HuskyNunaoil PA Resources AB
Nunaloil
0 50 100 Km
0 25 50 Miles
1
2
3 4Puilasoq
5 6Orsivik
7 8
DongChevronExxonMobilNunaoil
Drafting/ArcGis/Greenland_1.mxd
Figure 2.2: Location of Block 4 (Puilasoq) and Block 6 (Orsivik)

DISKO WEST BLOCK 4 & 6 SEISMIC SURVEY PEIA INTRODUCTION
2-4
2.3 Purpose and Structure of the Seismic PEIA
2.3.1 Background Through the Strategic Environmental Impact Assessment (Mosbech et al., 2007), the Greenland Government has reviewed the potential impacts of exploration and development of offshore oil and gas in the West Disko Area of Baffin Bay and Davis Strait, West Greenland. This assessment concluded that the environmental impacts and risks from 2-D seismic exploration have minimal impact on the life forms and ecology of the area during the open-water season, and that the licensing of exploration Blocks is the approach the Greenland Government wants to pursue. Consistent with this assessment, the Licence Holders identified in Section 2.1 evaluated the area that was offered for licensing in 2007 and concluded that the area was prospective for oil and gas. This assessment of the environmental risks and potential impacts from 2-D seismic survey has been prepared and is consistent with the strategic assessment prepared by NERI. As the Greenland authorities decided to license these areas, the Government would have considered alternative development strategies (e.g. fisheries, other natural resources, etc.) and concluded that the exploration and potential development of oil and gas was an acceptable alternative. In accordance with the strategic environmental assessment (Mosbech et al., 2007), this assessment has concluded that at least the initial phase of exploration (2-D seismic exploration) for oil and gas is consistent with the determination by the Greenland Government. Consequently, it is proposed to conduct an integrated 2-D seismic survey programme over the licence Blocks 4 and 6 in the West Disko area. In developing this PEIA, the risks and potential impacts from this initial phase of exploration have been evaluated. Subsequent phases of exploration (3-D seismic survey, exploration and appraisal drilling, and any subsequent development of production operations) are all contingent on success of the initial 2-D seismic survey.
2.3.2 The PEIA Report As indicated above, this PEIA is potentially the first in a series of environmental studies and assessments that will address each development stage for the appropriate licence Blocks. The Bureau of Minerals and Petroleum (BMP) is the government regulator for hydrocarbon activities in Greenland. The BMP’s Seismic Survey Standards for Offshore West Greenland (BMP, 2003) sets out that a preliminary environmental impact assessment (PEIA) must be included in the documentation submitted for an application to carry out a seismic survey. The BMP has further specified (in a letter sent to a number of oil companies on 15th December 2007) that the PEIA should only address the issues related to seismic survey acquisition, as opposed to the whole range of activities required in exploration and production activities. This PEIA follows this guidance and is structured to address the requirements of a PEIA as defined by BMP. The main purpose of the PEIA is twofold. Firstly, it presents the current understanding of the sensitivities of the relevant areas of the Greenland marine environment and adjacent areas to the proposed seismic surveys. Secondly, it

DISKO WEST BLOCKS 4 & 6 SEISMIC SURVEY PEIA INTRODUCTION
2-5
assesses the potential impacts and identifies the necessary measures to be adopted to ensure that these activities are conducted in such a manner as to avoid or minimise adverse impacts on the environment. This report comprises the following main elements:
• An overview of the legislative and regulatory framework for the project; • A description of the environment focusing on key aspects that relate to the
proposed activity; • A project description providing the technical details of the planned survey; • Identification of discharges and emissions with emphasis on the operation
and presence of airguns and hydrophones; • An assessment of the potential impacts of the surveys including accidental
events such as unplanned discharges or spills; • A discussion of monitoring and mitigating measures to prevent or reduce the
risk of the identified impacts; and • An outline of plans for monitoring and further studies to be carried out.
In summary, this PEIA report aims to address key environmental sensitivities, potential impacts and environmental management in a concise and focused document.
2.4 Schedule of Activities Esso plans to carry out the 2-D seismic acquisition across Blocks 4 and 6 during the open water (ice-free) period, typically July to October/November in 2008. The acquired data from each Block will be processed and interpreted by the operator of that Block. This will take place after completion of the field acquisition programme. An indicative schedule of activities is shown in Figure 2.3.
Figure 2.3: Indicative schedule of activities


DISKO WEST BLOCKS 4 & 6 SEISMIC SURVEY PEIA LEGISLATIVE FRAMEWORK
3-1
3. LEGISLATIVE FRAMEWORK
3.1 BMP Requirements
3.1.1 Licence Requirements The exploration commitments for Blocks 4 and 6 to be carried out in the first sub-period (1 October 2007 to 31 December 2011) include:
• Acquisition of 3000km (per Block) of high-quality 2-D seismic data (with marine gravity and magnetic data), with a specific focus on sub-basalt imaging. For Block 4, marine magnetic and gravity data will be acquired, whereas aerial gravity and magnetic data is under acquisition for Block 6. This work is the subject of the present PEIA study; and
• Environmental and ice studies including contribution to the strategic environmental assessment, to be carried out in co-operation with the local authorities and other operators in the area (see Section 9 for further discussion).
For both Blocks, the licensees shall have the option to extend sub-period 1 for one year by committing to acquisition of 1000km infill seismic data with marine gravity and magnetic data (this option, if exercised, is to be delivered to BMP in writing on or before 1 January 2011).
3.1.2 Requirements for Preparation of a PEIA The BMP requirements for preparation of EIAs (including PEIAs) are described in the document: Guidelines for preparing an Environmental Impact Assessment for exploration, development, production, decommissioning and transport of hydrocarbons offshore Greenland (BMP, 2006). These guidelines indicate a structure for the EIA and references to recommended source data. The BMP document Seismic Survey Standards for Offshore West Greenland (BMP, 2003) states “The licensee shall submit a preliminary environmental impact assessment, cf. Preliminary Environment Impact Assessment of Regional Offshore Seismic Surveys in Greenland (Mosbech et al., 2000), concerning the impact of the planned seismic operations on the area and for the time of operation.” The scope of the required study has been clarified further in a letter issued by BMP as described in Section 2.3.2. Esso has taken into consideration all guidance provided by the BMP in the preparation of this PEIA document.
3.2 International EIA Guidelines In 1993, the World Bank issued Guidelines for Environmental Assessment of Energy and Industry Projects (Anon, 1993). As of 30 April 2007, new versions of the World

DISKO WEST BLOCKS 4 & 6 SEISMIC SURVEY PEIA LEGISLATIVE FRAMEWORK
3-2
Bank Group environmental, health, and safety guidelines (known as the 'EHS guidelines') are now in use. There are industry sector guidelines directed specifically towards oil and gas developments offshore. The EHS guidelines highlight the need to consider all stages associated with the development of an offshore field, including exploration, development and production of oil and gas resources, and their potential impact on the environment. In addition to assessment of any impacts, the guidelines require that there should be consideration of alternatives to the proposed development. However, alternatives in the case of offshore exploration are generally limited in the type and degree of mitigation that will be implemented. The guidelines also stress the importance of management, training and monitoring. All of the above have been taken into consideration in preparing this PEIA. Esso has operated in over 100 different oil and gas provinces around the world and it has consistently been confirmed that Esso's standards comply with or exceed international standards. Esso is an affiliate of ExxonMobil, which is a global company with operations on six continents and in nearly every country. ExxonMobil is the world’s largest non-government producer of oil and gas. ExxonMobil's leadership in the Arctic is based on more than 80 years of experience in the region, more than any other major oil and gas company. ExxonMobil also has more than 35 years of sustained commitment to Arctic technology research and development, including industry’s only dedicated, in-house oil spill research programme. ExxonMobil's Arctic leadership is demonstrated by:
• Early and ongoing commitment to environmental and local community issues; • Clear leadership in delivering complex, integrated projects on time and on
budget worldwide; • Industry-leading health and safety performance; and • ExxonMobil's history of and ongoing commitment to pioneering achievements
in the Arctic.
3.3 Esso Corporate Requirements Esso is committed to undertaking its operations in accordance with its Corporate Environmental Policy, which is based on the following principles:
• Conduct of its business in a manner compatible with the balanced environmental and economic needs of the communities in which it operates;
• Commitment to continuous efforts to improve environmental performance throughout its operations;
• Compliance with all applicable laws and regulations and application of responsible standards where laws or regulations do not exist;
• Encouragement of concern and respect for the environment, emphasis on every employee’s responsibility in environmental performance and assurance that appropriate operating practices are followed; and
• Communication with the public on environmental matters and sharing of its experience with others to facilitate improvements in industry performance.
DISKO WEST BLOCKS 4 & 6 SEISMIC SURVEY PEIA LEGISLATIVE FRAMEWORK
3-3
Accordingly, Esso Exploration Greenland Ltd (Esso) will:
• Work with government and industry groups to foster timely development of effective environmental laws and regulations based on sound science and consider risks, costs and benefits, including effects on energy and product supply;
• Manage its business with the goal of preventing incidents and of controlling emissions and wastes to below harmful levels and design, operate and maintain facilities to this end;
• Respond quickly and effectively to incidents resulting from its operations, co-operating with industry organisations and authorised government agencies;
• Conduct and support research to improve understanding of the impact of its business on the environment to improve methods of environmental protection, and to enhance its capability to make operations and products compatible with the environment; and
• Undertake appropriate reviews and evaluations of its operations to measure progress and ensure compliance with this environmental policy.
The seismic contractors are also required to operate in accordance with Esso’s Environmental Management System (EMS) and the International Association of Geophysical Contractors (IAGC) Environmental Guidelines for Worldwide Geophysical Operations (see Section 3.4 below). In order to satisfy Esso’s environmental management system requirements, an Environmental Plan, reflecting these policies and standards, will be prepared specifically for the seismic operations. The provisions within the Environmental Plan will be incorporated into the Project HSE Plan that will be prepared by the seismic survey contractor, for their use during the surveys.
3.4 International Guidelines and Standards The aim of the IAGC (1994) Guidelines is to provide a reference for the seismic industry that will promote consideration and conservation of the environment giving practical guidance on the avoidance or minimisation of environmental impacts during marine seismic surveys. A brief summary of the content of the relevant sections of the guidelines is provided below:
• Operating practices - details the need for communication of environmental concerns to crew members. Recommends that a safety review should be conducted at start-up and that follow-up meetings with client participation should be held.
• Travel - advises that care should be exercised to reduce the risk to aquatic life, suggests regulation of travel speed and that fuel transfer and handling should be done in such a way to prevent spills.
• Hazardous materials - guidance is provided on the handling, storage, transfer and labelling of hazardous materials including fuel, oils and chemicals. The report details the preferred methods for handling wastes arising from the operations and the equipment necessary for the clean-up of spills and leakages.

DISKO WEST BLOCKS 4 & 6 SEISMIC SURVEY PEIA LEGISLATIVE FRAMEWORK
3-4
• Aquatic life - advises that consideration should be given to potentially interfering with migration routes, spawning periods or displacing aquatic life vulnerable to predators.
• Waste management - states that a waste management program should be developed to maximise the use of recyclable and bio-degradable items and outlines the disposal routes for various forms of waste.
• Vessel operations - gives guidance on refilling, maintenance, deployment and loss of cable streamers.
In addition to the above, it is usual for the contractor to ensure that all employees receive adequate health, safety and environmental training and that regular environmental inspections are carried out.
3.5 Greenland’s Obligation to International Conventions Since the introduction of the Home Rule Government in 1979, Greenland has signed a number of international agreements and has obligations under several international conventions concerning the use, administration and protection of wildlife (ref. www.nanoq.gl). Conventions of relevance to this PEIA include:
• 1991 Convention on Environmental Impact Assessment in a Transboundary Context (Espoo Convention) – applied to Greenland by Denmark in 1997;
• 1971 Convention on Wetlands of International Importance Especially as Waterfowl Habitat, Ramsar – however, this has yet to be incorporated into national conservation legislation (Mosbech et al., 2007);
• 1972 Convention for the Protection of the World Cultural and National Heritage;
• 1972 Convention on the Prevention of Marine Pollution by Dumping of Wastes and Other Matter (The London Convention) (Denmark);
• 1973 Convention on the Prevention of Pollution from Ships and Protocol 1978 (MARPOL 73/78);
• 1998 Convention on Access to Information, to Public Participation in the Decision Making Process and the Administration of Justice concerning Environmental Matters (Aarhus Convention); and
• 1992 Convention on Biological Diversity. The programme for the Conservation of Arctic Flora and Fauna (CAFF) is one of the four programmes within the Arctic Region Environmental Protection Strategy ratified by Greenland.

DISKO WEST BLOCKS 4 & 6 SEISMIC SURVEY PEIA ENVIRONMENTAL SETTING
4-1
4. ENVIRONMENTAL SETTING
4.1 Geographical Setting The Licence Holders of Blocks 4 and 6 have been granted licences to undertake seismic exploration and subsequent hydrocarbon exploitation in offshore Blocks 4 and 6 in the Disko West offshore concession area. Block 4 encompasses the offshore area immediately west of Disko Island, while Block 6 is to the south of this, south-west of Disko Island and west of Disko Bay. The Disko West study area includes much of the northern Davis Strait and south-eastern Baffin Bay, between latitudes 68 and 72°N. Many of the places and features described throughout this chapter are shown in Figure 4.1 which shows the licence Blocks in their geographical setting.
Figure 4.1: Licence Blocks 4 and 6 and the Disko West study area

DISKO WEST BLOCKS 4 & 6 SEISMIC SURVEY PEIA ENVIRONMENTAL SETTING
4-2
4.2 Physical and Chemical Environment
4.2.1 Meteorology Introduction The meteorological information that is included in this section has been obtained from a number of key sources; primarily a report written by the Danish Meteorological Institute entitled Weather, Sea and Ice Conditions - Offshore West Greenland, 2004; and the Strategic Environmental Impact Assessment of Hydrocarbon Activities in the Disko West Area, (Mosbech et al., 2007). Regional Air Circulation Patterns Local air circulation is influenced heavily by the high and steeply sloped coasts bordering the Davis Strait, in particular the coasts of Western Greenland. In addition, air pressures are influenced by the seasonal distribution of differing cold and warm surface temperatures (land and sea), with high air pressure observed over cold surfaces and low pressures over warmer surfaces. In winter months, a high-pressure area exists over northern Greenland, resulting in northerly winds prevailing throughout the West Greenland offshore area. A low-pressure area encompassing much of the North Atlantic, from Newfoundland to the Norwegian Sea, with a trough extending along the west coast of Greenland corresponds to the main zone of cyclonic activity. During the summer months, surface temperature differences are much less marked, resulting in a slack mean air pressure gradient and as such prevailing wind direction is less obvious. Typically, main tracks for depressions (cyclones) are still discernible around Iceland and cyclonic patterns can exist anywhere around Greenland. Seasonally, highest pressure and, correspondingly, the most settled weather typically occur around April, while lowest pressure occurs during December and January. Greenland typically receives its weather from the south-west, particularly during winter months. Most of the low-pressure systems affecting the west coast of Greenland originate from between the south and west. Weather systems originating from easterly directions tend to weaken as they pass over the cool Greenland land mass, but may regenerate over the Davis Strait. Therefore, low-pressure systems that approach Greenland from the south or south-west have the potential to cause the most severe weather in the Davis Strait. These lows tend to split, with one part moving towards Iceland and the other moving up the western coast of Greenland. In addition, east-moving lows can affect the Davis Strait during the summer, when the weather can appear worse as it can be very unsettled. However, as discussed, it is during the winter months that the weather along the western Greenland coast has the potential to be most severe, as the pressure systems are significantly more intense. The influence of the prevailing south-westerly low-pressure systems is most intense at the Davis Strait’s southernmost extent, and less further north where the lows are moderated by the high pressure systems that prevail due to the influence of the cold land (ice) masses.
DISKO WEST BLOCKS 4 & 6 SEISMIC SURVEY PEIA ENVIRONMENTAL SETTING
4-3
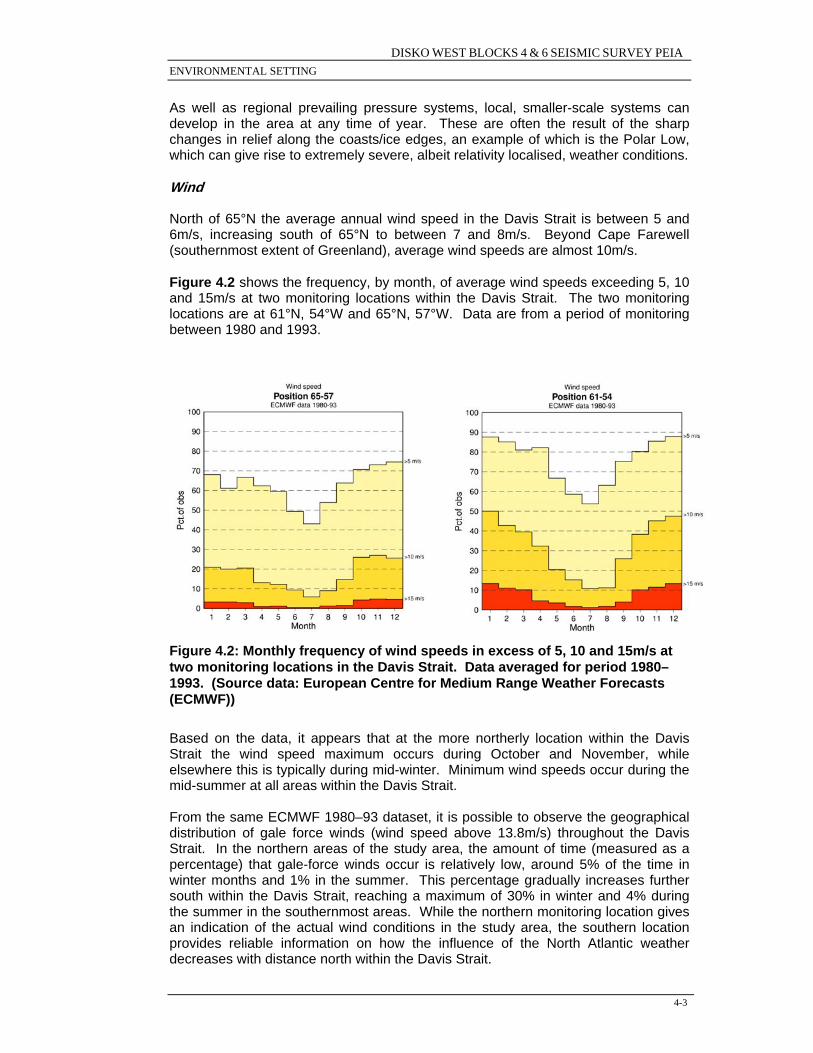
As well as regional prevailing pressure systems, local, smaller-scale systems can develop in the area at any time of year. These are often the result of the sharp changes in relief along the coasts/ice edges, an example of which is the Polar Low, which can give rise to extremely severe, albeit relativity localised, weather conditions. Wind North of 65°N the average annual wind speed in the Davis Strait is between 5 and 6m/s, increasing south of 65°N to between 7 and 8m/s. Beyond Cape Farewell (southernmost extent of Greenland), average wind speeds are almost 10m/s. Figure 4.2 shows the frequency, by month, of average wind speeds exceeding 5, 10 and 15m/s at two monitoring locations within the Davis Strait. The two monitoring locations are at 61°N, 54°W and 65°N, 57°W. Data are from a period of monitoring between 1980 and 1993.
Figure 4.2: Monthly frequency of wind speeds in excess of 5, 10 and 15m/s at two monitoring locations in the Davis Strait. Data averaged for period 1980–1993. (Source data: European Centre for Medium Range Weather Forecasts (ECMWF)) Based on the data, it appears that at the more northerly location within the Davis Strait the wind speed maximum occurs during October and November, while elsewhere this is typically during mid-winter. Minimum wind speeds occur during the mid-summer at all areas within the Davis Strait. From the same ECMWF 1980–93 dataset, it is possible to observe the geographical distribution of gale force winds (wind speed above 13.8m/s) throughout the Davis Strait. In the northern areas of the study area, the amount of time (measured as a percentage) that gale-force winds occur is relatively low, around 5% of the time in winter months and 1% in the summer. This percentage gradually increases further south within the Davis Strait, reaching a maximum of 30% in winter and 4% during the summer in the southernmost areas. While the northern monitoring location gives an indication of the actual wind conditions in the study area, the southern location provides reliable information on how the influence of the North Atlantic weather decreases with distance north within the Davis Strait.

DISKO WEST BLOCKS 4 & 6 SEISMIC SURVEY PEIA ENVIRONMENTAL SETTING
4-4
Figure 4.3 shows wind roses for the winter and summer months at four monitoring locations throughout the Davis Strait, based on the ECMWF 1980–1993 dataset.
Figure 4.3: Winter and summer wind roses at four monitoring locations throughout the Davis Strait. Data averaged for period 1980–1993 (Source data: ECMWF, modified from Hansen et al., 2004) Gale-force winds take a mostly northerly direction during the winter months, while in summer the significantly fewer gale-force wind occurrences are predominantly from the south. Exceptions to this are observed in the southernmost areas, where the influence of the North Atlantic is much more apparent. The influence of the high western Greenland coast is evident, except in the most southerly areas of study, with almost all winds predominately parallel to the coasts irrespective of season. Air Temperatures
WINTER
SUMMER

DISKO WEST BLOCKS 4 & 6 SEISMIC SURVEY PEIA ENVIRONMENTAL SETTING
4-5
The offshore areas west of Greenland are considered climatically to be part of the Arctic region and, as such, are characterised by average air temperatures that even in mid summer typically do not exceed 10°C. The Arctic is divided into two distinct climatic zones: the high Arctic (average July temperatures do not exceed 5°C) and the low Arctic (average July temperatures higher than 5°C). The northernmost areas of the Davis Strait and south-eastern Baffin Bay are considered to be high Arctic, while the remainder of the study area is low Arctic. The warmest month within the study area is on average August, (July in the near shore areas) while the coldest month is February. In the northern parts of the study area (considered high Arctic), there can be a seasonal average temperature range between warmest and coolest months as great as 30°C and much of the region will have sea ice cover for the majority of the year. In the southern areas, the low Arctic climate is influenced more significantly by the North Atlantic. As the study area is within the Arctic Circle, there is a period of time during the high summer months when there is continuous daylight and a corresponding period during mid winter when near continuous darkness occurs. This becomes more marked (of longer duration) the further north within the study area. Figure 4.4 shows the mean monthly temperatures and precipitation for Sisimiut (location shown in Figure 4.1) based on data collected over a nine-year monitoring period of 1985-1994. It should be noted that Sisimiut is approximately 150 miles south of Blocks 4 and 6 in the Davis Strait. It is on the coast such that the North Atlantic oceanic patterns are here more influenced by local climatic conditions. It can be seen that, at this coastal location, July is on average only slightly warmer than August. At Blocks 4 and 6, it is more likely that, on average, August will be very slightly warmer than July. Summer temperatures at Sisimiut have a mean maximum peak of 10°C, while in winter the lowest average temperatures can reach –18°C. Figure 4.4 serves to highlight the potential seasonal range in average air temperatures.

DISKO WEST BLOCKS 4 & 6 SEISMIC SURVEY PEIA ENVIRONMENTAL SETTING
4-6
Figure 4.4: Mean air temperature (°C) and precipitation (mm) for Sisimiut on the West Greenland coast Precipitation Precipitation is generally higher in the more southerly regions of the Davis Strait than in the northern areas of the study area, where the Davis Strait opens into Baffin Bay. This is due to the proximity to the open ocean and frequent passing of North Atlantic low-pressure weather fronts. Precipitation is low in the north as the moisture content of the air is much less, in particular this can be observed in the winter and spring months (Figure 4.4). Annual precipitation in the Disko area is between 200 and 300mm, compared with southernmost regions of Greenland where annual precipitation is more than 1000mm. Most precipitation occurs during late summer and autumn (peaks in August) coinciding with the greatest exposure of open water (sea ice at minimum extent) and occurrence of passing depressions. Winter precipitation will be snow for the majority of time, although it may form as rain in southernmost regions. During summer, local surface cover can influence whether precipitation falls as snow or rain. Light snow or freezing rain may fall over drift ice or seawater where air temperatures are close to freezing, otherwise summer snowfall is limited to short periods in the northern parts of study area and the majority of summer precipitation falls as rain. Typically, October and June are the transition months for snow/rain in the north of the study area; November and May in the far south. Visibility Reduced visibility can be the result of fog, precipitation and, in particular, heavy snow. Fog (defined by visibility less than 1km) occurs principally during the summer months (See Figure 4.5), with occurrences increasing in frequency during May, with a peak in June and July; throughout August the number of occurrences of fog gradually decreases.

DISKO WEST BLOCKS 4 & 6 SEISMIC SURVEY PEIA ENVIRONMENTAL SETTING
4-7
Figure 4.5: Occurrence of fog (number of days in each month) at Aasiaat July in the Davis Strait is very foggy, with fog occurring for 20–30% of the total time over the coldest areas of open water. Fog is less frequent in near shore areas. The fog, which occurs in the Davis Strait during summer, is known as advection fog. It is formed when relatively warm, humid air masses move over a colder surface. Typically, air temperatures within advection fog over the sea surface will be one or two degrees centigrade cooler than the sea surface itself, as a result of radiation cooling. This can often result in freezing fog. In winter, advection fog may occur occasionally when a warmer, moist air mass moves into the area from the south. Radiation fog may also occur under clear, calm conditions, over sea ice or snow-covered ice. However, for most of the winter, the relative lack of moisture in the air means that fog occurrences are rare. Reduced visibility is often caused by heavy snow; this is particularly the case in winter, over areas of open water, where snow showers can be frequent.
4.2.2 Oceanography Oceanic Circulation Patterns and Water Masses The waters off Greenland are in a transition zone between the oceanic circulation of the North Atlantic and the Arctic. The North Atlantic Current, a continuation of the Gulf Stream, which provides north-west Europe with its maritime climate, actually impacts Greenland’s waters. A westward flowing branch of the North Atlantic Current joins the East Greenland Current, where it underlies colder, less saline polar water masses moving southwards. The majority of the North Atlantic Current converges with Arctic water near Spitsbergen and sinks, forming an underlying current in the Arctic Ocean. A further westward branch of the North Atlantic current becomes the Irminger Current, to the south of Iceland; part of this current flows north along the Iceland coast and through the Denmark Strait to meet the East Icelandic Current, while a further branch flows in the direction of Greenland. This branch of the Irminger Current flows in a southerly direction along the east Greenland coast, separating so that some of the water mass turns north around the southernmost tip of

DISKO WEST BLOCKS 4 & 6 SEISMIC SURVEY PEIA ENVIRONMENTAL SETTING
4-8
Greenland to enter the Davis Strait, while the remainder stays within the Irminger Sea, forming a gyre. Water entering the Davis Strait by this route, in a water mass beneath the main East Greenland Current, is comparatively warm. Cold water originating from the Arctic Ocean flows into Greenland’s waters via two routes: through the Fram Strait (between Greenland and Spitsbergen) and through the Canadian Arctic Archipelago (into Baffin Bay). Approximately 75% of water movement from the Arctic Basin enters the North Atlantic via the Fram Strait and as such, is the principal source of cold water to the North Atlantic. This surface water mass moves south along the eastern Greenland Coast, along the Greenland Shelf, as the East Greenland Current (as previously mentioned), where it flows around the southern tip of Greenland at Cape Farewell, to flow northwards into the Davis Strait. This water mass flows north along the west Greenland coast, mixing with the underlying water from the Irminger Sea, as far as a latitude of 64–66°N and the Fylla Bank (offshore from the Greenland capital, Nuuk), where it turns westwards and meets the southward flowing current coming from Canada’s eastern coast, the Baffin Current. The Baffin Current is the second main exit for Arctic Water, via the Canadian Arctic Archipelago. The current follows the eastern Canadian coast, continuing further south as the Labrador Current, until it meets up with the North Atlantic Current. Figure 4.6 shows the overall current pattern in the Davis Strait and Baffin Bay concerning principal water masses. Red indicates relatively warm water that has originated from the North Atlantic, via the Irminger Current, which then mixes with the colder water from the East Greenland Current, forming the West Greenland Current. The cold water moving southwards through eastern Baffin Bay is the Baffin Bay Current, which becomes the Labrador Current further south.
DISKO WEST BLOCKS 4 & 6 SEISMIC SURVEY PEIA ENVIRONMENTAL SETTING
4-9
Figure 4.6: The overall oceanic current pattern in Davis Strait and Baffin Bay (Source: Mosbech et al., 2007a) Arctic-derived water in the study area is predominant during spring and early summer, while the inflow of North Atlantic-derived water masses is predominant during autumn and winter, thus helping to account for the waters between 62 and 67°N usually remaining ice free. The shallower near-shore water off the west Greenland coast, within the study area, is the primarily cold, less saline polar water of the East Greenland Current. Further offshore in deeper water, the water is warmer, fully saline (less influenced by glacial melt and fjord runoff) and derived from the North Atlantic via the Irminger Sea.

DISKO WEST BLOCKS 4 & 6 SEISMIC SURVEY PEIA ENVIRONMENTAL SETTING
4-10
Current velocities off the West Greenland coast are typically fairly weak (<0.1m/s) with the exception of near-shore areas and around the Greenland Banks (indicated in Figure 4.1), where the frontal areas between the two principal water masses (Arctic derived and North Atlantic derived) meet. The current velocities in this area are typically in excess of 0.25m/s and can often be in excess of 0.5m/s. The upper 1000m of the water column in the immediate study area is dominated by the following four water masses (Hansen et al., 2004):
• Arctic Water – characterised by temperatures of less than 1°C, which can rise to between 3 and 5°C during summer months. Salinity is typically less than 34.4%o.
• Irminger Water – characterised by temperatures of approximately 4.5°C and
salinity in excess of 34.95%o. Typically only observed in the southernmost areas of study.
• Irminger Mode Water – Irminger water that has mixed with the surrounding
water masses before reaching south-west Greenland. Characterised by temperature of approximately 4°C and salinities of between 34.85 and 34.95%o.
• North-west Atlantic Mode Water – characterised by temperatures in excess of
2°C and salinities between 34.5 and 34.85%o. Water temperatures can rise to more than 5°C in late autumn.
Due to the nature of the bathymetry and coastal morphology of the Davis Strait and Baffin Bay, and the fact that there are differing water masses, hydrodynamic discontinuities may occur in certain areas within the study area (Mosbech et al., 2007a). These occurrences may result from the meeting of water masses of differing properties (temperature and salinity). In addition, differing water masses may coincide with sharp changes in bathymetry, as is the case at the West Greenland and Fylla Banks where upwelling occurs assisted by tidal currents, providing conditions for productive fisheries. At such locations, downwelling of water can also occur. Similar upwelling can occur at ice edges and elsewhere along the steep West Greenland coast. Figure 4.7 shows those areas within the study area, where upwelling and downwelling have been observed. Prominent upwelling areas occur close to Hareø Island, at the mouth of Vaigat Sound (just north of Disko Island) and at the north of the Store Hellefiskebanke (an important fishery and bird area) to the south of and in the southernmost areas of Block 6.

DISKO WEST BLOCKS 4 & 6 SEISMIC SURVEY PEIA ENVIRONMENTAL SETTING
4-11
Figure 4.7: Regions within the project study area where high rates of vertical water movement (upwelling and downwelling) are observed. Vertical rates are indicated by the standard deviation of the vertical speed of upwelling/downwelling (Source: Mosbech et al., 2007a) Tidal Regime Tides in the Davis Strait and southern areas of Baffin Bay are semi-diurnal. There are two high tides and two low tides every 24 hours. The tidal patterns in the waters of Baffin Bay and Davis Strait radiate in an anti-clockwise direction around an amphidromic point at approximately 70°N (almost the centre of Baffin Bay). At this point, there is almost no tidal range. Tidal information is available for the port of Aasiaat, on the southern coast of Disko Bay, where there is a spring tidal range of 2.5m and a neap tidal range of 0.8m. To the south at the port of Sisimiut, tidal ranges are greater, with a spring tidal range of 4.3m and neap tidal range of 1.2m. Waves The wave regime in the West Greenland waters is influenced to a degree by the North Atlantic, which is considered to be both one of the windiest and, in combination with its great fetch, one of the roughest areas of the world's oceans. During the

DISKO WEST BLOCKS 4 & 6 SEISMIC SURVEY PEIA ENVIRONMENTAL SETTING
4-12
winter months, strong westerly winds (in excess of 15m/s) routinely generate waves with a height greater than 5m. Wave height studies have been undertaken in the Davis Strait, based on data collected by the US GEOSAT satellites between 1986 and 1989, using a radar altimeter. These studies were limited to the southern areas of the Davis Strait and do not extend much further north than the southern extent of seasonal sea ice (at similar latitude to licence Block 6). The largest waves in the Davis Strait are experienced during the winter months (November to March); otherwise, the wave climate is comparatively calm. Average wave heights near the licence Blocks typically do not exceed 2m (although it is important to note that during winter months, much of the sea surface in the vicinity is ice covered), with the exception of June when certain areas in the vicinity of licence Block 6 show average wave heights of 2-3m. Sea Ice and Icebergs Sea Ice The two principal factors governing sea ice formation in the Davis Strait and southern Baffin Bay are the northward-flowing West Greenland Current and the southward-flowing Baffin Current. Sea ice does not form uniformly from the north, throughout the Davis Strait, due to the retardation effects of the West Greenland Current. As a result, open water can exist inshore along the West Greenland coast in winter at much higher latitudes and for an extended period compared with the adjacent eastern Canadian coast, which is influenced by the Baffin Current. This can be observed in Figure 4.8. Figure 4.8 shows monthly sea-ice cover for 2004, in the study area, extending north into Baffin Bay and south to include much of the Davis Strait. Data is based on satellite monitoring data from the Defence Meteorological Satellite Program (DMSP) and Multi-channel Radiometer. The waters of the eastern Davis Strait are typically free of sea ice from April/May until December (Figure 4.8). However, there will be occasional icebergs in these waters. During winter months, the Baffin Current supplies sea ice to the Davis Strait. During March, the southern extent of the sea-ice edge on the eastern side of the Davis Strait is at approximate latitudes of 63-65°N. The exception to this is close to the western Greenland coast, where a lead of relatively ice free/or thinly iced water can extend northward as far as 67-68°N. Below 65°N, the Davis Strait is relatively ice-free throughout the year. In recent years, however, the extent of annual sea-ice formation has decreased. Three main types of ice are encountered in western Greenland’s coastal waters: fast ice, drift ice and land-derived (glacial) icebergs. There are two main types of fast ice: new (single year) and multi-year ice. Of the drift ice, the principal ice formation in the study area is known as the ‘West Ice along the western coasts of Greenland’. West Ice is drifting ice that dominates the western and northern areas of the Davis Strait and Baffin Bay. This ice regime is particularly prevalent during the spring melting season, as ice breaks up and melts more slowly along the western areas. Predominantly, ice encountered throughout the Davis Strait and southern Baffin Bay is new and is formed and reformed each winter. However, in certain areas older,

DISKO WEST BLOCKS 4 & 6 SEISMIC SURVEY PEIA ENVIRONMENTAL SETTING
4-13
multi-year ice may enter the western areas of study area via the Baffin Current and from Canadian coastal areas. Multi-year ice is present as fast ice along much of the eastern Greenland coasts. Under the right conditions, by mid winter, multi-year ice can stretch to the southernmost extent of Greenland, breaking off from the main fast ice and moving into the Davis Strait. It is rare for multi-year ice to be present along the West Greenland coast, particularly within the study area. However, multi-year ice floes derived from the eastern Greenland coast can be present along the West Greenland coasts, although always significantly further south than the project study area. These ice floes are at their greatest frequency during early summer and are typically only 5-20 metres, although they can be up to 100m. Multi-year ice derived from the eastern Greenland coast is considered drift ice, when in West Greenland waters. Even during particularly severe winters, the west coast of Greenland (eastern side of the Davis Strait) remains navigable to ice-strengthened vessels as far north of Sisimiut, due to the northward-flowing West Greenland Current. The West Greenland Current results in later ice formation and earlier melting than on the eastern Davis Strait coasts, as well as the retardation effects on sea ice extent. Early during the spring melt (April), a wide lead or polynya usually forms in the sea ice west of Disko Island and adjacent to Disko Bay. This connects with the lead that follows north along the western Greenland coast. Sea ice on the eastern side of the Davis Strait and southern Baffin Bay is typically at its maximum thickness in March/April. Maximum sea ice thickness can vary throughout the study area, depending on the distance from the coast and the degree of latitude. However, maximum sea-ice thickness ranges between 50cm and 90cm, becoming greater as distances over 100km from the West Greenland coast are exceeded. Sea ice drift in the northern Davis Strait and southern Baffin Bay regions is not particularly well understood. However, it is known to be principally controlled by the surface water currents and sea surface wind regime. The effects of the wind on sea ice drift become more significant further south in the Davis Strait, where the winds are stronger. It can be seen that the majority of the study area between 68 and 72°N is largely ice-free from June until January, and that the period of ice cover over the area including Blocks 4 and 6 is actually relatively short. It has also been noted in recent years that overall sea-ice cover has decreased in its extent and duration.
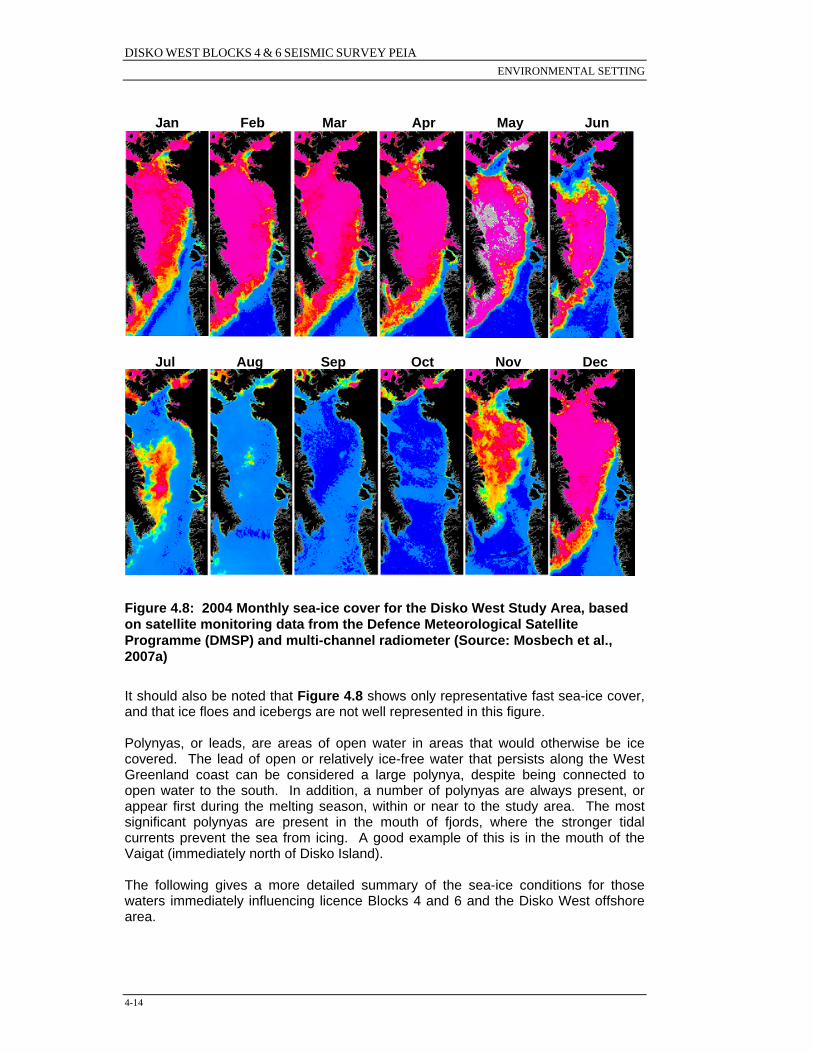
DISKO WEST BLOCKS 4 & 6 SEISMIC SURVEY PEIA ENVIRONMENTAL SETTING
4-14
Jan Feb Mar Apr May Jun
Jul Aug Sep Oct Nov Dec
Figure 4.8: 2004 Monthly sea-ice cover for the Disko West Study Area, based on satellite monitoring data from the Defence Meteorological Satellite Programme (DMSP) and multi-channel radiometer (Source: Mosbech et al., 2007a) It should also be noted that Figure 4.8 shows only representative fast sea-ice cover, and that ice floes and icebergs are not well represented in this figure. Polynyas, or leads, are areas of open water in areas that would otherwise be ice covered. The lead of open or relatively ice-free water that persists along the West Greenland coast can be considered a large polynya, despite being connected to open water to the south. In addition, a number of polynyas are always present, or appear first during the melting season, within or near to the study area. The most significant polynyas are present in the mouth of fjords, where the stronger tidal currents prevent the sea from icing. A good example of this is in the mouth of the Vaigat (immediately north of Disko Island). The following gives a more detailed summary of the sea-ice conditions for those waters immediately influencing licence Blocks 4 and 6 and the Disko West offshore area.

DISKO WEST BLOCKS 4 & 6 SEISMIC SURVEY PEIA ENVIRONMENTAL SETTING
4-15
Vaigat and Disko Bay In the Vaigat and Disko Bay during winter, sea-ice typically forms in early January and melts again during May or early June, depending on the severity of the previous winter. Fast ice is formed in midwinter in periods of particularly cold and calm weather conditions. Sea-ice appears earlier and melts later closer to the coast in south-eastern Disko Bay than in the rest of the Disko Bay area. The occurrence of sea-ice in Disko Bay can be summarised as follows:
Mild winters: waters ice up during early February; ice is characterised by young ice and thin first-year ice, mostly large drift ice floes. The area is free of sea ice by early May. Normal winters: waters ice up in mid January; ice is characterised by young ice and thin first-year ice, very large floes or fast ice. The area is free of sea ice by late May. Cold winters: waters freeze-up in late December, ice is characterised by thin first-year ice, mostly fast ice except in the break-up season. The area is free of sea-ice by late June.
West of Disko Island The waters immediately west of Disko Island and around Hareø Island are free of sea-ice from mid June to mid November, although belts of sea ice occasionally drift from the central parts of southern Baffin Bay to the area during the summer. An ‘ice bridge’ often occurs north-west of Disko Island due to onshore currents west of Nuussuaq, even when large open water areas are present west of Uummannaq Fjord and Svartenhuk (to the north of the immediate study area). When sea-ice is present, the area is characterised by large floes of thin first-year ice. However, the ice cover is very variable, and large open water areas or large areas with young ice only occur occasionally. Waters of the Davis Strait, west of Aasiaat and Disko Bay The waters immediately offshore from Disko Bay have a different ice regime to the bay itself. Here the sea-ice is characterised by young and thin first-year ice. The ice thickness and distribution varies depending on the local meteorological conditions. Sea-ice normally occurs from mid December until early May. In normal winters, a second west-east-oriented ‘ice bridge’ consisting of high concentrations of slowly moving drift ice forms west of Aasiaat at approximately 68°N, due to the onshore component of the surface current. During the summer, belts of remaining sea ice from the central parts of Davis Strait occasionally drift closer inshore towards the Greenland coast. Sea ice conditions are assessed on a regular basis (daily or weekly) by various meteorological agencies. This information will be important to assessing any operations or development scenarios for the area. An example of a recent ice chart is shown in Figure 4.9.

DISKO WEST BLOCKS 4 & 6 SEISMIC SURVEY PEIA ENVIRONMENTAL SETTING
4-16
Figure 4.9: Sea ice conditions in the Davis Strait, Disko West Area and Baffin Bay, March 2, 2008 (Source: Danish Meteorological Institute).
Ice Concentration Red: 9-10/10ths Orange: 7-8/10ths Yellow: 4-6/10ths
“Egg” code This is the World Meteorology Organization’s code for ice characteristics such as total/partial concentration, development and ice type. www.natice.noaa.gov/egg_code/index.html

DISKO WEST BLOCKS 4 & 6 SEISMIC SURVEY PEIA ENVIRONMENTAL SETTING
4-17
Icebergs Icebergs are derived from the coasts and are wholly terrestrial in origin. As such, they are made from fresh water, rather than seawater ice. They break off from the seaward ends of glaciers in a process known as calving and are typically much higher than sea ice, although they can range in size from 1m to over 75m above sea level. A ‘very large iceberg’ is considered greater than 200m in length and over 75m above sea level, whilst at the other end of the scale the smallest icebergs are termed ‘growlers’ and are less than 1m in height and 5m in length. Due to the displacement of icebergs, ocean currents are the principal governing factor in iceberg movement once they have calved from the glacier. To a lesser extent, tides and wind can also play a role in iceberg transport depending on the overall height of the iceberg. There are many glaciers along the West Greenland coast, with some of the most productive in terms of iceberg calving, situated in the Nares Strait and Disko Bay area. Icebergs are present throughout the Davis Strait and Baffin Bay between latitudes 60 and 72°N. However, in certain areas, they are particularly rare, while in others extremely abundant. Disko Bay is an area where icebergs are particularly prevalent, as is Melville Bay and Uummannaq Fjord immediately to the north. Several active glaciers in these areas produce 10–15,000 icebergs annually and are considered extremely important in terms of overall iceberg input into the northern Davis Strait and southern Baffin Bay area. To put this figure into context, the overall estimate for the total number of icebergs that are calved annually from glaciers along all coasts of Baffin Bay and the northern Davis Strait is approximately 25-30,000. This means that potentially half of all icebergs are produced in the immediate vicinity of the study area. Icebergs from Disko Bay may enter the Davis Strait, either via the Vaigat (to the north of Disko Island) or to the south of Disko Island. Figure 4.10 shows the iceberg density in the Disko Bay area and Disko West offshore area and the differing densities between the near-shore waters, where the icebergs are calved, and offshore waters.
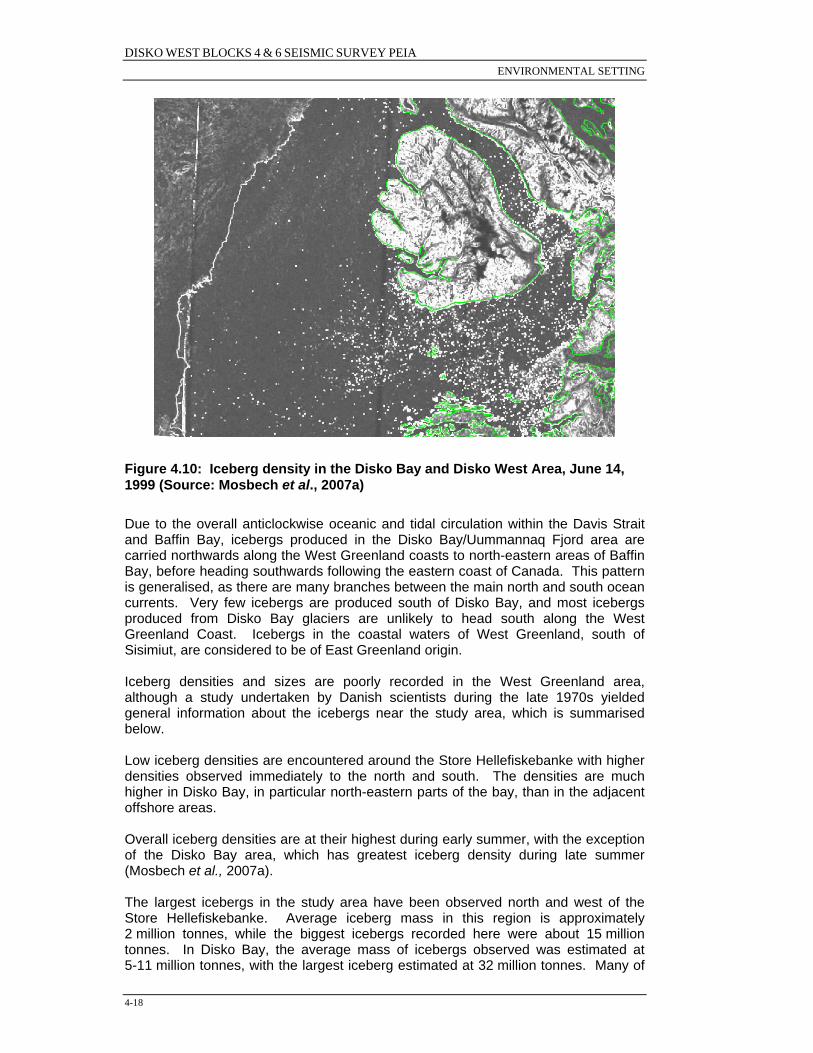
DISKO WEST BLOCKS 4 & 6 SEISMIC SURVEY PEIA ENVIRONMENTAL SETTING
4-18
Figure 4.10: Iceberg density in the Disko Bay and Disko West Area, June 14, 1999 (Source: Mosbech et al., 2007a) Due to the overall anticlockwise oceanic and tidal circulation within the Davis Strait and Baffin Bay, icebergs produced in the Disko Bay/Uummannaq Fjord area are carried northwards along the West Greenland coasts to north-eastern areas of Baffin Bay, before heading southwards following the eastern coast of Canada. This pattern is generalised, as there are many branches between the main north and south ocean currents. Very few icebergs are produced south of Disko Bay, and most icebergs produced from Disko Bay glaciers are unlikely to head south along the West Greenland Coast. Icebergs in the coastal waters of West Greenland, south of Sisimiut, are considered to be of East Greenland origin. Iceberg densities and sizes are poorly recorded in the West Greenland area, although a study undertaken by Danish scientists during the late 1970s yielded general information about the icebergs near the study area, which is summarised below. Low iceberg densities are encountered around the Store Hellefiskebanke with higher densities observed immediately to the north and south. The densities are much higher in Disko Bay, in particular north-eastern parts of the bay, than in the adjacent offshore areas. Overall iceberg densities are at their highest during early summer, with the exception of the Disko Bay area, which has greatest iceberg density during late summer (Mosbech et al., 2007a). The largest icebergs in the study area have been observed north and west of the Store Hellefiskebanke. Average iceberg mass in this region is approximately 2 million tonnes, while the biggest icebergs recorded here were about 15 million tonnes. In Disko Bay, the average mass of icebergs observed was estimated at 5-11 million tonnes, with the largest iceberg estimated at 32 million tonnes. Many of

DISKO WEST BLOCKS 4 & 6 SEISMIC SURVEY PEIA ENVIRONMENTAL SETTING
4-19
the largest icebergs observed in the study area can be constrained in their potential to drift further offshore or close inshore by their draft (maximum draft of some icebergs estimated in excess of 250m). As such, this must be considered another important factor in governing overall iceberg distribution. Bathymetry and Coastal Morphology The offshore shelf waters throughout the study area are generally fairly shallow (typically less than 200m) in the area between the coast and the steep shelf break. The shelf includes several large shoals or banks, which range between 20 and 200m in depth. In the southern part of the study area, the shelf is up to 120km wide. In the northern part, the shelf is wider and less well defined where it drops away towards the deep sea. The shelf is traversed by deep troughs, which separate the fishing banks. To the west of the shelf, the water drops away to depths of approximately 2500m. Figure 4.10 shows the bathymetry of the study area. Where Disko Bay opens into the Davis Strait and, consequently, licence Block 6, a deepwater trough exists (known as Egedesminde Dyb) where depths exceed 900m. This extends as a fan feature across the shelf to the shelf break (Zarudzki, 1980) (Figure 4.11).
Figure 4.11: Bathymetry of the Disko Bay and Disko West study area The coastal morphology of central West Greenland is dominated by high cliffs (see Figure 4.12) and is indented by fjords, many of which have large glaciers. To the south of Disko Bay (within the study area of 68-72°N), the coastal zone is dominated
4
6

DISKO WEST BLOCKS 4 & 6 SEISMIC SURVEY PEIA ENVIRONMENTAL SETTING
4-20
by rock shorelines with outlying skerries and islands. In more sheltered areas, between more prominent rock coasts, are small bays of gravel or sand sediment. There are many islands within Disko Bay and the coastline here is afforded a degree of protection from prevailing offshore conditions by Disko Island. In places, glaciers meet the coast and the overall impression is one of spectacular coastal scenery. The most prominent coastal features of the study area are the long fjords and large glaciers. Good examples include the Jakobshavn Glacier, which runs into the Ilulissat ice fjord, and the many glaciers entering Uummannaq Fjord. The Jakobshavn glacier is fed from the Greenland Icesheet and is considered the most productive glacier in the northern hemisphere.
Figure 4.12: Typical coastal morphology West Greenland
4.2.3 Geology and Geomorphology Stratigraphy West Greenland Continental Margin The transition zone between the continental and oceanic crust is broader on the southern and western coasts of Greenland than on the eastern. The seaward extent of the continental crust off southern West Greenland lies well to the south-west of the continental slope, at water depths over 1500m (Geological Survey of Denmark and Greenland (GEUS), 2003). This is supported by evidence found in the structural pattern of the seismic lines. Both the typical continental crust and the transitional crust between continental and oceanic crust show large tilted fault blocks overlain by syn and post-rift sediments. The oldest sediments are most likely of Early Cretaceous age.
DISKO WEST BLOCKS 4 & 6 SEISMIC SURVEY PEIA ENVIRONMENTAL SETTING
4-21
The crust underlying the Davis Strait is estimated to be approximately 22km thick, which is intermediate between the thickness of normal oceanic and continental crust (GEUS, 2003). It is assumed that this is continental crust that has thinned. The nature of the crust underlying Baffin Bay is not as obvious, as there are no distinct sea-floor-spreading magnetic anomalies in this region. Figure 4.13 shows a stratigraphic column for the West Greenland Shelf and the predicted depths of potential reservoir formations.
Figure 4.13: Stratigraphic section of the West Greenland Shelf, showing the depths of source rocks and potential reservoirs.

DISKO WEST BLOCKS 4 & 6 SEISMIC SURVEY PEIA ENVIRONMENTAL SETTING
4-22
Offshore Sedimentary Basin Near Licence Blocks 4 and 6 Previous seismic exploration has shown that large sedimentary basins occur offshore from West Greenland between 63 and 68°N and 73 and 77°N, and that in the intervening areas that there are extensive Lower Tertiary basalts, below which there are expected to be thick sedimentary successions. Lower Tertiary basalts that have been exposed onshore in the Disko–Nuussuaq–Svartenhuk-Halvø area continue offshore where they have been mapped from seismic and magnetic data over the entire area between latitudes 68 and 73°N. In the eastern part of this area, the basalts are exposed at the seabed, evidenced during dredging surveys, but to the west they become increasingly buried under a cover of Eocene and younger sediments. Below the basalt layers, underlying sediments may be as much as 5km in thickness (GEUS, 2003). Figure 4.14 shows a cross-section of the offshore central West Greenland sedimentary basin at approximately 69° 30'N (to the west of Disko Island).
Figure 4.14: A cross-sectional diagram of the offshore central West Greenland sedimentary basin at approximately 69° 30'N (to the west of Disko Island). The depth is obtained from depth-converted seismic data, with a vertical exaggeration x 7 (Source: GEUS, 2003) Seabed Sediments The seabed of western Disko Bay is described as relatively rugged in nature, with frequent rock outcroppings and much evidence of iceberg scour and glacial sediment deposits. Iceberg scour, or keels, are most apparent in the near-shore waters where water depths are reduced, but are also present in deeper waters to a lesser degree. Sediments in Disko Bay are predominantly glacial in origin and at certain locations are described as partly comprising coarse pebbles and other rock debris, derived from glacial sources (Mosbech et al., 2007b). Coarser sediments are typically found in the coastal waters, whilst in deeper waters of Disko Bay and further offshore in the Disko West study area, sediments are much softer and contain greater proportions of silts.

DISKO WEST BLOCKS 4 & 6 SEISMIC SURVEY PEIA ENVIRONMENTAL SETTING
4-23
4.3 Biological Environment
4.3.1 Benthic and Planktonic Communities Benthic Communities Shallow Arctic coastal waters can be highly productive and form an important constituent part of the marine food web. The benthic communities within the study area, particularly bivalve molluscs, constitute an important food source for fish, birds and marine mammals (Merkel et al., 2007). The shallow near-shore waters support a significant biomass of benthic algae, particularly brown algae, which is found in the intertidal and subtidal zone down to about 50m of water depth. Common species in the study area include Fucus vesiculosus, Fucus distichus, Ascophyllum nodusum, Agarum cibrosum and several Laminaria species (Christensen, 1981). In near-shore waters, the composition and species diversity of benthic communities differs greatly depending on a number of factors, namely coastal type and exposure to wave action and ice. In the study area, bivalve mollusc species are represented by the blue mussel (Mytilus edulis), Hiatella bysifera, Serripes groenlandicus and Mya truncata. In addition, making most of the faunal biomass are polychaetes, echinoderms, amphipods and gastropod molluscs. Several Arctic benthic species live particularly long and, as such, this slow growth tends to make them vulnerable to disturbance. The seabed sediments in deeper offshore waters of the study area are much softer and contain silts; a diverse infaunal and epifaunal assemblage is noted in these areas. The benthic fauna dominating deeper water areas includes crustaceans, bivalve molluscs, polychaetes, and echinoderms. This habitat within the study area is of particular importance for the deepwater prawn (Pandalus borealis) and the snow crab (Chionoectes opilio), both of which are fished in commercially important quantities. On the subtidal banks (in approximately 50-100m water depth), polychaetes are the most numerous infauna, whilst epifaunal species include various crustacean species. These are important prey species for fish. Bryozoans and echinoderms are also important benthic species. An important point to note is that on the slopes of the Store Hellefiskebanke the benthic fauna is noticeably richer than on the top of the banks, and is influenced by upwelling of nutrient rich deeper water. Phytoplankton The single most important event in the determination of the production capacity of Arctic marine food webs is the spring phytoplankton bloom. This bloom equates to a peak in primary production throughout the water column (Söderkvist et al., 2006). The onset of the spring phytoplankton bloom within the study area depends on a number of factors, such as meteorological conditions, duration of sea-ice cover and oceanography. However, the spring bloom has typically commenced by late April and develops throughout May. The phytoplankton develops as a result of sunlight and stratification of the water column during spring; as such, the spring bloom can often occur earlier at the edges of the sea-ice than in open water, where the ice cover has resulted in a more stabilised water column. In other localised areas, such as deep-water upwelling areas, glacial edges and tidal fronts, primary production may sustain a peak

DISKO WEST BLOCKS 4 & 6 SEISMIC SURVEY PEIA ENVIRONMENTAL SETTING
4-24
throughout the summer. There are a number of such locations throughout the study area. Upwelling areas are found at the north-eastern corner of Store Hellefiskebanke, outside Disko Bay and around Hareø Island, and off the front of the Jakobshavn Glacier situated in the Ilulissat ice fjord in the interior of Disko Bay. Seabirds and mammals are drawn to these areas, as the highly productive areas are rich feeding grounds. In particular, upwelling areas, of which there are a number within the study area, further highlight its importance. High primary production also occurs on the underside of sea-ice, although its importance within the immediate study area is not fully known. Upwelling areas are of particular significance within the study area as they form much more predictable, long-lived, and consistent areas of high primary production than ice edges and fronts and the underside of sea ice. Zooplankton Species of copepods from the genus Calanus are dominant zooplankton species in the waters of the study area; these are an important prey species for both fish and their larvae. In addition, they are important prey for some whale species (particularly bowhead whales) and some seabirds (little auk is a specialised Calanus feeder) (Mosbech et al., 2007a). Calanus is of great significance in the Arctic marine ecosystem, as higher trophic levels rely on a lipid that accumulates in it. As such, many lifecycle processes and other biological activity, such as fish spawning and growth, may be timed such that it is synchronised with the Calanus life cycle. In addition, Calanus copepods are important to benthic communities as they supply food in their large, fast-sinking faecal pellets (Söderkvist et al., 2006). The majority of biological activity in the surface water layer occurs during spring and early summer in association with the spring phytoplankton bloom and the appearance of the Calanus populations (Mosbech et al., 2007a). Peak abundances of shrimp and fish larvae are also observed in the early summer in association with the peak abundance of their planktonic prey species. It is understood that the most productive period for zooplankton is May to June. Calanus are widespread throughout West Greenland’s waters where high numbers have been recorded in Disko Bay and both on the banks and west of the banks in deeper waters. The larvae of fish and shrimp species are also important components of the zooplankton. Important sites within the study area for the development of shrimp and fish larvae within the zooplankton are on the slopes of the banks and the shelf break, and in Disko Bay where the highest biomass of their copepod prey is also located (Simonsen et al., 2006). Shrimp larvae are distributed widely throughout the study area with particularly high densities both on the banks and to west of the banks. Shrimp larvae are estimated to travel up to 500km from their release site before they settle, and it is indicated that there are several such release sites on the offshore banks south of Disko Bay, including the northern edge of Store Hellefiskebanke. Other areas where shrimp larvae were in particularly high numbers were in Disko Bay itself and the waters around Hareø Island. Greenland halibut larvae concentrations in the upper water column are relatively high south of 68°N, while within the majority of the study area they are low during summer. Other fish larvae that have been studied include sand eel, which were very

DISKO WEST BLOCKS 4 & 6 SEISMIC SURVEY PEIA ENVIRONMENTAL SETTING
4-25
numerous particularly in Disko Bay and on some of the banks, and redfish, which are very numerous south of 62°N, but almost absent from the waters of the study area (Pedersen & Smidt, 2000). Overall, the zooplankton is expected to move corresponding to the ocean currents. However, it has been observed that there is a degree of retention of zooplankton communities over the banks, where plankton tends to be concentrated and entrapped for periods (Pedersen et al., 2005).
4.3.2 Fish and Fisheries Introduction The majority of fish in the study area are demersal, and only a few species are caught commercially in West Greenland’s waters, while more are caught in local subsistence fisheries. Despite more species being caught in subsistence fisheries, the number is still relatively low, meaning that there is a general lack of information about many species of fish and shellfish within the study area and surrounding waters. In economic terms, Greenland halibut, deepwater shrimp and lumpsucker are the most important species that are caught commercially. Species that are caught in local subsistence fisheries include capelin, arctic char, redfish, spotted wolf-fish and Atlantic halibut (Mosbech et al., 1998). Table 4.1 gives a summary of selected species of invertebrates and fish present within the study area. Winter/Spring Spawning Species Until recently, Atlantic cod (Gadus morhua) were numerous, particularly in the southern parts of the study area on the offshore banks and around the Store Hellefiskebanke. However, as a result of the offshore stock collapsing due to over fishing, Atlantic cod now is only present within the study area in very small numbers and in inshore waters (Hovgaard & Christensen, 1990). Greenland cod (Gadus ogac) is also present in the study area in small numbers and some small-scale commercial and subsistence exploitation of this species occurs (Mosbech et al., 1998). Greenland halibut (Reinhardtius hippoglossoides) are a deepwater demersal species and are present throughout the offshore parts of the study area, as well as deeper fjords. Spawning takes place at depths in excess of 1000m during the winter months in waters south of 67°N. Eggs and larvae drift northwards with the West Greenland Current to settle in the shallower waters of the offshore banks. The Store Hellefiskebanke and Disko Bay are considered important nursery areas for juvenile Greenland halibut until they reach 1-2 years old. The majority of Greenland halibut that are fished throughout the study area would have been spawned south of the study area; consequently, those fish spawned within the study area will join an adult stock further north of the study area (Pedersen & Riget, 1993).
Table 4.1: Summary of selected important fish and large invertebrate species in the study area (Modified from Hansen et al., 2004 and Mosbech et al., 2007a)

DISKO WEST BLOCKS 4 & 6 SEISMIC SURVEY PEIA ENVIRONMENTAL SETTING
4-26
Species
Main habitat Spawning area Spawning period
Exploitation Importance of study area to
population Blue mussel (Mytilus edulis)
Subtidal, rocky coast
Subtidal, rocky coast
Low levels of local exploitation
Low
Deep sea/cold water shrimp (Pandalus borealis)
Mainly offshore, at 100–600m depth
Larvae released at relatively shallow depth (100–200m) in north & south of the study area
March–May in southern part, August in northern
Commercially exploited and very important
High
Iceland scallop (Chlamys islandica)
Inshore and on the banks with high current velocity, at 20–60m depth
As main habitat Some commercial and local exploitation
Medium
Snow crab (Chionoecetes opilio)
Coastal waters and fjords, at 180-400m depth
As main habitat April-May Commercial exploitation
Medium
Atlantic cod (Gadus morhua)
On the banks south of 64°N; local stocks inshore
Pelagic eggs and larvae in upper water column
March-April Local exploitation Low*
Greenland cod (Gadus ogac)
Inshore/fjords Inshore/fjords demersal eggs, pelagic larvae
February–March
Commercial and local exploitation
Medium
Arctic cod (Arctogadus glacialis)
Pelagic Mainly north of 68°N
- Important prey species
Medium
Sand eel (Ammodytes sp.)
At the banks at depths between 10 and 80m
At the banks, demersal eggs, pelagic larvae
July-August Important prey species
Medium
Spotted wolffish (Anarhichas minor)
Inshore and offshore waters over hard sea bed
Demersal eggs Peaks in September
Local exploitation Medium
Arctic char (Salvelinus alpinus)
Coastal waters and fjords
Freshwater rivers Autumn Local exploitation Medium
Capelin (Mallotus villosus)
Coastal beaches and bays, demersal eggs
Important prey species
April–June Local exploitation; Important prey species
Medium
Atlantic halibut (Hippoglossus hippoglossus)
Offshore and inshore, deep water
Pelagic eggs and larvae, deep water
Spring Local exploitation Low
Greenland halibut (Reinhardtius hippoglossoides)
Deep water, in fjords and offshore waters
Deep water, pelagic eggs and larvae
Winter Important; local and commercial exploitation
High
Redfish (Sebastes mentella)
Offshore and in fjords, 150–600m depth
Spawn outside area
- Local Medium
Lumpsucker (Cyclopterus lumpus)
Pelagic Coastal, demersal eggs
May–June Commercial and local exploitation
Medium
* Indicates potential change if the offshore stock is re-established. The importance of the study area to population (conservation value) indicates the significance of the population occurring within the assessment area in a national and international context. Arctic cod (Arctogadus glacialis) and Arctic char (Salvelinus alpinus) are both winter spawning species and are important in the food web of the study area. Arctic cod is an important species in the local food web, being a prey species for marine mammals. They are typically present in offshore waters, while Arctic char winter and spawn in rivers, moving into the coastal waters in the spring to feed.

DISKO WEST BLOCKS 4 & 6 SEISMIC SURVEY PEIA ENVIRONMENTAL SETTING
4-27
Summer Spawning Species Lumpsucker (Cyclopterus lumpus) are found predominantly in the deep offshore waters, although during spring and early summer they spawn in shallow coastal waters, including the coastal waters of the study area (Figure 4.15). This has resulted in an increasingly important inshore fishery, mainly for their roe (Mosbech et al., 1998). Capelin (Mallotus villosus) is an important fish species in the study area. They are a schooling fish and tend to be present in the study area in particularly large numbers during the spawning season. Capelin spawning occurs in spring and early summer along the shores of bays, fjords, rocky coasts and beaches (Sørensen, 1985). Capelin are particularly important, as they are an important prey species for larger fish, seabirds and marine mammals. Figure 4.15 is a map of the spawning areas of capelin and lumpsucker in the inshore waters of the study area. The spawning map has been produced using local knowledge of the area from fishermen. In addition, surveys for capelin were undertaken in the offshore regions of the study area in 2005 by the Greenland Institute for Natural Resources (GINR). These surveys found the only significant occurrences of capelin were in the mouth of the Vaigat and south-eastern Disko Bay. Sand eel (Ammodytes sp.) is an important prey species in the study area for both marine mammals and seabirds. Sand eels are present on the banks, often buried in the sandy bottom; they are one of the few species of fish, which spawn in the study area during the summer (Kapel, 1979). The deep-water shrimp (Pandalus borealis) is the most important species, in economic terms, that is fished in Greenland’s waters. Within the study area, it is fished whenever ice does not close the waters, primarily on the slopes of the banks (mainly the outer slopes) and in Disko Bay itself. Spawning takes place between March and May in the southernmost regions of the study area and in August in northerly regions and further into Disko Bay. During the dark hours of the night, shrimps can forage widely throughout the water column and can even occur near the surface during night.

DISKO WEST BLOCKS 4 & 6 SEISMIC SURVEY PEIA ENVIRONMENTAL SETTING
4-28
Figure 4.15: Spawning and fishery map for capelin and lumpsucker in the coastal waters of the study area

DISKO WEST BLOCKS 4 & 6 SEISMIC SURVEY PEIA ENVIRONMENTAL SETTING
4-29
4.3.3 Seabirds Sea Bird Populations in the Disko Island and Disko West Areas Due to the suitable rocky terrain, the lack of terrestrial predators and the abundance of available food to seabirds, there is a thriving population of auks, ducks, cormorants and gulls associated with the western coast of Greenland. The study area in particular, is rich in many species of seabirds, each adapted to a variety of ecological niches. Some species feed predominately on fish, such as the Brünnich’s guillemot (Uria lomvia) feeding in summer, in the outer coastal areas and further offshore), whereas the cormorants (Phalacrocorax carbo) feed in coastal areas and fjords. Some are surface plankton feeders like the kittiwakes (Rissa tridactyla) and some are bottom feeders like the eiders (Somateria mollissima) (preferring hard bottom substrates) and king eiders (Somateria spectabilis) (preferring soft bottom substrates). The largest seabird populations are present in the study area during summer months, as the winter ice forces the bird populations southwards to open waters. However, the recurrent open waters that can occur in the Disko Bay area during winter are of extreme importance to seabirds, and maintain some winter populations within the area. One such area is located in the fjord mouths near Kangaatsiaq, where tidal activity results in areas of ice-free water throughout even the most severe winters. Large moulting and wintering populations of king eider exist within the study area, and on the Store Hellefiskebanke (in the southernmost offshore regions of the study area). The Store Hellefiskebanke is an internationally important wintering site for this species. Other winter visitors to the study area include the Ivory Gull (Pagophila eburnean), an internationally vulnerable species that is observed in the offshore parts of the study area between November and May. The many coastal islands and steep rocky cliff faces offer good potential as sites for breeding, and in many such places large breeding colonies are situated. A large number of such sites exist on Disko Island and some of the other islands in Disko Bay as well as mainland colonies, such as the colony of Brünnich’s guillemot that is found in internationally important numbers at Ritenbenk (coastal island inshore from Disko Island). It is estimated that there are approximately 700,000 breeding pairs in Baffin Bay and the northern Davis Strait (Boertmann et al., 2007). Large colonies of little auk (Alle alle) also exist within the study area, and it is estimated that approximately 33 million breeding pairs may be present on the north-western and western Greenland coasts during the summer months (Boertmann et al., 2007). Table 4.2 gives an indication of seabird occurrence and activity in the coastal zone and offshore areas near Disko Island and Bay. The International Union for the Conservation of Nature (IUCN) Red List Status refers to conservation importance within Greenland. This list is provisional, as it has yet to be published (Mosbech et al., 2007a). The importance of the study area to the species population has been defined by Anker-Nilssen (1987) and refers to the significance of the population occurring within the assessment area in a national and international context and therefore gives a conservation value to the study area with regards to individual species.

DISKO WEST BLOCKS 4 & 6 SEISMIC SURVEY PEIA ENVIRONMENTAL SETTING
4-30
Table 4.2: Seabird occurrence and activity in the coastal zone and offshore areas between latitude 68 and 72°N (Modified from Hansen et al., 2004 and Mosbech et al., 2007a)
Species Occurrence within study area Distribution IUCN Red-List Status
in Greenland
Importance of study area to
population Great shearwater (Puffinus gravis)
Summering Offshore July–October Least concern (LC)
Low
Cormorant (Phalacrocorax carbo)
Breeding/ summering/ wintering
Coastal May–November within study area; throughout the entire year in open waters south of Disko Bay
Least concern (LC)
High
Common eider (Somateria mollissima)
Breeding/ summering/ moulting/ wintering
Coastal Year-round (confined to southernmost parts of study area over winter)
Vulnerable (VU)
High
King eider (Somateria spectabilis)
Moulting Wintering
Coastal Coastal & Offshore in southernmost areas
August-September October–May
Not evaluated
High
Long-tailed duck (Clangula hyemalis)
Breeding/ moulting/ wintering
Coastal Year-round (confined to southernmost areas in winter
Least concern (LC)
Medium
Red-breasted merganser (Mergus serrator)
Breeding/ moulting
Coastal May–December Least concern (LC)
Medium
Harlequin duck (Histrionicus histrionicus)
Moulting Coastal (on more exposed rocky shores)
August–September Near threatened (NT)
Medium
Brent goose (Branta bernicla)
Passage Coastal Spring and autumn Least concern (LC)
Medium
White-fronted goose (Anser albifrons flavirostris)
Breeding Coastal May–September Endangered (EN)
High
Red-necked phalarope (Phalaropus lobatus)
Breeding/ passage
Offshore Spring and autumn Least concern (LC)
Low
Grey phalarope (Phalaropus fulicarius)
Breeding/ passage
Offshore Spring and autumn Least concern (LC)
Low
Northern Fulmar (Fulmarus glacialis)
Breeding/ summering
Coastal and offshore
April–December Least concern (LC)
High
Kittiwake (Rissa tridactyla)
Breeding/ summering
Coastal & offshore (foraging)
November Endangered (EN)
High
Glaucous gull (Larus hyperboreus)
Breeding/ summering/ wintering
Coastal and offshore
Year-round Least concern (LC)
Medium

DISKO WEST BLOCKS 4 & 6 SEISMIC SURVEY PEIA ENVIRONMENTAL SETTING
4-31
Table 4.2 continued: Species Occurrence within study area Distribution IUCN Red-
List Status in Greenland
Importance of study area to
population Iceland gull (Larus glaucoides)
Breeding/ summering/ wintering
Coastal and Offshore
Year-round Least concern (LC)
Medium
Great black-backed gull (Larus marinus)
Breeding/ summering/ wintering
Coastal and offshore
Year-round Least concern (LC)
Medium
Arctic skua (Stercorarius parasiticus)
Breeding /summering
Coastal Summer months Least concern (LC)
Low
Ross’ gull (Rhodostethia rosea)
Breeding Coastal (very localised)
Summer months Vulnerable (VU)
Low
Ivory gull (Pagophila eburnean)
Wintering Offshore November–May Vulnerable (VU)
Medium
Sabines gull (Larus sabini)
Passage Offshore August and May–June
Near threatened (NT)
Low
Arctic tern (Sterna paradisaea)
Breeding Coastal May–September Near threatened (NT)
High
Brünnich’s guillemot (Uria lomvia)
Breeding/ summering/ wintering
Coastal and offshore
Year-round (confined to southernmost areas in winter
Vulnerable (VU)
High
Razorbill (Alca torda)
Breeding Coastal and offshore
May–September Least concern (LC)
High
Puffin (Fratercula arctica)
Breeding Coastal and offshore
May–October Near threatened (NT)
High
Black guillemot (Cepphus grille)
Breeding/ wintering
Coastal Coastal and offshore
Summer Winter
Least concern (LC)
High
Little auk (Alle alle)
Breeding Wintering
Coastal and offshore Offshore
May–August September–November
Least concern (LC)
High
White-tailed eagle (Haliaeetus albicilla)
Breeding/ wintering
Coastal (rare in southernmost areas)
Year-round Vulnerable (VU)
Low
Fourteen species of colony-breeding seabirds are present within the study area at different times. The principal seabird colonies within the study area are shown in Figure 4.16. As previously mentioned, one of the more important colonies is for Brünnich’s guillemot, which has a coastal colony within Disko Bay at Ritenbenk. Other important seabird colonies include kittiwake in north-western Disko Bay, fulmar (Fulmarus glacialis) on the west coast of Disko Island and in Uummannaq Fjord, a number of large colonies of Arctic terns (Sterna paradisaea) in Disko Bay and a number of puffin (Fratercula arctica) colonies in outer Disko Bay. There are many small colonies of black guillemot (Cepphus grille), great cormorant, razorbill (Alca torda) and common eiders in the area.

DISKO WEST BLOCKS 4 & 6 SEISMIC SURVEY PEIA ENVIRONMENTAL SETTING
4-32
During summer, a number of species of sea duck migrate into the area to moult following breeding. During this period, many ducks will mass together in coastal waters, particularly in the sheltered bays and archipelagos of the Disko area. During this period, the birds are particularly sensitive to disturbance, as they will be flightless while they moult and regenerate their new flight feathers. In addition to king eider, a number of other species may moult within the study area, including: eider, long-tailed duck (Clangula hyemalis), red-breasted merganser (Mergus serrator) and harlequin duck (Histrionicus histrionicus). Figure 4.16 also maps the principal sensitive areas of the Disko West study area with regards to sea duck moulting. There are certain sensitivities throughout the study area at almost all times throughout the year with respect to seabird populations. At different times, these sensitivities can be more or less localised in geographical extent, applied to more or less significant bird population numbers, or to bird populations of more or less significant conservation status. These include autumn and spring, when migration takes place for many species, late spring and throughout summer when breeding and moulting takes place, and over winter when many species winter in certain parts of the study area.
4.3.4 Mammals The study area is important to a number of species of marine mammals. There are 19 species of marine mammal that are known to be present within the study area at different times and for differing periods of time throughout a typical year. Of the 19 species encountered, 12 are cetaceans, 6 are pinnipeds and 1 is the semi-aquatic carnivore, namely the polar bear. Table 4.3 gives an overview of the marine mammals that can be found within the study area. It also summarizes the timings and duration of occurrences, an estimate of local stock size and/or abundance and their conservation status and significance of the study area to the different populations. The red list status for most species listed is based on the IUCN 1996 designations, which the IUCN themselves acknowledge needs to be updated. The polar bears conservation status is based on reclassification in 2001; all others were designated prior to 1996. The importance of the study area to the various populations has been defined by Anker-Nilssen (1987) and refers to the significance of the population occurring within the assessment area in a national and international context and therefore gives a conservation value to the study area with regards to individual species.

DISKO WEST BLOCKS 4 & 6 SEISMIC SURVEY PEIA ENVIRONMENTAL SETTING
4-33
Figure 4.16: Principal seabird colonies and sea duck moulting areas within Disko Bay and the Disko West Study Area

DISKO WEST BLOCKS 4 & 6 SEISMIC SURVEY PEIA ENVIRONMENTAL SETTING
4-34
Table 4.3: An overview of the marine mammals found within the study area between latitude 68 and 72°N (Modified from Hansen et al., 2004 and Mosbech et al., 2007a) Species Occurrence
Period Main
Habitat Estimated stock size / abundance
Protection /Exploitation
IUCN (1996) Red List Status
Importance of
population in study
area Bowhead whale (Balaena mysticetus)
February–June
Pack ice/ marginal ice zone
c. 250 Protected (since 1932)
Vulnerable* High
Minke whale (Balaenoptera acutorostrata)
April–November
Coastal waters and banks
4000, relatively common
Hunting regulated
Lower risk Medium
Humpback whale (Megaptera novaeangliae)
June–November
Edge of banks and coastal waters
1000, more common in south of study area
Protected (1986)
Vulnerable Medium
Fin whale (Balaenoptera physalus)
June–October
Edge of banks and coastal waters
2000, relatively common
Hunting regulated
Endangered Medium
Blue whale (Balaenoptera musculus)
July–October
Edge of banks
Few sightings
Protected (1966)
Vulnerable* Low
Bottlenose whale (Hyperoodon ampullatus)
(June–August)
Deep water Infrequent sightings
Hunting unregulated
Lower risk, conservation dependent
Low
Harbour porpoise (Phocoena phocoena)
April–November
Throughout whole study area
Common Hunting unregulated
Vulnerable Medium
Long-finned Pilot whale (Globicephala melas)
June–October
Unknown Occasional sightings
Hunting unregulated
Lower risk, of least concern
Low
Killer whale (Orcinus orca)
June–August
Throughout whole study area
Rare but regular sightings
Hunting unregulated
Lower risk, conservation dependent
Low
White whale/Beluga (Delphinapterus leucas)
November–May
Banks c. 8000 Hunting regulated
Vulnerable High
Narwhal (Monodon monoceros)
November–May
Edge of banks and deep waters
c. 3000 Hunting regulated
Data deficient High
Sperm whale (Physeter macrocephalus)
May–November
Deep waters
Rare but regular sightings
Protected (1985)
Vulnerable Low
Harp seal (Phoca groenlandica)
June–October
Throughout whole study area
c. 5.4 million Hunting unregulated
Lower risk, of least concern
Medium
Hooded seal (Cystophora christata)
March–October
Throughout whole study area
Unknown, but numerous
Hunting unregulated
Lower risk, of least concern
Medium
Ringed seal (Pusa hispida)
Throughout entire year
Whole study area, on ice
Common Hunting unregulated
Lower risk, of least concern
Medium
Harbour/Common seal (Phoca vitulina)
Throughout entire year
Coastal waters
Very rare Hunting regulated
Lower risk**, of least concern
High
Bearded seal (Erignathus barbatus)
Mainly winter
Drift ice on the banks
Common Hunting unregulated
Lower risk, of least concern
Medium
Walrus (Odobenus rosmarus)
Winter Drift ice on the banks
c. 3000 Hunting regulated
Lower risk, of least concern
High
Polar bear (Ursus maritimus)
Mainly winter
Drift ice and ice edges
c. 4000 Hunting regulated
Vulnerable (2001)
Medium
* Applies to the Northwest Atlantic stock; ** local population is vulnerable

DISKO WEST BLOCKS 4 & 6 SEISMIC SURVEY PEIA ENVIRONMENTAL SETTING
4-35
Pinnipeds Ringed seal (Pusa hispida), hooded seal (Cystophora christata) and harp seal (Phoca groenlandica) are the most common species of pinnipeds in the vicinity of the study area. Harp and hooded seals migrate into the area mainly in the summer and whelp their young elsewhere. Both of these species predominantly eat fish and other pelagic prey species and hooded seals are known to dive to considerable depths to feed on prey close to the seabed (up to approximately 1000m) (Kapel, 1995, 1996; Kapel & Rosing-Asvid, 1996; Folkov & Blix, 1999). Ringed seals are observed throughout the study area at all times of the year, occurring mainly in ice-covered waters; they are also observed to whelp their young on the fast ice of the fjords. Their diet consists mainly of fish and crustaceans (Siegstad et al., 1998). Bearded seals (Erignathus barbatus) are commonly observed in the study area and are considered a winter/spring seasonal visitor, occurring on and around the drift ice, where they whelp and mate in the early spring. Harbour seals (Phoca vitulina), by comparison with other pinnipeds observed in the study area, have become an increasingly rare occurrence. They are considered very rare or absent within the study area. The nearest known site with regular occurrence is Kangerlussuaq Fjord, which is just south of the assessment area (Teilmann & Dietz, 1994). Harbour seals also feed on a broad range of pelagic prey species, and are the only seal species that are observed to haul out on land within the study area. They can be observed hauled out on the more remote islands, sandbanks and skerries in the outer areas of Kangerlussuaq Fjord. Walruses (Odobenus rosmarus) can be observed in the study area between February and May on the drift ice, in offshore areas, where the water depths are typically less than 100m. This allows them to be able to dive to reach their preferred food source, bivalve molluscs. The walrus population is in decline due to unsustainable hunting, although hunting is now regulated, the returning 2006 population of walruses in the study area was estimated at around 3000 individuals. Walruses in the study area are known to winter on the banks to the north and west of Disko Island and near the Store Hellefiskebanke, and return to summering grounds to the north and east in Baffin Bay. The two separate walrus winter populations within the study area have been observed and it would appear that the wintering home range of this species is extremely confined. This small home range is a factor of the restricted suitable habitat, which is not found elsewhere within the study area or along the West Greenland coast. This tends to highlight the importance of the study area to this species for feeding and breeding (Mosbech et al., 2007a). Cetaceans The species that are believed to be the most heavily reliant on the study area for its resources are the baleen whale (the bowhead whale) and the toothed whales (narwhal and white whale or beluga). These species tend to migrate southwards and spend an extended period of time, mainly concentrated in the offshore waters during autumn, winter and into the spring. Other cetacean species include the harbour porpoise (Phocoena phocoena), humpback whale (Megaptera novaeangliae), minke whale (Balaenoptera acutorostrata) and fin whale (Balaenoptera physalus), which arrive in the study area in the spring and early summer, migrating from their wintering grounds further south. These species are considered abundant visitors during the summer and autumn. With the exception of the harbour porpoise, these species are baleen whales and are

DISKO WEST BLOCKS 4 & 6 SEISMIC SURVEY PEIA ENVIRONMENTAL SETTING
4-36
believed to be less disturbed by seismic survey operations than toothed whales and dolphins. Baleen whales within the study area are observed mainly around the edges of the offshore banks and coastal waters, while the less frequently observed toothed whales, namely bottlenose whales (Hyperoodon ampullatus) and sperm whales (Physeter macrocephalus) are observed further offshore. Less frequently observed, but regular summer and autumn visitors to the study area include killer whales (Orcinus orca), long-finned pilot whales (Globicephala melas), sperm whales, bottlenose whales and blue whales (Balaenoptera musculus). The study area is not considered to be of significant importance to the infrequent summer visiting toothed whales. This is because of the size and geographical distribution of their overall populations and as they are only observed rarely and in particularly small numbers, when compared with other cetacean species. The bowhead whale (Balaena mysticetus) visits the study area during winter and spring, migrating into the area from the high Arctic Canadian Archipelago and elsewhere in Baffin Bay. Bowhead whales usually arrive during January and February and leave towards the end of May and early June. They stay mainly in the vicinity of the marginal fast ice, as well as entering Disko Bay and spending some time in the waters south of Disko Island. The overall stock size of bowhead whales is extremely small due to extensive hunting, and despite being protected since the 1930s, the population is taking a long time to show significant recovery. The total Baffin Bay/Davis Strait population is likely to number only a few thousand individuals. Bowhead whales feed on copepods, and exploit the dense concentrations of Calanus spp. copepods close to the seabed within the study area. As such, they are dependent on the seasonal productivity of the area, in particular the high primary and secondary productivity in the study area. Satellite tracking studies of bowhead whales within the study area between 2001 and 2006 (Heide-Jørgensen and Laidre, 2006) show that the waters of the study area and to the south of Disko Island in particular are believed to be important foraging grounds for resting or pregnant females for the Canada-Greenland population in its entirety (Mosbech et al., 2007a). Narwhals (Monodon monoceros) are strictly winter visitors to the study area, typically arriving during November and remaining in the area until May. Narwhals migrate from more northerly areas of Baffin Bay, from both Greenland and Canadian high Arctic coastal areas. Tracking of narwhals wintering in the study area has shown that they migrate from summering grounds in Melville Bay (North West Greenland) and Eclipse Sound (north-east Canada) (Dietz and Heide-Jørgensen, 1995). It is suggested that there is a mix of narwhals from a number of different populations throughout the Baffin Bay region that winter within the study area (Riget et al., 2002). Within the study area narwhals are observed to winter in the pack ice where there is deeper water (in excess of 600m seems to be preferred) and sharp changes in seabed bathymetry. Particular areas where narwhals aggregate are offshore from the southern entrance to Disko Bay. They are also observed north of Disko Island in the outer regions of Uummannaq Fjord. Large numbers of narwhals have been observed in the study area during November, and following this are observed in the Disko West and Disko Bay areas. Narwhals feed at some of the areas productive fishing banks; their winter diet comprises fish (in particular Greenland halibut) and squid (Laidre and Heide-Jørgensen, 2005).

DISKO WEST BLOCKS 4 & 6 SEISMIC SURVEY PEIA ENVIRONMENTAL SETTING
4-37
Narwhals populations are thought to be in decline, although accurate information is lacking regarding the species overall conservation status (Mosbech et al., 2007a). The biologically sustainable harvest recommendation within the study area is thought to be around 135 animals/year, however current estimates are that approximately 300 animals are caught each winter. The white whale or beluga (Delphinapterus leucas) is abundant on the offshore banks within the study area, where they winter between November and May. Belugas tend to congregate in shallower waters closer to the coast than narwhals, primarily between the drift ice and the coast. The wintering areas for beluga within the study area are highlighted in Figure 4.17, which also shows the migration routes following the western coasts of Greenland for belugas from their summering grounds in the Canadian high Arctic. The study area is considered extremely important for wintering beluga populations as the suitable habitat that is afforded and productive fisheries mean that they acquire the major part of their annual food intake in the area. The beluga population is noted to be in serious decline due to excessive hunting, despite hunting being regulated (Heide-Jørgensen and Reeves, 1996). The harbour porpoise (Phocoena phocoena) is one of the smallest marine mammals in the world and, as its name implies, prefers the habitat of coastal and near-shore waters. Harbour porpoises are summer visitors to the study area, arriving during April and staying until November; their migration follows the advancing and retreating sea-ice. They are a common sight in the study area, and have been observed in significant numbers throughout all parts of the study area. They feed on smaller fish, and particularly favour capelin in the study area. Despite the fact that harbour porpoise is well distributed throughout the cold waters of the northern hemisphere, its population is showing signs of drastic decline, particularly in West Greenland waters. Although not hunted commercially like larger whale species, harbour porpoise has traditionally been hunted for food and, particularly, its fat, which is used as lighting oil. Hunting in West Greenland is currently not regulated. Polar Bear The polar bear (Ursus maritimus) is observed in the study area primarily during the winter months when sea-ice is present. Within the study area, the bears that are present can be from two distinct populations: the Davis Strait population and the Baffin Bay population. Both these populations are present along both Canadian and West Greenland coasts, although satellite tracking studies suggest higher population numbers on the western Davis Strait and Baffin Bay (Ferguson et al., 1998) and tend to follow the movements of the West Ice, which means they can be observed in the study area from autumn, through to Spring (Taylor et al., 2001). As the ice starts to break up in the spring melting season, polar bears tend to leave the study area and follow the retreating ice northwards and towards the western areas of the Davis Strait and Baffin Bay where the ice is more secure and longer lived. Accurate population estimates for bears in the Disko West area are now considered to be very difficult to make, due to the relatively changing ice conditions in the Disko area in most recent years. As a result, further studies are planned to take into account up-to-date environmental conditions. Polar bears are hunted and, despite regulation of this hunting in both Greenland and Canada their global population is considered to be of vulnerable status on the updated (2001) IUCN red list.
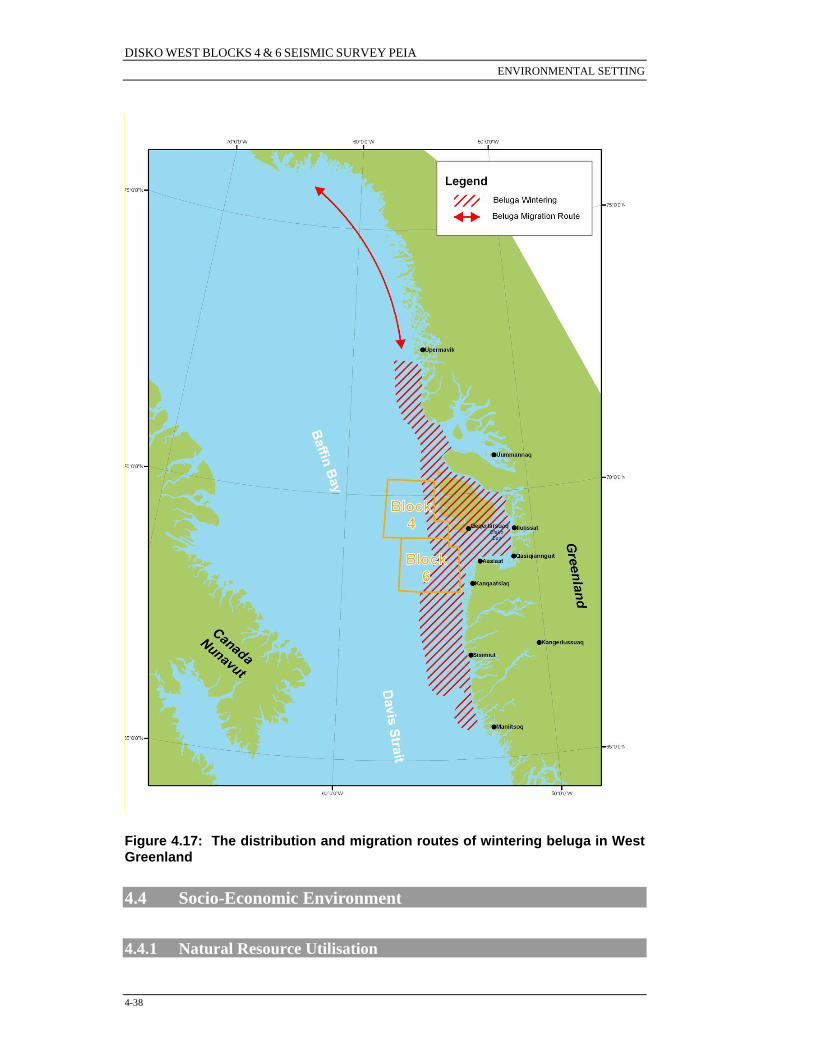
DISKO WEST BLOCKS 4 & 6 SEISMIC SURVEY PEIA ENVIRONMENTAL SETTING
4-38
Figure 4.17: The distribution and migration routes of wintering beluga in West Greenland
4.4 Socio-Economic Environment
4.4.1 Natural Resource Utilisation

DISKO WEST BLOCKS 4 & 6 SEISMIC SURVEY PEIA ENVIRONMENTAL SETTING
4-39
Commercial Fishing Commercial fisheries are most important export industry in Greenland; this is underlined by the fact that fishery products accounted for 87% of the total Greenlandic export revenue (2.4 billion DKK) in 2004 (Statistics Greenland, 2007). Total fisheries are shown in Table 4.4. (Greenland in Figures, 2007).
Table 4.4: Total fisheries in Greenland waters Near Shore 1996 1998 2000 2002 2004*
1,000 tonnes Prawn 77,0 73,6 86,5 112,6 144,4 Cod 7,7 5,9 4,1 3,9 4,9 Halibut 29,0 30,0 33,4 34,6 40,6 Crab 0,7 1,9 10,6 10,3 6,4 Capelin 235,2 228,1 117,1 92,1 42,0 Other catches 30,6 33,5 19,7 32,0 23,9
TOTAL 380,2 373,0 271,3 285,5 262,2 * Provisional Figures Very few species are exploited by the commercial fisheries in the study area, and in Greenland as a whole. Based on commercial value, the most significant species in the study area are deep-sea shrimp, Greenland halibut and snow crab. Deep-water shrimp is fished on the bank slopes and in Disko Bay. In recent years up to 40% of the total Greenland shrimp catches were taken from within the study area. Figure 4.18 is a map showing the fishing grounds within the study area for the deep-water shrimp. The major part of the catch is taken by large modern trawlers, which process the catches onboard. In Disko Bay and other inshore waters, smaller vessels are used and the catches are usually delivered to factories in the towns. The fishery takes place whenever the sea-ice does not close the waters (Mosbech et al., 2007a). Snow crab is caught both in inshore waters and on the banks in the study area. The fishery was first initiated in 1992 and has increased rapidly. However, catches in more recent years have decreased in spite of increasing fishing effort. The catches from within the 68-72°N study area comprised 32-38% of the total Greenland catch (5,500–1,600 tonnes) in 2002-2005, which again highlights the importance of the area (Mosbech et al., 2007a). The fishery for Greenland halibut has two principal components within the study area: an inshore fishery from Disko Bay and northern regions of the study area where fishing takes place in deep water fjords. Here, the fish are caught on long-lines either from small vessels or from the winter ice. This activity takes place throughout the year, and in 2001 comprised around 11,000 tonnes in total. Jakobshavn Icefjord is by far the most important site for this fishery. The second component of the fishery is in offshore waters where fish are caught by large trawlers. This fishery occurs during the summer and autumn on the shelf slope. Since 2000, the annual catch from this fishery has ranged between 200 and 1,500 tonnes from within the study area, although during the period between 2003 and 2005 only about 350 tonnes was caught. In 2001, tonnage from within the study area

DISKO WEST BLOCKS 4 & 6 SEISMIC SURVEY PEIA ENVIRONMENTAL SETTING
4-40
represented approximately 82% of the total Greenland halibut catch (Mosbech et al., 2007a). Figure 4.19 shows the fisheries for Greenland halibut and snow crab.
Figure 4.18: Deepwater shrimp fishery map for the Disko West study area

DISKO WEST BLOCKS 4 & 6 SEISMIC SURVEY PEIA ENVIRONMENTAL SETTING
4-41
Figure 4.19: Fisheries for Greenland halibut and snow crab Smaller-scale commercial fisheries exist for Iceland scallop and lumpsucker, where roe is the commercial product. Both fisheries within the study area make up an important proportion of the total Greenland catch (approximately 60% for Iceland scallops, which are caught in inshore waters where currents are strongest). Lumpsucker is a spring and early summer fishery, occurring when the fish move inshore into coastal waters to spawn. Fish are caught from small vessels using gill nets. Subsistence, Recreational Fishing and Hunting Subsistence and recreational fishing and hunting are traditionally important to the people of the study area, and Greenland as a whole, as a means of supplementing family income. However, in recent years this kind of hunting and fishing has gradually started to become increasingly recreational in nature (Mosbech et al.,

DISKO WEST BLOCKS 4 & 6 SEISMIC SURVEY PEIA ENVIRONMENTAL SETTING
4-42
2007a). In smaller villages, many people are still very much dependent on subsistence hunting and fishing, and the subsistence industries as a whole can have significant inputs to the overall economy and impacts on resource numbers. Capelin, lumpsucker and Arctic char are caught in the inshore waters of the study area on a local scale during spring and summer months. In addition, blue mussels are harvested. Figure 4.20 and Figure 4.21 give indications of the extent of fishing areas for capelin and lumpsucker respectively in the coastal waters of the study area.
Figure 4.20: Extent of coastal fishing grounds for capelin, within the project
study area
Marine mammal species hunted within the study area include all the species of seals, walrus, white whale (beluga), narwhal, minke whale and fin whale, and potentially killer whale and harbour porpoise to a much lesser degree. In 1993, the following numbers of seals were reported to the official bag record for the Disko Bay region (Greenland Home Rule, 1995): ringed seal 15,000, harp seal 15,000, hooded seal 600, bearded seal 300 and walrus 200 (Mosbech et al., 2007a). Of narwhals and white whale (beluga), approximately 100 and 300 were taken respectively in 1993 (Greenland Home Rule, 1995). The harvest of narwhals and beluga from 2005 has been limited by quotas of 385 and 160 respectively for the entirety of West Greenland in the season 2006/07, where each municipality is allocated a specific percentage. The harvest of minke whales and fin whales are also limited by quotas of 175 and 10 animals respectively for the entire West Greenland coast (Mosbech et al., 2007a).

DISKO WEST BLOCKS 4 & 6 SEISMIC SURVEY PEIA ENVIRONMENTAL SETTING
4-43
Figure 4.21: Extent of coastal fishing grounds for lumpsucker within the project study area Seals are caught throughout the year, although ringed seals are primarily only taken when sea-ice is present. Harp seal and hooded seal are taken during periods when there is open water. Narwhals, white whales and walrus are caught in late autumn and winter, and the two large species of whales (minke and fin) are caught in summer and autumn. Certain species of seabird are hunted mainly in autumn and winter, and the two most intensively hunted species are the Brünnich’s guillemot and common eider. These species historically have been taken in large numbers; however, in recent years hunting has been more stringently regulated to take into consideration their declining populations. Tourism The Greenland tourist industry has developed rapidly in recent years; promoted on account of its unique and unspoiled natural resources. The town of Ilulissat (see Disko Bay, Figure 4.1) is considered the most important tourist site in Greenland. Ilulissat boasts at least three modern hotels and is popular with tour operators. The primary attraction of Ilulissat is the Ilulissat Glacier and Jakobshavn Icefjord, which is a World Heritage Site (Mosbech et al., 2007a). Other important tourist areas within the study area include the towns of Aasiaat, Qeqertarsuaq and Uummannaq, where tourist activities take place on a much smaller scale than compared with Ilulissat. The total number of tourists that visited

DISKO WEST BLOCKS 4 & 6 SEISMIC SURVEY PEIA ENVIRONMENTAL SETTING
4-44
Greenland in 2005 was approximately 33,000 (Statistics Greenland, 2006). In addition to which are increasingly numerous cruise ships that visit Greenland during the summer months, bringing an additional 16,500 tourists per year (in 2005) (Statistics Greenland, 2006).
4.4.2 Protected Areas Figure 4.22 shows the protected areas within and immediately vicinity of the study area.
Figure 4.22: Map showing the environmental protected areas within and immediately vicinity of the study area Within the study area are six candidate Ramsar (Wetlands of International Importance) sites. These are yet to be finally designated and are included in a list of 11 potential sites across Greenland as a whole. These protected bird areas will be incorporated into national Greenland legislation in due course (Mosbech et al., 2007a). Additional internationally protected areas include the Jakobshavn Icefjord,

DISKO WEST BLOCKS 4 & 6 SEISMIC SURVEY PEIA ENVIRONMENTAL SETTING
4-45
which is designated a UNESCO (United Nations Educational, Scientific and Cultural Organisation) World Heritage Site. Under national legislation, there are several nature reserves, bird protection areas and protected seabird colonies within the assessment area. All access to bird protected areas is prohibited during the breeding season (Mosbech et al., 2007a). A number of protected wildlife areas have been established within the study area under the Mineral Extraction Law, in which mineral extraction is regulated. Protected areas within the study area that are administered by NGOs, and hence not under national or international legislation, include several Important Bird Areas (IBAs) designated by Birdlife International. Some of the IBAs are included in or protected by the national regulations, but many are without protection or activity regulations. One of the IBAs encompasses the offshore Store Hellefiskebanke.
4.5 Summary of Key Sensitivities and Focal Issues The following provides a brief summary of the key sensitivities in the study area of the Disko West region, that approximately correspond to licence Blocks 4 and 6. In light of the fact that the activity under consideration is for a 2-D seismic acquisition survey, only the pertinent sensitivities are summarised. Survey operations are scheduled to take place during the open water months (mid July to late October/November); however, due to the nature of the environment, there is a degree of seasonal overlap with regards key sensitivities. As such, key sensitivities for both spring and autumn are also described. The following sensitivities have been summarised from Mosbech et al., (2007), which describes a number of offshore areas within the study area west of Disko Island, between 72 and 68°N. Only those offshore areas that correspond approximately to licence Blocks 4 and 6 are described. Spring
Offshore (Far) A fishery exists (in ice free periods) for deep-sea shrimp in southern regions. Wintering and spring migrating narwhal and spring migrating bowhead whale may be encountered. Offshore (Moderate) A fishery exists (in ice free periods) for deep-sea shrimp as well as hunting for Walrus (on ice) in southernmost waters of the study area. Wintering and spring migrating white whales (beluga) and narwhal may be present as well as wintering and spring migrating bowhead whale, wintering walrus and spring migrating Brünnich's guillemot and fulmar. Coastal

DISKO WEST BLOCKS 4 & 6 SEISMIC SURVEY PEIA ENVIRONMENTAL SETTING
4-46
A fishery exists (in ice free periods) for deep-sea shrimp (mainly in Vaigat mouth and in southernmost coastal waters, where the fishery is particularly important). Hunting for white whales (beluga), narwhals, seals and walrus also take place. Wintering walrus are encountered, in particular in southernmost waters and off Svartenhuk and Nuussuaq. In addition, there are spring migrating white whales (beluga) and bowhead whales, and wintering and spring migrating narwhals. Wintering bearded seal are present in southernmost parts of the study area. Spring migrating Brünnich's guillemot and breeding and spring migrating fulmar and wintering and spring migrating king eider.
Summer
Offshore (Far) A fishery exists for deep-sea shrimp in southern regions and Greenland halibut in central waters (west of Disko Island). Summering minke, fin and humpback whales may be encountered. Breeding and non-breeding populations of fulmars and summering little auk are present. Offshore (Moderate) Fisheries exist for deep-sea shrimp and snow crab in southern waters. Summering minke, fin and humpback whales may be encountered, as well as breeding and non-breeding fulmars. Coastal Fisheries exist for deep-sea shrimp (particularly important in southern waters), snow crab (mainly in Vaigat mouth and a particularly important fishery in southern waters, and scallop (in the waters close to the Disko Island coast). Hunting takes place for minke whale, fin whale and seals. Summering minke, fin and humpback whales may be encountered as well as breeding and non-breeding fulmar populations.
Autumn
Offshore (Far) A fishery exists for deep-sea shrimp in southern waters and for Greenland halibut in central regions (west of Disko Island). Autumn (from November) migrating and wintering narwhal and autumn migrating Brünnich’s guillemot, little auk and fulmar are present. Offshore (Moderate)

DISKO WEST BLOCKS 4 & 6 SEISMIC SURVEY PEIA ENVIRONMENTAL SETTING
4-47
A fishery exists for deep-sea shrimp in southernmost waters, also present are autumn (from November) migrating white whales (beluga) and narwhal; summering minke, fin and humpback whales until October in southern waters may also be present. Autumn migrating Brünnich's guillemot, little auk and fulmar are present. Coastal Fisheries exist for snow crab and deep-sea shrimp (mainly in Vaigat mouth and particularly important in southernmost waters). Fisheries also exist for scallop (particularly close to the Disko Island coast). Hunting is carried out for narwhal and white whales (beluga), while in southern areas minke and fin whale are also taken. Seals and seabirds are also hunted in coastal areas. Autumn (from November) migrating white whales (beluga); autumn (from October) migrating and wintering narwhal. Additionally, summering minke, fin and humpback whales may be present in southern waters until October. Wintering bearded seal may be present in central and southern regions from November. Autumn migrating Brünnich's guillemot, little auk and fulmar and wintering (from October) king eider populations are present in the southern regions.


DISKO WEST BLOCKS 4 & 6 SEISMIC SURVEY PEIA PROJECT DESCRIPTION
5-1
5. PROJECT DESCRIPTION
5.1 General Description of Seismic Surveys
5.1.1 Introduction Seismic exploration is routinely used worldwide both onshore and offshore to identify and assess subsurface geological structures, and the potential presence and extent of any associated oil and gas deposits. Data acquired during initial seismic exploration typically assists in defining more prospective areas. This then can identify prospective geological structures and identify the best location/s for exploration drilling. Further information is typically gained through 3-D seismic surveys, on any prospective structures’ geology, which can assist with reducing risks from subsequent exploration drilling assessment. All of this is aimed at reducing any oil and gas exploration operational risks, which can pose subsequent risks to the environment, if not managed appropriately. In the offshore environment, seismic surveys are conducted by discharging directionally focused energy pulses in the form of low frequency sound into the water column. These pulses travel through, and are reflected back from, the boundaries of geological strata below the seafloor and are subsequently recorded by receivers (hydrophones) deployed in cables towed behind the seismic survey vessel (see Figure 5.1). Depths and spatial extent of these strata are then calculated and mapped, based upon difference between the time of the sound being generated and subsequently recorded by the receiver.
Figure 5.1: Schematic of offshore seismic survey
5.2 Seismic Sound Source
Seabed
Target Structure

DISKO WEST BLOCKS 4 & 6 SEISMIC SURVEY PEIA PROJECT DESCRIPTION
5-2
Offshore seismic surveys are acquired using arrays of various sized airguns. In the early years of offshore oil and gas exploration (ca. 1960s), explosives were used for these surveys. The typical modern day operational configuration of a seismic survey vessel and equipments is shown in Figure 5.1. The airgun (see Figure 5.2) is now the most common energy source used in offshore seismic surveys. It works as follows:
• An array of airguns is trailed behind the survey vessel, under the surface of the water (usually at a depth of anywhere between 5 and 30m, depending on the environmental characteristics of the marine environment, and also on the target geological structure which is being imaged);
• Air at high pressure (c. 2,000psi) is supplied continuously to the airguns from the survey vessel. This forces the piston downwards, and the chambers fill with high pressure air while the piston remains in the “closed” position;
• When triggered to do so (at prescribed time intervals, or distances intervals), the solenoid valve opens and the piston is forced upwards; and
• Compressed air in the lower chamber flows rapidly out. An air-filled cavity is produced in the water that expands and then collapses. This oscillation creates a seismic pressure wave as it does so releasing the energy (sound) into the water column.
• The objective of using an array of airguns is to focus the energy towards the seafloor through cancellation of the pulses as they move in other directions from the source.
Figure 5.2: Operation of an airgun Airguns are operated either singly or in arrays. Typically, single airguns are used only for shallow water surveys, while deeper water requires the use of arrays

DISKO WEST BLOCKS 4 & 6 SEISMIC SURVEY PEIA PROJECT DESCRIPTION
5-3
comprised of several sub-arrays of airguns. In the case of the proposed survey for Blocks 4 and 6, where the geological targets are below a hard dense layer of basalt, the large array configuration will be required.
5.2.1 Types of Seismic Survey There are two main types of offshore seismic surveys, both of which require a source vessel to sail along pre-determined lines or transects. The two types, illustrated in Figure 5.3, are:
• 2-D surveys, where a single hydrophone streamer is towed behind a vessel to record the returned sound generated by the source array. This produces a vertical “slice” or vertical 2-D image of the geology below the source. Typical 2-D surveys are designed to cover a wide area and provide a general picture of the subsurface geology. These surveys can cover wide areas or can be slightly more focused, as is the case with the proposed Block 4 and 6 surveys. These surveys are typically less intensive than the other type, namely 3-D surveys. Lines on 2-D surveys are anywhere from 500m to several kilometres apart.
• 3-D surveys, where more detailed delineation of the boundaries and extent of
subsurface geological structures typically are conducted, are used to identify specific drilling objectives. These surveys typically follow 2-D regional assessments, if the results from the 2-D surveys identify prospective areas. Lines are generally only 25-30m apart. In essence, a 3-D survey is the equivalent of collecting numerous, closely spaced 2-D “slices” so that a more detailed visualisation of the geology can be computed. 3-D surveys are generally more intensive than 2-D surveys, and can take significantly longer than some 2-D surveys to complete.
Where 3-D surveys are repeated over time, for example, to monitor the size of a petroleum reservoir and its drawdown or recovery, they are referred to as 4-D surveys. This technology has evolved with the development of more powerful computers to allow production operations to better plan and execute the recovery of the hydrocarbon reservoir.

DISKO WEST BLOCKS 4 & 6 SEISMIC SURVEY PEIA PROJECT DESCRIPTION
5-4
Figure 5.3: Schematic showing 2 types of seismic surveys A) 2-D survey using single streamer; and B) 3-D survey using multiple streamers.

DISKO WEST BLOCKS 4 & 6 SEISMIC SURVEY PEIA PROJECT DESCRIPTION
5-5
5.3 Outline of the Proposed 2-D Seismic Survey Programme
5.3.1 Overview The aim of the current proposed programme is to acquire high quality 2-D seismic data for Disko West licence Blocks 4 and 6, in order to identify potential targets (geological structures) for any future potential exploration or appraisal programme. Some 2-D data has already been acquired in the general licence Block area in the period between 2001 and 2007, although the quality of this data is not adequate to identify potential structures below the basalt which overlays potential targets in Blocks 4 and 6. The challenge for this 2-D seismic survey is to obtain good definition sub-basalt imaging (see Figure 5.4). This requires a large sound source to provide the energy that will penetrate the basalt layer, obtain a response from the target areas below and return it to the recording system, some tens of metres below the sea surface. Esso has investigated a number of different options for the airgun source array, and determined that the array volume needs to be larger than previous source arrays used for the previous regional 2-D surveys. Modelling assessment has considered source array volumes in the range of 5,080 to 8,000 cubic inches. This evaluation has shown the source volume in the order of 6580 cubic inches should provide sufficient source output to achieve adequate data quality in the return signals from below the basalt.
Figure 5.4: Existing 2-D image indicating some geological features. The sub-basalt data quality is inadequate to identify potential target structures Esso will be the operator for the proposed survey programme of Blocks 4 and 6 (hereafter called the programme). CGGVeritas has been selected as the seismic survey contractor for both Blocks, following a competitive tender round. It is anticipated that the entire field programme will last for up to four months (depending on weather and ice conditions) and will comprise the following main components:

DISKO WEST BLOCKS 4 & 6 SEISMIC SURVEY PEIA PROJECT DESCRIPTION
5-6
• Mobilisation of vessels (including seismic vessel, along with two (2) "chase boats" or support vessels) to the Disko West Blocks;
• Deployment of the towed equipment (airgun array and hydrophone streamer); • Data acquisition, comprising the bulk of the programme (NB: vessels may be
kept on standby during poor weather, etc.); and • Retrieval of equipment and demobilisation from the area.
However, due to the harsh and unpredictable nature of the environmental conditions in the survey area, operational details and schedules may change on a daily basis due to, for example, ice coverage, presence of icebergs, weather (sea-state) and other operational considerations. It will be necessary for the survey vessel to have operational flexibility around the planning of daily operations to minimise the occurrence of standby or downtime, which can significantly extend the planned duration of the surveys.
5.3.2 Survey Programme The proposed seismic survey programme schedule is presented in Section 2.4, although as noted above exact dates may vary, depending on operational and environmental conditions. All work is planned to be conducted during the ice-free “open water” season of (approximately) early July through to October/early November, although this can vary depending on the severity or not of the current winter season, and its effect on the retreat of sea-ice from the area. The vessels are due to arrive in the area in July, and the first seismic survey work will commence immediately after any portion of the survey area becomes ice-free. Currently, it is anticipated that given reasonable weather, operational considerations and ice conditions, all 2-D survey work for both Blocks 4 and 6 should be completed within the open water season of 2008. If for any reason this is not achieved for either Block 4 or 6, plans will be modified to respond to the conditions and coverage of the survey achieved at that time. If insufficient area of either Block is surveyed in 2008, it may be determined that a further field season may be required in a subsequent year within the first Licence period, to achieve the objectives of the programme and the requirements of the licence conditions for each Block. If this is the case, and a subsequent field season is required, the conclusions of this assessment, supported by any monitoring during the field programme, should remain applicable for such an occasion. If there is information gained during 2008, which may alter any determination within this PEIA, this information will be brought to the attention of the BMP and reviewed prior to any subsequent field programme. Local ice/iceberg conditions will play a key role in determining the order of work and although provisional schedules may be drawn up for the survey vessel, daily planning activities will be undertaken to achieve optimum Block coverage and efficient vessel utilisation. In addition to the survey program in Blocks 4 and 6, it should be noted that another unrelated 2-D seismic acquisition programmes in planned for Blocks 5 and 7. In order to minimise interference of sound sources from other survey vessels on the different Blocks, operators will need to co-operate to ensure all parties are able to achieve their objectives with the minimum of impact on each other's programme, as well as minimal impact to the environment. Operational co-operation between the Block operators will also assist with the sharing of resources for emergency and oil spill contingency planning and response.

DISKO WEST BLOCKS 4 & 6 SEISMIC SURVEY PEIA PROJECT DESCRIPTION
5-7
5.3.3 Survey Area The primary objective of the programme is to acquire a total of approximately 6,000 line kilometres of 2-D seismic data in the licence Blocks 4 and 6, particularly at the sub-basalt level. This comprises two approximately 3,000km surveys, being approximately 3,000km in each of Block 4 and Block 6. Summary details of the programme and data acquisition objectives are presented in Table 5.1. If time and conditions allow, then the Licence Holders may determine that acquisition of an additional 1,000km of 2-D seismic data may be acquired for Block 4 and or Block 6. This additional survey acquisition is addressed specifically in each of the Block 4 and 6 licences, as an optional condition, which would impact the licence term for either Block. The layout of the survey programme is presented in Figure 5.5. The seismic survey vessel will sail along pre-determined lines; the length and orientation of these lines will vary depending on the size and shape of the licence Blocks, and the needs for optimising the target objectives within each Block. Most survey lines will typically run northwest-southeast or northeast-southwest for Block 6, and east-west or northeast-southwest for Block 4. Run-outs will be required beyond the full-fold end-points coordinates. Run-outs and vessel turn during line change will typically take place outside the license Blocks. Given the adjacent nature of all the Blocks in the West Disko area, it is advantageous to all participants, that tie-ins between all licence Block surveys are made. This will allow interpretation of the data to be extended to the whole region, and not just the specific Blocks. For this, some specific survey lines and tie points are planned.
Table 5.1: Details of survey area Parameter Block 4 Block 6
Approx. water depth (m) 100–300 50–500 Approx. distance offshore (km) 5–150 5–150
Corner co-ordinates* N W N W 70° 15’00’’ 58° 00’00’’ 69° 10’00’’ 57° 00’00’’70° 15’00’’ 55° 15’00’’ 69° 10’00’’ 54° 30’00’’69° 30’00’’ 55° 15’00’’ 69° 00’00’’ 54° 30’00’’69° 30’00’’ 54° 30’00’’ 69° 00’00’’ 54° 00’00’’69° 10’00’’ 54° 30’00’’ 68° 10’00’’ 54° 00’00’’
123456 69° 10’00’’ 58° 00’00’’ 68° 10’00’’ 57° 00’00’’
Area of licence Block (km2) 13,957 13,213 Separation of lines (km) c. 5 c. 5
Total line km of data (km) c. 3,000 c. 3,000 Optional additional survey (km) 1,000 1,000
Based on the survey speed of the vessel, it is estimated that approximately 100km of 2-D survey line data can be acquired in a 24-hour period.

DISKO WEST BLOCKS 4 & 6 SEISMIC SURVEY PEIA PROJECT DESCRIPTION
5-8
Figure 5.5: Map of the proposed survey programme, showing survey line orientation for Block 4 and Block 6.
5.3.4 Vessels Four vessels will be involved in the programme, namely the main survey vessel (M/V CGG Princess), two chase/guard vessels (F/F Meredian and the M/S Kvitbjørn) and a seismic workboat/tender, which is launched from the M/V CCG Princess. Survey Vessel

DISKO WEST BLOCKS 4 & 6 SEISMIC SURVEY PEIA PROJECT DESCRIPTION
5-9
The M/V CGG Princess, a Norwegian-flagged, dedicated seismic survey vessel (Figure 5.6), will be used for the programme over Blocks 4 and 6. Details of the vessel are presented in Table 5.2.
Figure 5.6: MV CGG Princess
Table 5.2: M/V CGG Princess specifications Parameter Specification
Owner Exploration Resources ASA Vessel type Steel hulled ice-class (Ice 1A) 2D/3D seismic
survey Vessel length 76.2 m
Draught 7.1m Tonnage 2508 GRT Engines 2 x 1730 Bhp Bergen Diesel KRG-9; 1 x 2305
Bhp Bergen Diesel KVG-12 Maximum number of berths 47
Endurance 42 days Transit Cruising speed 13 knots
Fuel type/ storage capacity Marine gasoil with 20% kerosene / 691.65m3 Lubricating oil capacity 16.2m3
The M/V CGG Princess is an ice-class ICE-1A vessel, rated to operate safely in polar regions affected by significant icing conditions. In approximately June 2008, it is planned to transit from the Mediterranean (probably Malta) and possibly via Northern Ireland to Ilulissat (West Greenland), which will act as the temporary operations base for the survey vessel (Figure 2.1). The M/V CGG Princess will initially undergo re-supply/refuelling, before proceeding to the survey area. In the event of severe weather, the survey vessel may seek shelter and/or anchorage at Ilulissat or any other suitable harbour/port in its vicinity. The normal operating speed of the vessel while acquiring seismic data is 4 to 4.5 knots (current dependent); and it will normally operate on a 24-hour basis while surveying, although it may be necessary for the vessel to stand by if weather conditions are unsuitable. Refuelling will only take place in port, which is currently

DISKO WEST BLOCKS 4 & 6 SEISMIC SURVEY PEIA PROJECT DESCRIPTION
5-10
planned for Ilulissat, where facilities are available. Refuelling and/or port calls (for re-supply) is anticipated to occur on approximately two occasions during the entire survey period. Changes of both seismic and maritime crews take place every five weeks; therefore, two crew changes are planned for the whole survey. These crew changes are planned to take place in Ilulissat, and the port calls of the M/V CGG Princess will be scheduled to coincide with the incoming crew arriving at Ilulissat. It is not anticipated that helicopters will be used to support the routine operations (e.g. for crew changes), but they may be used in emergencies, such as if a medical evacuation was needed. Any ballast water exchanges for the M/V CGG Princess will take place in the deep ocean or at port in accordance with international (IMO) guidelines such that the potential for the transfer of aquatic organisms is minimised. The vessel will have had a dry dock inspection and new hull paint and anti-fouling coat, immediately prior to mobilising to Greenland. Other Vessels The purpose of the chase/guard vessels during the survey will be to ensure both that the streamer and airgun array are protected at all times, that the area planned to be surveyed is operationally clear (i.e. that icebergs, other vessels or marine life are clear of the operational area, and that the survey vessel can operate to acquire the required data in an optimal manner) and that there is no interference with other vessels or gear (e.g. fixed fishing gear). Two of these vessels, the F/F Meredian and the M/S Kvitbjørn (see Figure 5.7 and Figure 5.8), are proposed (subject to a satisfactory inspection and audit) for the programme. These vessels have been used in this role during seismic surveys in Greenland or other areas of the world's oceans in the past. Maximum fuel capacities of the chase vessels are presented in Table 5.3.
Table 5.3: Vessel class and maximum fuel capacity for the chase vessels
Vessel type Class Fuel type/Max. capacity Chase/guard vessel
F/F Meredian See Figure 10
Originally DNV + 1A1 Ice C Stern Trawler Deep Sea Fishing
Marine gasoil with 20% kerosene /100m3
Chase/guard vessel
M/S Kvitbjørn DNV + 1A1 Ice
classification Fishing Vessel S and Sealer
Marine gasoil with 20% kerosene /190m3

DISKO WEST BLOCKS 4 & 6 SEISMIC SURVEY PEIA PROJECT DESCRIPTION
5-11
Figure 5.7: F/F Meredian
Figure 5.8: M/S Kvitbjørn Both the F/F Meredian and the M/S Kvitbjørn have fixed ballast and hence no ballast water exchange will occur with both these vessels. In addition, a NorPower 22 workboat and Man Overboard (MOB) fast response boat (see Figure 5.9) will be used to assist in the maintenance of the airgun array and streamer and provide emergency response. These vessels will be deployed directly from the M/V CGG Princess.

DISKO WEST BLOCKS 4 & 6 SEISMIC SURVEY PEIA PROJECT DESCRIPTION
5-12
Figure 5.9: Typical Norpower workboat and MOB fast response vessel
5.3.5 Seismic Source As described in Section 5.2, a range of different seismic source volumes were evaluated to identify the optimal output level to achieve acceptable data quality and hence imaging of the sub-basalt target. A total source volume of 6580 cubic inches (107.8 litres) was assessed as being the optimal capacity, based on the operational constraints of the source vessel, and the imaging objectives. The energy source will consist of multiple Bolt 1900 LLX/1500 LL airguns towed in an array beneath floats. Energy source specifications are outlined in Table 5.4 and a plan of the array is presented in Figure 5.10. In total, the array is planned to have 44 active and 3 inactive guns.
MOB Boat

DISKO WEST BLOCKS 4 & 6 SEISMIC SURVEY PEIA PROJECT DESCRIPTION
5-13
Table 5.4: Summary details of proposed seismic source Parameter Specification
Total capacity 6,580 cubic inches Gun types BOLT 1500LL; BOLT 1900 LLX
Number of strings in array 6 Aspect ratio of proposed array 10m sub array separation
Number of active guns 44 Number of spare guns 3
Support system Partnerplast/Barovane floats Width of array
(outer port to outer stbd) 60–80m
Distance of array from stern 100–150m Tow depth of array 15m
Figure 5.10: Proposed layout of airgun array

DISKO WEST BLOCKS 4 & 6 SEISMIC SURVEY PEIA PROJECT DESCRIPTION
5-14
The seismic source used will generate power of up to 266 dB re 1µPa@1m (peak to peak), in the frequency band of 5-100 Hz. When firing at full capacity for data acquisition, airguns will be fired simultaneously at the rate of once approximately every 10 seconds or approximately every 25m. On a turn between each survey line, the airguns will be shut down and a “soft start” undertaken before starting on the next line (see Section 7.2.5).
5.3.6 Hydrophone Streamer Cable A single 10km long hydrophone streamer cable will be towed behind the seismic vessel. The streamer will be “deep-towed” at a depth of approximately 27m to enhance sub-basalt data acquisition and reduce the effect of "ghosting" from the water surface boundary. The M/V CGG Princess has prior experience in performing deep-tow acquisition. Summary detail of the cable is provided below (Table 5.5).
Table 5.5: Summary details of hydrophone streamer cable Parameter Specification
Number of streamers 1 Streamer length 10 km Streamer type Sercel sentinel solid Towing depth 27 m
Streamer Type Solid streamer A Sercel Sentinel solid streamer is planned as the base case for this survey. It will be buoyed by surface tailbuoys to alert other sea users to its presence and to act as a platform for positioning equipment. If however, for any reason the solid streamer is not available for this survey, the survey vessel will utilise a single (industry standard) fluid filled streamer. This alternative is discussed further in this section, as well as in the impact assessment section. When on standby the survey vessel may leave any or all towed equipment (including the hydrophone streamer) deployed, although in particularly severe weather/wave conditions the streamer and source array may be retrieved. When the vessel is planning to return to port for crew change and re-supply, all equipment in the water will be retrieved. Both deployment and retrieval of the streamer will take approximately 12 hours. The M/V CGG Princess will require inspection to ensure its certification is current, prior to mobilising to West Greenland. During this inspection, the vessel operator (CGGVeritas) plans to replace the current fluid filled streamer on the vessel with the planned solid streamer. This work is currently being planned to be undertaken in Malta, as the vessel will more than likely be completing a survey offshore of Libya for ExxonMobil, prior to the Greenland work. This change in streamer will include making modifications to the handling equipment on the aft deck. If for any reason that the solid streamer is not available (due to other CGGV requirements) then it will be necessary to retain the current fluid filled streamer for the West Greenland surveys. These fluid filled streamers typically contain a light, colourless, de-aromatised aliphatic hydrocarbon (similar to kerosene) called Isopar M, which provides electrical insulation and neutral buoyancy. The cable would be divided into

DISKO WEST BLOCKS 4 & 6 SEISMIC SURVEY PEIA PROJECT DESCRIPTION
5-15
isolated sections of approx. 150m, each of which would contain on average 150 to 200 litres of fluid. In the base case of operating with a solid streamer, all storage vessels holding Isopar M (streamer fluid) will be isolated, so that the risk of release of any of this material is reduced or eliminated.
5.3.7 Re-supply and Logistics It is anticipated that all re-supply and crew change for all vessels will occur in Ilulissat. This is currently scheduled to occur every five weeks, and there are currently two re-supply visits planned, based on the forecast survey programme duration. If however significant delays are encountered due to operational or weather conditions, then additional re-supply visits may be required. Crew change will be scheduled to utilise either scheduled commercial flights between Kangerlussuaq and Ilulissat, or if there is insufficient capacity to meet the ongoing local community needs and the additional survey needs, then charter flights will be considered.


DISKO WEST BLOCKS 4 & 6 SEISMIC SURVEY PEIA IMPACT ASSESSMENT
6-1
6. IMPACT ASSESSMENT
6.1 Introduction & Methodological Considerations The main steps used in the assessment described in this report can be summarised as follows:
1. Identification of the activities of the proposed seismic programme that might result in potential environmental impacts.
2. Identification of the key potential environmental sensitivities vulnerable to those identified activities of the proposed seismic programme.
3. Description of each identified potential environmental impact including the control and mitigation measures proposed.
4. Determination of the significance of the potential environmental impacts identified, considering the proposed mitigation measures. Assessment of the level of significance requires a consideration of the likelihood and magnitude of the potential environmental impact, its geographical scale (site, local, and regional) and its duration (short-term, long-term) in relation to the sensitivity of the key environmental receptors.
For the purposes of this PEIA, the potential impacts have been classified into five categories to qualify the likely scale of predicted environmental impacts (Table 6.1) and gauge the need for mitigation actions. The terminology in Table 6.1 is used to categorise impacts in the summary provided in Section 7.10.
Table 6.1: Categories of potential environmental impacts Negligible Impact There are no significant effects predicted to occur to the environment or the impact is of small enough magnitude that it does not require further consideration in the assessment. No specific mitigation measures are required. Minor Impact The adverse effect, if any, disappears immediately after cessation of the activity. No mitigation measures are necessary to return to original situation. Moderate Impact The adverse effect requires some time to disappear after cessation of activity. However, no mitigation measures other than best management practices are required to return to the original situation. Severe Impact The impact magnitude requires the implementation of mitigation measures, and with these measures, the return to the original situation requires a relatively long period of time. Critical Impact The impact magnitude exceeds the acceptable threshold. There is a permanent loss of environmental conditions, without possible recovery even with implementation of mitigation measures.

DISKO WEST BLOCKS 4 & 6 SEISMIC SURVEY PEIA IMPACT ASSESSMENT
6-2
6.2 Key Programme Aspects and Environmental Sensitivities The first step in the assessment process is to identify the key environmental issues that require evaluation. This assessment considers the various activities associated with the proposed seismic programme and the potential impacts on the receiving environment. Considering the project description included in Section 5, the components of the proposed seismic programme in Blocks 4 and 6 that have the potential to result in environmental effects have been identified as being: Routine Activities
• Source sound generation and transmission (Airgun array operation) • Physical presence of the survey vessel, streamer and support vessels • Solid and liquid wastes generated on the vessels • Atmospheric emissions
Potential Incidents
• Streamer cable break and cable content release (if solid streamers are not used)
• Fuel spill from vessels • Vessel collision or sinking • Tangling gear with fishing equipment.
These potential impacts on the key aspects of the different environmental components identified in Section 4 (Baseline chapter) are discussed in more detail in the following sections.
6.3 Impacts of Seismic Sound on Marine Life and Resources
6.3.1 Introduction One of the most important environmental considerations related to seismic survey activities are the potential effects of the sound waves produced by the seismic source array on the different marine biota. The propagation of low frequency signals in the sea is efficient, with little loss due to attenuation (i.e. due to absorption and scattering) in some environments. Close to an airgun array, spherical spreading loss (the reduction in intensity caused by the spreading of waves into an ever increasing space) results in signal intensity dropping quickly. This loss is around 6dB per doubling of distance. However, attenuation depends on the propagation conditions. In good propagation conditions, the signal may be above the background level for more than 100km; in poor propagation conditions, it may reach background level within a few tens of kilometres (McCauley, 1994). The sound waves that travel laterally will continue until they meet an object or they are dissipated by normal decay of the signal. Despite these factors, in-water sound travels a long distance and some low frequency sound waves from the seismic source may be detectable at tens of kilometres from the array. Nevertheless, the intensity of the sound waves does decay exponentially and although low-level signals

DISKO WEST BLOCKS 4 & 6 SEISMIC SURVEY PEIA IMPACT ASSESSMENT
6-3
travel for long distances, the higher amplitude waves lose much of their energy very close to the airgun array. Intense sound exposure can reduce the hearing ability of marine animals. The point at which an animal can begin to detect sound is referred to as an auditory threshold. A threshold shift (TS) occurs when, after exposure to intense sound, hearing sensitivity is impaired. A temporary threshold shift (TTS) is when hearing sensitivity has been impaired but the threshold will return to pre-exposure levels (i.e. hearing sensitivity returns to normal) over time. A permanent threshold shift (PTS) is when hearing sensitivity has been impaired to some level and will not return back to pre-exposure levels, and the animal suffers some permanent degradation of hearing ability. Effects of underwater sound are based on the source-path-receiver concept shown in Figure 6.1. The acoustic energy or sound originates with a source. The ability of a marine animal to receive sounds is dependent on the degree of propagation loss between the source and the receiver, the hearing abilities of the animal and the amount of natural ambient or background sound in the surrounding sea (Bolt and Ingard, 1957).
Figure 6.1: Source–path–receiver model An animal’s ability to detect sounds produced by anthropogenic activities depends on the amount of natural ambient or background sound. Wind, thermal sound, precipitation, vessel traffic, presence of ice and biological sources all contribute to ambient sound. Ambient sound is highly variable on oceanic continental shelves and this may result in considerable variability in the range at which marine animals can detect anthropogenic sounds. There are various potential effects of exposure to sound from seismic and other sources that can be characterised as pathological, physiological or behavioural. Criteria can be established for zones of influence based on ambient sound levels,

DISKO WEST BLOCKS 4 & 6 SEISMIC SURVEY PEIA IMPACT ASSESSMENT
6-4
absolute hearing thresholds of the species of interest, slight changes in behaviour of the species of interest (including habituation), stronger disturbance effects (e.g. avoidance), temporary hearing impairment (TTS) and permanent hearing impairment (PTS) or other physical damage, as illustrated in Figure 6.2.
Figure 6.2: Schematic representation of zones of potential effects associated with anthropogenic sounds on marine mammals In the following sections, the potential impacts on sensitive receptors (species or groups of animals) in the marine environment are considered.
6.3.2 Impacts of Seismic Sound on Adult Fish Several studies have been published on the determination as to whether seismic airguns cause damage to adult fish. Field experiments have been conducted using penned fish held at different distances from a seismic source. The findings of some of the key studies are shown in Table 6.2. The findings of the reviewed experimental work, indicate general threshold levels for potential pathological and lethal effects in fish. The findings further indicate that beyond a range of 0.5-1m from the airguns, the probability of any fish being killed is very low. Internal injuries appear to occur in fish at received sound pressure levels of 220dB, which only occurs very close to the source (within metres). General auditory damage has been recorded for some species from 180dB (Turnpenny and Nedwell, 1994). The pressure pulse generated by airguns is considered to be the most important factor leading to tissue damage in fish. In particular, Gausland (1992), reports that fish killed within a distance of 0.5m of airguns had ruptured swim bladders.

DISKO WEST BLOCKS 4 & 6 SEISMIC SURVEY PEIA IMPACT ASSESSMENT
6-5
Table 6.2: Effects on adult fish caused by seismic airguns Author Experimental work Results and Conclusions
La Bella et al. (1996)
Captive fish in cages at 12m depth. Airgun array 210dB/Hz re1µPa @ 1m. Seismic vessel passed at a minimum of 150m from the caged fish.
200 sea bass: behavioural response to the approach of the sound source, but no lethal event was recorded on captive sea bass immediately after the seismic shooting. The cage was recovered after 6 hours, no evidence of traumatic effects on fish skeleton structure.
Matishov (1992)
Single airgun. 226dB re1µPa @ 1m.
Transient stunning: cod died within 48 hours owing to internal injuries.
Kosheleva (1992)
Single airguns and arrays. 1,000–3,000 cubic inches Source level 220–240dB re1µPa @ 1m.
50% of Barents Sea cod, subject to airgun emissions, with peak sound pressure levels estimated in the range 220–240dB, suffered damage to blood cells, internal bleeding and eye injuries when in the immediate vicinity (i.e. within 0.5m) of the firing airgun or array.
Falk & Lawrence (1973)
Single airgun 4916cm3 Source level 230dB re 1µPa @ 1m
Caged whitefish exposed to a single large airgun resulted in several fish with swimbladder damage.
Under natural conditions, fish detect the sound of airguns at long distances, and healthy adult fish will exhibit avoidance behaviour, moving away from the sound source. The fish sense both the strength and direction of the sound produced by airguns as the frequency spectrum, typically 5-200Hz, coincides with the most sensitive region of fish hearing, 20-700Hz. The hearing capabilities of some fish indicate that the sound of a full-scale airgun array may be heard at a distance of more than 100km (Dalen et al., 1996). Fish avoidance capacity is largely determined by their size, and it is expected on the basis of established knowledge of swimming ability, that most fish larger than 30-50mm will swim away and keep a safe distance from the passing seismic source. The exception to this is likely to be reef fish, which are dependent on specific habitat and require reefs for shelter and avoidance of predators. Hence, in the planned programme, injuries caused by the seismic survey activity would be expected to be restricted to the juvenile stages of fish (i.e. fish typically less than 50mm in length). Negative effects on fish stocks may occur if adult fish are scared away from localised spawning grounds during the spawning season. The Sand Eel is one of the few species in the assessment area that spawn in the summer and stocks could be sensitive to seismic surveys if they are displaced from their spawning grounds. However, based on the available data, it is most likely that spawning takes place over large areas of the West Greenland banks and localised spawning aggregations that could be disrupted have not been observed (Mosbech et al., 2007).
6.3.3 Impacts of Seismic Sound on Fish Eggs and Larvae Fish eggs and larvae are the component of the plankton that have received most attention in the literature related to seismic sound, as the fitness of these stages of the fish life cycle is considered to be an important factor in determining adult fish population structure (Doherty and Williams, 1988). The findings of these studies indicate that injuries and mortality to eggs and larvae are highest at close range, i.e. within 2m of the source (airguns), and decrease

DISKO WEST BLOCKS 4 & 6 SEISMIC SURVEY PEIA IMPACT ASSESSMENT
6-6
rapidly within a short distance from the airgun. Outside a range of 5m, no effects are demonstrated (Kostychenko, 1973; Mosbech et al., 2007). The volume of habitat affected by a seismic survey is very small and population effects, if any, are considered to be very limited (for example, Norwegian and Canadian assessments, Anonymous, 2003). However, in Norway, specific spawning areas in certain periods of the year may have very high densities of fish larvae in the uppermost water layers. Consequently, the Lofoten-Barents Sea area is closed for seismic survey activities during the cod and herring spawning period in May-June (Anonymous, 2003). Generally, densities of fish eggs and larvae are low in the upper ten metres in Greenland waters. Moreover, most fish species spawn in a dispersed manner and in winter or spring with no temporal overlap with the open water period, when the seismic programme is currently planned. It is therefore most likely that impacts of the seismic programme on the recruitment level to fish stocks in West Greenland waters are negligible (Mosbech et al., 2007).
6.3.4 Impacts of Seismic Sound on Fisheries Geophysical seismic surveys have been conducted in the North Sea for over 30 years. During recent years, seismic survey vessels have been operating on fishing grounds in the Norwegian and Barents Seas. Several studies have focused on the assessment of the potential impacts of seismic survey activities on catch rates of the fishing industry. Observations during seismic surveys indicate that fish swim away from seismic sources. Løkkeborg (1991) investigated long-line catches off northern Norway in the presence of a two-week seismic survey with peak source levels of 238dB re 1µPa @ 1m. Catch was reduced by 55-80% within the survey area and there was a reduction in catch up to a distance of 5km. However, catches were observed to return to normal within 24 hours after seismic acquisition had ceased. In the same area, Løkkeborg and Soldal (1993) investigated effects of seismic acquisition with source levels of about 239–250dB re 1µPa @ 1m. Trawls were made before, during and after acquisition. Cod catches during operation were reduced by 79-83% compared to pre-acquisition levels within the survey area and up to 9km from the area. When the survey ended, the catches were observed to return to pre-acquisition levels within 12 hours. Probably the most detailed study of changes to fish distribution caused by seismic activities is that of Engas et al. (1993) from the Norwegian Institute of Marine Research. Seismic shooting was shown to significantly affect the distribution of two demersal fish species, cod and haddock, even at distances as great as 18 nautical miles from the source. Catch rates were recorded and these showed a reduction of around 50% in the average trawl catch rate for the entire area following the start of seismic acquisition. In the centre of the acquisition area, reductions as great as 70% were recorded. In this case, there was no sign of an increase in cod or haddock from either acoustic mapping data or trawl catches five days after seismic acquisition had ceased. It has been concluded that it presumably takes a period of time for fish to re-invade an area following any movement from the area, and this may be due to the movement back into the area being less directed than the movement out, or it may be dependent upon the species and how sedentary it is (Evans and Nice, 1996).

DISKO WEST BLOCKS 4 & 6 SEISMIC SURVEY PEIA IMPACT ASSESSMENT
6-7
Observations have also been made of airguns affecting the shoaling behaviour of fish. Demersal fish species tend to dive away from the suspended sound source into deeper water (Evans and Nice, 1996). This has been demonstrated in experiments conducted by Løkkeborg and Soldal (1993) where they observed the effects of a 20-40 airgun array on saithe off the coast of northern Norway. Trawling experiments indicated that the saithe had remained in the area but had gone deeper. In summary, the findings of studies undertaken in both the North Sea and the Adriatic Sea indicate that the adult fish were observed to exhibit avoidance behaviour resulting in temporary displacement from the seismic survey area. The extent of this displacement however was considered to fall within the normal geographic range of the species, with recovery of pre-seismic catch levels demonstrated. Direct impacts of the seismic survey on shrimp are not anticipated. Table 6.3 indicates the results of some experimental work that supports this.
Table 6.3: Impacts on benthic organisms from seismic airgun surveys Author Species Experimental work Observations
Webb & Kempf, 1998.
Brown shrimp Crangon crangon
Wadden Sea: Array of 15 airguns, total volume 480 cubic inches at 2,000 psi. Source level 190dB re1µPa @ 1m. Water depth 2m.
Observations during the survey showed no mortality of shrimp and no evidence of reduced catch rates. Impact limited due to lack of gas voids and rigid exoskeleton.
Steffe & Murphy, 1992.
Prawns New South Wales coast, Australia: Monitored cooperative catch data before and after a seismic survey.
Unable to show any significant effects in prawn catch rates before, during or after seismic survey.
Crustaceans have no specific hearing organs, and studies on crustaceans did not find any reduction in catchability (Hirst and Rodhouse, 2000; Andriguetto-Filho, 2005). The same applies to snow crab fisheries, although some recent Canadian studies may indicate the possibility of long-term effects that could affect populations at important reproduction areas (DFO, 2004 – quoted in Mosbech et al., 2007). The planned seismic programme may cause some temporary interaction with shrimp and snow crab fisheries, where some historical fishing records indicate higher catches occur. These interactions will be minimised by the communications carried out before the start of the seismic programme and by the presence of an onboard fisheries liaison officer, who will work to minimize any adverse effects from the survey programme. The Greenland halibut fishery is relatively small compared to the inshore fishery (in recent years about 350 tonnes compared with more than 10,000 tonnes) (Mosbech et al., 2007). No specific information is available about the reactions of Greenland halibut to seismic surveys but if catches are reduced by seismic surveys, it would most likely be temporary and will probably only affect specific fisheries for a few days (Mosbech et al., 2007). In addition, the trawling grounds are restricted to specific depths at approximately 1,500m and would therefore be outside the Block 4 and 6 areas (water depths 50–500m).

DISKO WEST BLOCKS 4 & 6 SEISMIC SURVEY PEIA IMPACT ASSESSMENT
6-8
6.3.5 Birds Seabirds are not generally considered sensitive to seismic surveys programmes because of their ability to avoid the seismic sound source (Mosbech et al., 2007). In terms of disturbance, passing aircraft are known to be able to cause significant disturbance to both seabird colonies and sea duck moulting areas (NERI, 2000). However, the use of aircraft (helicopters) is not planned in the proposed survey during routine operations.
6.3.6 Impact of Seismic Sound on Marine Mammals Pinnipeds, Walrus, Polar Bear Although several species of seal are widely distributed and abundant in the survey area, they are not considered to be vulnerable to 2-D seismic operations (NERI, 2000). Given the shallow water requirements of walrus, they are unlikely to be encountered in the deeper offshore survey areas. Similarly, polar bear are extremely unlikely to be encountered within harmful range of either the airgun array or the survey vessel since they are found around the ice and on the ice edge and hence should not be in the vicinity of the survey area. Disturbance from aircraft can potentially cause significant negative impacts, such as to haul-out areas of walrus (NERI, 2000). However, as previously stated, aircraft will only be used in emergency operations and hence will not present any ongoing risk to these species. Cetaceans Cetaceans are the group of animals that are probably identified as most vulnerable to sound, in the current assessment. The different whale species that are likely to be encountered in the assessment area will be white whale (beluga), narwhal and bowhead whale, and they are mostly absent from the area in summer and autumn (Mosbech et al., 2007) when the proposed seismic survey programme over Blocks 4 and 6 is planned. There is however some increased risk of overlap in the late autumn. Other cetaceans may also be observed occasionally (see Table 4.3). Southall et al. (2007) have carried out an extensive review of the available literature and have formulated scientific recommendations for marine mammal exposure criteria. For a species such as the bowhead whale, the sound exposure level (SEL) for injury was set at 198dB re1µPa2-s. It should be stressed that no marine mammal mortality or damage to tissue has been documented for exposure to airguns during seismic surveys and that the exposure level for injury is a theoretical value extrapolated from experimental data. Behavioural responses to seismic surveys vary between species and within species. For example, reactions of bowhead whales to sound exposure depend on whether they are feeding or migrating. Behavioural disturbance for migrating bowheads occurred at received sound levels of around 120dB re1µPa@1m, whereas for feeding bowheads the onset of a behavioural response is at around 140–160dB re1µP@1m or maybe even higher (Southall et al., 2007). Migrating bowhead

DISKO WEST BLOCKS 4 & 6 SEISMIC SURVEY PEIA IMPACT ASSESSMENT
6-9
whales may avoid seismic surveys by distances of up to 35km (Mosbech et al., 2007). In general, the ecological significance of such displacement effects is generally unknown, but if alternative habitats are available, the significance will probably be low and the temporary character of seismic surveys also will allow displaced animals to return after the surveys (Mosbech et al., 2007). Observations undertaken during 201 seismic surveys in UK and adjacent waters have been analysed to examine effects on cetaceans (Stone and Tasker, 2006). Sighting rates, distance from airguns and orientation to the source were compared for periods when airguns were active and when they were silent. It was suggested that the different taxonomic groups of cetaceans may adopt different strategies to responding to acoustic disturbance from seismic surveys. Some small odontocetes (toothed whales) move out of the immediate area, while the slower moving mysticetes (baleen whales) orient away from the vessel and increase their distance from the source but may not move away from the area completely. As shown in Figure 6.3, cetaceans tended to remain more than 500m from the inactive seismic array and generally moved even further away when a seismic array was operating. This presumably reduces the sound exposure levels on the animal.
Figure 6.3: Median closest distance of approach of cetaceans to large volume airgun arrays in relation to airgun activity (from Stone and Tasker 2006) Estimated sound exposure levels have been modelled for representative locations in each of Blocks 4 and 6 (see Figure 6.4 for the location of the modelled sound levels), using a single location of the airgun array operating at full capacity. Model parameters included information on the specific airgun array to be used, typical seafloor geological conditions and local bathymetry as input data.

DISKO WEST BLOCKS 4 & 6 SEISMIC SURVEY PEIA IMPACT ASSESSMENT
6-10
Figure 6.4: Location of selected modelling point for airgun array in Blocks 4 and 6 as used in modelled scenario. Figure 6.5 presents a vertical profile of the modelled sound pressure levels in the water column for each of the two modelled points (1 and 2) in Blocks 6 and 4 (see Figure 6.4 for the location of the modelled points). These clearly illustrate that the airgun array has been specifically designed to focus the most intense sound energy into a narrow “slice” vertically downwards towards the sea floor and hence the geological structures. This thereby greatly reduces any potential risk to receptor species such as cetaceans which may be at different distances and take-off angles from the source array. Based on these model outputs, Table 6.4 summarises the predicted distance from the source, for different sound exposure levels.

DISKO WEST BLOCKS 4 & 6 SEISMIC SURVEY PEIA IMPACT ASSESSMENT
6-11
Figure 6.5: Vertical profiles of modelled sound exposure levels at (top) Point 1 (Block 6) and (bottom) Point 2 (Block 4) in the water column above the seafloor.
Table 6.4: Summary of modeled sound exposure levels at distances from points 1 and 2.
Radii (km) Sound exposure level (dB re 1µPa2-s) #1 (Block 6) #2 (Block 4)
150 26.3 26.9 160 9.5 9.2 170 2.9 3.0 180 0.64 0.70 186* 0.26 0.32 190 0.12 0.16 198* 0.04 0.04 200 0.04 0.04
* Sound Exposure Levels (SEL) below which physical injury would not occur for marine mammals (from Southall et al., (2007) as described in the text below).
Southall et al., (2007) have proposed following their review of the most recent literature, revised criteria for protective sound exposure levels below which, physical
Point 1 (Block 6)
Point 2 (Block 4)

DISKO WEST BLOCKS 4 & 6 SEISMIC SURVEY PEIA IMPACT ASSESSMENT
6-12
injury to marine mammals from sound exposure, should not occur. These levels are 198dB re1µPa2-s for cetaceans and 186dB re1µPa2-s for pinnipeds in water. Modelled exposure levels as shown in Table 6.4 indicate that these sound exposure levels occur well within a 500m radius from the source for the representative points in each block (point 1 in Block 6 and point 2 in Block 4). For the planned surveys of Blocks 4 and 6 a safety radius of 500m will be utilised as referenced by the BMP and in accordance with the JNCC guidelines. As shown in Table 6.4, and along with the expected average stand-off distance for the different whale species (refer to Figure 6.3, from Stone & Tasker 2006) this should provide sufficient protection such that marine mammals will not be exposed to sound levels that would cause physical harm. Based on the analysis of Stone & Tasker (2006), the modelled sound exposure levels and the seasonal occurrence of the more sensitive animals in the Disko West area, it is predicted that there will not be significant interactions between marine mammals and the seismic survey vessel, predominantly because of the timing of the survey. In addition, through the application of mitigation measures that will be followed, such as application of the JNCC Guidelines (http://www.scar.org/information/JNCC_Seismic_survey_guidelines.pdf), the utilisation of marine mammal observers (MMOs) on the vessel and implementation of “soft start” procedures for the airguns as described in more detail in Section 7.2.5, any risks to any animals in the vicinity of the programme area, will be further reduced or eliminated.
6.4 Impacts of Routine Operations
6.4.1 Physical Presence of Vessels and Equipment The planned seismic survey programme may encounter vessels (e.g. fishing for shrimp and snow crab) in the Block 6 area. The objective of the chase/guard vessels will be to minimize the risk of encounter between the survey vessel and its equipment and any other vessels (e.g. fishing, hunting, tourism, etc.), obstructions (e.g. fishing gear, icebergs or ice floes, etc.) during operations. An operational exclusion zone will be established around the survey vessel when it is operating. As such, this represents a potential short-term, minor impact to commercial fishers and other sea users.
6.4.2 Waste Estimates of the quantities, types and handling of wastes generated onboard the survey and support vessels are presented in Table 6.5. All wastes will be managed in accordance with the Waste Management Procedures which will be operational onboard the survey vessel as well as within the legislative framework described in Section 3.4. Disposal of the low volumes of treated sewage at sea will be gradual, of temporary duration and dispersed over a wide area, so will have a negligible impact.

DISKO WEST BLOCKS 4 & 6 SEISMIC SURVEY PEIA IMPACT ASSESSMENT
6-13
There will be a minor negative impact to the onshore Greenland environment through a small increased demand for waste management resources, such as infrastructure and facilities (e.g. landfill capacity). Waste that can be accommodated by the existing infrastructure will be disposed of using appropriate contractors in Ilulissat. Other waste that can be burned, will be disposed of in the onboard incinerator on the M/V CGG Princess.
Table 6.5: Estimated waste volumes generated during the survey
Quantity per day m3*
(Total for survey**)
Waste type
Princess
2 x Chase
vessel
Treatment Disposal
Non-combustible 0.07
(8.4)
4kg
(480kg) Compacted Onshore
Galley/general waste 0.83
(99.6)
6kg
(720kg) Incinerated onboard Onshore
Sewage 0.96
(115.2)
0.1
(12) Treated onboard At sea
Oily bilge 0.5
(60)
0.16
(19.2) Collected in tanks Onshore
*Except where indicated. **Based on 120 days survey. ***Based on data from Meredian Waste that cannot be disposed of via licensed waste contractors in Greenland will be retained on the vessels and transferred to appropriate waste disposal facilities at the end of the programme.
6.4.3 Emissions to Air Emissions to air will primarily consist of exhaust gases from the vessel engines, with some additional emissions from air compressor generators and the onboard waste incinerator on the M/V CGG Princess. An estimate of fuel usage and associated emissions for the survey is presented in Table 6.6 for the three main vessels. Aerial emissions from the three main vessels (i.e. the survey vessel and two chase/guard vessels) will be in approximately the same order of magnitude as that from commercial fishing vessels that normally operate in the region in summer. Emissions will be released gradually over a wide area, maximising potential for dispersion and minimising risk of localised effects. In addition, emissions will be limited to the duration of the programme (i.e. for the duration of the survey). Impacts from aerial emissions are therefore assessed to be negligible.

DISKO WEST BLOCKS 4 & 6 SEISMIC SURVEY PEIA IMPACT ASSESSMENT
6-14
Table 6.6: Estimated fuel consumption and emissions of vessels per day and for the planned survey
Fuel consumption CO2 NOx VOC CH4 SO2
Vessel m3/day
m3/survey
1
Kg/day
t/survey
Kg/day
t/survey
Kg/day
t/survey
Kg/day
t/survey
Kg/day
t/survey
Survey vessel
CGG Princess 15 1800 41,451 4,974 764 91.8 31 3.8 3.3 0.4 259 31.1
Chase/guard vessel
F/F Meredian c. 5 600 13,817 1,658 255 30.6 10 1.2 1 0.1 86 10.4
Chase/guard vessel
M/S Kvitbjørn c. 5 600 13,817 1,658 255 30.6 10 1.2 1 0.1 86 10.4
Total 25 3000 69,085 8,290 1,274 153 51 6.2 5.3 0.6 431 51.9 1 Based on 120 days to complete survey
6.4.4 Invasive Species Alien invasive species (AIS) have a risk of being introduced by a number of pathways when vessels move between different parts of the world's oceans. In the offshore exploration industry, the two principal pathways are:
• Biofouling on the hulls of the vessel; and • Ballast water discharged from a vessel.
While ballast water is more of an issue in tanker and cargo vessels, there may be some limited exchange of ballast water by the M/V CGG Princess on arrival in Greenland. During any ballast operations the M/V CGG Princess will follow the Ballast Water Management Plan that adheres to International (IMO) guidelines for such procedures. Therefore, there is a limited opportunity for transfer of AIS. Biofouling is a minor issue for relatively fast vessels such as survey, chase and workboats, as these will generally have very low burdens of attached biota, compared to slow vessels/infrastructure (such as barges or rigs), due to limited habitats and mitigation measures such as self-ablating and antifouling hull paints. In addition, the M/V CGG Princess will have just had a new anti-fouling coat applied during the planned dry-dock, immediately prior to departing for Greenland. Both chase/guard boats have had recent inspections and anti-fouling applications.

DISKO WEST BLOCKS 4 & 6 SEISMIC SURVEY PEIA IMPACT ASSESSMENT
6-15
6.5 Accidental Events
6.5.1 Introduction Port calls for re-supply and refuelling alongside the wharf in Ilulissat harbour are expected to only occur every five weeks, and hence only two visits are planned during the seismic survey programme. No refuelling will take place at sea. Spills related to refuelling may occur; however, past experience with such events confirms that such occurrences are infrequent and small in total volume. There will be oil/fuel transfer procedures and an oil spill response plan in place that will mitigate any potential impacts by identifying procedures to prevent spills from occurring, and in the event of a spill, providing guidance on dealing quickly and effectively with any spills. Other accidental events that may occur during seismic survey operations are:
• Loss or damage of towed equipment (streamer and or array); and • Spillage of fuel and/or chemicals from vessel(s) at sea as a consequence of
either mishandling or release from a holed vessel (e.g. after collision with an iceberg).
6.5.2 Loss or Damage to Towed Equipment Seismic streamers used in offshore surveys are frequently those containing an aliphatic hydrocarbon (similar to kerosene) to provide electrical insulation and neutral buoyancy. However, before commencing work in Greenland, the M/V CGG Princess is planned to be refitted with a solid streamer system. This has the advantage of removing any risk to the marine environment from loss of the streamer fluid in the event of the streamer being damaged. In a worst-case scenario of loss of all towed equipment (i.e. solid streamer, buoys and airgun array), there would be negligible environmental impact, given the essentially inert nature the equipment. If for any reason the planned use of the solid streamer is not possible, then it will be necessary to deploy a fluid filled streamer. This streamer will be divided into isolated sections of approximately 150m, each of which will contain approximately 150 to 200 litres of fluid. The total loss of the streamer is highly improbable. However, limited release of streamer fluid caused by damage to a streamer section is a possibility. In such instances, a visible film may form on the surface of the sea, as the streamer fluid (typically Isopar M) is insoluble in water. However, due to the light nature of the fluid, rapid dispersion and evaporation is likely to occur with only a small proportion potentially still remaining on the sea surface after 24 hours. Due to the physical properties of the cable fluid, the impacts of spills or releases of this nature would be limited in extent and time and would have no long-term environmental impact.
6.5.3 Spillage of Fuel or Chemicals Spills of fuels and oils are most likely to occur whilst bunkering (refuelling) in port or as a result from inadequate storage. As refuelling is planned to be undertaken alongside at Ilulissat wharf, the key potential accidental events would be:
• Minor spillages to sea as a consequence of mishandling fluids onboard; or • Loss of entire fuel capacity of the vessel (e.g. following holing in a
collision/break-up upon grounding in severe weather).

DISKO WEST BLOCKS 4 & 6 SEISMIC SURVEY PEIA IMPACT ASSESSMENT
6-16
For the first of these, spillage may occur as a result of a leaking hydraulic hose, leaking oil drums, etc. Such spills are either entirely contained on the vessel or if they do reach the sea are typically less than 50 litres. Incidents such as these would be rare due to strict on board procedures in place, with all liquids being stored in appropriately bunded areas. Consequent environmental impacts from any releases or spills are likely to be negligible, as the small quantities spilled would be dispersed rapidly. As was discussed in previous sections, if the solid streamer is used, then any storage of streamer fluid (Isopar M) on the vessel will be isolated and locked out, so that there is no risk of inadvertent release of the fluid. In selecting appropriately classified Ice Class vessels for the survey and chase/guard activities, these vessels reduce the risk of encountering problems in the ice conditions of West Greenland. This risk is further reduced, by installation of ice detecting radar on the survey vessel and one of the chase/guard vessels. Ice management through avoidance and survey track clearing and line sequencing will assist in further reducing this risk. For the worst-case spill scenario where containment of the full tank capacity of fuel onboard the M/V CGG Princess is lost, unmitigated impacts may be significant based on the potential of exposing some populations of sea birds and other surface inhabiting species. Environmental sensitivity maps which have been prepared by the different agencies in Greenland and Denmark are valuable resources in assessing these potential impacts, and in planning response options to minimise such impacts. It is anticipated that the seismic vessel will have maximum storage capacities for diesel fuel and lubricating oil of 692m3 and 16m3 respectively. The fuel to be used by vessels is regular marine diesel (MGO 20 with 20% kerosene). This is preferential to the use of heavy fuel oil that could represent a greater environmental hazard if spilled because of its persistence in the marine environment. Available modelling for much larger spill scenarios (well blow-out or discharge) has been undertaken (Morsbech et al., 2004), and is available to assist in contingency planning. These scenarios are not applicable to the risk presented by the significantly smaller volumes of fuel carried by the survey vessel and support vessels and the characteristics of the fuel that is planned for use.
6.6 Cumulative and Transboundary Impacts The planned seismic survey programme will be operating at the same time as a separate unrelated 2-D seismic acquisition programme in Disko West Blocks 5 and 7 by Husky Energy. The cumulative impact of this will be minimised by the need to avoid, as much as possible, interference of sound sources from the other survey vessels in the different other Blocks. This will be achieved by operators co-operating to ensure all parties are able to achieve their programme objectives, with the minimum of impact on each other's programme, as well as minimal impact to the environment. Operational co-operation between the Block operators will also assist with sharing of resources for emergency and oil spill contingency planning, giving an additional level of security in the case of any accidental events. As regards transboundary issues, these are the responsibility of the appropriate regulatory agency, and it is anticipated that the BMP will keep its Canadian counterparts informed of all activities taking place in the Disko West area.

DISKO WEST BLOCKS 4 & 6 SEISMIC SURVEY PEIA IMPACT ASSESSMENT
6-17


DISKO WEST BLOCKS 4 & 6 SEISMIC SURVEY PEIA ENVIRONMENTAL MITIGATION AND MONITORING
7-1
7. ENVIRONMENTAL MITIGATION AND MONITORING
7.1 Introduction The procedures that will be adopted to ensure that any potential environmental impacts and the risks associated with the seismic survey programme operations are either prevented or effectively managed and controlled to reduce them to negligible levels are summarised in the following sections. This includes those aspects identified in a survey-specific Risk Assessment for health, safety, security and environmental aspects undertaken by the contractor (CGGVeritas). A summary of the proposed plan for implementation of these procedures is presented in Section 7.8.
7.2 Sound and Physical Presence of Operations
7.2.1 General General mitigation measures that will be in place to minimise the impact of sound generated from the seismic source array will be as follows:
• Use of an airgun array which provides a focussed sound source directed vertically down from the array. The airgun array has been configured specifically to minimise noise transmission in the non-vertical planes from the source array. This downward propagation therefore reduces the area in which impacts may occur;
• Use of the smallest airgun array capacity possible in order to obtain the required data quality (primary data acquisition objective is to image the sub-basalt targets);
• At the start of each airgun activity, power will increase slowly (“soft start”) to encourage avoidance reactions by marine mammals and fish; and
• Coordination between seismic vessels surveying adjacent or nearby Blocks (e.g. Blocks 5 and 7). This will involve systematic co-operation between vessels, so that the surveys minimize the impact on data quality of the other surveys, as well as minimize impacts on marine life in the vicinity of the surveys.
In addition, a number of aspect-specific mitigation measures will be in place and are described in the following sections.
7.2.2 Plankton and Benthos Impacts to benthic and planktonic communities are considered to be negligible; therefore no specific mitigation measures other than the general measures above are proposed.
7.2.3 Fish and Fisheries Given the assessed negligible impacts predicted for fish eggs, larvae, fry and adults (NERI, 2000), no fish-specific mitigation measures are proposed.

DISKO WEST BLOCKS 4 & 6 SEISMIC SURVEY PEIA ENVIRONMENTAL MITIGATION AND MONITORING
7-2
However, in order to mitigate against potential negative impacts to fisheries’ interests, the following measures are proposed:
• Prior to, and during, the planned survey programme, notices will be issued to fisheries and maritime interests prior to survey work commencing, including details such as survey area co-ordinates, schedule and communication frequencies;
• As per BMP’s Seismic Survey Standards (5.02.01-04), the contractor will take an approved fisheries expert onboard the seismic (or chase/guard) vessel if requested by BMP, at the operator's/contractors own expense. There will be communications with any vessels in the area to eliminate or reduce to acceptable levels any potential interactions. The fisheries expert will have local knowledge and act as a consulting observer on any matters related to fishing, and keep a log of observations (which will be submitted to BMP within three days of return to shore).
• In addition, the presence of the chase/guard vessels will ensure that all vessels are kept adequately clear of seismic operations and equipment. This will minimize the risk of damage to the survey equipment, or to other vessels or fishing gear in the area.
7.2.4 Birds As no significant impacts of seismic sound is predicted on seabirds (NERI, 2000), and therefore no specific mitigation measures are proposed. However, the marine mammal observers (MMOs) onboard the survey and/or chase/guard vessels will also carry out seabird observations in accordance with JNCC standards (Webb and Durinck, 1992). Aircraft traffic (especially helicopter flights if used in an emergency) will follow standard aviation rules, along with any BMP Rules concerning minimum height and distance from significant wildlife areas to avoid unnecessary disturbance.
7.2.5 Mammals Pinnipeds/Walrus/Polar Bear Given the apparent tolerance of seals to the underwater sound created by seismic operations and their abundance, seals are not considered to be vulnerable to 2-D seismic operations (NERI, 2000), where any approach, passing and movement away of the source vessel will present a limited exposure to any animal. However, seals that are “hauled out” in coastal areas and walruses in the drift ice may be disturbed by aircraft and helicopters. Aviation support is not a routine planned operation, and hence will not present any significant risk to animals in the vicinity of Blocks 4 and 6 and therefore no impacts are anticipated. Cetaceans The following mitigation measures will be employed during the seismic survey programme in order to minimise the potential for impact to any marine mammals that could be present in the survey area, in accordance with BMP’s Seismic Survey Standards, May 2003 (Section 2.01.04):
• The airgun array will not be started within 500m of a group of large whales (two or more individuals, e.g. humpback whales);

DISKO WEST BLOCKS 4 & 6 SEISMIC SURVEY PEIA ENVIRONMENTAL MITIGATION AND MONITORING
7-3
• The airgun array will be started gradually (“soft start”) over a period of at least 20 minutes to minimise disturbance of marine mammals and encourage their movement away from the immediate survey area. This is the process whereby a single small-volume airgun is fired initially, gradually introducing more airguns and those of a larger volume, until the full working capacity is reached.
• A communication exercise will take place between the crew of the survey vessel and the marine mammal observer(s) (MMOs) within 24 hours of start-up.
Recognised international standards in the monitoring and management of seismic surveys in relation to marine mammals (JNCC, 2004) will also be followed throughout the programme. The stipulations in these Guidelines include:
• The provision of an appropriately qualified and experienced MMO onboard the seismic vessel (NB: this is in addition to normal bridge watch).
• Beginning at least 30 minutes before commencement of any use of the seismic sources the MMO should carefully make a visual check from a suitable high observation platform to see if there are any marine mammals within 500 metres of the seismic array (measured from the centre of the array).
• If marine mammals are seen within 500 metres, the start of the seismic source should be delayed until they have moved away, allowing adequate time after the last sightings for the animals to move away (at least 20 minutes).
• Power should be built up slowly from a low energy start-up (e.g. starting with the smallest airgun in the array and gradually adding in others) over at least 20 minutes – the “soft start”.
• If, for any reason, firing of the airgun has stopped and not restarted for at least 5 minutes, a full 20 minute “soft start” should be carried out.
• After any break in firing of any duration a visual check should be made for marine mammals within 500 metres of the centre of the array.
The JNCC Guidelines indicate that a visual check should be made before starting the airguns. However it has never been the intention of these Guidelines to prevent “soft starts” during the hours of darkness or poor visibility and it is standard industry practice to utilise "soft starts" when required by operational necessity (Carolyn Barton nee Stone, pers. Comm.). The “soft start” is likely to in any case cause any cetaceans in the area to move away. Stone (2006) concluded that significantly more cetaceans were heading away from the seismic vessel during the “soft start” than at any other time, including when airguns were operating a full power. A protection zone for narwhal, namely the “Narwhal Zone III” is located to the west of Blocks 4 and 6 (on the continental shelf slope). This is a critical wintering habitat and subsequently prohibited to seismic exploration during 15 November–30 March (NERI, 2000). The operator of the seismic survey programme in Blocks 4 and 6 are aware of these restrictions and will adhere to the requirements.
7.2.6 Ice Monitoring and Management

DISKO WEST BLOCKS 4 & 6 SEISMIC SURVEY PEIA ENVIRONMENTAL MITIGATION AND MONITORING
7-4
The presence of ice and icebergs will be an important element in the planning and implementation of operations. The aim will be to avoid or minimise interactions with ice and icebergs in order to prevent damage to vessels or equipment and optimise the acquisition schedule. In the planning phase, the following information will be utilised:
• Historical information from past 3–4 years; • Recent satellite images to determine extent of ice/icebergs and best area to
schedule the acquisition; • Weather and ice/iceberg trajectory on a 3–4 day look ahead schedule; • Daily satellite images (available ~6 hours after snapshot); and • Weekly ice analyses – see Figure 4.9 as an example.
During operations, dedicated ice observer personnel will be present on the M/V CGGV Princess or one of the chase/guard vessels. It is planned to install specialised ice radar capability on the survey vessel and one chase/guard vessel. This Rutter “Sigma S6” enhanced ice navigator radar has the following capabilities:
• Up to 1 meter resolution 4 nautical miles away (calm sea state); and • Able to tracks up to 1,000 targets in open water.
This equipment is used by the Canadian Coastguard and other vessels working in ice/iceberg waterways and will enable real time tracking of ice and icebergs. It will also provide additional capability during periods of poor visibility (see Figure 7.1).
Figure 7.1: Sigma S6 ice radar capabilities for tracking ice particle movement The measures listed above (communications issued to mariners, use of chase/guard vessels, MMOs and presence of onboard Fisheries Liaison Officer) are also applicable in the mitigation of short-term disruption for the physical presence of vessels and equipment. Other than these, no further specific mitigation measures are proposed.
7.2.7 Other Monitoring
Typical Radar Sigma S6 Radar Image

DISKO WEST BLOCKS 4 & 6 SEISMIC SURVEY PEIA ENVIRONMENTAL MITIGATION AND MONITORING
7-5
Ideally, detailed modelling of the sound levels generated by the proposed survey would be performed in order to accurately assess sound propagation in the marine environment over (and to some extent beyond) the survey area. However, the oceanographic environment of the survey area is complex in terms of bathymetry, water column stratification resulting from differences in salinity and temperature and the presence of ice and icebergs. As such, propagation of sound is likely to vary, dependent on factors such as water depth, sound source depth in relation to the thermocline, sea bottom sediment hardness and proximity to freshwater lenses and ice to mention a few. These conditions are therefore not conducive to meaningful modelling efforts. In order to gain a better understanding of the propagation of sound in these waters, we are investigating use of a system of underwater sound recording devices (hydrophones) to be deployed at locations in the survey area during the survey to acquire quantitative data on actual sound propagation and transmission loss. Provisionally, these locations may include:
• the bank area immediately to the south of Block 6; • the main channel along the southern edge of Disko Island; and / or • the bank to the north in Block 4.
A hydrophone array could be deployed with instrumentation to record physical oceanographic parameters (e.g. an Acoustic Doppler Current Profiler or ADCP) and possibly conductivity and temperature probes. Any data acquired will be useful in assessing iceberg movement, along with interpreting other environmental data collected during the planned Strategic Environmental Studies.
7.3 Waste All waste will be segregated and handled in accordance with the Waste Management Plan which will operate in accordance within all corporate guidelines and national and international legislation/regulations.
7.4 Emissions to Air Air emissions will be minimised through regular maintenance of all engines onboard, in line with Maritime Registry of Shipping (MRS) and other similar requirements. Only appropriate waste suitable for onboard combustion in the incinerator will be disposed of via this method.
7.5 Invasive Species All vessels will use standard anti-fouling paints to discourage growth of fouling organisms. In addition, international standard HSE and housekeeping procedures will be in place to minimise, and eradicate vermin onboard and prevent their transmission in the port. Any ballast operations will be carried out in accordance with International (IMO) guidelines.

DISKO WEST BLOCKS 4 & 6 SEISMIC SURVEY PEIA ENVIRONMENTAL MITIGATION AND MONITORING
7-6
7.6 Accidental Events
7.6.1 Loss or Damage to Towed Equipment The likelihood of damage to the streamers is mitigated by the fact that the vessels are equipped with sophisticated navigational equipment that provides a warning of the approach of other ships and use at least two independent means of weather forecasting to predict poor weather, along with using a solid streamer. The streamer will be towed at approximately 27m water depth and hence be away from most normal vessel traffic; however, there may still be a risk of damage from icebergs, which will be mitigated by the measures described in Section 7.2. Other sea users are warned of the presence of towed equipment by notices issued to mariners and by the chase/guard vessels, and by a tailbuoy fitted with radar reflectors, night lights and geographical positioning system (GPS) receivers. During adverse weather conditions, operations will be suspended and the towed equipment may be retrieved onboard the vessel. In the unlikely event that the streamer is accidentally severed, recovery buoys will ensure that it rises to the surface facilitating retrieval, by the workboat or chase vessels.
7.6.2 Spillage of Fuel or Chemicals Streamer Fluids A solid streamer system has been selected specifically to mitigate against the potential release of streamer fluid into the marine environment. This will significantly reduce the risk of chemical exposure to any marine animals. In this case, all storage tanks will be isolated, such that the contents cannot be accidentally released to the environment. If circumstances dictate the need to make use of a fluid filled streamer, there is a potential for small fluid spills into the marine environment. However, there are a number of mitigating measures in place in connection with this, including:
• Containing the streamer fluid in isolated sections, hence limiting the amount of fluid released if the streamer is damaged or severed;
• Chase/guard vessels will scout the survey line area ahead of the survey vessel to ensure that ice will not present a risk to the survey operations. The chase/guard vessel may either advise on relocation to another survey area, or work to move ice from the survey track;
• Chase/guard vessels and a fisheries liaison officer in place to prevent interactions with other marine traffic; and
• Ice observers and ice radar to assist in avoiding ice and icebergs. Fuel or Chemicals The following measures will be in place to mitigate against accidental spills:
• Refuelling of vessels will not be undertaken at sea, but only alongside the wharf, where spills, although unlikely to happen, can be responded in more easily, and will reduce the risk of any exposure to marine life;
• The vessels will operate with strict safety, navigational, operating and communications procedures in place in order to avoid collisions. These will include use of experienced chase boat crews, Automatic Identification System

DISKO WEST BLOCKS 4 & 6 SEISMIC SURVEY PEIA ENVIRONMENTAL MITIGATION AND MONITORING
7-7
(AIS) tracking, adherence to the Collision Regulations, communication with other seismic contractors and 24 hour look ahead plans;
• The survey vessel (M/V CGG Princess) was selected partly on the basis that it is rated ice-class ICE-1A, thus greatly reducing the chances for fuel tank rupturing on collision with ice (or other vessels);
• The fuel to be used by vessels is regular marine diesel (MGO 20 with 20% kerosene) and not heavy fuel that could represent a greater environmental hazard if spilled;
• Onboard the vessel, the valves between fuel tanks will be kept closed, thereby minimising potential for complete fuel loss. Refuelling will occur according to a specific procedure;
• An Oil Spill Response Plan for the Naval operations in Greenland is available (http://forsvaret.dk/NR/rdonlyres/35458618-4C85-4667-9C51-9741EDF73E36/44256/brpsamletapril2007.pdf), which details equipment, resources, command structure, response actions and communications in the event of any spill (at present this document is in Danish but will be translated into English prior to the start of the seismic survey);
• Shipboard Oil Pollution Emergency Plans (SOPEP), spill mitigation equipment and other facilities are kept onboard all vessels in order to contain or minimise spills; all the vessel crews have been trained in the use of the plans and equipment; and
• There will be a bridging document which sets out how all spill response resources (personnel, command structure, equipment, etc.) will interface, including co-ordination between other seismic survey operators.
The likelihood of incident occurring that results in complete fuel loss of any of the vessels involved in the seismic survey programme or as a result of a collision with other vessels is very small. However, as a specific requirement in Esso's Operations Integrity Management System, an Oil Spill Contingency Plan will be implemented ahead of the commencement of the survey programme operations. If a spill occurs, the vessel will immediately contact the designated Spill Notification Point for Greenland at the Maritime Rescue Co-ordination Centre, (MRCC) Gronnedal. The MRCC will contact the Danish Environmental Protection Agency (NEPA), who in turn will activate the National Oil Spill Response Plan. The Greenland Naval Oil Response Plan indicates that equipment and crew for combating oil spills are found in 12 fire stations in coastal towns. These include Qeqertarsuaq, Ilulissat, Qasigiannguit, Aasiaat and Sisimiut. The equipment includes booms, skimmers and ancillary equipment. Each station is designed to deal with an oil spill of up to 20,000 litres. For larger spills, equipment will be transported between sites or equipment and personnel will be transported from Denmark on request from Greenland. The Plan is similar to plans in operation around the world and is based on a tiered system as follows: Tier 1: For small spills that can be dealt with by limited national resources or by the local authorities’ or operation’s contingency plans. The conditions of the spill and its location will be part of the decision as to whether the spill fits into this category
Tier 2: For spills that require significant national resources and/or cooperation between several contingency organisations personnel and equipment. This Tier covers a wide range of spill sizes and scenarios.
DISKO WEST BLOCKS 4 & 6 SEISMIC SURVEY PEIA ENVIRONMENTAL MITIGATION AND MONITORING
7-8
Tier 3: For large oil spills that require the mobilisation of all the national resources and depending on the situation also require international support provided through bilateral, regional or global cooperation agreements
. For a Tier 3 response, Esso will have available through its affiliate contacts and contracts, oil spill response resources which have expertise in spill response planning, oil spill modelling, logistics and spill command. Esso also has immediate access to significant oil spill response equipment stockpiles in North America and the U.K. (primarily Oil Spill Response Limited in Southampton). Esso can access these 24 hours a day, and is well drilled in their notification, activation and integration into any spill response operation. Due to the volumes of oil and fuel carried on all vessels, it is anticipated that Tier 3 response capabilities will not be required during the seismic survey operations. Waste resulting from the clean-up of spills onboard the vessels (e.g. used spill kits) will be disposed of onshore at approved facilities, or incinerated onboard the survey vessel, if it is appropriate.
7.7 Environmental Management Plan
7.7.1 Introduction The following information pertaining to the Environmental Management Plan (EMP) is often referred to as the Environmental Protection Plan (EPP), as referenced in the BMP's seismic survey standards. Typically, most environmental impacts associated with seismic survey operations are caused by poor operating procedures and insufficient training of personnel resulting in unplanned events. One of the main mitigation measures therefore is to have in place a rigid and defined set of operating procedures that are communicated to all relevant crew and staff, complemented by environmental and health and safety awareness training. Further, Esso has had the M/V CGG Princess working for it in Libya for the past few months, and is fully familiar with its operation, performance and management systems. Similarly CGGVeritas is fully familiar with Esso's Operations Integrity Management System and all it's requirements. This will assist in a smooth transition for operations in Greenland.
7.7.2 Environmental Procedures and Training The seismic survey operator selected to undertake the seismic survey programme of Blocks 4 and 6 will be required to operate in compliance with Esso's corporate environmental policy and environmental management system (EMS). Standards and guidelines will be drawn from (but not limited to) the following documents:
• CGGVeritas Project Health, Safety and Environment Plan; • BMP Seismic Survey Standards for West Greenland (2003) • IAGC publications, in particular the Environmental Guidelines for World-wide
Geophysical Operations; • Relevant OGP publications;

DISKO WEST BLOCKS 4 & 6 SEISMIC SURVEY PEIA ENVIRONMENTAL MITIGATION AND MONITORING
7-9
• MARPOL 73/78 Regulations; and • Esso's Operations Integrity Management System.
The IAGC guidelines provide a reference for the seismic industry that will promote consideration and conservation of the environment giving practical guidance on the avoidance of environmental impacts during marine seismic surveys. The appointed seismic contractor will confirm to Esso, that it is in possession of this document and that it will adhere to the general operating guidelines of this document for its marine operations. The IAGC guidelines are a minimum set of standards for the seismic survey. Therefore, in addition, the seismic survey contractor will be required to adhere to the survey-specific guidelines as identified in this PEIA for its marine operations and will need to ensure that all employees receive adequate environmental training and that regular environmental inspections are carried out. Proper training and waste management procedures and emergency preparedness are of paramount importance. The seismic programme will be performed in accordance with the requirements of the Emergency Response Plan. Specific personnel will have designated responsibilities with regard to environmental protection. While onboard, the Captain has ultimate responsibility for ensuring that the vessel is operated with due regard for the preservation of the environment. The appointed seismic survey contractor will have the responsibility to ensure that all crew members and relevant shore-based personnel have received appropriate training in order to carry out their duties associated with the survey, in a safe, healthy and environmentally responsible manner. The vessels will be equipped with appropriate sorbent booms and materials to respond to a spill. During the survey programme, a log will be kept detailing each days progress and events. Each day’s report will follow a standard format and include provision for recording any environmental incidents, which may occur. Environmental incidents include spillage, line breakage or other incidents with possible environmental consequences.
7.7.3 Socio-economic Considerations – Stakeholder Consultations Operators of each of the Blocks 4 and 6 will take a phased approach to the exploration and potential exploitation of hydrocarbon resources in the Licence Blocks. The typical stages for exploration, appraisal, development and operation are:
• 2-D seismic acquisition, interpretation and analysis; • 3-D seismic acquisition, interpretation and analysis; • Exploration drilling; • Appraisal drilling; • Field development; and • Decommissioning
Each stage is dependant on success in the preceding stage. Therefore, there is no guarantee that all stages will be undertaken. For each of these stages, the operator of the Block plans to acquire environmental and socio-economic information to meet assessment needs and requirements. Stakeholders will be consulted during the process.

DISKO WEST BLOCKS 4 & 6 SEISMIC SURVEY PEIA ENVIRONMENTAL MITIGATION AND MONITORING
7-10
Onshore activities associated with the seismic survey programme should have little or no detrimental socio-economic impact, and should on balance provide a limited short-term direct benefit to the local economy. In the medium term, if the findings of the seismic survey programme indicate the potential presence of hydrocarbon reserves, further exploration activities, and any subsequent development activities associated with identified structures should provide an important direct benefit to Greenland. The mitigation measures identified will ensure that there is a negligible impact on fisheries interests from normal operations. An oil spill resulting from a vessel collision could however, cause temporary disruption of fisheries activity and have a negative impact on coastal fisheries in the unlikely event of oil reaching the coast. During the initial 2-D seismic survey programme, Esso will be working closely with BMP and the other Licence Holders in each of the two Blocks (4 and 6) to understand any issues which may arise. The BMP facilitated community consultation at various towns within the West Disko area between March 28 and April 3, 2008. These meetings with community leaders (typically the Mayor and council administration officials) and the community at large, were held in the different villages and towns in the vicinity of the proposed survey areas (namely Sisimiut, Qangaatsiaq, Aasiaat, Qasigiannguit, Ilulissat and Uummannaq). At each community meeting, presentations were made by a range of companies which are planning seismic operations in the open water season of 2008. After the presentations were made, sufficient time was allowed for questions from the public, and these were addressed by the various members of the presentation team, including the BMP, NunaOil A/S and other international oil companies. Esso, DONG energy, Chevron, Husk Energy and NunaOil (all participants in the Blocks 4 and 6) were represented at the meetings. This initiative was an excellent opportunity to provide information about the scope of the seismic survey programme and the environmental impact assessment and management process, as well as the wider aspects and issues related to potential oil and gas developments. Communication with the local communities will also provide further information on the current state of the environment, and the concerns or issues of the communities, related to the proposed survey programmes. Before the seismic survey programme begins, BMP will typically issue a public statement (based on information provided from the operator) communicating information concerning the upcoming seismic acquisition.

DISKO WEST BLOCKS 4 & 6 SEISMIC SURVEY PEIA ENVIRONMENTAL MITIGATION AND MONITORING
7-11
7.8 Summary of Impacts and Mitigation Table 7.1 provides a summary of the impact categorisation and mitigation measures to be implemented as discussed in Chapters 6 and 7.
Table 7.1: Impact assessment summary
Aspect or Source Potential Impact
Probability of Occurrence or
Exposure
Proposed Monitoring or Mitigation Measures
Residual Outcome or
Impact Routine Activities
Disruption effect on local social environment and economy
Contact with local Greenland communities during port activities
Stakeholder consultations Negligible
Interaction with fishing activities operating in the survey area
Very low considering the limited fishing activity anticipated within Blocks 4 and 6 and the mitigation measures in place
Advise relevant Greenland authorities to notify vessels within the survey area Two chase vessel utilised Use of the appropriate signals in accordance with International Maritime Law, including communications via radio, light signals
Negligible
Physical presence of the seismic survey vessel and recording Seismic airgun array and streamer
Interaction with existing marine traffic
Low due to low densities of marine traffic in the area and mitigation measures in place
Warnings (Notice to Mariners) of the proposed activities will be issued Negligible
Water impacts from seismic survey and chase vessels’ waste generation
Very low considering mitigation measures in place
Compliance with the vessel’s Waste Management Plan
Negligible
Vessels operations/ routine emissions and discharges
Air impacts from emissions
Very low based on low total emissions
Proper maintenance of equipment and generators Regular monitoring of fuel consumption Proper use of onboard incinerator for appropriate wastes
Negligible
Disturbance to marine mammals (potential physical/ physiological/ behavioural effects)
Unlikely due to expected low densities of marine mammals in the area and mitigation measures in place
Application of the UK-JNCC guidelines for minimising the acoustic disturbance on cetaceans. Use of two dedicated marine mammal observers (MMO) on seismic vessel
Minor Operation of seismic equipment: airguns/sound
Disturbance to marine organisms: fish, invertebrates, plankton and birds
Low; potential impact restricted to organisms in close proximity to source
None Negligible

DISKO WEST BLOCKS 4 & 6 SEISMIC SURVEY PEIA ENVIRONMENTAL MITIGATION AND MONITORING
7-12
Table 7.1 continued:
Aspect or Source Potential Impact
Probability of Occurrence or
Exposure
Proposed Monitoring or
Mitigation Measures
Residual Outcome or
Impact Non-Routine Activities (including accidental events)
Accidental loss of streamer fluid/ streamer and associated equipment
Water impact. Planned use of solid streamer, but in the event that it is not available, fluid streamer sill be used Very limited due to relatively small volume of fluid contained in streamer section Chase vessels will help to minimise potential for other vessels to disturb the streamer
Solid streamer is planned Multi-section streamer Presence of chase vessels
Minor
Vessels operation/ Spillage during refuelling at port
Water impact Coastal area impact
Very limited due to procedures and mitigation measures in place
Refuelling operation will be managed through detailed vessel specific procedures and emergency response plans Long range of vessels with limited number of port calls
Minor
Vessels operations/fuel and oil spills from the vessels
Water impact Coastal area impact
Extremely unlikely considering good condition and maintenance of vessels, navigational systems to identify/avoid obstacles
Vessel specific procedures and emergency response plans. Use of marine diesel and not heavy fuel oil
Minor

DISKO WEST BLOCKS 4 & 6 SEISMIC SURVEY PEIA CONCLUSIONS
8-1
8. CONCLUSIONS This Preliminary Environmental Impact Assessment (PEIA) concludes, consistent with results from many previous published studies that normal 2-D seismic survey programme activities result in both:
• negligible long-term adverse effects that would inhibit recovery of the environment to its normal state; and
• negligible adverse acute biological effects. However, it is understood that seismic survey activities can lead to minor changes to normal behaviour of higher organisms such as fish, sea mammals and birds and that within close range (<5m) of an operating airgun array, mortality of plankton and juvenile fish unable to swim away from the airguns could occur. Mortality and injury effects are predicted to be most frequent and serious only within 1.5m of the airgun array and are not considered to represent significant impacts to plankton populations or specifically to fish recruitment at the population level. Potential impacts identified specifically in connection with the Block 4 and 6 seismic surveys were:
• Possible minor interactions with some whale species if present and possible acoustic disturbance, although sound levels outside the safety zone for whales are not sufficient to cause any physical harm. Negative interactions with marine mammals will be mitigated by the operational controls which will be applied, (e.g. "soft starts") and the presence of MMOs on the vessels to ensure the JNCC Guidelines are adhered to at all times. It should also be noted that the species that would be most susceptible to sound disturbance, i.e. the bowhead whale, beluga and narwhal are unlikely to be present during the open water season when the seismic survey is planned;
• Possible interactions with vessels fishing for shrimp and snow crab, causing temporary short-term displacement from fishing areas. These interactions will be minimized by communications with the fishing communities before the start of the surveys, the presence of the chase/guard vessels and by the fact that a Fisheries Liaison Officer will be onboard one of the vessels at all times, and will facilitate communication with other sea users;
• Possible interactions with icebergs which could cause damage to equipment and vessels particularly in poor visibility conditions. This will be mitigated by the installation of specialized ice detection radar on the seismic vessel and one of the chase/guard vessels, and the presence of dedicated ice observation personnel on the vessels;
• The routine production of waste onboard the vessels will be controlled by a specific Waste Management Plan and the impacts related to this are assessed as being negligible; and
• Air emissions from the seismic survey will have a negligible environmental impact.
Regarding potential accidental events, navigational equipment onboard the seismic survey vessel, streamer cable tailbuoys and the chase/guard vessels will provide warning to other sea users of the location of the streamer and planned operation areas. Thus, risk of damage to the equipment and possible resultant spillages or loss of equipment to the marine environment can be avoided or significantly reduced.

DISKO WEST BLOCKS 4 & 6 SEISMIC SURVEY PEIA CONCLUSIONS
8-2
The potentially more significant impact related to the seismic survey programme would be caused by an oil spill caused by a vessel grounding or collision with a subsequent rupture of the fuel tanks. This could cause impacts on birds at sea and to sensitive coastal resources. However, this risk will be reduced by the fact that the survey vessels will use marine diesel instead of heavy fuel oil which is more persistent in the marine environment. The likelihood of such an occurrence is very small. However, as a specific requirement in Esso's Operations Integrity Management System, an Oil Spill Contingency Plan will be documented and be implemented ahead of the commencement of the survey programme operations. This Plan will integrate with the local Greenland resources, as well as with the resources held on the programme vessels and any other Licence Block operators who have operations over the same time period. Esso will have available through its affiliate contacts and contracts, oil spill response resources which have expertise in spill response planning, oil spill modelling, logistics and spill command. Esso also have immediate access to significant oil spill response equipment stockpiles (Tier 3) in North America and the U.K. (primarily Oil Spill Response Limited in Southampton). Esso can access these 24 hours a day, and is well drilled in their notification, activation and integration into any spill response operation. However, it is expected that this level of response will not be required for any incident which may release oil (fuel) to the environment. Onshore activities associated with the seismic survey programme should have little or no detrimental socio-economic impact, and should on balance provide a limited short-term direct benefit to the local economy. In the medium term, if the findings of the seismic survey programme indicate the potential presence of hydrocarbon reserves, further exploration activities, and any further development activities associated with any identified hydrocarbon reserves will provide an important direct benefit to Greenland. The contractor selected to undertake the seismic survey programme of Blocks 4 and 6 will be required to operate in compliance with Esso's corporate environmental policy and Environmental Management System (EMS). CGGVeritas have the M/V CCG Princess working for Esso in Libya, and hence are fully familiar with Esso's system and management. The performance of the vessel and crew reflects the full understanding of each Company's systems. In addition the seismic survey will be carried out in accordance with all relevant Regulations, Guidelines and Standards, thus ensuring best possible environmental performance. Overall, as a consequence of the timing of the seismic survey and the mitigation measures that will be employed to reduce or avoid potential impacts or disturbance, no significant environmental impacts are anticipated.

DISKO WEST BLOCKS 4 & 6 SEISMIC SURVEY PEIA PLANS FOR FURTHER STUDIES
9-1
9. PLANS FOR FURTHER STUDIES As part of the Licence Agreements, the Licensees are required to fund environmental and ice studies, including contribution to the Strategic Environmental Assessment of the West Disko area, in co-operation with the local authorities and other operators in the area. The Licence Holders are currently discussing the scopes of these proposed studies, with the aim of commencing them in the summer of 2008. The potential studies are listed in Table 9.1.
Table 9.1: Proposed further studies
Aspect of Study Lead Researchers Aspects included
Benthic flora/fauna GINR, NERI Soft substrate infauna, hard substrate flora
Seabirds NERI Autumn migrations; critical habitats; feeding ecology
Marine mammals GINR, NERI Ecology of polar bear,
narwhals, and bowhead whales
Ice studies Danish National Space
Centre Danish Meteorological Institute
Remote sensing of ice dynamics offshore Disko-
Nuussuaq; satellite mapping of sea-ice and icebergs; drift
velocities; ice thickness The Licence Block participants will be working with the relevant research organisations in Greenland and Denmark, as well as the BMP, to implement these studies to assist in the assessment of current and potential operations for the West Disko area. The key objective of all these studies and the monitoring programme proposed for these seismic surveys, is to advance the understanding of the ecology of the region, and facilitate improved impact assessment and management for any future oil and gas activities.


DISKO WEST BLOCKS 4 & 6 SEISMIC SURVEY PEIA REFERENCES AND BIBLIOGRAPHY
10-1
10. REFERENCES AND BIBLIOGRAPHY
Andriguetto-Filho, J. M.; Ostrensky, A.; Pie, M. R.; Silva, U. A. & Boeger, W. A. 2005. Evaluating the impact of seismic prospecting on artisanal shrimp fisheries. Continent. Shelf Res., 25:1720-1727.
Anker-Nilssen, T. 1987. Metoder til konsekvensanalyser olje/sjøfugl. – Vildtrapport 44, Norsk Institutt for Naturforskning, Trondheim 114 pp.
Anon., 1993. Environmental assessment sourcebook. Volume III. Guidelines for environmental assessment of energy and industry projects. World Bank Technical Paper No. 154.
BMP. 2003. Seismic Survey Standards for Offshore West Greenland. Government of Greenland Bureau of Minerals and Petroleum. May 2003. 24pp.
BMP. 2006. Guidelines for preparing an Environmental Impact Assessment (EIA) for exploration, development, production, decommissioning and transport of hydrocarbons offshore Greenland. May 2006 Government of Greenland Bureau of Minerals and Petroleum. 7pp.
Boertmann, D., Mosbech, A., Frederiksen, M. & F Merkel. 2007. Environmental Studies in the Disko West Area - Project plan, Seabird autumn migration and marine ecology. National Environmental Research Institute, Denmark, unpublished PowerPoint presentation.
Bolt, R.H., and K.U. Ingard. 1957. System Considerations in Noise Control Problems. Page 22-1 in Handbook of Noise Control, edited by C.M. Harris. New York: McGraw-Hill.
Christensen, E. 1981. Havbundens planter. Pp. 253-261 in Nørrevang, A. & Lundø, J. (Red.) Danmarks Natur 11-Grønland. – Politikens Forlag.
Dalen, J., Ona, E., Soldal, A.V. & Saetre, R . 1996. Seismiske Undersokelser Til Havs: En Vurdering Av Konsekvenser for Fisk og Fiskerier.
Dietz, R. & Heide-Jørgensen, M.P. 1995. Movements and swimming speed of narwhals (Monodon monoceros) instrumented with satellite transmitters in Melville Bay, Northwest Greenland. Can. J. Zool. 73: 2106–2119
Doherty, P.J. & Williams, D.McB. 1988. The replenishment of coral reef fish populations., Oceanogr. Mar. Biol. Annu. Rev. 26:487-551.
Engas, A., Løkkeborg, S., Ona, E. & Soldal, A.V. 1993. Effects of seismic shooting on catch availability of cod and haddock. Institute of Marine Research, Norway. Fisken og Havet, 9, 117 pp.
Evans, P.G.H. & Nice, H. 1996. Review of the effects of underwater sound generated by seismic surveys on cetaceans. Sea Watch Foundation, Oxford.

DISKO WEST BLOCKS 4 & 6 SEISMIC SURVEY PEIA REFERENCES AND BIBLIOGRAPHY
10-2
Falk, M.R. & Lawrence, M.J. 1973. Seismic exploration: its nature and effect on fish. Technical Report Series No. CEN T-73-9, Resource Management Branch, Central Region (Environment), Canada.
Ferguson, S.H., Taylor, M.K. Born, E.W. & Messier, F. 1998. Fractals, Sea-Ice landscapes and spatial patterns of polar bears. Journal of Biogeography 25(6): 1081–1092.
Folkov, L.P. & Blix, A.S. 1999. Diving behaviour of hooded seals (Cystophora cristata) in the Greenland and Norwegian Seas. Polar Biology 22: 61–74.
Gausland, I. 1992. An assessment of the risk potential of Norwegian shelf seismic operations. Fisheries and Offshore Petroleum Exploration 2nd International Conference, Bergen Norway, 6–8 April.
Geological Survey of Denmark and Greenland 2003 (GEUS), 2003. Description of the geological map of Greenland 1:2,500,000. Offshore Geology. Geological Survey of Denmark and Greenland, Internet 2008. http://www.geus.dk/program-areas/raw-materials-greenl-map/greenland/gr-map/nh05_1s-uk.htm
Greenland Homerule Government 1995. Piniarneq 1996. – Namminersornerullutik Oqartussat/Atuakkiorfik, Nuuk.
Greenland in figures 2007. (4th Edition) - Baunbæk, L (ed). Published on behalf of Statistics Greenland. Greenland Home Rule Government. ISSN: 1604-7397
Hansen K, Q., Buch, E., and U. Gregersen (eds.) 2004. Weather, Sea and Ice Conditions – Offshore West Greenland. Focussing on New Licence Areas, 2004. Greenland Bureau of Minerals and Petroleum. Danish Meteorological Institute, Copenhagen, 2004.
Heide-Jørgensen, M.P. & Laidre, K. 2006. Bowhead whales and oil exploration and drilling in West Greenland. – Greenland Institute of Natural Resources.
Heide-Jørgensen, M.P. & Reeves, R.R. 1996. Evidence of a decline in beluga, Delphinapterus leucas, abundance off West Greenland. ICES J. Mar. Sci. 53: 61–72.
Heide-Jørgensen, M.P., Richard, P., Dietz, R., Laidre, K.L., Orr, J. & Schmidt, H.C. 2003b. An estimate of the fraction of belugas (Delphinapterus leucas) in the Canadian high Arctic that winter in West Greenland. Polar Biology 26: 318–326.
Hirst, A.G. and Rodhouse, P.G., 2000. Impacts of geophysical seismic surveying on fishing success. Reviews in Fish Biology and Fisheries, 10, 113-118.
Hovgaard, H. & S. Christensen 1990: Population Structure and Migration Patterns of Atlantic Cod (Gadus morhua) in West Greenland Waters Based on Tagging Experiments from 1946 to 1964. NAFO Sci. Coun. Studies 14: 45–50.
IMO. 1992. MARPOL 73/78. Consolidated Edition, 1991. IMO (International Maritime Organisation), London 1992.
International Association of Geophysical Contractors. 1994. Environmental Guidelines for Worldwide Geophysical Contractors.

DISKO WEST BLOCKS 4 & 6 SEISMIC SURVEY PEIA REFERENCES AND BIBLIOGRAPHY
10-3
JNCC (2004) Guidelines for Minimising Acoustic Disturbance to Marine Mammals from Seismic Surveys.
Kapel, F.O. 1979: Exploitation of large whales in West Greenland in the twentieth century. Rep. Int. Whal. Commn 29: 197–214.
Kapel, F.O. 1995. Feeding ecology of harp and hooded seal in the Davis Strait – Baffin Bay region. In: Blix AS, Walløe L and Ulltang Ø (eds) Whales, seals and man, pp 287-304. – Developments in Marine Biology 4, Elsevier.
Kapel, F.O. 1996. Recoveries in Greenland, 1949-94, of tagged or branded harp and hooded seals. NAFO Scientific Council Studies 26: 87–99.
Kapel, F.O. & Rosing-Asvid, A. 1996. Seal hunting statistics for Greenland 1993 and 1994, according to a new system of collecting information, compared the previous lists-of-game. NAFO Sci. Coun. Studies 26: 71–86.
Kosheleva, V. 1992. The impact of airguns used in marine seismic exploration on organisms living in the Barents Sea. Fisheries and Offshore Petroleum Exploitation. 2nd International Conference, Bergen, Norway. 6–8 April.
Kostyvchenko, L.P. 1973. Effect of elastic waves generated in marine seismic prospecting on fish eggs in the Black Sea. Hydrobiological Journal 9 (5), 72–75.
La Bella, G., Froglia, C., Ratti, S. & Rivas, G. 1996. First Assessment of Effects of Air-Gun Seismic Shooting on Marine Resources in the Central Adriatic Sea. Society of Petroleum Engineers Technical Paper. SPE 35782.
Laidre, K. L. and M. P. Heide-Jørgensen. 2005. Arctic sea ice trends and narwhal vulnerability. Biological Conservation 121:509-517
Løkkeborg, S. 1991. Effects of a Geophysical Survey on catch success in longline fishing. ICES.CM.1991/B:40,1-9.
Løkkeborg, S. & Soldal, A.V. 1993. The influence of seismic exploration with airguns on cod (Gadus morhua) behaviour and catch rates. ICES J. Mar. Sci., Symp. 196.
Matishov, G.G. 1992. The reaction of bottom-fish larvae to airgun pulses in the context of the vulnerable Barents Sea ecosystem. Fisheries and Offshore Petroleum Exploitation 2nd International Conference, Bergen, Norway, 6–8 April 1992.
McCauley, R.D. 1994. Environmental implications of offshore oil and gas development in Australia – seismic surveys. Australian Institute of Marine Science, Townsville, Queensland. 121 pp.
Merkel, F.R., Jamieson, S.E., Falk. K. & Mosbech, A. 2007. – The diet of common eiders wintering in Nuuk, Southwest Greenland. Polar Biology 30: 227–234.
Mosbech, A., Boertmann. D., Nymand, J., Riget, F. & Acquarone M, 1998. The Marine Environment in Southwest Greenland. Biological resources, resource use and sensitivity to oil spill. – National Environmental Research Institute, Denmark. NERI Technical Report 236. 205 pp.

DISKO WEST BLOCKS 4 & 6 SEISMIC SURVEY PEIA REFERENCES AND BIBLIOGRAPHY
10-4
Mosbech, A., Boertmann, D., Olsen, B. Ø., Olsvig, S., von Platen, F., Buch, E., Hansen, K.Q., Rasch, M., Nielsen, N., Møller, H. S., Potter, S., Andreasen, C., Berglund, J. & Myrup, M. 2004: Environmental Oil Spill Sensitivity Atlas for the West Greenland (68º-72º N) Coastal Zone. National Environmental Research Institute, Denmark. 442 pp. – NERI Technical Report no. 494 (CD-ROM). http://environmental-atlas.dmu.dk/
Mosbech, A., Boertmann, D. & Jespersen, M. 2007a: Strategic Environmental Impact Assessment of hydrocarbon activities in the Disko West area. National Environmental Research Institute, University of Aarhus. 188 pp. NERI technical report no. 618. http://www.dmu.dk/Pub/FR618.pdf
Mosbech, A., Hansen, A.B., Asmund, G., Dahllöf, I., Petersen, D.G. & Strand, J. 2007 (b). A chemical and biological study of the impact of a suspected oil seep at the coast of Marraat, Nuussuaq, Greenland - With a summary of other environmental studies of hydrocarbons in Greenland. National Environmental Research Institute, University of Aarhus, Denmark. 56 pp. - NERI Technical Report no 629. http://www.dmu.dk/Pub/FR629.pdf
NERI. 2000. Preliminary Environmental Impact Assessment of Regional Offshore Seismic Surveys in Greenland. 2nd Edition. Research Notes from NERI No. 132. Ministry of Environment and Energy, National Environmental Research Institute. 25pp.
Pedersen, S.A. & F. Riget 1993: Feeding habits of redfish (Sebastes spp.) and Greenland halibut (Reinhardtius hippoglossoides) in West Greenland waters. ICES J. Mar. Sci. 50 : 445–459.
Pedersen, S.A. & Smidt, E.L.B. 2000. Zooplankton distribution and abundance in West Greenland waters 1950-1984. Journal of Northwest Atlantic Fishery Science 26: 45–102.
Pedersen, S.A., Ribergaard, M. & Simonsen, C. 2005. Micro- and mesoplankton in Southwest Greenland waters in relation to environmental factors. Journal of Marine Systems 56: 85–112.
Riget, F., Dietz, R., Møller, P., Glasius, M., Pallsbøl, P. & Hobson, K. 2002. Population structure of West Greenland narwhals. A multidisciplinary approach. – National Environmental Research Institute, Denmark, NERI Technical Report 400. http://www2.dmu.dk/1_viden/2_Publikationer- /3_fagrapporter/rapporter/FR400.pdf
Siegstad, H., Neve, P.B., Heide-Jørgensen & Härkönen, T. 1998. Diet of the ringed seal (Phoca hispida) in Greenland. Pp. 229-241 in Heide- Jørgensen, M.P. & Lydersen, C. (eds), Ringed seals in the North Atlantic. NAMMCO Scientific Publications 1.
Simonsen, C., Munk, P. Folkvord, A., Pedersen, S.a. 2006. Feeding ecology of Greenland halibut and sandeel larvae off West Greenland. – Marine Biology DOI 10.1007/s00227-005-0172-5.
Söderkvist, J., Nielsen, T.G. & Jespersen, M., 2006. Physical and biological oceanography in West Greenland waters with emphasis on shrimp and fish larvae distribution. – NERI Technical Report, No. 581.
DISKO WEST BLOCKS 4 & 6 SEISMIC SURVEY PEIA REFERENCES AND BIBLIOGRAPHY
10-5
Sørensen, E.F. 1985: Ammassat ved Vestgrønland. – Greenland Fisheries and Environmental Research Institute. 82 pp.
Statistics Greenland 2006. Statistisk Årbog. – Greenland Home Rule Government
Statistics Greenland 2007. Statistisk Årbog. – Greenland Home Rule Government.
Steffe, A. & Murphy, J. 1992. Offshore prawn catches in the Newcastle region, May to November 1991. Fisheries Research Institute, NSW, Australia.
Stone, CJ & Tasker, M.L. 2006. The effects of seismic airguns on cetaceans in UK waters. J. Cetacean Res. Manage. 8(3): 255-263.
Stone, C.J. 2006. Marine mammal observations during seismic surveys in 2001 and 2002. JNCC Report 359. 110 pp.
Southall, B.L. 2007. Aquatic Mammals. 33 (4) Various articles.
Taylor, M.K., Seeglook, A., Andriashek, D., Barbour, W., Born, E.W., Calvert, W., Cluff, H.D., Ferguson, S., Laake, J., Rosing-Asvid, A., Stirling, I., & Messier, F. 2001. Delineating Canadian and Greenland polar bears (Ursus maritimus) populations by cluster analysis of movements. Canadian Journal of Zoology 79: 690–709.
Teilmann, J. & Dietz, R. 1994. Status of the Harbour seal, Phoca vitulina, in Greenland. Canadian Field-Naturalist 108 (2): 139–155.
Turnpenny, A. & Nedwell, J. 1994. The effects on marine fish, diving mammals and birds of underwater sound generated by seismic surveys. Fawley Aquatic Research Laboratories Ltd.
Webb, A. & Durinck, J. 1992. Counting birds from ship. In: Manual for aeroplane and ship surveys of waterfowl and seabirds. Eds. J. Komdeur, J. Bertelsen & G. Cracknell. IWRB Spec. Publ. No. 19: 24-37.
Webb, C.L.F. & Kempf, N.J. 1998. The Impact of Shallow-water Seismic in Sensitive Areas. Society of Petroleum Engineers Technical Paper. SPE 46722.
Zarudzki, E.F.K. 1980: Interpretation of shallow seismic profiles over the continental shelf in West Greenland between latitudes 64° and 69°30´N. Rapport Grønlands Geologiske Undersøgelse 100, 58–61.


DISKO WEST BLOCKS 4 & 6 SEISMIC SURVEY PEIA APPENDICES
A-1
APPENDICES

DISKO WEST BLOCKS 4 & 6 SEISMIC SURVEY PEIA APPENDICES
A-2
Appendix A: Abbreviations bHp brake horse power CO carbon monoxide CO2 carbon dioxide CO3
2- carbonate dB decibels DGPS differential global positioning system DNV Det Norske Veritas EC European Community EIA environmental impact assessment EMS environmental management system E & P exploration and production EPS environmental protection strategy ERT Environment and Resource Technology Limited EWP environmental work programme GESAMP joint group of experts on the scientific aspects of marine pollution GPS global positioning system HC hydrocarbon Hz hertz IAGC International Association of Geophysical Contractors IMO International Maritime Organisation ISO International Standards Organisation IUCN World Conservation Union kW kilowatt LARSE Los Angeles Regional Seismic Experiment LL long life MARPOL International Convention for the Prevention of Pollution from Ships MOB Man Overboard MRS Maritime Registry of Shipping ms millisecond MSDS material safety data sheet NOx nitrogen oxides ppm parts per million ppt parts per thousand PSA production sharing agreement psi pounds per square inch PTS permanent threshold shifts SEIA seismic environmental impact assessment SO2 sulphur dioxide SOLAS safety of life at sea SOx sulphur oxides TTS temporary threshold shifts UKOOA United Kingdom Offshore Operators Association UNDP United Nations Development Programme µPa micro Pascals 3D three-dimensional 2D two-dimensional


![pp.ipd.kit.edu · Elementary blocks A statement consists of a set of elementary blocks blocks : Stmt → P(Blocks) blocks([x := a]!)={[x := a]!} blocks([skip]!)={[skip]!} blocks(S1;S2](https://img.pdfslide.us/doc/110x75/5e812e885fca162f91121c3f/ppipdkitedu-elementary-blocks-a-statement-consists-of-a-set-of-elementary-blocks.jpg)