Embed Size (px)
Citation preview
Blis insights:
The influence of location on cross-screen advertising
November 2015
Key insights into how location influences the way, where and when consumers engage with cross-screen advertising
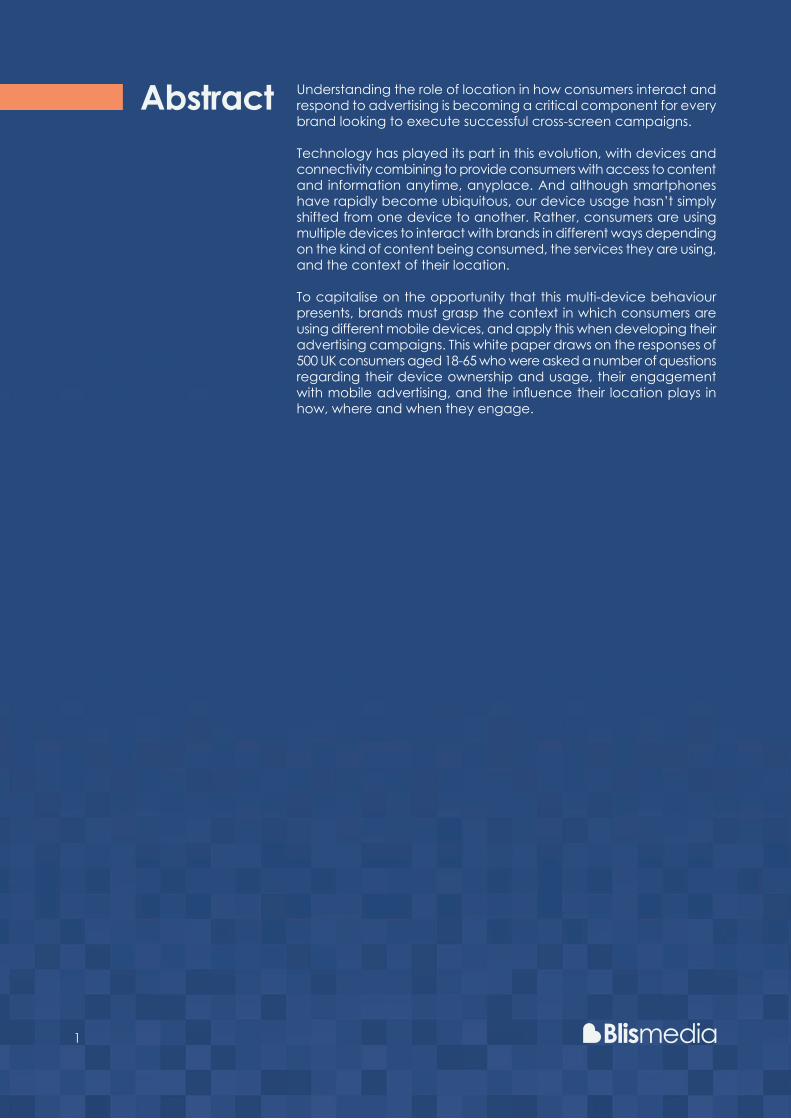
Abstract Understanding the role of location in how consumers interact and respond to advertising is becoming a critical component for every brand looking to execute successful cross-screen campaigns.
Technology has played its part in this evolution, with devices and connectivity combining to provide consumers with access to content and information anytime, anyplace. And although smartphones have rapidly become ubiquitous, our device usage hasn’t simply shifted from one device to another. Rather, consumers are using multiple devices to interact with brands in different ways depending on the kind of content being consumed, the services they are using, and the context of their location.
To capitalise on the opportunity that this multi-device behaviour presents, brands must grasp the context in which consumers are using different mobile devices, and apply this when developing their advertising campaigns. This white paper draws on the responses of 500 UK consumers aged 18-65 who were asked a number of questions regarding their device ownership and usage, their engagement with mobile advertising, and the influence their location plays in how, where and when they engage.
1

Introduction The UK advertising industry is at an important crossroads as changing consumer habits redefine the way advertising is created, targeted and consumed. The first great change is happening right now, with the UK becoming the first country in the world where the spend on digital advertising accounts for half of all advertising - £8.1bn of the £16.2bn forecast for the whole of 20151.
A second great change is also well underway, as UK consumers eschew their desktops and laptops for smartphones and tablets as their main means of accessing the Internet and consuming media. By 2018, research firm eMarketer expects more than half of Britons to own an iPad, Kindle or similar tablet device2 – that’s on top of the 72% of the population who already own a smartphone3. This means that not only have consumers embraced mobile, but that they are comfortable shifting between different kinds of devices depending on context, location and mood. It’s understanding this cross-device usage that is crucial if brands and advertisers are to deliver relevant and successful campaigns.
It’s clear that mobile advertising is the fastest growing subset of this digital advertising spend. The $101.37 billion expected to be spent on mobile advertising worldwide next year is more than a four-fold increase on 20134. So it makes sense that as consumption changes, so too does the whole approach behind the advertising consumers see. It has become more important than ever for advertisers to reach their target audience on multiple mobile devices, at home, at work or on the move - in real-world locations.
In this white paper we have sought to find answers to these questions around location and cross-device usage in order to give brands and agencies insight into how best to serve consumers as they shift between different devices. This white paper is based on extensive consumer research designed to explore how consumers engage with brands over multiple devices, and the preferred locations and context in which they choose to do so.
1 http://www.emarketer.com/Article/UK-Achieve-World-First-Half-of-Media-Ad- Spend-Goes-Digital/10122802 http://www.theguardian.com/media/2014/jul/01/mobile-advertising-overtake- print-industry3 http://www.statista.com/statistics/257051/smartphone-user-penetration-in-theuk/4 http://www.emarketer.com/Article/Mobile-Ad-Spend-Top-100-Billion-Worldwide- 2016-51-of-Digital-Market/1012299#sthash.CDGaMMSb.dpuf
2
Methodology
Key insights
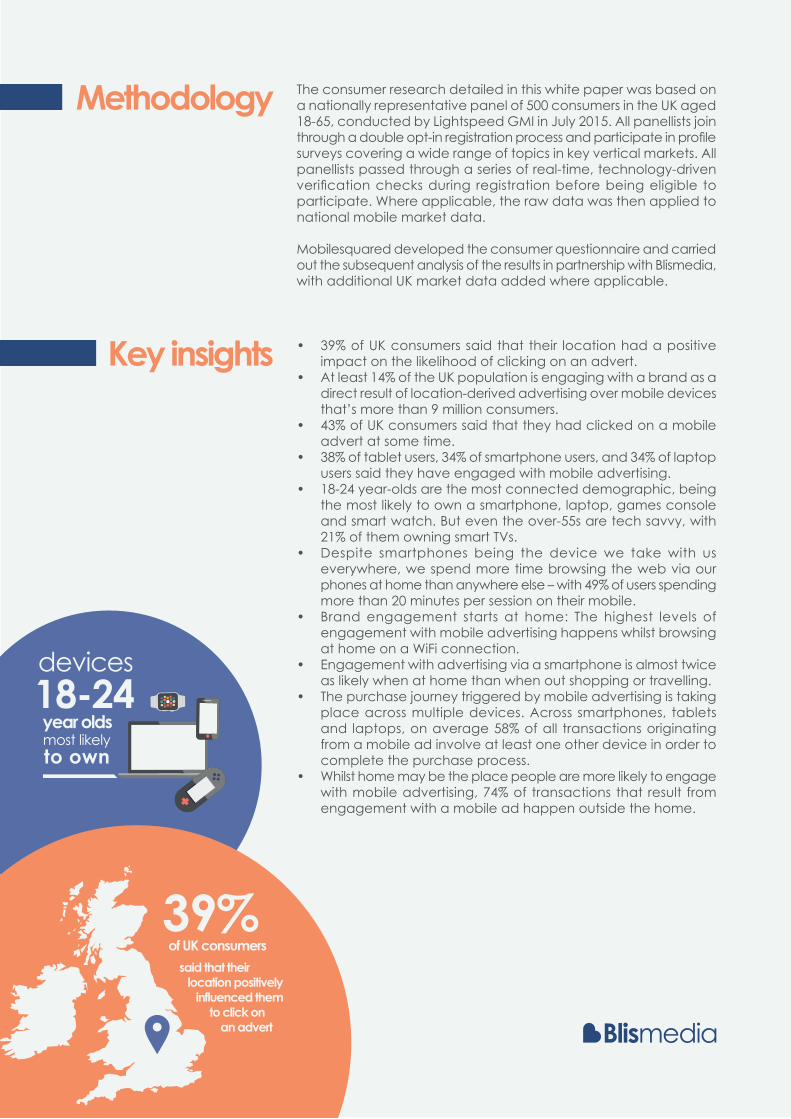
The consumer research detailed in this white paper was based on a nationally representative panel of 500 consumers in the UK aged 18-65, conducted by Lightspeed GMI in July 2015. All panellists join through a double opt-in registration process and participate in profile surveys covering a wide range of topics in key vertical markets. All panellists passed through a series of real-time, technology-driven verification checks during registration before being eligible to participate. Where applicable, the raw data was then applied to national mobile market data.
Mobilesquared developed the consumer questionnaire and carried out the subsequent analysis of the results in partnership with Blismedia, with additional UK market data added where applicable.
• 39% of UK consumers said that their location had a positive impact on the likelihood of clicking on an advert.
• At least 14% of the UK population is engaging with a brand as a direct result of location-derived advertising over mobile devices that’s more than 9 million consumers.
• 43% of UK consumers said that they had clicked on a mobile advert at some time.
• 38% of tablet users, 34% of smartphone users, and 34% of laptop users said they have engaged with mobile advertising.
• 18-24 year-olds are the most connected demographic, being the most likely to own a smartphone, laptop, games console and smart watch. But even the over-55s are tech savvy, with 21% of them owning smart TVs.
• Despite smartphones being the device we take with us everywhere, we spend more time browsing the web via our phones at home than anywhere else – with 49% of users spending more than 20 minutes per session on their mobile.
• Brand engagement starts at home: The highest levels of engagement with mobile advertising happens whilst browsing at home on a WiFi connection.
• Engagement with advertising via a smartphone is almost twice as likely when at home than when out shopping or travelling.
• The purchase journey triggered by mobile advertising is taking place across multiple devices. Across smartphones, tablets and laptops, on average 58% of all transactions originating from a mobile ad involve at least one other device in order to complete the purchase process.
• Whilst home may be the place people are more likely to engage with mobile advertising, 74% of transactions that result from engagement with a mobile ad happen outside the home.
39%of UK consumers
18-24year olds
devices
most likely to own
said that their location positively influenced them to click on an advert
Executive summary
Mobile is the medium brands are turning to, to drive consumer engagement. Our research shows that 43% of UK consumers said that they have clicked on a mobile advert and we know that figure is only going to increase. Contextual relevance has been one of the elements that splits mobile from other mediums. But it is the influence of location that truly separates mobile from all other channels in terms of how it informs our understanding of cross-device behaviour.
The UK is a mobile nation, and consumers have never been more connected. Almost three-quarters of the UK have a smartphone, and our research reveals a similar number have a laptop, and 50% own a tablet. This means our connectedness is not tied down to any-one location, and even not to one device.
Our research confirms what we already know: At least 14% of the UK population is engaging with a brand as a direct result of location-derived advertising over mobile devices. That’s more than nine million consumers!
Another telling statistic from our research is that 39% of UK consumers said that their location had a positive impact on the likelihood of brand engagement (in this case clicking on an ad).
But location advertising is not just about serving a contextually relevant ad in real-time. It’s about understanding an individual’s behaviour from the moment they step out of their home, to go to work, to play sport or socialise, to when they return home.
These movements provide insight that generates the data that ultimately delivers personalised brand engagement opportunities. What we now have a better understanding of, are what devices people use at the various locations that influence their daily movements, not to mention the length of their typical browsing sessions at each spot.
Home is the hub for our connectedness and the starting point for our brand engagement journey. Our research reveals that we spend more time browsing the web via our smartphones at home than anywhere else – with 49% of users spending more than 20 minutes per session on their mobile.
Not surprisingly, this has a direct impact on brand engagement, with the highest levels of engagement with mobile advertising happening whist browsing at home on a WiFi connection. In fact, brand engagement via advertising on a smartphone is almost twice as likely whilst at home than when out shopping or travelling.
Yet our research tells us that 74% of transactions started from clicking on a mobile ad, are completed outside of the home. Not only that, but the purchase journey triggered by mobile advertising is taking place across multiple devices. On average, 58% of all transactions originating from a mobile ad involve at least one other mobile device in order to complete the purchase process.
Mobile advertising is no longer about serving an ad that is contextually relevant. It is about serving an ad that is relevant to the app or browsing session length, the device being used allied to the user’s movements.
It is up to us to ensure that the next nine million consumers engage with a brand based on their movements.
74% ‘‘ ‘‘of transactions started from clicking on a mobile ad are completed outside of the home
4
It’s official: The UK is now a smartphone-first society. Research by UK telcoms regulator Ofcom found that two-thirds of the population now own a smartphone, and for the first time they have overtaken laptops as the preferred device for accessing the internet. This means that brands’ activities must reflect the dominance that mobile exerts on online usage, but also understand that laptops, tablets and even desktop computers are still important devices when it comes to the time we spend online.
Blismedia’s own findings not only support Ofcom’s, but additionally show that UK consumers view their smartphone as the most important connected device they own. Across all demographics, the smartphone was unanimously chosen by our sample group as their number one device. There was also no disagreement between different demographics over their second and third most preferred devices, which was the laptop and tablet respectively. This represents a direct correlation between the degree of usage of each device, and how important they were to the user.
Of course, the way people use devices is heavily dependent on context - the where, when and why. When it comes to creating effective advertising campaigns, understanding the influence location plays on consumer behaviour is essential in order to deliver the right creative at the right time. Although the UK consumers we questioned clearly view the smartphone as their primary device, there is a strong crossover of users owning multiple devices, and using them in different ways.
The UK is now a
smartphone-first society
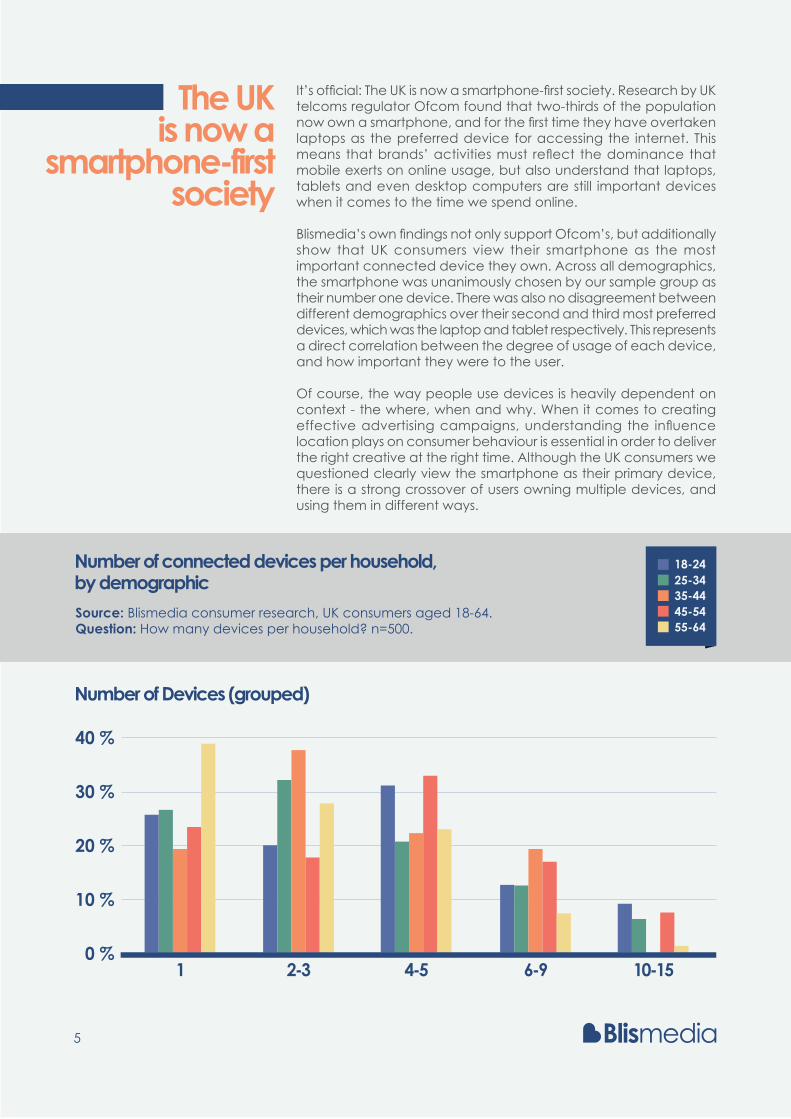
Number of connected devices per household, by demographic
Number of Devices (grouped)
Source: Blismedia consumer research, UK consumers aged 18-64. Question: How many devices per household? n=500.
1 2-3 4-5 6-9 10-150 %
10 %
20 %
30 %
40 %
5
As the previous chart shows, the majority of UK households now own several different devices that they use to browse the web and consume content. This shows that consumers are perfectly happy to transition to different devices depending on where they are and what they are doing; in fact, this context-dependant usage is a big reason why people choose to own multiple devices in the first place. As we’ll examine later, larger screened devices like laptops and tablets are hugely favoured for browsing whilst at home and at static locations, where both the ability to connect over Wi-Fi rather than 3G or 4G supports much longer session times.
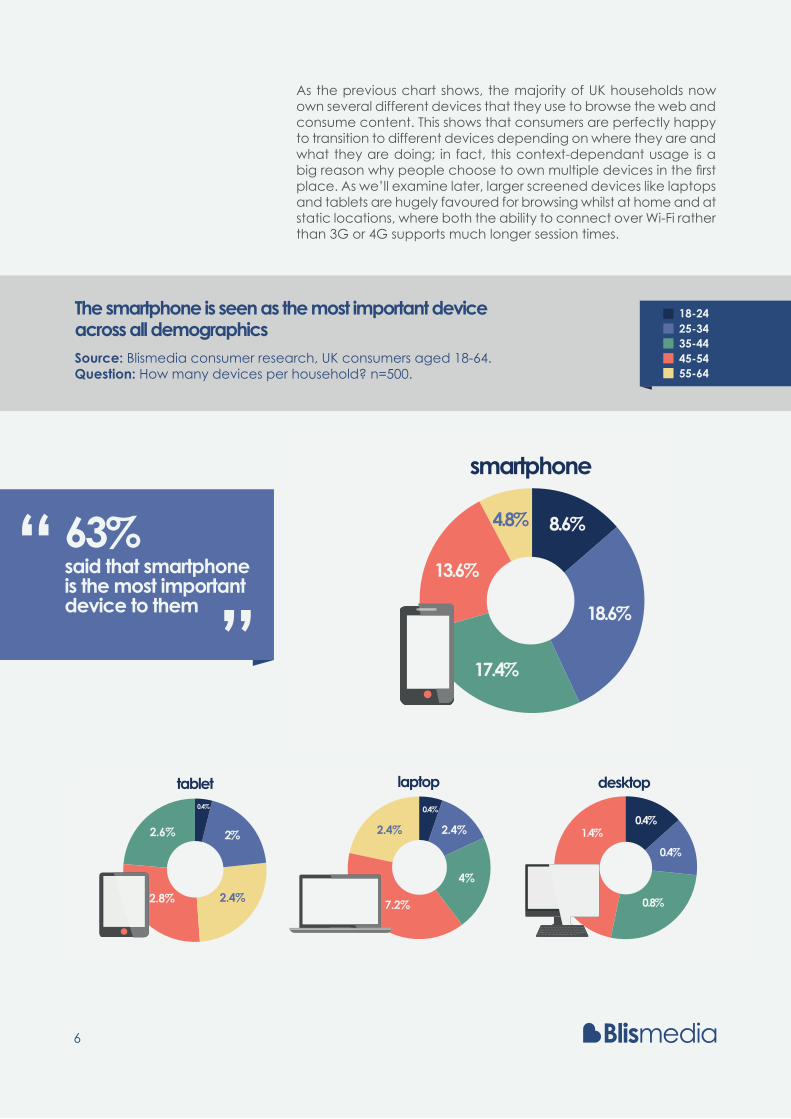
The smartphone is seen as the most important device across all demographicsSource: Blismedia consumer research, UK consumers aged 18-64. Question: How many devices per household? n=500.
smartphone tablet
laptop
4.8% 8.6%
13.6%
18.6%
17.4%
2%
2.4%
2.6%
2.8%
0.4%
0.4%
2.4%2.4%
4%
7.2%
0.4%
0.8%
1.4%0.4%
desktop
smartphone tablet
laptop
4.8% 8.6%
13.6%
18.6%
17.4%
2%
2.4%
2.6%
2.8%
0.4%
0.4%
2.4%2.4%
4%
7.2%
0.4%
0.8%
1.4%0.4%
desktopsmartphone tablet
laptop
4.8% 8.6%
13.6%
18.6%
17.4%
2%
2.4%
2.6%
2.8%
0.4%
0.4%
2.4%2.4%
4%
7.2%
0.4%
0.8%
1.4%0.4%
desktop
6
63% ‘‘ ‘‘said that smartphone is the most importantdevice to them
8%
14%
30%28%
22%
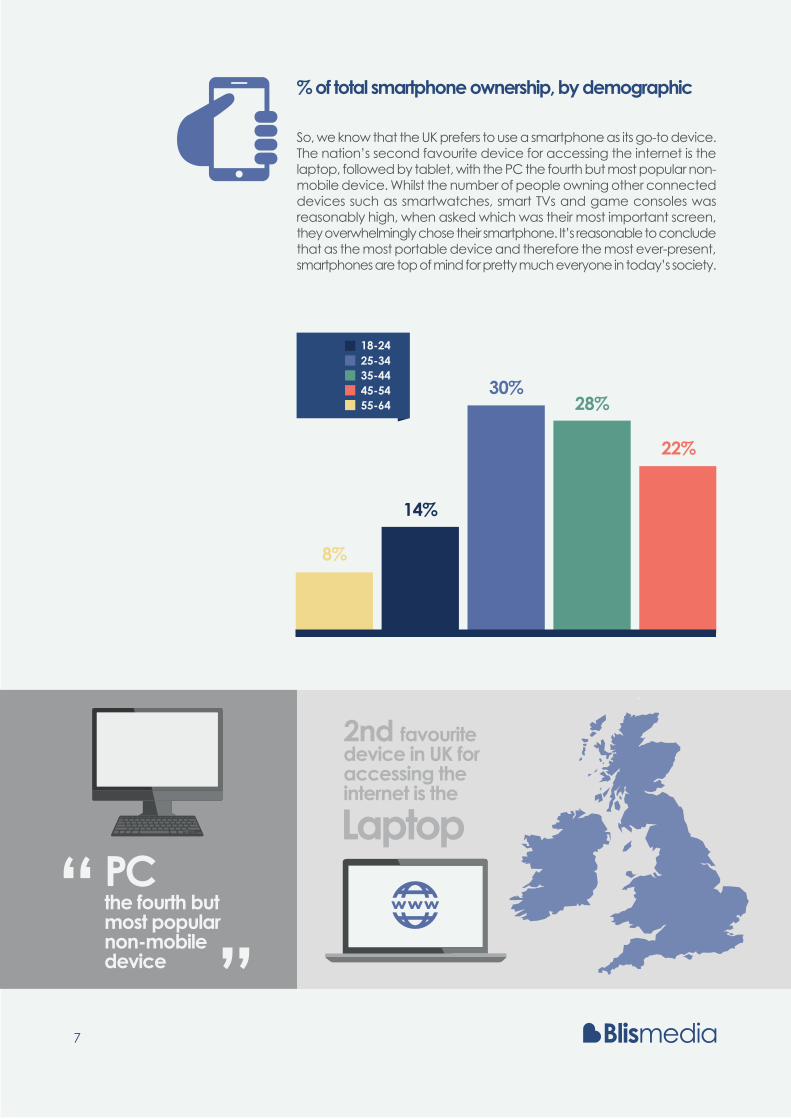
So, we know that the UK prefers to use a smartphone as its go-to device. The nation’s second favourite device for accessing the internet is the laptop, followed by tablet, with the PC the fourth but most popular non-mobile device. Whilst the number of people owning other connected devices such as smartwatches, smart TVs and game consoles was reasonably high, when asked which was their most important screen, they overwhelmingly chose their smartphone. It’s reasonable to conclude that as the most portable device and therefore the most ever-present, smartphones are top of mind for pretty much everyone in today’s society.
% of total smartphone ownership, by demographic
PC‘‘ ‘‘the fourth but most popular non-mobile device
2nd favourite device in UK for accessing the internet is the
Laptop
7
When questioned about how often they engaged with advertising, Tablet users were the most likely to click on an ad, with 38.3% likely to do so, compared to 34% of smartphone users, and 33.6% of laptop users. Of those tablet users, 23% said location-derived contextual information influenced their decision to click on an ad – a higher proportion than both smartphone (17%) and laptop (16.3%) users. The single biggest reason for not engaging with advertising was that it wasn’t relevant to the user, with a general lack of trust in advertising the other most common response. It certainly seems that for those who are happy to click on adverts, the fact that they feel the advertising to have this element of contextual relevancy means that the trust issue is not a problem. To put this into context, if the response of our research group is representative of the UK as a whole, this means that some 8 million smartphone users, 5.3 million laptop users and 4 million tablet users regularly click on advertising. Of course, we’ve already established that there is strong cross-over of users owning multiple devices, but based on the smartphone figure alone, this implies that at least 14% of the UK population is engaging with brands as a direct result of location-derived advertising on a mobile device.
How we are connecting our devices to the internet is also an essential piece of the contextual puzzle. Whilst Wi-Fi has become free in most places, the growth of 4G network coverage means that consumers can get high-speed access more and more easily without the hassle of entering passwords or sifting through Wi-Fi networks. Although the majority of sessions outside of the home are still via 3G, given the rapid uptake of 4G over the last 18 months it could well surpass 3G as the most common type of connection within the next year . This could have big implications for advertising, as faster 4G connections means that more rich media can be used, improving the user experience and allowing for more creative opportunities.
As we would expect, home usage is hugely biased towards Wi-Fi, and this correlates strongly with the use of laptops and the preference for 20-minute plus Dining sessions when at home. Wi-Fi is also the most popular type of connection whilst out shopping or in a bar/café – probably because these types of businesses have an interest in offering customers free Wi-Fi to entice them into the store. but in the remaining top 9 locations for mobile usage, the majority of users claim to use either 3G or 4G networks.
Device type influences
engagement
Connectivity affects context
1 Source: http://media.ofcom.org.uk/news/2015/cmr-uk-2015/2 Source: Mobilesquared
8
wifimobile data
shopping
shopping
commute
commute
office
office
car
car
bus
bus
train
train
airport
airport
airportlounge
airportlounge
cinema
cinema
sportingevent
sportingevent
restaurant
restaurant
bar/cafe
bar/cafe
home
home
0% 0% 40% 60%7.5% 15% 22.5% 30%
9
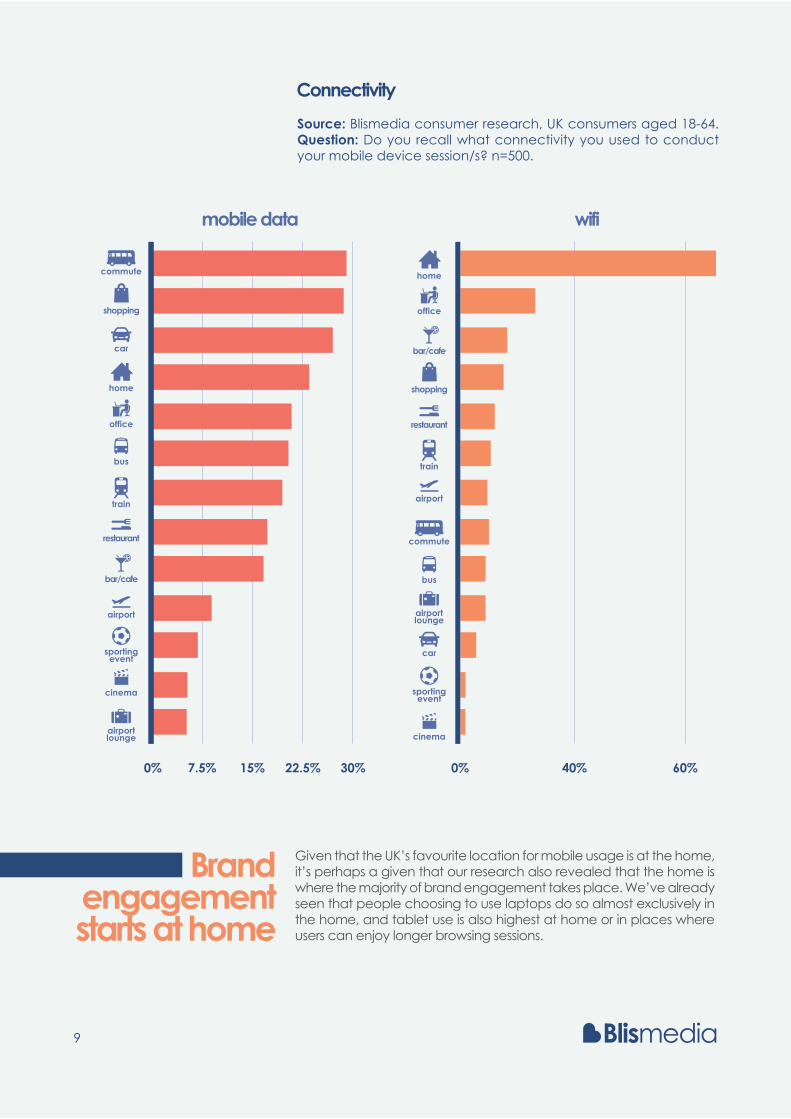
Connectivity
Source: Blismedia consumer research, UK consumers aged 18-64. Question: Do you recall what connectivity you used to conduct your mobile device session/s? n=500.
Given that the UK’s favourite location for mobile usage is at the home, it’s perhaps a given that our research also revealed that the home is where the majority of brand engagement takes place. We’ve already seen that people choosing to use laptops do so almost exclusively in the home, and tablet use is also highest at home or in places where users can enjoy longer browsing sessions.
Brand engagement starts at home
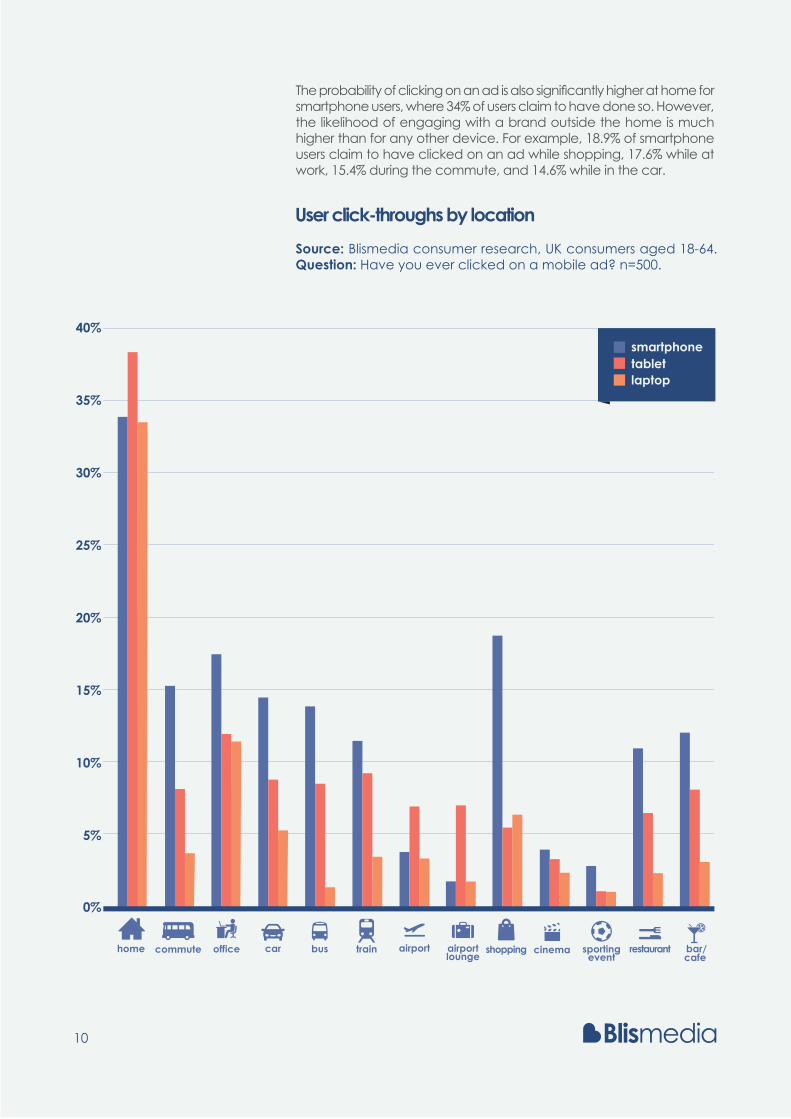
User click-throughs by location
Source: Blismedia consumer research, UK consumers aged 18-64. Question: Have you ever clicked on a mobile ad? n=500.
commute office car bus train airport airportlounge
shopping cinema sportingevent
restaurant bar/cafe
0%
5%
10%
15%
20%
25%
30%
35%
40%
home
10
The probability of clicking on an ad is also significantly higher at home for smartphone users, where 34% of users claim to have done so. However, the likelihood of engaging with a brand outside the home is much higher than for any other device. For example, 18.9% of smartphone users claim to have clicked on an ad while shopping, 17.6% while at work, 15.4% during the commute, and 14.6% while in the car.
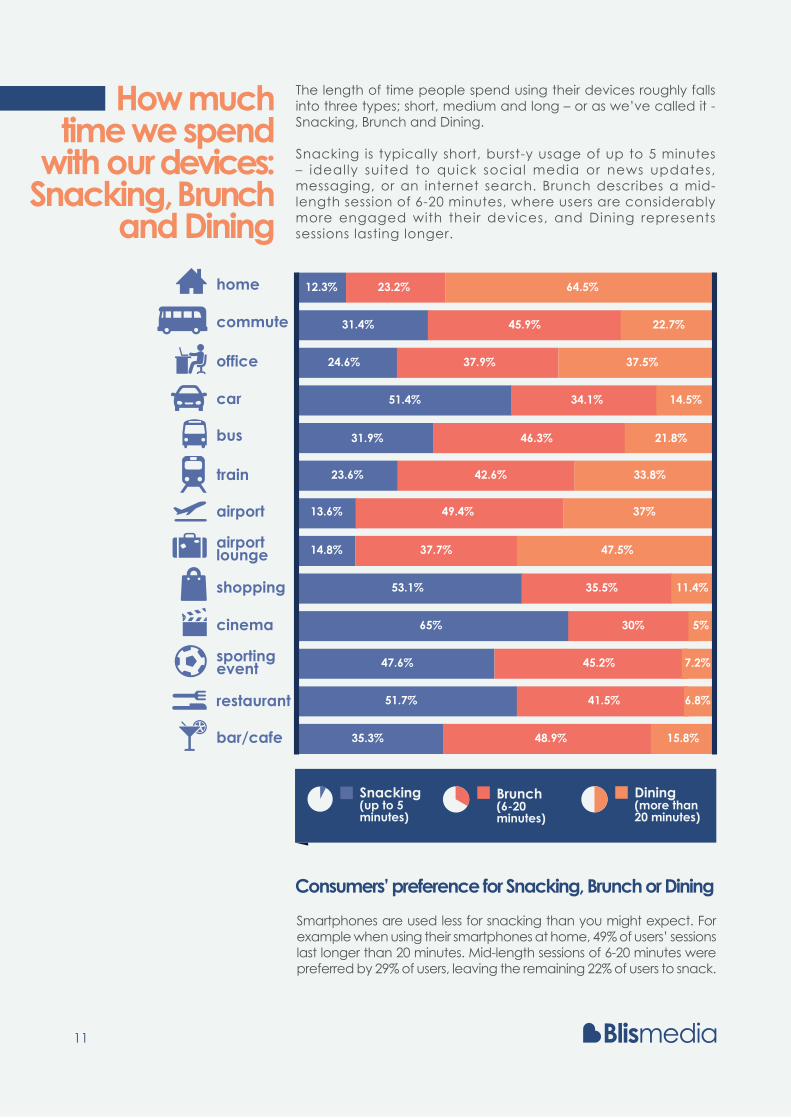
The length of time people spend using their devices roughly falls into three types; short, medium and long – or as we’ve called it - Snacking, Brunch and Dining.
Snacking is typically short, burst-y usage of up to 5 minutes – ideally suited to quick social media or news updates, messaging, or an internet search. Brunch describes a mid-length session of 6-20 minutes, where users are considerably more engaged with their devices, and Dining represents sessions lasting longer.
How much time we spend
with our devices: Snacking, Brunch
and Dining
Consumers’ preference for Snacking, Brunch or Dining
Smartphones are used less for snacking than you might expect. For example when using their smartphones at home, 49% of users’ sessions last longer than 20 minutes. Mid-length sessions of 6-20 minutes were preferred by 29% of users, leaving the remaining 22% of users to snack.
home
commute
office
car
bus
train
airport
airportlounge
shopping
cinema
sportingevent
restaurant
bar/cafe
12.3% 23.2% 64.5%
31.4% 45.9% 22.7%
24.6% 37.9% 37.5%
51.4% 34.1% 14.5%
31.9% 46.3% 21.8%
23.6% 42.6% 33.8%
13.6% 49.4% 37%
14.8% 37.7% 47.5%
53.1% 35.5% 11.4%
65% 30% 5%
47.6% 45.2% 7.2%
51.7% 41.5% 6.8%
35.3% 48.9% 15.8%
11
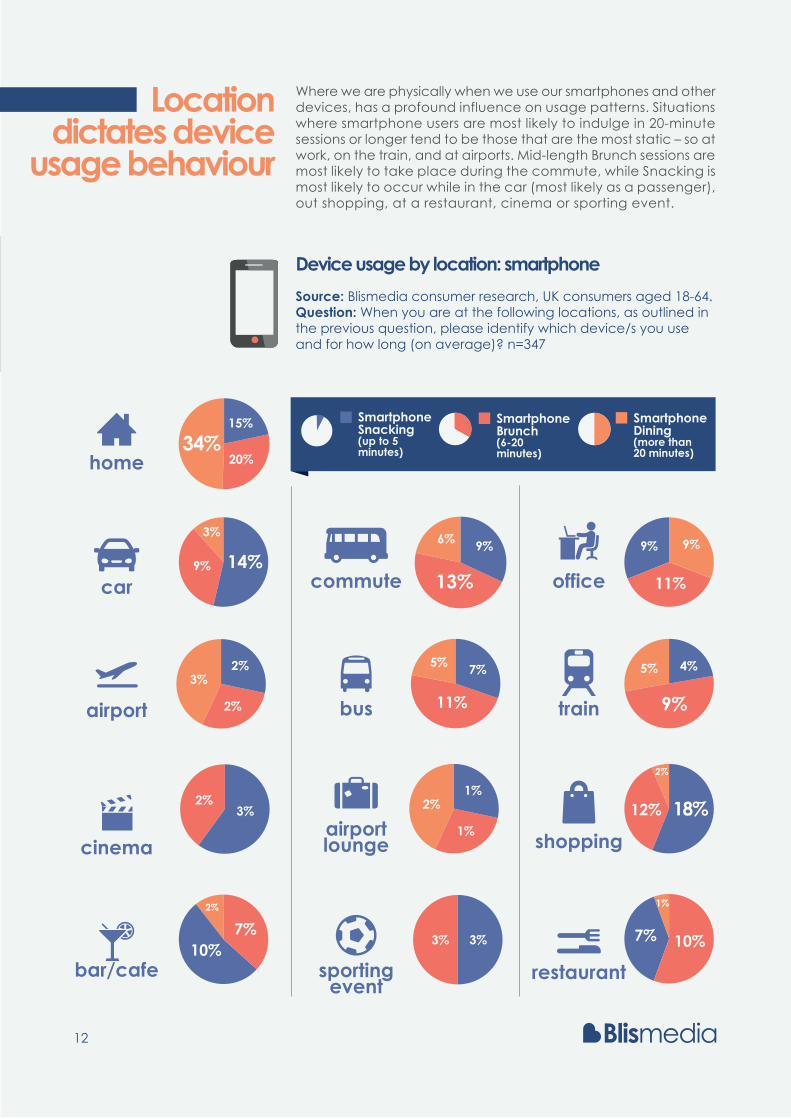
Where we are physically when we use our smartphones and other devices, has a profound influence on usage patterns. Situations where smartphone users are most likely to indulge in 20-minute sessions or longer tend to be those that are the most static – so at work, on the train, and at airports. Mid-length Brunch sessions are most likely to take place during the commute, while Snacking is most likely to occur while in the car (most likely as a passenger), out shopping, at a restaurant, cinema or sporting event.
Location dictates device
usage behaviour
Device usage by location: smartphone
Source: Blismedia consumer research, UK consumers aged 18-64. Question: When you are at the following locations, as outlined in the previous question, please identify which device/s you use and for how long (on average)? n=347
SmartphoneSnacking
SmartphoneBrunch
SmartphoneDining
home
commute officecar
bus trainairport
airportlounge shoppingcinema
sportingevent
restaurantbar/cafe
15%
20%34%
6%
13%
9% 9% 9%
11%14%9%
3%
7%
11%
5% 4%
9%
5%2%
2%
3%
1%
1%
2% 18%12%
2%
3%2%
3% 3% 10%7%
1%
10%7%
2%
SmartphoneDining(more than20 minutes)
SmartphoneSnacking(up to 5minutes)
SmartphoneBrunch(6-20minutes)
12
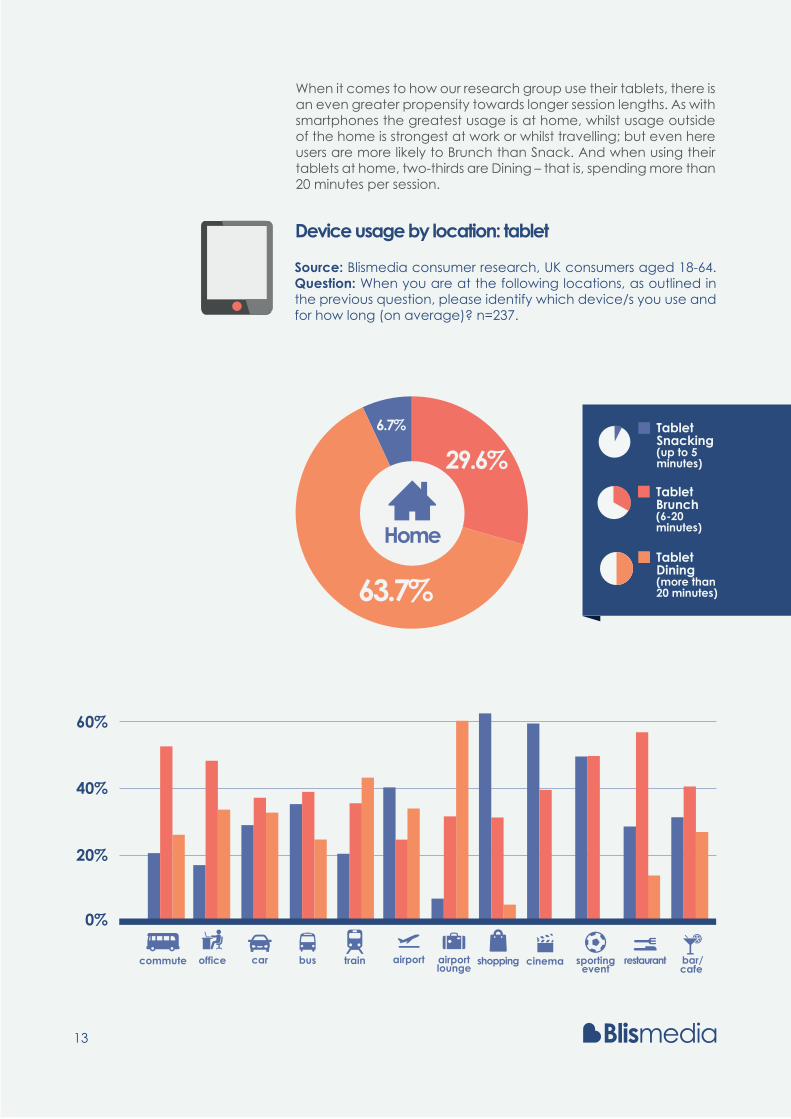
Device usage by location: tablet
Source: Blismedia consumer research, UK consumers aged 18-64. Question: When you are at the following locations, as outlined in the previous question, please identify which device/s you use and for how long (on average)? n=237.
When it comes to how our research group use their tablets, there is an even greater propensity towards longer session lengths. As with smartphones the greatest usage is at home, whilst usage outside of the home is strongest at work or whilst travelling; but even here users are more likely to Brunch than Snack. And when using their tablets at home, two-thirds are Dining – that is, spending more than 20 minutes per session.
63.7%
29.6%
6.7%
Home
SmartphoneSnacking
SmartphoneDining
TabletDining(more than20 minutes)
TabletSnacking(up to 5minutes)
TabletBrunch(6-20minutes)
63.7%
29.6%
6.7%
Home
SmartphoneSnacking
SmartphoneDining
TabletDining(more than20 minutes)
TabletSnacking(up to 5minutes)
TabletBrunch(6-20minutes)
commute office car bus train airport airportlounge
shopping cinema sportingevent
restaurant bar/cafe
0%
20%
40%
60%
80%
13
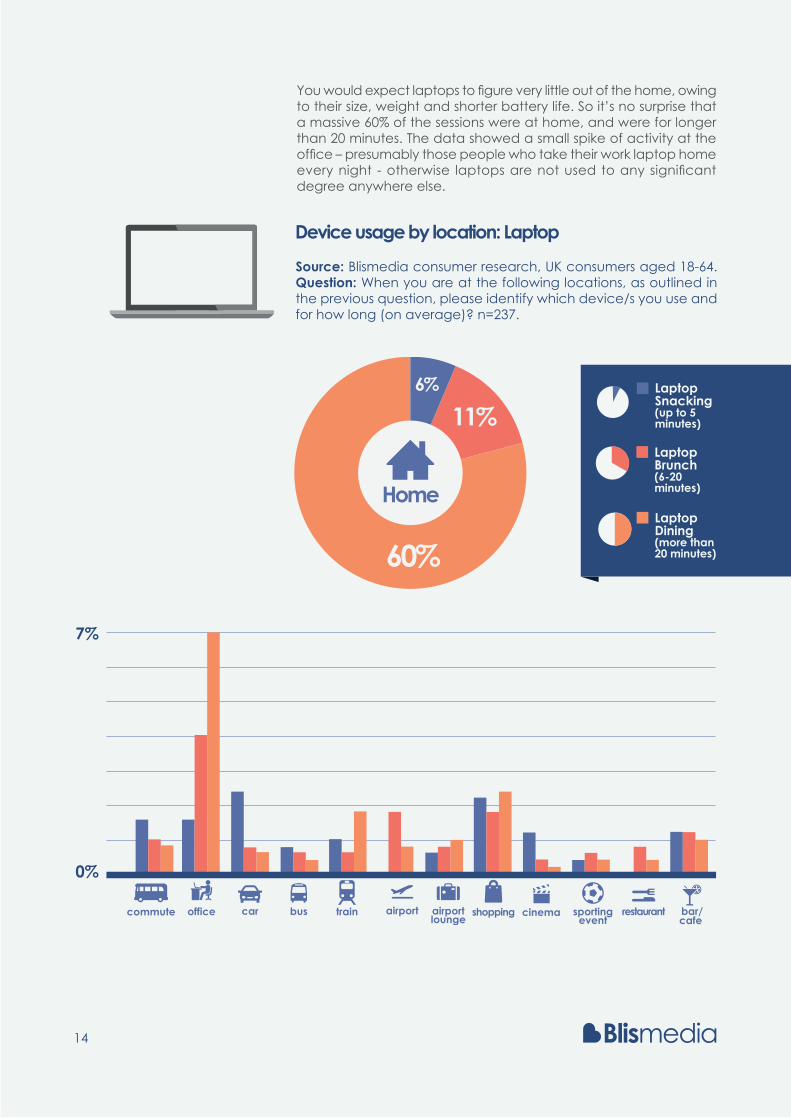
Device usage by location: Laptop
You would expect laptops to figure very little out of the home, owing to their size, weight and shorter battery life. So it’s no surprise that a massive 60% of the sessions were at home, and were for longer than 20 minutes. The data showed a small spike of activity at the office – presumably those people who take their work laptop home every night - otherwise laptops are not used to any significant degree anywhere else.
Source: Blismedia consumer research, UK consumers aged 18-64. Question: When you are at the following locations, as outlined in the previous question, please identify which device/s you use and for how long (on average)? n=237.
commute office car bus train airport airportlounge
shopping cinema sportingevent
restaurant bar/cafe
0%
7%
60%
11%6%
Home
SmartphoneSnacking
SmartphoneDining
LaptopDining(more than20 minutes)
LaptopSnacking(up to 5minutes)
LaptopBrunch(6-20minutes)
60%
11%6%
Home
SmartphoneSnacking
SmartphoneDining
LaptopDining(more than20 minutes)
LaptopSnacking(up to 5minutes)
LaptopBrunch(6-20minutes)
14
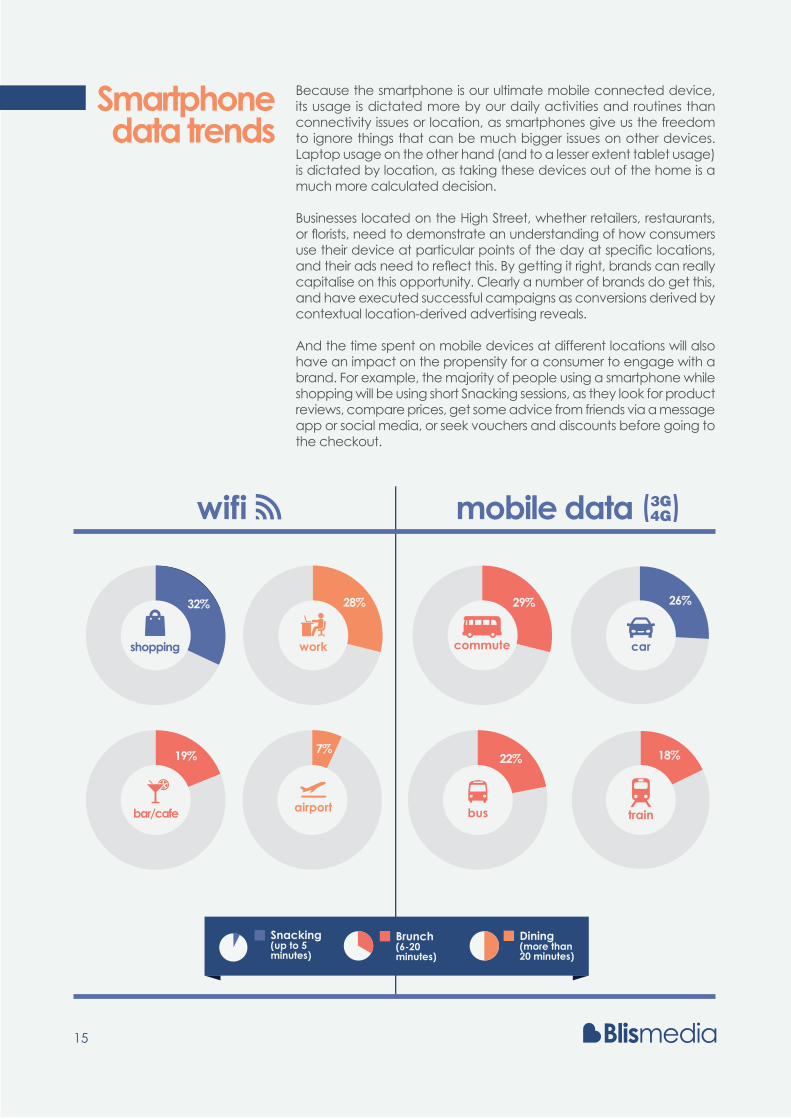
Because the smartphone is our ultimate mobile connected device, its usage is dictated more by our daily activities and routines than connectivity issues or location, as smartphones give us the freedom to ignore things that can be much bigger issues on other devices. Laptop usage on the other hand (and to a lesser extent tablet usage) is dictated by location, as taking these devices out of the home is a much more calculated decision.
Businesses located on the High Street, whether retailers, restaurants, or florists, need to demonstrate an understanding of how consumers use their device at particular points of the day at specific locations, and their ads need to reflect this. By getting it right, brands can really capitalise on this opportunity. Clearly a number of brands do get this, and have executed successful campaigns as conversions derived by contextual location-derived advertising reveals.
And the time spent on mobile devices at different locations will also have an impact on the propensity for a consumer to engage with a brand. For example, the majority of people using a smartphone while shopping will be using short Snacking sessions, as they look for product reviews, compare prices, get some advice from friends via a message app or social media, or seek vouchers and discounts before going to the checkout.
Smartphone data trends
29%
wifi mobile data 3G4G( (
shopping
32%
19% 7%22%
commutework
airportbar/cafe
SmartphoneSnacking
SmartphoneBrunch
SmartphoneDining
Dining(more than20 minutes)
Snacking(up to 5minutes)
Brunch(6-20minutes)
28%
car
26%
bus train
18%
15
Therefore it’s essential not only to understand these behaviours and build an advertising strategy that reflects them, but also to track and measure campaign success in a way that captures these elements of context and location.
Device-by-device analysis based on the top 12 OOH locations, reveals that the average number of smartphone users that will click on an ad is 12.5%, compared to 9.7% of tablet users and 6.3% of laptop users.
Where location comes into its own OOH is the increased mobility of the smartphone coupled with its ease of use, making it the most likely device to engage with a brand via advertising.
By just focusing on mobile-based activity at the 12 OOH locations, on average 10.7% of smartphone users are likely to click on an ad, compared to 7.3% of tablet users, and 4% of laptop users.
Beyond the home, the smartphone is the standout device when it comes to consumers engaging with brands via ads in virtually every location bar the airport lounge as already highlighted.
While the smartphone can be considered the default device, the research revealed that screen size is the determining factor for consumers when deciding which device to use, dependent on their location, the type of service to be used, and the content to be consumed.
12.5% ‘‘ ‘‘is the the average number of smartphone users that will click on an ad
While smartphones dominate activity up to the point of purchase, it’s a somewhat different story once a consumer starts engaging with a brand after clicking on an ad. It’s this stage that best exemplifies how consumers shift between different devices, and why brands need to target multiple devices when developing their campaigns.
SmartphoneWhen asked what action they had taken after engaging with an advert, 20.4% of our research group said they had gone on to make a purchase. 8.6% went into a physical store, and 3.8% downloaded a voucher.
Whilst at home — where almost one-fifth of all smartphone-originated transactions take place — 59% of these purchases that originated on a smartphone are completed on a different device. That figure increases to 65% of purchases happening across different devices once all 12 locations are taken into account.
TabletAlthough fewer consumers in our research group used a tablet, their likelihood of engaging with advertising whilst using the device was much higher than for smartphone users. 24% of all tablet users had a purchase, with 11.7% of users visiting a store, and 5.6% downloading a voucher.
Tablet users are more likely to complete a transaction in the home than smartphone users. There is also a greater propensity to complete the transaction using the same device — 42% on tablets compared to 35% of smartphone users.
Conversion is not a
device thing
16
Conclusion
17
40% ‘‘ ‘‘of total transactions on a laptop originating from an ad were completed on the same device
LaptopOne-third of all purchases on a laptop originating from a mobile ad are completed in the home — representing the highest transaction conversion across all the devices we looked at. 40% of total transactions on a laptop originating from an ad were completed on the same device.
While the UK may now be officially recognised as a smartphone society, cross-device activity is prevalent and presenting brands with the opportunity to deliver content to a particular device at any given location.
Across the three devices, on average 58% of all transactions originating from a mobile ad involve at least one other device in order to complete the purchase process. Furthermore, 74% of transactions originating from a mobile ad take place beyond the home.
The data confirms that consumers are using multiple devices at a variety of locations to engage with brands. What’s more, mobile advertising is clearly influencing their decision-making process. Simply put, location drives engagement via cross-device advertising.
91%
66%
66%
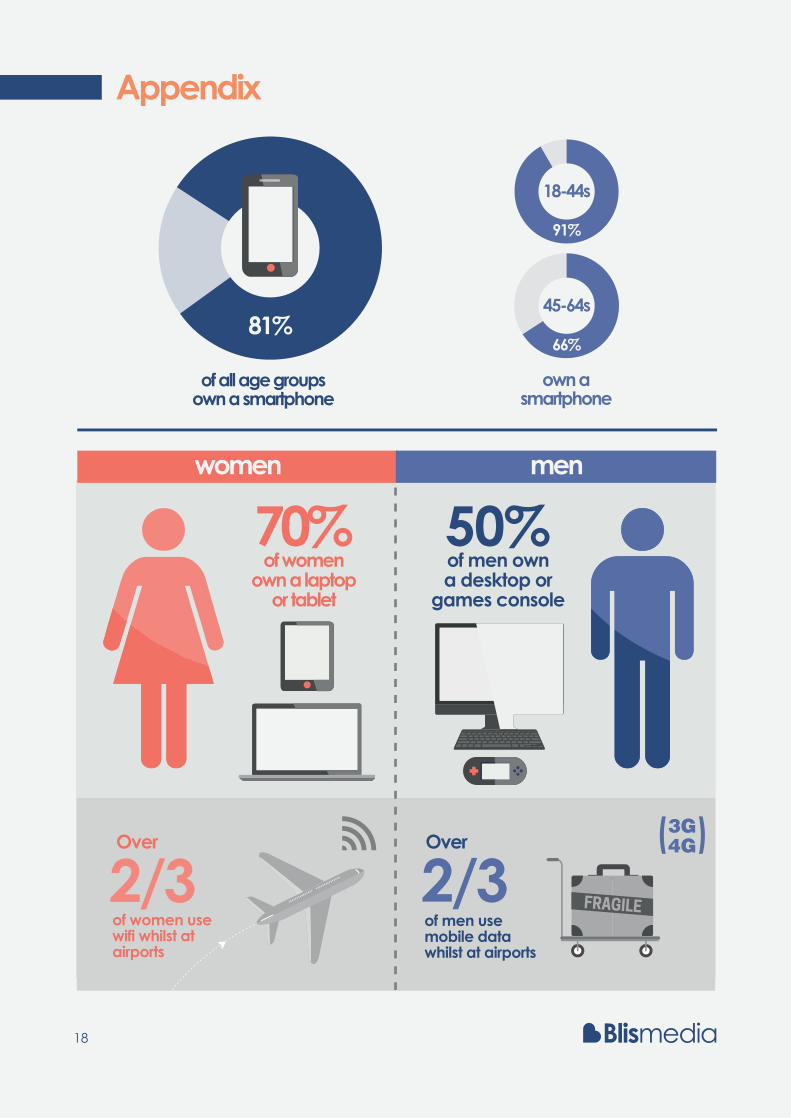
81%
18-44s
45-64s
own asmartphone
of all age groupsown a smartphone
women men
of womenown a laptop
or tablet
70%of men owna desktop or
games console
50%
2/3of men usemobile datawhilst at airports
3G4G( (Over Over
2/3of women usewifi whilst atairports
18
Appendix
infographic placeholder
18-24
25-34
35-44
45-54
55-64
Device ownership distribution similar to 25-34 group,but lower percentage-wise for every device bar thesmartphone
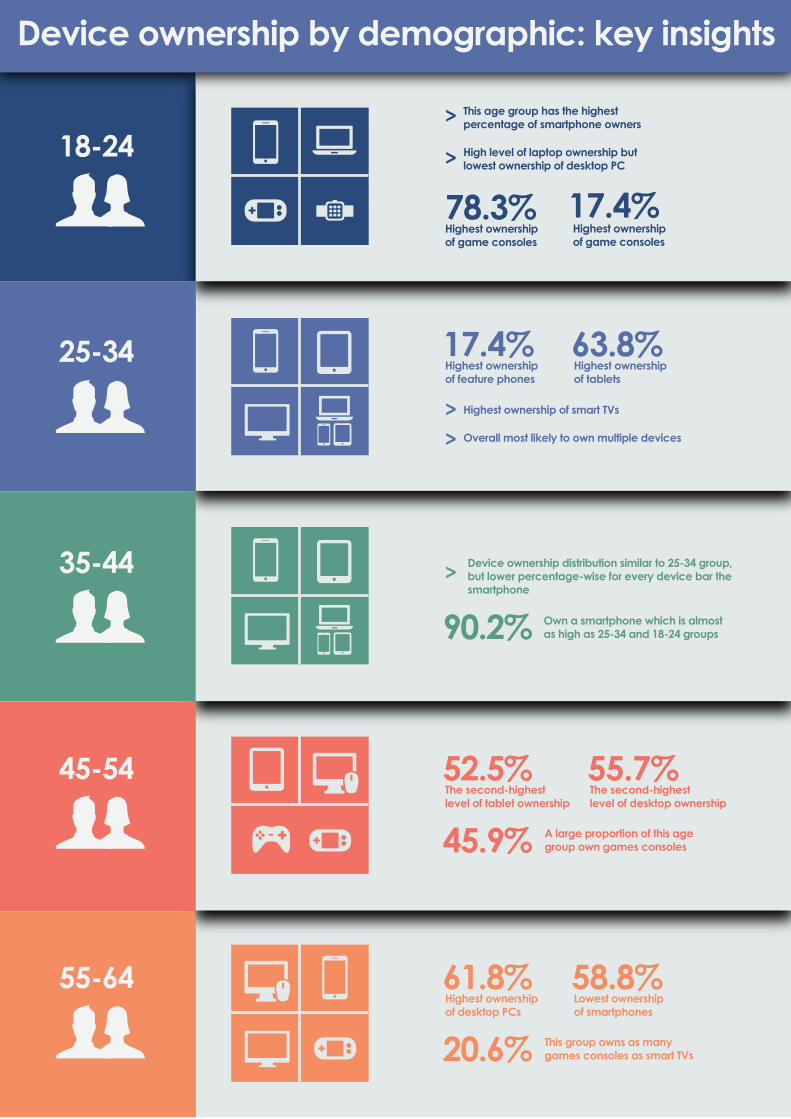
Device ownership by demographic: key insights
This age group has the highestpercentage of smartphone owners>
> High level of laptop ownership butlowest ownership of desktop PC
Highest ownership of smart TVs>
>
>
Overall most likely to own multiple devices
78.3% 17.4%Highest ownershipof game consoles
17.4%Highest ownershipof feature phones
63.8%Highest ownershipof tablets
61.8%Highest ownershipof desktop PCs
20.6% This group owns as manygames consoles as smart TVs
58.8%Lowest ownershipof smartphones
52.5%The second-highestlevel of tablet ownership
90.2% Own a smartphone which is almostas high as 25-34 and 18-24 groups
45.9% A large proportion of this agegroup own games consoles
55.7%The second-highestlevel of desktop ownership
Highest ownershipof game consoles
About Blismedia
About MobileSquared
+44 203 451 9820
@blismedia
/blismedia
Blismedia is a leading provider of data-driven, programmatic ad buying solutions for digital display and video. We believe that consumer location and content behaviour, over time, can give us huge insight into who they are. Established in 2004, the business has built and deployed proprietary, industry-leading platforms that serve digital content to audiences on the move. The company is headquartered in London with regional offices throughout Asia, the Middle East and APAC, as well as partnerships in place that enable it to serve digital campaigns to consumers anywhere in the world.
The Blismedia platform serves highly targeted display Ads via Real Time Bidding to very specific locations and demographic groups across mobile, tablet and laptop. The company’s customers are primarily media buying agencies acting on behalf of the world’s largest brands, including Samsung, Ford, P&G, Unilever and Mercedes Benz.
Blismedia partners with the data owners that provide accurate information to allow precise targeting. These partners include the leading Wi-Fi networks as well as the Supply Side Platforms (SSPs) that provide the inventory for bidding in real-time. The company is a member of the IAB leadership council and is backed by three of the best Media and technology VCs in the UK. For more information, visit www.blismedia.com.
We provide intelligence and insight on the mobile sector, but what sets us apart is how we transform this into high-performing incisive content and strategy that puts our clients ahead of their competition. Our work has a clear impact on our clients’ business results, because we design each brief around their business objectives. www.mobilesquared.co.uk


![CIFE - stacks.stanford.edugg301vb3551/WP097_0.pdfwere a “practical” subset of the IFC standard at the time [BLIS 02, 04]. The BLIS project was the first major demonstration by](https://img.pdfslide.us/doc/110x75/5e79027dedff0e11460ed421/cife-gg301vb3551wp0970pdf-were-a-aoepracticala-subset-of-the-ifc-standard.jpg)