Embed Size (px)
Citation preview

Blair RutterManager, Policy DevelopmentAgricore UnitedApril 25, 2003
Presentation toPolicy Disputes Information
Consortium
Montréal, PQ
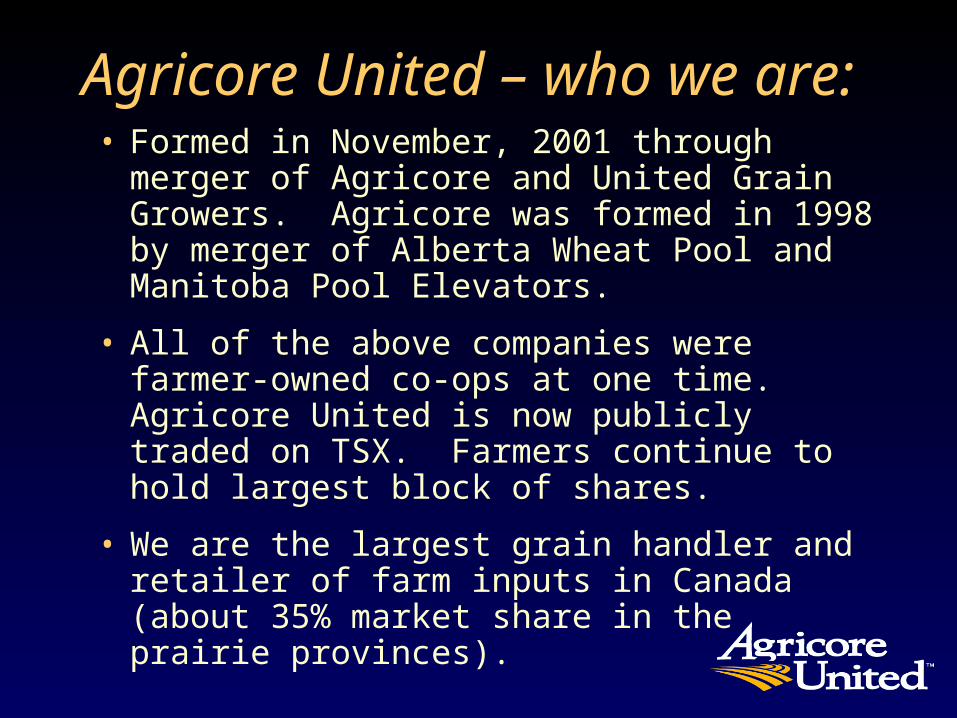
Agricore United – who we are:• Formed in November, 2001 through merger of
Agricore and United Grain Growers. Agricore was formed in 1998 by merger of Alberta Wheat Pool and Manitoba Pool Elevators.
• All of the above companies were farmer-owned co-ops at one time. Agricore United is now publicly traded on TSX. Farmers continue to hold largest block of shares.
• We are the largest grain handler and retailer of farm inputs in Canada (about 35% market share in the prairie provinces).
Outline of presentation
• Canadian grain production and exports
• Canada/U.S. grain trade flows
• Canada/Mexico grain trade flows
• Comment on various policy disputes

* Includes wheat, durum, barley, canola oats, flax, rye and peas
Western Cdn grain production*1979-2002 (Million tonnes)
20
25
30
35
40
45
50
55
60
79 81 83 85 87 89 91 93 95 97 99 '01
Year

Canadian bulk grain exports (million tonnes), 1970/71 - 2002/03p
12
16
20
24
28
32
1970/71 1975/76 1980/81 1985/86 1990/91 1995/96 2000/01
Crop yearSources: Statscan, Canadian Grain Commission(includes wheat, barley, oats, rye, flax, canola, peas and lentils)

Actual Projected (million tonnes) Production Production
2002 2003
Wheat (excl. durum) 12.0 20.1Barley 7.3 12.8 Corn 9.1 8.9Canola 3.6 5.8 Durum wheat 3.7 5.0Oats 2.7 3.7Soybeans 2.3 2.6 Dry Peas 1.4 2.3Other crops 2.6 3.4
TOTALS 44.6 64.6
Source: Market Analysis Division, Agriculture and Agri-Food Canada, March 13, 2003
Canadian Grain Production 2002 & 2003p
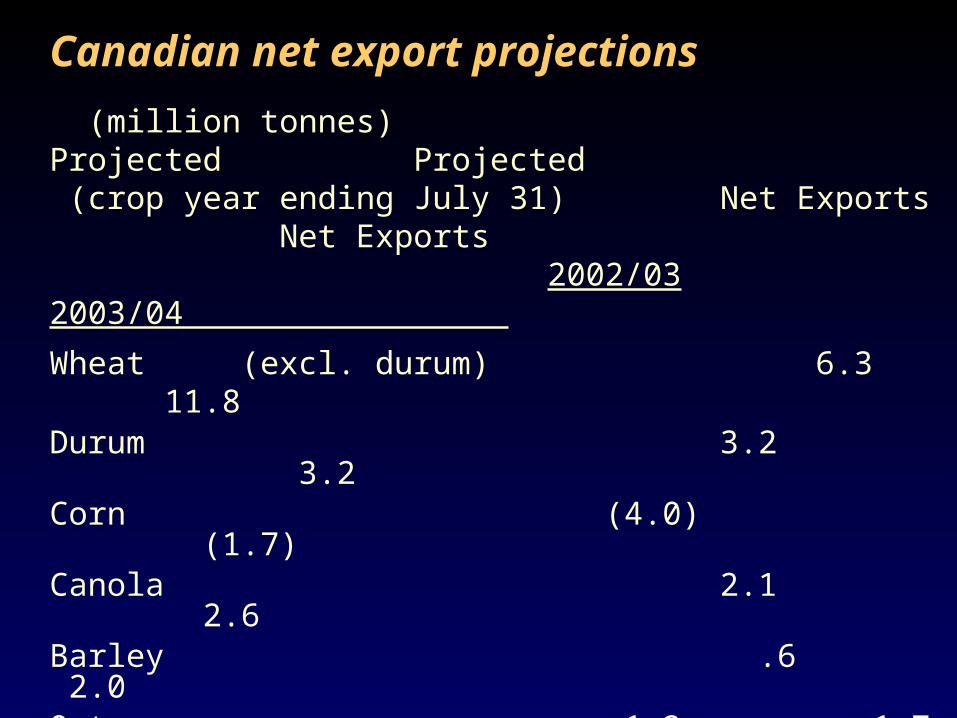
(million tonnes) Projected Projected (crop year ending July 31) Net Exports Net Exports
2002/03 2003/04
Wheat (excl. durum) 6.3 11.8Durum 3.2 3.2Corn (4.0) (1.7)Canola 2.1 2.6Barley .6 2.0Oats 1.2 1.7Dry Peas 1.0 1.5Flax .6 .6Other crops 1.3 1.5
TOTALS 12.2 23.2
Source: Market Analysis Division, Agriculture and Agri-Food Canada, March 13, 2003
Canadian net export projections

Direction of western Canadian agriculture
Continued growth in domestic livestock industry will take up most if not
all gains in grain production.
Modest growth in further processing of grains.
Offshore grain exports to decline over the long term.
Growth in two-way grain trade with the U.S. (and exports to Mexico) is expected to
continue.

(Cdn $ million) Average Average 1989-91 2000-02
Wheat 31 296
Durum 48 109
Flour 4 70
Mixes, Doughs, Cereals, Bakery (4) 429
Pasta (6) (25)
Oats 73 207
Barley 51 109
Malt 6 62
Grain and grain product trade flows: Canadian net exports to the U.S.
Source: Grains & Oilseeds Statistics, AAFC (March/03 and prior reports)

(Cdn $ million) Average Average1989-91 2000-02
Canola: Seed 7 4 Oil 90 261 Meal 51 190Total Canola 148 455
Corn (70) (409)
Animal Feeds n/a (152)
Soybeans (29) (140)
Soybean meal (162) (283)
Source: Grains & Oilseeds Statistics, AAFC (March/03 and prior reports)
Grain and grain product trade flows: Canadian net exports to the U.S. (cont.d)

(Cdn $ million) Average Average 1989-91 2000-02
Wheat 11 196Barley 2 3Malt 0 17Canola 20 220Lentils n.a. 10 Dry Beans n.a. 2 Chickpeas n.a. (1) Mixes, doughs, cereals & bakery n.a. (4)
Grain and grain product trade flows: Canadian net exports to Mexico
Source: AAFC, Industry Canada (Strategis database)

Factors behind increased Canadian grain and product flows to U.S. (and Mexico)
• Elimination of quotas and tariffs under CUSTA (1989) and NAFTA (1994).
• Elimination of Canadian transportation subsidies (the Crow) on grain shipments East/West (1995).
• Increase in the value of the U.S. dollar against the Canadian dollar and almost all other currencies.
• U.S. companies looking to secure access to supplies of grain with certain quality attributes.

Factors behind increased Canadian grain and product trade flows to U.S. and Mexico (continued)
• Greater economic integration – strategic alliances. NAFTA gives business greater confidence to invest and establish commercial linkages
• Improved and lower cost rail linkages north/south.
• Elimination of Canadian two-price wheat policy (leading to increased dough & bakery exports)

Factors behind increased U.S. feedgrain trade flows to Canada
• Rapid growth in livestock industry. Canada is now feedgrain deficit.
• Greater economic integration -- improved rail transportation linkages and greater truck backhaul opportunities.
• Cross-border trade impediments have been reduced.

Canada/U.S. grain trade disputes & concerns
• The Canadian Wheat Board (CWB).
• U.S. farm bill distortions.
• U.S. bioterrorism legislation/regulations.
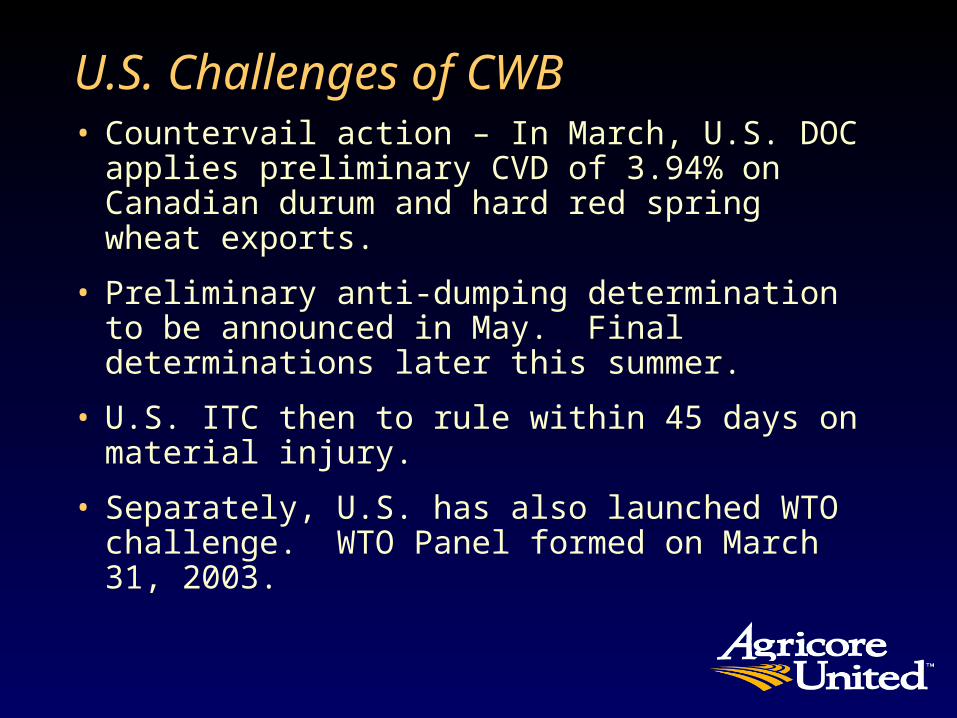
U.S. Challenges of CWB• Countervail action – In March, U.S. DOC applies
preliminary CVD of 3.94% on Canadian durum and hard red spring wheat exports.
• Preliminary anti-dumping determination to be announced in May. Final determinations later this summer.
• U.S. ITC then to rule within 45 days on material injury.
• Separately, U.S. has also launched WTO challenge. WTO Panel formed on March 31, 2003.

U.S. DOC determination
• 5 programs named in petition determined to be not countervailable.
• On the issue of CWB deficits, DOC will take further time before issuing determination.
• DOC deems two programs to be countervailable subsidies:
(a) government-supplied railcars – 0.35%(b) interest earnings on government guarantee of CWB borrowing – 3.59%

My comments on DOC findings• Good reasoning throughout ruling, except on
railcar issue. Shipments to U.S. do not benefit from “free” provision of railcars. Railways are assessed commercial lease rates on these shipments. In fact, provision of free cars on east/west movement acts as a modest disincentive to ship south.
• Valid ruling regarding the interest earnings, except magnitude is too high. CVD of 3.59% represents a duty of Cdn $8 to $10 per tonne. True benefit of interest earnings more like Cdn $3 to $5 per tonne.

“Why does thou behold the mote in thy brother's eye,
but perceivest not the beam in thine own?”
Matthew 7:2

In fact,
• They may not realize it, but the Canadian Wheat Board is the North Dakota wheat farmers’ biggest friend.
• If CWB monopoly were to be eliminated, would U.S. really allow free and unfettered access? On what grounds could U.S. possibly limit access?
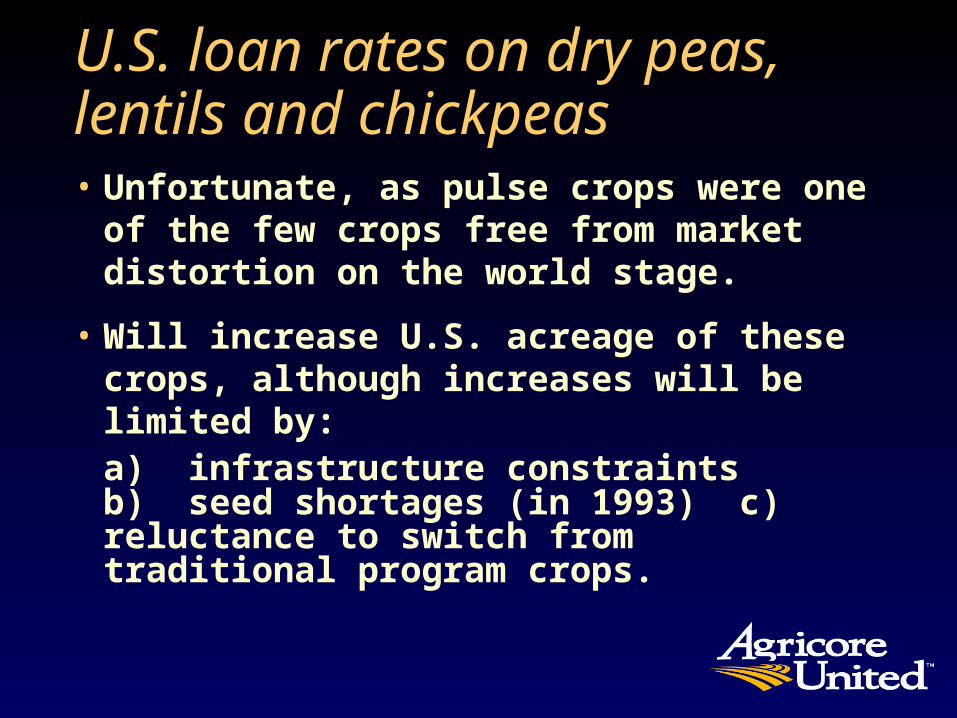
U.S. loan rates on dry peas, lentils and chickpeas• Unfortunate, as pulse crops were one of
the few crops free from market distortion on the world stage.
• Will increase U.S. acreage of these crops, although increases will be limited by:
a) infrastructure constraintsb) seed shortages (in 1993)c) reluctance to switch from traditional program crops.

U.S. bioterroism legislation• New regulations come into effect in
December. Appreciate intent.
• However, proposed notice provisions (e.g. notification of shipment by noon of previous day) have potential to introduce significant delays and added costs.
• Regulations apply broadbrush approach – treat bulk grain commodities in same manner as consumer-ready products.

Canada / Mexico grain trade disputes
• None to speak of

Canada / Mexico grain trade concerns• Mexican border was temporarily closed to bean
imports this spring due to misrepresentation of origin by U.S. suppliers. Canadian shipments caught in crossfire.
• Relatively low TRQ for Canadian bean exports, compared to U.S. (However, TRQs to be eliminated in 2008). Ongoing SPS concerns.
• Need to strengthen commercial linkages.

Conclusions• Canada/U.S. trade in grain and grain products is
large and growing, in both directions.
• Aside from concerns over the CWB, the Canada/U.S. grain trade relationship operates with relatively little friction.
• Bioterrorism regulations are not likely to significantly affect trade flows, but may significantly increase costs to the industry.
• Canada/Mexico grain trade relationship is good, but modest in scope.

Blair RutterManager, Policy DevelopmentAgricore UnitedApril 25, 2003
Presentation toPolicy Disputes Information
Consortium
Montréal, PQ